Abstract
In this study, a TiNi alloy with a composition of 50 at.% of titanium and 50 at.% of nickel is investigated in terms of its corrosion and biocompatibility behavior for biomedical applications. The corrosion measurements, which include the determination of open-circuit potential and linear polarization resistance measurements, cyclic polarization measurements, and electrochemical impedance spectroscopy in 9 g L−1 NaCl, show that TiNi has satisfactory corrosion stability. According to the SEM and EDS analysis, after cyclic polarization, pitting corrosion occurred, accompanied by the dissolution of the unstable Ti2Ni inclusions. The analysis also showed that TiNi has good biocompatibility for human osteoblast-like cells, as determined by the mitochondrial activity, which was assessed using a direct contact test following ISO standard 10993-5, via scanning electron microscopy (SEM) and fluorescent microscopy.
1. Introduction
TiNi shape memory alloys (SMAs) are functional biomaterials with a unique ability to change shape and remain plastically deformed at lower temperatures, while exhibiting a reverse feature that recovers the original (pre-deformed, i.e., remembered) shape above critical temperatures [1,2]. The alloy that contains the equiatomic or near-equiatomic composition of titanium and nickel possesses shape memory and exhibits a superelastic effect due to reversible thermoelastic martensitic transformations. Moreover, this composition forms a TiO2 layer, which significantly reduces the nickel ion release, thus providing sufficient biocompatibility for biomedical applications [3]. As an intelligent material that combines sensing and actuation based on thermal input, the TiNi alloy allows for high work output, thanks to which it is used to make biosensors, tissue engineering devices, and drug delivery systems [4]. Nickel–titanium alloys are used to manufacture coronary and ureteral stents, surgical instruments, flexible micro-needles, endoscopic catheters, endodontic instruments, orthodontic wires, and orthopedic implants, for use in dentistry, etc. [2,5,6,7].
Besides their functional properties, the interaction of TiNi alloys with imaging techniques, particularly magnetic resonance imaging (MRI), is an important aspect of their medical application [8]. TiNi SMA has gained widespread attention in the orthopedic field due to its ability to replicate the unique characteristics of human tissues and bones [9,10]. TiNi alloys exhibit high flexibility values, accommodating up to 8% strain, compared to Co-Cr and stainless steel, which resist only 1% strain [11,12]. TiNi alloys have modulus values of 30 GPa in the martensitic phase, while the modulus of human bone is approximately 20 GPa [13]. Their benefits include ease of manufacturing, simple and rapid application, effective compression osteosynthesis leading to primary bone healing, and relatively low costs; this makes them a promising alternative to traditional bone plates and/or screws [14,15,16,17]. As the TiNi shape memory alloys are characterized by high nickel content, the main concerns for their commercial application are focused on potential nickel release.
In addition to their mechanical and functional properties, the corrosion resistance of TiNi alloys in physiological environments is a key factor at play in their long-term success as biomaterials. Although TiNi is generally considered corrosion resistant due to the formation of a TiO2-based passive film [18], electrochemical studies in 0.9% NaCl solution (9 g L−1), simulating body fluids, have shown that this alloy is still susceptible to localized corrosion, particularly pitting, under certain conditions [18,19,20]. The presence of nickel, which is essential for the shape memory effect, introduces concerns related to nickel ion release if the passive film is compromised, potentially causing cytotoxicity, allergic reactions, or inflammatory responses [21,22,23]. While electrochemical techniques such as potentiodynamic polarization and electrochemical impedance spectroscopy consistently demonstrate passive behavior and low current densities, discrepancies in the reported results often arise from differences in testing methodologies and surface quality [18,24,25]. Some representative corrosion properties of equimolar TiNi alloy in 9 g L−1 NaCl are as follows. Semin et al. [26] investigated TiNi and Ti+-implanted TiNi sample alloys that were electrochemically polished in a mixture of acetic and perchloric acids. In 9 g L−1 NaCl, they obtained open-circuit potentials of −0.111 V after 1 h of exposure. From the polarization curve extrapolation, incorrectly interpreting slopes as Tafel lines, bc = −210 mV dec−1 and ba = 170 mV dec−1; with the corrosion potentials, a corrosion current density of 0.13 μA cm−2 is determined. The alloy shows essentially passive behavior from ~0 V to +0.250 V, with an average passive current density of 3 μA cm−2. An increase above 0.25 V in the current density indicates the onset of pitting propagation. Ti+-implanted TiNi shows slightly better characteristics, with a small decrease in the corrosion current density to 0.083 μA cm−2. Sun et al. [27] investigated porous and dense NiTi shape memory alloys and obtained a corrosion potential of −0.3 V; the corrosion current density is not reported, while the passive current density is very low, in the range of 0.1 μA cm−2. Pitting potentials are recorded at 0.35 V. Elshaer et al. [28] compared as-cast TiNi and Ti6Al4V alloys. For the TiNi alloy, a corrosion potential of −0.34 V is observed, with a narrow passive region from −0.3 V to 0.22 V and passive current of ~0.5 μA cm−2. Above −0.2 V, the current increased quickly until reaching a steady value of about 30 μA cm−2, probably corresponding to the pseudopassive film. Lethabane et al. [29] investigated TiNi and Ti-Ni-Cu-Nb alloys. The corrosion potential for TiNi was −0.25 V and the corrosion current density was ~110 μA cm−2, and, interestingly, it did not have a passive region. Generally, ongoing research is focused on manufacturing processes and defining optimal conditions in order to minimize the formation of intermetallic phases, which are considered to be the main cause of localized corrosion and surface chemical instability. This would contribute to the increase in overall biofunctionality. Literature-based evidence regarding the microstructural and chemical analysis of TiNi SMA alloys obtained via vacuum induction melting (VIM) and arc re-melting (VAR) [30,31,32] suggests that both methods meet the requirements prescribed by the ASTM-F 2063-18 standard for medical devices [33]. Still, the obtained ingots exhibit certain disadvantages, mainly concerning the high reactivity of the melt and the tendency to segregation, so re-melting is necessary. However, as the number of re-melting cycles increases, the tendency for oxygen contamination also increases [34,35].
The scattered results and limited knowledge regarding the corrosion and biocompatibility of this alloy during long-term implantation have restricted its use as an implantable material. It should also be noted that corrosion and biocompatibility are also dependent on the manufacturer and manufacturing processes. Thus, the main goal of this study is to investigate the corrosion and biocompatibility behaviors of a TiNi alloy prepared using the vacuum induction melting (VIM) method.
2. Materials and Methods
2.1. Production of the As-Cast TiNi Alloy
A TiNi alloy with a composition of 50 at.% of titanium, and 50 at.% of nickel (Merkur d.d, Celje, Slovenia) was produced using the classical process according to the ASTM F2063-18 Standard [33], i.e., re-melting four times in a vacuum furnace by induction melting (Leybold Hereaeus, Helsinki, Finland), with electro-resistive heating to reduce gas content and remove impurities, before finally casting into ingots.
2.2. Corrosion Testing
Before corrosion testing, the TiNi alloy samples were mechanically ground using SiC papers (1000–4000 grit), polished with 0.05 μm Al2O3 on the polishing cloth; this was followed by ultrasonic cleaning in ethanol and deionized water. Electrochemical measurements were conducted using a standard three-compartment glass cell with a volume of 100 cm3, with the TiNi sample (2 cm2) used as the working electrode, a saturated calomel electrode (SCE) as the reference, and, as the counter electrode, the lead wire inserted in the polypropylene bag to avoid hypochlorite formation. According to ISO 10271:2009 [36], the tests were performed in a 9 g L−1 NaCl (Merck KGaA, Darmstadt, Germany) solution at pH = 7.4 adjusted with 0.1 M NaOH (Merck KGaA, Darmstadt, Germany), at room temperature. Open-circuit potential (Eocp) and linear polarization measurements (±20 vs. Eocp) were taken in order to determine polarization resistance, Rp; values were simultaneously recorded for 1 h. Then, electrochemical impedance spectroscopy (EIS) was performed at open-circuit potential, Eocp, with a 5 mV amplitude over a frequency range of 10 kHz to 0.10 Hz. After EIS, potentiodynamic polarization was performed, which was conducted at a scan rate of 1 mV s−1. All measurements were carried out using a Gamry 1010E (Gamry, Warminster, PA, USA) potentiostat/galvanostat. Surface morphology before and after testing was analyzed using a scanning electron microscope (SEM) JEOL JSM-6610LV (JEOL, Tokyo, Japan) at 20 kV, equipped with an energy-dispersive detector (EDS) model: an X-Max Large-Area Analytical Silicon Drift connected to an INCA Energy 350 (USA-Oxford Instruments, Concord, MA, USA). To identify microstructural configurations, the sample was prepared according to the protocol for metallographic preparation: grinding, polishing with a diamond paste suspension of 0.05 μm, and cleaning with deionized water in an ultrasonic bath. The prepared surface was chemically etched with 3 mL HF, 6 mL HNO3, and 100 mL of water for 45 s. The optical image was taken using a Nikon Epiphot 300 (Nikon, Tokyo, Japan) metallurgical microscope. For the determination of the grain area distribution, ImageJ software (version 1.5t, National Institutes of Health, LOCI, University of Wisconsin, Madison, WI, USA) was used.
2.3. Biocompatibility
2.3.1. Cell Cultivation
Human osteoblast-like cells (MG-63, ATCC® CRL-1427™) were grown in a complete growth medium: Dulbecco’s modified Eagle’s medium (DMEM) with 4 mM L-glutamine, 10% Fetal bovine serum (FBS), and 1% Antibiotic Antimycotic (ABAM) (all from Sigma-Aldrich, Steinheim, Germany). Cells were cultured in 5% CO2 at 37 °C in a humidified atmosphere and regularly passaged at 80% confluence.
2.3.2. Cell Seeding on Samples
TiNi discs (number of samples, n = 6, 2r = 9 mm) were compared with control samples of round microscopy cover glass (n = 6, 2r = 9 mm). Before the cell seeding, all samples were sterilized with UV-C light for 1 h and placed in a 12-well culture plate. MG-63 cells (2 × 10⁴ cells/cm2) were seeded directly onto the samples and incubated at 37 °C in a humidified 5% CO2 atmosphere. For viability assay, the cells were cultured for 24 h, and cell adhesion was evaluated using a fluorescent microscope after 168 h (7 days), and, for SEM, after 24 h and 168 h.
2.3.3. Cell Viability Assay
Mitochondrial activity was assessed using a direct contact test following ISO standard 10993-5:2009 [37]. After 24 h of cell culturing on the samples, metabolic activity was evaluated using the MTT (3-([4,5-dimethylthiazol-2-yl]-2,5-diphenyl-tetrazolium bromide)) assay (Sigma-Aldrich, St. Louis, MO, USA). To measure cell metabolism, the growth medium was removed from the wells, and a fresh growth medium containing 5 mg/mL MTT was added. The cells were incubated for 4 h in the dark at 37 °C. After incubation, the medium was discarded, and 100 μL of dimethyl sulfoxide, DMSO (Sigma-Aldrich, St. Louis, MO, USA) was added to dissolve the tetrazolium salts from the mitochondria. Absorbance was then measured at 540 nm using an enzyme-linked immunosorbent assay (ELISA) microplate reader (RT-2100c, Rayto, Shenzhen, China).
2.3.4. Preparation of Samples for Fluorescent Microscopy
After washing with phosphate-buffered saline (PBS) to remove non-adherent cells, the samples were stained with Hoechst 33,342 (2 µg mL−1) for 20 min. This dye selectively stains viable cell nuclei, emitting blue fluorescence. Imaging was performed using an Axio Imager Z1 epifluorescence microscope (Carl Zeiss, Oberkochen, Germany), and viable cells were quantified using ImageJ software, IJ 1.46r (Bethesda, Rockville, MD, USA). For each sample type, three wells were analyzed, with cell counts performed over a minimum surface area of 2.5 mm2 per well.
2.3.5. Preparation of Samples for SEM Analysis
The morphology of MG-63 cells attached to the samples was analyzed using a JEOL JSM-6500F scanning electron microscope (Tokyo, Japan). Sample preparation, including fixation, contrast enhancement, and dehydration, was performed following previously established protocols [38]. To ensure optimal imaging, the samples were coated with a thin gold layer using a Precision Etching Coating System (682 PECS, Gatan, Pleasanton, CA, USA). The analysis focused on the morphology and adhesion patterns of MG-63 cells on both control samples (cover glass) and TiNi discs.
2.3.6. Inductively Coupled Plasma-Optical Emission (ICP-OES)
A static immersion test was used to provide quantitative data on the nickel and titanium ions released from the specimens’ surfaces into the DMEM solution. Before testing, TiNi discs were prepared according to ISO 10271:2009 for testing materials in dentistry [36]. Specimens were immersed in 5 mL of each test solution in a test tube clogged with a rubber cork using a nylon string. The test durations were 24 h and 48 h at a constant temperature of 37 ± 0.2 °C. In parallel with the samples, the pure solution “zero samples” were treated in the same way. The concentration of nickel and titanium ions (µg L−1, ppb) in the obtained solutions after the static migration test was measured using the analytical technique of Inductively Coupled Plasma Optical Emission Spectrometry (ICP-OES). The ICP-OES measurement was performed on a Thermo Scientific iCAP 6500 Duo ICP instrument (Thermo Fisher Scientific, Cambridge, UK) using iTEVA operating software (Issue 9.8, Thermo Fisher Scientific, Cambridge, UK). The sample was introduced into the plasma via the direct aspiration of the liquid sample. Standard solutions for instrument calibration within appropriate concentration ranges were prepared from certified standard solutions: Multi-Element Plasma Standard Solution 4, Specpure®, 1000 µg/mL, and, for titanium, a standard plasma solution, Specpure®, Ti 1000 µg/mL (supplied by Alfa Aesar GmbH & Co KG, Karlsruhe, Germany). Quantification was performed at the following emission lines: Ni II 231.604 nm and Ti II 336.121 nm. The correlation coefficients were greater than 0.9999. For each sample, ICP-OES measurements were conducted in triplicate (n = 3). The relative standard deviation (RSD) of repeated measurements was <5%. The limit of detection (LOD) was 0.12 and 0.20 µg L−1, while the limit of quantification (LOQ) was 0.41 and 0.48 µg L−1 for nickel and titanium, respectively. The analytical process quality control (QC) was performed using a certified reference material (CRM): EPA Method 200.7 LPC Solution (ULTRA Scientific, Santa Clara, CA, USA). The achieved agreement with certified values (recovery) for all certified elements was in the range of 98–103%. The concentrations of nickel and titanium ions in the solution are presented in ng mL−1.
3. Results and Discussion
3.1. SEM and EDS Characterization of the TiNi Alloy
Figure 1 shows SEM images of the as-prepared TiNi alloy. In Figure 1a, a relatively homogenous structure can be observed, with some small inclusions of shapeless structures. Similar results for the TiNi alloy have been obtained by many authors [37,38,39,40] who identified inclusions as the Ti2Ni phase. The results revealed that the TiNi alloy is a hypoeutectic system, consisting of a cubic TiNi matrix and a cubic Ti2Ni phase. It should be pointed out that inclusions, dispersed in the bulk material, are generally Ti2NiOx and eventually form TiC, displaying micrometric sizes that are responsible for pitting or breakdown potential [41].
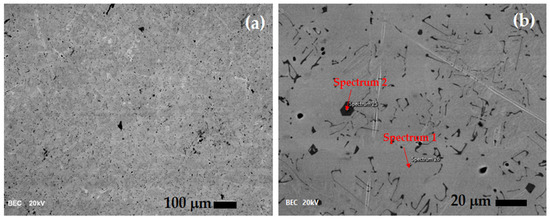
Figure 1.
SEM images of the as-prepared TiNi alloy under different magnification (a) 100×, (b) 600×. Note: the scale bars based on the original are manually inserted due to better visibility.
To determine the composition of the alloy matrix and inclusions, a higher magnification is used, as shown in Figure 1b, and EDS is performed, marked in the figure as spectra 1 and 2.
According to the EDS spectra presented in Figure 2, obtained from the regions marked in Figure 1b, the TiNi matrix (spectrum 1) exhibits a composition of 54 wt.% Ni and 42 wt.% Ti. Converting to at.% composition is Ti49Ni51, which is practically identical to the TiNi matrix. The composition of the inclusion (spectrum 2) has 60 wt.% of Ti and 37% wt.% of Ni, or 66.5 at.% of Ti and 33.5 at.% of Ni, which corresponds to the cubic Ti2Ni phase. Based on the phase diagram of TiNi alloys, the cubic Ti2Ni phase is formed during alloy cooling at temperatures above 800 °C in the Ti-rich melt zones. According to the data in the literature [42], small amounts of this phase ensure the alloy’s ductility. Specifically, during the additional cooling of the melt, the zones of the Ti2Ni phase represent the centers of nucleation of martensite grains, the carrier of the shape memory effect. Faster cooling of the alloy favors the formation of this phase. However, because this phase has a higher hardness than the TiNi phase that forms the alloy’s matrix, large amounts of Ti2Ni precipitates can directly reduce the superelastic properties of the alloy. The presence of a small amount of carbon could be attributed to contamination of the surface by air impurities. As well as vacuum induction melting, the most commonly used method of obtaining nickel–titanium alloys is metal melting in arc furnaces (vacuum arc remelting). A graphite crucible furnace is the best choice for melting pure metals to prevent possible melt contamination [43,44,45], but some impurities are possible due to carbon pick-up.
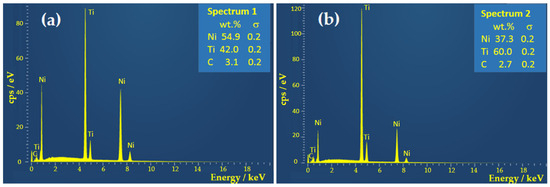
Figure 2.
EDS spectra of the as-prepared TiNi alloy taken from the points marked in Figure 1b. (a) Spectrum 1, (b) Spectrum 2.
An optical microscopy image of chemically etched TiNi alloys is shown in Figure 3a; it shows a predominant equiaxed structure, with irregular grain sizes and shapes. The area of the grains is in a broad range from ~100 μm2 up to ~6500 μm2, with the main average area of 416 μm2. To estimate grain dimensions, in the first approximation, we considered the grains to have an elliptical shape. Knowing that the area of an ellipse is p = a × b × π, where a and b are the radius, we can assume that b = 0.5a, and, by conducting simple calculations for the average area of ~416 μm2, the average grain size is determined to be around 32 μm × 16 μm. In addition, the grain area is mostly below 2000 μm2, as shown by the inset in Figure 3b, or lower than ~70 μm × 35 μm.
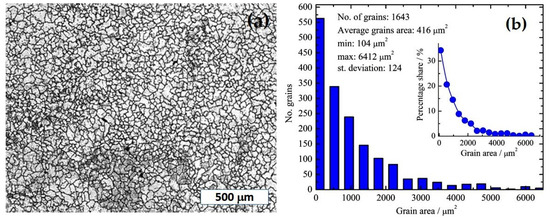
Figure 3.
(a) Optical micrograph at ×50 magnification of the as-cast NiTi alloy. (b) Grain area distribution. Inset: percentage share of grain area.
3.2. Corrosion Behavior
Figure 4 shows the dependence of the open circuit potential, Eocp, and polarization resistance, Rp, obtained from the linear polarization measurements over time. After immersion, open-circuit potentials increase from −0.443 V to −0.428 V, while polarization resistance increases from 62 kΩ cm2 to 72 kΩ cm2. The observed increase in both values indicates that the naturally formed thin film on the alloy is probably porous, with the pores being progressively passivated over the course of immersion.
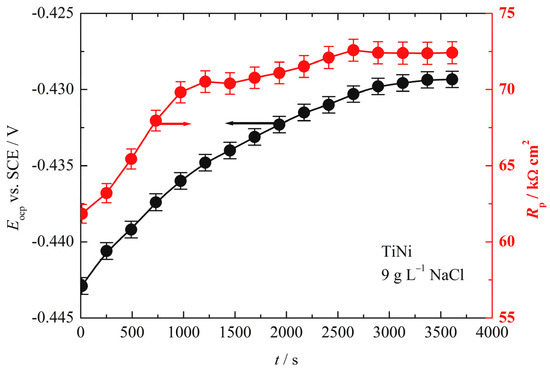
Figure 4.
The dependence of the open-circuit potential, Eocp, and polarization resistance, Rp, over time.
Figure 5 presents the cyclic polarization curve of the TiNi electrode starting from a cathodic potential of −0.65 V. The cathodic branch is characterized by a high slope of −193 mV dec−1 that cannot be connected to Tafel behavior. It is most plausible that such a high slope is linked to oxygen reduction under mixed activation–diffusion control and surface film composition change. It is necessary to note that, at Eocp, there is no change in the cathodic to anodic current densities of the polarization curve, suggesting that this spontaneous potential is the quasi-corrosion potential of the alloy. Similar results were obtained by Gaber et al. [46] for the corrosion of AISI 201 austenitic stainless steel in 1 M H2SO4. Namely, the open circuit potential was −0.1 V while the corrosion potential determined from the polarization curves was approximately +0.25 V, but this phenomenon is not explained. Consequently, at Eocp, it can be suggested that the following reaction occurred. During the immersion period, increases in Rp and Eocp could be connected with the dissolution of Ti2Ni as an energetically unstable state that behaves as an anodic place and an oxygen reduction reaction at the TiNi matrix as a more stable phase. The overall reaction is:
Ti2Ni + 4OH− = TiNi + TiO2 + 2H2O + 4e−
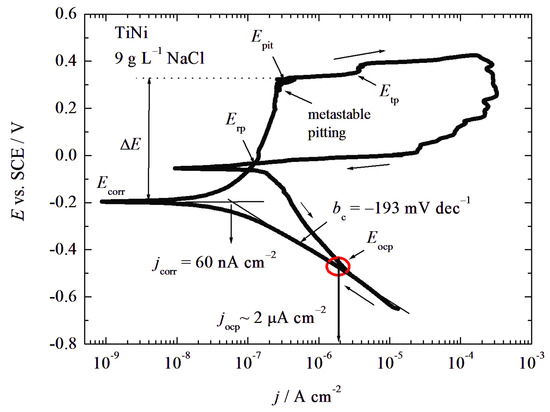
Figure 5.
Cyclic polarization curve (v = 1 mV s−1) of the TiNi electrode in 9 g L−1 NaCl. Arrows indicate the direction of potential scanning.
It proceeded via the following steps:
and:
Ti2Ni = TiNi + Ti4+ + 4e−
Ti4+ + 4OH− = TiO2 + 2H2O
O2 + 2H2O = 4OH− + 4e−
Hence, during the immersion, contact corrosion (between TiNi and Ti2Ni inclusions) probably takes place, which leads to the passivation of Ti2Ni, and, after a certain time, this reaction could be neglected.
At the potential of −0.2 V, a change from cathodic to anodic current densities arose that could be connected with the real corrosion potential Ecorr, at which point the alloy matrix started to oxidize, followed by passivation. Extrapolating the cathodic line to corrosion potential, we estimate the corrosion current density, jcorr, of around 60 nA cm−2 or less. The passive behavior occurred in the potential range from −0.1 V to 0.22 V with an average passive current density jpas of 0.2 μA cm−2, followed by metastable pitting. At a potential of 0.34 V, the critical pitting potential, Epit, is observed to be connected with the sharp increase of the current density. A shoulder at 0.36 V is also visible, which could be attributed to the transpassive potential, Etp, accompanied by a change in the metal oxidation state, most likely from Ni2+ to Ni3+. In the reverse scan, positive hysteresis is observed, connected to pit growth. The repassivation potential, Erp, is recorded at ~0 V, followed by an oxygen reduction reaction. In some studies, the numerical values of pitting corrosion resistance, Rpit, are calculated as: Rpit = ΔE = |Ecorr − Epit|. The difference between Ecorr and Epit can be used to evaluate a material’s vulnerability to pitting. A small ΔE indicates a greater susceptibility; therefore, the metal is prone to pitting corrosion even at potentials near to the corrosion potential [47].
In Table 1, due to the better comparisons, characteristic corrosion parameters obtained from the polarization curves and linear polarization measurements are summarized.

Table 1.
The characteristic corrosion parameters for TiNi in 9 g L−1.
In order to examine the corrosion processes, and the plausible oxide nature on the surface, and/or does the repassivation after pitting corrosion occurs, before and after cyclic polarization measurements, the electrochemical impedance is measured. The results, presented as Nyquist and Bode plots, are shown in Figure 6a,b. The interpretation of the obtained impedance spectra is explained based on the above discussion and data from the literature [48,49,50]. The Nyquist plot shows that impedance is practically a straight line, with slopes of 51° before and 57° after polarization, which are higher than 45° (characteristic of pure diffusion control) and lower than 90° (characteristic of pure capacitive behavior). It should be noted that the open-circuit potentials, shown in the inset in Figure 6a, are very close to the potential determined during the linear polarization measurements, as shown in Figure 4. In the Bode plot, in the frequency range from 10,000 to ~200 Hz, the horizontal line that suggests resistance behavior cannot be seen. The slope of the lines of |Zmod| vs. log f is ~0.67, indicating a complex mixture of capacitive–diffusion behavior, suggesting the usage of the constant phase elements (CPE) for fitting. Decreasing the frequency, the phase reaches the maximum at ~40 Hz with a phase angle of 68°, followed by slow decreases in the phase angle and stabilization around 55° at frequencies lower than ~2 Hz. This behavior could be attributed to surface phenomena, e.g., passivation. The spectra after polarization in the Nyquist plot have a higher slope than before polarization, and the phase peak is slightly shifted to lower frequencies, suggesting that the passive layer is disturbed but undergoes slower recovery.
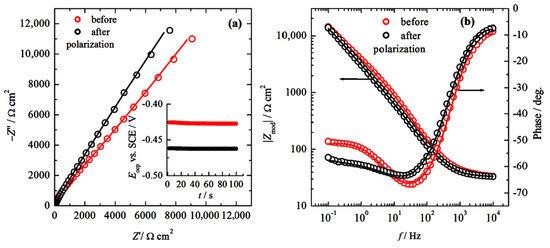
Figure 6.
(a) Nyquist plot of the electrochemical impedance spectra before and after cyclic polarization. Inset: open-circuit potentials before recording EIS, and (b) Bode plot before and after the cyclic polarization measurements. Symbols: experimental data; lines: fitted data.
Based on explanations of the electrochemical impedance behavior, the physical model and the equivalent electrical circuit (EEC) are shown in Figure 7a. The elements of Rf and Cf correspond to film oxide resistance and capacitance. CPEdl is assigned to the double-layer capacitance, due to the inhomogeneity of the oxide surface. The impedance of a constant phase element (CPE) is described by the formula:
where Y is the CPE admittance, n is the CPE exponent (a value between 0 and 1), i is the imaginary unit, i2 = −1, and ω is the angular frequency (ω = 2πf). Rct and CPEw are connected with charge transfer reaction, and diffusion (using the pure Warburg element, the fit was not good), and Rs solution resistance. The presented physical model of the EIS can explain the difference between open circuit and corrosion potential, Figure 5. The inclusion of Ti2Ni is a Ti-rich phase with a lower local surface potential and probably a different and thinner oxide than the TiNi matrix, which can undergo slow dissolution via reaction 1 and form some kind of oxide. That oxide passivizes the inclusion over time. Thus, the increased slope of the cathodic line could be explained by the sum of passive and oxygen reduction current densities. Due to the relatively small current densities of 2–3 μA cm−2, at open-circuit potential, the reaction given by Equations (2) and (4) is most probably under diffusion or mixed activation–diffusion control because the concentration of Ti4+ and dissolved oxygen is very small. During this time, the reactions become rather slow but sufficient to establish Eocp. Due to the cathodic polarization, Ti2Ni is additionally covered by an oxide layer, and, only at Ecorr, the further oxidation of the TiNi matrix occurs, followed by a passive state.
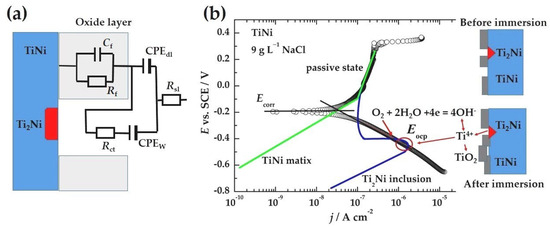
Figure 7.
(a) The physical model and the equivalent electrical circuit of the electrochemical impedance spectroscopy. (b) A plausible explanation of the differences between the open circuit and corrosion potentials.
The fitted parameters of the equivalent electrical circuit are summarized in Table 2. Based on the values of the “goodness of fit” lower than 0.1 × 10⁻³, it can be concluded that the experimental EIS data are successfully interpreted using the chosen equivalent circuit model.
Table 2.
The fitted parameters of the equivalent electrical circuit, shown in Figure 6a, (1) before and (2) after cyclic polarization. G.F represents the “goodness of fit”.
From the obtained fitted data for admittance Y0,dl, Ω−1cm−2 sn, and n from CPEdl, the double-layer capacitance, Cdl, can be estimated according to:
Consequently, before polarization, Cdl is 6.6 μF cm−2, and, after polarization, it is 4.7 μF cm−2. The Warburg diffusion element (ZW) is a constant phase element (CPE), with a constant phase of 45° (phase independent of frequency) or n ≈ 0.5. In an ideal case, it has a magnitude inversely proportional to the square root of the frequency:
The impedance module of Warburg impedance can be presented as:
This represents the total opposition to the flow of current in the circuit, considering both resistance and reactance. In Equation (8), Υ0,W is the Warburg coefficient (or Warburg constant) that represents admittance. To calculate |Zw|, the frequency must be determined. Because Rct of ~2 kΩ cm2 is much smaller than Rp = 72 kΩ cm2, as obtained from linear polarization measurements (Figure 4), it is not sensitive to the reaction control (solution resistance, charge transfer resistance, diffusion). As the Rp is measured ±20 mV around Eocp with a sweep rate of 1 mV s−1, the total duration is 40 s or ~0.02 Hz. Hence, the |Zw| is ≈65 kΩ cm2, which is already a satisfactory agreement. However, the Rp is the sum of all parameters:
this gives an Rp of 68 kΩ cm2: practically identical values.
Rp = Rs + Rct + |Zw|
If the overpotential, η, is very small (±5 mV) and the electrochemical system is at equilibrium, the classical Stern–Geary equation for the charge-transfer resistance can be represented with the equation:
As shown in Table 2, Rct is 2700 Ω cm2 and 2000 Ω cm2; consequently, the corresponding open-circuit current densities, taking into account 4e− exchange, are 2.3 μA cm−2 and 3.2 μA cm−2, respectively, in excellent agreement with the experimentally observed values shown in Figure 4. Moreover, given that [51,52] the thickness, d, of naturally formed oxide on Ti and its alloys, is ~5 nm (5 × 10⁻⁷ cm), it is plausible to calculate the specific resistance of the oxide film, ρ, Ω cm, from the Rf = 31.2 Ω cm2, according to:
where S = 1 cm and ρ is in the order of 62 MΩ cm, which corresponds to semiconductors.
After the cyclic polarization, the SEM and EDS are taken, and the results are shown in Figure 8, while EDS analysis from the marked spectra is summarized in Table 3. In Figure 8a, the overall composition of the TiNi matrix is shown, and Table 3 shows that the total Ni content slightly decreases from the spectra taken before polarization. Therefore, Ni may be slightly dissolved, according to the Pourbaix diagram, via the following reactions:
Ni = Ni2+ + 2e−
Ni2+ + 2OH− = Ni(OH)2,sln
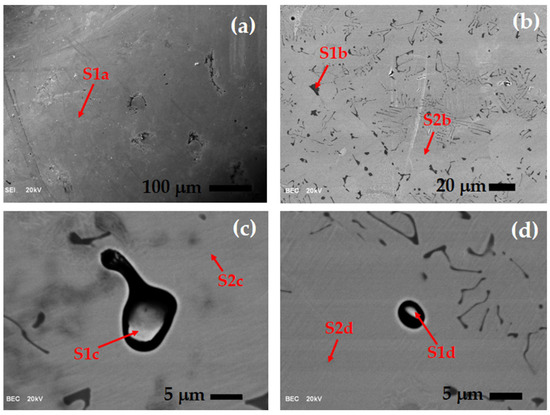
Figure 8.
SEM images of the TiNi after cyclic polarization with marked point (S) where EDS is performed, under different magnifications, (a) 40×, (b) 600×, (c) and (d) 3000×.
Table 3.
Summarized EDS analysis of the spectra marked in Figure 8.
This is because of the low Ni2+ concentrations and solubility product of 2.0 × 10⁻¹⁵ M−2, meaning that Ni(OH)2 is slightly soluble in water. From Figure 6a, it is also possible to see that pitting corrosion occurred, accompanied by micro-galvanic corrosion. The surface does not undergo severe corrosion, and most of the surface is intact (Figure 8b); the existence of Ti2Ni inclusions is evident (spectrum 1b). It is interesting that, in some places, a hole is formed with intrusions inside the hole (Figure 8c,d). Based on the EDS spectra, the intrusions have the composition of an alloy matrix, e.g., TiNi. This can be explained by the work of Gao et.al. [53]. Namely, the solidified NiTi phase develops swiftly as the temperature of the molten alloy decreases, taking the shape of either columnar or equiaxed grains. As the temperature of the molten pool decreases further to ~980 °C, the Ti-rich molten phase that surrounds the solid NiTi phase experiences a peritectic reaction, transitioning from NiTi + L(Ti) to Ti2Ni, causing the precipitation of Ti2Ni around the NiTi grains. Consequently, it seems that the main corrosion mechanism is the contact corrosion of Ti2Ni as an anodic site, in contact with TiNi intrusions and the surroundings TiNi matrix that represents cathodic sites.
The EDS analysis of wt.% of the SEM spectra shown in Figure 8a–d is summarized in Table 3. In addition to carbon, whose origin is explained in the above text, some small amounts of Si and Al are detected, probably from the SiC grinding paper employed, as well as Al2O3 from polishing. Moreover, at spectrum S1d, 0.2 wt.% of Cl is detected, which is contamination from the electrolyte. We can assume that C, Si, Al and Cl, are impurities, so only wt.% of Ti and Ni are recalculated to at.% and the corresponding phase of the TiNi alloy is given.
In the following section, some comparisons of our results and the data for different methods of preparing TiNi alloys available in the literature are given. Sun et al. [26] investigated the corrosion behaviors of porous TiNi and compared them with the dense TiNi alloy prepared in a non-consumable vacuum arc-melting furnace. The corrosion current densities, jcorr, of porous NiTi alloys are markedly higher than the values of the dense ones, and the breakdown potentials of porous NiTi are in the range of 0 V to 0.1 V, much lower than the values of the dense samples at ~0.35 V. The porous TiNi essentially did not show a passive region, while the current density of the dense sample was in the range of 10 nA cm−2 to ~0.5 μA cm−2. Recently, laser powder bed fusion (LPBF) has been used to produce TiNi alloys [54]. The breakdown potential in SBF is ~0.45 V, with a passive current density higher than 1 μA cm−2. Regarding the corrosion behavior in 9 g L−1 of the newly developed method of producing TiNi alloy, using continuous casting [23], the corrosion current density is roughly estimated to be 6 μA cm−2, with a very limited passive region of ~0.15 V and a breakdown potential at ~0.05 V.
Even the examined TiNi alloy shows similar and, in some cases, better corrosion behavior than the alloys described in the Introduction [26,27,28,29] and the above text [23,54]. The future optimization of the cooling processes should be performed to minimize the formation of Ti2Ni phases. In addition, the anodization of the TiNi alloy in suitable electrolytes should also be investigated in order to increase corrosion stability.
3.3. Biocompatibility of the TiNi Alloy
3.3.1. Cell Viability and Adhesion
A colorimetric assay, which was used to measure cell viability and proliferation by assessing cellular metabolic activity (MTT), revealed no significant change in cell viability when cultivated on TiNi samples, in comparison to the control samples (98.6 ± 0.5% in control; 97.1 ± 0.3% for TiNi), as shown in Figure 9.
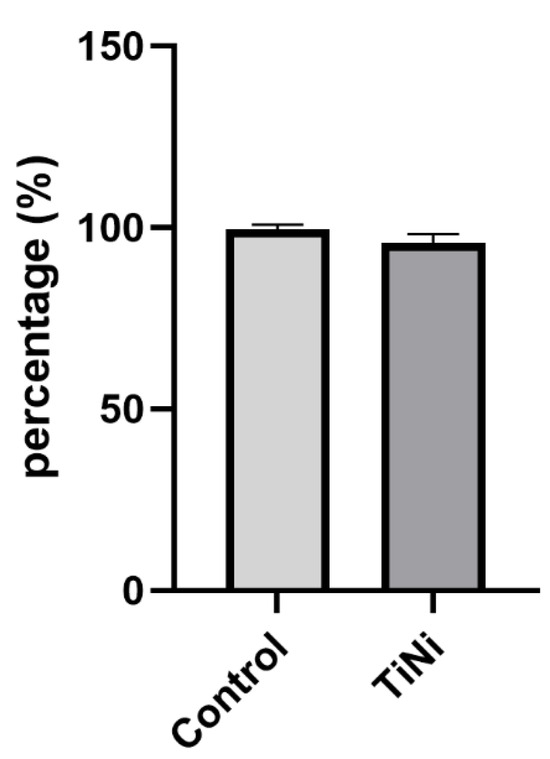
Figure 9.
Percentage of viable cells after 24 h of culturing on samples (MTT assay). No significant difference was observed in the Mann–Whitney test.
The results of fluorescence microscopy showed that the TiNi sample is not cytotoxic, as the density of attached cells is not statistically significantly lower in the TiNi samples than in the control, as shown in Figure 10.
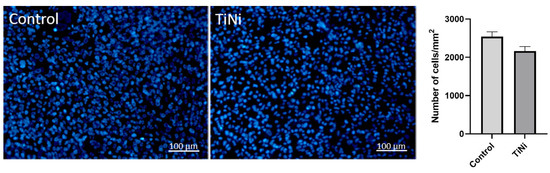
Figure 10.
Cell proliferation 7 days (168 h) after cultivation. No significant difference was observed in the Mann–Whitney test.
After 24 h of culturing on control and TiNi specimens, the cell morphology was characterized by polygonal shapes and the presence of cytoplasmic extensions (Figure 11). At higher magnifications, the SEM images clearly show cytoplasmic extensions, indicating the cells’ ability to interact with and spread on the substrate surface. Cells extend their cytoplasm, forming long, thin projections that help them interact with and adhere to the surrounding surface.
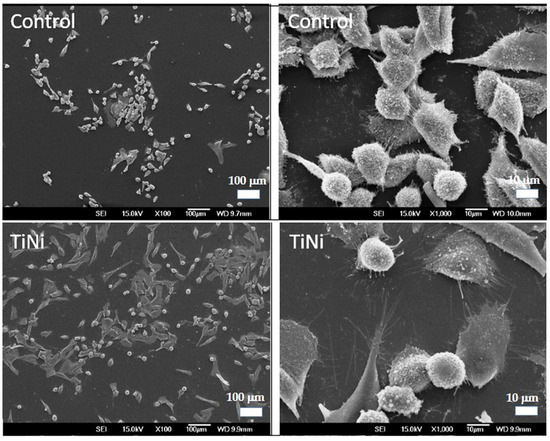
Figure 11.
Representative SEM micrographs of MG-63 cells after 24 h of culturing on control and TiNi specimens.
At 168 h of exposure in both groups, cells with well-defined cellular and membrane outgrowths are predominant. Notably, the cells spread out and cover the surface of the materials, a sign of cell activity and integration with the environment (Figure 12). However, the cell morphology differed slightly between the control and TiNi specimens. Cells on the control specimens exhibited an elongated shape with multiple filopodia firmly attached to the disc surface. In contrast, cells on the TiNi specimens are more rounded, with a smaller cell footprint but large filopodia. Both specimen types showed numerous cellular interconnections, indicating a high degree of cell–cell contact. No cells with apoptotic or necrotic morphology were observed at 168 h.
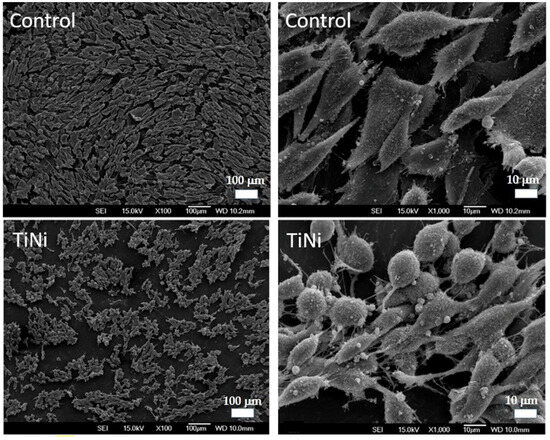
Figure 12.
Representative SEM micrographs of MG-63 cells after 168 h of culturing on TiNi specimens.
3.3.2. Inductively Coupled Plasma Optical Emission Spectroscopy
Inductively Coupled Plasma Optical Emission Spectroscopy (ICP-OES) elemental analysis was conducted to examine the substitution of nickel and titanium ions in the DMEM solution. The results revealed that, during 24 h of immersion, the migration of Ni ions was slightly higher than that of titanium ions (Table 4). On the contrary, after 48 h, the concentration of titanium ions released exceeded that of nickel ions.
Table 4.
The total concentration of nickel and titanium released into the DMEM solution (in ng/mL).
Regarding the analysis of individual ion release (Ni and Ti), the results indicated that nickel ion release is initially higher than that of titanium, which is consistent with previous studies [55,56]. This can be attributed to the dissolution of the TiO2 surface layer, exposing the underlying layer, which is rich in nickel [57]. Additionally, the lower stability of nickel oxide contributes to its faster degradation compared to titanium oxide. The critical concentration of nickel that is necessary to induce allergies is 600–2500 μg, and the daily dietary intake level is 300–500 μg [58]. The result of the static test performed (TiNi alloy, 24 h, 5 mL) shows that a total of 0.0053 µg of nickel migrated into the solution. This is significantly lower than the daily nickel intake from food, as well as being below the allergenic threshold for nickel. Simultaneously, a total of 0.0042 µg of titanium migrated into the solution in 24 h and 0.0087 µg in 48 h. Previous studies found that the maximum rate of Ni ions release occurred at the beginning of the test, before the rate reduced dramatically due to the thickening of the oxide layer, which serves as a protective barrier. Numerous studies have shown that the cell culture medium facilitates the interaction of Ni and Ti with oxygen, leading to the formation of surface oxides on the nickel–titanium alloy [59]. It should also be pointed out that OH− is one of the toxic reactive oxygen species (ROS) related to pathological cell death. Hydroxyl anions are compounds that perforate the cell membrane and initiate lipid peroxidation, which is a crucial mediator in the mechanism of cell apoptosis and autophagy [60]. Several key damage mechanisms are promoted through the peroxidation of phospholipid bilayers: DNA chain damage, stress of the endoplasmatic reticulum, and mitochondrial apoptosis [60,61].
3.3.3. Cytotoxicity of TiNi
The cytotoxicity of the material’s surface is evaluated through direct contact with human-derived osteoblast-like cells. The findings of this study indicate that mitochondrial activity in cells cultured directly on the tested samples was slightly lower compared to control cells; however, this difference is not statistically significant. Although cell proliferation decreased over the seven-day exposure period, the results did not indicate any subtoxic or lethal effects in standard in vitro conditions ISO 10993-5:2009 [37]. Similar results were obtained in a recent study by Ibrahim et al. [62], with no significant difference in mitochondrial activity when human osteoblasts and cardiac cells were grown on a cast TiNi alloy. Even though cell proliferation is unimpaired, the SEM micrographs, shown in Figure 11, revealed a more rounded morphology of MG-63 cultured on experimental samples on day seven. In the experimental group, cells appear more rounded, likely due to interactions between cells and the material’s surface properties. TiNi alloys form a passive oxide layer in the culture medium over time, which may impair cell adhesion and spreading, leading to a rounded morphology [63]. The passive layer with a duplex structure and porous outer layer may affect the cell’s adhesion and spread through the material surface. The corrosion tests indicated that Cl− rich solutions can promote the formation of hydroxyl anions on the surface of the TiNi alloy, which may lead to adverse clinical effects under in vivo conditions. The observed change in cell morphology, characterized by a more rounded appearance of cells cultured on NiTi samples, as seen under scanning electron microscopy, may indicate increased surface roughness or potential nickel ion release [64].
Accordingly, the study conducted by Ryhänen et al. [57] showed the satisfactory biocompatibility of nitinol alloy composed of 54 wt% nickel and 46 wt% titanium in contact with osteoblasts. When the cells were in direct contact with the alloy produced using the vacuum melting, no inhibitory effect on cell growth was observed. Similar findings were reported by other authors [65] who investigated the biocompatibility of alloys produced using the hot isostatic pressing (HIP) and cold isostatic pressing (CIP) methods. The results showed the good biocompatibility of the Ti-rich alloy, which contains at least 50 wt% titanium. In contrast, the increase in nickel content had a different effect. Alloys with a nickel concentration exceeding 60 wt% caused cells to become detached from the alloy’s surface due to the toxic effects associated with the nickel-rich surface.
Based on all of the above findings, future research should analyze the biological characterization of the alloy under different conditions that mimic the wider human biological environment, such as interactions with other cells, depending on the future purpose of the product.
4. Conclusions
Summarizing the main findings, the following can be concluded:
- As-cast TiNi is a two-phase system. Apart from the primary TiNi phase matrix, the inclusion of an additional Ti2Ni cubic phase is detected.
- TiNi has acceptable corrosion stability. In addition to its moderately low corrosion potential and pitting corrosion at 0.34 V, the dissolution of the unstable Ti2Ni inclusions is also responsible for the breakdown potentials.
- Even though the examined TiNi alloy shows good corrosion behavior, the future optimization of the cooling processes should be performed to minimize the formation of Ti2Ni phases.
- The nickel ions’ release concentration was lower than the daily nickel intake from food and below the allergenic threshold. However, the Ni2+ release was higher than that of the Ti ion, indicating the instability of the protective surface oxide.
- The MTT assay and fluorescence microscopy analysis showed that cell viability and adhesion on TiNi samples are not significantly impaired compared to the control sample. Despite the well-preserved cell morphology cultured on the TiNi alloy, subtle changes in the form of a spherical shape were detected, which may suggest greater surface roughness or the possible release of nickel ions.
- Further improvement in the corrosion properties could be achieved by anodization.
Author Contributions
Conceptualization, M.M.L. and B.N.G.; methodology, B.N.G., M.M.L., D.M. and B.D.; validation, B.N.G., M.M.L., D.M. and A.S.P.; formal analysis, M.M.L., D.M., B.D., M.L., A.S.P. and B.N.G.; investigation, M.M.L., D.M., B.D., A.S.P. and B.N.G.; resources, M.M.L. and B.N.G.; data curation, M.M.L., D.M., B.D., M.L., A.S.P. and B.N.G.; writing—original draft preparation, M.M.L., D.M., B.D., M.L., A.S.P. and B.N.G.; writing—review and editing, M.M.L., A.S.P. and B.N.G.; visualization, M.M.L., A.S.P. and B.N.G.; supervision, M.M.L. and B.N.G.; project administration, M.M.L. and B.N.G.; funding acquisition, M.M.L. and B.N.G. All authors have read and agreed to the published version of the manuscript.
Funding
This research was funded by the MINISTRY OF EDUCATION, SCIENCE AND TECHNOLOGICAL DEVELOPMENT, SERBIA, grant number 451-03-137/2025-03/200135; and as a part of the Eureka Project 20740 REC-MET “Recycling loop of metal alloys from dentistry and maritime”.
Institutional Review Board Statement
This study was conducted in accordance with the Declaration of Helsinki and approved by the Institutional Review Board of the Faculty of Dental Medicine, University of Belgrade (protocol code 36/7, approval date: 11 March 2018).
Data Availability Statement
The original contributions presented in this study are included in the article. Further inquiries can be directed to the corresponding author.
Conflicts of Interest
The authors declare no conflicts of interest.
References
- Morgan, N.B. Medical shape memory alloy applications—The market and its products. Mater. Sci. Eng. A 2004, 378, 16–23. [Google Scholar] [CrossRef]
- Kapoor, D. Nitinol for medical applications: A brief introduction to the properties and processing of nickel titanium shape memory alloys and their use in stents. Johnson Matthey Technol. Rev. 2017, 61, 66–76. [Google Scholar] [CrossRef]
- Patel, S.K.; Behera, B.; Swain, B.; Roshan, R.; Sahoo, D.; Behera, A. A review on NiTi alloys for biomedical applications and their biocompatibility. Mater. Today Proc. 2020, 33, 5548–5551. [Google Scholar] [CrossRef]
- Mehrpouya, M.; Cheraghi Bidsorkhi, H. MEMS Applications of NiTi based shape memory alloys: A Review. Micro Nanosyst. 2016, 8, 79–91. [Google Scholar] [CrossRef]
- Stoeckel, D.; Pelton, A.; Duerig, T. Self-expanding nitinol stents: Material and design considerations. Eur. Radiol. 2004, 14, 292–301. [Google Scholar] [CrossRef]
- Nair, V.S.; Nachimuthu, R. The role of NiTi shape memory alloys in quality of life improvement through medical advancements: A comprehensive review. Proc. Inst. Mech. Eng. H 2022, 236, 923–950. [Google Scholar] [CrossRef] [PubMed]
- Szold, A. Nitinol: Shape-memory and super-elastic materials in surgery. Surg. Endosc. 2006, 20, 1493–1496. [Google Scholar] [CrossRef]
- Reinhardt, J.; Nguyen-Trong, T.-H.; Hähnel, S.; Bellemann, M.E.; Heiland, S. Magnetic resonance imaging of stents: Quantitative in vitro examination at 3 Tesla. Z. Med. Phys. 2009, 19, 278–287. [Google Scholar] [CrossRef]
- Dimitriou, R.; Tsiridis, E.; Giannoudis, P.V. Current concepts of molecular aspects of bone healing. Injury 2005, 36, 1392–1404. [Google Scholar] [CrossRef]
- Akbarinia, S.; Sadrnezhaad, S.K.; Hosseini, S.A. Porous shape memory dental implant by reactive sintering of TiH2–Ni-urea mixture. Mater. Sci. Eng. C 2020, 107, 110213. [Google Scholar] [CrossRef]
- Mirshekari, G.R.; Saatchi, A.; Kermanpur, A.; Sadrnezhaad, S.K. Laser welding of NiTi shape memory alloy: Comparison of the similar and dissimilar joints to AISI 304 stainless steel. Opt. Laser Technol. 2013, 54, 151–158. [Google Scholar] [CrossRef]
- Senthilnathan, K.; Shamimi, A.; Bonsignore, C.; Paranjape, H.; Duerig, T. Effect of prestrain on the fatigue life of superelastic nitinol. J. Mater. Eng. Perform. 2019, 28, 5946–5958. [Google Scholar] [CrossRef]
- Niinomi, M.; Liu, Y.; Nakai, M.; Liu, H.; Li, H. Biomedical titanium alloys with young’s moduli close to that of cortical bone. Regen. Biomater. 2016, 3, 173–185. [Google Scholar] [CrossRef]
- Laster, Z.; Muska, E.A.; Nagler, R. Pediatric mandibular fractures: Introduction of a novel therapeutic modality. J. Trauma. 2008, 64, 225–229. [Google Scholar] [CrossRef]
- Dunn, J.; Kusnezov, N.; Fares, A.; Mitchell, J.; Pirela-Cruz, M. The scaphoid staple: A systematic review. Hand 2017, 12, 236–241. [Google Scholar] [CrossRef]
- Molloy, R.D. Letters to the Editor. J. Trauma Acute Care Surg. 2009, 66, 963. [Google Scholar] [CrossRef]
- Ghimire, S.; Miramini, S.; Edwards, G.; Rotne, R.; Xu, J.; Ebeling, P.; Zhang, L. The investigation of bone fracture healing under intramembranous and endochondral ossification. Bone Rep. 2021, 14, 100740. [Google Scholar] [CrossRef]
- Gojić, M.; Vrsalović, L.; Kožuh, S.; Ćubela, D.; Gudić, S. Microstructure and corrosion properties Ni-Ti alloy after electrochemical testing in 0.9% NaCl solution. Zašt. mater. (Mat. Prot. ). 2012, 53, 345–351. [Google Scholar]
- Tan, L.; Dodd, R.; Crone, W. Corrosion and wear-corrosion behavior of NiTi modified by plasma source ion implantation. Biomaterials 2003, 24, 3931–3939. [Google Scholar] [CrossRef]
- Altas, E. Investigation of the effects of surface oxide layer on wear and corrosion in NiTi alloys: A mechanical and chemical perspective. Sci. Sinter. 2024. OnLine-First. [Google Scholar] [CrossRef]
- Mustafa, N.N.A.; Ahmad, R.; Kamar Affendi, N.H.; Sulaiman, E.; Khushaini, M.A.A.; Ismail, M.; The, L.K.; Salleh, M.Z. In vitro evaluation of cytotoxicity and genotoxicity of porous nickel titanium dental implants produced by metal injection molding technique. J. Biomed. Mater. Res. B, Appl. Biomater. 2024, 112, e35306. [Google Scholar] [CrossRef]
- Matusiewicz, H. Potential release of in vivo trace metals from metallic medical implants in the human body: From ions to nanoparticles—A systematic analytical review. Acta Biomater. 2014, 10, 2379–2403. [Google Scholar] [CrossRef]
- Lazić, M.M.; Mitić, D.; Radović, K.; Đorđević, I.; Majerič, P.; Rudolf, R.; Grgur, B.N. Corrosion behavior of nickel–titanium continuous-casted alloys. Metals 2024, 14, 88. [Google Scholar] [CrossRef]
- Guilemany, J.M.; Cinca, N.; Dosta, S.; Benedetti, A.V. Corrosion behaviour of thermal sprayed nitinol coatings. Corros. Sci. 2008, 51, 171–180. [Google Scholar] [CrossRef]
- Bonaccorso, A.; Tripi, T.R.; Rondelli, G.; Condorelli, G.G.; Cantatore, G.; Schäfer, E. Pitting corrosion resistance of nickel–titanium rotary instruments with different surface treatments in seventeen percent ethylenediaminetetraacetic acid and sodium chloride solutions. J. Endod. 2008, 34, 208–211. [Google Scholar] [CrossRef]
- Semin, V.O.; D’yachenko, F.A.; Erkovich, A.V.; Ostapenko, M.G.; Chernova, A.P.; Shulepov, I.A.; Savkin, K.P.; Khabibova, E.D.; Yuzhakova, S.I.; Meinser, L.L. Characterization of corrosion properties, structure and chemistry of titanium-implanted TiNi shape memory alloy. Mater. Charact. 2023, 206, e113457. [Google Scholar] [CrossRef]
- Sun, X.T.; Kang, Z.X.; Zhang, X.L.; Jiang, H.J.; Guan, R.F.; Zhang, X.P. A comparative study on the corrosion behavior of porous and dense NiTi shape memory alloys in NaCl solution. Electrochim. Acta 2011, 56, 6389–6396. [Google Scholar] [CrossRef]
- Elshaer, R.N.; Ibrahim, K.M. Study of microstructure, mechanical properties, and corrosion behavior of as-cast Ni-Ti and Ti-6Al-4V alloys. J. Materi. Eng. Perform. 2022, 32, 7831–7845. [Google Scholar] [CrossRef]
- Lethabane, M.L.; Olubambi, P.A.; Chikwanda, H.K. Corrosion behaviour of sintered Ti–Ni–Cu–Nb in 0.9% NaCl environment. J. Mater. Res. Technol. 2015, 4, 367–376. [Google Scholar] [CrossRef]
- Hočevar, M.; Batič, B.Š.; Godec, M.; Kononenko, V.; Drobne, D.; Gregorčič, P. The interaction between the osteosarcoma cell and stainless steel surface, modified by high-fluence, nanosecond laser pulses. Surf. Coat. Technol. 2020, 394, e125878. [Google Scholar] [CrossRef]
- Sharma, N.; Jangra, K.K.; Raj, T. Fabrication of NiTi alloy: A review. Proc. Inst. Mech. Eng. Part L J. Mater. Des. Appl. 2015, 232, 250–269. [Google Scholar] [CrossRef]
- Kabiri, Y.; Kermanpur, A.; Foroozmehr, A. Comparative study on microstructure and homogeneity of NiTi shape memory alloy produced by copper boat induction melting and conventional vacuum arc melting. Vacuum 2011, 86, 1073–1077. [Google Scholar] [CrossRef]
- ASTM F2063-18; Standard Specification for Wrought Nickel-Titanium Shape Memory Alloys for Medical Devices and Surgical Implants. ASTM International: West Conshohocken, PA, USA, 2018.
- Jiang, S.-Y.; Zhang, Y.-Q. Microstructure evolution and deformation behavior of as-cast NiTi shape memory alloy under compression. Trans. Nonferrous Met. Soc. China 2012, 22, 90–96. [Google Scholar] [CrossRef]
- Ivanić, I.; Gojić, M.; Kožuh, S. Slitine s prisjetljivosti oblika (II. dio): Podjela, proizvodnja i primjena. Kem. U Ind. 2014, 63, 331–344. [Google Scholar] [CrossRef]
- ISO 10271:2009; Dentistry-Corrosion Test Methods for Metallic Materials. International Organization for Standardization: Geneva, Switzerland, 2009.
- ISO 10993-5:2009; Biological Evaluation of Medical Devices-Part 5: Tests for in vitro Cytotoxicity. International Organization for Standardization: Geneva, Switzerland, 2009.
- Lemke, J.N.; Gallino, F.; Cresci, M.; Zilio, S.; Coda, A. Low-hysteresis shape memory alloy scale-up: DSC, XRD and microstructure analysis on heat-treated vacuum induction melted Ni-TI-CU-PD alloys. Metals 2021, 11, 1387. [Google Scholar] [CrossRef]
- Anikeev, S.G.; Artyukhova, N.V.; Shabalina, A.V.; Kulinich, S.A.; Hodorenko, V.N.; Kaftaranova, M.I.; Promakhov, V.V.; Gunter, V.E. Preparation of porous TiNi-Ti alloy by diffusion sintering method and study of its composition, structure and martensitic transformations. J. Alloys Compd. 2021, 900, 163559. [Google Scholar] [CrossRef]
- Gao, S.; Bodunde, O.P.; Qin, M.; Liao, W.-H.; Guo, P. Microstructure and phase transformation of nickel-titanium shape memory alloy fabricated by directed energy deposition with in-situ heat treatment. J. Alloys Compd. 2021, 898, 162896. [Google Scholar] [CrossRef]
- Hu, L.; Xue, Y.; Shi, F. Intermetallic formation and mechanical properties of Ni-Ti diffusion couples. Mater. Des. 2017, 130, 175–182. [Google Scholar] [CrossRef]
- Sun, F.; Jordan, L.; Albin, V.; Lair, V.; Ringuedé, A.; Prima, F. On the High Sensitivity of Corrosion Resistance of NiTi Stents with Respect to Inclusions: An Experimental Evidence. ACS Omega. 2020, 5, 3073–3079. [Google Scholar] [CrossRef]
- Bhagyaraj, J.; Ramaiah, K.V.; Saikrishna, C.N.; Bhaumik, S.K.; Gouthama, N. Behavior and effect of Ti2Ni phase during processing of NiTi shape memory alloy wire from cast ingot. J. Alloys Compd. 2013, 581, 344–351. [Google Scholar] [CrossRef]
- Fashu, S.; Lototskyy, M.; Davids, M.W.; Pickering, L.; Linkov, V.; Tai, S.; Renheng, T.; Fangming, X.; Fursikov, P.V.; Tarasov, B.P. A review on crucibles for induction melting of titanium alloys. Mater. Des. 2019, 186, 108295. [Google Scholar] [CrossRef]
- Frenzel, J.; Neuking, K.; Eggeler, G. Induction melting of NITI shape memory alloys-the influence of the commercial crucible graphite on alloy quality. Materialwiss. Werkst. 2004, 35, 352–358. [Google Scholar] [CrossRef]
- Gaber, G.A.; Mohamed, L.Z.; Järvenpää, A.; Hamada, A. Enhancement of corrosion protection of AISI 201 austenitic stainless steel in acidic chloride solutions by Ce-doped TiO2 coating. Surf. Coat. Tech. 2021, 423, 127618. [Google Scholar] [CrossRef]
- Esmailzadeh, S.; Aliofkhazraei, M.; Sarlak, H. Interpretation of cyclic potentiodynamic polarization test results for study of corrosion behavior of metals: A review. Prot. Met. Phys. Chem. Surf. 2018, 54, 976–989. [Google Scholar] [CrossRef]
- Lazanas, A.C.; Prodromidis, M.I. Electrochemical Impedance Spectroscopy-A tutorial. ACS Meas. Sci. Au 2023, 3, 162–193. [Google Scholar] [CrossRef]
- Singh, M.B.; Gabriel, B.I.; Venkatraman, M.S.; Cole, I.S.; Moorthy, C.G.; Emmanuel, B. Theory of impedance for initial corrosion of metals under a thin electrolyte layer: A coupled charge transfer-diffusion model. J. Chem. Sci. 2022, 134, 32. [Google Scholar] [CrossRef]
- Rivera-Grau, L.M.; Casales, M.; Regla, I.; Ortega-Toledo, D.M.; Ascencio-Gutierrez, J.A.; Porcayo-Calderon, J.; Martinez-Gomez, L. Effect of organic corrosion inhibitors on the corrosion performance of 1018 carbon steel in 3% NaCl solution. Int. J. Electrochem. Sci. 2013, 8, 2491–2503. [Google Scholar] [CrossRef]
- Sittig, C.; Textor, M.; Spencer, N.D.; Wieland, M.; Vallotton, P.H. Surface characterization of implant materials c.p. Ti, Ti-6Al-7Nb and Ti-6Al-4V with different pretreatments. J. Mater. Sci. Mater. Med. 1999, 10, 35–46. [Google Scholar] [CrossRef]
- Pantaroto, H.N.; Cordeiro, J.M.; Pereira, L.T.; De Almeida, A.B.; Nociti Junior, F.H.; Rangel, E.C.; Neto, N.F.A.; Da Silva, J.H.D.; Barão, V.A.R. Sputtered crystalline TiO2 film drives improved surface properties of titanium-based biomedical implants. Mater. Sci. Eng. C 2020, 119, 111638. [Google Scholar] [CrossRef]
- Gao, S.; Weng, F.; Bodunde, O.P.; Qin, M.; Liao, W.-H.; Guo, P. Spatial characteristics of nickel-titanium shape memory alloy fabricated by continuous directed energy deposition. J. Manuf. Process. 2021, 71, 417–428. [Google Scholar] [CrossRef]
- Chen, G.; Liu, S.; Huang, C.; Ma, Y.; Li, Y.; Zhang, B.; Gao, L.; Zhang, B.; Wang, P.; Qu, X. In-situ phase transformation and corrosion behavior of TiNi via LPBF. Corr. Sci. 2022, 203, 110348. [Google Scholar] [CrossRef]
- Rincic Mlinaric, M.; Durgo, K.; Katic, V.; Spalj, S. Cytotoxicity and oxidative stress induced by nickel and titanium ions from dental alloys on cells of gastrointestinal tract. Toxicol. Appl. Pharmacol. 2019, 383, 114784. [Google Scholar] [CrossRef]
- Katić, V.; Ćurković, L.; Bošnjak, M.U.; Špalj, S. Determination of corrosion rate of orthodontic wires based on nickel-titanium alloy in artificial saliva. Materialwiss. Werkst. 2014, 45, 99–105. [Google Scholar] [CrossRef]
- Ryhänen, J.; Niemi, E.; Serlo, W.; Niemelä, E.; Sandvik, P.; Pernu, H.; Salo, T. Biocompatibility of nickel-titanium shape memory metal and its corrosion behavior in human cell cultures. J. Biomed. Mater. Res. 1997, 35, 451–457. [Google Scholar] [CrossRef]
- Ng, K.W.; Man, H.C. Laser surface modification of nickel–titanium (NiTi) alloy biomaterials to improve biocompatibility and corrosion resistance. In Elsevier eBooks; Woodhead Publishing: Cambridge, UK, 2012; pp. 124–151. [Google Scholar] [CrossRef]
- Du, T.; Liu, J.; Dong, J.; Xie, H.; Wang, X.; Yang, X.; Yang, Y. Multifunctional coatings of nickel-titanium implant toward promote osseointegration after operation of bone tumor and clinical application: A review. Front. Bioeng. Biotechnol. 2024, 12, 1325707. [Google Scholar] [CrossRef]
- Wang, B.; Wang, Y.; Zhang, J.; Hu, C.; Jiang, J.; Li, Y.; Peng, Z. ROS-induced lipid peroxidation modulates cell death outcome: Mechanisms behind apoptosis, autophagy, and ferroptosis. Arch. Toxicol. 2023, 97, 1439–1451. [Google Scholar] [CrossRef]
- Kajarabille, N.; Latunde-Dada, G.O. Programmed Cell-Death by ferroptosis: Antioxidants as mitigators. Int. J. Mol. Sci. 2019, 20, 4968. [Google Scholar] [CrossRef]
- Ibrahim, K.M.; Safwat, E.M.; Ghayad, I.M.; El-Hadad, S. In-vitro biocompatibility evaluation of cast Ni–Ti alloy produced by vacuum arc melting technique for biomedical and dental applications. Chem. Pap. 2022, 77, 847–858. [Google Scholar] [CrossRef]
- Garcia-Ramirez, M.J.; Lopez-Sesenes, R.; Rosales-Cadena, I.; Gonzalez-Rodriguez, J.G. Corrosion behaviour of Ti–Ni–Al alloys in a simulated human body solution. J. Mater. Res. Technol. 2017, 7, 223–230. [Google Scholar] [CrossRef]
- Mine Toker, S. Surface Property Dependent Biocompatibility Analysis of NiTi Shape Memory Alloys to be used in Root Canal Shaping Applications. Int. J. Dent. Oral Sci. 2018, 1–4. [Google Scholar] [CrossRef]
- Bogdanski, D.; Köller, M.; Müller, D.; Muhr, G.; Bram, M.; Buchkremer, H.P.; Stöver, D.; Choi, J.; Epple, M. Easy assessment of the biocompatibility of Ni–Ti alloys by in vitro cell culture experiments on a functionally graded Ni–NiTi–Ti material. Biomaterials 2002, 23, 4549–4555. [Google Scholar] [CrossRef] [PubMed]
Disclaimer/Publisher’s Note: The statements, opinions and data contained in all publications are solely those of the individual author(s) and contributor(s) and not of MDPI and/or the editor(s). MDPI and/or the editor(s) disclaim responsibility for any injury to people or property resulting from any ideas, methods, instructions or products referred to in the content. |
© 2025 by the authors. Licensee MDPI, Basel, Switzerland. This article is an open access article distributed under the terms and conditions of the Creative Commons Attribution (CC BY) license (https://creativecommons.org/licenses/by/4.0/).