Article

The Influence of Beryllium Incorporation into an Al-5wt.%Cu-1wt.%Si Alloy on the Solidification Cooling Rate, Microstructural Length Scale, and Corrosion Resistance

1
Department of Aeronautical Engineering, School of Engineering of São João, São Paulo State University (UNESP), São João da Boa Vista 13876-750, SP, Brazil
2
Department of Materials Engineering, University of Sao Paulo (USP), Sao Carlos 13563-120, SP, Brazil
3
Department of Manufacturing and Materials Engineering, University of Campinas (UNICAMP), Campinas 13083-860, SP, Brazil
*
Author to whom correspondence should be addressed.
Metals 2025, 15(7), 736; https://doi.org/10.3390/met15070736
Submission received: 3 June 2025 / Revised: 21 June 2025 / Accepted: 28 June 2025 / Published: 30 June 2025

Abstract

The addition of beryllium (Be) to Al–Cu alloys enhances their mechanical properties and corrosion resistance. This study aims to investigate the effects of solidification cooling rates and the addition of Be on the microstructural refinement and corrosion behavior of an Al–5wt.%Cu–1wt.%Si–0.5wt.%Be alloy. Radial solidification under unsteady-state conditions was performed using a stepped brass mold, producing four distinct cooling rates. An experimental growth law, λ2 = 26 T ˙ 1 / 3 , was established, confirming the influence of Be and the cooling rate on dendritic size reduction. The final microstructure was characterized by an α-Al dendritic matrix with eutectic compounds (α-Al + θ-Al2Cu + Si + Fe-rich phase) confined to the interdendritic regions. No Be-containing intermetallic phases were detected, and beryllium remained homogeneously distributed within the eutectic. Notably, Be addition promoted a morphological transformation of the Fe-rich phases from angular or acicular forms into a Chinese-script-like structure, which is associated with reduced local stress concentrations. Tensile tests revealed an ultimate tensile strength of 248.8 ± 11.2 MPa and elongation of approximately 6.4 ± 0.5%, indicating a favorable balance between strength and ductility. Corrosion resistance assessment by EIS and polarization tests in a 0.06 M NaCl solution showed a corrosion rate of 28.9 µm·year−1 and an Epit of −645 mV for the Be-containing alloy, which are lower than those measured for the reference Al–Cu and Al–Cu–Si alloys.

1. Introduction

The addition of beryllium (Be) to aluminum alloys has attracted scientific and technological interest since the beginning of the 20th century due to Be’s unique properties, such as low density, high hardness, corrosion resistance, thermal stability, and good electrical conductivity [1,2]. In commercial Al-Si alloys, some studies [3,4] have shown that minor Be additions promote microstructural refinement and significant morphological changes, such as the transformation of harmful needle-like, iron-rich phases into less detrimental Chinese-script morphologies. Additionally, in Al-Mn [5] and Al-Fe-Cu [6] systems, Be has been observed to stabilize quasicrystalline phases and alter solidification mechanisms, favoring primary formation over incomplete peritectic reactions.
The Al-5wt.%Cu-1wt.%Si alloy (the base of UNS A02950 alloy [7]) represents a ternary system commonly employed in aluminum casting industries, especially in applications requiring good mechanical strength, weldability, and moderate corrosion resistance. Copper (Cu) contributes to precipitation hardening through the formation of metastable phases, while silicon (Si) improves melt fluidity and reduces solidification shrinkage [8]. However, the simultaneous presence of Cu and Si favors the formation of complex intermetallic phases, whose morphology, distribution, and composition strongly influence the final properties of the material. The resulting microstructure after solidification is highly dependent on the process’s thermal parameters, particularly the cooling rate, which controls secondary dendritic arm spacing, grain size, and the fractionation of intermetallic phases.
The relationship between microstructural parameters and the ultimate application properties is vital for the metallurgical pre-planning of a metallic component for structural or mechanical applications. This analysis encompasses assessing the grain size, quantifying phase fractions, and evaluating the microstructural arrangement. Parameters such as tensile strength and corrosion resistance have been mainly correlated with microstructural parameters associated with solidification [9,10,11,12], such as dendritic or cellular spacing. Applying aluminum-based lightweight alloys to manufacturing technological components offers improvements in various areas, as their intrinsic characteristics generally result in better fuel efficiency and superior corrosion resistance. The correlation of microstructural parameters with the resulting corrosion behavior is essential for the initial analysis of the alloy application properties. This is justified because each process exposes the metal to potentially harmful environmental conditions [13,14]. It is worth noting that corrosion resistance and mechanical strength do not always exhibit similar behavior associated with microstructural parameters such as grain size, cellular and dendritic spacings, and phase fraction [10]. The microstructural morphology of aluminum alloys in their as-cast state is influenced by the dynamics of the solid/liquid interface during latent heat release. During the alloy solidification process, a transition can occur in the growth morphology, shifting from planar to cellular and from cellular to dendritic microstructures [10].
The addition of beryllium to aluminium alloys has garnered increasing attention due to its capacity to refine microstructural features and improve performance in structural and corrosive environments [15,16,17]. Studies have shown that even small additions of Be, typically below 0.5 wt.%, can significantly alter the morphology of eutectic constituents and precipitate phases, promoting a more homogeneous and refined distribution [18,19,20]. This refinement mechanism is particularly beneficial in reducing micro-galvanic coupling between anodic and cathodic phases, which contributes to enhanced corrosion resistance. Moreover, Be additions have been associated with improvements in mechanical strength, primarily due to the suppression of coarse phase formation and the stabilization of the solidification front [21]. Nonetheless, the application of Be in Al-based alloys requires careful control, as excessive content may lead to the formation of brittle intermetallics [2] or raise toxicity concerns during processing [22,23,24].
Azarbarmas et al. [25] conducted a study investigating the impact of Beryllium on the microstructure and mechanical properties of the Al-15wt.%Mg2Si composite. The authors found that increasing the Be content reduced the average size and volume fraction of primary Mg2Si particles. Additionally, they observed that the alloy without Be exhibited the formation of coarse primary Mg2Si crystals, which grew in hollow forms. In contrast, the alloy containing Be demonstrated the formation of finer Mg2Si particles without this void morphology, which was considered advantageous as the voids within particles can serve as potential sites for crack initiation. Furthermore, the researchers confirmed that the addition of Be improved both the ultimate tensile strength (UTS) and elongation values.
Although advances have been made in the design of Al-Cu-Si alloys, few studies have systematically addressed the influence of trace alloying elements such as beryllium on solidification mechanisms and their subsequent effects on microstructure and electrochemical performance. Given the high reactivity of Be and its potential to form heterogeneous particles that act as nucleation sites, it is reasonable to assume that its presence alters local solidification conditions, leading to more refined and potentially more homogeneous microstructures. Nevertheless, the literature still lacks experimental evidence correlating Be addition with modifications in solidification thermal parameters, such as growth rate and thermal gradient, and their consequences for corrosion resistance in aggressive environments, which is a key factor in structural applications exposed to severe conditions. The addition of beryllium to aluminum alloys facilitates achieving this objective [24]. Considering the meticulous metallurgical processing of Be, it is crucial to assess its impact when added to conventional Al alloys, which hold the potential to achieve specific mechanical strength to produce structural components.
This study aims to clarify the effects of adding beryllium on the solidification process, microstructure development, and corrosion resistance of the Al–5wt.%Cu–1wt.%Si alloy under transient radial solidification conditions. Despite increasing interest in using trace alloying elements for controlling microstructure, the impact of Be on dendritic refinement, intermetallic shape, and electrochemical properties in Al–Cu–Si alloys remains poorly understood. A comprehensive approach, combining experimental casting in a stepped brass mold, thermal analysis, XRD, SEM/EDS, mechanical testing, and electrochemical analysis, was used. The aim was to find a quantitative link between cooling rate, secondary dendritic arm spacing (λ2), and corrosion rate (CRy), while also exploring how Be influences Fe- and Si-containing phases. Unlike earlier studies that mainly focused on commercial Al–Si alloys or high-Be-content systems, this research examined a small Be addition (0.5 wt.%) to a ternary Al–Cu–Si alloy, offering new insights into its effects on eutectic modification, solid solution behavior, and phase morphology. The findings help expand strategies for designing Al-Cu-based structural alloys by exploring Be as both a microstructural modifier and a corrosion resistance enhancer.

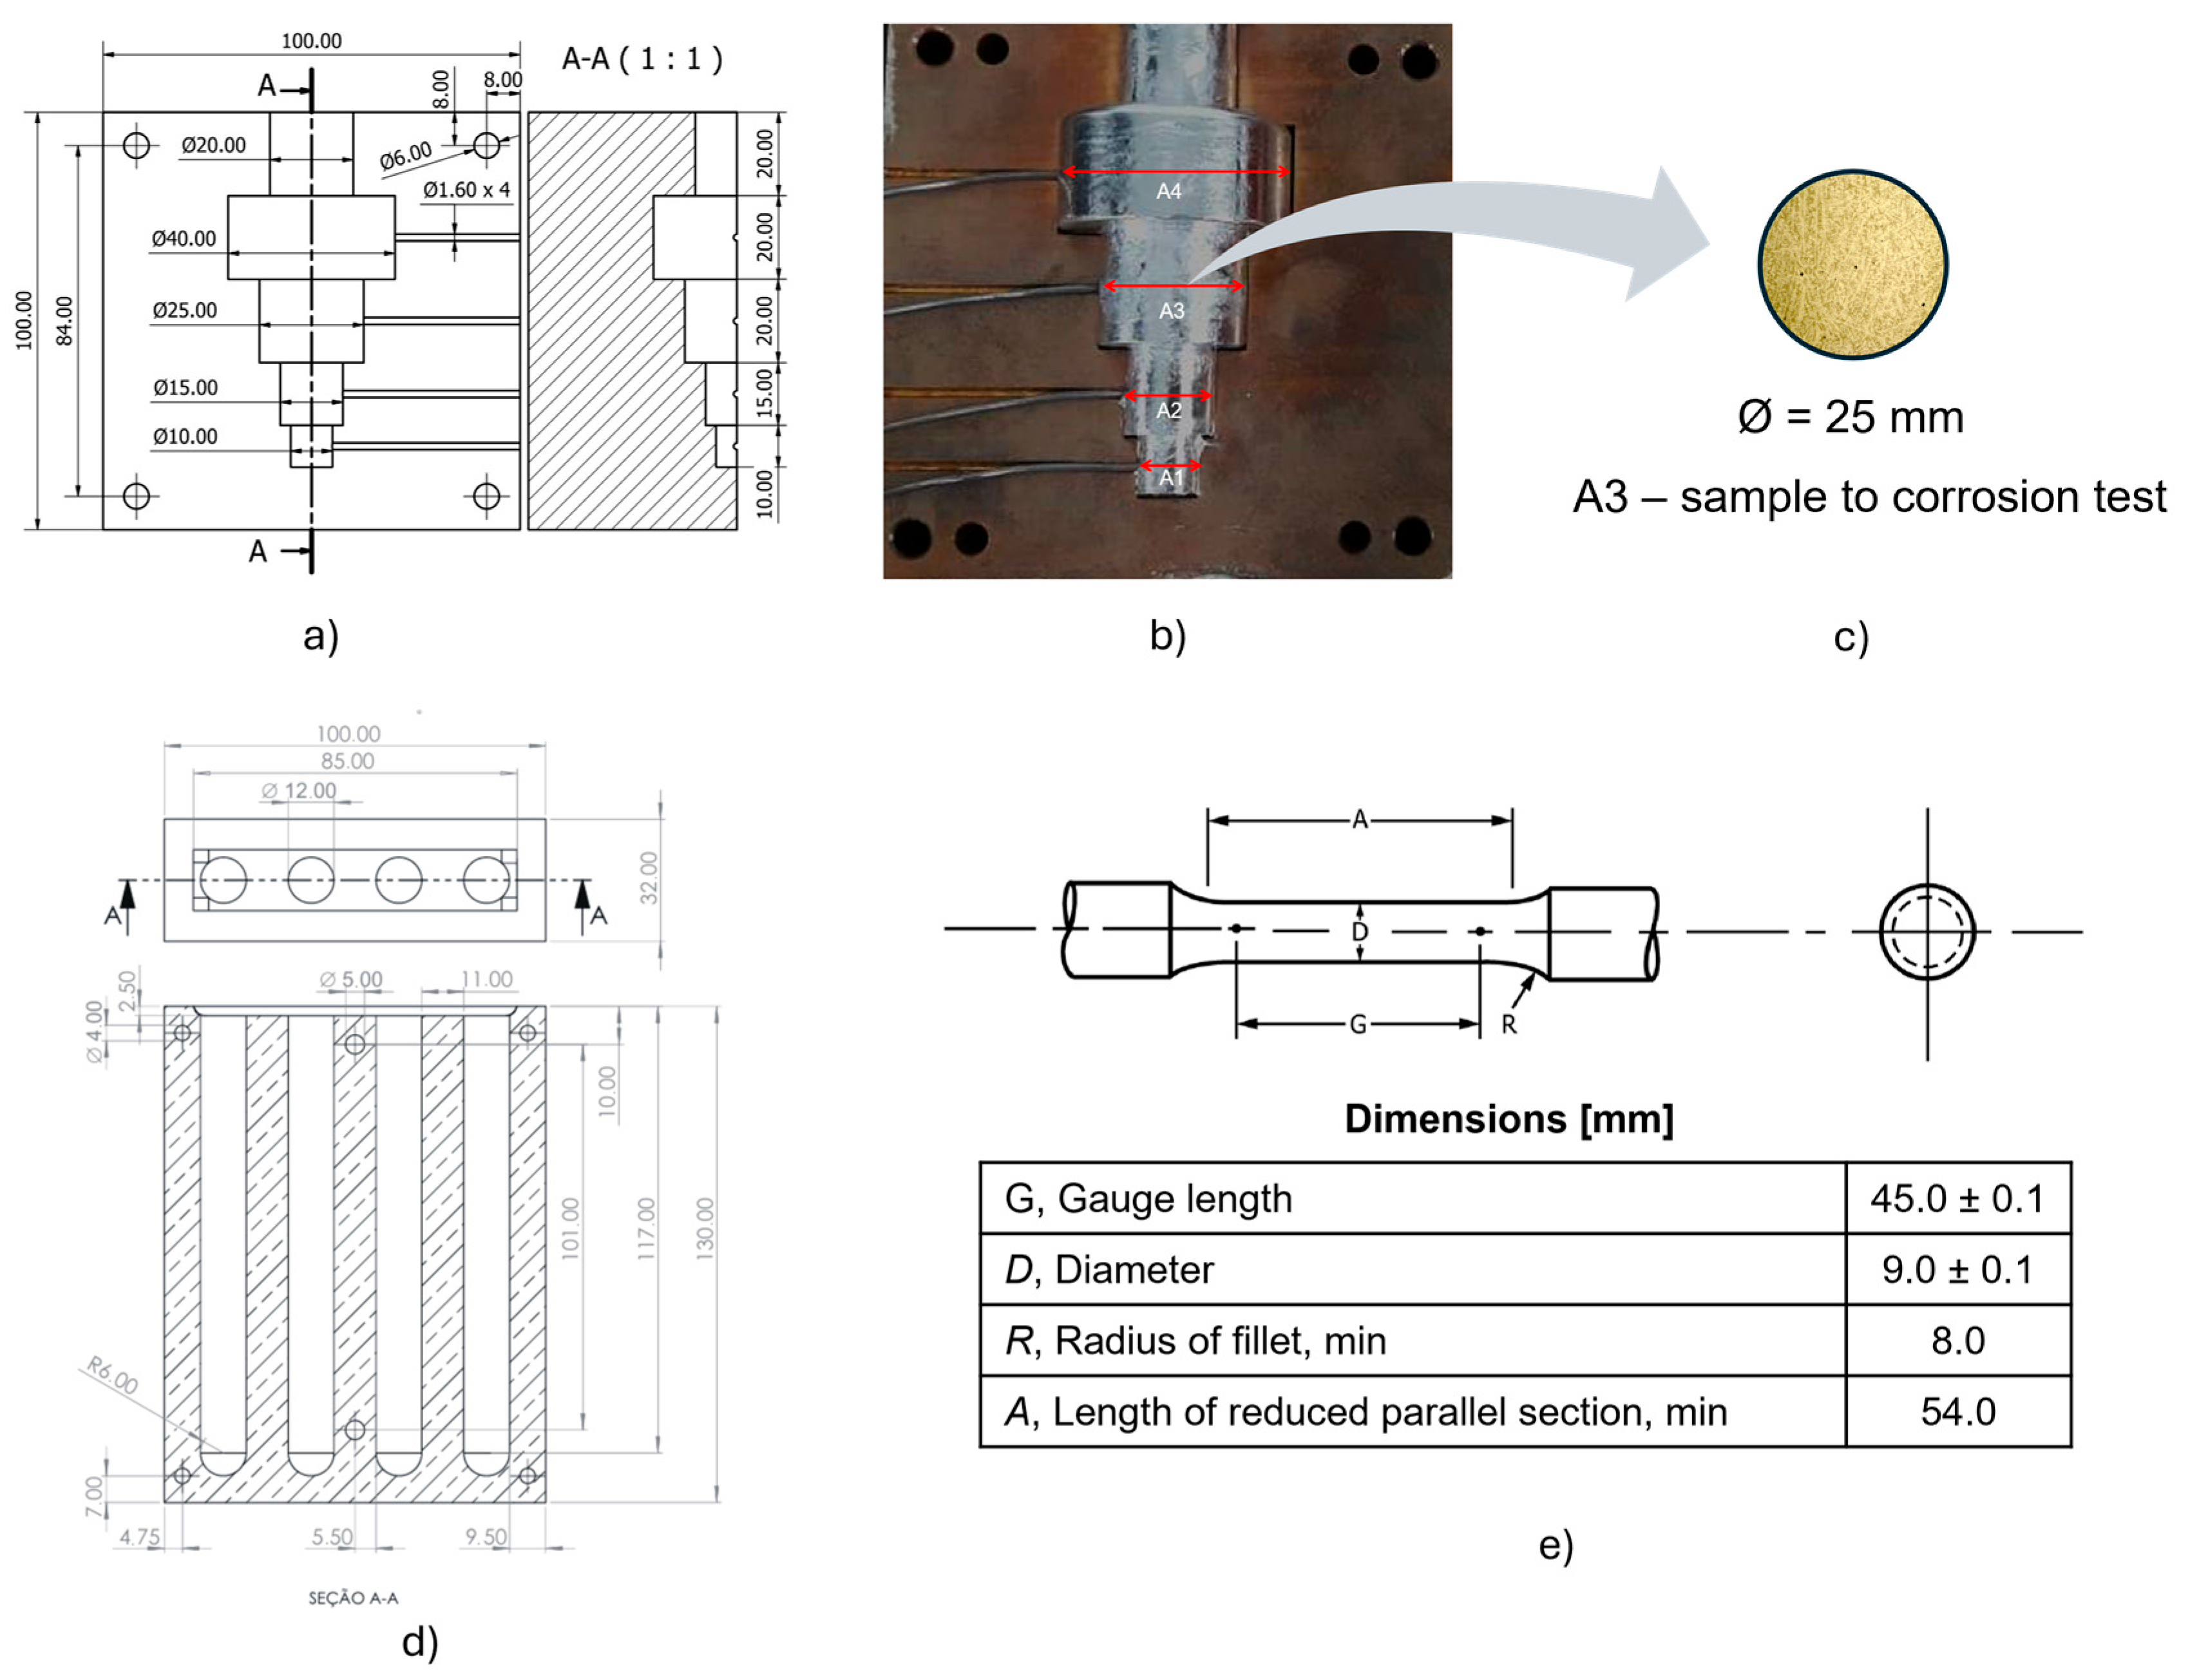
2. Materials and Methods

Thermodynamic equilibrium simulations were conducted using Thermo-Calc 2023b software and the TCAL8 database to guide the addition of beryllium in an Al alloy, aiming to predict the microstructural constituents and phases. This methodology facilitates an understanding of the microstructural behavior and phase formation of the alloy itself, as well as the definition of a composition of interest [26,27].
The Al-5wt.%Cu-1wt.%Si-0.5wt.%Be alloy was fabricated by incorporating a copper-based alloy with a beryllium content of 10 wt.% and commercially pure silicon. The compositions of metals used to prepare the alloy are shown in Table 1. Initially, the aluminum was melted in a muffle furnace at a temperature of 850 °C using a silicon-carbide crucible internally coated with a refractory mass based on alumina. Then, all solute elements were introduced into the molten liquid and held in the furnace for 60 min at 850 °C to facilitate solute incorporation into the alloy through diffusion. Prior to pouring the alloy, a stainless-steel (AISI 304) rod was used for homogenization to prevent contamination. Finally, the alloy was cast into a brass mold (ASTM C27200 alloy) at 750 °C, which had four varying diameters: 10, 15, 25, and 40 mm, as illustrated in Figure 1.
To measure the solidification cooling rate ( T ˙ ), a total of four (4) type-K thermocouples with a wire diameter of 0.2 mm were strategically positioned at the geometrical center of the cylindrical cavity for each section of the brass ingot mold (Figure 1b). These thermocouples were connected to a data logger, Fieldlogger (Novus, Canoas, Brazil), via coaxial cables, and interfaced with a computer. The setup allowed for the automated recording of temperature data at a frequency of 5 Hz. Time-dependent temperature profiles were utilized to analyze the cooling rates for each cast mold diameter. This approach enabled a comprehensive understanding of the thermal dynamics involved in the casting process. The T ˙ was calculated using power law functions, representing the overall temperature–time behavior in the casting process [28]. The details of the experimental casting apparatus, melting, and solidification procedure have been described in a previous study [29]. The T ˙ values are provided in Table 2. The ingot was sectioned to produce four samples, with the sample positions and section shapes shown in Figure 1b.
The microstructural analysis was conducted on samples taken from each cross-section related to the vertical axis of the brass ingot mold. The samples were prepared by grinding with sandpaper and polishing with ¼ μm of diamond paste, eliminating the need for chemical etching to reveal the microstructure. Optical microscopy was performed using a ZEISS Axiolab 5 microscope (ZEISS, Oberkochen, Germany). Secondary dendritic arm spacings (λ2) were measured from optical images of the samples. The intercept method [30,31,32] was used to measure λ2. A minimum of 50 measurements were conducted for each sample. The intermetallic compounds (IMCs) were characterized using scanning electron microscopy (SEM) micrographs and analyzed with an energy dispersive spectrometer (EDS), model OXFORD X-MAX50 (Oxford Instruments, Abingdon, UK), which was incorporated into a SEM Quanta FEG 250 (Thermo Fisher Scientific, Waltham, MA, USA). X-ray diffraction analysis (XRD) was performed using a diffractometer model X’Pert PRO MRD XL (Malvern Panalytical, Malvern, UK); the patterns were obtained using an XRD diffractometer with a 2-theta range from 10 to 120° (Bragg–Brentano reflection geometry with CuKα radiation; λ = 1.5418 Å), by comparing the XRD patterns with crystallographic data from the Inorganic Crystal Structure Database–ICSD.
The tensile test was performed in triplicate with test specimen (TS) solidified samples using a cooling rate of approximately 21.4 K/s and prepared following the ASTM E8/E8M standard [33]; a Universal Testing Machine (Biopdi, São Carlos, Brazil) from Biopdi was used for the tensile test, with a test speed of 0.5 mm/min and a preload of 500 N. Tensile samples have a cylindrical shape with a reduced section of 9.0 mm and a gauge length of 45.0 mm (Figure 1d–e).
A three-electrode electrochemical cell setup was used to conduct electrochemical impedance spectroscopy (EIS) and linear potentiodynamic polarization (or linear sweep voltammetry—LSV) analyses. The cell comprised an Ag/AgCl 3 M KCl reference electrode and a platinum plate counter electrode, and the sample A3 ( T ˙ = 21.4 K/s) of the Al-5wt.%Cu-1wt.%Si-0.5wt.%Be alloy was taken as the working electrode [10]. Specimens for the electrochemical tests were subjected to metallographic preparation, including sanding and polishing, like the process employed for microstructural characterization. The tests were performed in triplicate, as recommended by the standards [9,10], to ensure the reproducibility of the results. The data obtained were statistically analyzed, including the calculation of standard deviation, to ensure consistency of the results. Before the beginning of each test, the samples were washed with distilled water and dried to eliminate any dirt on the area to be tested. Corrosion tests were conducted using an AUTOLAB PGSTAT128N (Metrohm Autolab, Herisau, Switzerland) and Nova 1.1 software. The corrosion tests were conducted only for sample A3 (Ṫ = 21.4 K/s), since no significant variation in the type or fraction of intermetallic phases was observed among the samples, and the literature reports indicate that minor changes in secondary dendrite arm spacing (λ2) alone have limited influence on corrosion behavior.
All electrochemical tests were conducted at room temperature (25° ± 2 °C) using a 0.06 M NaCl solution. The choice of this diluted saline solution was motivated by the inhibitory effect and aggressiveness often observed in electrolytes with higher concentrations, such as the standard 0.5 M solution. Both the EIS and LSV analyses were performed under naturally aerated conditions. The working electrode was exposed to the electrolyte solution with a circular area of 0.503 cm2, and a surface finish was achieved using 1-μm of diamond paste. Additionally, an Autolab Faraday cage was employed to shield the EIS measurements and LSV scans from any external sources of electromagnetic interference. Before starting the LSV analysis, the sample was measured at open-circuit potential (OCP) for 2400 s. Linear polarization assays were then performed at a sweep rate of 0.167 mV/s from −0.200 mV to +0.250 mV versus OCP. Corrosion current density (icorr) values were calculated for all samples exposed to the electrolyte employing Tafel extrapolation [34,35].
EIS analysis was conducted with an amplitude adjusted to 10 mV, corresponding to the peak-to-peak open-circuit potential, using six points per decade in a frequency range from 100 mHz to 100 kHz with an AC signal. The impedance spectroscopy assays resulted in Bode, Bode phase, and Nyquist curves. Simulations were performed using the AUTOLAB NOVA 1.11 software. All electrochemical measurements were conducted in triplicate.

3. Results and Discussion

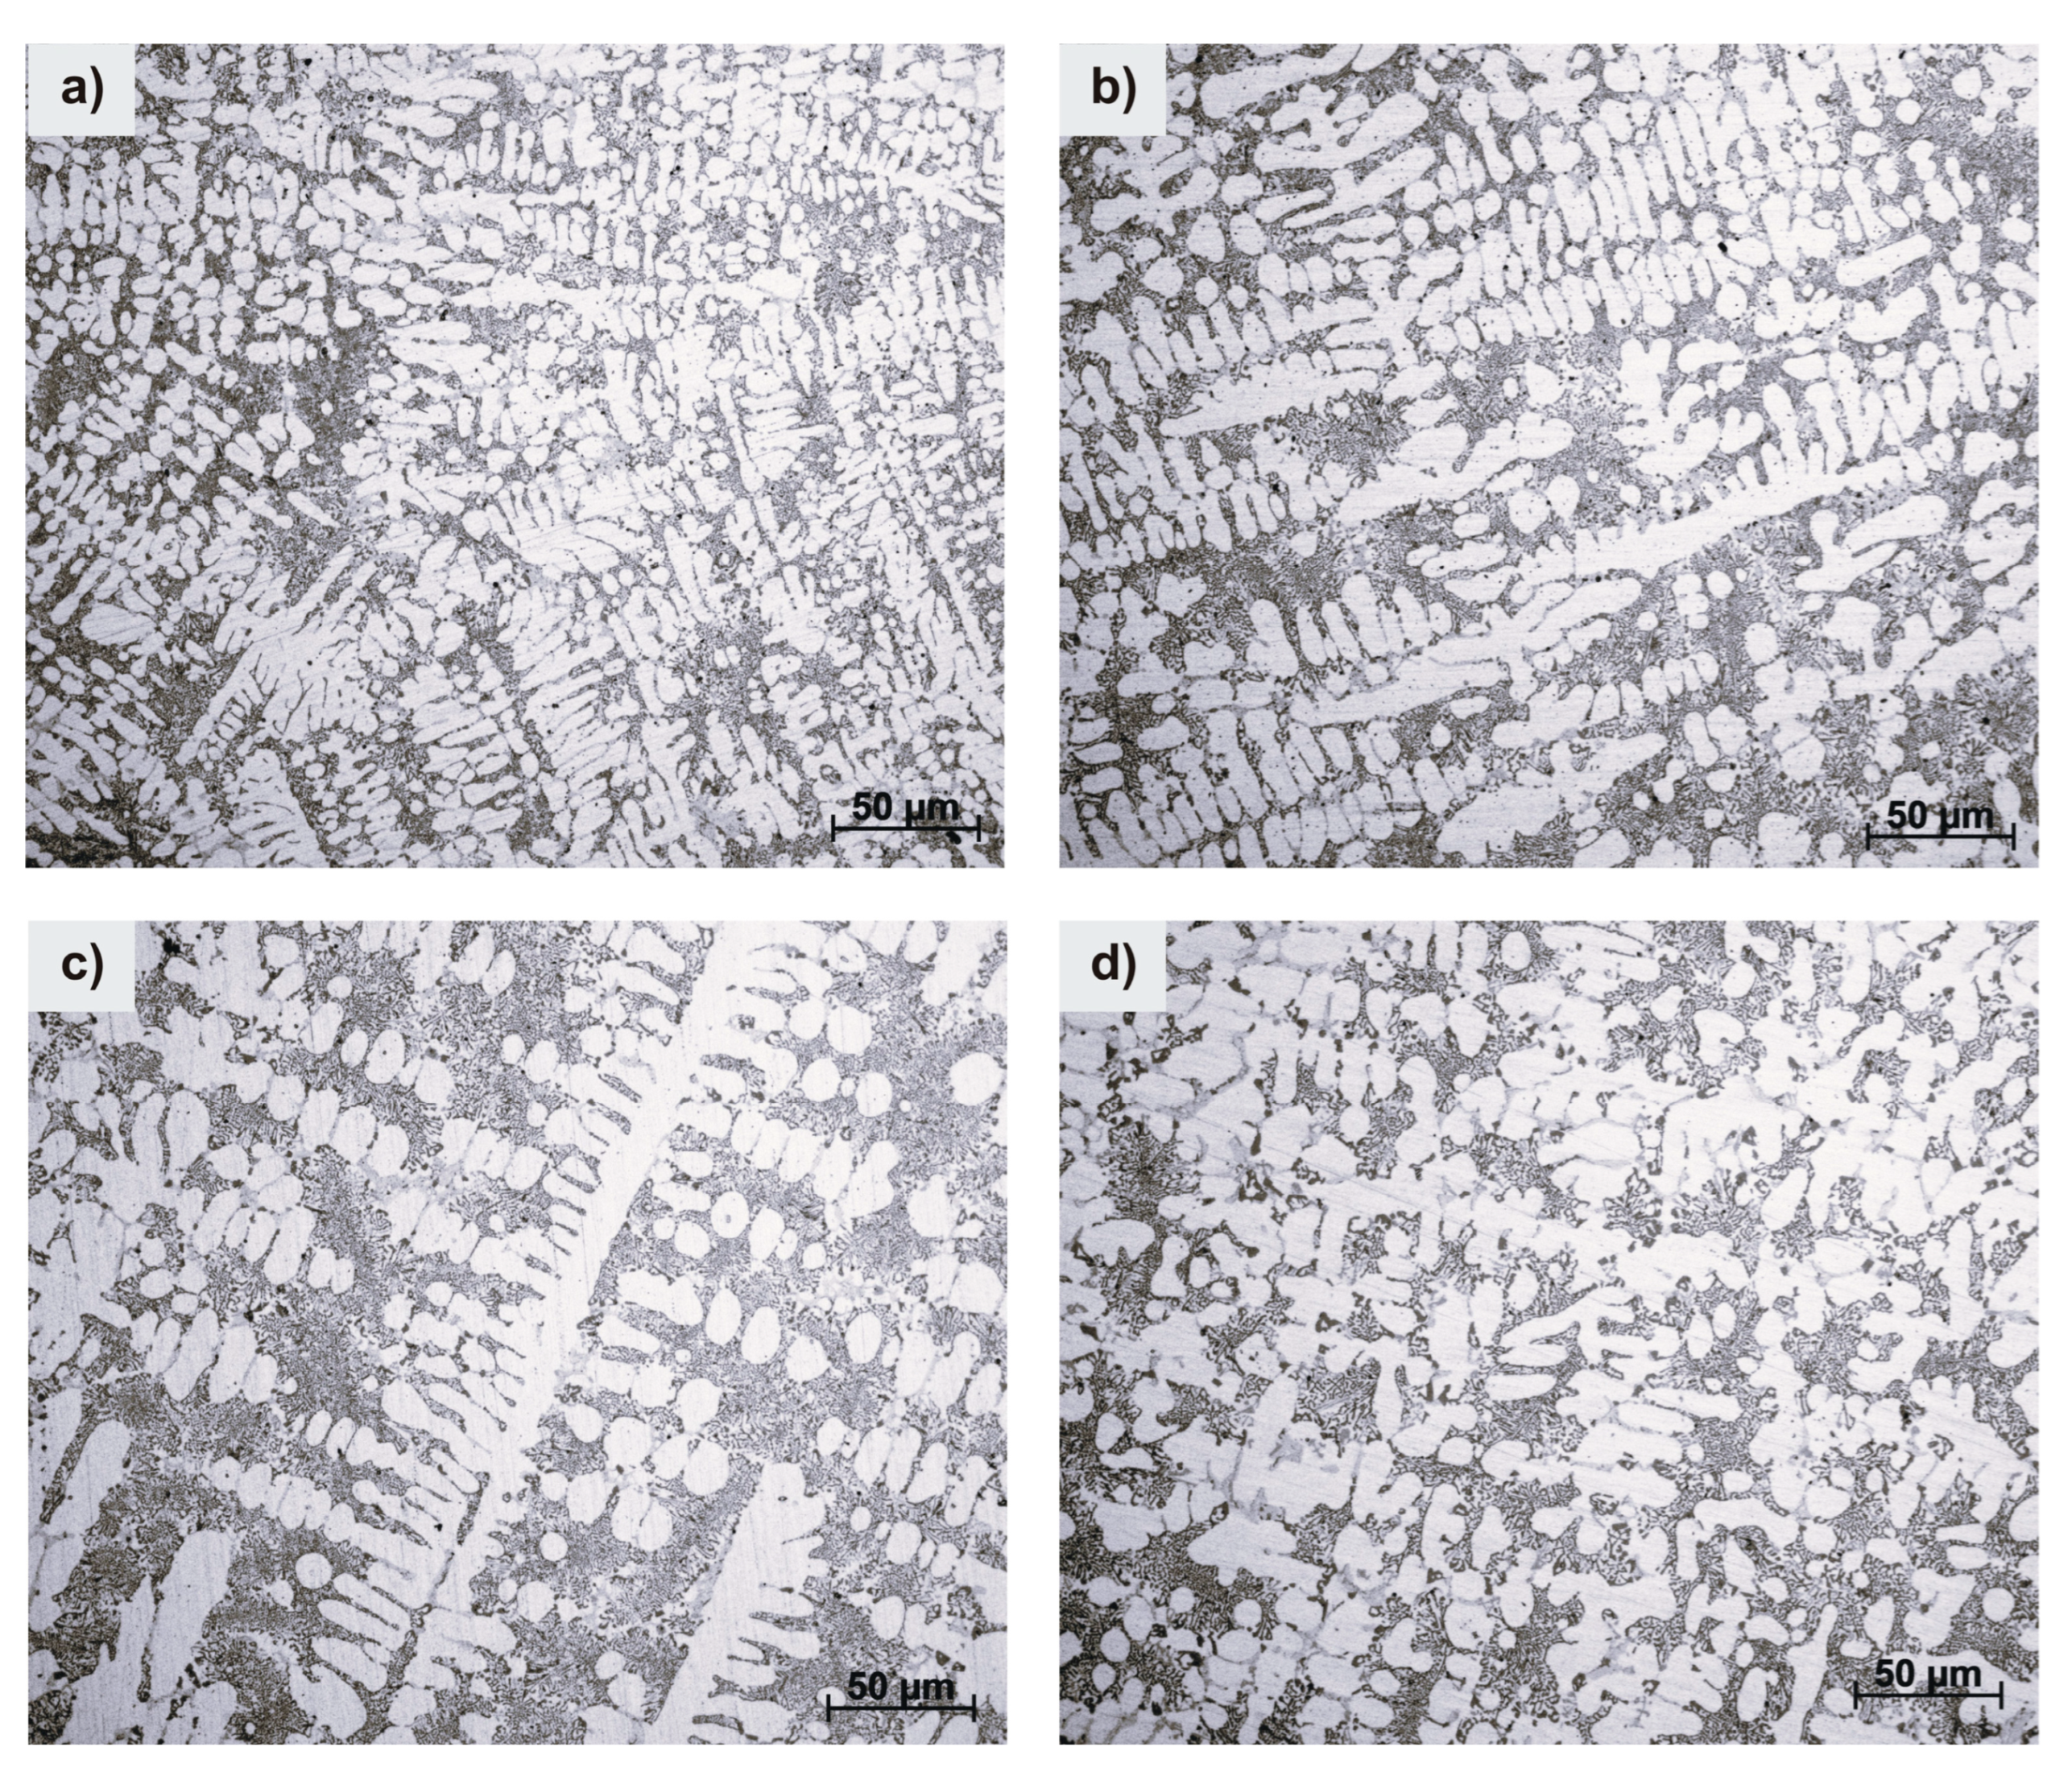
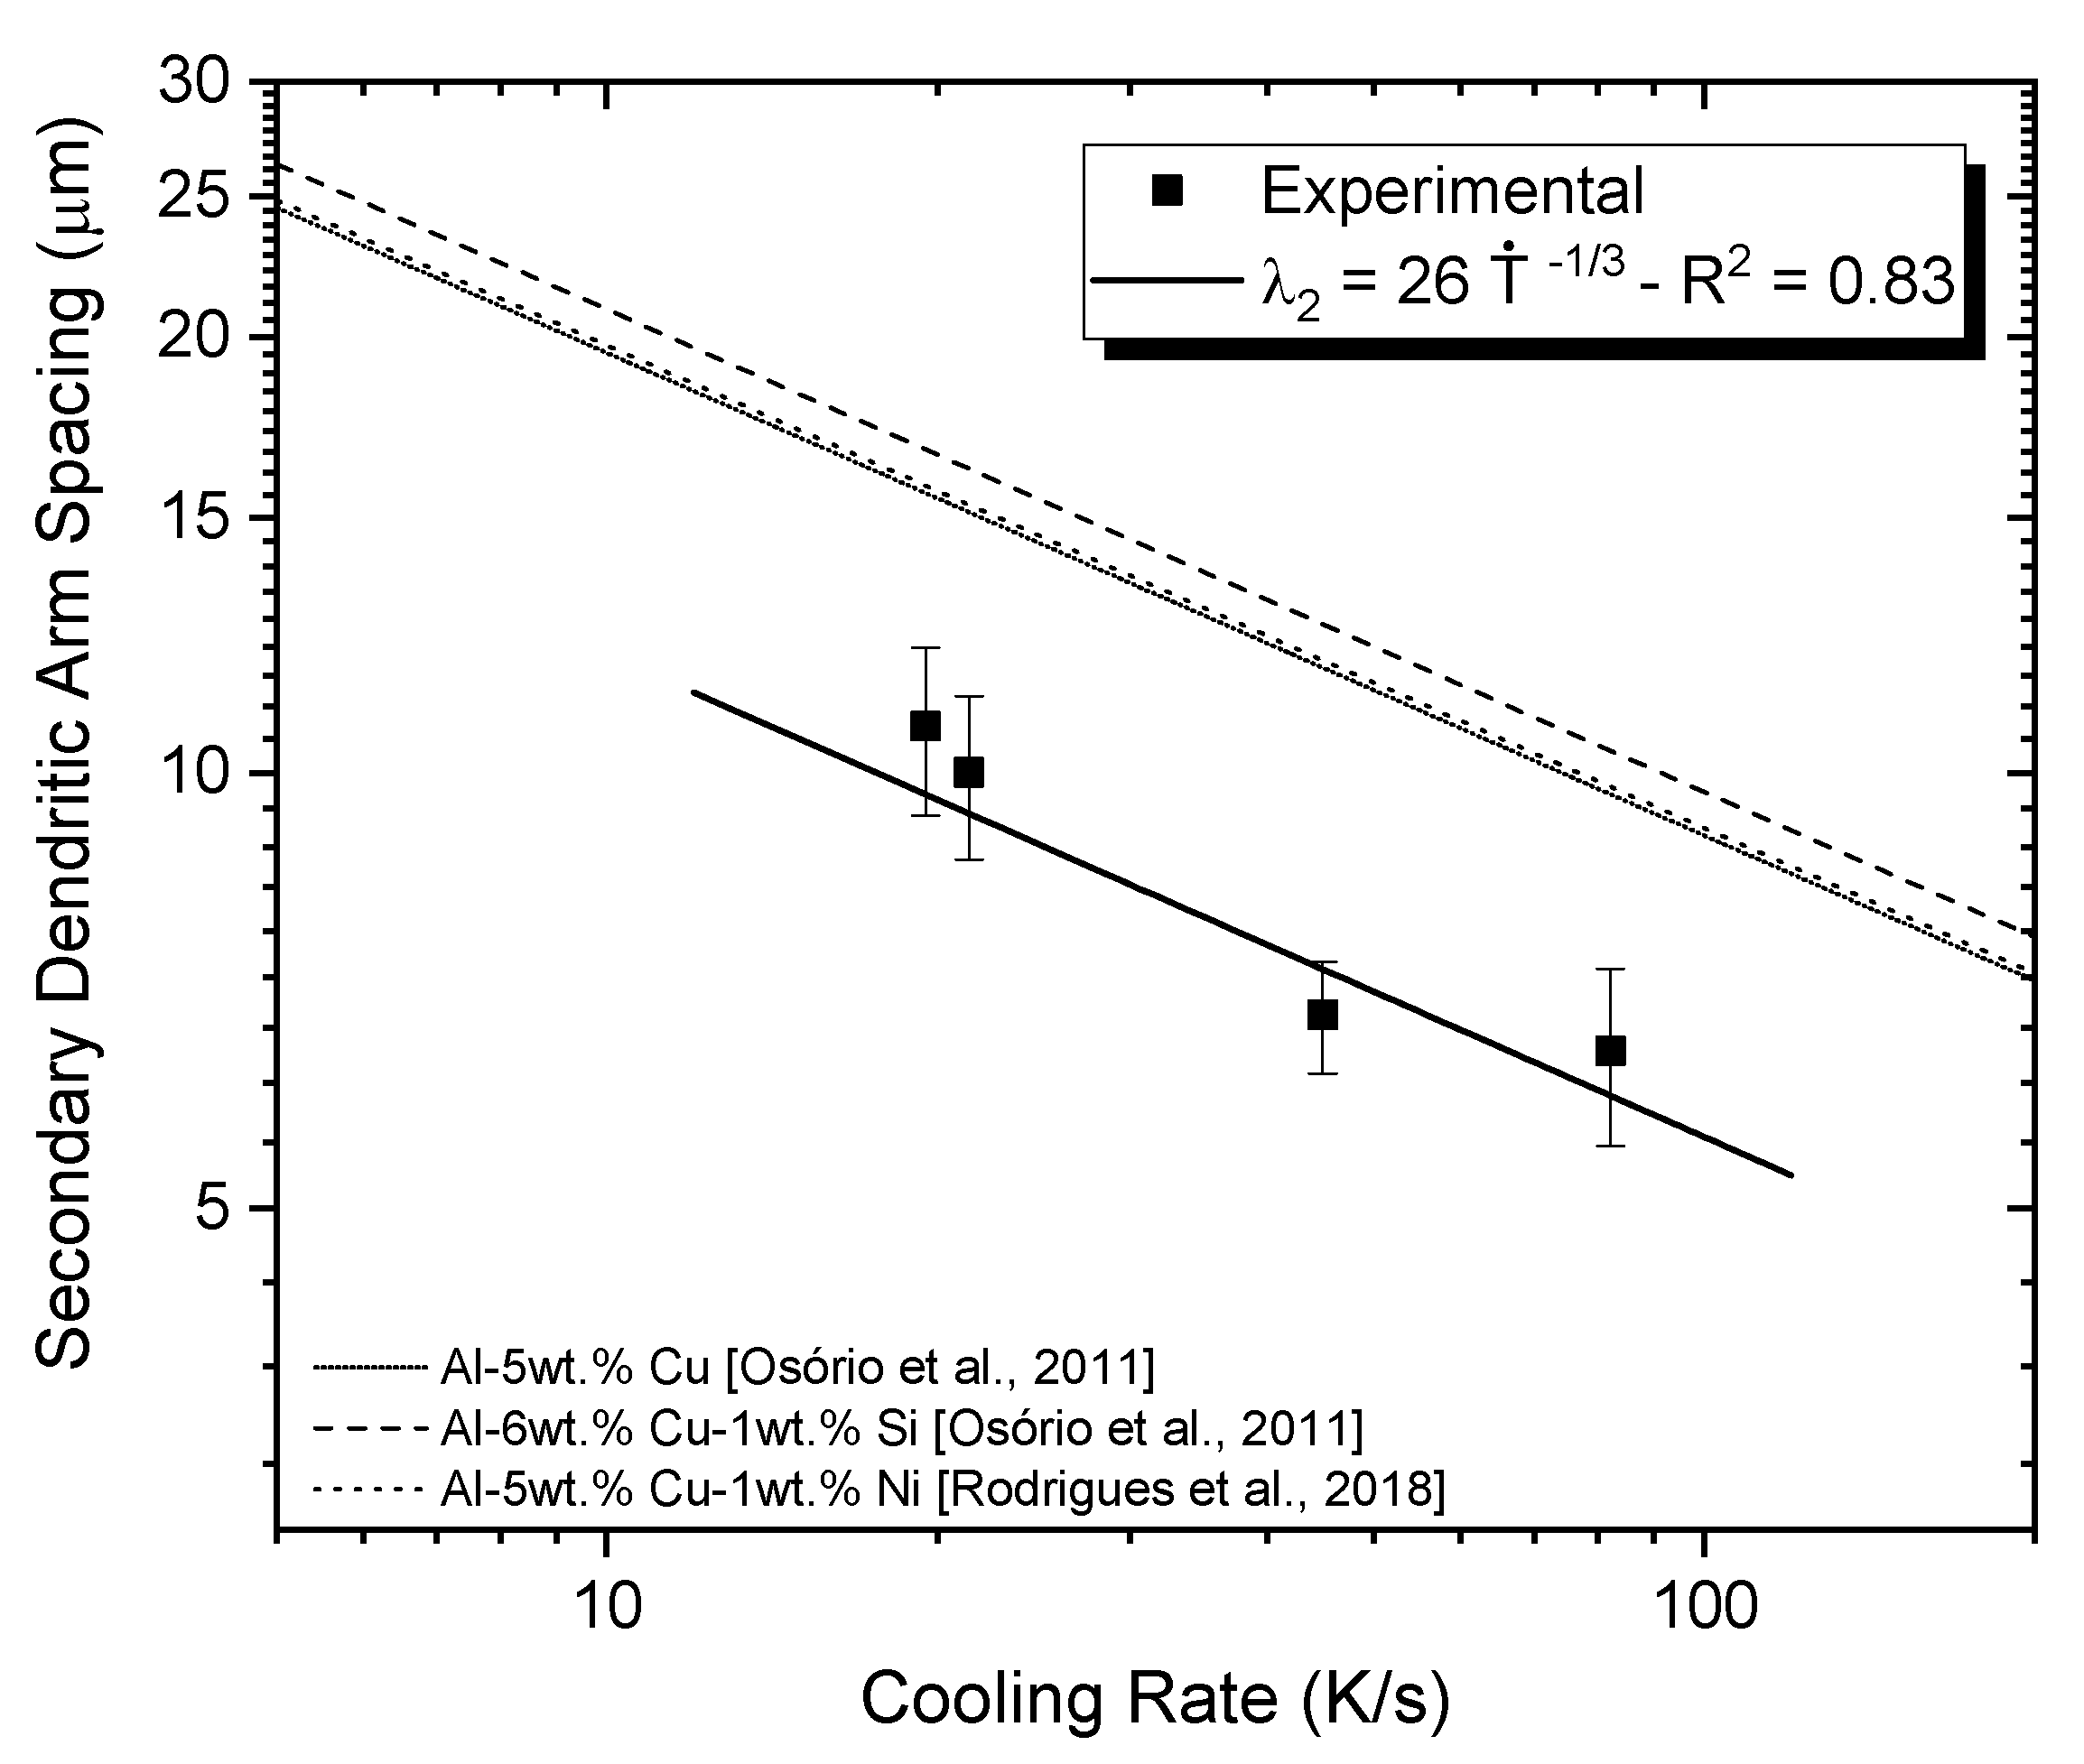
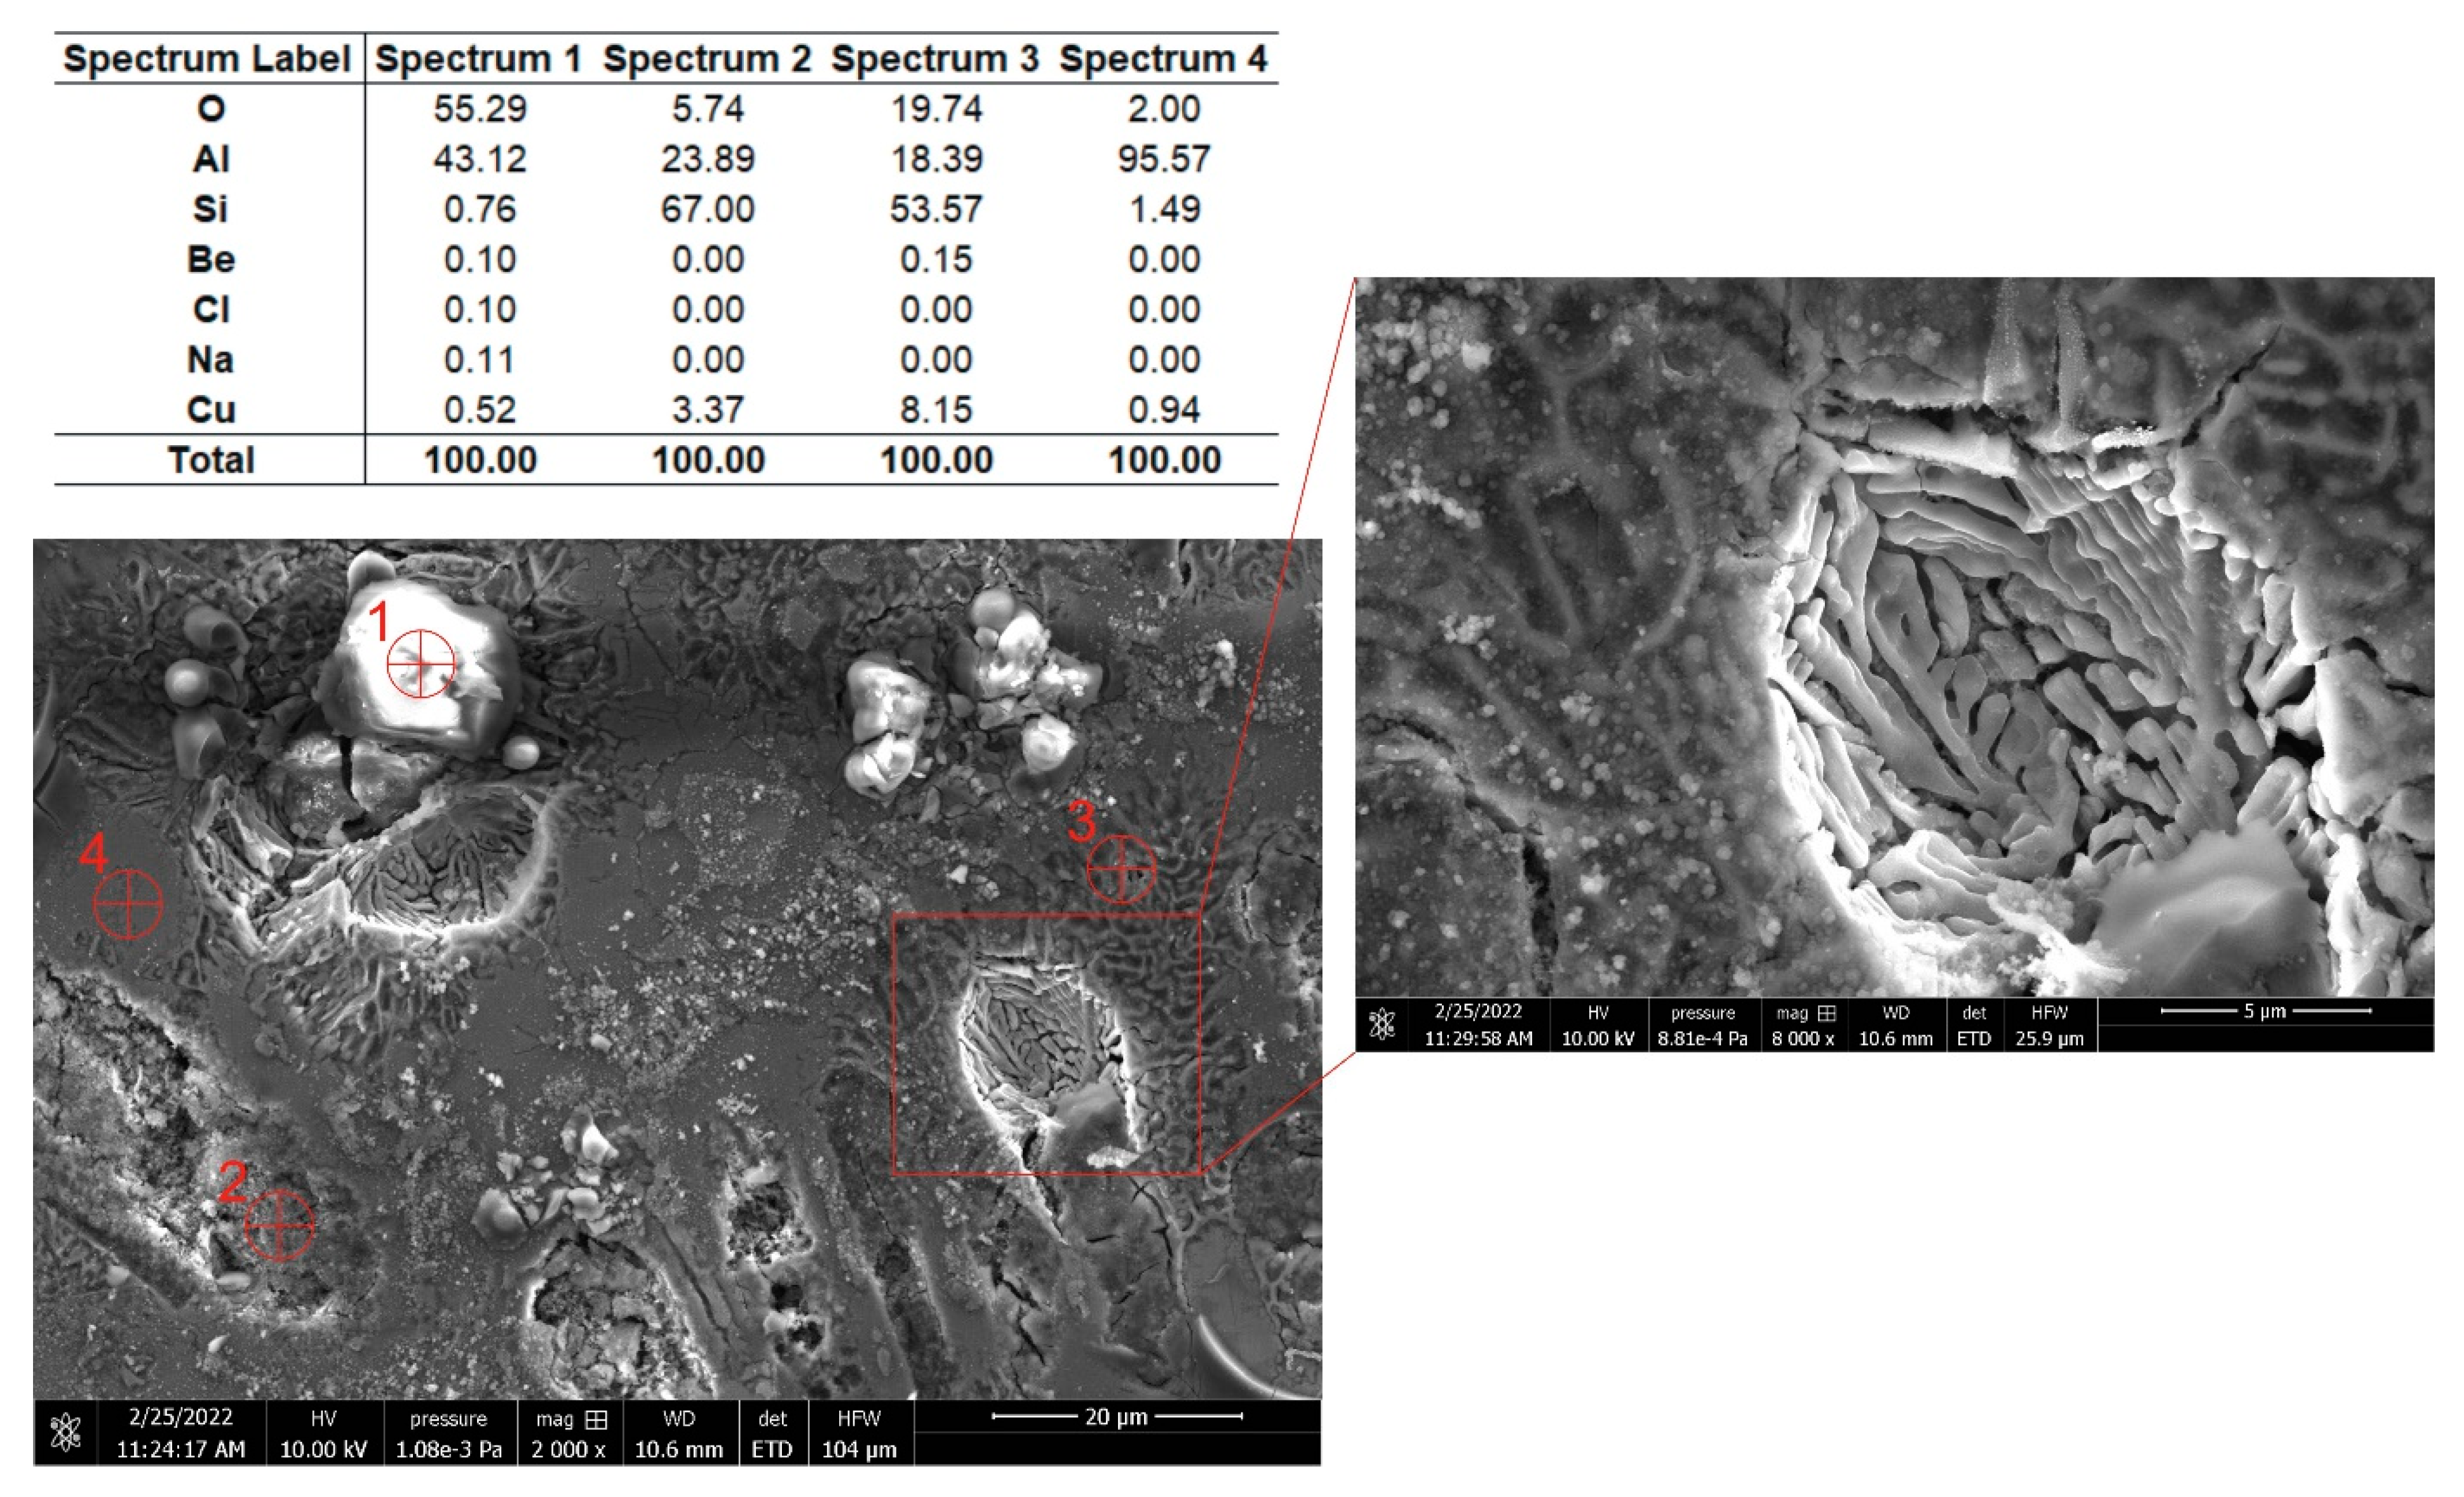
3.1. Microstructural Characterization

Thermodynamic simulations, depicted in Figure 2, show that for an Al alloy, the addition of even small amounts of Be above a certain threshold leads to a significant shift in equilibrium in the pseudo-binary phase equilibrium diagram. Specifically, Figure 2a indicates that the solidification path decomposes the primary phase (likely α-Al) into a multiphase microstructure. Figure 2b illustrates the evolution of phase fractions during solidification and cooling down to 25 °C. By combining both diagrams, the solidification path can be described along the dashed line. At point *1, only the liquid phase is present. Upon cooling and reaching the liquidus temperature at point *2, T = 610 °C, primary formation of the α-Al phase (FCC_A1) occurs. At point *3, T = 606 °C, the primary formation of the Be-rich phase (HCP_A3) also takes place. As cooling continues, at point *4, T = 624 °C, the eutectic reaction occurs, and all the remaining liquid transforms into a eutectic mixture (α-Al + Si + θ-Al2Cu). Finally, at point *5, T = 150 °C, the microstructure consists of α-Al + α-Be + eutectic, which remains stable down to room temperature. This is attributed to the strong tendency of Be to segregate in a hexagonal compact structure, also causing the segregation of Si into a diamond cubic structure (DSC) with a matrix of Al.
Figure 2 presents the predicted phase formation for a system under thermodynamic equilibrium, corresponding to cooling rates lower than 10−5 K/s [36]. Under such conditions, the solidification kinetics combined with a low thermal gradient ahead of the solid/liquid interface allow sufficient time for the formation of primary phases with low volume fractions. As shown in Figure 2b, the volume fraction of the Be-rich phase remains below 1%. However, under unsteady-state conditions during transient solidification, cooling rates exceeding 10 K/s are sufficient to suppress the formation of Be-rich phases. In this regime, beryllium was separated and remained confined in the eutectic region, forming a metastable solid solution instead of precipitating into a distinct Be-rich intermetallic phase. As observed by Silva et al. (2019) for Al-Si-Mg alloys [31], the primary formation of the Mg2Si phase was suppressed, and higher amounts of Mg and Si were retained in the solid solution.
The XRD pattern in Figure 3 confirms the presence of four distinct phases: α-Al, θ-Al2Cu, Si, and Fe-rich intermetallic compounds, including β-AlFeSi and a complex quaternary phase identified as i-Al55Si7Cu25.5Fe12.5 [37]. The α-Al phase forms the primary dendritic matrix, while a heterogeneous eutectic mixture characterizes the interdendritic regions. Notably, no Be-containing intermetallic phases were detected by XRD, and the EDS mapping corroborates that beryllium is uniformly distributed within the matrix and eutectic areas, creating a metastable solid solution rather than separate Be-rich intermetallic phases. Localized Cu enrichment within the eutectic areas is evident, consistent with the formation of the θ-Al2Cu phase, which exhibits a predominantly acicular morphology. This observation aligns with previously reported results in Al-Cu-based alloys and highlights the complex phase interactions promoted by the simultaneous presence of Cu, Si, Fe, and trace Be [20]. Studies investigating minor additions of Be (<0.5 wt.%) in Al-33wt.%Cu [12] and A356 [18] alloys also reported no detection of Be-containing phases by XRD analysis, indicating its incorporation likely occurs in solid solution or as undetectable metastable phases.
Figure 4 provides a comprehensive microstructural and compositional analysis of the Al-5wt.%Cu-1wt.%Si-0.5wt.%Be alloy solidified at a cooling rate of 21.4 K/s (sample A3). In Figure 4a, a backscattered electron (BSE) SEM image highlights the typical dendritic structure with a continuous α-Al matrix and the presence of eutectic Si and intermetallic compounds [38]. Notably, θ-Al2Cu phases are identified with a bright contrast and acicular morphology, while Fe-rich intermetallics appear as elongated, branched structures. Figure 4b presents localized SEM/EDS point analyses at selected sites, confirming the chemical composition of the distinct phases. Spectrum 1, located in the matrix, is dominated by aluminum (>98%), whereas spectra 2 to 4 reveal increasing Cu and Si contents, with detectable amounts of Be in spectra 2–4 (up to 0.73 wt.%), indicating Be distribution among intermetallic phases of the eutectic [17]. Figure 4c shows EDS elemental mapping, further clarifying the spatial distribution of Al, Cu, Si, and Be.
Cu-rich phases are concentrated in the θ-Al2Cu particles, Si maps highlight the eutectic Si network, and Be appears uniformly distributed in the interdendritic regions, suggesting Be segregation and potential participation in intermetallic phase formation [12,17,18,20]. This multi-technique approach provides insight into the role of Be in modifying phase morphology and distribution.
Based on its partial refinement effect on eutectic Si and its interaction with Fe-rich intermetallics, it is hypothesized that beryllium may exhibit a similar modifying role to that of strontium (Sr) [19,39,40,41], promoting the morphological transformation of eutectic silicon from a coarse plate-like structure to the more refined, rounded, or fibrous structure seen in Figure 4a. Camargo et al. [18] demonstrated that the addition of trace amounts of beryllium (~0.07 wt.%) to the A356 alloy promoted significant microstructural refinement, reducing both secondary dendrite arm spacing and Fe-rich intermetallic size.
As detailed in the Materials and Methods section, in this research study with an Al-5wt.%Cu-1wt.%Si-0.5wt.%Be alloy, brass cylindrical molds of varying diameters (10, 15, 25, and 40 mm) were used to induce different solidification cooling rates ( T ˙ ). The smallest diameter facilitated cooling rates of over 80 K/s. Microstructural analysis revealed the presence of an α-Al matrix with a predominantly dendritic morphology, as shown in Figure 5. To comprehensively characterize the solidification process, the secondary dendritic arm spacing (λ2) was carefully measured and subjected to parametric analysis. A strong correlation was established between λ2 and T ˙ values. By applying linear regression to the experimental data, a discernible growth law was derived, indicating a more refined growth pattern than that of other alloys in the Al-Cu system [9,11,42]. These empirical insights contribute to a deeper understanding of the influence of cooling rates on the microstructure of brass ingots and provide valuable insights into the growth behavior of the specific Al-Cu alloy system under investigation.
The final morphology of the microstructure indicated some solidification characteristics, such as secondary dendritic arm spacing (λ2). An experimental growth law of the type λ 2 = 26   T ˙ 1 / 3 is proposed to describe the λ2 evolution as a function of the cooling rate, as shown in Figure 6. The quality regression was standardized by a coefficient of determination, R2 = 0.83. The high R2 value shown in Figure 6 reinforces the reliability of the proposed experimental growth law, demonstrating that the model effectively represents the relationship between dendritic spacing and cooling rate under the solidification conditions evaluated. Solidification in a cylindrical mold promotes two-dimensional heat extraction. However, it can be assumed that unidirectional heat flow conditions are established in regions close to the mold wall. This hypothesis can be supported by the established growth law, since the use of the exponent −1/3 in this equation suggests that the growth pattern is that of a system with unidirectional solidification [11,31,43]. This same exponent has been used to correlate λ2 with T ˙ in binary and ternary Al-Cu alloys [9,11,42]. The curves that represent the secondary dendritic growth for Al-5wt.%Cu [11], Al-5wt.%Cu-1wt.%Ni [9], and Al-6wt.%Cu-1wt.%Si [42] alloys are shown in Figure 6 for comparison purposes.
As shown in Figure 5, adding Be resulted in a refinement of the secondary dendritic arm spacing. Due to solute segregation, this refinement may be attributed to the increased solute accumulation at the solid/liquid (S/L) interface. During solidification under unsteady-state conditions, the cooling rate influences solute diffusion, affecting solute redistribution ahead of the S/L interface and causing varying degrees of solute segregation. In the analyzed alloy, the amount of Cu in the solid solution was lower than that observed in other ternary alloys of the Al-Cu system [9,42]. This difference seems to have allowed for greater segregation of Cu into the liquid, which, combined with the Si and Be (having no solubility in α-Al), contributed to the refinement of the microstructure.
The final microstructure consisted primarily of α-Al dendrites and a eutectic mixture containing θ-Al2Cu and Si. Morphological analysis showed that Fe-rich phases exhibit a rounded Chinese script-like structure [3,4,44], in contrast to the acicular morphologies typically associated with crack initiation and reduced ductility. This refinement is attributed to Be-induced modifications in the nucleation and growth dynamics of the eutectic phases. Additionally, the reduction in secondary dendritic arm spacing (λ2 = 10.0 µm) reflects the influence of Be on the thermal gradient and solute accumulation at the solid/liquid interface, consistent with a directional solidification growth law (λ2 T ˙ −1/3). This refined microstructure is a key factor contributing to the improved mechanical properties of the alloy.

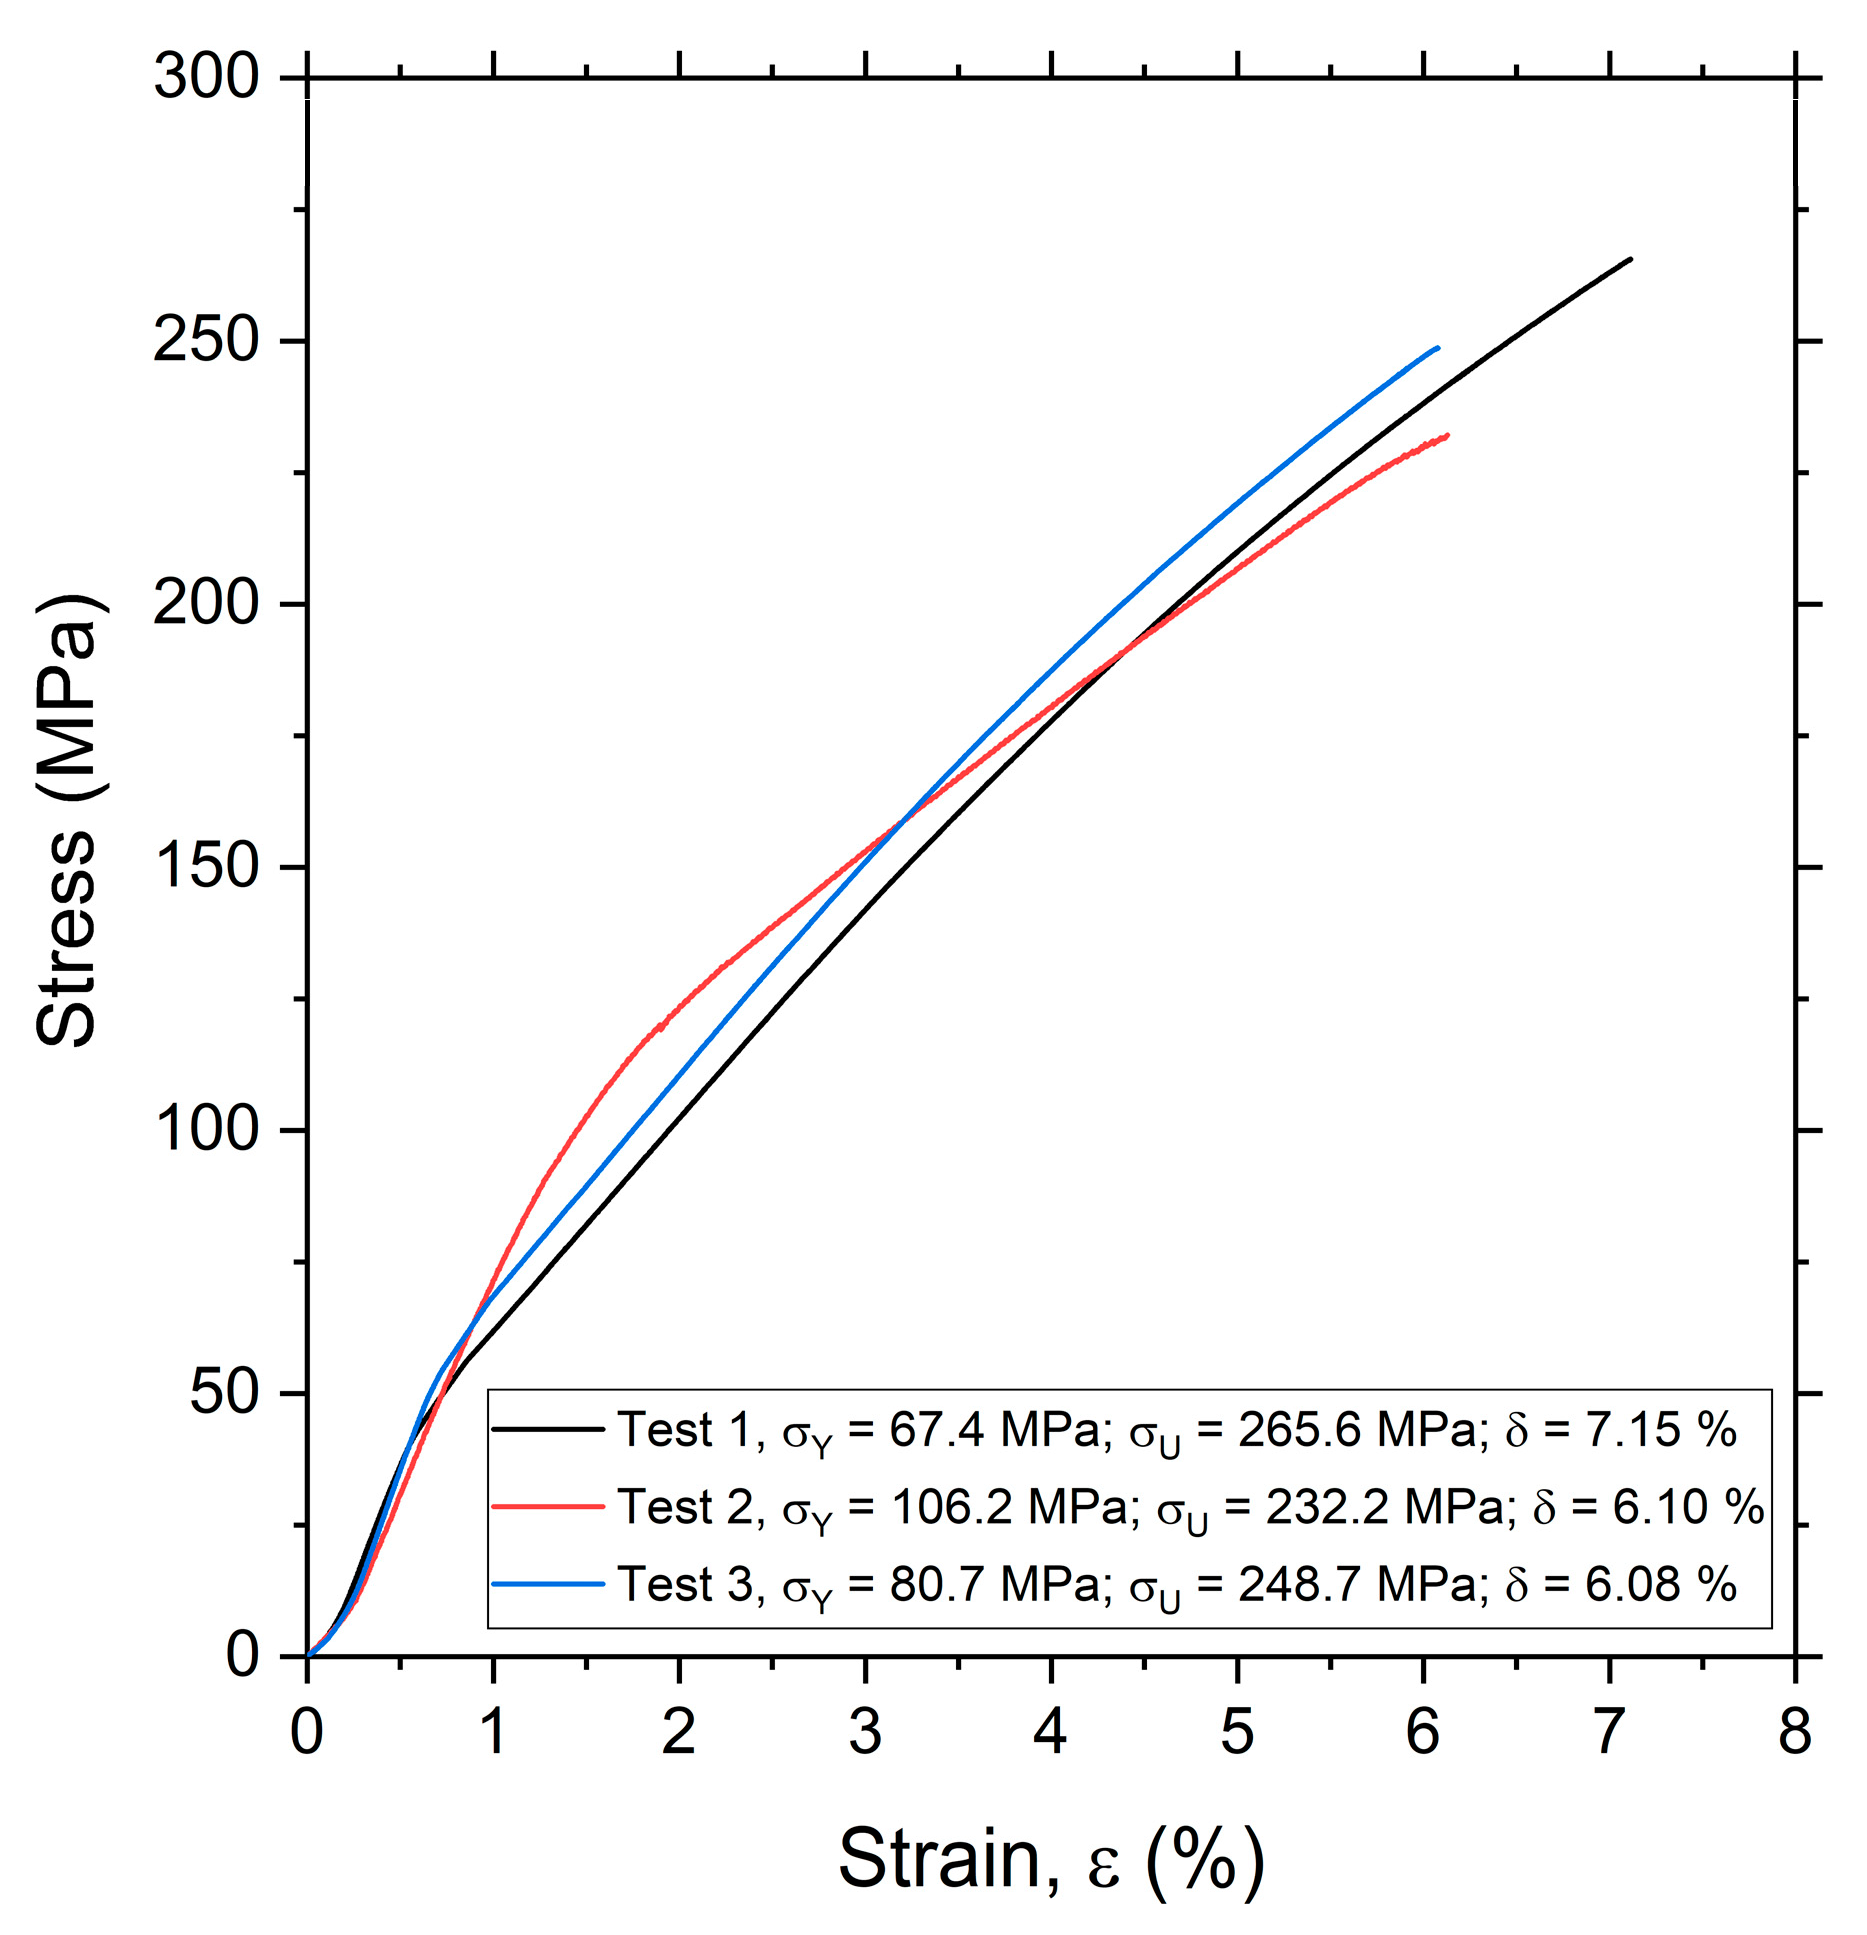
3.2. Tensile Test and Mechanical Behavior

The tensile tests were performed on samples solidified under conditions equivalent to those of sample A3, corresponding to a cooling rate of 21.4 K/s. The test results presented in Figure 7 for the Al-5wt.%Cu-1wt.%Si-0.5wt.%Be alloy show a yield strength (σY) of approximately 84.8 ± 14.3 MPa, ultimate tensile strengths (σU) of approximately 248.8 ± 11.2 MPa, and total elongations to break (δ) of approximately 6.4 ± 0.5%. These values indicate a well-balanced mechanical performance, combining strength and ductility. The consistent behavior among samples highlights the reproducibility of the processing conditions and suggests a homogeneous microstructure, likely promoted by the influence of beryllium during solidification.
The enhanced strength can be attributed to the combined action of two mechanisms: solid solution strengthening due to the Be incorporation into the α-Al matrix under high cooling rates, and the morphological modification of eutectic phases. As shown in Figure 3, the Fe-rich phases exhibit a Chinese script-like morphology instead of the sharp or acicular forms typically observed in conventional Al-Cu-Si alloys. These angular morphologies are well known for acting as stress concentrators, promoting crack initiation and reducing ductility. The more rounded and interconnected morphology reduces local stress concentrations, thus enhancing mechanical integrity. Although this effect is well documented for Fe-rich phases in Al-Si alloys [3,4], the present results suggest that Be may induce a similar transformation in Si-rich eutectic phases, potentially by altering nucleation and growth dynamics during solidification. These microstructural effects consistently explain the superior mechanical performance of the Be-modified alloy.
The comparison with the Al-5wt.%Cu-1wt.%Ni alloy reported by Rodrigues et al. (2018) [9] highlights the superior mechanical performance of the Al-5wt.%Cu-1wt.%Si-0.5wt.%Be alloy, particularly in terms of σU. As noticed, the Al-5wt.%Cu-1wt.%Ni alloy [9] exhibited σU values ranging from 100 MPa to 200 MPa, even under directional solidification conditions with primary dendritic spacings (λ2) between 8 μm and 45 μm. In contrast, the Be-containing alloy, solidified at a cooling rate of 21.4 K/s, achieved a median σU value of approximately 248.8 ± 11.2 MPa, with measured λ2 values between 7.5 μm and 14 μm, reflecting a significantly more refined microstructure [25].
Although the Al-Cu-Ni alloy exhibited markedly higher elongation, ranging from 2.5% to 25% [9] depending on the microstructural refinement, this gain in ductility came at the expense of tensile strength, which remained lower than that of the Be-containing alloy. The addition of beryllium simultaneously promoted microstructural refinement and modification of the eutectic phase morphology, notably transforming Fe-rich phases from angular shapes into Chinese script-like structures. This morphology reduces local stress concentrations and enhances the structural integrity of the material.
Table 3 presents a comparative analysis of the mechanical behavior and solidification parameters of various Al-Cu-based alloys. The Al-5Cu-1Si-0.5Be alloy developed in this study exhibited the highest cooling rate (21.4 K/s), resulting in a refined dendritic structure (λ2 = 10.0 ± 2.8 µm). This microstructural refinement contributed to an ultimate tensile strength (σU = 248.8 ± 11.2 MPa) higher than the binary Al-5Cu alloy (225 MPa) [11] and Al-5Cu-1Ni (190 MPa) [9]. Although its yield strength (σY = 84.8 ± 14.3 MPa) is lower than that of Mg- and Li-containing alloys [45], it remains adequate considering the alloy’s composition and solidification conditions. The elongation to failure (δ = 6.4 ± 0.5%) confirms a favorable ductility level comparable to Al-5Cu-2.5Si-1.1Mg (7.72%) [46] and superior to that of the unmodified binary alloy. These results demonstrate that the combined addition of Si and Be under high cooling rates effectively enhances the tensile performance of Al-Cu alloys without compromising ductility. The alloy’s competitive strength–ductility balance supports the hypothesis that Be acts as a synergistic modifier in Al-Cu-Si systems, contributing to both microstructural refinement and mechanical property optimization.

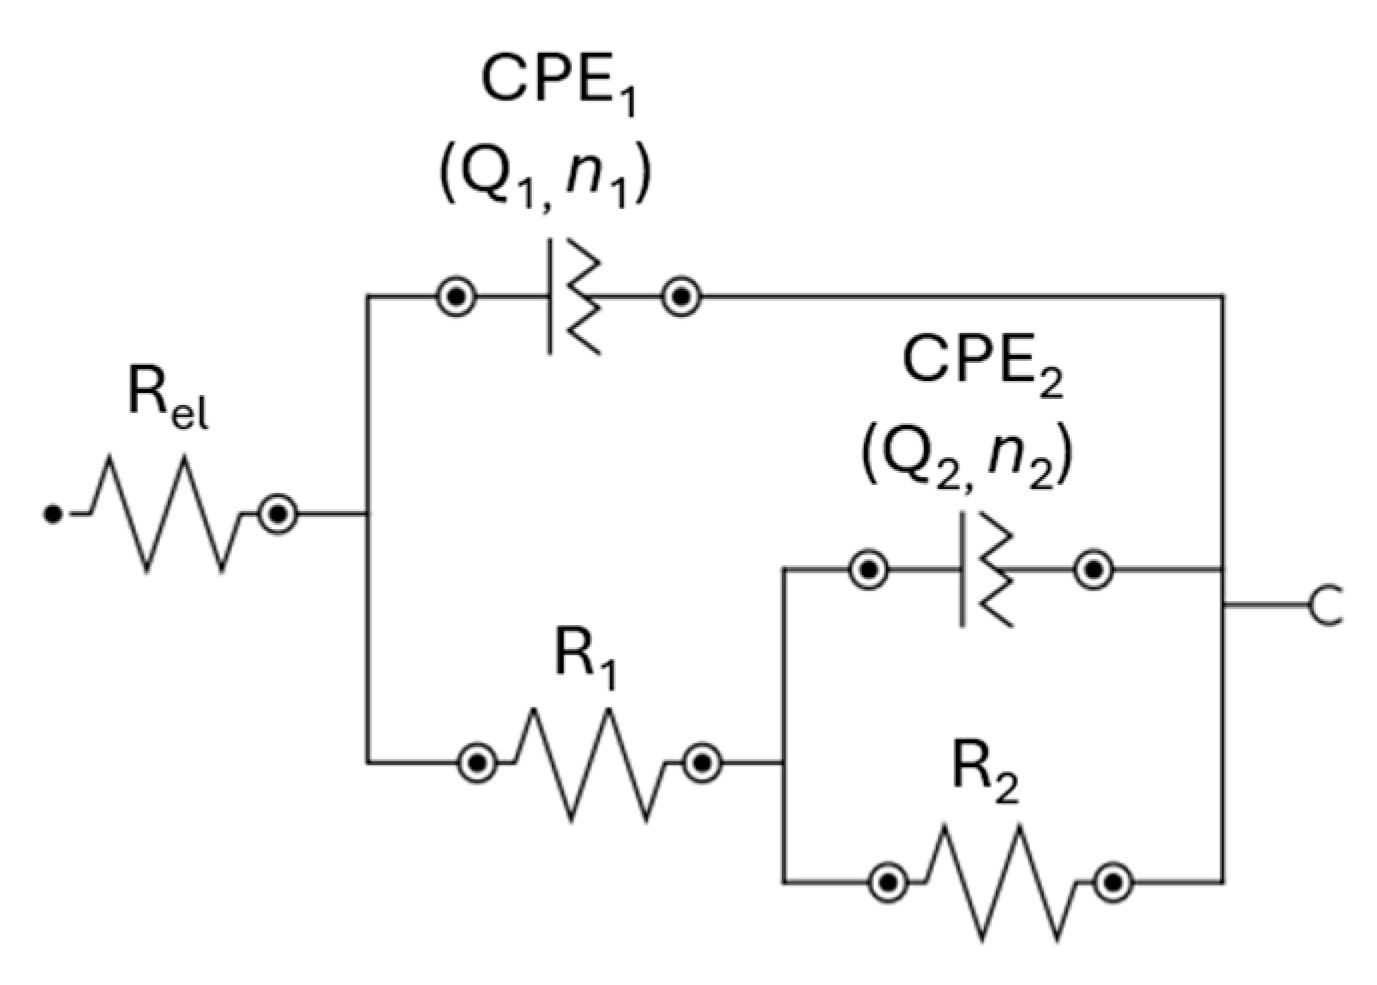
3.3. EIS and Equivalent Circuit Measurements

The EIS and LSV tests performed on the analyzed samples utilized a milder chloride solution. This approach was adopted to enhance our understanding of the initial stages of the corrosive process. The experimental EIS plots for the as-cast ternary Al-5wt.%Cu-1wt.%Si-0.5wt.%Be alloy are shown in Figure 8. The Nyquist plots, Figure 8a, confirmed the presence of two depressed capacitive loops, as also previously reported for other aluminum multicomponent alloys [47]. Two peaks occurred in the phase angle plots, i.e., (1) θ = 70° and 28 Hz, and (2) θ = 35° and 0.2 Hz, as can be seen in Figure 8b. Two distinct regions are suggested in the Bode plots (|Z| vs. frequency): (1) In the high-frequency region (between 103 and 105 Hz), |Z| is constant (of approximately 85 Ω) and associated with a phase angle (θ) close to 0°. This indicates that the electrolyte resistance dominates the impedance. (2) For low and intermediate frequencies, the Bode magnitude displayed a linear slope of approximately −1, which indicates a capacitive behavior [47].
The fitted equivalent circuit (EC) adopted here is illustrated in Figure 9 [47,48,49], while the fitted parameters are provided in Table 4. EC curve fitting analyses were performed for all alloy EIS data. The experimental findings correspond well with the estimated values, and the error chi-square (χ2) values are within an acceptable order of 10−2. The quality of the experimental/simulated fit has been characterized by the χ2 value. The sums of squares (provided by the NOVA software) for each sample examined are also shown in Table 4. The small values of the chi-square statistic and fitting errors indicate the correctness and suitability of the EC model [48,49,50]. The EC was composed of Rel (solution resistance), R1 (surface layer resistance), and R2 (charge transfer resistance), as well as constant phase elements (CPE) of the surface layer (CPE1) and double layer (CPE2), with CPE being characterized by its Q and n parameters.
The equivalent circuit model employed in this work, composed of two constant phase elements (CPE1 and CPE2) in parallel with resistive elements (R1 and R2) in series with the solution resistance (Rel), was selected to accurately capture the complex electrochemical behavior observed in the EIS spectra of the Al-5wt.%Cu-1wt.%Si-0.5wt.%Be alloy. The presence of two distinct depressed semicircles in the Nyquist plot, along with two separated phase angle peaks in the Bode phase diagram, indicates the existence of at least two time constants associated with different interfacial processes. In this context, CPE1‖R1 represents the response of the surface film, while CPE2‖R2 accounts for the charge transfer process at the alloy/electrolyte interface. The use of CPEs instead of ideal capacitors is justified by the observed non-ideal capacitive behavior, which is commonly attributed to surface heterogeneities, distributed reactivity, and roughness inherent to as-cast multicomponent aluminum alloys. The excellent agreement between the experimental data and the fitted model, reflected in the low chi-square values, confirms the suitability of the proposed circuit to describe the electrochemical impedance response of the alloy in the studied NaCl solution.
As shown in Table 4, the R1 value was approximately 5.94 kΩ·cm2 for the as-cast sample. This value is close to that observed for the Al-6wt.%Cu-1wt.%Si [42] alloy and lower than that of the Al-5wt.%Cu [11] alloy (R1 equals 5.65 kΩ·cm2 and 6.62 kΩ·cm2, respectively). This indicates that adding Be did not deleteriously change the corrosion resistance and instead promoted a slight improvement compared to the binary alloy.
During dendritic growth in steady-state conditions, solute elements such as Cu, Si, and Be may segregate preferentially along the dendrite arms or in the interdendritic regions. This segregation can affect the overall corrosion resistance of the alloy, as the composition of the corroding regions differs from the bulk alloy composition. The levels of cooling rates obtained during the solidification of the Al-5wt.%Cu-1wt.%Si-0.5wt.%Be alloy contributed to the formation of a Cu supersaturated solid solution (SS) in the dendritic matrix of α-Al [8] with approximately 1.35wt.% Cu, as seen in Figure 4. Through the application of energy dispersive spectroscopy (EDS), we were able to identify the presence of secondary phases characterized by silicon and Cu-rich compositions. Figure 4b shows the details of the distribution of solute elements in each phase and presents the composition values obtained by EDS. The presence of dendrites introduces heterogeneities in the alloy microstructure. Regions with different compositions and crystal structures can exhibit varying susceptibility to corrosion. Some areas might be more susceptible to corrosion attack than others, leading to non-uniform corrosion patterns.

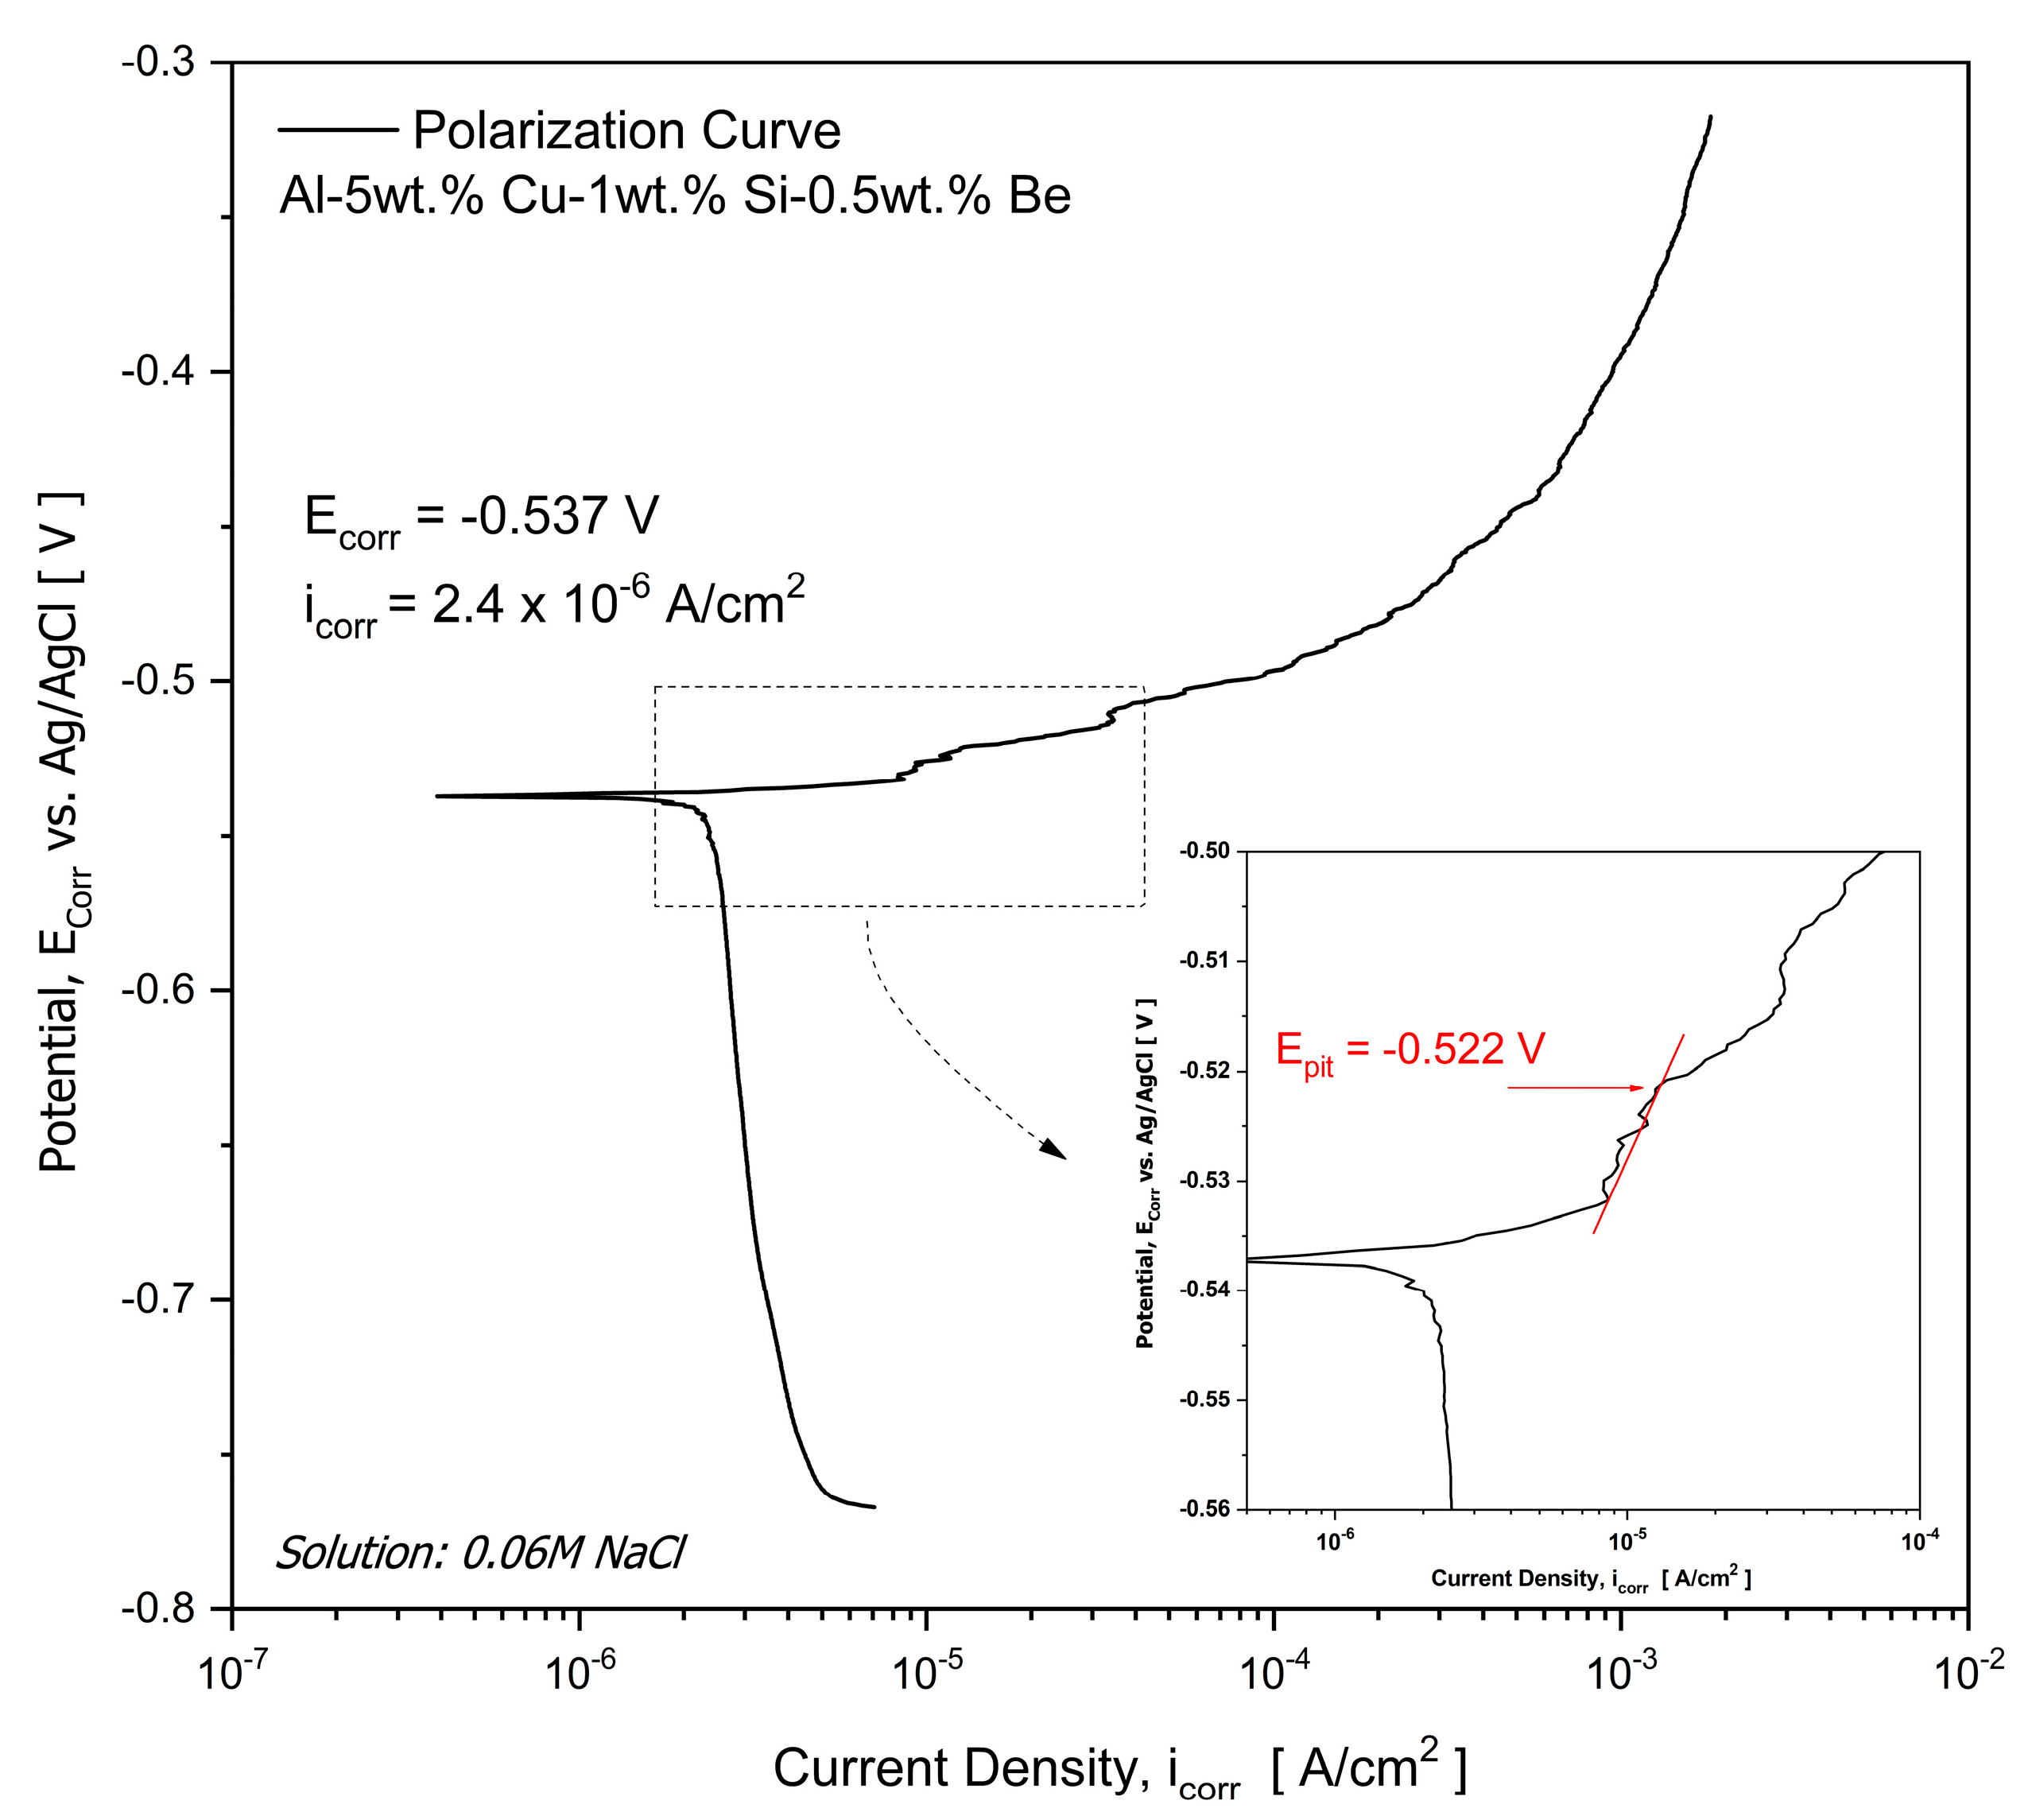
3.4. Potentiodynamic Polarization Measurements

Figure 10 shows the experimental linear polarization profile of Al-5wt.%Cu-1wt.%Si-0.5wt.%Be alloy sample A3 solidified at a cooling rate of approximately 21.4 K/s. The polarization profiles allowed the values of corrosion current densities (icorr) and corrosion potentials (Ecorr) in a solution of 0.06 mol/L NaCl at room temperature, 25 °C, to be determined by extrapolation from Tafel’s plots, considering both the anodic and cathodic branches of the polarization curves. The Ecorr was approximately −0.537 V (vs. Ag/AgCl), and icorr was approximately 2.4 × 10⁻⁶ A/cm2. The polarization profiles were obtained by applying a small potential perturbation to the sample and measuring the current change. The values of Ecorr and icorr can be used to assess the corrosion resistance of an alloy. A comparison of this value can be made with previous studies from the literature [9,11], in which electrochemical tests and analyses of microstructural parameters of Al-Cu alloys were also conducted. The Ecorr value of the Al-5wt.%Cu-1wt.%Si-0.5wt.%Be alloy is relatively low, indicating it is a relatively corrosion-resistant alloy. The icorr value is also relatively low, indicating that the corrosion rate is also relatively low.
The pitting potential (Epit) corresponds to the critical anodic potential at which the passive film that protects the alloy surface breaks down, initiating localized corrosion by pitting. In aluminium-based alloys, this value marks the transition between the passive region and the onset of rapid anodic dissolution. For the Al-5wt.%Cu-1wt.%Si-0.5wt.%Be alloy, the polarization curve presented reveals an Epit of −0.522 V vs. Ag/AgCl. Although a brief plateau in the anodic branch is visible, indicating an incipient passivation, the absence of a well-defined passive region suggests that no stable protective film was formed under the tested conditions. The sharp increase in current density shortly after Epit confirms that the passive layer, if formed, was not sustained, resulting in a behavior typical of alloys with poor passivation capability. This electrochemical response indicates that, in a 0.06 mol/L NaCl solution, the addition of Be to the Al-Cu-Si base alloy did not promote stable passivation. Consequently, the material becomes highly susceptible to pitting, especially in chloride-containing environments. Despite the measured Epit being similar to values observed in other Al-Cu systems [9], the lack of a passive plateau highlights the influence of microstructural features and intermetallic distribution on the electrochemical stability of the alloy. These findings are relevant for assessing the applicability of this alloy in service conditions that demand enhanced corrosion resistance. The EIS results (see Figure 8) agree with those from potentiodynamic polarization (see Figure 10), where the corrosion rate demonstrates that adding Be minimizes corrosion in a 0.06 M NaCl solution.
The corrosion rate (CRy) [51] is a significant parameter employed to assess the corrosion behavior of metallic alloys. This metric facilitates the transformation of corrosion rates obtained through electrochemical techniques into current density units (μA/cm2) corresponding to penetration depth per unit time (μm/year). The CRy values can be determined following the guidelines outlined in the ASTM G102−89 Standard [51]. The calculation process involves the utilization of specific equations, enabling researchers to effectively quantify the rate of corrosion for the given metallic alloy under investigation as follows:
C R y = K 1 i c o r r ρ W E
W E = 1 n i f i W i
where CRy is the corrosion rate (μm/year), K1 = 3.27 × 10⁻³ mmꞏg/(μAꞏcmꞏyear), icorr is the corrosion current density (μA/cm2), and ρ is the density of the alloy (g/cm3); WE is the alloy equivalent mass, ni is the valence of the ith element of the alloy, fi is the mass fraction of the ith component of the alloy, and Wi is the atomic mass of the ith element of the alloy. Based on data extracted from the www.matweb.com database, an average density value of 2.7 g/cm3 was considered for all alloy compositions.
Table 5 summarizes the cooling rate, dendritic spacing, and electrochemical corrosion parameters of different Al-Cu-based alloys, highlighting the influence of alloying elements on corrosion resistance. The Al–5wt.%Cu–1wt.%Ni alloy [9] exhibited the best corrosion resistance among the evaluated systems, with the lowest corrosion rate (CRy = 1.7 μm·year−1) and the most noble corrosion potential (Ecorr = −0.525 V). This behavior is likely associated with the absence of silicon in its composition, which tends to exacerbate galvanic effects when present in the eutectic phase. In comparison, the Al–5wt.%Cu–1wt.%Si–0.5wt.%Be alloy demonstrated a CRy of 28.9 μm·year−1, which, although higher than that of the Ni-containing alloy, is significantly lower than the values observed for the Al–5wt.%Cu binary alloy [11] (CRy = 46.9 μm·year−1) and the Al–6wt.%Cu–1wt.%Si alloy [42] (CRy = 47.2 μm·year−1). Li et al. [52] investigated the effect of the Cu/Li ratio on the corrosion behavior of Al–Cu–Li alloys. They reported that a decreasing Cu/Li ratio significantly worsens intergranular corrosion (IGC) resistance. The IGC depth increased from 41.8 µm to 89.3 µm, while the Ecorr shifted from –0.609 V to –0.662 V and the icorr rose from 2.52 × 10⁻⁵ A/cm2 to 4.03 × 10⁻⁵ A/cm2, indicating that alloys with lower Cu/Li ratios are more prone to corrosion due to increased intergranular attack.
These results indicate that the addition of beryllium improves the corrosion resistance of Al–Cu–Si alloys, likely by refining the microstructure and modifying the morphology of Si-containing intermetallics, which can reduce micro-galvanic coupling. While the Be-containing alloy does not surpass the corrosion resistance of the Ni-modified alloy, it provides a more favorable combination of properties, offering both superior mechanical strength and refined microstructure, with a corrosion rate markedly lower than that of the binary and Si-containing reference alloys. Thus, the Al–5wt.%Cu–1wt.%Si–0.5wt.%Be alloy represents a balanced and promising alternative for applications where moderate corrosion resistance must be paired with enhanced mechanical performance. Similar trends have been reported for Al–Mg–Li alloys, where low Be additions (~0.1 wt.%) improved intergranular corrosion resistance, while higher contents (>0.25 wt.%) led to deterioration due to deeper corrosion paths and microstructural instability [17].
The potentiodynamic polarization results (Figure 10) agree with those from the EIS (Figure 8), where the corrosion rate demonstrates that adding Be minimizes corrosion in a 0.06 M NaCl solution. When assessing the corrosion characteristics of as-cast hypoeutectic alloys, a comprehensive understanding of the electrochemical properties of the constituent phases forming the matrix and eutectic is paramount in determining the cathodic-to-anodic area (AC/AA) ratio. The AC/AA ratio plays a critical role in influencing the CRy, wherein an increase in the AC/AA ratio leads to a corresponding rise in the icorr, resulting in reduced corrosion resistance of the material [14]. Based on the nobility and corrosion rate of the alloying elements involved, the dendritic matrix should be less noble than the eutectic region. However, due to the supersaturated Cu content in the solid solution in the matrix, the α-Al matrix is also nobler. The presence of Cu in the α-Al matrix caused a modification in the AC/AA configuration within the microstructure of the Al-5wt.%Cu-1wt.%Si-0.5wt.%Be alloy.
Figure 11 reveals that pitting corrosion in the Al–5wt.%Cu–2wt.%Si–0.5wt.%Be alloy initiates preferentially in the eutectic Al–Si-rich regions, particularly in areas with high Si and low Cu content (Spectra 2 and 3). These zones exhibit significant compositional inhomogeneity, as evidenced by EDS data indicating an up to 67 wt.% Si and reduced levels of Cu, which suggests that these regions act as anodic sites relative to the surrounding Al matrix. The corrosion morphology, especially the cellular dissolution patterns magnified on the right, is consistent with localized galvanic coupling between the eutectic Si and the adjacent Al-rich phase.
The corrosion attack appears to propagate into areas depleted of Cu (as in Spectrum 1), indicating that the degradation is not random but follows microstructural features where electrochemical potential gradients are present. This mechanism closely resembles intergranular corrosion, wherein corrosion progresses along phase boundaries due to differences in electrochemical activity between the grain matrix and intermetallic-rich zones. The observation of localized dissolution aligned with eutectic features and secondary phases supports this interpretation. Moreover, the presence of traces of Be does not appear to contribute to corrosion initiation directly, reinforcing the role of microstructural and compositional segregation as the dominant factor driving pit nucleation and growth in this alloy [53].
Post-corrosion SEM and EDS analyses revealed that pitting initiated in eutectic regions rich in Si and depleted in Cu, as observed in the Al-6wt.%Cu-5wt.%Ni alloy [43]. These regions act as local anodes due to electrochemical potential differences relative to the α-Al matrix. The localized dissolution patterns observed are consistent with intergranular corrosion mechanisms driven by phase boundary segregation. Be was not detected in corroded regions as an active phase, confirming that its influence is microstructural rather than electrochemical. Overall, the Al–5wt.%Cu–1wt.%Si–0.5wt.%Be alloy demonstrates refined microstructure, competitive corrosion resistance, and enhanced mechanical strength, validating the effectiveness of Be as a microstructure-modifying element in Al–Cu–Si systems.

4. Conclusions

The radial solidification of the Al–5wt.%Cu–1wt.%Si–0.5wt.%Be alloy in a stepped brass ingot mold under unsteady-state thermal conditions revealed a clear inverse correlation between secondary dendritic arm spacing and the cooling rate, described by the empirical growth law λ2 = 26 T ˙ −1/3. This exponent confirms a dendritic growth regime governed by solute diffusion and interface kinetics under near-unidirectional heat flow. The addition of beryllium, combined with elevated cooling rates (up to 21.4 K/s), promoted significant microstructural refinement, with λ2 values ranging from 7.5 to 14 µm. Beyond reducing the dendritic scale, Be addition also altered the morphology of eutectic silicon from coarse, plate-like to more refined, fibrous structures and transformed Fe-rich intermetallics into shorter and more compact morphologies. These modifications are consistent with Be’s role as a microstructure-modifying element, influencing solute redistribution and promoting a more homogeneous solidification front.
Mechanical testing demonstrated that the refined microstructure led to improved tensile performance, showing a yield strength (σY) of approximately 84.8 ± 14.3 MPa, ultimate tensile strength (σU) of approximately 248.8 ± 11.2 MPa, and total elongations to break (δ) of approximately 6.4 ± 0.5%. These values exceed those reported for other Al-Cu-based alloys under similar conditions, highlighting the effectiveness of Be in enhancing mechanical behavior through solid solution strengthening and morphological modification of eutectic constituents.
Electrochemical evaluation, supported by EIS and potentiodynamic polarization measurements, indicated that the Be-containing alloy exhibited a corrosion rate of 28.9 µm·year−1, significantly lower than those of the binary Al–5wt.%Cu and ternary Al–6wt.%Cu–1wt.%Si alloys. The corrosion potential (Ecorr = –0.537 V), current density (icorr = 2.4 × 10⁻⁶ A/cm2), and pitting potential (Epit = –0.522 V) showed a corrosion rate of 28.9 µm·year−1, suggesting that no stable passive film was formed under the testing conditions (0.06 M NaCl). Instead, the enhanced corrosion behavior is attributed to microstructural refinement, particularly the modification of the Si-rich eutectic and a more uniform distribution of the intermetallics, which mitigates localized galvanic coupling. Although the corrosion resistance did not surpass that of the Ni-containing alloy, the Be-modified alloy offered a more favorable trade-off between corrosion performance and mechanical strength.
The incorporation of 0.5 wt.% Be into the Al–5wt.%Cu–1wt.%Si system promotes a finer and more uniform microstructure, enhances tensile properties, and improves corrosion resistance relative to conventional Al–Cu and Al–Cu–Si alloys. These results confirm the viability of Be as a strategic alloying element in the development of Al-Cu-based alloys for structural applications that demand an optimized combination of mechanical and electrochemical performance.

Author Contributions

Conceptualization, J.R.S., M.P.A. and C.B.; methodology, J.R.S., M.P.A. and T.V.; software, F.F.C.; validation, J.R.S., M.P.A. and C.B.; formal analysis, J.R.S., M.P.A., T.V., F.F.C., N.C. and C.B.; investigation, J.R.S., M.P.A. and T.V.; resources, J.R.S., M.P.A. and C.B.; data curation, J.R.S. and C.B.; writing—original draft preparation, J.R.S., M.P.A., T.V., F.F.C., N.C. and C.B.; writing—review and editing, N.C., A.G. and C.B.; visualization, A.G. and C.B.; supervision, C.B.; project administration, J.R.S., M.P.A. and C.B.; funding acquisition, C.B. All authors have read and agreed to the published version of the manuscript.

Funding

This research was funded by FAPESP—São Paulo Research Foundation, Brazil (Grant: 2022/03633-3), CNPq-National Council for Scientific and Technological Development (Grant: 407871/2018-7), IEPe/PROPe call 05/2023, and the Master’s Scholarship granted by CAPES 001.

Data Availability Statement

The original contributions presented in the study are included in the article; further inquiries can be directed to the corresponding author.

Acknowledgments

The support from the Center for Research and Innovation in Materials and Structures (CEPIMATE) and the Structure, Manufacturing and Materials Research Group (GPEM2) is acknowledged.

Conflicts of Interest

The authors declare no conflicts of interest.

References

  1. Pan, Z.; Du, Y.; Huang, B.Y.; Liu, Y.; Wang, R.C. A Thermodynamic Description of the Al–Be System: Modeling and Experiment. Calphad 2004, 28, 371–378. [Google Scholar] [CrossRef]
  2. Molchanova, L.V.; Ilyushin, V.N. Alloying of Aluminum-Beryllium Alloys. Russ. Metall. (Met.) 2013, 2013, 71–73. [Google Scholar] [CrossRef]
  3. Yie, S.N.; Lee, S.L.; Lin, Y.H.; Lin, J.C. Mechanical Properties of Al-11% Si Casting Alloys Containing Trace Be and Sr. Mater. Trans. JIM 1999, 40, 294–300. [Google Scholar] [CrossRef]
  4. Wang, G.; Bian, X.; Zhang, J. Effect of Be on the Age-Hardening Characteristics of as-Cast Al-11Si-0.3Mg Alloy. Jinshu Xuebao/Acta Metall. Sin. 2003, 39, 43–46. [Google Scholar]
  5. Song, G.S.; Fleury, E.; Kim, S.H.; Kim, W.T.; Kim, D.H. Formation and Stability of Quasicrystalline and Hexagonal Approximant Phases in an Al-Mn-Be Alloy. J. Mater. Res. 2002, 17, 1671–1677. [Google Scholar] [CrossRef]
  6. Song, G.S.; Fleury, E.; Lee, S.M.; Kim, W.T.; Kim, D.H. Quasicrystal-Forming Ability of the Icosahedral Phase in Al-Cu-Fe-Be Alloys. Mater. Sci. Eng. A 2003, 346, 42–49. [Google Scholar] [CrossRef]
  7. Rooy, E.L.; van Linden, J.H.L. Properties and Selection: Nonferrous Alloys and Special-Purpose Materials. In ASM Metals Handbook; ASM International: Materials Park, OH, USA, 1990; Volume 2, pp. 3330–3345. [Google Scholar]
  8. Zolotorevsky, V.S.; Belov, N.A.; Glazoff, M.V. Casting Aluminum Alloys; Elsevier: Amsterdam, The Netherlands, 2007; Volume 51, ISBN 9788578110796. [Google Scholar]
  9. Rodrigues, A.V.; Lima, T.S.; Vida, T.A.; Brito, C.; Garcia, A.; Cheung, N. Microstructure and Tensile/Corrosion Properties Relationships of Directionally Solidified Al–Cu–Ni Alloys. Met. Mater. Int. 2018, 24, 1058–1076. [Google Scholar] [CrossRef]
  10. Brito, C.; Vida, T.; Freitas, E.; Cheung, N.; Spinelli, J.E.; Garcia, A. Cellular/Dendritic Arrays and Intermetallic Phases Affecting Corrosion and Mechanical Resistances of an Al-Mg-Si Alloy. J. Alloys Compd. 2016, 673, 220–230. [Google Scholar] [CrossRef]
  11. Osório, W.R.; Siqueira, C.A.; Santos, C.A.; Garcia, A. The Correlation between Electrochemical Corrosion Resistance and Mechanical Strength of As-Cast Al-Cu and Al-Si Alloys. Int. J. Electrochem. Sci. 2011, 6, 6275–6289. [Google Scholar] [CrossRef]
  12. Rodrigues, A.V.; Kakitani, R.; Silva, C.; Giovanetti, L.; Dias, M.; Henein, H.; Garcia, A.; Cheung, N. Influence of Minor Additions of Be on the Eutectic Modification of an Al-33wt.%Cu Alloy Solidified under Transient Conditions. Metals 2023, 13, 94. [Google Scholar] [CrossRef]
  13. Moran, J.P.; Bovard, F.S.; Chrzan, J.D.; Vandenburgh, P. Corrosion Performance of New Generation Aluminum-Lithium Alloys for Aerospace Applications. In Proceedings of the ICAA13 Pittsburgh: 13th International Conference on Aluminum Alloys, Pittsburgh, PA, USA, 3–7 June 2016; pp. 425–430. [Google Scholar]
  14. Vargel, C. Corrosion of Aluminium; Elsevier: Amsterdam, The Netherlands, 2004; ISBN 9780080444956. [Google Scholar]
  15. Vijayarani, K.; Vishnu Devan, M.; Natarajan, R. Effects of Addition of Alkaline Earth Metal-Beryllium on the Dissolution Behaviour of Aluminium-Zinc Alloy. Port. Electrochim. Acta 2017, 35, 91–102. [Google Scholar] [CrossRef]
  16. Prater, W.L. Pitting Corrosion of Cast Metallurgy Aluminum-Beryllium Alloys in Sulfuric Acid Solutions. Corrosion 2008, 64, 517–531. [Google Scholar] [CrossRef]
  17. Huang, Y.; Li, W.; Wu, M.; Xiao, D.; Huang, L.; Liu, W. Effects of Beryllium Addition on Microstructure, Mechanical and Corrosion Performance of Al-Mg-Li Alloys. Materials 2023, 16, 6308. [Google Scholar] [CrossRef]
  18. Camargo, O.A.B.; Padilha, G.S.; Pinto, F.C.; Osório, W.R.; Poloni, E.; Bortolozo, A.D. Synergistic Effects of Minor Be and Zr Contents on Microstructural and Mechanical Properties of A356 Cast Alloy. Int. J. Met. 2024, 19, 1676–1689. [Google Scholar] [CrossRef]
  19. Ibrahim, M.F.; Alkahtani, S.A.; Abuhasel, K.A.; Samuel, F.H. Microstructural Characterization of Beryllium Treated Al-Si Alloys. Adv. Mater. Sci. Eng. 2015, 2015, 673025. [Google Scholar] [CrossRef]
  20. Mukhopadhyay, A.K.; Singh, V.; Prasad, K.S.; Chakravorty, C.R. On S(Al2CuMg) Precipitation in an AlCuMg Alloy Containing Small Additions of Beryllium. Acta Mater. 1996, 44, 3115–3124. [Google Scholar] [CrossRef]
  21. Tang, P.; Yu, F.; Teng, X.; Peng, L.; Wang, K. Effect of Beryllium Addition and Heat Treatment on the Microstructure and Mechanical Properties of the 15%Mg2Si/Al-8Si Composite. Mater. Charact. 2021, 180, 111416. [Google Scholar] [CrossRef]
  22. Pawlas, N.; Pałczyński, C.M. Beryllium. In Handbook on the Toxicology of Metals, 5th ed.; Elsevier: Amsterdam, The Netherlands, 2022; Volume 2, pp. 101–119. [Google Scholar] [CrossRef]
  23. Willis, H.H.; Florig, H.K. Potential Exposures and Risks from Beryllium-Containing Products. Risk Anal. 2002, 22, 1019–1033. [Google Scholar] [CrossRef]
  24. Speer, W.; Es-Said, O.S. Applications of an Aluminum–Beryllium Composite for Structural Aerospace Components. Eng. Fail. Anal. 2004, 11, 895–902. [Google Scholar] [CrossRef]
  25. Azarbarmas, M.; Emamy, M.; Rassizadehghani, J.; Alipour, M.; Karamouz, M. The Influence of Beryllium Addition on the Microstructure and Mechanical Properties of Al–15%Mg2Si in-Situ Metal Matrix Composite. Mater. Sci. Eng. A 2011, 528, 8205–8211. [Google Scholar] [CrossRef]
  26. de Albuquerque, S.; Reinhart, G.; Magalhães, D.C.C.; Spinelli, J.E.; Soltani, H.; Boumechta, W.; Bertelli, F.; Nguyen-Thi, H. Solidification Paths of Al-Cu-Sn Alloys: Comparison of Thermodynamic Analyses and Solidification Experiments Using in Situ X-Radiography. Mater. Today Commun. 2024, 40, 109545. [Google Scholar] [CrossRef]
  27. Sanchez, J.M.; Galarraga, H.; Marquez, I.; de Cortazar, M.G. High-Throughput CALPHAD-Guided Design and Experimental Study on the Development of a Novel Multicomponent as-Cast Al-Si-Cu-Zn-Fe-Mn-Mg Based Alloy through the Direct Melting of Post-Consumer Scrap. J. Alloys Compd. 2025, 1015, 178888. [Google Scholar] [CrossRef]
  28. Okamoto, T.; Kishitake, K. Dendritic Structure in Unidirectionally Solidified Aluminum, Tin, and Zinc Base Binary Alloys. J. Cryst. Growth 1975, 29, 137–146. [Google Scholar] [CrossRef]
  29. Soler, G.D.A.; de Faria, A.O.; Borges, J.S.; Vida, T.; Souza, R.C.; Avila, J.A.; Brito, C. Effect of Co Addition on the Microstructure and Mechanical Properties of an Al-2wt.%Ni Alloy. Metals 2024, 14, 1156. [Google Scholar] [CrossRef]
  30. Vandersluis, E.; Ravindran, C. Comparison of Measurement Methods for Secondary Dendrite Arm Spacing. Metallogr. Microstruct. Anal. 2017, 6, 89–94. [Google Scholar] [CrossRef]
  31. Silva, C.D.; Soares, T.; Cheung, N.; Garcia, A.; Reis, D.A.P.; Brito, C. Dendritic Spacing and Macrosegregation Affecting Microhardness of an Al-Si-Mg Alloy Solidified Under Unsteady State Conditions. Mater. Res. 2019, 22, e20190390. [Google Scholar] [CrossRef]
  32. Gündüz, M.; Çadirli, E. Directional Solidification of Aluminium-Copper Alloys. Mater. Sci. Eng. A 2002, 327, 167–185. [Google Scholar] [CrossRef]
  33. ASTM E8/E8M-22; Standard Test Methods for Tension Testing of Metallic Materials. ASTM International: West Conshohocken, PA, USA, 2024. [CrossRef]
  34. Ahmad, Z. Principles of Corrosion Engineering and Corrosion Control; Elsevier: Amsterdam, The Netherlands, 2006. [Google Scholar]
  35. Khadke, P.; Tichter, T.; Boettcher, T.; Muench, F.; Ensinger, W.; Roth, C. A Simple and Effective Method for the Accurate Extraction of Kinetic Parameters Using Differential Tafel Plots. Sci. Rep. 2021, 11, 8974. [Google Scholar] [CrossRef]
  36. Kurz, W.; Fisher, D.J.; Rappaz, M. Fundamentals of Solidification, 5th Fully Revised ed.; Trans Tech Publications Ltd.: Bäch, Switzerland, 2023. [Google Scholar]
  37. Stadnik, Z.M.; Takeuchi, T.; Tanaka, N.; Mizutani, U. Structural, Mössbauer, and Transport Studies of the Icosahedral Quasicrystals Al55Si7Cu25.5Fe12.5, Al62.5Cu24.5Fe13 and the Crystalline 1/1 Approximant Al55Si7Cu25.5Fe12.5. J. Phys. Condens. Matter 2003, 15, 6365. [Google Scholar] [CrossRef]
  38. Kurz, W.; Rappaz, M.; Trivedi, R. Progress in Modelling Solidification Microstructures in Metals and Alloys. Part II: Dendrites from 2001 to 2018. Int. Mater. Rev. 2021, 66, 30–76. [Google Scholar] [CrossRef]
  39. Ganesh, M.R.S.; Reghunath, N.; Levin, M.J.; Prasad, A.; Doondi, S.; Shankar, K.V. Strontium in Al–Si–Mg Alloy: A Review. Met. Mater. Int. 2022, 28, 1–40. [Google Scholar] [CrossRef]
  40. Fracchia, E.; Gobber, F.S.; Rosso, M. Effect of Alloying Elements on the Sr Modification of Al-Si Cast Alloys. Metals 2021, 11, 342. [Google Scholar] [CrossRef]
  41. Fortini, A.; Lattanzi, L.; Merlin, M.; Garagnani, G.L. Comprehensive Evaluation of Modification Level Assessment in Sr-Modified Aluminium Alloys. Int. J. Met. 2018, 12, 697–711. [Google Scholar] [CrossRef]
  42. Osório, W.R.; Moutinho, D.J.; Peixoto, L.C.; Ferreira, I.L.; Garcia, A. Macrosegregation and Microstructure Dendritic Array Affecting the Electrochemical Behaviour of Ternary Al-Cu-Si Alloys. Electrochim. Acta 2011, 56, 8412–8421. [Google Scholar] [CrossRef]
  43. Rodrigues, A.V.; Lima, T.S.; Vida, T.A.; Brito, C.; Garcia, A.; Cheung, N. Microstructure Features and Mechanical/Electrochemical Behavior of Directionally Solidified Al−6wt.%Cu−5wt.%Ni Alloy. Trans. Nonferrous Met. Soc. China 2021, 31, 1529–1549. [Google Scholar] [CrossRef]
  44. Guo, H.; Hu, W.; Yang, K.; Yu, C. Effects of Si and Fe Additions on Mechanical Properties of As-Cast Al–5Cu Alloys. Mater. Sci. Technol. 2022, 38, 352–362. [Google Scholar] [CrossRef]
  45. Yu, W.; Wang, Y.; Li, Y.; Wang, H.; Wang, Z.; Xu, G.; Li, J.; Tang, H.; Yu, F.; Qian, X. Segregation-Induced Abnormal Recrystallization Behavior, Texture Evolution, and Effects on Mechanical Properties in Twin-Roll Casting 2060 Al-Cu-Li Alloys. J. Alloys Compd. 2024, 991, 174472. [Google Scholar] [CrossRef]
  46. Cai, Q.; Mendis, C.L.; Chang, I.T.H.; Fan, Z. Microstructure and Mechanical Properties of New Die-Cast Quaternary Al-Cu-Si-Mg Alloys. Mater. Sci. Eng. A 2021, 800, 140357. [Google Scholar] [CrossRef]
  47. Arthanari, S.; Jang, J.C.; Shin, K.S. Corrosion Studies of High Pressure Die-Cast Al-Si-Ni and Al-Si-Ni-Cu Alloys. J. Alloys Compd. 2018, 749, 146–154. [Google Scholar] [CrossRef]
  48. Semiletov, A.M.; Chirkunov, A.A.; Kuznetsov, Y.I. Protection of D16 Alloy against Corrosion in Neutral Aqueous Solutions and in an Aggressive Atmosphere Using Organic Inhibitors. Prot. Met. Phys. Chem. Surf. 2020, 56, 1285–1292. [Google Scholar] [CrossRef]
  49. Pulido-González, N.; Torres, B.; Zheludkevich, M.L.; Rams, J. High Power Diode Laser (HPDL) Surface Treatments to Improve the Mechanical Properties and the Corrosion Behaviour of Mg-Zn-Ca Alloys for Biodegradable Implants. Surf. Coat. Technol. 2020, 402, 126314. [Google Scholar] [CrossRef]
  50. Chen, Z.; Han, P.; He, B.; Sun, F.; Bai, X.; Wang, X.; Guo, T.; Wang, X. Electrochemical Impedance Spectroscopy (EIS) of NaCl-Saturated Sandy Soil at Sub-Zero Temperatures. Int. J. Electrochem. Sci. 2021, 16, 210914. [Google Scholar] [CrossRef]
  51. ASTM DESIGNATION G102; Standard Practice for Calculation of Corrosion Rates and Related Information from Electrochemical Measurements. In Annual Book of ASTM Standars; ASTM International: West Conshohocken, PA, USA, 2012; Volume 66.
  52. Li, C.; Li, X.; Zhang, Y.; Wen, K.; Yan, L.; Li, Y.; Li, Y.; Yu, M.; Gao, G.; Yan, H.; et al. Effect of Cu/Li Ratio on Mechanical Properties and Corrosion Behavior of Sc-Containing Al-Cu-Li Alloys. Materials 2025, 18, 2254. [Google Scholar] [CrossRef]
  53. Geng, J.; Li, Y.; Liu, G.; Xiao, H.; Hong, T.; Huang, J.; Wang, M.; Chen, D.; Wang, H. Segregation of S Precipitates at T/Al Interfaces and Relevant Effects on Localized Corrosion Mechanisms in Al-Cu-Mg Alloy. Mater. Charact. 2020, 168, 110571. [Google Scholar] [CrossRef]
Figure 1. (a) Design of the brass ingot mold used, (b) position of samples and sections of cuts, (c) detail of sample to corrosion test, (d) design of the bronze mold utilized for casting the ingots to process the tensile testing samples, and (e) dimensions of the tensile test specimen.
Metals 15 00736 g001
Figure 2. (a) Pseudo-binary phase diagram of Al-5wt.%Cu-1wt.%Si-Xwt.%Be and (b) volume fraction of all phases in the simulation.
Metals 15 00736 g002
Figure 3. XRD patterns for the Al-5wt.%Cu-1wt.%Si-0.5wt.%Be alloy, in a solidified sample at a cooling rate of 21.4 K/s (sample A3).
Metals 15 00736 g003
Figure 4. (a) SEM image showing the morphology arrangement of the Al-5wt.%Cu-1wt.%Si-0.5wt.%Be alloy solidified sample at a cooling rate of 21.4 K/s (sample A3), (b) punctual SEM/EDS analysis, and (c) mapping element (EDS).
Metals 15 00736 g004
Figure 5. Micrographs obtained by optical microscopy for (a) sample A1 ( T ˙ = 82.2 K/s), (b) sample A2 ( T ˙ = 45.0 K/s), (c) sample A3 ( T ˙ = 21.4 K/s), and (d) sample A4 ( T ˙ = 19.5 K/s). Magnification 500x.
Metals 15 00736 g005
Figure 6. Evolution of the secondary dendritic arm spacing (μm) with the solidification cooling rate (K/s) for the Al-5wt.%Cu-1wt.%Si-0.5wt.%Be alloy, compared with results of other Al-Cu-based alloys from the literature. Adapted from Refs. [9,11,42].
Metals 15 00736 g006
Figure 7. Engineering stress–strain curves obtained from uniaxial tensile tests of the Al–5wt.%Cu–1wt.%Si–0.5wt.%Be alloy, solidified at a cooling rate of 21.4 K/s.
Metals 15 00736 g007
Figure 8. (a) Nyquist curve and (b) Bode and Bode phase curves for the Al-5wt.%Cu-1wt.%Si-0.5wt.%Be alloy in a 0.06M sodium-chloride solution, in a solidified sample at a cooling rate of 21.4 K/s (sample A3).
Metals 15 00736 g008
Figure 9. The equivalent electrical circuit used to model the experimental EIS data of the Al-5wt.%Cu-1wt.%Si-0.5wt.%Be alloy: [Rel(CPE1[R1(CPE2R2)])].
Metals 15 00736 g009
Figure 10. Potentiodynamic polarization curve of the Al-5wt%Cu-1wt.%Si-0.5wt.%Be alloy in a 0.06M sodium-chloride solution, of a sample solidified at a cooling rate of 21.4 K/s (sample A3).
Metals 15 00736 g010
Figure 11. Typical SEM images illustrating the pitting corrosion behavior after the linear polarization test in a 0.06M NaCl solution.
Metals 15 00736 g011
Table 1. Chemical composition (wt.%) of the metals used to prepare the alloy.
Alloy
Elements
MgAlBeSiCuNiFeMn
Al0.01Balance-0.130.01-0.23-
Cu----Balance0.008-0.08
Si-0.11-Balance-0.010.32-
Cu-Be-0.0299.830.0097Balance0.010.053-
Table 2. Cooling rate for each sample (diameter).
Sample (Diameter [mm])Cooling Rate ( T ˙ ) [K/s]
A1 (10 mm)82.2
A2 (15 mm)45.0
A3 (25 mm)21.4
A4 (40 mm)19.5
Table 3. Comparative table of cooling rate, average dendritic spacing, yield strength, ultimate tensile strengths, and elongations to break of different Al-Cu alloys. The concentrations of the alloys are in weight percent.
Alloy T ˙
[K/s]
λ 2
[μm]
σY
[MPa]
σU
[MPa]
δ
[%]
Al-5Cu [11]9.824.3 ± 2.3 112 ± 13.0225 ± 21.0-
Al-5Cu-1Ni [9]12.610.5 ± 2.2 -190 ± 8.025 ± 2.4
Al-5Cu-2.5Si-1.1Mg [46] --219 ± 3.1344.7 ± 6.57.72 ± 1.4
2060-T6 Al-Cu-Li [45]--~348−37810.2
A356—T6 [18]1.535 ± 6.0 -243 ± 1711.0 ± 1.4
Al-5Cu-1Si-0.5Be [this work]21.410.0 ± 2.8 84.8 ± 14.3 248.8 ± 11.26.4 ± 0.5
Table 4. Results of the simulated impedance parameters for the Al-5.0wt.%Cu-1.0wt.%Si-0.5wt.%Be alloy casting.
ParameterValueEstimated Error (%)
Rel (Ω∙cm2)85.480.42
Q1 (S∙sn/cm2)12.201.90
R1 (kΩ∙cm2)5.940.73
n10.92-
Q2 (S∙sn/cm2)167.521.57
R2 (kΩ∙cm2)12.651.59
n20.99-
χ20.9 × 10⁻³
Table 5. Comparative table of cooling rate, average dendritic spacing, corrosion current density, and corrosion potential for different Al-Cu alloys. The concentrations of the alloys are in weight percent.
Alloy T ˙
[K/s]
λ 2
[μm]
i c o r r
[ μ A · c m 2 ]
E c o r r
[ V ]
C R y
[ μ m · y e a r 1 ]
Al-5Cu [11]9.824.3 ± 2.3 4.15−0.67846.9 *
Al-5Cu-1Ni [9]12.610.5 ± 2.2 0.15−0.5251.7 *
Al-6Cu-1Si [42]13.510.2 ± 1.2 4.36−0.62047.2 *
Al-Cu-Li [52]--0.31−0.642-
Al-5Cu-1Si-0.5Be [this work]21.410.0 ± 2.8 2.40−0.53728.9
* CRy values were determined based on Equation (1) and data that are available in the literature.
Disclaimer/Publisher’s Note: The statements, opinions and data contained in all publications are solely those of the individual author(s) and contributor(s) and not of MDPI and/or the editor(s). MDPI and/or the editor(s) disclaim responsibility for any injury to people or property resulting from any ideas, methods, instructions or products referred to in the content.

