
Comparison of Microstructure and Hardening Ability of DCI with Different Pearlite Contents by Laser Surface Treatment

Abstract
1. Introduction
2. Materials and Methods
3. Results and Discussion
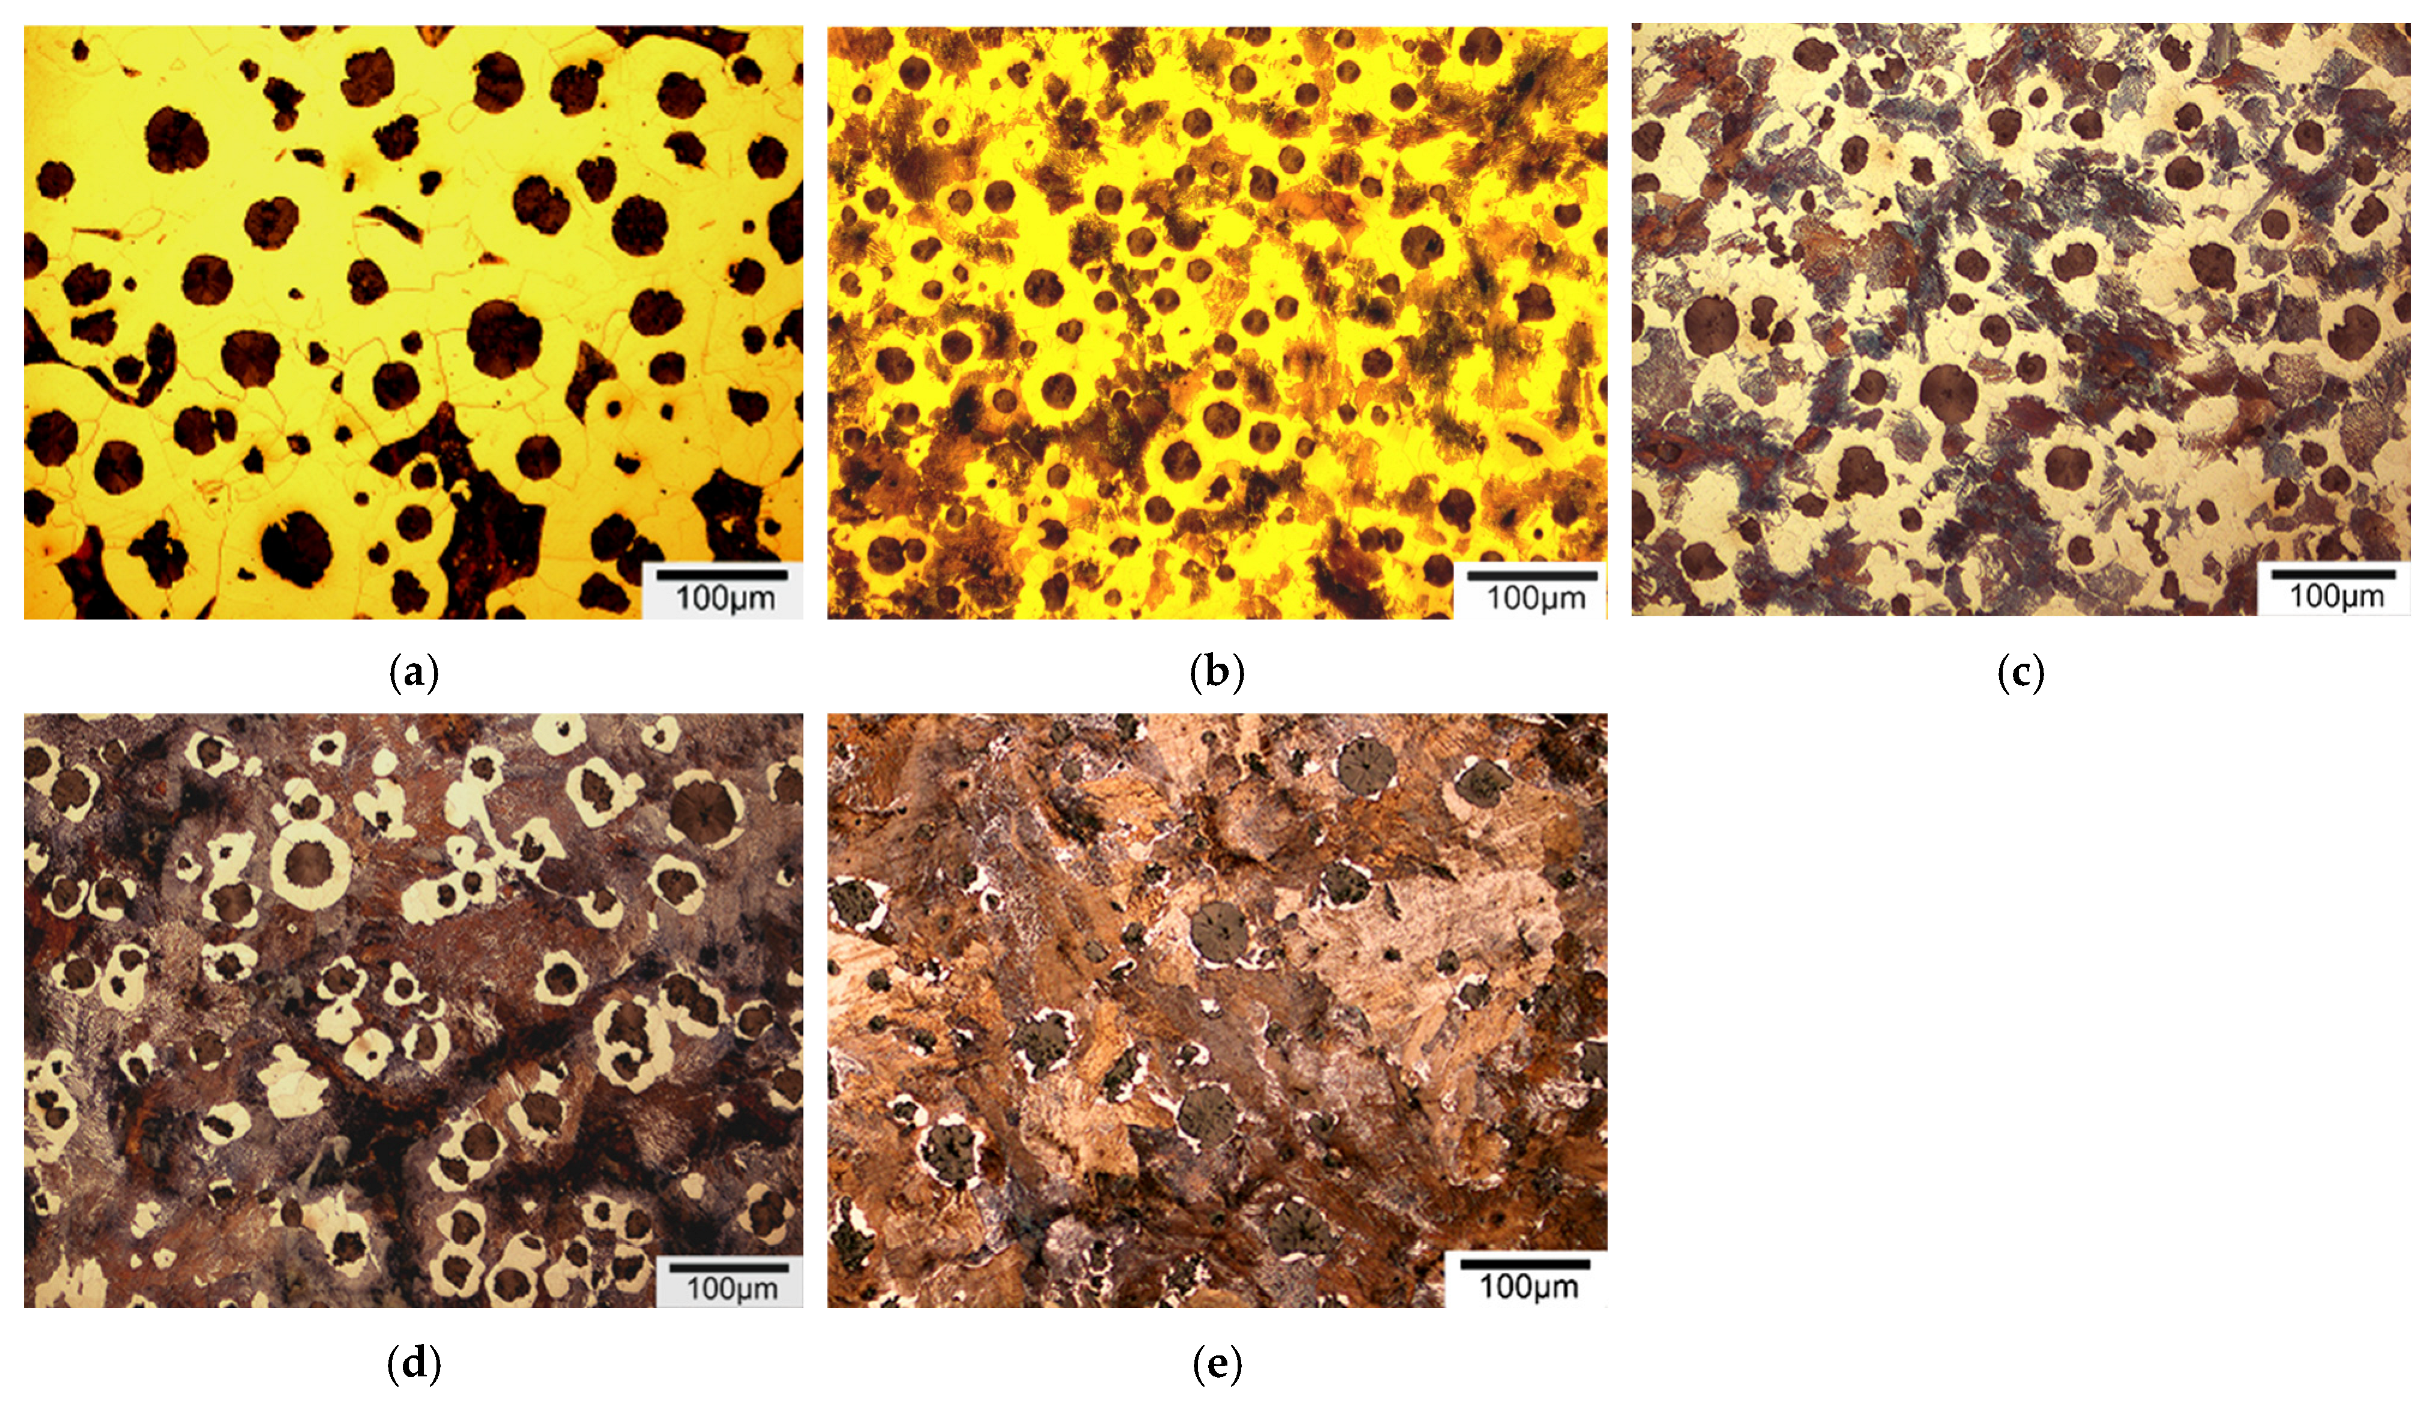
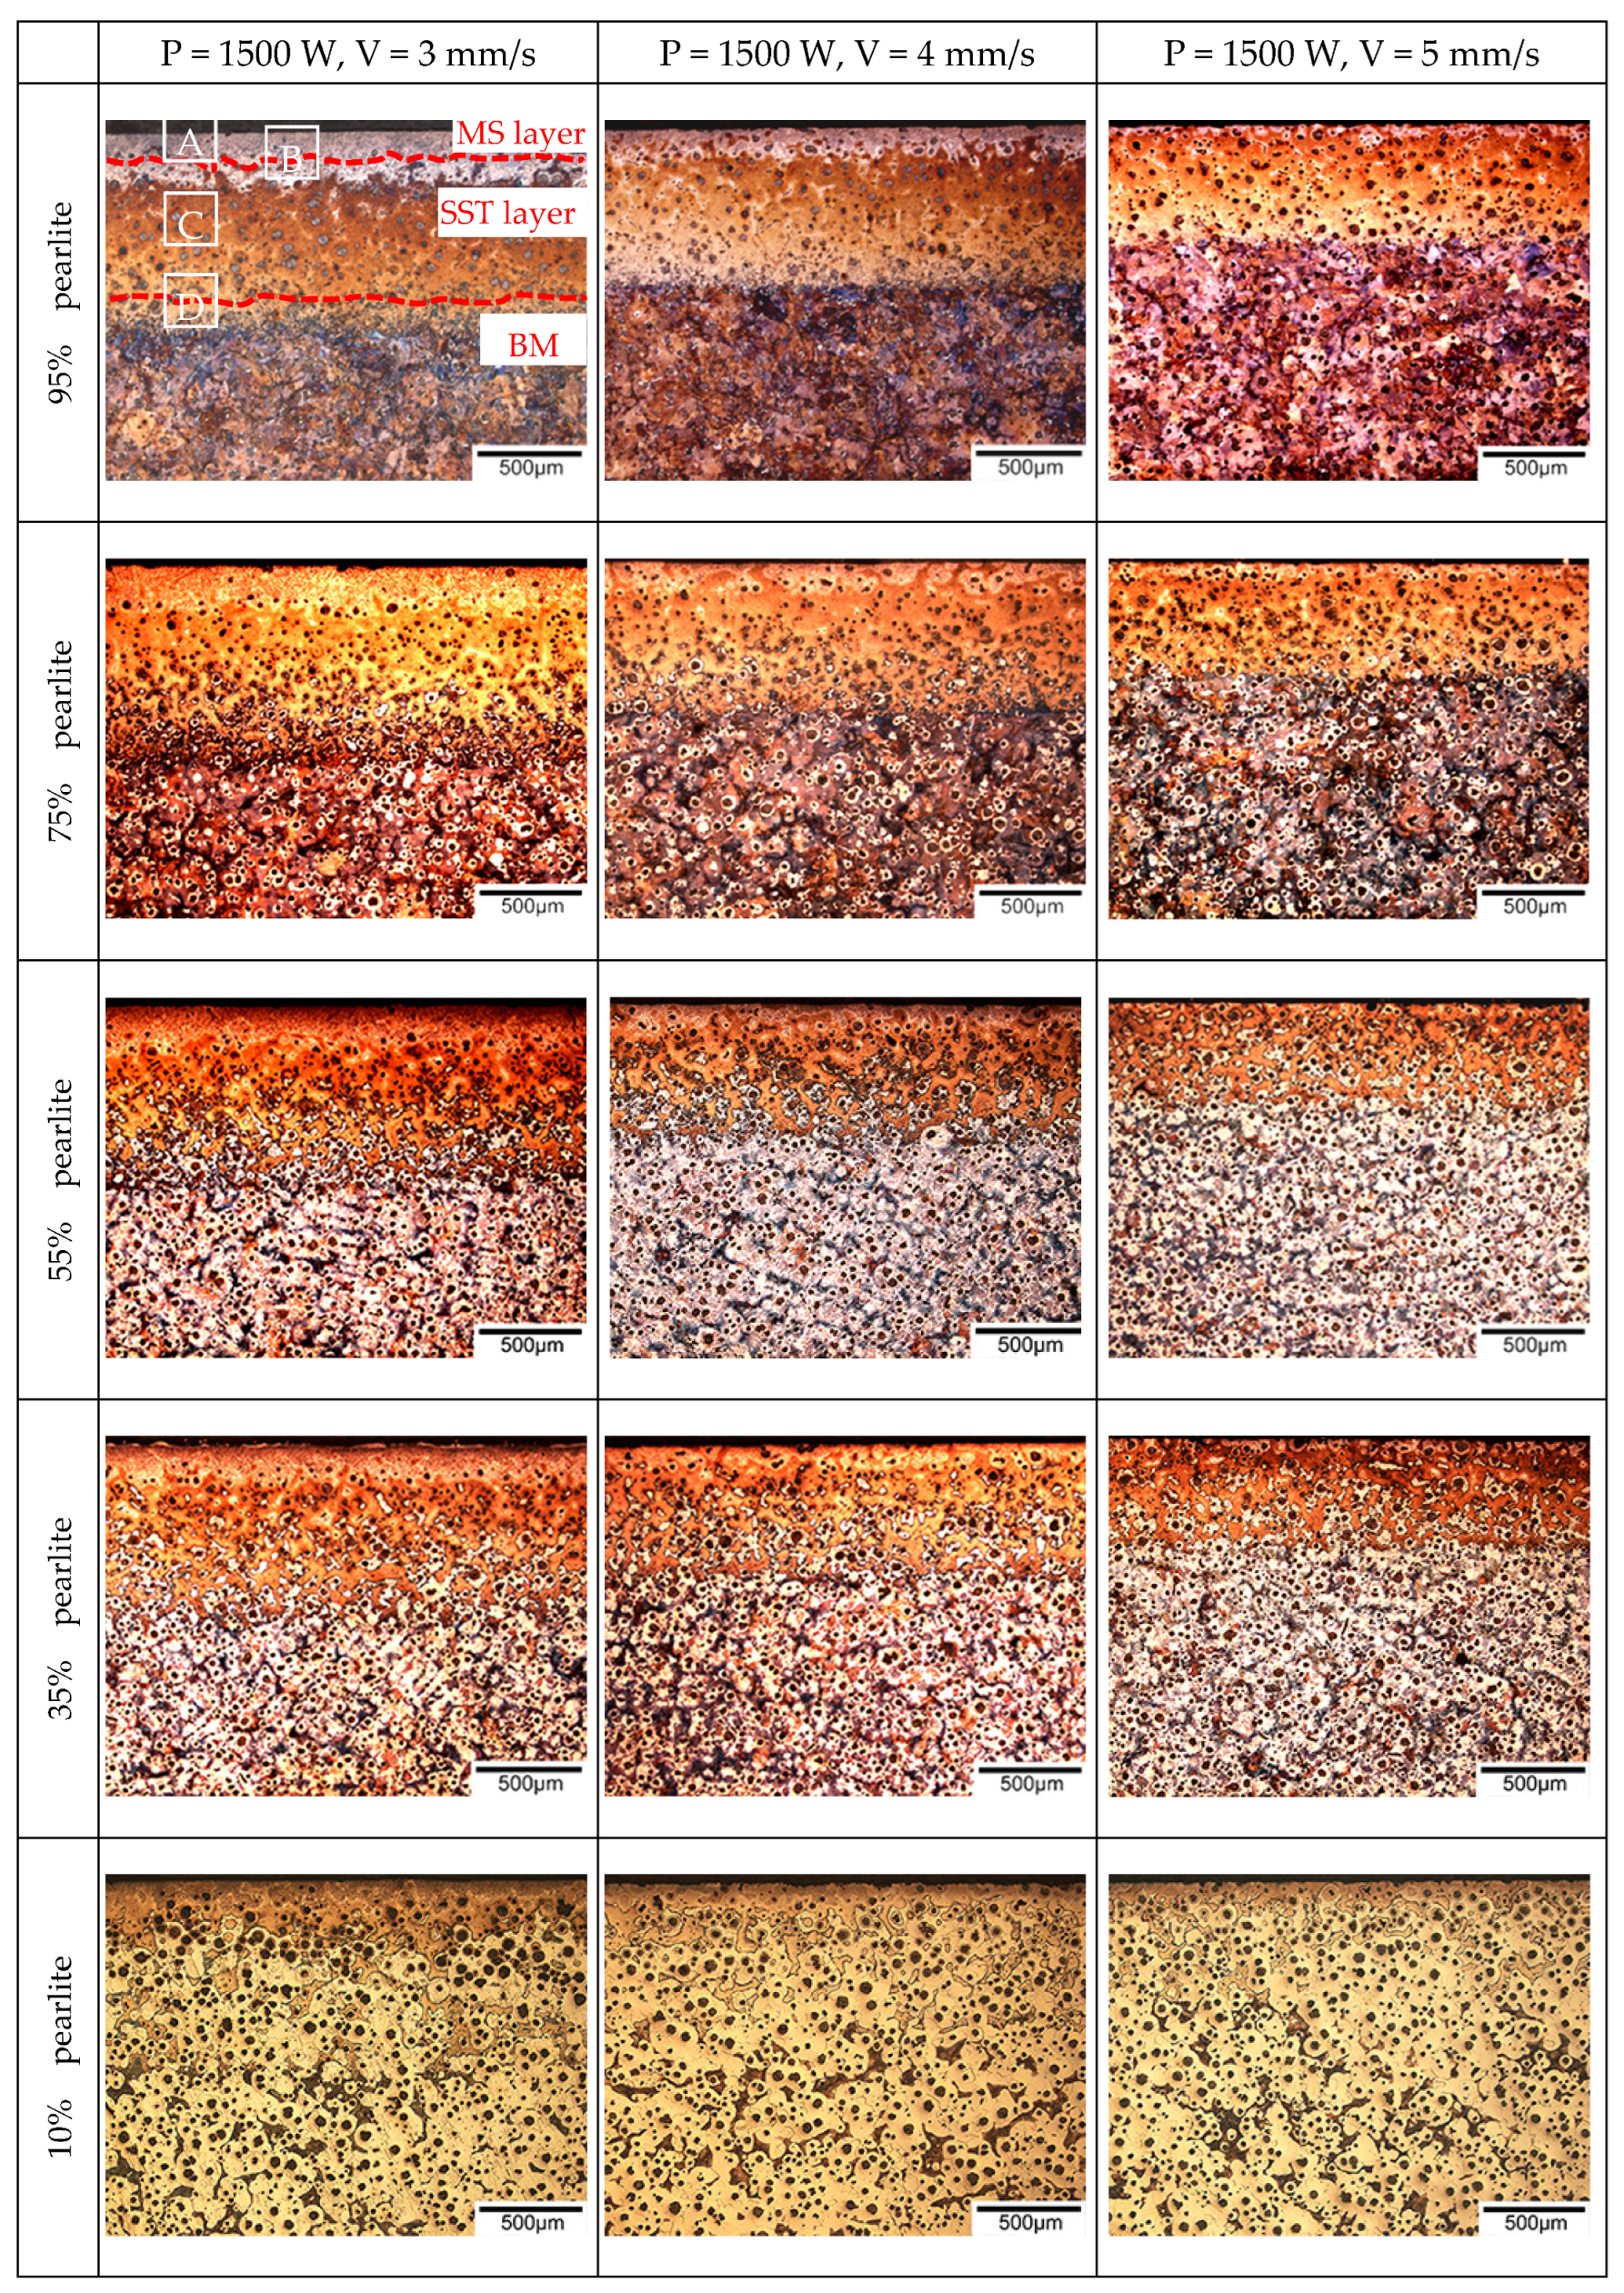
3.1. Microstructure of Laser Surface-Treated DCI with Different Pearlite
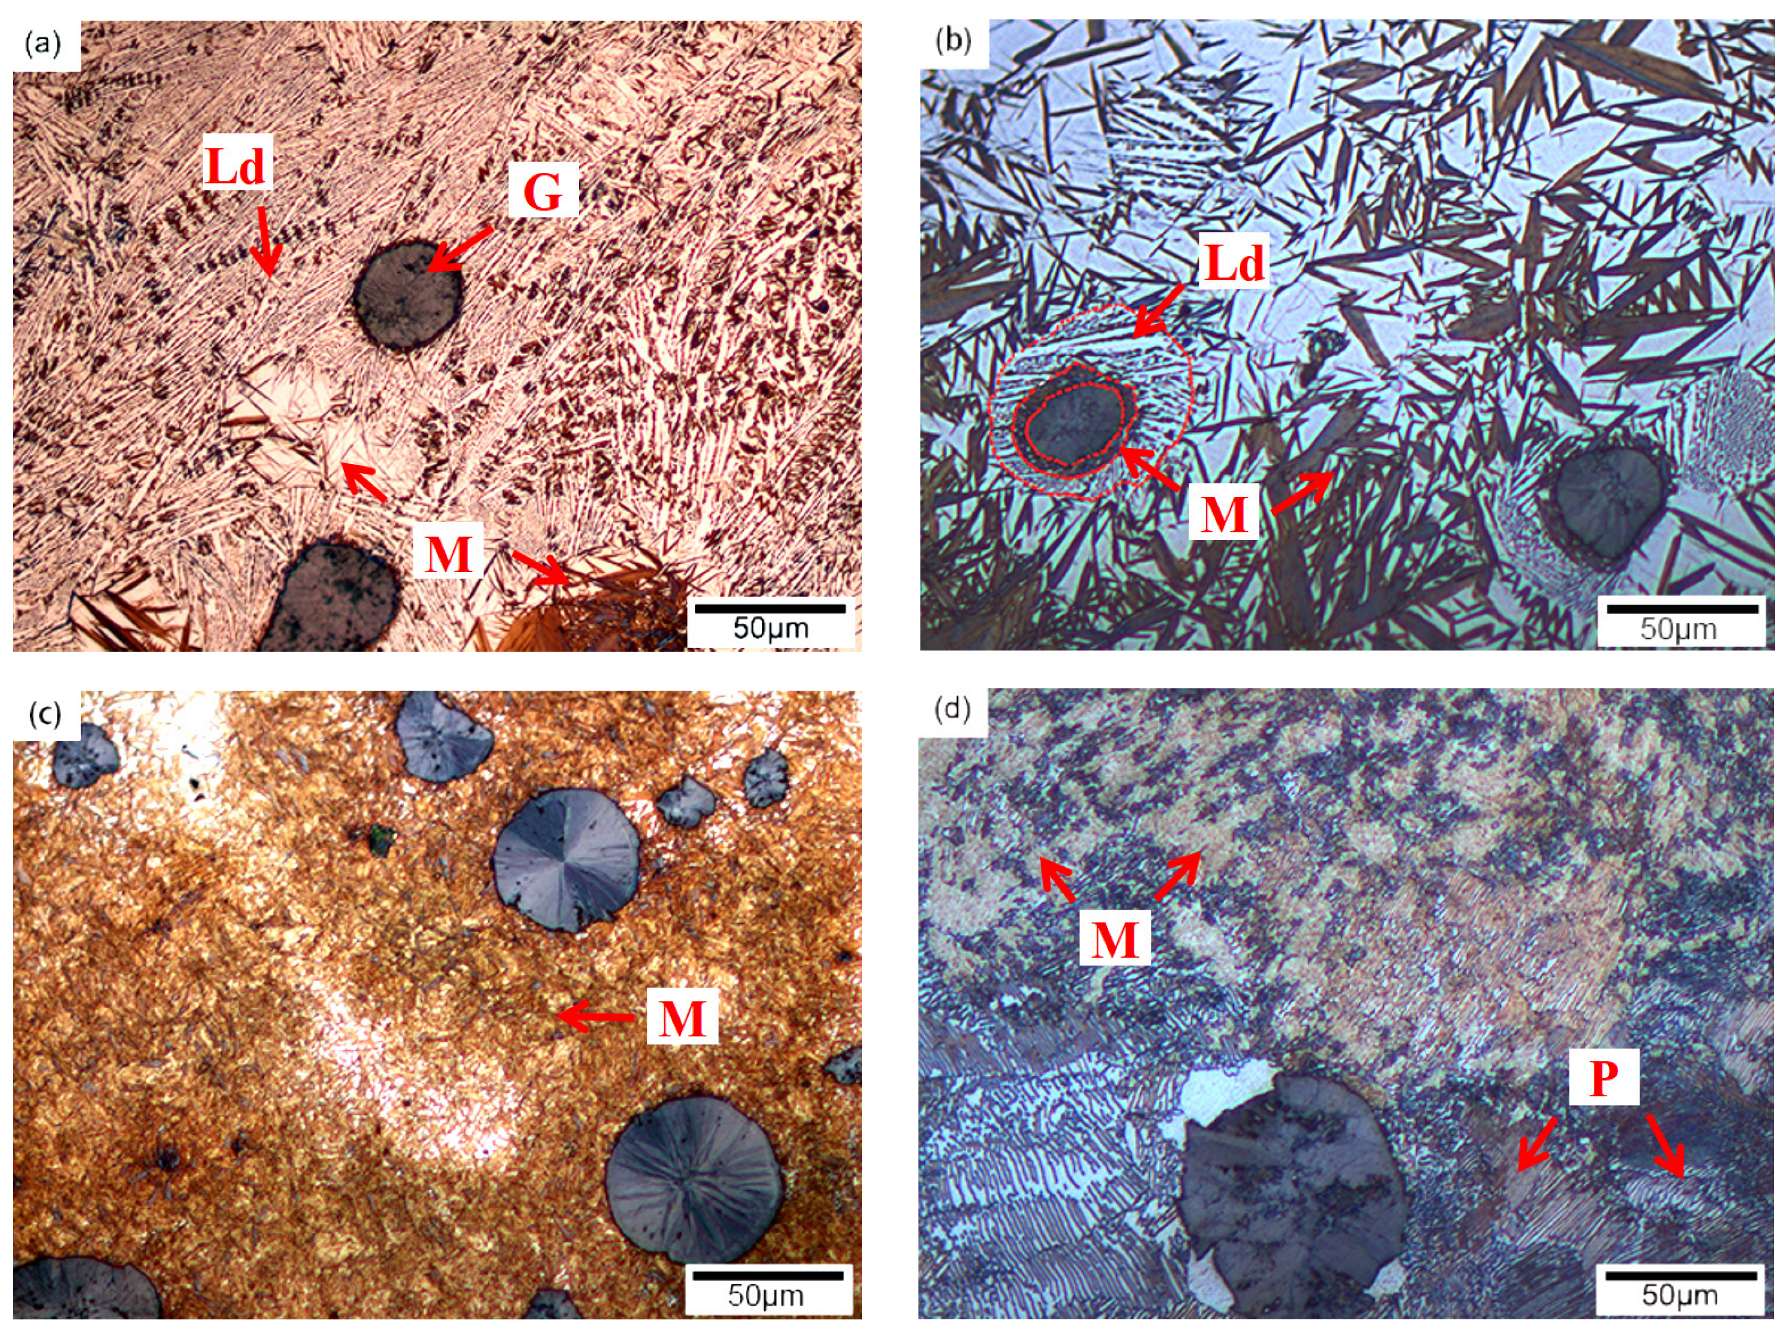
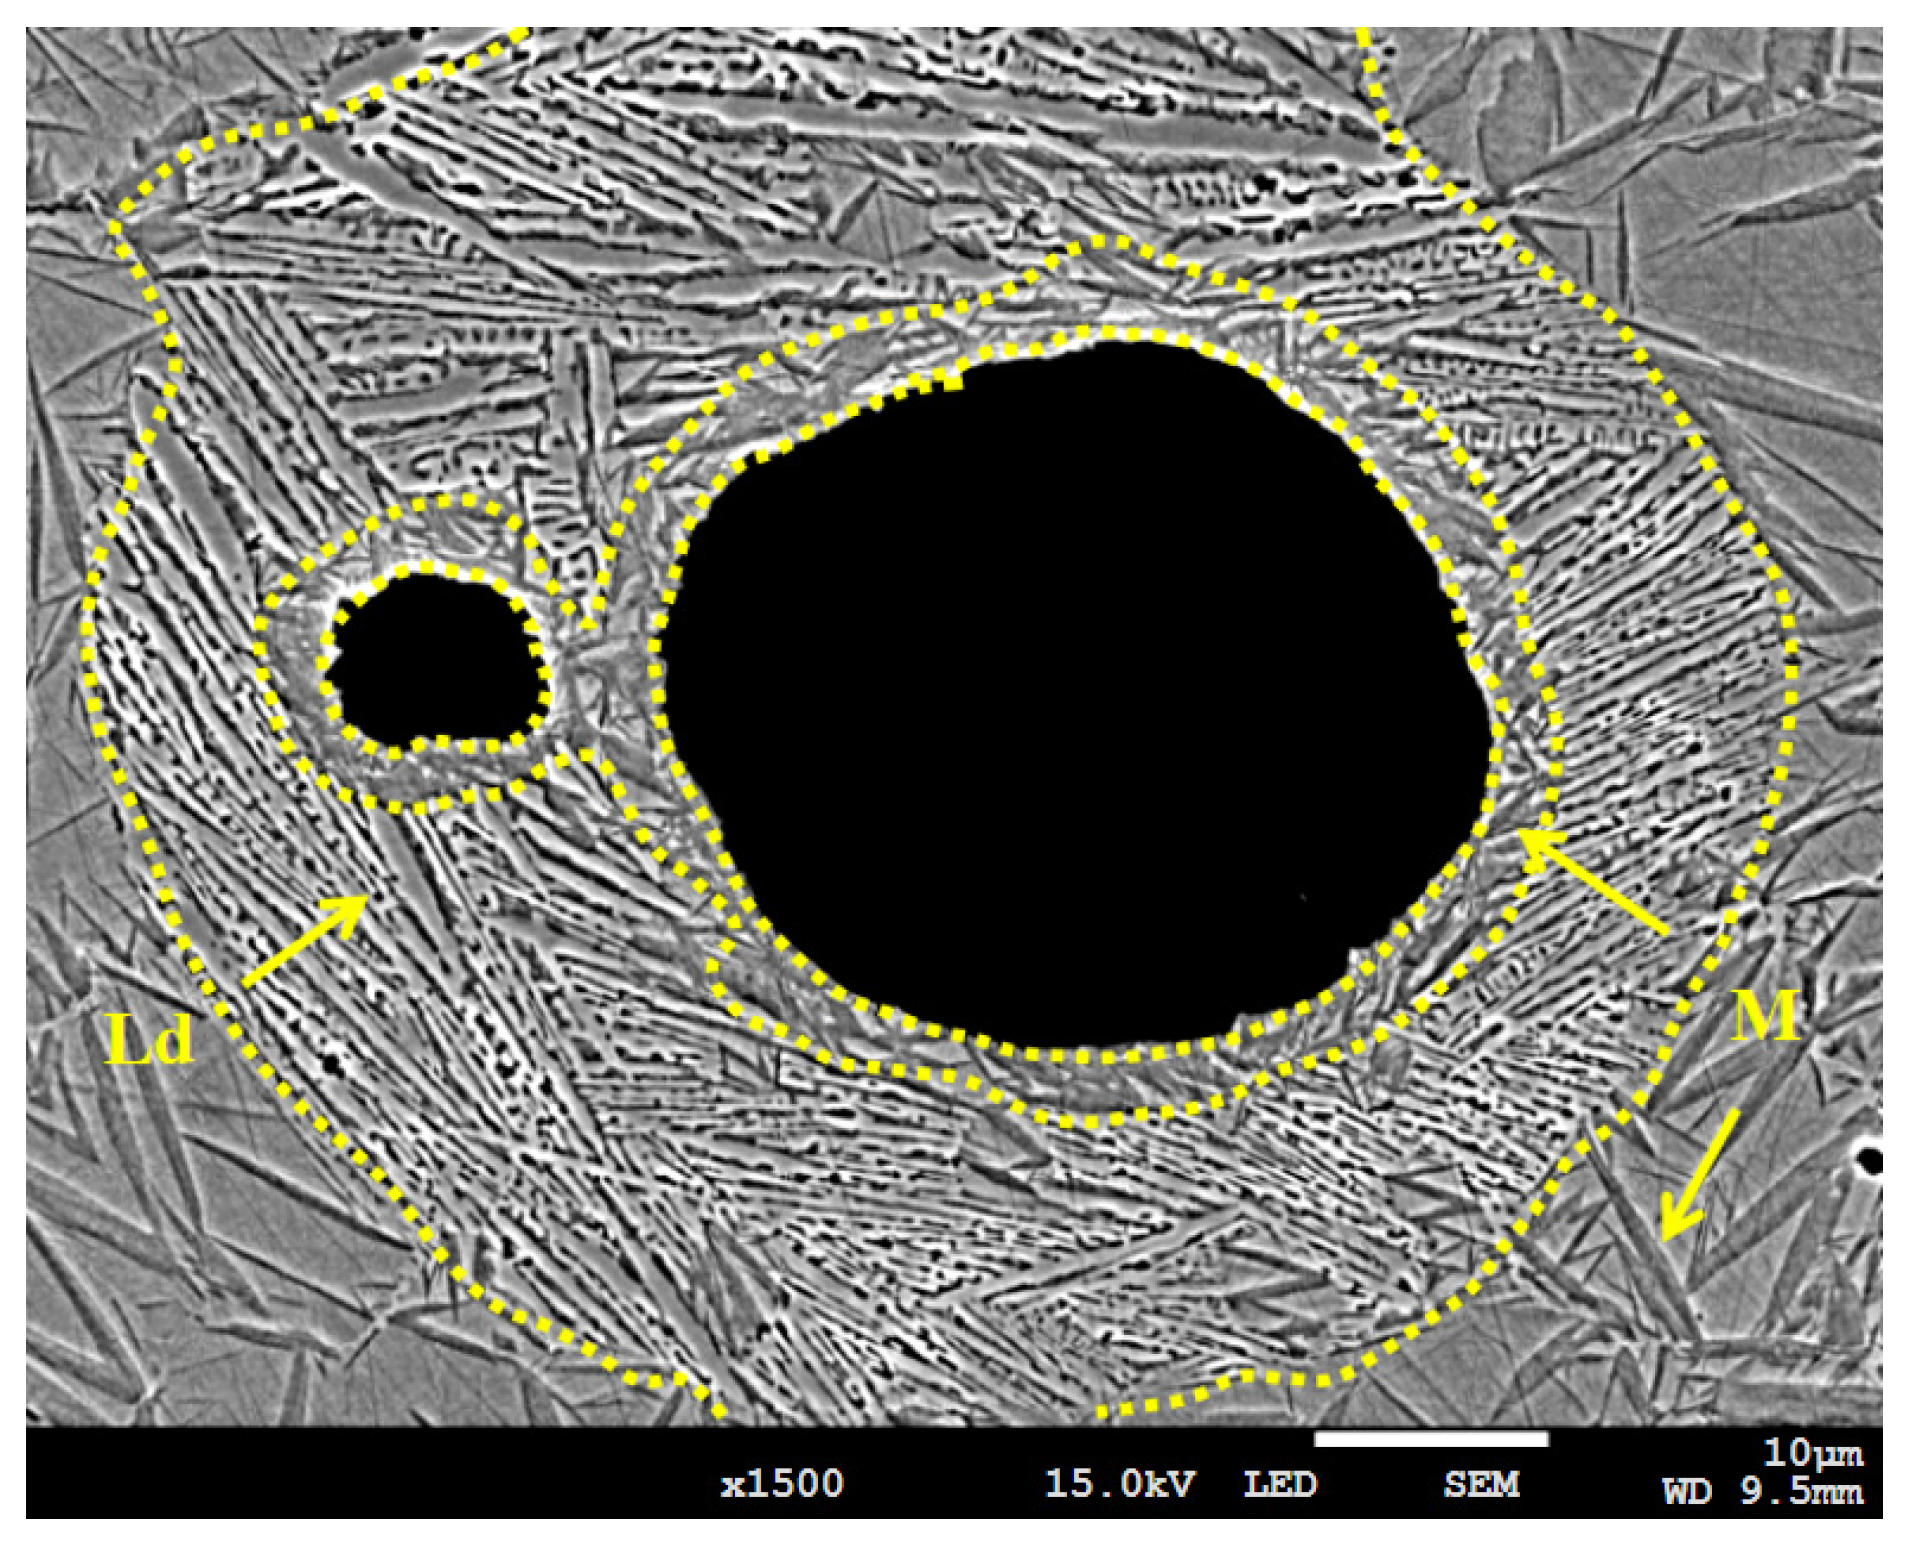
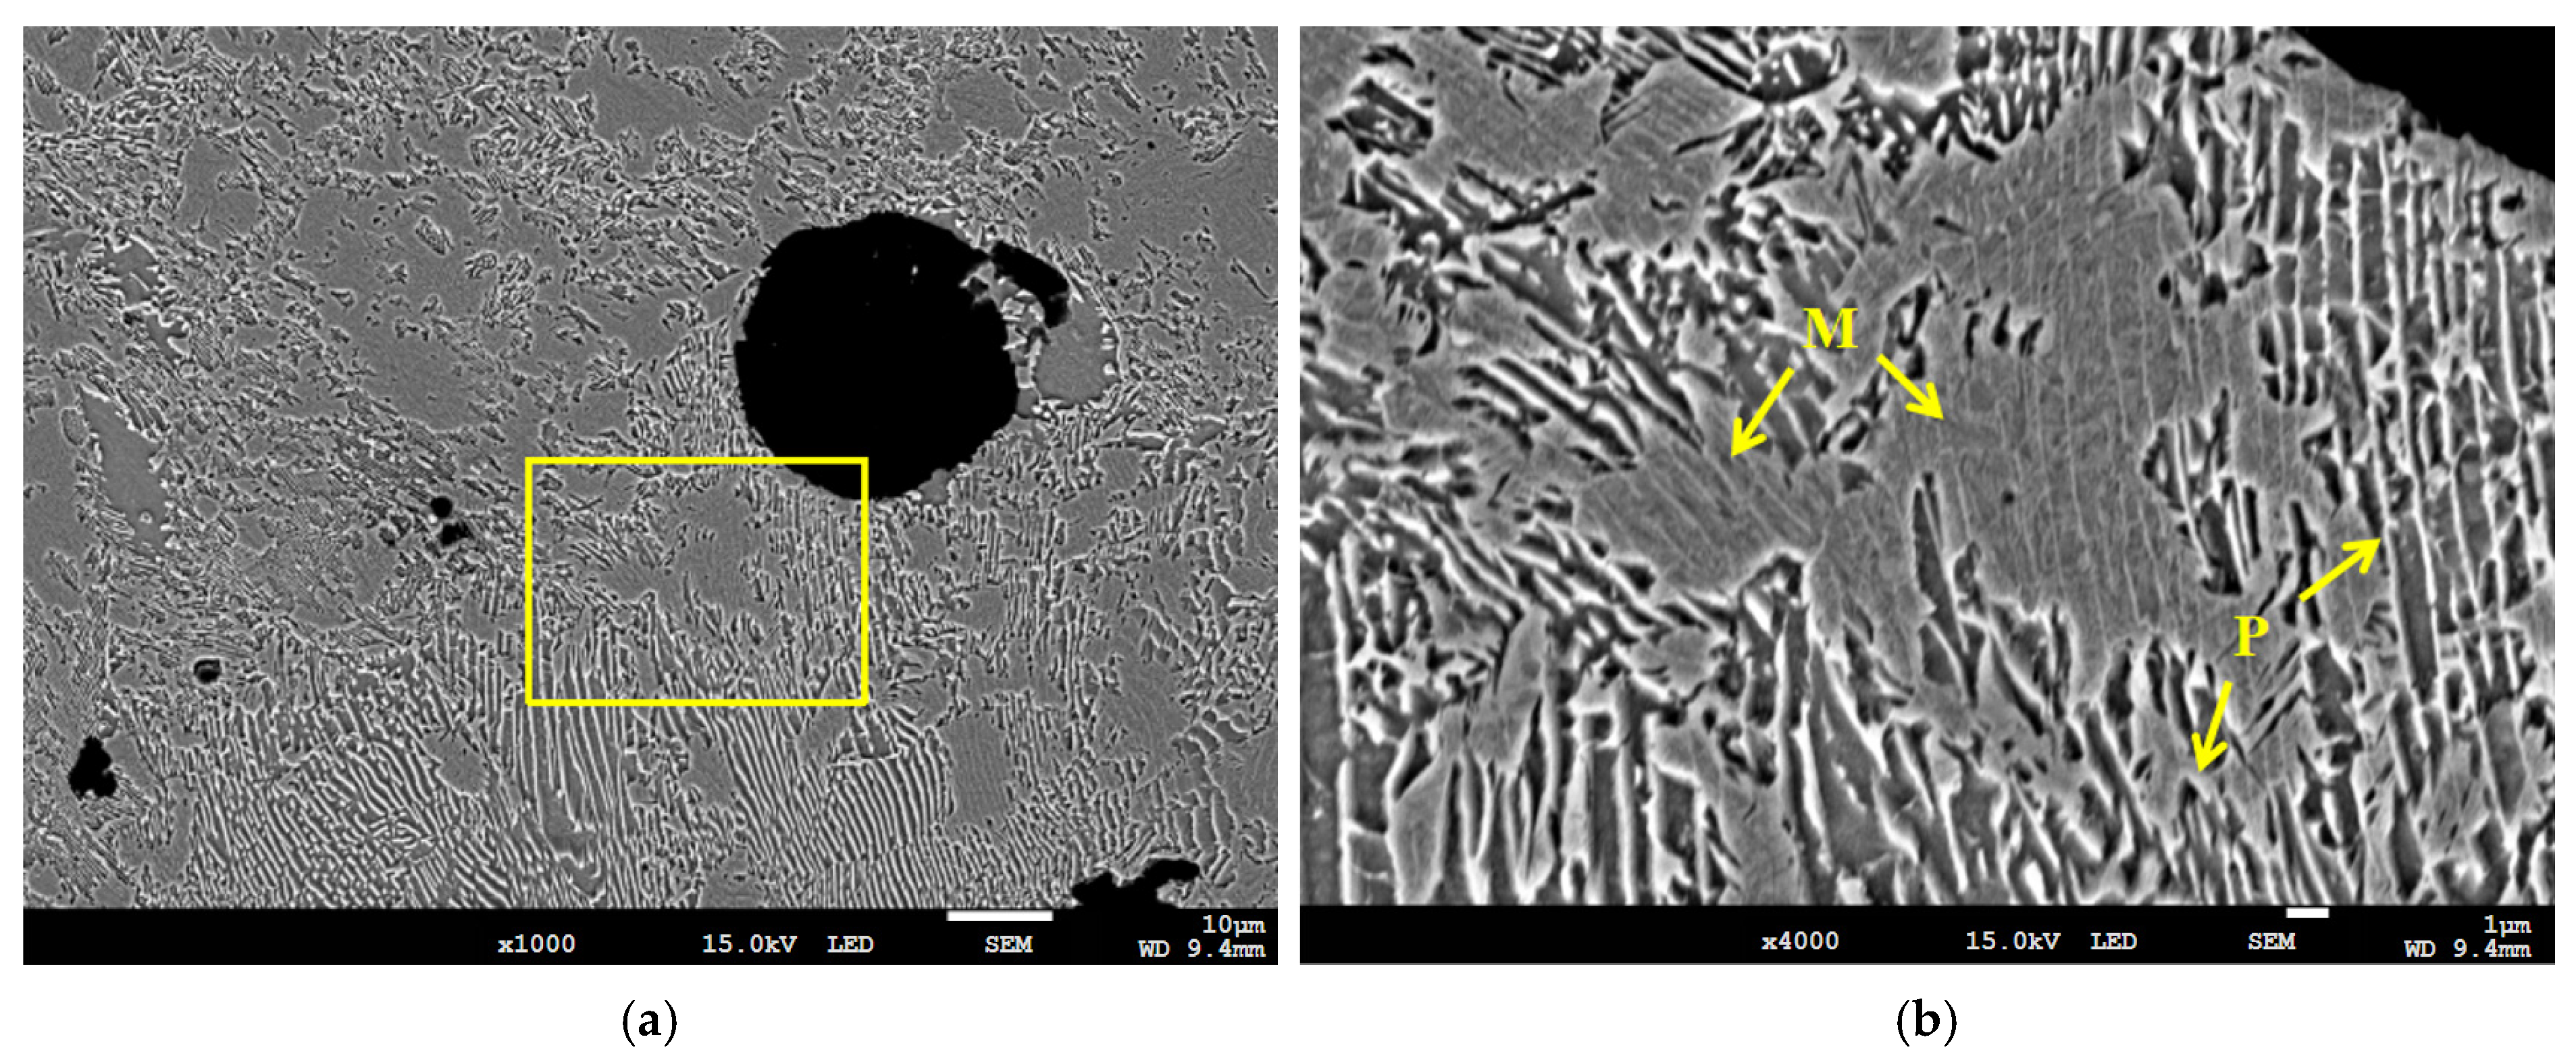
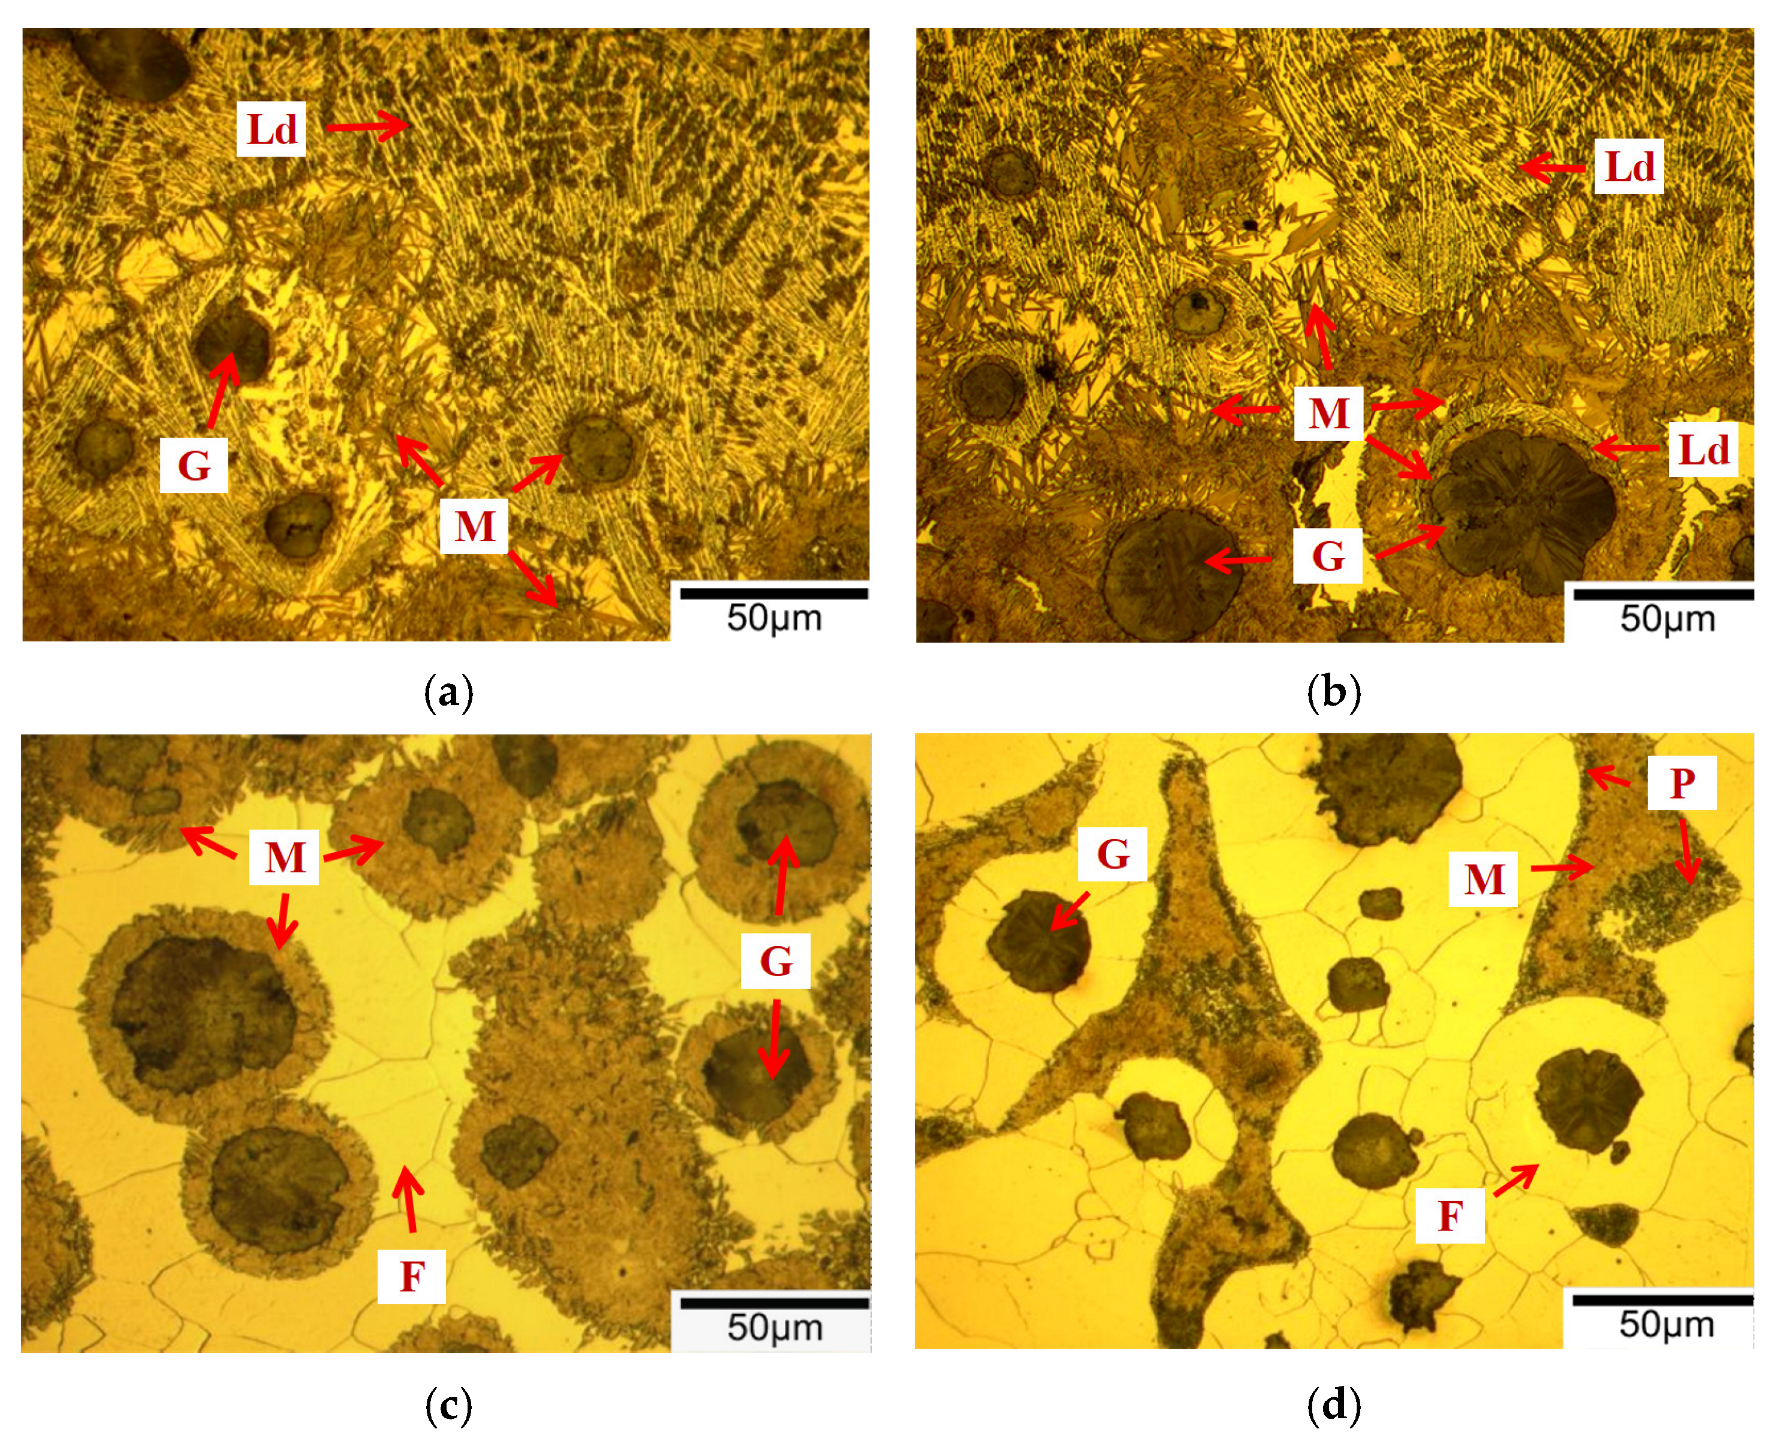
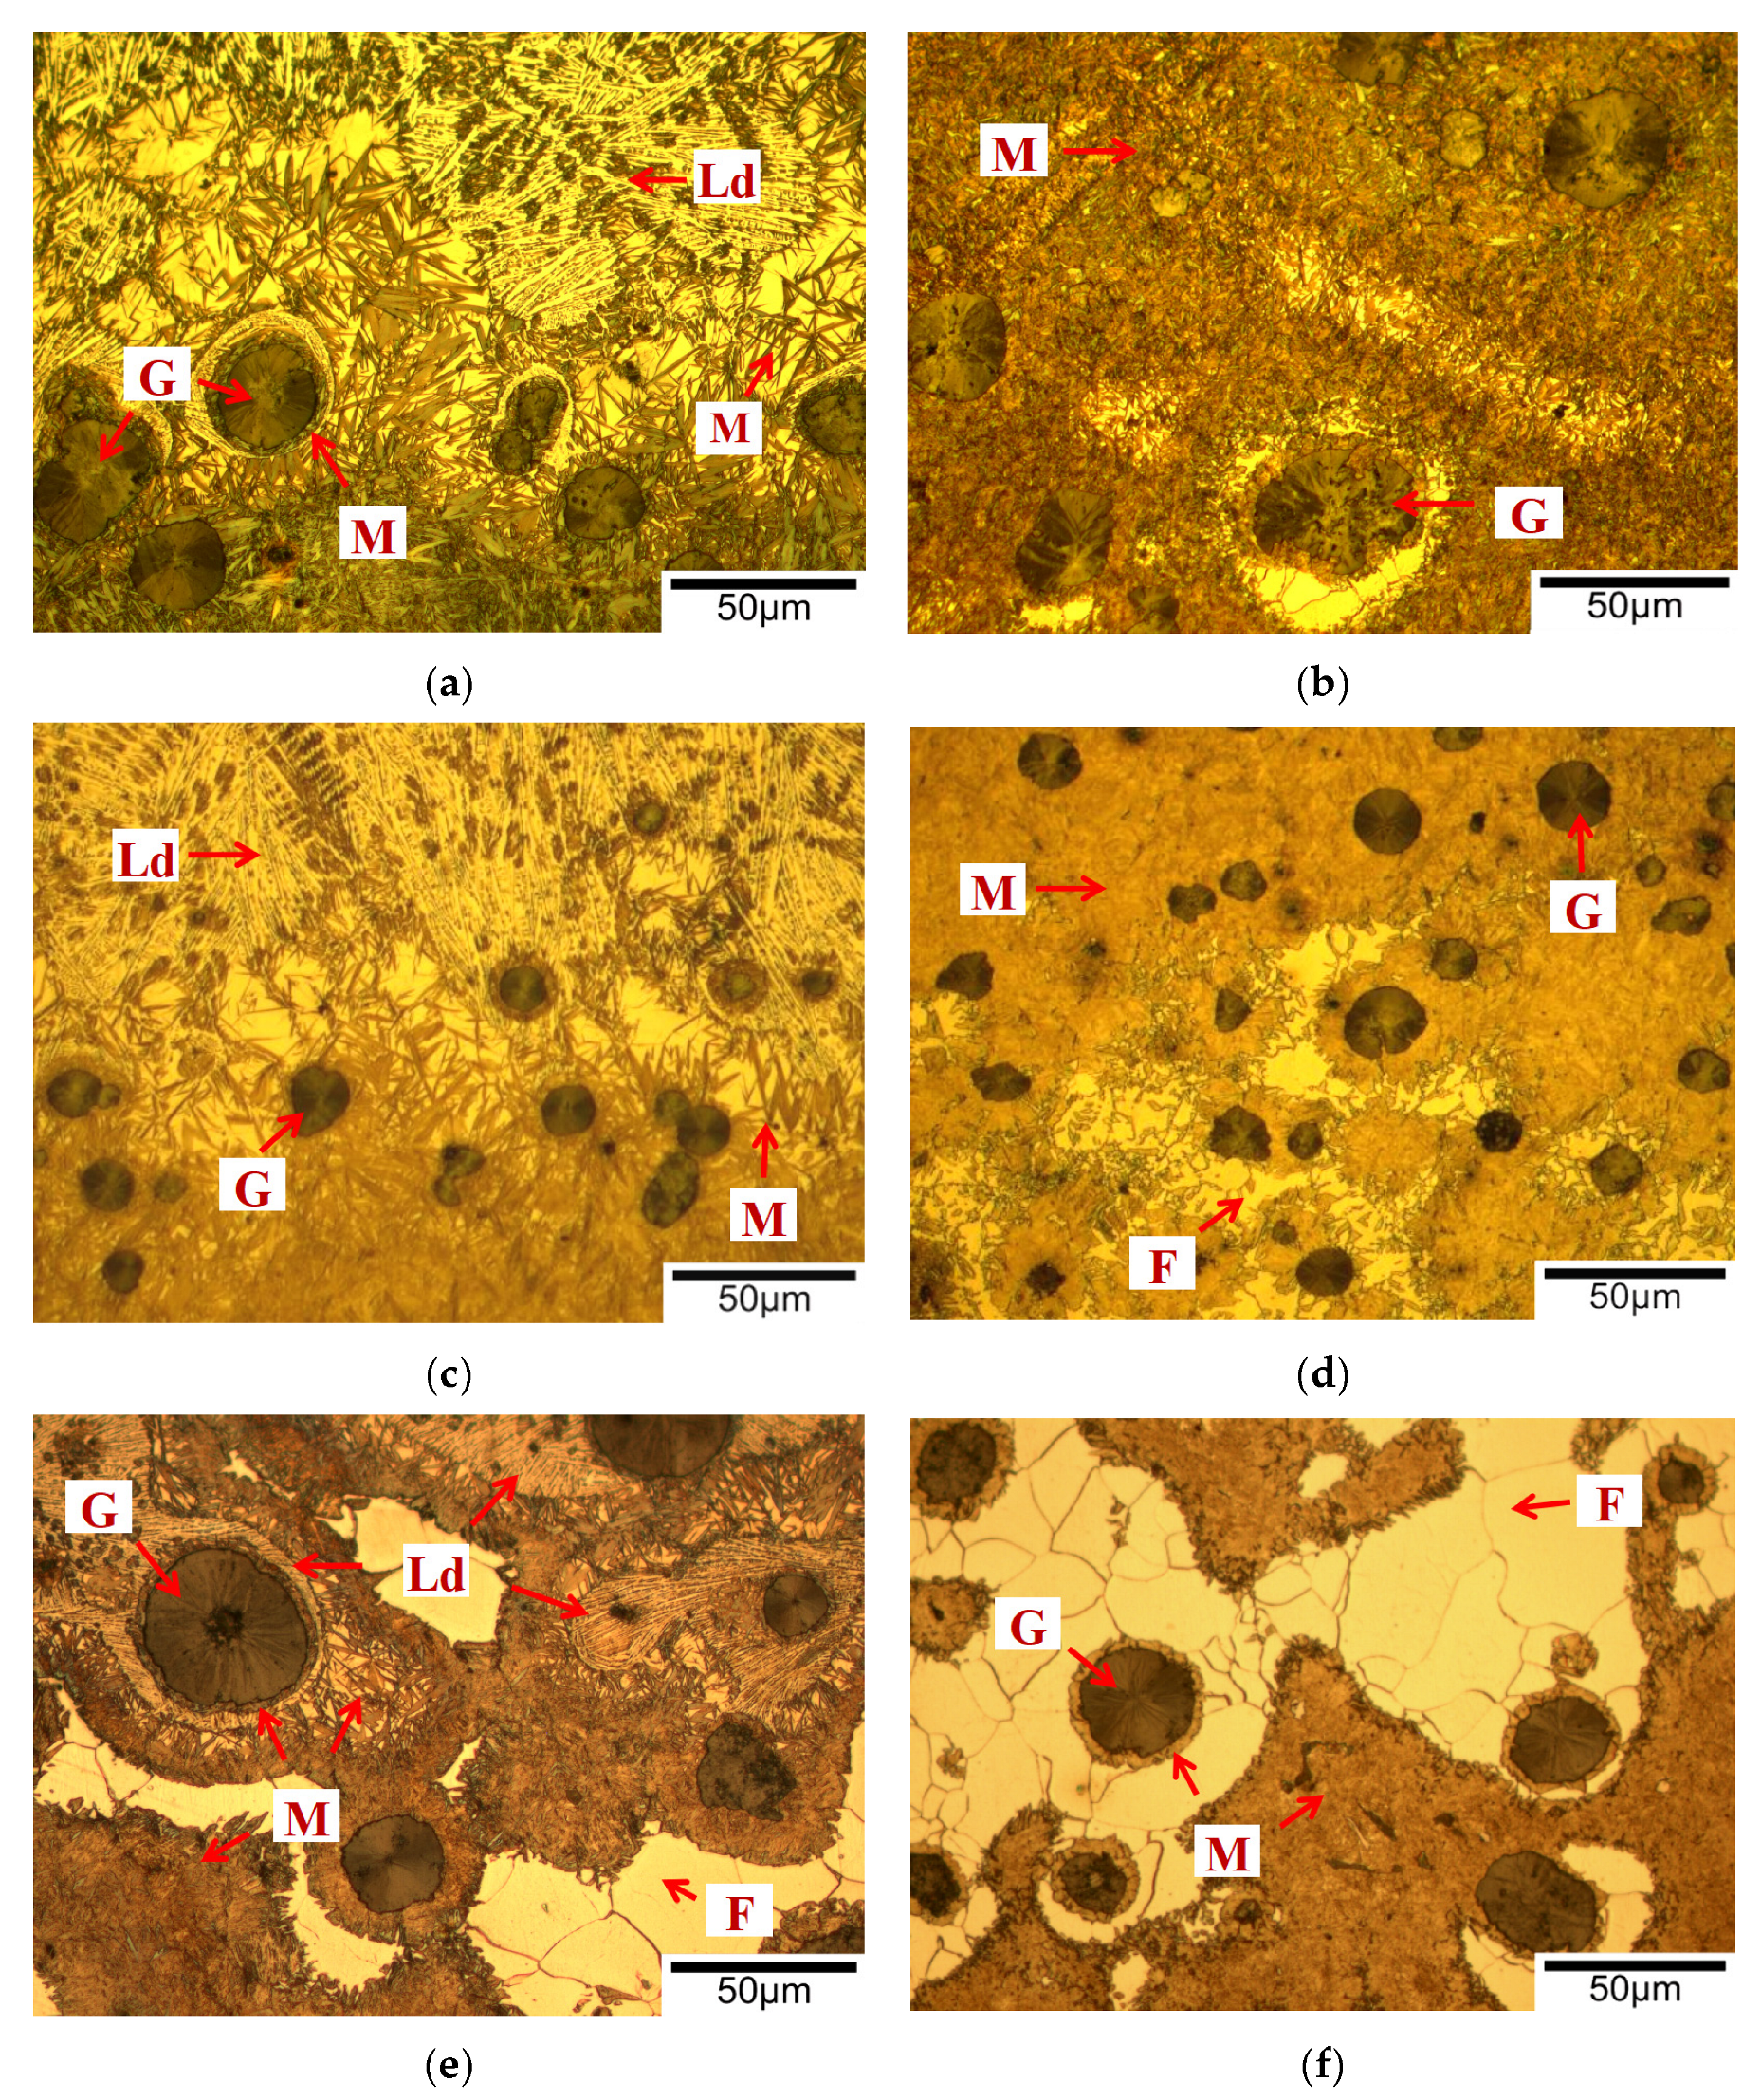
3.1.1. Microstructure Characteristics
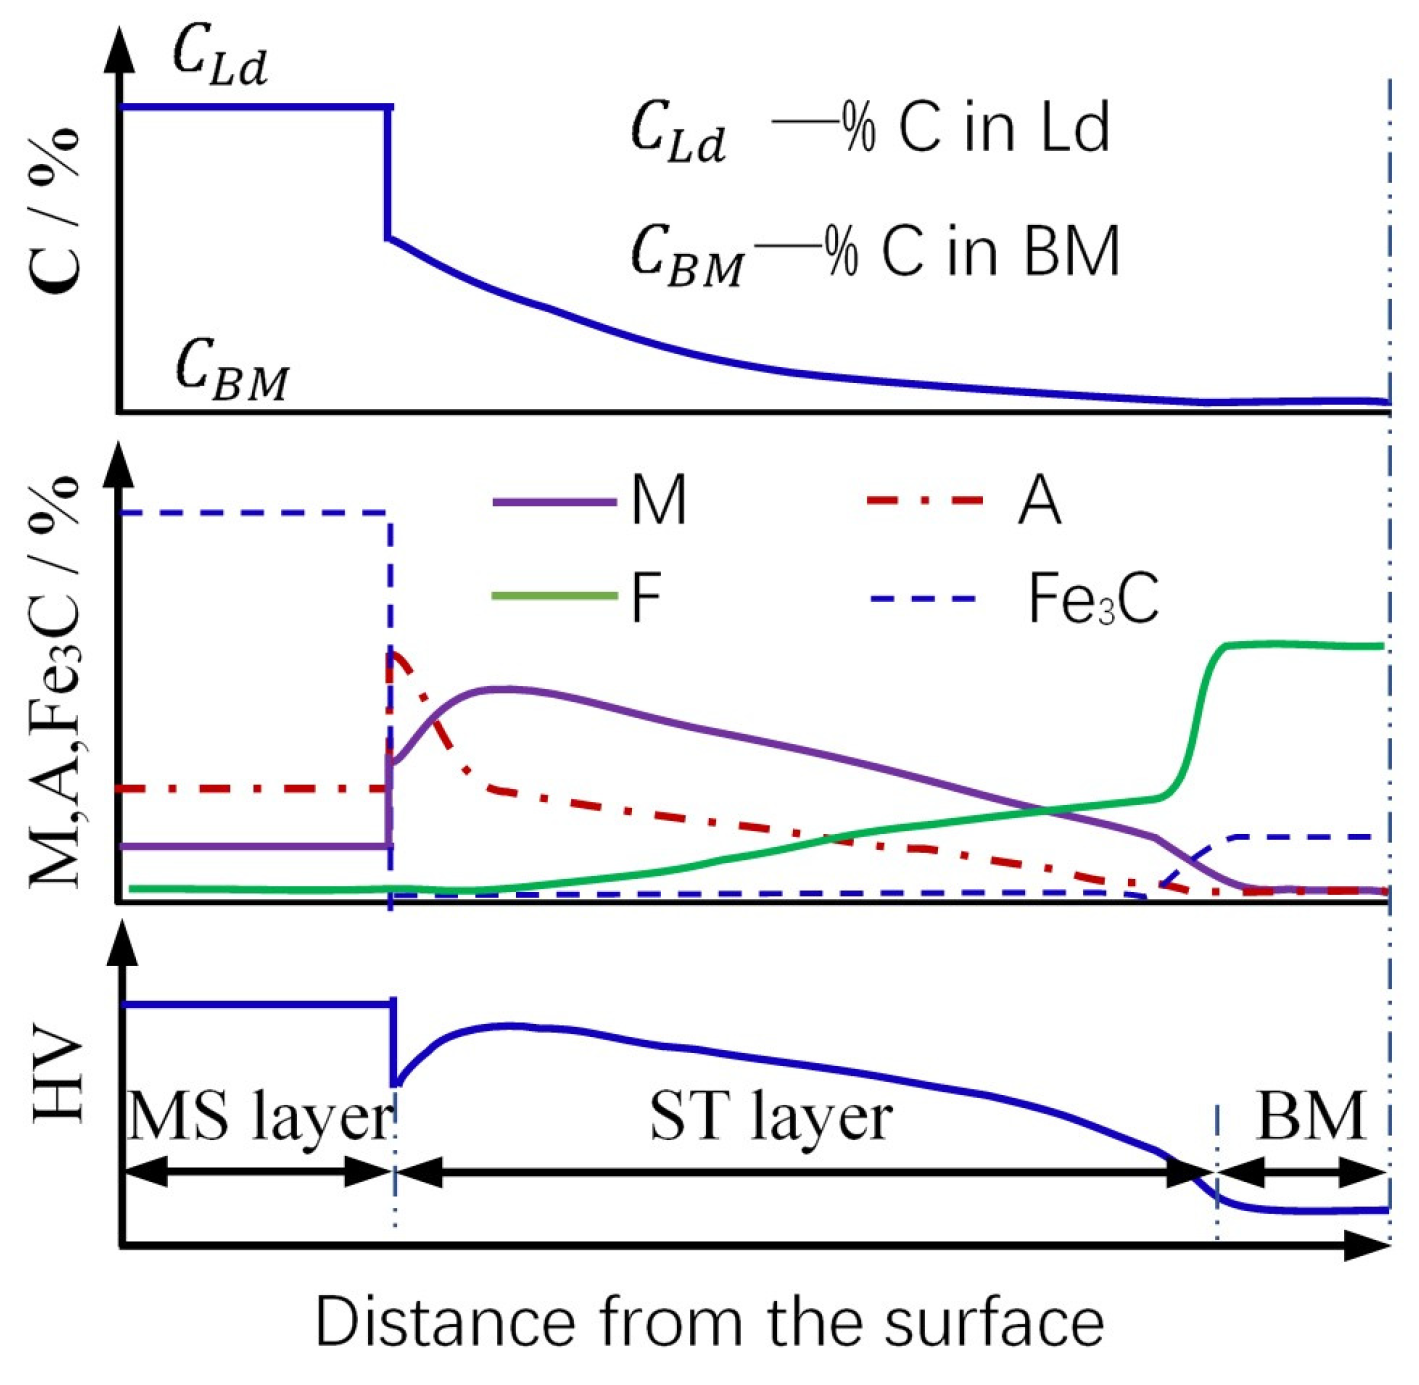
3.1.2. Mechanism of Microstructure Formation
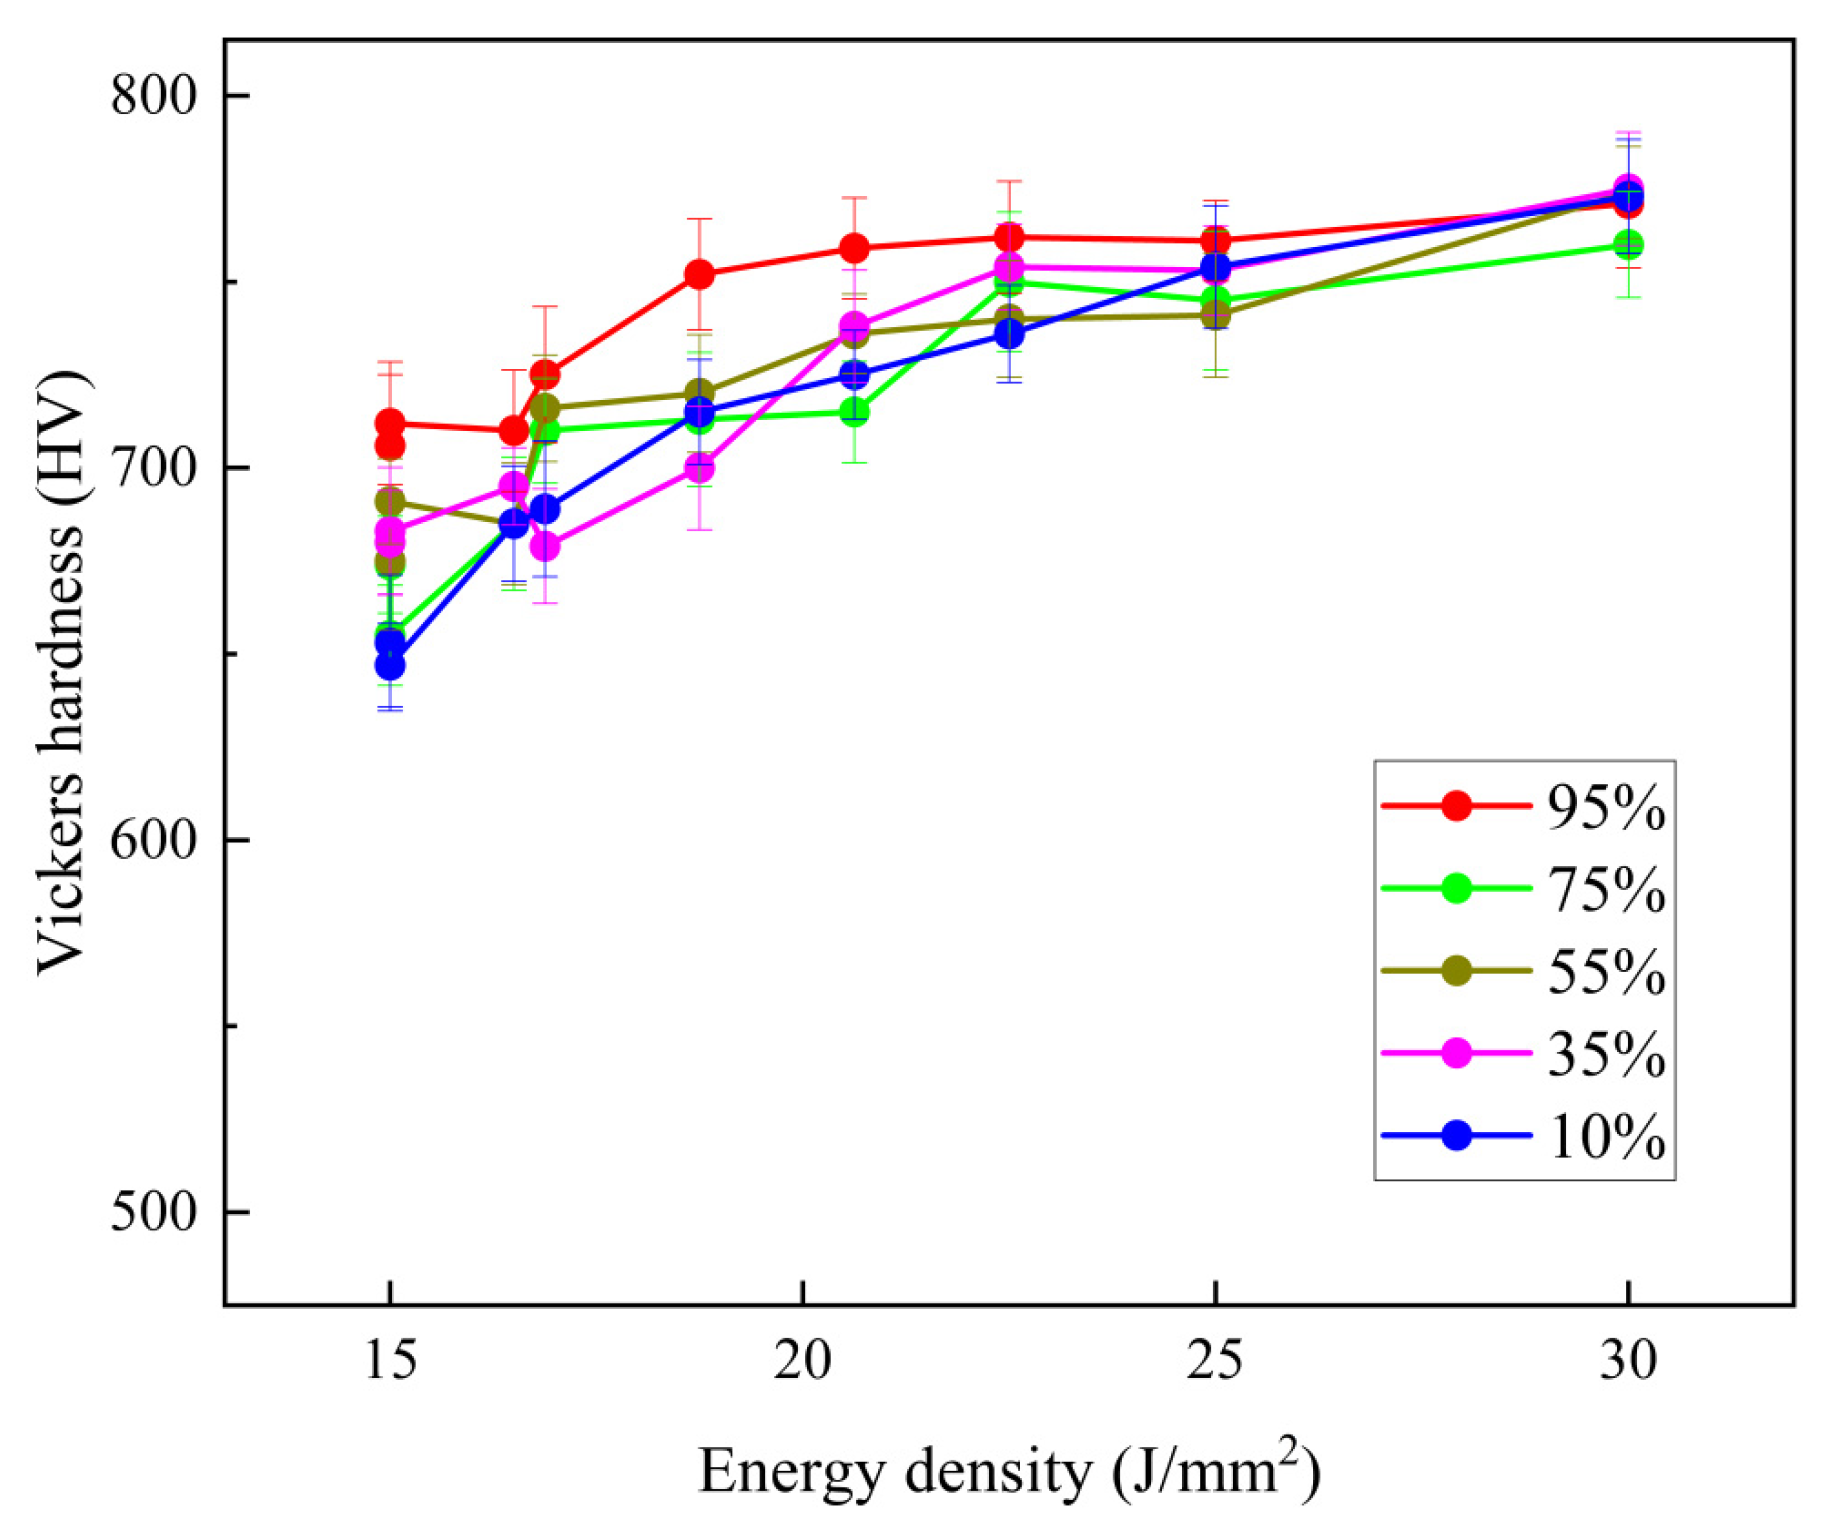
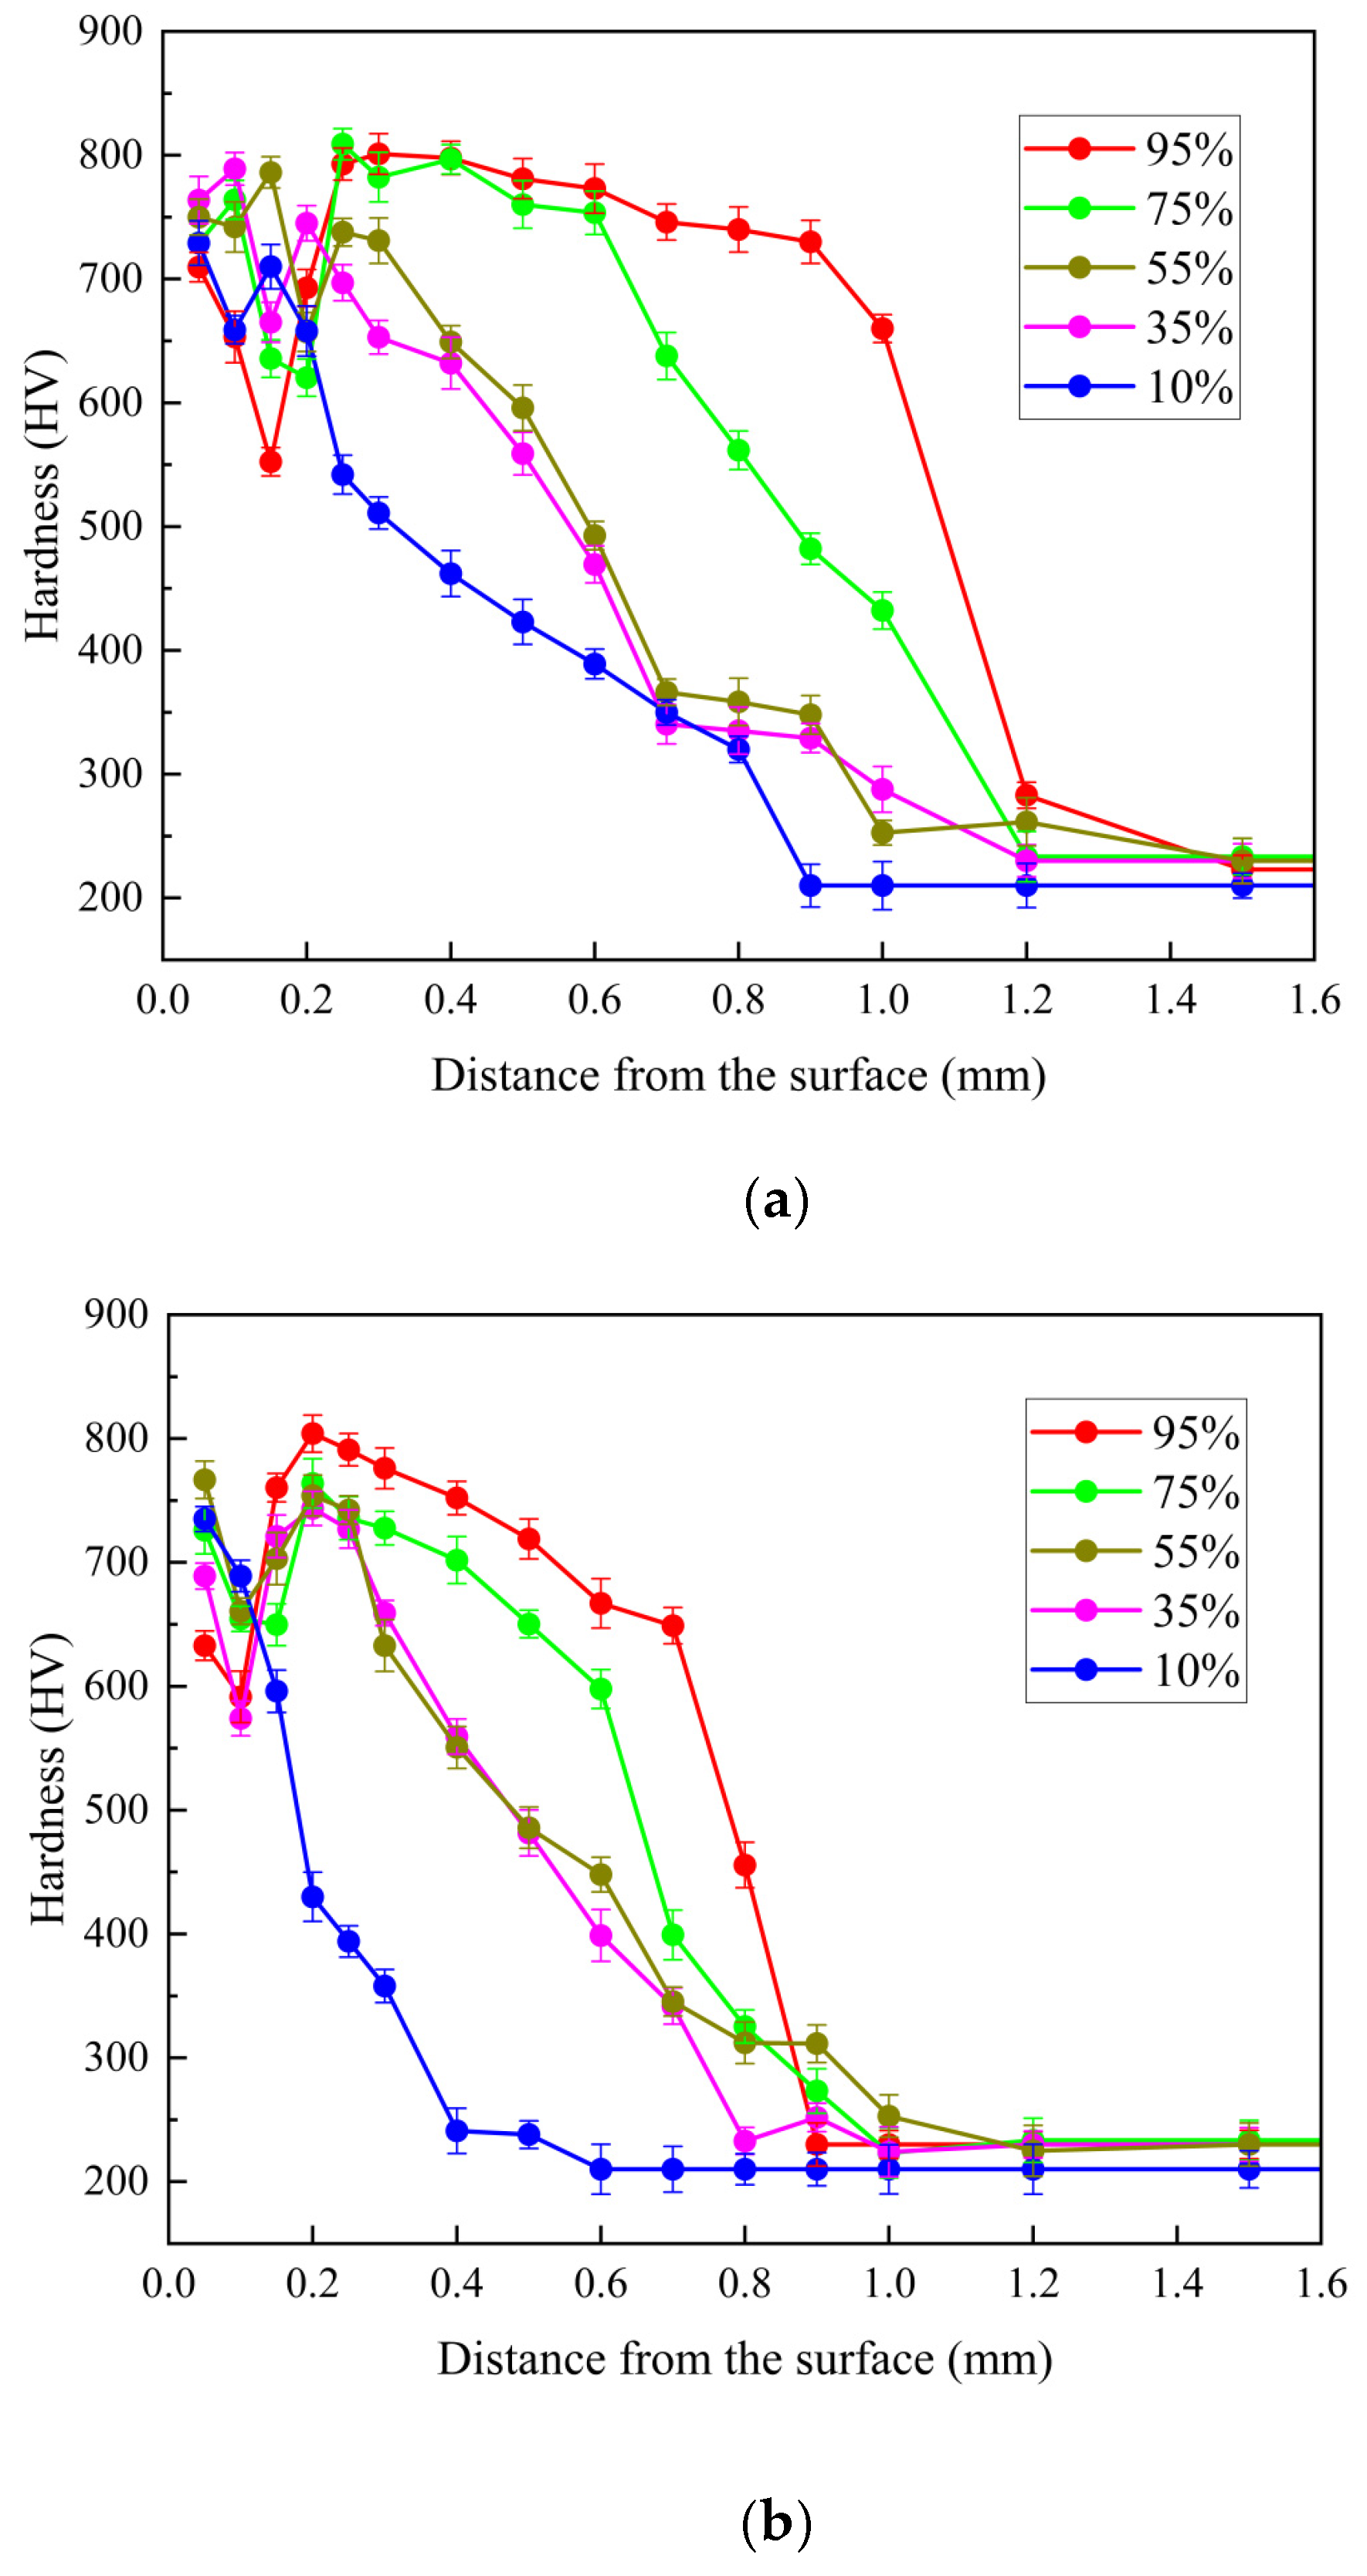
3.2. Hardness of Laser Surface-Treated DCI with Different Pearlite
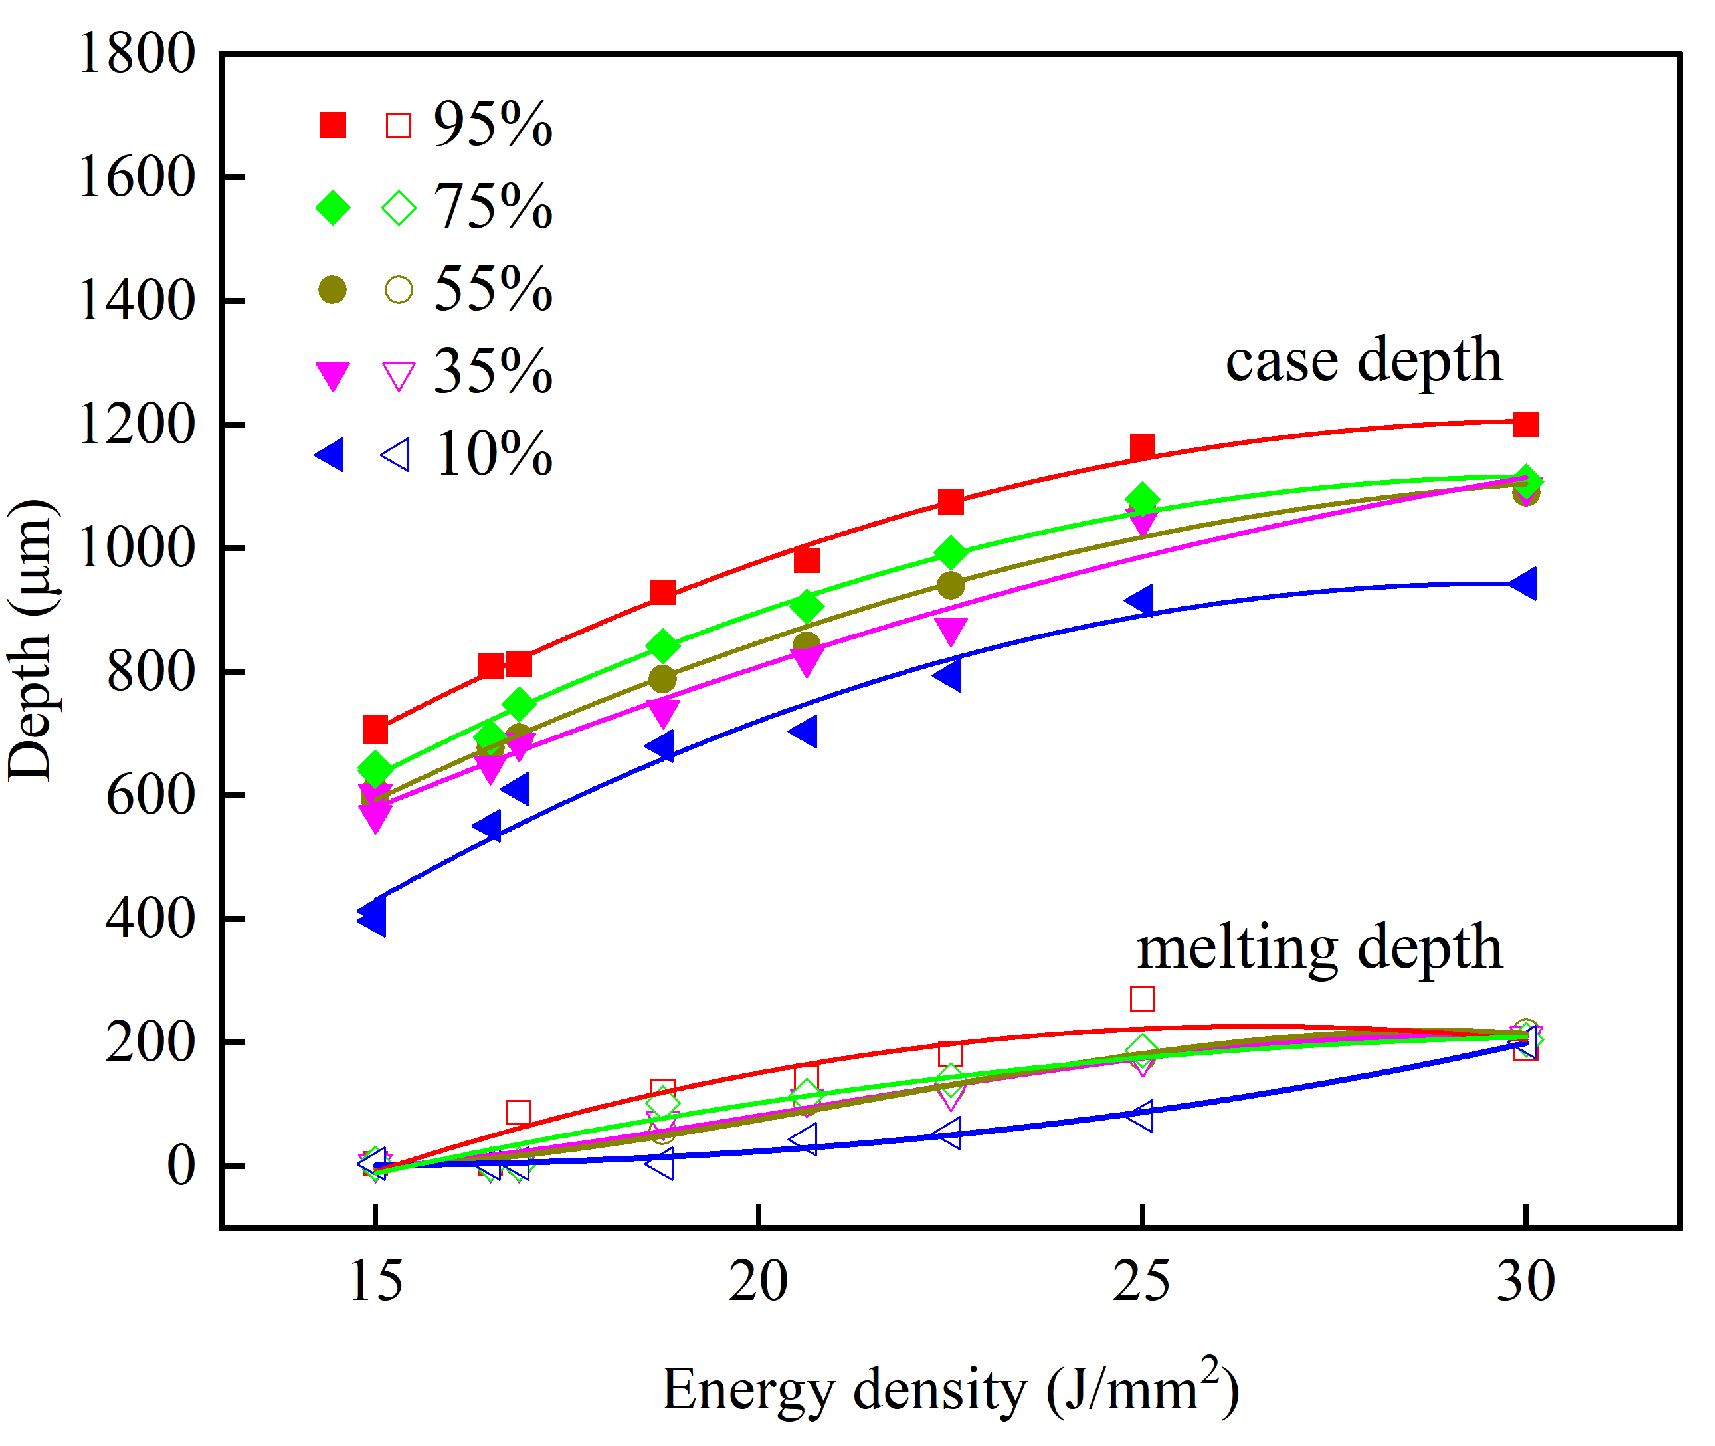
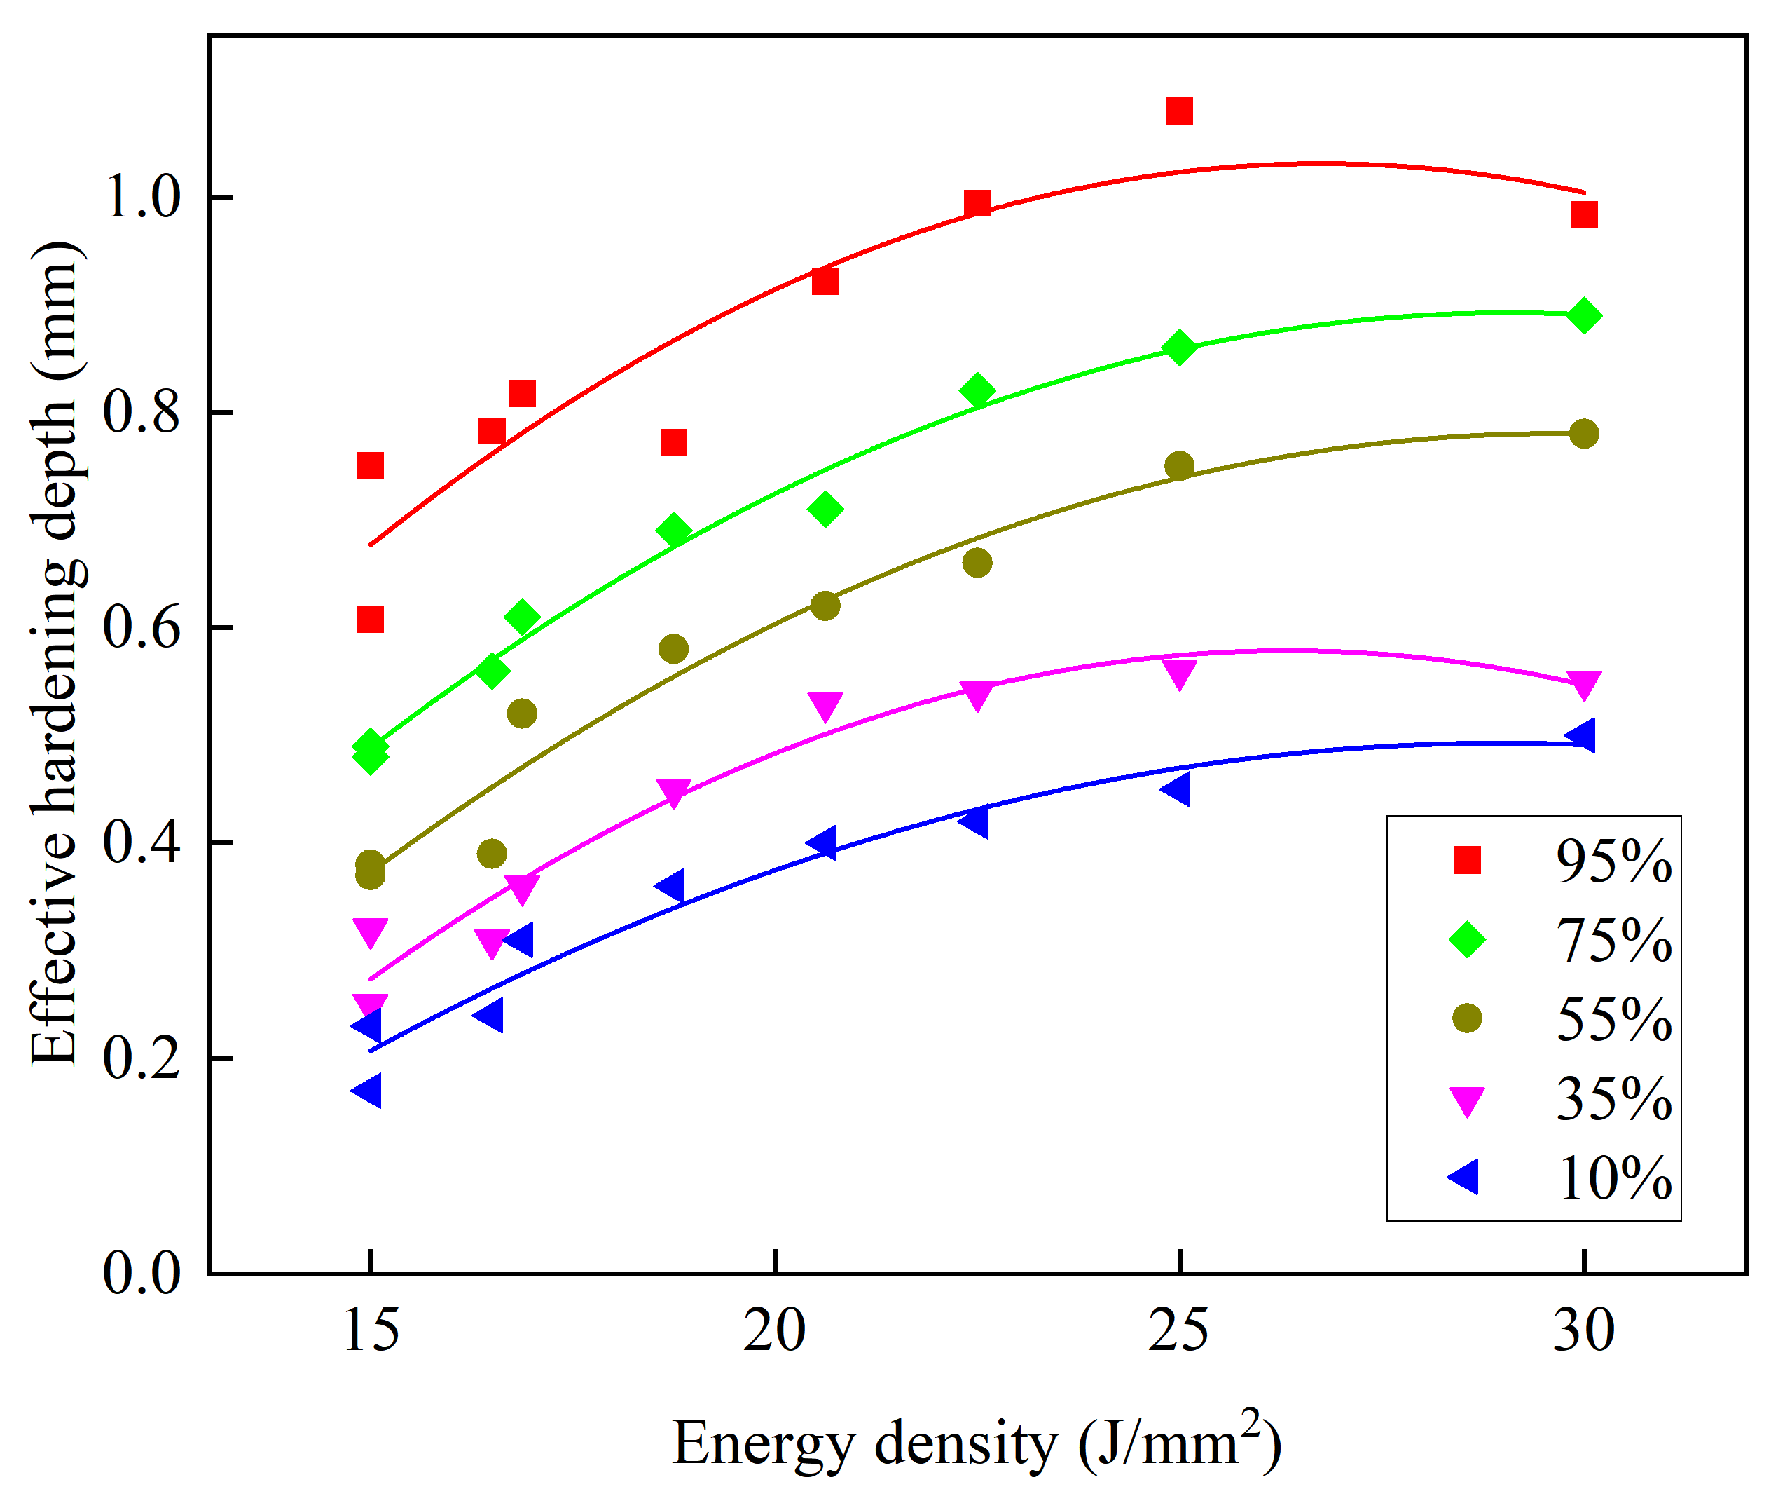
3.3. Hardened Depth of Laser Surface-Treated DCIs with Different Pearlite Contents
3.4. Hardening Ability of DCI with Different Pearlite Contents
4. Conclusions
- The laser MS layer of the DCIs with different pearlite contents has a similar microstructure consisting of fine transformed ledeburite, martensite and residual austenite.
- The microstructure of the SST layer of the DCIs varies with pearlite content. In the pearlite DCI, it is a martensite and residual austenite; in the ferrite–pearlite DCIs it is composed of martensite, ferrite and residual austenite. In the ferrite DCI, there is only a small amount of martensite around the graphite nodule.
- The hardness of the laser MS layer of the DCIs with different pearlite contents has no obvious difference. Within the SST layer, the hardness in the pearlite DCI varies relatively little, but in the ferrite DCI it gradually decreases along the depth. In the transition region between the SST layer and the base metal, there is a steep decrease in hardness in the pearlite DCI, and it decreases gently in the ferrite DCI.
- The increase in pearlite content in DCI slightly raises the hardened depth, but significantly increases the effective hardened depth and the hardening ability. When the pearlite content of DCI increases from 10% to 95%, its hardening ability increases by 1.1 times. From an engineering perspective, to achieve the best laser hardening effects, DCIs with higher pearlite content should be prioritized.
Author Contributions
Funding
Data Availability Statement
Conflicts of Interest
References
- Lacaze, J.; Dawson, S.; Hazotte, A. Cast iron: A historical and green material worthy of continuous research. Int. J. Tech. 2021, 12, 1123–1138. [Google Scholar]
- Tiedje, N.S. Solidification, processing and properties of ductile cast iron. Mater. Sci. Technol. 2010, 26, 505–514. [Google Scholar] [CrossRef]
- Zanardi, F.; Bonollo, F.; Angella, G.; Bonora, N.; Iannitti, G.; Ruggiero, A. A Contribution to New Material Standards for Ductile Irons and Austempered Ductile Irons. Int. J. Metalcast. 2017, 11, 136–147. [Google Scholar] [CrossRef]
- Murcia, S.C.; Paniagua, M.A.; Ossa, E.A. Development of as-cast dual matrix structure (DMS) ductile iron. Mater. Sci. Eng. A 2013, 566, 8–15. [Google Scholar] [CrossRef]
- Gonzaga, R.A. Influence of ferrite and pearlite content on mechanical properties of ductile cast irons. Mater. Sci. Eng. A 2013, 567, 1–8. [Google Scholar] [CrossRef]
- Tartaglia, J.M.; Gundlach, R.B.; Goodrich, G.M. Optimizing structure-property relationships in ductile iron. Int. J. Metalcast. 2014, 8, 7–38. [Google Scholar] [CrossRef]
- Artola, G.; Monzón, A.; Lacaze, J.; Sertucha, J. Tensile properties and fracture toughness at service temperatures of an optimized pearlitic ductile iron alloy for automotive crankshafts. Mater. Sci. Eng. A 2022, 831, 142206. [Google Scholar] [CrossRef]
- Schoenborn, S.; Kaufmann, H.; Sonsino, C.; Heim, R. Variable amplitude fatigue of high-strength cast iron alloys for automotive applications. Int. J. Fatigue 2016, 91, 445–458. [Google Scholar] [CrossRef]
- Podgornik, B.; Vizintin, J.; Thorbjornsson, I.; Johannesson, B.; Thorgrimsson, J.T.; Celis, M.M.; Valle, N. Improvement of ductile iron wear resistance through local surface reinforcement. Wear 2012, 274, 267–273. [Google Scholar] [CrossRef]
- Pagano, N.; Angelini, V.; Ceschini, L.; Campana, G. Laser remelting for enhancing tribological performances of a ductile iron. Procedia CIRP 2016, 41, 987–991. [Google Scholar] [CrossRef]
- Chen, Z.; Yu, X.; Ding, N.; Cong, J.; Sun, J.; Jia, Q.; Wang, C. Wear resistance enhancement of QT700-2 ductile iron crankshaft processed by laser hardening. Opt. Laser Technol. 2023, 164, 109519. [Google Scholar] [CrossRef]
- Dinesh Babu, P.; Balasubramanian, K.R.; Buvanashekaran, G. Laser surface hardening: A review. Int. J. Surf. Sci. Eng. 2011, 5, 131–151. [Google Scholar] [CrossRef]
- Kennedy, E.; Byrne, G.; Collins, D.N. A review of the use of high power diode lasers in surface hardening. J. Mater. Process. Technol. 2004, 155, 1855–1860. [Google Scholar] [CrossRef]
- Abboud, J.H.; Benyounis, K.Y.; Olabi, A.G.; Hashmi, M.S.J. Laser surface treatments of iron-based substrates for automotive application. J. Mater. Process. Technol. 2007, 182, 427–431. [Google Scholar] [CrossRef]
- Ion, J.C. Laser transformation hardening. Surf. Eng. 2002, 18, 14–31. [Google Scholar] [CrossRef]
- Ghaini, F.M.; Ameri, M.H.; Torkamany, M.J. Surface transformation hardening of ductile cast iron by a 600w fiber laser. Optik 2019, 203, 163758. [Google Scholar] [CrossRef]
- Moradi, M.; Moghadam, M.K.; Shamsborhan, M. How the laser beam energy distribution effect on laser surface transformation hardening process; Diode and Nd: YAG lasers. Optik 2020, 204, 163991. [Google Scholar] [CrossRef]
- Janicki, D. Direct diode laser surface melting of nodular cast iron. Appl. Mech. Mater. 2015, 809–810, 423–428. [Google Scholar] [CrossRef]
- Catalán, N.; Ramos-Moore, E.; Boccardo, A.; Celentano, D. Surface laser treatment of cast irons: A review. Metals 2022, 12, 562. [Google Scholar] [CrossRef]
- Mathur, A.K.; Molian, P.A. Laser Heat Treatment of Cast Irons—Optimization of Process Variables: Part I. J. Eng. Mater.-Technol. 1985, 107, 200–207. [Google Scholar] [CrossRef]
- Molian, P.A.; Mathur, A.K. Laser Heat Treatment of Cast Irons—Optimization of Process Variables, Part II. J. Eng. Mater.-Technol. 1986, 108, 233–239. [Google Scholar] [CrossRef]
- Chen, C.H.; Ju, C.P.; Rigsbee, J.M. Laser surface modification of ductile iron: Part 1 microstructure. Mater. Sci. Technol. 1988, 4, 161–166. [Google Scholar] [CrossRef]
- Gadag, S.P.; Srinivasan, M.N.; Mordike, B.L. Effect of laser processing parameters on the structure of ductile iron. Mater. Sci. Eng. A 1995, 196, 145–154. [Google Scholar] [CrossRef]
- Grum, J.; Šturm, R. Comparison of measured and calculated thickness of martensite and ledeburite shells around graphite nodules in the hardened layer of nodular iron after laser surface remelting. Appl. Surf. Sci. 2002, 187, 116–123. [Google Scholar] [CrossRef]
- Al-Sayed, S.R.; Elgazzar, H.; Nofal, A. Metallographic investigation of laser-treated ductile iron surface with different laser heat inputs. Ain Shams Eng. J. 2023, 14, 102189. [Google Scholar] [CrossRef]
- Catalán, N.; Ramos-Moore, E.; Boccardo, A.; Celentano, D.; Alam, N.; Walczak, M.; Gunasegaram, D. Surface Laser Treatment on Ferritic Ductile Iron: Effect of Linear Energy on Microstructure, Chemical Composition, and Hardness. Metall. Mater. Trans. B 2021, 52, 755–763. [Google Scholar] [CrossRef]
- Alabeedi, K.F.; Abboud, J.H.; Benyounis, K.Y. Microstructure and erosion resistance enhancement of nodular cast iron by laser melting. Wear 2009, 266, 925–933. [Google Scholar] [CrossRef]
- Cui, W.; Liu, J.; Zhu, H.; Shi, Y. Investigation on wear resistance of nodular cast iron by laser surface treatment. Mater. Res. Express 2019, 6, 086564. [Google Scholar] [CrossRef]
- Küçük, Y.; Altaş, E.; Topcu, M.E. A comparative analysis of the effect of laser surface treatment on the dry sliding wear behavior of ductile cast irons with different microstructures. Optik 2023, 274, 170540. [Google Scholar] [CrossRef]
- Ceschini, L.; Campana, G.; Pagano, N.; Angelini, V. Effect of laser surface treatment on the dry sliding behaviour of the EN-GJS400-12 ductile cast iron. Tribol. Int. 2016, 104, 342–351. [Google Scholar] [CrossRef]
- Roy, A.; Manna, I. Mathematical modeling of localized melting around graphite nodules during laser surface hardening of austempered ductile iron. Opt. Lasers Eng. 2000, 34, 369–383. [Google Scholar] [CrossRef]
- Boccardo, A.D.; Catalán, N.; Celentano, D.J.; Ramos-Moore, E. A Thermo-metallurgical Model for Laser Surface Engineering Treatment of Nodular Cast Iron. Metall. Mater. Trans. B 2021, 52, 854–870. [Google Scholar] [CrossRef]
- Lasota, I.; Protsenko, V.; Matyushkin, A.; Kuznetsov, M.; Gook, S. Laser surface hardening of engine camshaft cams. Mater. Today Proc. 2020, 30, 478–482. [Google Scholar] [CrossRef]
- Zhan, K.; Zhang, Y.; Bao, L.; Yang, Z.; Zhao, B.; Ji, V. Surface characteristic and wear resistance of QT-700-2 nodular cast iron after laser quenching combing with shot peening treatment. Surf. Coat. Technol. 2021, 423, 127589. [Google Scholar] [CrossRef]
- Theron, M.; Van Rooyen, C.; Malabi, K. Investigation into laser refurbishment and transformation hardening of cast iron forming dies for the automotive industry. J. Laser Appl. 2020, 32, 022071. [Google Scholar] [CrossRef]
- Fernández-Vicente, A.; Pellizzari, M.; Arias, J.L. Feasibility of laser surface treatment of pearlitic and bainitic ductile irons for hot rolls. J. Mater. Process. Technol. 2012, 212, 989–1002. [Google Scholar] [CrossRef]
- GB/T 9441-2021; Metallographic Test Method for Spheroidal Graphite Cast Iron. National Standards Committee: Beijing, China, 2021.
- GB/T 18683-2002; Laser Surface Hardening of Iron and Steel Parts. National Standards Committee: Beijing, China, 2021.
- Li, S.; Enomoto, M.; Yang, Z.-G. Study of partition to non-partition transition of austenite growth along pearlite lamellae in near-eutectoid Fe-C-Mn alloy. Acta Mater. 2019, 177, 198–208. [Google Scholar] [CrossRef]
- Holmgren, D. Review of thermal conductivity of cast iron. Int. J. Cast Met. Res. 2005, 18, 331–345. [Google Scholar] [CrossRef]
- Ameri, M.H.; Ghaini, F.M.; Torkamany, M.J. Investigation into the efficiency of a fiber laser in surface hardening of ICD-5 tool steel. Opt. Laser Technol. 2018, 107, 150–157. [Google Scholar] [CrossRef]
- Maharjan, N.; Wu, N.; Zhou, W. Hardening efficiency and microstructural changes during laser surface hardening of 50CrMo4 steel. Metals 2021, 11, 2015. [Google Scholar] [CrossRef]


| C | Si | Mn | Cu | Fe |
|---|---|---|---|---|
| 3.45~3.65 | 2.10~3.12 | 0.18~0.28 | as required | balance |
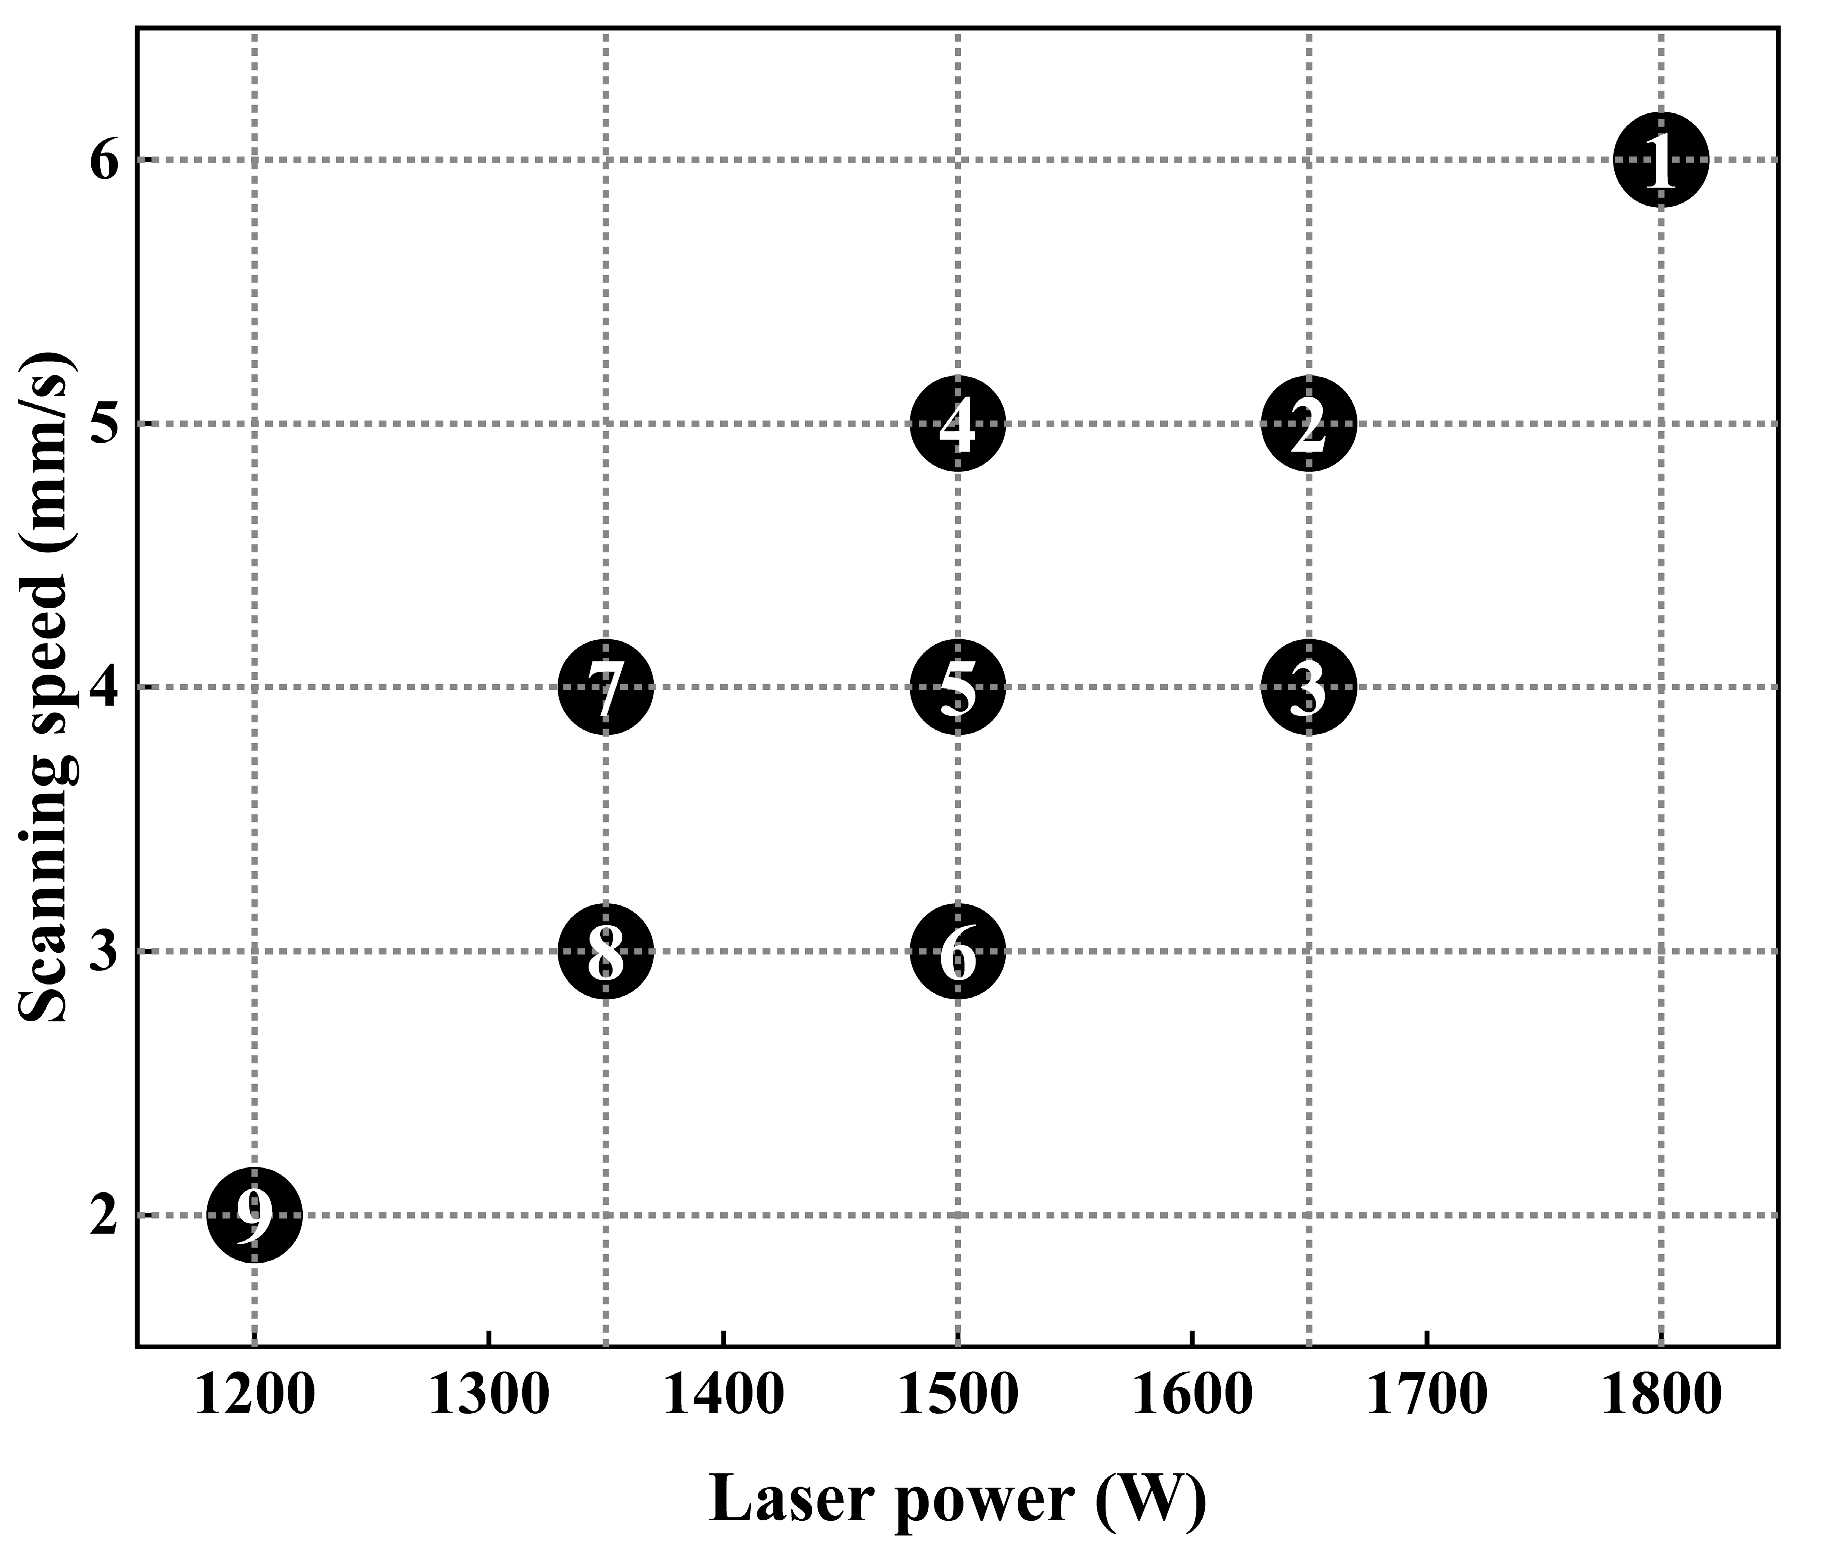
| P (W) | V (mm/s) | E (J/mm2) | |
|---|---|---|---|
| 1 | 1800 | 6 | 15.0 |
| 2 | 1650 | 5 | 16.5 |
| 3 | 1650 | 4 | 20.6 |
| 4 | 1500 | 5 | 15.0 |
| 5 | 1500 | 4 | 18.8 |
| 6 | 1500 | 3 | 25.0 |
| 7 | 1350 | 4 | 16.9 |
| 8 | 1350 | 3 | 22.5 |
| 9 | 1200 | 2 | 30.0 |
Disclaimer/Publisher’s Note: The statements, opinions and data contained in all publications are solely those of the individual author(s) and contributor(s) and not of MDPI and/or the editor(s). MDPI and/or the editor(s) disclaim responsibility for any injury to people or property resulting from any ideas, methods, instructions or products referred to in the content. |
© 2025 by the authors. Licensee MDPI, Basel, Switzerland. This article is an open access article distributed under the terms and conditions of the Creative Commons Attribution (CC BY) license (https://creativecommons.org/licenses/by/4.0/).
Share and Cite
Wang, Z.; Zhou, X.; Zeng, D.; Yang, W.; Liu, J.; Shi, Q. Comparison of Microstructure and Hardening Ability of DCI with Different Pearlite Contents by Laser Surface Treatment. Metals 2025, 15, 734. https://doi.org/10.3390/met15070734
Wang Z, Zhou X, Zeng D, Yang W, Liu J, Shi Q. Comparison of Microstructure and Hardening Ability of DCI with Different Pearlite Contents by Laser Surface Treatment. Metals. 2025; 15(7):734. https://doi.org/10.3390/met15070734
Chicago/Turabian StyleWang, Zile, Xianmin Zhou, Daxin Zeng, Wei Yang, Jianyong Liu, and Qiuyue Shi. 2025. "Comparison of Microstructure and Hardening Ability of DCI with Different Pearlite Contents by Laser Surface Treatment" Metals 15, no. 7: 734. https://doi.org/10.3390/met15070734
APA StyleWang, Z., Zhou, X., Zeng, D., Yang, W., Liu, J., & Shi, Q. (2025). Comparison of Microstructure and Hardening Ability of DCI with Different Pearlite Contents by Laser Surface Treatment. Metals, 15(7), 734. https://doi.org/10.3390/met15070734