Article

Laser Powder Bed Fusion of a Ti-16Nb-Based Alloy: Processability, Microstructure, and Mechanical Properties

by
Azim Gökçe
1,2,*,
Vamsi Krishna Balla
1,3,
Subrata Deb Nath
1,†,
Arulselvan Arumugham Akilan
1 and
Sundar V. Atre
1
1
Materials Innovation Guild, Department of Mechanical Engineering, University of Louisville, Louisville, KY 40208, USA
2
Department of Metallurgical and Materials Engineering, Technology Faculty, Sakarya University of Applied Sciences, Sakarya 54187, Turkey
3
Biomaterials and Medical Devices Division, CSIR-Central Glass & Ceramics Research Institute (CSIR-CGCRI), 196 Raja S.C. Mullick Road, Kolkata 700032, India
*
Author to whom correspondence should be addressed.
Current address: GE Honda Aero Engines, LLC., 2987 Tucker Street, Burlington, NC 27215, USA.
Metals 2025, 15(7), 728; https://doi.org/10.3390/met15070728
Submission received: 6 May 2025 / Revised: 16 June 2025 / Accepted: 17 June 2025 / Published: 29 June 2025
(This article belongs to the Section Additive Manufacturing)

Abstract

Titanium alloys, especially Ti6Al4V, are widely used in biomedical implants due to their biocompatibility and mechanical strength. However, their high elastic modulus (>100 GPa), compared to that of human bone (10–30 GPa), often causes stress shielding, reducing implant lifespan. To address this, titanium alloys with lower elastic modulus are under development. In this study, Ti-based multi-element alloy with 16 wt.% Nb samples were fabricated using laser powder bed fusion (L-PBF) from a premixed powder blend of Ti6Al4V and Nb-Hf-Ti. Processing high-melting Nb-based alloys via L-PBF poses challenges, which were mitigated through optimized parameters, including a maximum laser power of 100 W. Eleven parameter sets were employed to evaluate printability, microstructure, and mechanical properties. Microstructural analysis revealed Widmanstätten structures composed of α and β phases, along with isolated spherical pores. Reduced hatch spacing and slower laser speed led to increased hardness. The highest hardness (~43 HRC) was observed at the highest energy density (266 J/mm3), while the lowest (~28 HRC) corresponded to 44 J/mm3. Elastic modulus values ranged from 30 to 35 GPa, closely matching that of bone. These results demonstrate the potential of the developed Ti-based alloy containing 16 wt.% Nb as a promising candidate for load-bearing biomedical implants.

Graphical Abstract

1. Introduction

Titanium and its alloys are among the most preferred material groups for implant production due to their excellent biocompatibility and favorable mechanical strength [1,2]. While various types of titanium alloys are used as biomaterials, β-type Ti alloys have been gaining increasing attention owing to their lower elastic modulus [3,4]. Among these, Ti6Al4V (also known as Ti64) is the most widely used titanium alloy because of its high strength, low density, superior fracture toughness, excellent corrosion resistance, and biocompatibility. It is utilized in a wide range of applications, from aerospace to biomedical industries [5,6]. Previous studies have shown that a significant mismatch between the elastic modulus of the implant and that of bone can lead to a stress shielding effect [7,8,9]. However, the elastic modulus of most common implant materials is notably higher than that of human cortical bone (10–30 GPa [10]). For instance, Ti6Al4V has an elastic modulus exceeding 100 GPa, while 316L stainless steel reaches approximately 205 GPa [11]. The elastic modulus of Ti-based components can be reduced either through structural design or alloy modification. One common approach involves creating porous structures via evaporation of certain additives during manufacturing [12,13,14,15]. However, it has been reported that porous structures often exhibit inferior corrosion resistance compared to their dense counterparts [16]. An alternative strategy is the addition of β-stabilizing elements such as Nb [17], Ta [18], and Mo [19]. However, since the melting temperatures of Ta (3017 °C) and Mo (2623 °C) are significantly higher than that of Nb (2477 °C) and so it is more difficult to use those metals as alloying elements in the studies using elemental metal powders instead of pre-alloyed ones.
Powder metallurgy (PM) methods offer design engineers several advantages, such as near-net-shape production, efficient material utilization, and reduced energy consumption [20]. Additionally, PM facilitates the alloying of elements with different melting points. Laser powder bed fusion (L-PBF), an emerging technology that utilizes particulate materials, enables customized production of biomedical implants [21]. L-PBF allows for the fabrication of components with high-resolution features, internal channels, and precise dimensional control [22]. Although the production of Ti6Al4V parts has been extensively studied in the literature, research on the laser processing of Ti-Nb alloys remains limited. Fischer et al. [23] investigated the properties of Ti38Nb alloy produced using selective laser melting (SLM) and reported a fully β-Ti microstructure when a high energy input (412 J) was applied. Schwab et al. [24] found that higher energy input during the SLM process led to higher part strength in their study on the SLM processing of pre-alloyed Ti45Nb powders. Wang et al. [25] examined the effects of Nb content on the properties of SLM-processed Ti-Nb alloys and reported an elastic modulus of 18.7 GPa for the Ti25Nb alloy. Vrancken et al. [26] studied the properties of a Ti6Al4V–10% Mo alloy produced via SLM and observed a reduction in elastic modulus from 103 GPa to 73 GPa. Although the laser power used in these studies ranged from 120 to 400 W, the commonly preferred range is 200–400 W. However, it has been reported that such high laser powers may reduce mechanical properties due to factors such as increased grain size, residual stresses, and an inhomogeneous microstructure [27].
Our previous studies [12,13,16,17,28,29,30,31] demonstrated that Ti-Nb-based alloys produced via press-sintering or powder injection molding routes can be promising alternatives to conventional implant materials, and that their biocompatibility can be further enhanced through various surface modification methods [12,13,32]. For instance, a study on Ti16Nb [32] demonstrated that this alloy is an excellent substrate for bioactive coatings such as HA, HA-GO, and HA-GO-COL. Another study [13] showed that the addition of Nb to titanium promotes the formation of a more bioactive surface by enhancing the deposition of hydroxyapatite (HAP) on its surface. The aim of this study is to examine the properties of a Ti-Nb alloy produced using a laser powder bed fusion (L-PBF) system with a laser power of 100 W in order to mitigate the adverse effects associated with higher laser power. Ti6Al4V and C-103 powders were used as raw materials, and the effects of L-PBF process parameters on the properties of the resulting alloy were investigated using metallurgical analysis techniques.

2. Materials and Methods

The commercially available powders, with compositions shown in Table 1 were supplied by Praxair Surface Technologies, Indianapolis, IN, USA (Ti6Al4V), and Nova Electronic Materials Inc., Albany, OR, USA (C-103). The Ti6Al4V powders have a reported size range of −325 mesh to +635 mesh (−43 to +20 µm), according to the manufacturer’s data. The C-103 powders have a reported size of −400 mesh (−37 µm).
An appropriate amount (82 wt.% Ti6Al4V-18 wt.% C-103) of each powder was measured and combined in a plastic container to produce a Ti-16Nb-5Al-3V-2Hf alloy. A Mettler Toledo XS104 analytical balance (Greifensee, Switzerland) was used to measure the powder weights with an accuracy of 0.0001 g. The apparent densities of both the elemental and mixed powders were determined according to the ASTM B212 standard [33]. Tap densities were measured using the ASTM B527 standard [34] with an AIMSizer AS-100 Tap Density Meter (Beijing, China). The homogeneity of the powder mixture was confirmed by elemental mapping via energy-dispersive X-ray spectroscopy (EDS) conducted after mixing, which demonstrated a uniform distribution of the constituent elements. To minimize the risk of segregation due to the significant density difference between the powders, the mixed powders were stored in a stable, vibration-free environment after mixing and remained undisturbed until the laser powder bed fusion (L-PBF) process was initiated.
Theoretical density measurements were performed using a Micromeritics AccuPyc II 1340 gas pycnometer (Norcross, GA, USA) under a high-purity nitrogen atmosphere.
The specimens were produced using a Concept Laser Mlab Cusing R L-PBF machine (Lichtenfels, Germany). The machine was equipped with a Yb-fiber laser operating at a wavelength of 1050 nm, capable of delivering a maximum power of 100 W with a 50 µm beam diameter. The L-PBF experiments utilized specific process parameters, including laser power, scan speed, layer thickness, and hatch spacing, as detailed in Table 2.
It should be noted that the energy densities of the samples were calculated using Equation (1). The energy density, E (J/mm3), is defined as shown in Equation (1), where “P” is laser power (W), “v” is scan speed (mm/s), “h” is hatch spacing (mm), and “t” is layer thickness (mm) [35]. Layer thickness and power values were held constant at 20 µm and 96 W, respectively, based on the prior experience of the research group [36,37,38].
E = P v × h × t
A titanium build plate was used as the substrate, and a Y-shaped rubber coater blade was employed to spread the powders from the dose chamber to the build chamber. A low-oxygen atmosphere was maintained by evacuating the air in the chamber and filling it with argon immediately. Eleven cube samples were produced using the parameters provided in Table 2.
A constant scan strategy was applied, following a line pattern with alternating layers oriented at −45° and +45° for all specimens. SolidWorks 2018 Version 26 (Dassault Systèmes) was used to create the CAD models and 2D drawings of the samples (Figure 1). AutoFab software Version 1.4 Build 7417 (Marcam Engineering Gmbh, Bremen, Germany) was used to slice the modeled coupons and control the parameters listed in Table 2.
The densities of the printed samples were measured using the Archimedes method, employing a density kit attached to an analytical balance. The theoretical density percentage of the samples was calculated using the equation provided below.
%   T D = ρ p a r t ρ a l l o y × 100
The surface roughness of the samples was measured using a Mitutoyo SJ-210 surface profilometer (Kanagawa, Japan) in accordance with the ISO 4287:1997 standard [39]. The XY section (perpendicular to the build direction) of the samples was inspected during metallographic analyses. Samples for microstructural characterization were prepared following standard metallographic procedures. Grinding was performed with SiC paper with grit sizes ranging from 120 to 800 under flowing tap water. The samples were then polished using Dialub Purple Lubricant (Buckinghamshire, UK) and 0.05 µm Siamat Colloidal Silica (Antony, France). Optical microscopy was conducted with an Olympus BX51 light microscope (Tokyo, Japan) equipped with polarized light and synchronized with image analysis software. A Tescan Vega 3 Scanning Electron Microscope (Brno, Czech Republic), equipped with an EDAX analyzer, was used to image the raw powders and printed samples. The samples were analyzed under operating conditions with accelerating voltages between 10 and 20 kV and a beam spot size ranging from 10 to 20 µm.
X-ray diffraction (XRD) analyses were conducted using a Bruker D8 XRD analyzer (Karlsruhe, Germany) equipped with a copper X-ray source. Version 4.0 of the Eva software was used to analyze the obtained XRD patterns. Mechanical tests were performed in accordance with ASTM E8-16a [40] using an MTS hydraulic tensile testing machine equipped with a 100 kN load cell. A strain rate of 0.001 s−1 was applied, and strain was measured using an extensometer. Tensile test data were utilized to generate stress–strain curves and determine Young’s modulus. Each measurement was based on four samples. The hardness of the specimens was measured using the Rockwell ‘C’ scale under a load of 150 kg. Since the specimens were printed in a horizontal orientation, hardness measurements were taken on the top surface. Ten hardness measurements were recorded for each sample.

3. Results and Discussions

3.1. Powder Characteristics

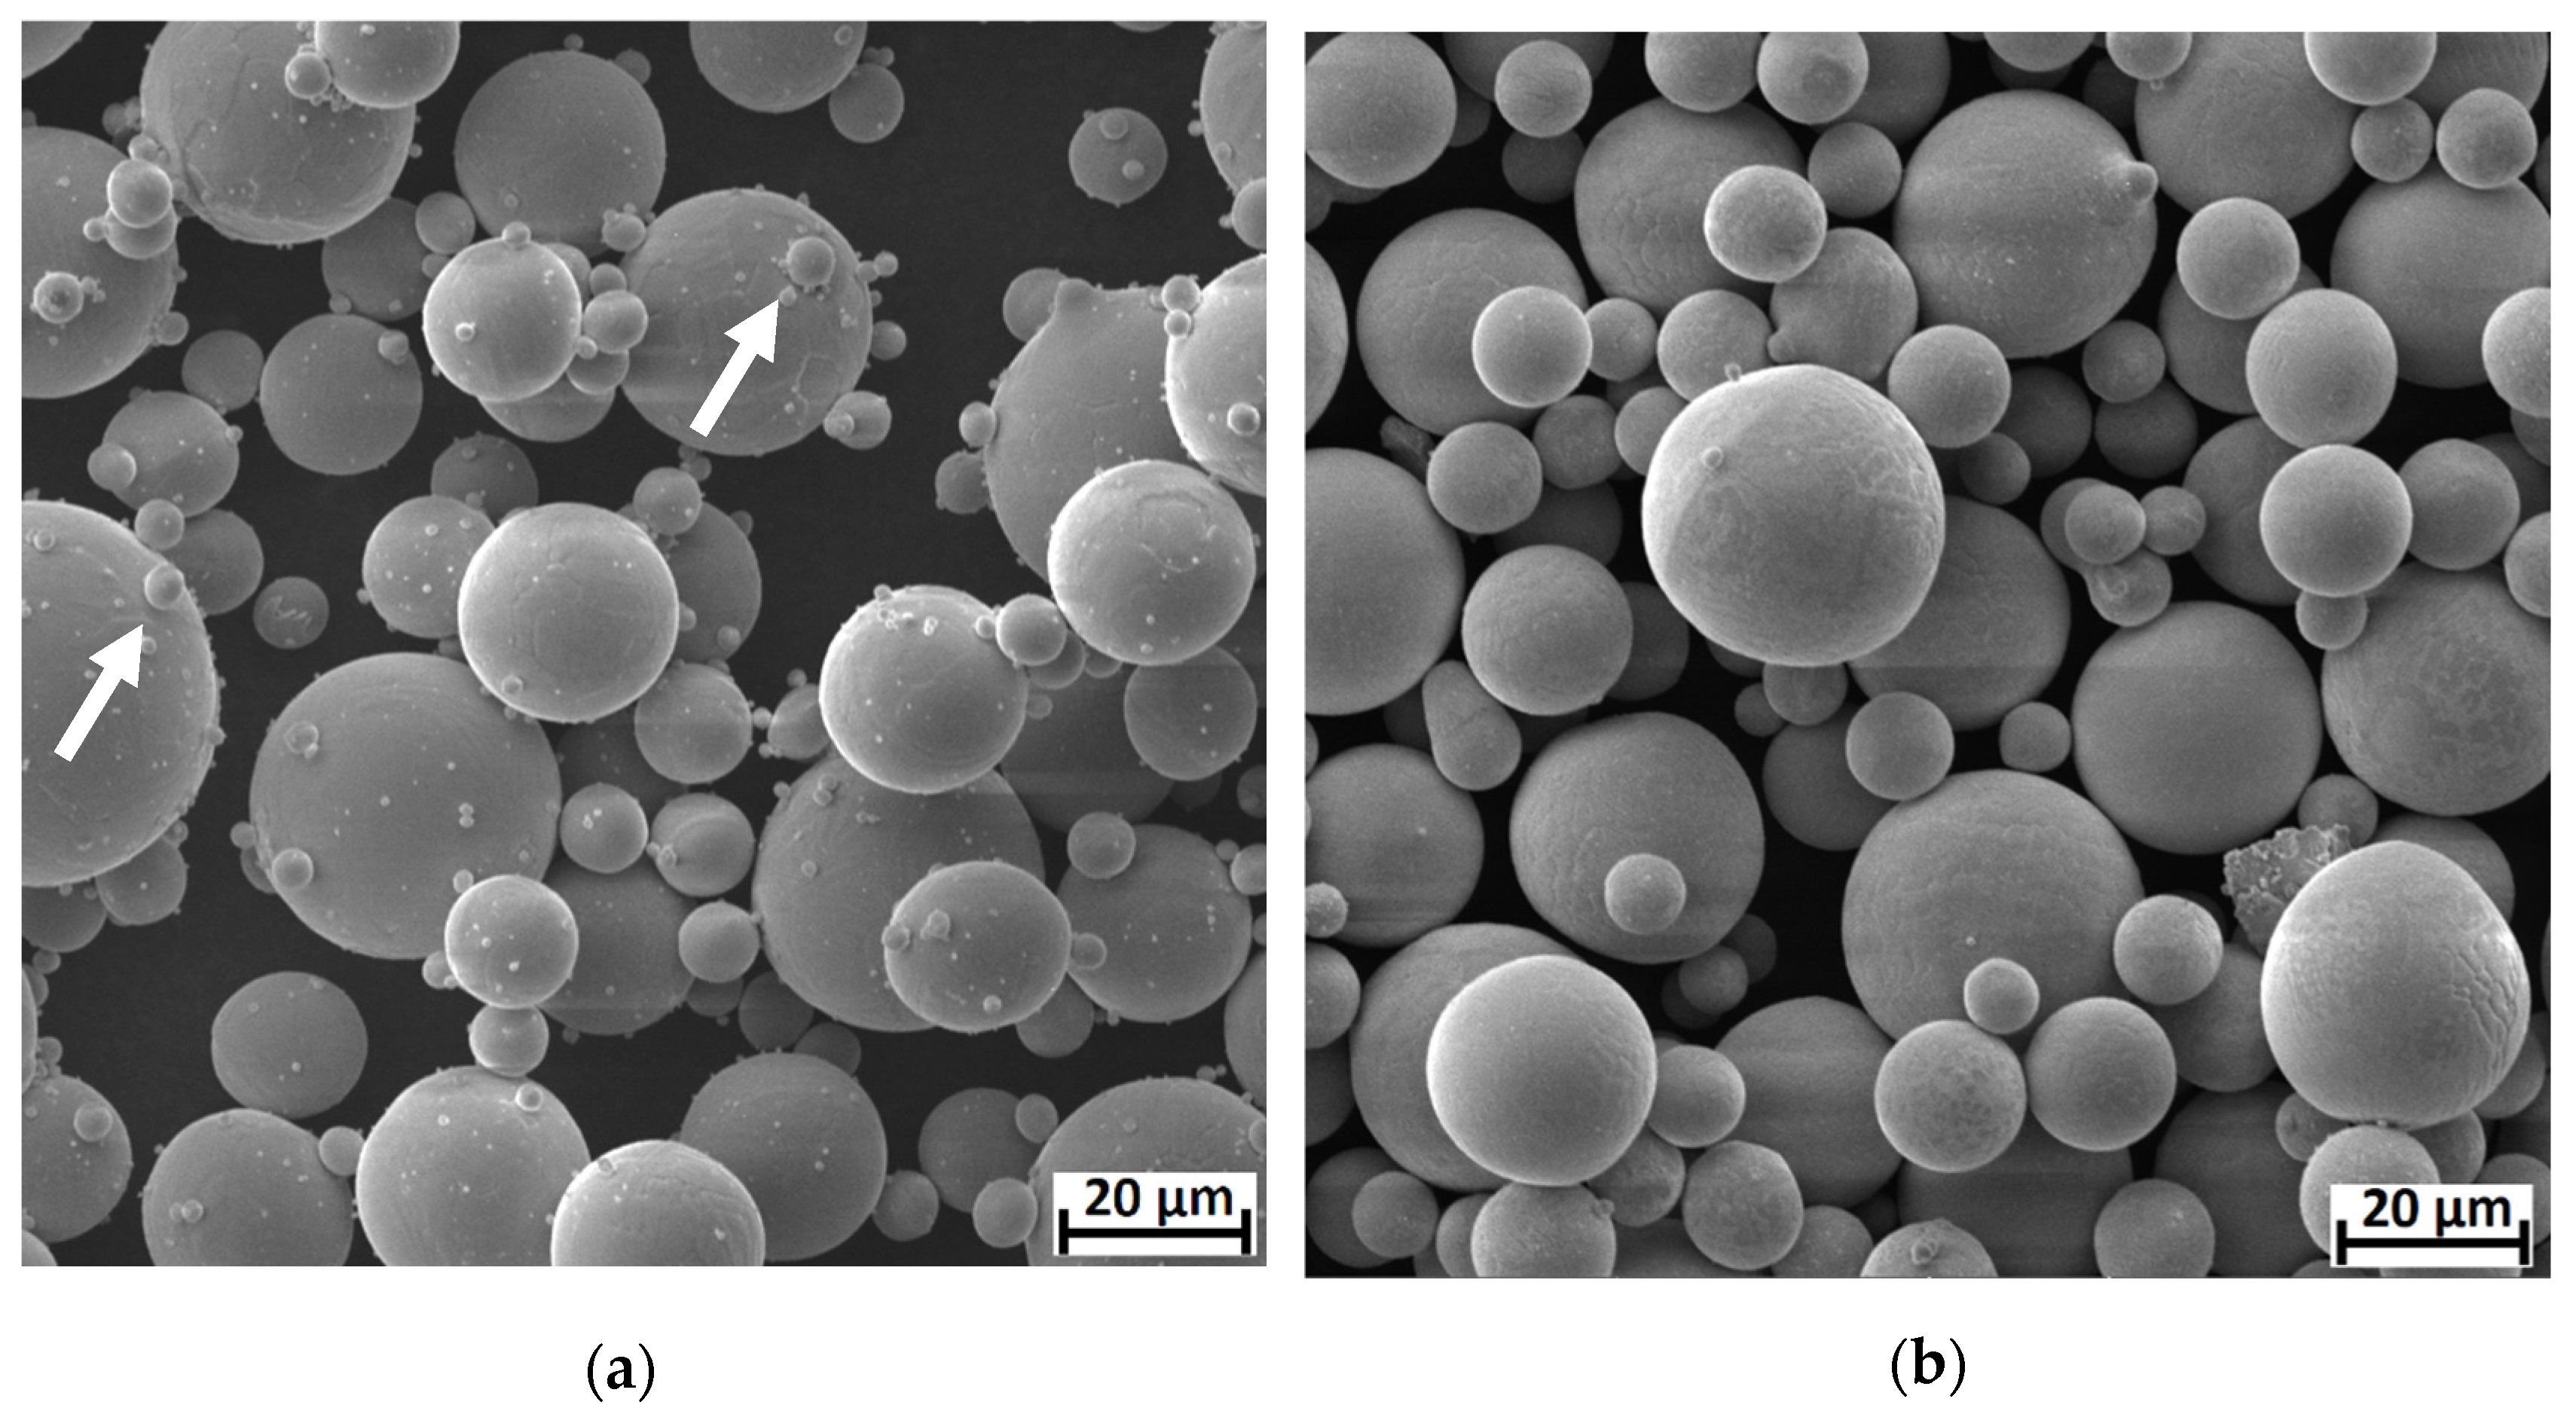
The morphology of the raw powders was characterized using SEM (Figure 2), clearly showing that both the Ti6Al4V and C-103 powders exhibit spherical shapes due to the gas atomization process. It should be noted that some satellites (Figure 2, White arrows) are visible on the surface of the Ti6Al4V powders; these are smaller particles that adhered to larger ones during solidification. However, no satellites were detected on the C-103 powders, likely due to their higher melting energy and consequently faster cooling rates.
The densities of the raw powders and powder mixture were determined using a gas pycnometer, and the results are presented in Table 3. It is evident that the tapped density ratio of the Ti6Al4V powders is higher than that of the C-103 powders (Figure 3). Tapping resulted in an approximate 6% increase in the apparent density of C-103 powder and about 10% for Ti6Al4V powder. It is believed that the higher sphericity of the C-103 powders leads to a higher apparent density, making the tapped density of the C-103 powders close to their apparent density. As mentioned previously, some satellites were observed on the surfaces of the Ti6Al4V powders. Due to these satellites, the apparent density of the Ti6Al4V powders is lower than that of the C-103 powders. It is postulated that during tapping, smaller particles move through the voids between the larger powders and satellites, leading to increased tap density. Another important consideration for powder bed processes is the flowability of the powders [41]. Poor flow behavior would prevent the formation of a homogeneous powder layer on the build plate [42]. In this study, the flow behavior of the powders was determined using the Hausner ratio, which is calculated as the ratio of tapped density to apparent density; lower values indicate better flowability [43]. Practically, a Hausner ratio below 1.25 indicates acceptable flowability [44]. According to Figure 3, the Hausner ratios of both elemental and mixed powders are below 1.25 (dashed line), indicating that the mixed powders exhibit good flowability.
Figure 4 presents the XRD analysis of the raw powders and the powder mixture. The Ti6Al4V powder primarily consists of α and β titanium phases, as indicated by characteristic diffraction peaks corresponding to both the hexagonal close-packed (HCP, α-Ti) and body-centered cubic (BCC, β-Ti) crystal structures. Although the C-103 powder is reported to contain approximately 10% Hafnium, only Nb peaks were identifiable in the XRD results. The absence of distinct Hf peaks in the XRD pattern of the Nb-10Hf alloy is likely due to the formation of a solid solution in which Hf atoms are substituted within the Nb lattice, resulting in a single-phase BCC structure. This observation is consistent with the findings of Hong and Koo, who also reported only Nb peaks in the XRD analysis of C-103 alloy [45]. Moreover, the XRD pattern of the mixed powders confirms that no phase transformation or significant contamination occurred during the mixing process, as only α-Ti and Nb peaks are present.

3.2. Surface Roughness

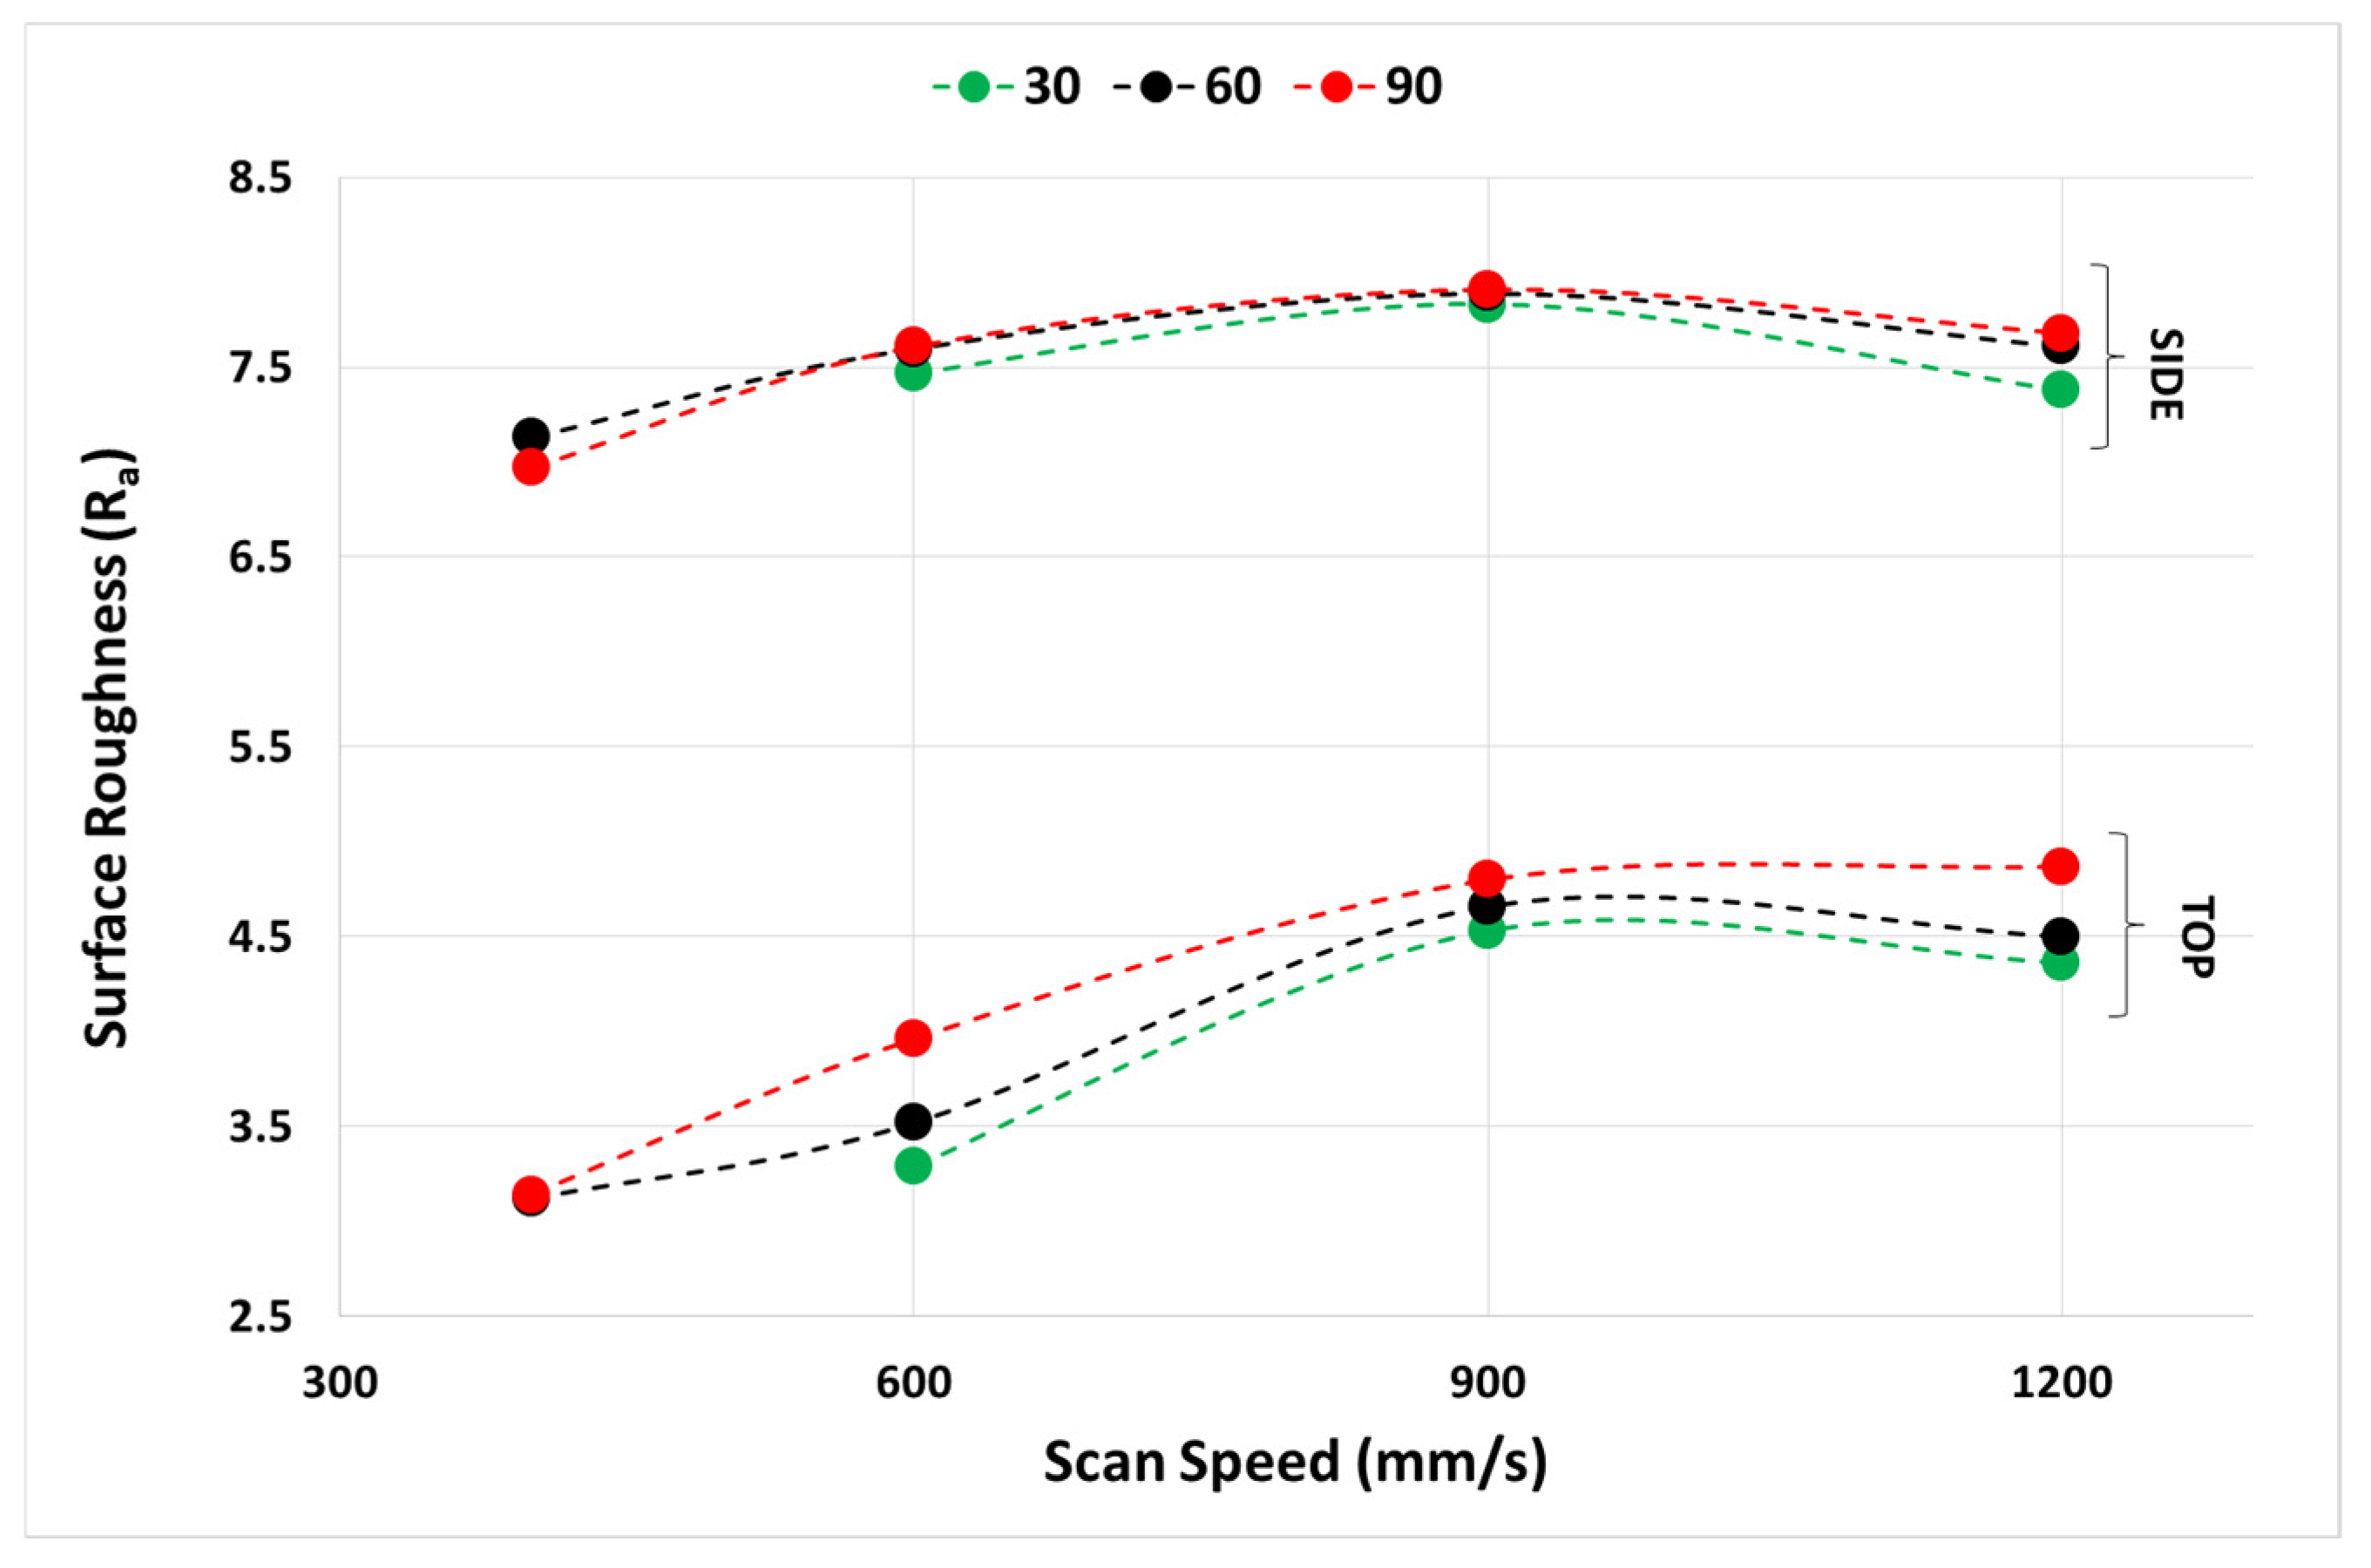
The surface roughness results (Figure 5) revealed that lower scan speeds led to reduced surface roughness. Measurements showed that roughness values ranged from 3.14 to 4.89 μm on the top surfaces and from 6.97 to 7.91 μm on the side surfaces. While higher energy densities produced smoother top surfaces, their influence on the roughness of side surfaces was less significant. Fino et al. [46] reported that slower scan rates improve surface quality in their study on the SLM processing of aluminum. Similarly, Song [47] noted that a shorter distance between scan lines reduces surface roughness. However, when scan lines are too close, surface waviness may occur due to the re-melting of previously solidified material. Other researchers [48,49] observed that increased overlap between scan lines also contributes to reduced surface roughness. Overall, improved surface quality is associated with low scanning speed and low hatch spacing, which aligns with previous findings. Additionally, surface roughness may increase due to particles ejected from the melt pool and subsequently solidified on the surface [50]. The effect of scan speed on surface texture becomes more pronounced at larger hatch spacing values, especially on the top surface.
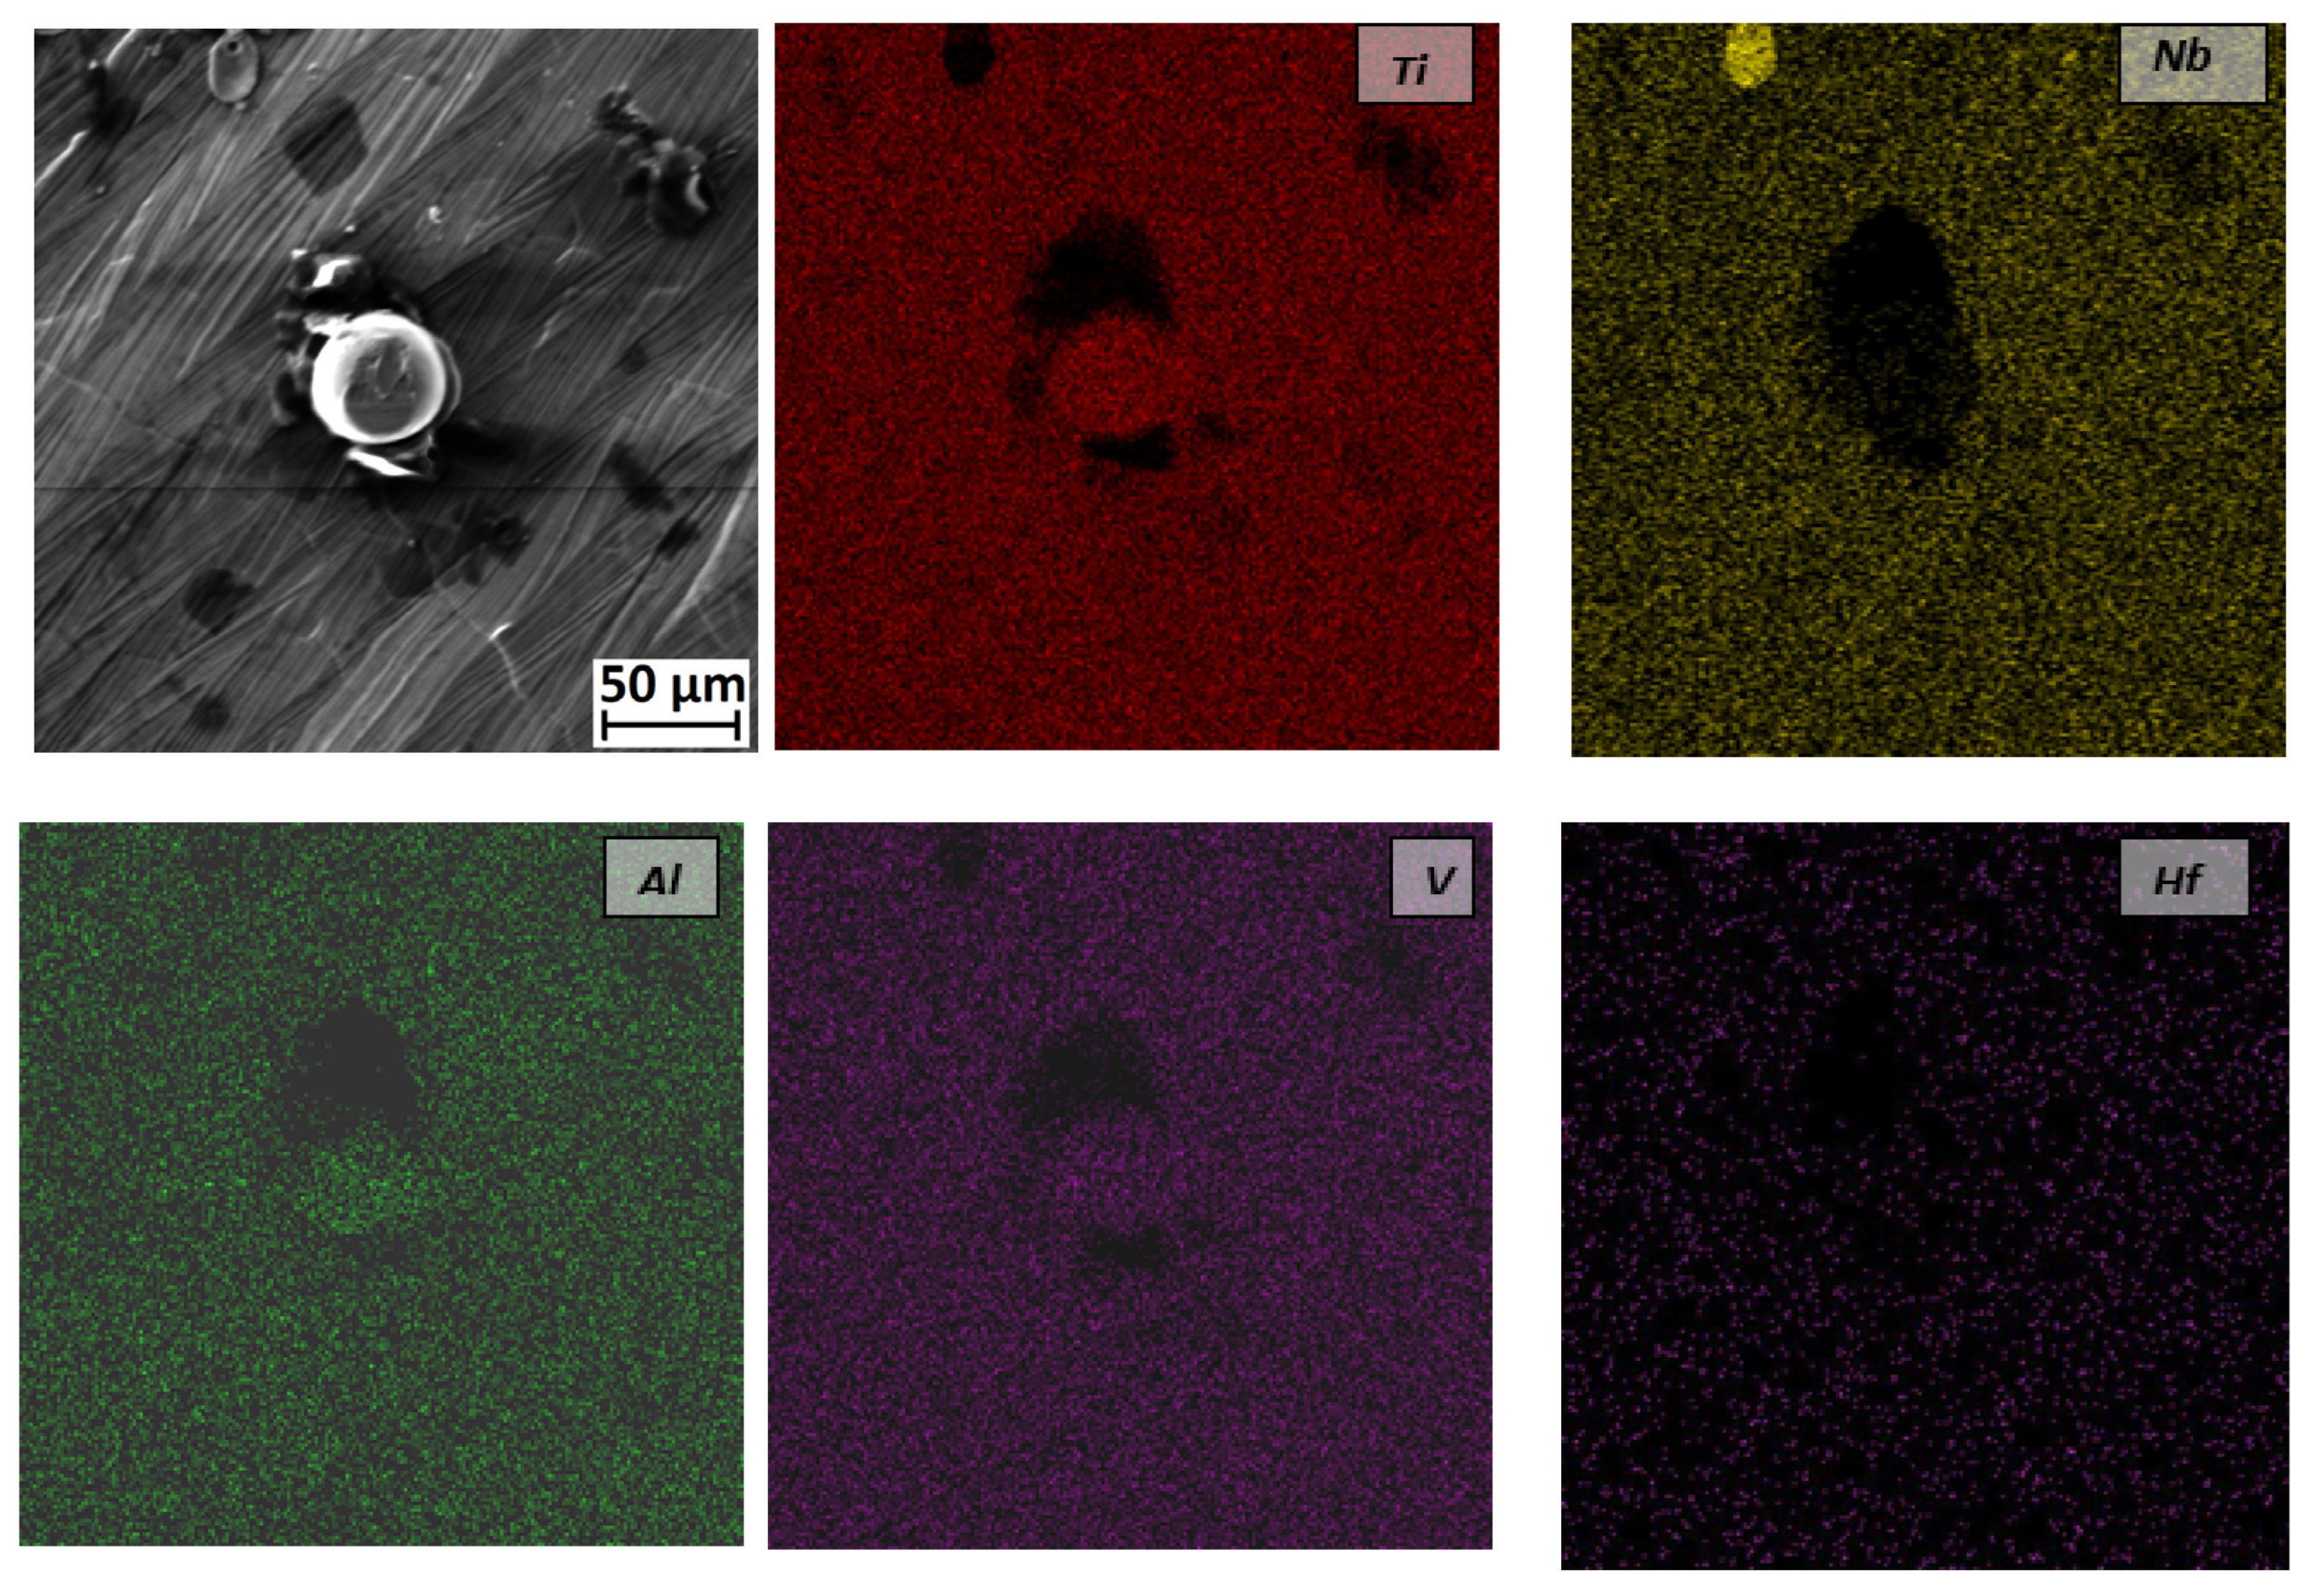
Spherical particles are clearly visible in the SEM image of the sample processed with the highest energy input (Figure 6). EDS mapping was conducted to determine whether these particles were Ti6Al4V or C-103 (Figure 6). As shown in Figure 6, the bright spherical particle at the center corresponds to Ti6Al4V, while a C-103 particle is visible at the top. Although some black stains are present on the surface, no significant difference in the elemental composition between these regions and the surrounding matrix was detected. Therefore, it is postulated that the stains result from the contact of blown, unmelted hot particles. Additionally, some porosity was observed, likely caused by particle pull-out during the SLM process.
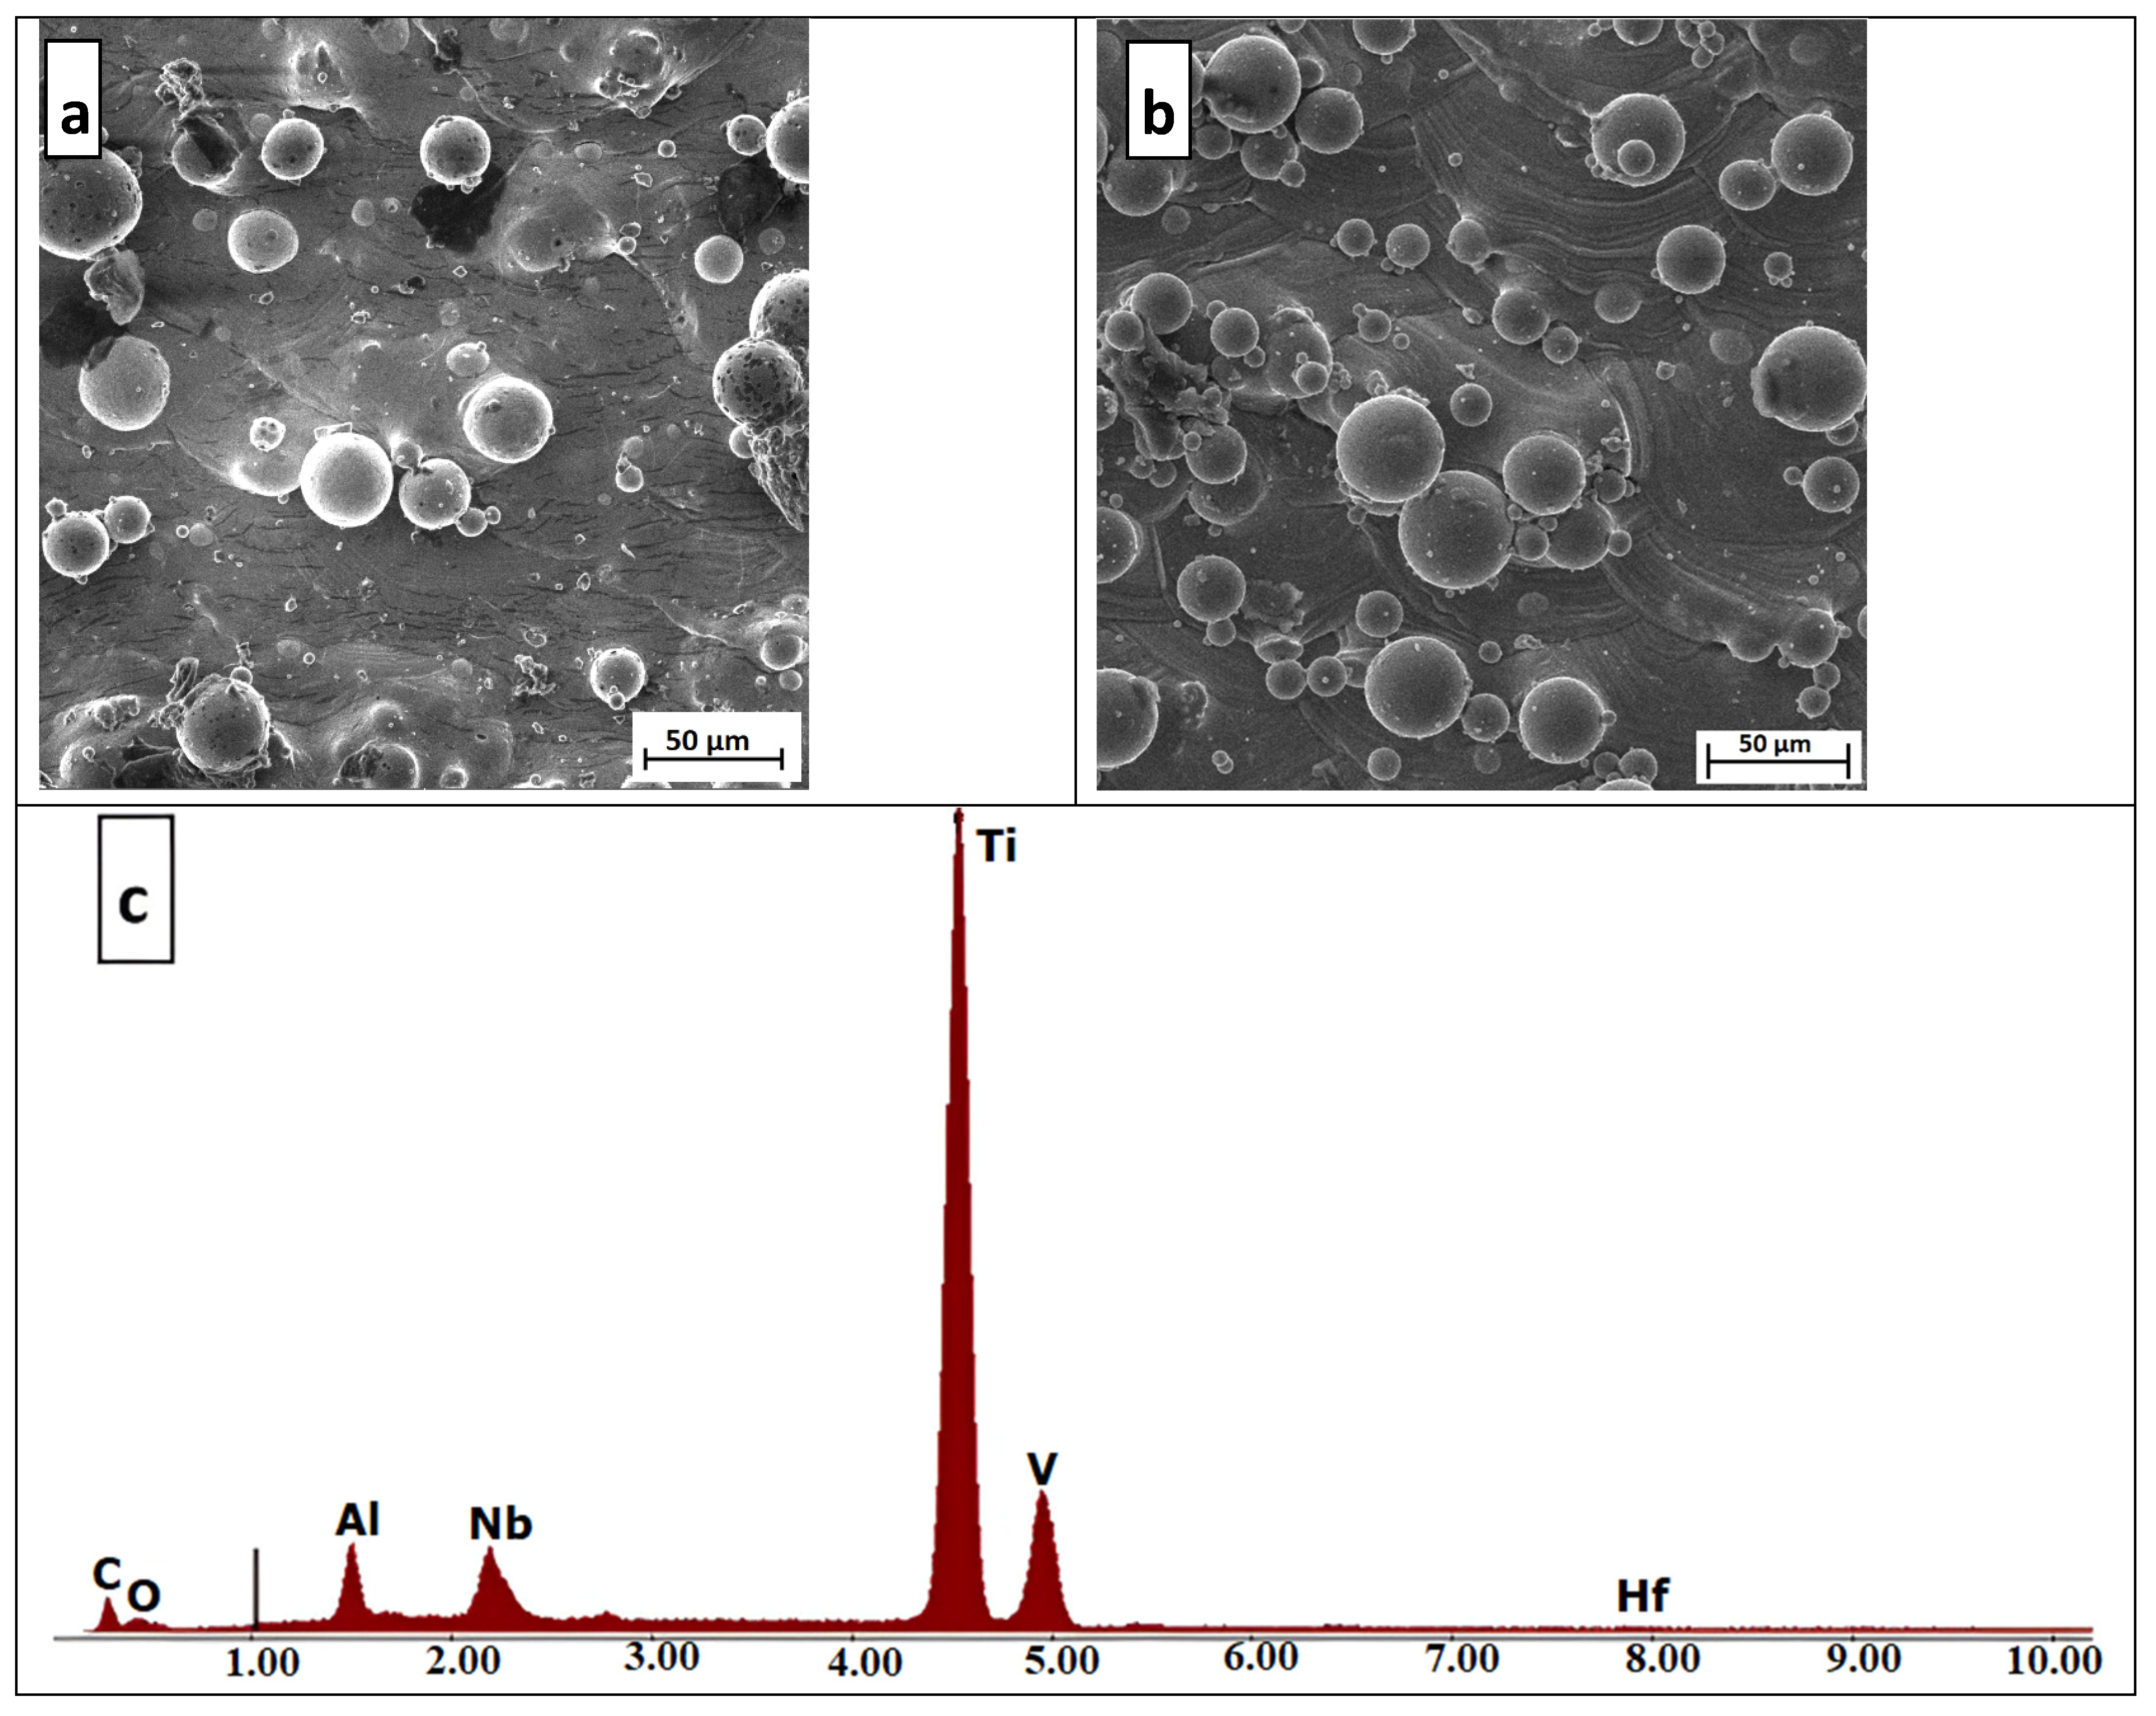
Surface roughness in the X–Z plane of the samples was higher than that in the X–Y plane (Figure 5). SEM imaging of the X–Z surface of Sample 1 revealed that the primary cause of this increased roughness was the presence of unmelted particles (Figure 7).
It is well known that a steep thermal gradient develops along the sides of a sample during printing. Therefore, it is concluded that some of these particles adhered to the molten zones from adjacent regions during the SLM process. Moreover, it is worth noting that removing the adhered particles from the X–Y surface is easier than from the X–Z surface, due to the higher energy input and more focused laser beam in the X–Y direction. Nevertheless, the surface roughness values of the produced samples were found to be lower than those reported for Ti6Al4V in the literature [51].
It was observed that tracking the solidified melt pools is easier in Sample 9 (Figure 7b). However, the appearance of the adhered powders is very similar to that in Sample 1. The EDS spectrum of the X–Z plane of Sample 9 (Figure 7c) revealed the presence of oxygen in the sample, which is attributed to the high oxygen affinity of titanium. According to the EDS analysis, the weight percentages of the elements in the analyzed region are as follows: Ti—63.34 wt.%, Nb—16.28 wt.%, Al—8.77 wt.%, V—2.84 wt.%, Hf—2.74 wt.%, O—2.08 wt.%, and C—3.96 wt.%. Furthermore, it can be concluded that the amount of adhered unmelted powders on Sample 9 is higher than that on Sample 1 due to the lower energy input.

3.3. Density

The theoretical densities of all manufactured parts were above 95% (Figure 8). According to the porosity measurements, the majority of the samples (n = 9) had porosity values under 0.5%, while two samples (Samples 10 and 11) showed markedly elevated porosity levels, ranging from 3.6% to 4.4%. Samples 1 and 2 exhibited the lowest porosity, with corresponding energy inputs of 266 and 133 J/mm3, respectively. Although Sample 11 had a relatively high energy input (200 J/mm3), its density (~96.4% TD) was lower than those of many other samples. This indicates that while energy input significantly influences porosity in SLM parts, it is not the sole factor affecting density evolution. Moreover, Figure 8 clearly shows that a scan speed of 400 mm/s consistently results in the lowest density, regardless of hatch spacing. Chen et al. [52] reported a similar observation, noting that low scan speeds increase the exposure time of the melt pool to laser energy, which can cause turbulence and instability in the liquid metal, ultimately leading to porosity and balling.
Conversely, the use of high scanning speeds may lead to melt pool instability due to surface tension and capillary forces. Nevertheless, the density values obtained at scan speeds above 600 mm/s are relatively consistent, with all samples exhibiting over 99% of the theoretical density. It is well known that if the matrix alloy adequately wets the reinforcing phases, pore formation between the reinforcement and the matrix can be minimized. In this study, it is presumed that the molten Ti6Al4V alloy effectively wetted the Nb particles, enabling high-density values (i.e., low porosity) without requiring the complete melting of Nb particles.
As previously mentioned, two samples—Sample 10 and Sample 11—exhibited porosity levels exceeding 3.5%. These samples were fabricated using a scan speed of 400 mm/s, with hatch spacings of 60 µm and 90 µm, respectively. Despite energy inputs of 133 J/mm3 and 200 J/mm3, the relatively low scan speed appears to have been insufficient to re-scan the previously melted regions before they cooled to subcritical temperatures. According to Zhang et al. [53], reducing the scan speed increases the energy density, which elevates the powder temperature, thereby enhancing the melting and ultimately improving final part density. However, once complete melting is achieved, further increases in energy input yield diminishing returns. While the general trend in this study aligns with Zhang et al. [53], Samples 10 and 11 exhibited lower densities despite low scan speeds, suggesting other contributing factors.
Kruth et al. [54] reported that excessively low scan speeds may result in melt pool instability, leading to balling and dross formation, which can reduce the final part density. The density values reported in this study are comparable to those from previous investigations on Ti6Al4V [55] and are notably higher than the values reported for Ti45Nb alloys produced via SLM using pre-alloyed powders [54].

3.4. Microstructural Characterization and Phase Analysis

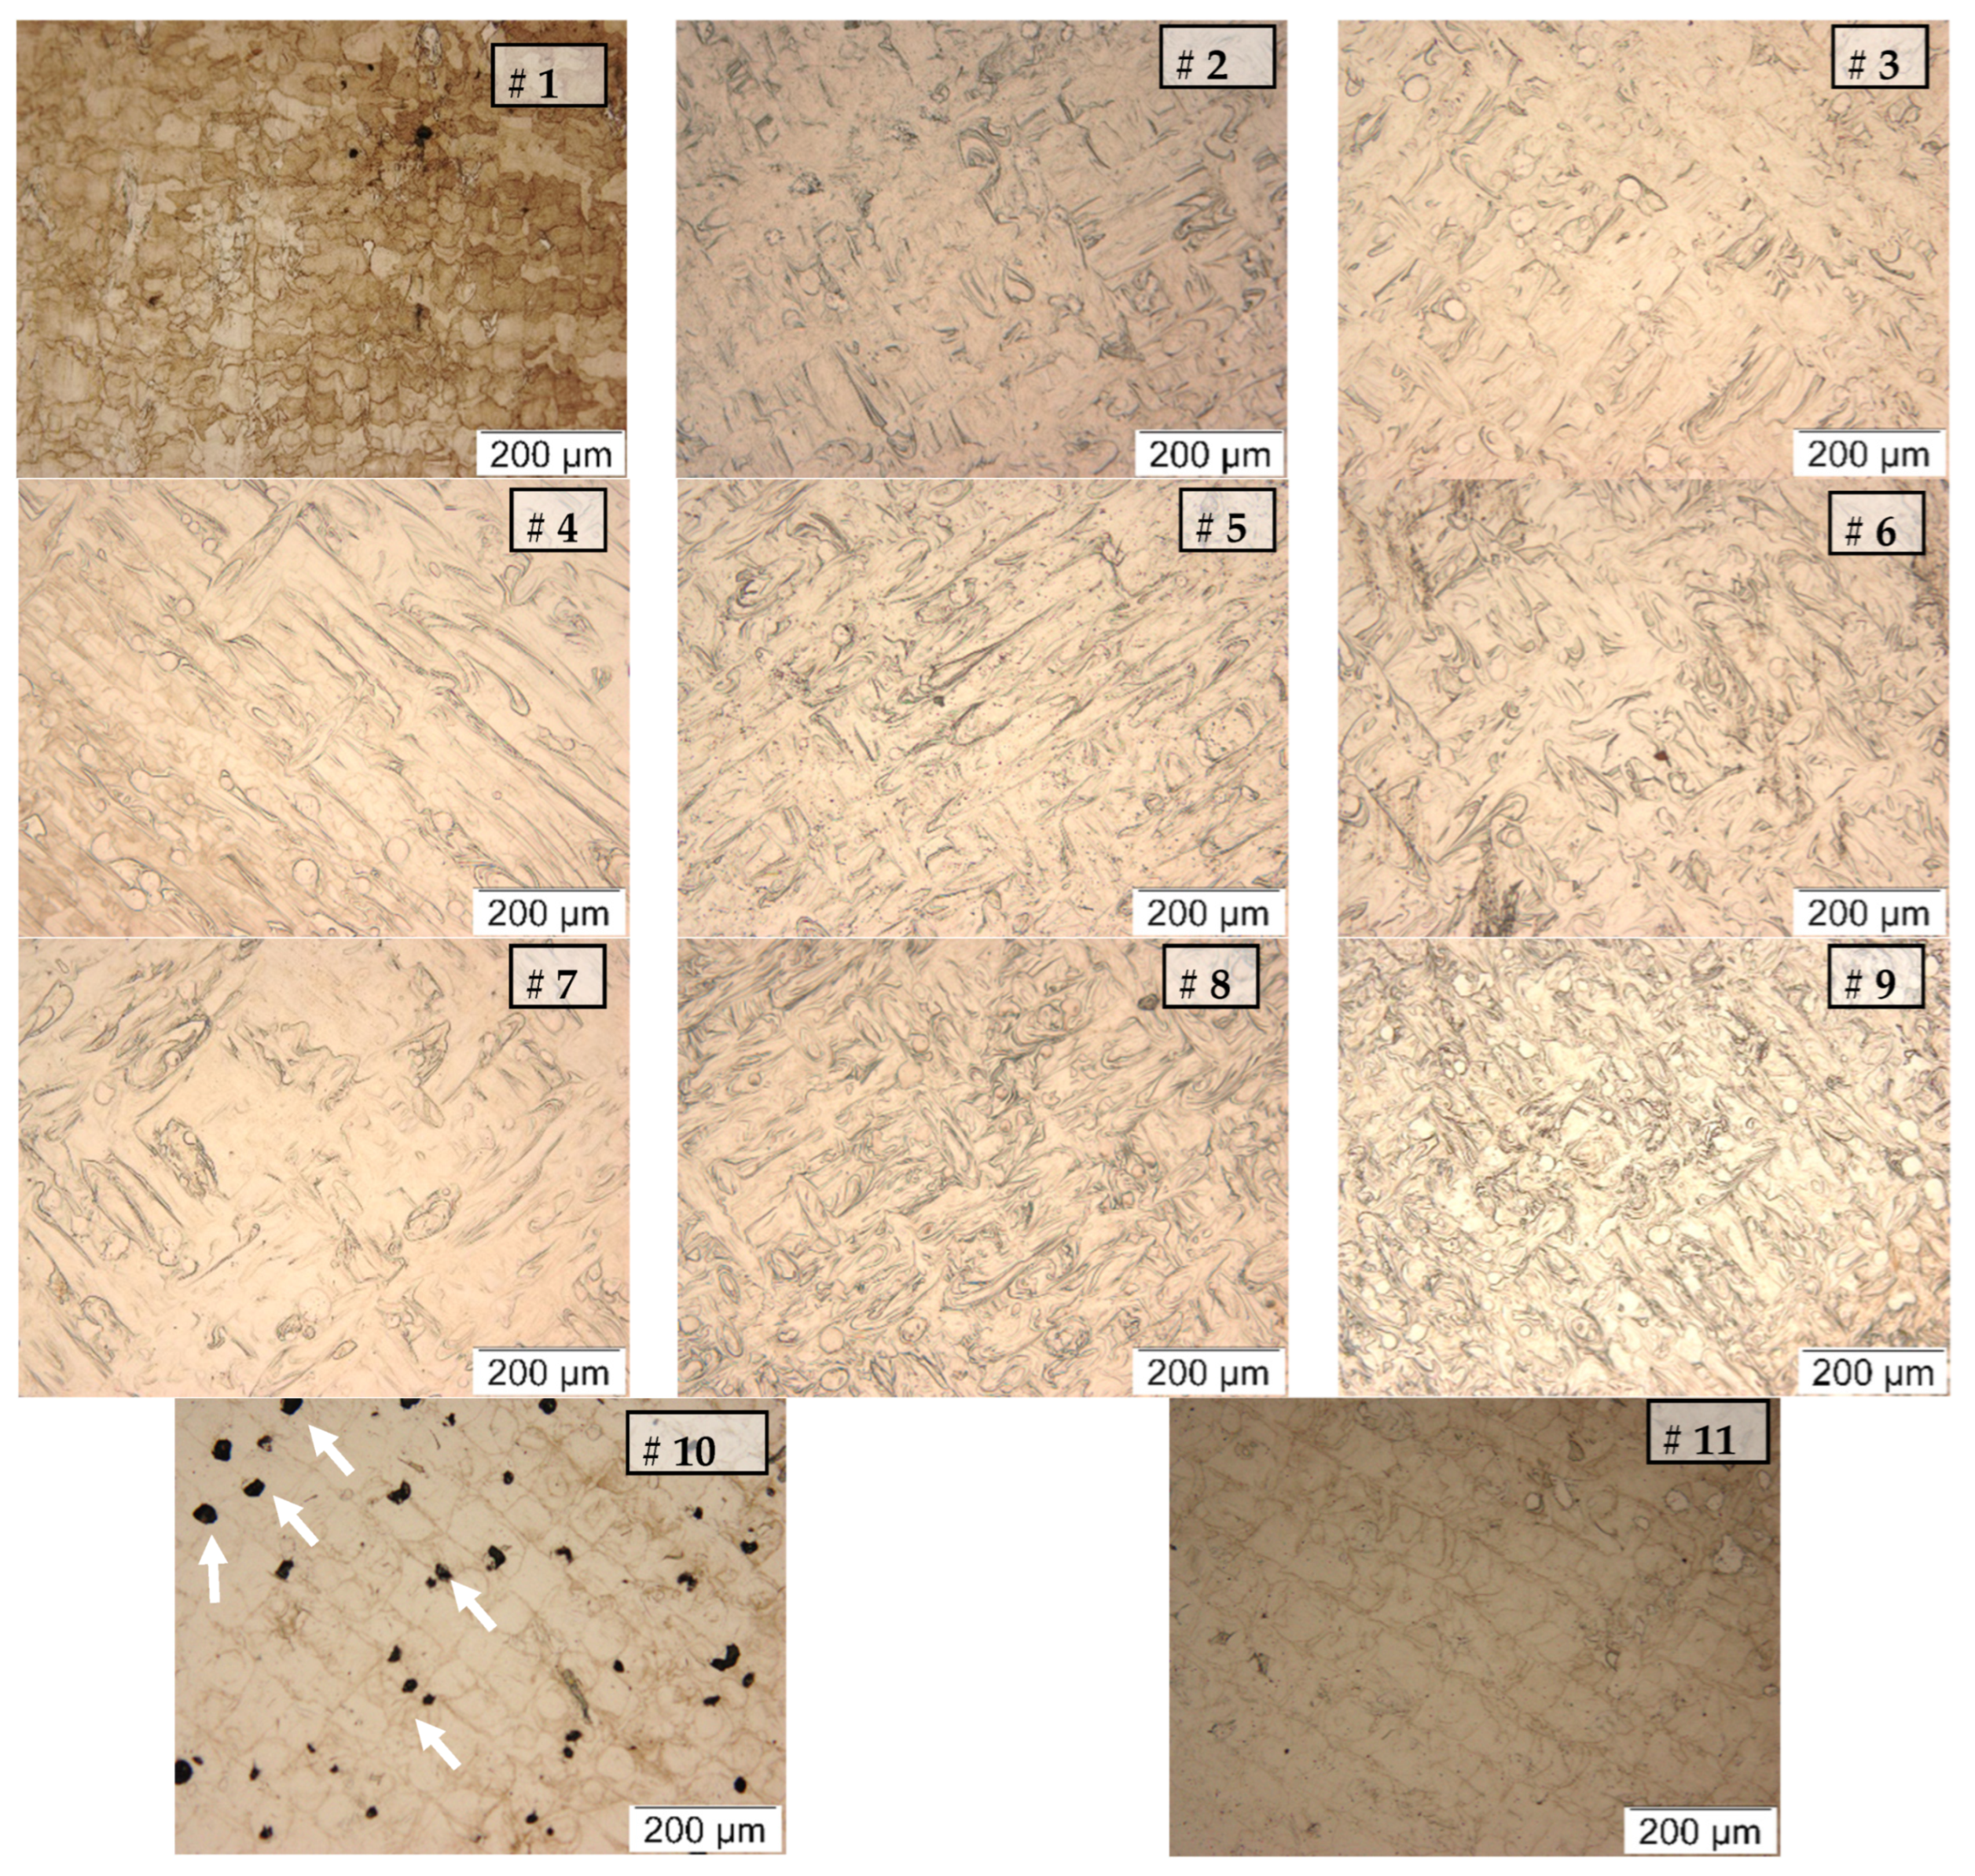
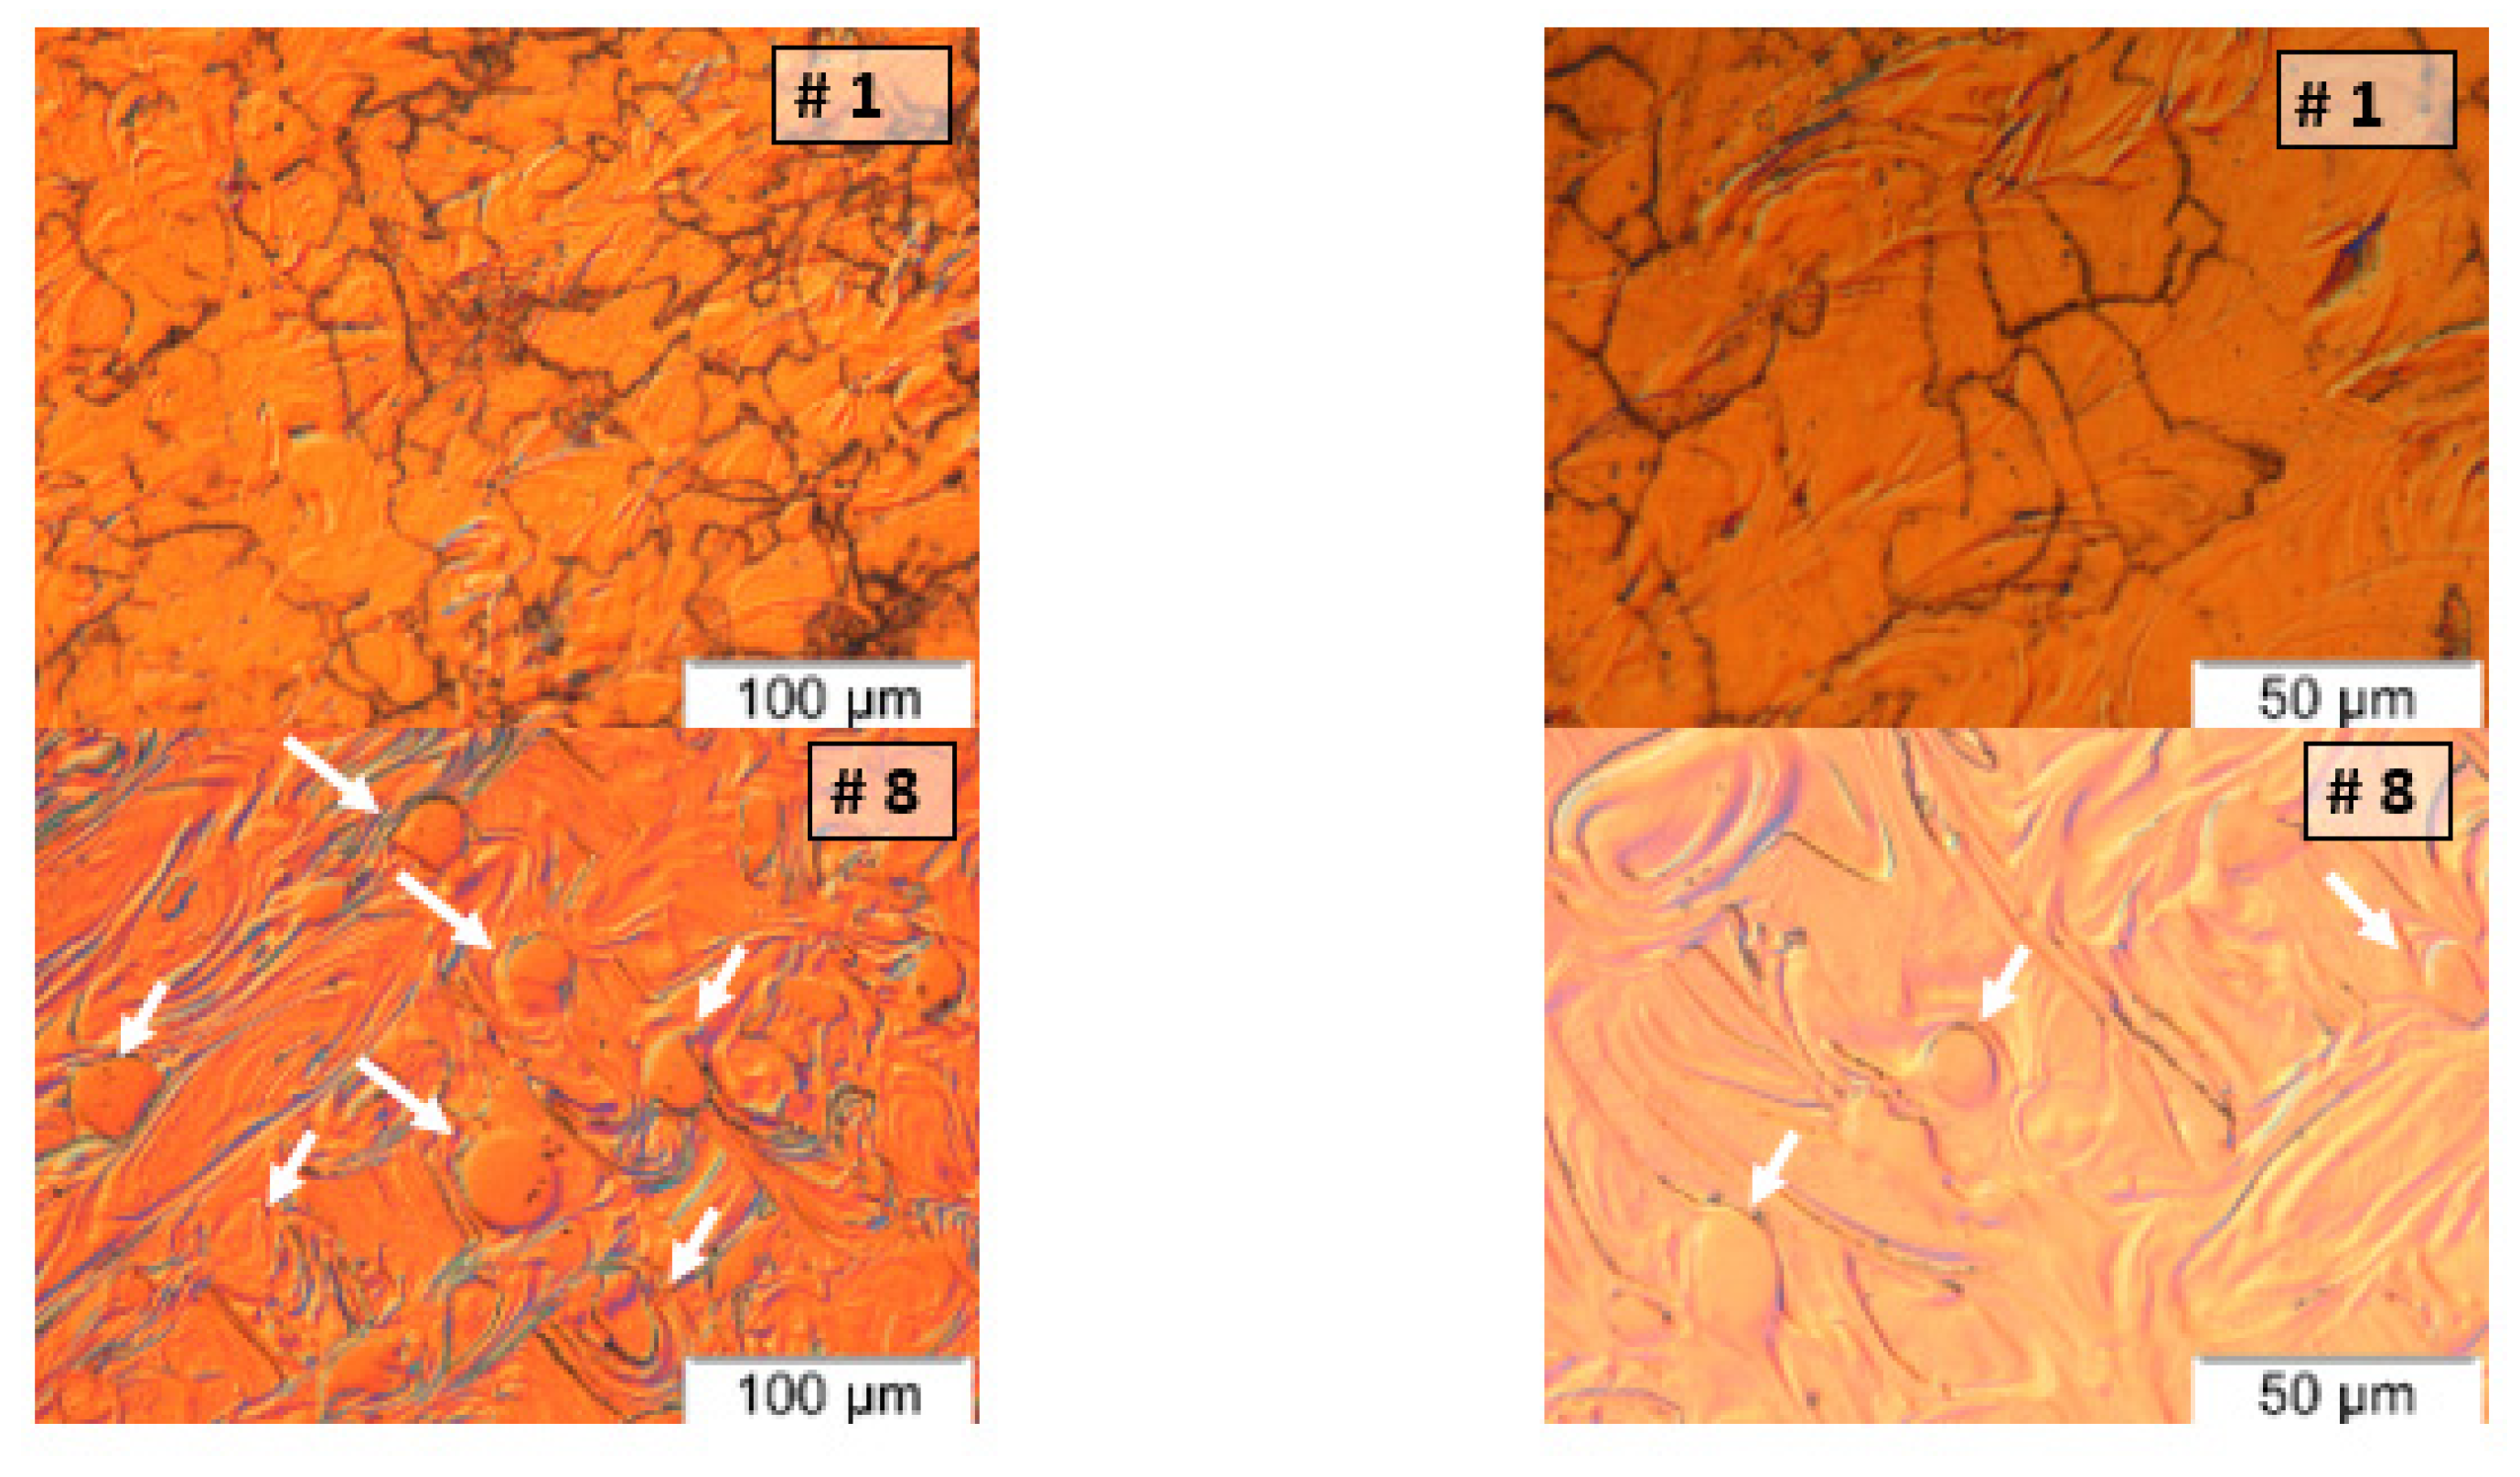
In order to investigate the influence of processing parameters on the microstructure, optical microscope images taken at the same magnification are presented in Figure 9. Some un-melted Nb particles are visible in the parts produced under an energy density of 266 J/mm3. Additionally, samples fabricated at lower energy densities (Samples 5, 6, 8, and 9) exhibit similar microstructural features. Although the samples were etched with Kroll’s reagent—commonly employed for such alloy systems—the grain structure could not be revealed in Samples 2 through 10. However, grain boundary-like features were partially observed in Sample 1. In sample 10, the pores are clearly visible, which supports the results obtained from the density measurements (white arrows in Figure 9). Theoretical density tends to increase as hatch spacing is reduced, due to improved bonding between scan lines and fewer unmolten or porous regions. Microsections of Samples 1 and 8 were investigated under polarized light to enhance contrast and improve the visibility of microstructural features such as grain boundaries and morphological differences (Figure 10). In addition to improving contrast, polarized light microscopy also revealed details related of the melt pool morphology and helped identify partially melted and un-melted C-103 particles (as indicated by the white arrows in Figure 10) embedded in the matrix. Ti6Al4V has an electrical conductivity approximately ten times higher than that of C-103. According to Torkamany et al. [56], under comparable conditions, Ti6Al4V exhibits greater laser absorption than Nb. Furthermore, C-103 possesses a thermal conductivity roughly five times that of Ti6Al4V, which leads to faster energy dissipation. In contrast, Ti6Al4V retains heat more effectively due to its lower thermal conductivity and heat capacity.
Borgman et al. [57] suggested that an energy density above 225 J/mm3 is necessary to achieve effective melting of Nb particles. In line with this, no un-melted Nb particles were observed in the sample produced at 266 J/mm3. Conversely, an increase in scan speed led to a greater number of un-melted Nb particles, which aligns with recent findings in the literature [58].
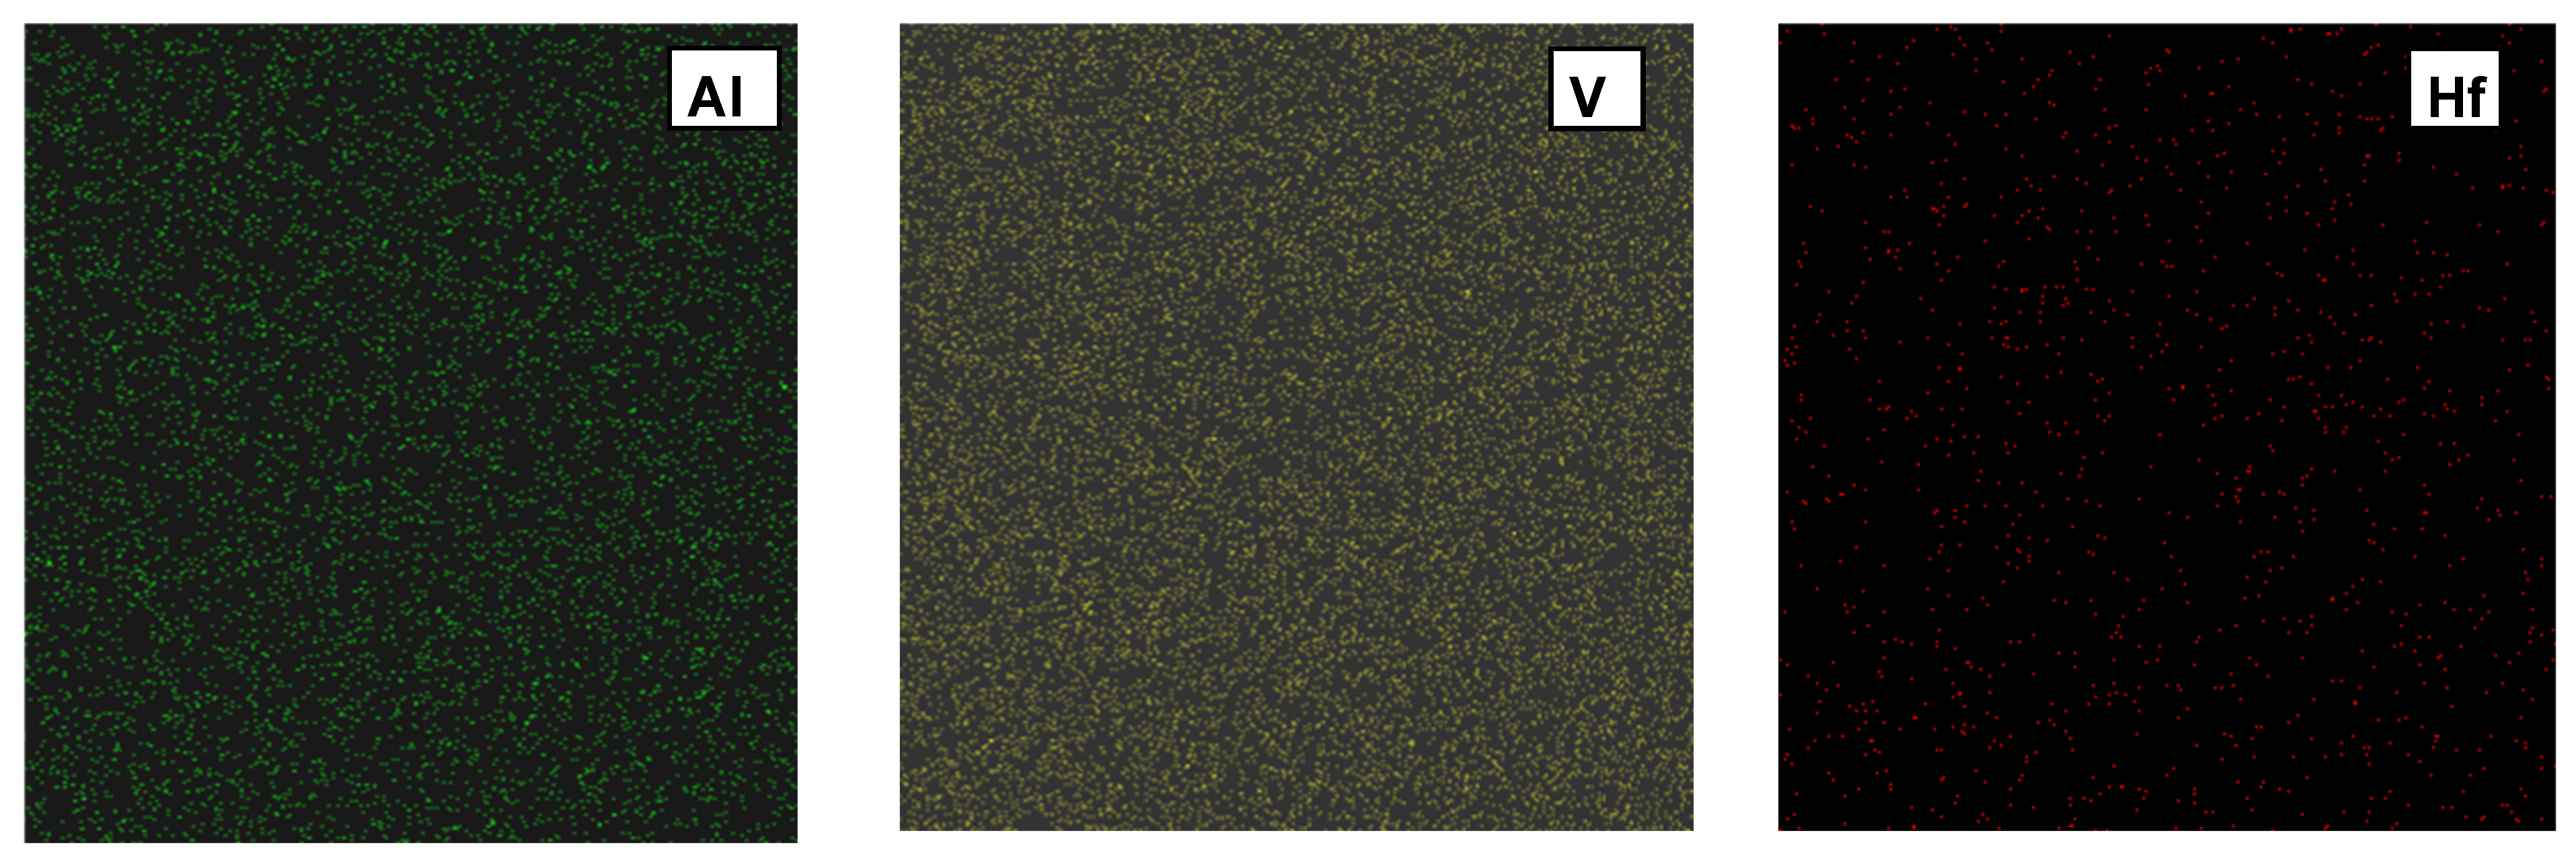
EDS elemental mapping of Sample 1 (Figure 11) revealed a fine and homogeneous distribution of alloying elements throughout the microstructure. Although a region with notable color contrast was visible in the elemental mapping image, no corresponding increase in signal intensity was detected in the Nb or Hf maps for the same area. This suggests that the contrast is not due to localized enrichment of these elements, but may rather be attributed to surface morphology or imaging artifacts. Such artifacts may arise from residual polishing media, etching stains, or minor contamination. The homogeneous distribution of alloying elements is attributed to the high melting temperature and rapid cooling rate during the process [59]. These results clearly indicate that the in situ alloying process was successfully achieved for the sample produced at the highest energy density. Furthermore, the peak broadening observed in the XRD patterns of the samples fabricated with the highest energy input is greater than that of the samples produced under lower energy conditions. This peak broadening is typically associated with solid solution formation. Detailed XRD analysis of the fabricated parts will be discussed in the subsequent sections. According to the average values obtained from EDS point analyses across the microstructure, the Nb content was determined to be 15.78 wt.%, which corresponds to the targeted composition of the alloy. Li et al. [60] reported similar microstructures in their study on LPBF processing of Ti-41Nb alloys. However, unlike their findings, no segregation was observed at the melt pool boundaries in the present study, which is likely due to the differences in scan strategies employed.
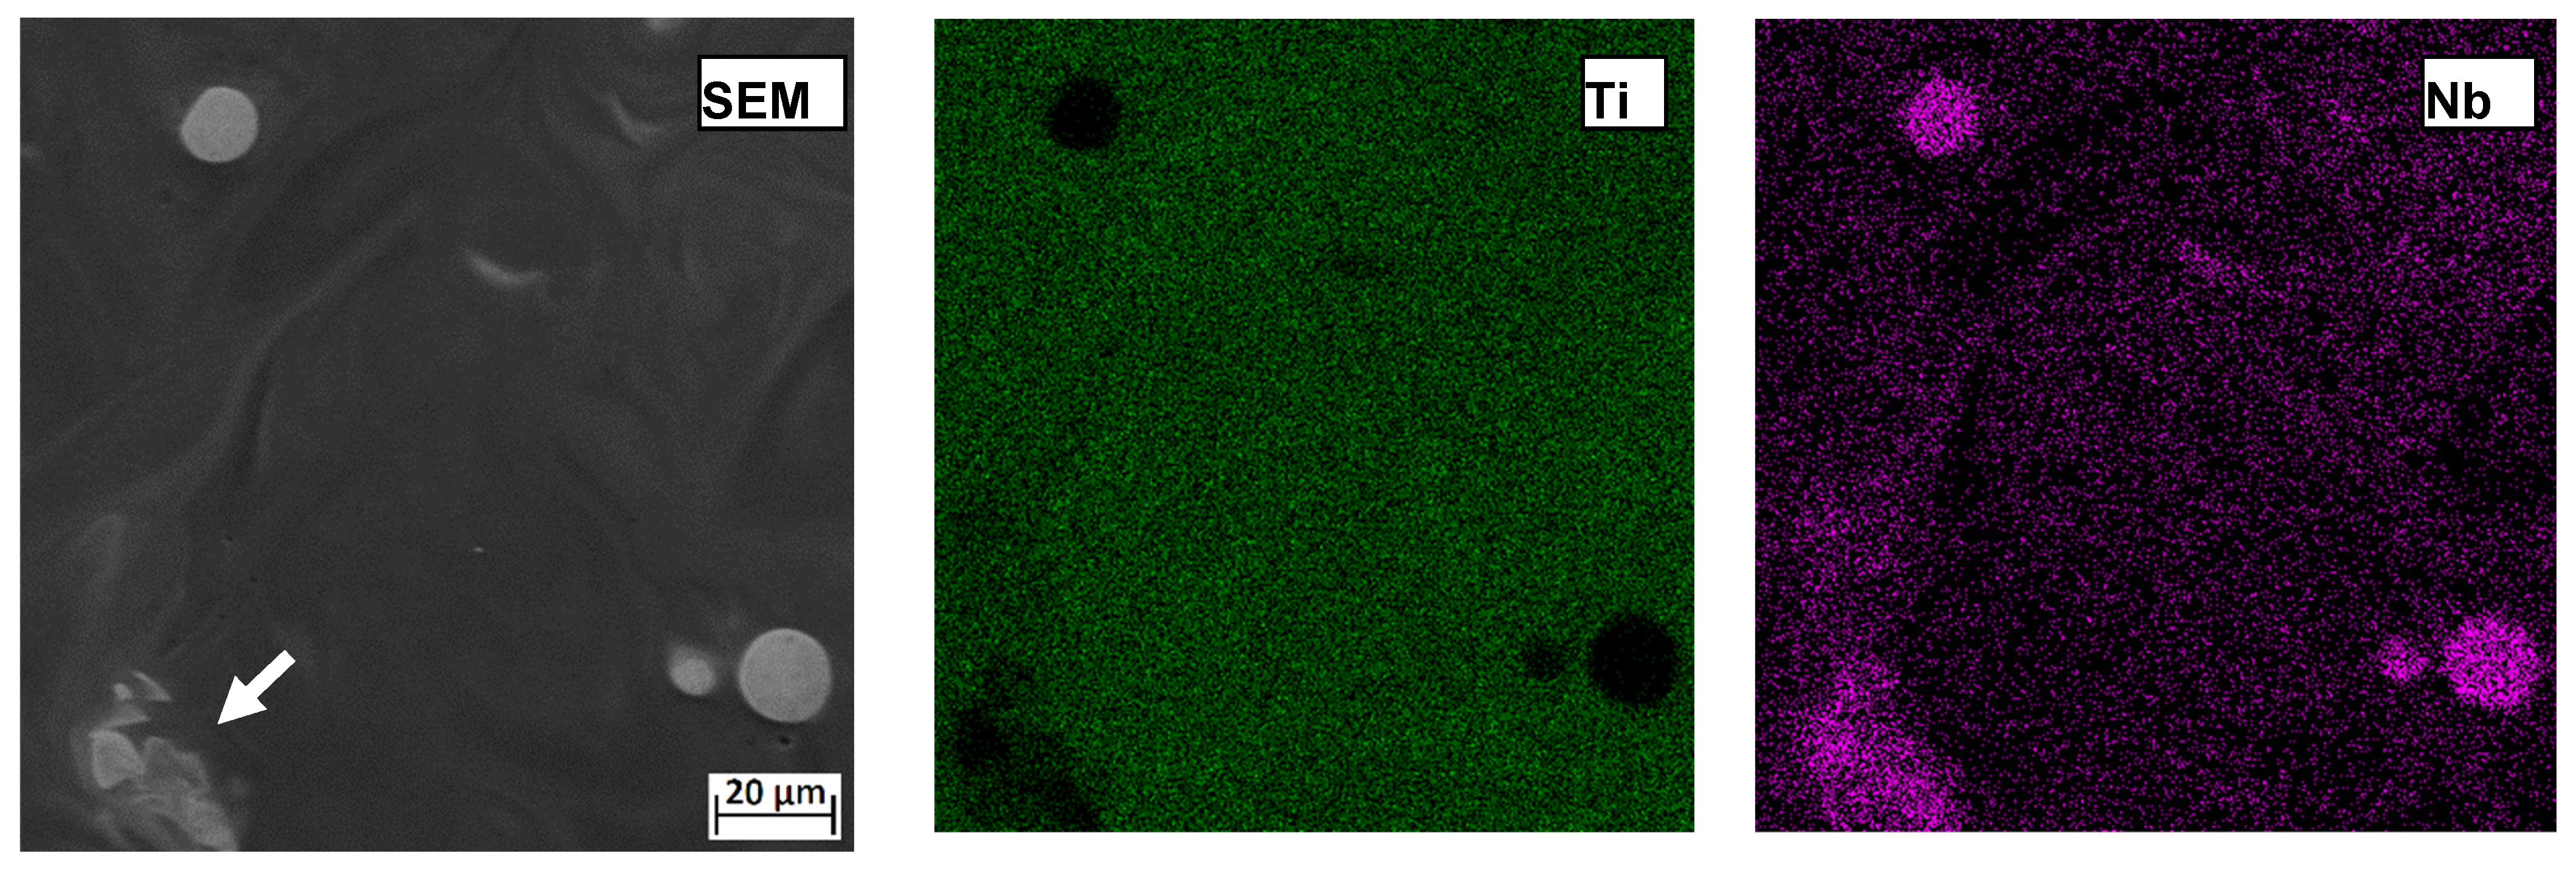
EDS elemental mapping of Sample 9 (Figure 12) revealed an inhomogeneous microstructure and uneven distribution of alloying elements. As shown in Figure 12, brighter areas indicate higher Nb content, while darker areas are rich in Ti. White circular regions represent unmelted Nb particles, with a partially melted Nb particle also visible (Figure 12, white arrow). The large difference in melting points between Ti and Nb (over 800 °C), combined with the short laser exposure time (~10−3 s) and rapid cooling rates (105–108 K/s) in laser-based additive manufacturing systems makes it challenging to melt Nb particles with higher melting points [25,61]. Consequently, the energy density used for Sample 1 (266 J/mm3) was sufficient to melt all particles and form a homogeneous alloy. However, for Sample 9 (44 J/mm3), the energy density was high enough to partially melt some Nb particles, leaving others unmelted. According to quantitative EDS analysis performed on the entire investigated surface of Sample 9, the composition was determined as follows (in wt.%): Ti—72.41, Nb—14.32, Al—9.33, V—3.02, and Hf—0.92. EDS analysis of Sample 9’s matrix revealed a Nb content of 14.32 wt.%, lower than the target due to the unmelted Nb particles. Additionally, the Hf content in the sample processed at the highest energy density (1.92 wt.%) is nearly double that of the sample processed at the lower energy density (0.92 wt.%) attributed to the insufficient melting of C-103 particles.
It is known that higher energy densities in LPBF processes raise the melt pool temperature and reduce the cooling rate [38]. As a result, alloying elements have more time to diffuse through the microstructure. Another contributing factor to the fine distribution of alloying elements is the recirculation of elements within the melt pool, driven by the Marangoni effect [62]. A higher-magnification image of Sample 1 (Figure 13) reveals that its microstructure consists of α and β lamellae, corresponding to a Widmanstätten structure. In such alloys, during solidification, the α phase nucleates along the prior β grain boundaries [63]. Consequently, the dark areas in the micrograph represent the α phase, which has lower Nb content, while the lighter areas represent the β phase with higher Nb content [16]. The morphology of the β phase constituents is typical for these alloys [12,25], and is attributed to the formation of acicular martensite due to distortion in the HCP structure from doping with β-stabilizing elements like Nb [15,64]. However, the α phase was likely not detected in the XRD analysis due to its low volume fraction. A more detailed evaluation of the formed phases is provided in the subsequent sections. As mentioned earlier, the β–α transformation primarily starts from decomposition products (ω and β’). Thus, it can be concluded that the high cooling rate, resulting from the LPBF process, led to the formation of metastable phases. The α phase nucleated on these metastable phases, eventually resulting in a homogeneous and fine microstructure with α and β phases.
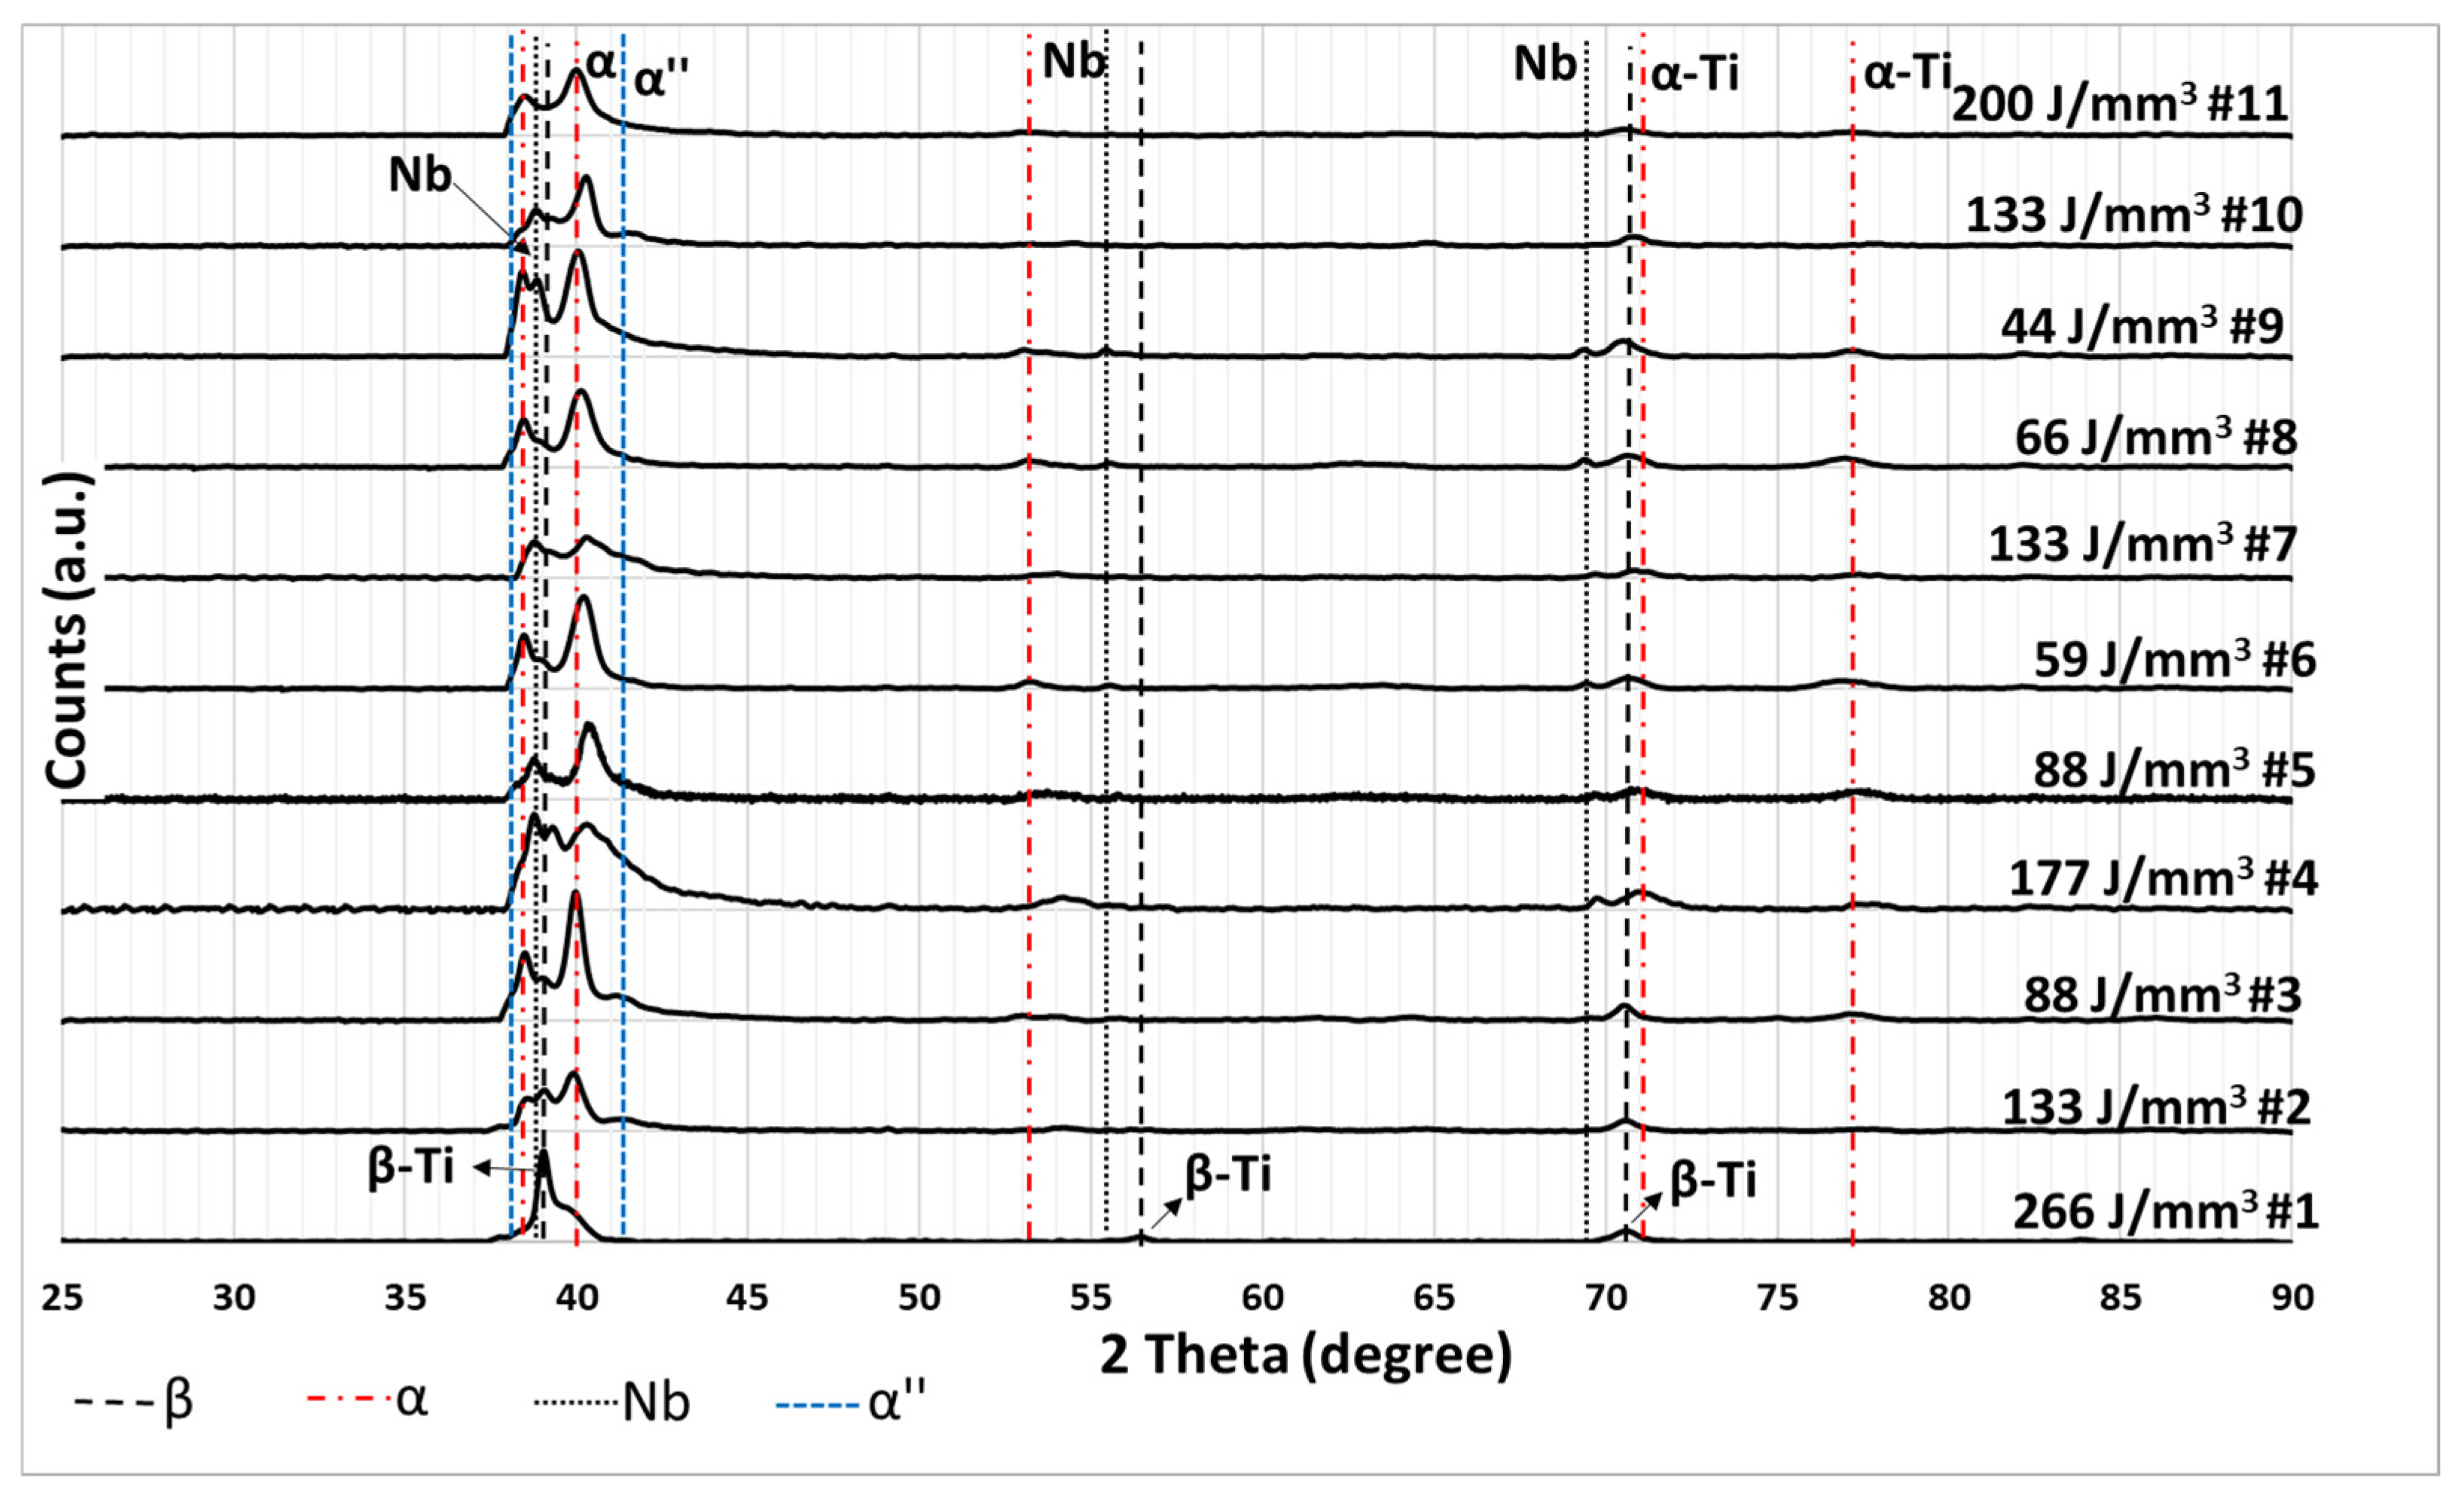
X-ray diffraction (XRD) analyses (Figure 14) show that the phases formed in laser powder bed fusion systems are influenced by factors beyond just energy density. For example, although Samples 2 and 10 were produced with the same energy density (200 J/mm3), the β-phase is more prominent in Sample 2. According to Table 2, the scanning speed used for Sample 2 was higher, and the hatch spacing was narrower. As a result, the faster-moving laser passes closer to areas that have not yet cooled down. Additionally, the narrower hatch spacing results in higher temperatures in these solidifying regions. A similar trend is observed between Samples 3 and 5, both of which were produced using an energy density of 88 J/mm3. The Nb peak intensity detected in Sample 5 is slightly lower than in Sample 3 due to the faster laser speed and narrower hatch spacing in Sample 5. This suggests that the Nb particles in Sample 5 melted more effectively due to the reheating of the cooling region by the laser passing nearby. Consequently, Sample 5 shows a lower Nb peak intensity in the XRD analysis. The presence of peaks associated with Nb indicates the presence of unmelted Nb particles in the samples produced with lower energy densities, as discussed earlier. A comparison of peak widths with those from other studies [16,28] indicates broader peaks in this study, which is attributed to the small grain size and high crystal deformation resulting from the process used [65]. Unlike other powder-based methods, some equilibrium phases, such as α″ may form during the SLM process due to rapid solidification of the melt pool [25]. A few peaks corresponding to α″ with low intensity were detected in the XRD analysis (Figure 14), but distinguishing this phase is challenging due to overlapping with other peaks and its low concentration. Hein et al. [65] also observed similar peak broadening near the main α peak at 40° and attributed this behavior to the presence of α″. Based on these data, it can be inferred that this phase forms as a result of incomplete β → α″ → α transformation during the process, as proposed by Qi et al. [66]. Slow cooling of the alloy or the use of heat treatments would provide enough time for the transformation from α″ to α to complete. No α″ peak was observed in the XRD pattern of Sample 1, likely due to the β-stabilizing effect of fully melted Nb. Another possible explanation is the relatively slow cooling of the melt pool due to the narrow hatch spacing and high energy input.

3.5. Mechanical Properties

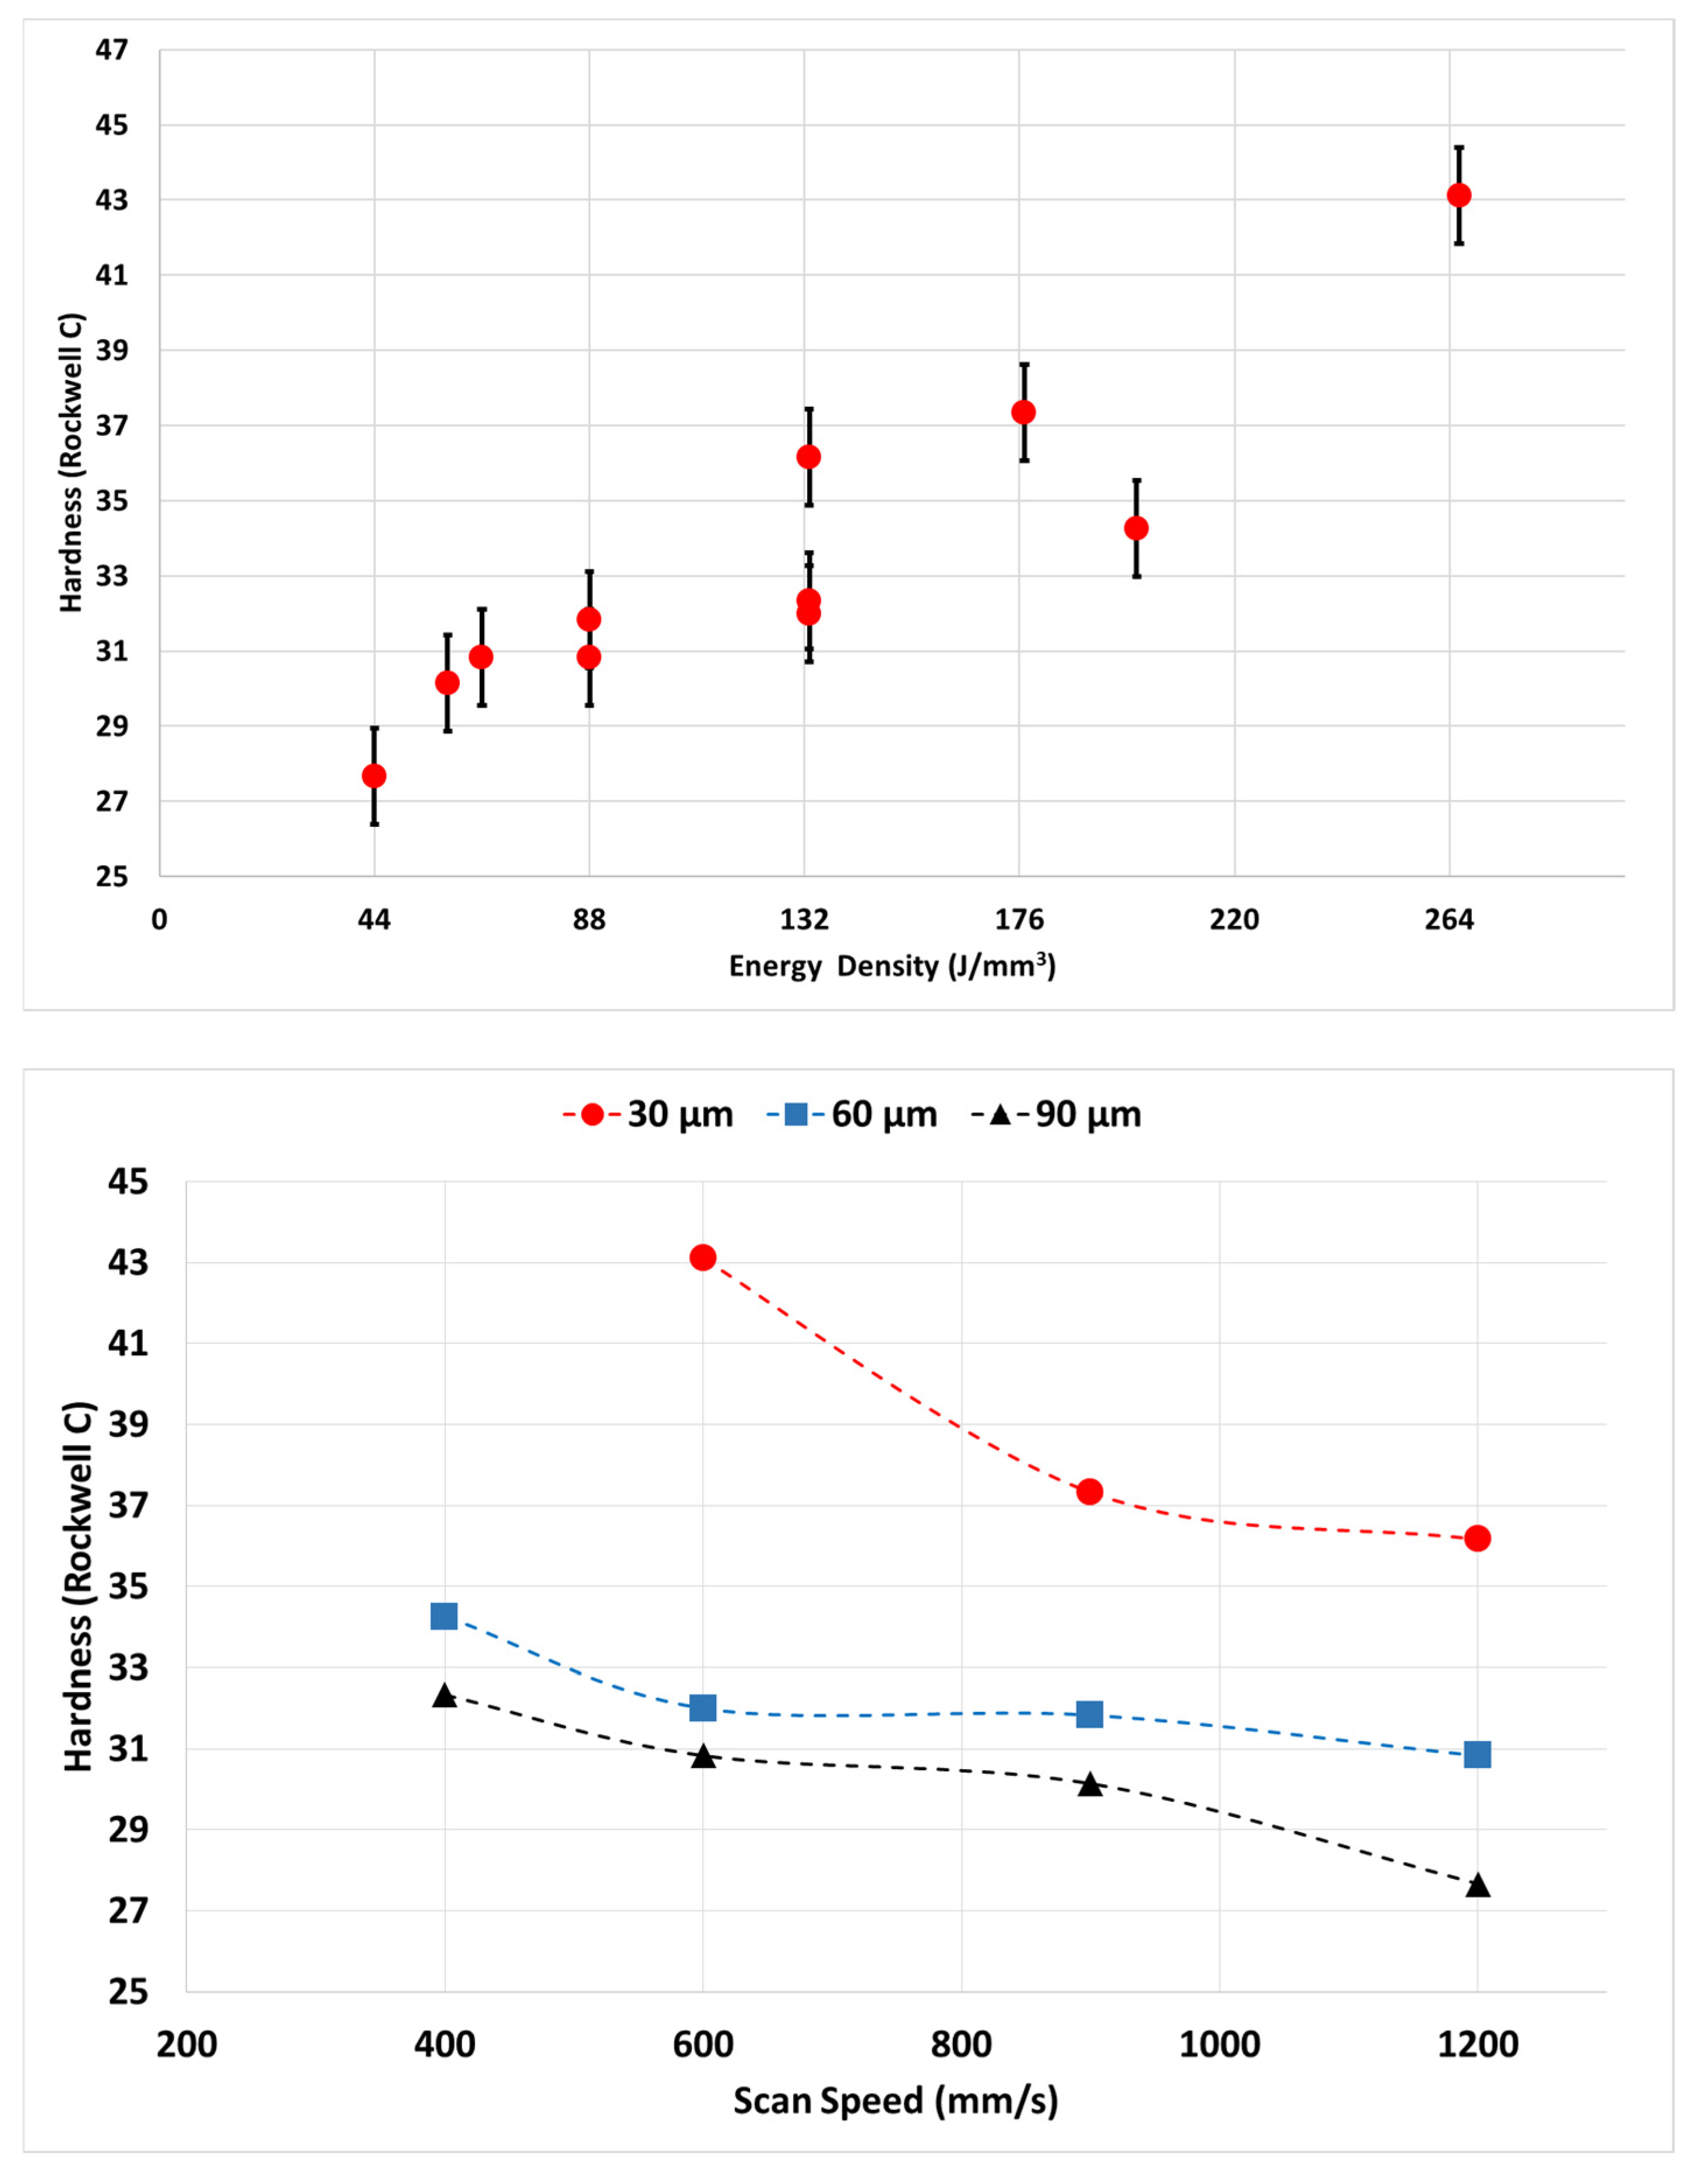
The hardness values of the as-printed samples are shown in Figure 15. The trend of hardness versus energy density closely resembles that of density versus energy density. For instance, although Samples 10 and 11 were produced using relatively high energy densities, their hardness values are lower due to their low densities, which result from the high hatch spacing used during processing. The data show that the sample produced with the highest energy density (266 J/mm3) exhibits the highest hardness. However, XRD analysis (Figure 14) indicates that this sample contains a larger amount of β phase, which would typically be expected to result in lower hardness. This unexpected outcome is attributed to solid solution strengthening [28,61]. Wang et al. [25] reported similar findings in their study on the effect of Nb content in laser-processed Ti-Nb alloys, where increased β phase content resulted in higher hardness due to grain refinement and solid solution hardening. Hardness values are generally higher in samples produced with narrower hatch spacing. A smaller hatch spacing leads to closer melt pools and thus enhances the diffusion of niobium throughout the structure. This suggests that the solid solution strengthening effect is more pronounced in these samples.
Five samples were produced at the lowest (44 J/mm3) and highest (266 J/mm3) energy densities to determine their elastic modulus values. The sample produced at the lower energy density exhibited an elastic modulus of 35.28 (±0.75) GPa, while the sample processed at the higher energy density showed a value of 38.23 (±0.5) GPa. These results agree with the findings of Smith Wang et al. [25], who reported an elastic modulus of 24 GPa for the Ti-15Nb alloy. The higher elastic modulus values observed in this study are likely due to differences in β phase content. Although the measured elastic modulus values are lower than that of Ti6Al4V, they remain higher than that of cortical bone. It is known that lower elastic modulus values can be achieved through porous manufacturing; however, this may adversely affect biocorrosion resistance due to increased surface area [16]. Although no visible porosities were observed in the microstructure (Figure 9), the presence of micro-scale porosity—typical of the LPBF process—may have contributed to the slightly reduced elastic modulus compared to cast [67] or sintered [16] counterparts.
The tensile strength of the specimens produced at 44 J/mm3 and 266 J/mm3 was measured as 1100 ± 50 MPa and 920 ± 40 MPa, respectively. Similarly, Vrancken et al. [26] reported a decrease in tensile strength with increasing β-phase content. As seen in Figure 9 and Figure 10, the specimen fabricated at 266 J/mm3 exhibits a microstructure composed of equiaxed grains and a continuous grain boundary network. As previously noted, in such alloys, the α phase nucleates along prior β grain boundaries during solidification [63]. This brittle α-phase grain boundary network is likely responsible for the transgranular fracture behavior observed in the sample produced at 266 J/mm3, ultimately resulting in lower tensile strength compared to the sample produced at 44 J/mm3 [68]. Motyka et al. [69] suggested that maximum tensile strength is typically achieved in alloys containing approximately equal amounts of α and β phases. Therefore, the higher α-phase content in the sample fabricated at 44 J/mm3 (Figure 14) may contribute to its superior tensile strength. In conclusion, while the presence of α phase at β grain boundaries may enhance hardness, it has a detrimental effect on tensile strength due to the brittle nature of the α phase.

4. Conclusions

The completed study has provided valuable insights into the production of Ti-Nb alloys using laser powder bed fusion (L-PBF). The effects of process parameters on surface roughness, density, microstructural characteristics, hardness, and phase formation were systematically investigated. The main conclusions are as follows:
  • The Ti16Nb5Al3V2Hf alloy was successfully fabricated using two master alloys (Ti6Al4V and C-103) under various processing conditions.
  • A total of 11 samples were produced using eight different energy density values. While nine samples exhibited porosity below 0.5%, two samples showed significantly higher porosity levels, ranging from 3.6% to 4.4%.
  • The highest porosity was observed in a sample produced at 200 J/mm3, despite this being a relatively high energy density. This sample had the highest hatch spacing and the lowest scan speed, suggesting that low scan speeds combined with wide hatch spacing lead to decreased part density.
  • Surface roughness measurements ranged from 3.14 to 4.89 μm for top surfaces, and from 6.97 to 7.91 μm for side surfaces. For top surfaces, higher energy densities resulted in smoother finishes. However, the effect of energy density on side surface roughness was less pronounced.
  • Microstructural analysis of the samples produced with the lowest and highest energy densities showed a uniform distribution of Nb. Nevertheless, unmelted Nb particles were observed in all samples except the one produced using the highest energy density combined with low scan speed and narrow hatch spacing.
  • XRD results showed that the β phase was dominant in the sample produced with the highest energy density, due to enhanced diffusion of Nb, a known β stabilizer. Conversely, the α phase was dominant in the sample produced with the lowest energy input.
  • The hardness values ranged from 28 to 43 HRC. The highest hardness was attributed to solid solution strengthening resulting from a finer and more uniform distribution of Nb. Elastic modulus values of 35.28 GPa and 38.23 GPa were measured for samples produced at the lowest and highest energy densities, respectively. These values are closer to that of human cortical bone than those of conventional Ti-Nb alloys.
  • Overall, the findings demonstrate that L-PBF is an effective method for producing Ti-Nb-based alloys with improved microstructural and mechanical properties compared to traditional manufacturing techniques.

Author Contributions

Investigation, A.G., V.K.B. and A.A.A.; conceptualization, A.G., V.K.B., A.A.A. and S.V.A.; methodology, A.G., S.D.N. and V.K.B.; software, S.D.N. and A.A.A.; writing—original draft preparation, A.G.; writing—review and editing, A.G., V.K.B. and S.V.A.; supervision, S.V.A.; project administration, S.V.A. All authors have read and agreed to the published version of the manuscript.

Funding

This research was funded by the Turkish National Scientific Council (Tubitak) via the 2219-International Postdoctoral Research Fellowship Program, Grant No. 1059B191800747.

Data Availability Statement

The original contributions presented in this study are included in the article. Further inquiries can be directed to the corresponding author.

Acknowledgments

One of the authors (A.G.) gratefully acknowledges the support of the Scientific and Technological Research Council of Türkiye (TÜBİTAK) through the 2219 International Postdoctoral Research Fellowship Program.

Conflicts of Interest

The authors declare no conflicts of interest.

References

  1. Niinomi, M. Mechanical Properties of Biomedical Titanium Alloys. Mater. Sci. Eng. A 1998, 243, 231–236. [Google Scholar] [CrossRef]
  2. Pilliar, R.M. Metallic Biomaterials. In Biomedical Materials; Springer: Boston, MA, USA, 2009; pp. 41–81. [Google Scholar] [CrossRef]
  3. Guo, S.; Meng, Q.; Zhao, X.; Wei, Q.; Xu, H. Design and Fabrication of a Metastable β-Type Titanium Alloy with Ultralow Elastic Modulus and High Strength. Sci. Rep. 2015, 5, 14688. [Google Scholar] [CrossRef] [PubMed]
  4. Meng, Q.; Zhang, J.; Huo, Y.; Sui, Y.; Zhang, J.; Guo, S.; Zhao, X. Design of Low Modulus β-Type Titanium Alloys by Tuning Shear Modulus C44. J. Alloys Compd. 2018, 745, 579–585. [Google Scholar] [CrossRef]
  5. Zhang, L.; Chen, L. A Review on Biomedical Titanium Alloys: Recent Progress and Prospect. Adv. Eng. Mater. 2019, 21, 1801215. [Google Scholar] [CrossRef]
  6. Peters, M.; Kumpfert, J.; Ward, C.H.; Leyens, C. Titanium Alloys for Aerospace Applications. Adv. Eng. Mater. 2003, 5, 419–427. [Google Scholar] [CrossRef]
  7. Ridzwan, M.I.Z.; Shuib, S.; Hassan, A.Y.; Shokri, A.A.; Mohammad Ibrahim, M.N. Problem of Stress Shielding and Improvement to the Hip Implant Designs: A Review. J. Med. Sci. 2007, 7, 460–467. [Google Scholar] [CrossRef]
  8. Yamamoto, N.; Ohno, K.; Hayashi, K.; Kuriyama, H.; Yasuda, K.; Kaneda, K. Effects of Stress Shielding on the Mechanical Properties of Rabbit Patellar Tendon. J. Biomech. Eng. 1993, 115, 23–28. [Google Scholar] [CrossRef]
  9. Niinomi, M.; Nakai, M. Titanium-Based Biomaterials for Preventing Stress Shielding between Implant Devices and Bone. Int. J. Biomater. 2011, 2011, 836587. [Google Scholar] [CrossRef] [PubMed]
  10. Wachter, N.J.; Augat, P.; Krischak, G.D.; Mentzel, M.; Kinzl, L.; Claes, L. Prediction of Cortical Bone Porosity in Vitro by Microcomputed Tomography. Calcif. Tissue Int. 2001, 68, 38–42. [Google Scholar] [CrossRef]
  11. Prasad, K.; Bazaka, O.; Chua, M.; Rochford, M.; Fedrick, L.; Spoor, J.; Symes, R.; Tieppo, M.; Collins, C.; Cao, A.; et al. Metallic Biomaterials: Current Challenges and Opportunities. Materials 2017, 10, 884. [Google Scholar] [CrossRef]
  12. Yılmaz, E.; Gökçe, A.; Findik, F.; Gülsoy, H.Ö. Biomedical Porous Ti-16Nb-10Zr-(0–15)Ta Alloys. Int. J. Mater. Res. 2019, 110, 375–378. [Google Scholar] [CrossRef]
  13. Yılmaz, E.; Gökçe, A.; Findik, F.; Gulsoy, H.Ö. Metallurgical Properties and Biomimetic HA Deposition Performance of Ti-Nb PIM Alloys. J. Alloys Compd. 2018, 746, 301–313. [Google Scholar] [CrossRef]
  14. Kim, D.G.; Woo, K.D.; Kang, D.S.; Lee, T.; Lee, M.H. Fabrication and Biocompatibility Evaluation of Porous Ti-Nb-Based Biomaterials with Space Holder by Rapid Sintering. Mater. Res. Innov. 2015, 19, S1-301–S1-304. [Google Scholar] [CrossRef]
  15. de Oliveira, C.S.S.; Griza, S.; de Oliveira, M.V.; Ribeiro, A.A.; Leite, M.B. Study of the Porous Ti35Nb Alloy Processing Parameters for Implant Applications. Powder Technol. 2015, 281, 91–98. [Google Scholar] [CrossRef]
  16. Yılmaz, E.; Gökçe, A.; Findik, F.; Gulsoy, H.O.; İyibilgin, O. Mechanical Properties and Electrochemical Behavior of Porous Ti-Nb Biomaterials. J. Mech. Behav. Biomed. Mater. 2018, 87, 59–67. [Google Scholar] [CrossRef]
  17. Yılmaz, E.; Gökçe, A.; Fındık, F.; Gülsoy, H.Ö. Effects of Nb Content on the Microstructural and Mechanical Properties of the Biomedical PM Ti-Nb Alloys. Pamukkale Univ. J. Eng. Sci. 2017, 23, 945–948. [Google Scholar] [CrossRef]
  18. Zhou, Y.L.; Niinomi, M.; Akahori, T. Mechanical Properties of Binary Ti-Ta Alloys for Biomedical Applications. Mater. Sci. Forum 2004, 449–452, 1089–1092. [Google Scholar] [CrossRef]
  19. Oliveira, N.T.C.; Aleixo, G.; Caram, R.; Guastaldi, A.C. Development of Ti–Mo Alloys for Biomedical Applications: Microstructure and Electrochemical Characterization. Mater. Sci. Eng. A 2007, 452–453, 727–731. [Google Scholar] [CrossRef]
  20. Upadhyaya, G.S. Sintered Metallic and Ceramic Materials—Preparation, Properties and Applications; Wiley: Hoboken, NJ, USA, 2001; p. 22. [Google Scholar] [CrossRef]
  21. Colaco, M.; Igel, D.A.; Atala, A. The Potential of 3D Printing in Urological Research and Patient Care. Nat. Rev. Urol. 2018, 15, 213–221. [Google Scholar] [CrossRef]
  22. Frazier, W.E. Metal Additive Manufacturing: A Review. J. Mater. Eng. Perform. 2014, 23, 1917–1928. [Google Scholar] [CrossRef]
  23. Fischer, M.; Joguet, D.; Robin, G.; Peltier, L.; Laheurte, P. In Situ Elaboration of a Binary Ti–26Nb Alloy by Selective Laser Melting of Elemental Titanium and Niobium Mixed Powders. Mater. Sci. Eng. C 2016, 62, 852–859. [Google Scholar] [CrossRef]
  24. Schwab, H.; Prashanth, K.; Löber, L.; Kühn, U.; Eckert, J. Selective Laser Melting of Ti-45Nb Alloy. Metals 2015, 5, 686–694. [Google Scholar] [CrossRef]
  25. Wang, Q.; Han, C.; Choma, T.; Wei, Q.; Yan, C.; Song, B.; Shi, Y. Effect of Nb Content on Microstructure, Property and in Vitro Apatite-Forming Capability of Ti-Nb Alloys Fabricated via Selective Laser Melting. Mater. Des. 2017, 126, 268–277. [Google Scholar] [CrossRef]
  26. Vrancken, B.; Thijs, L.; Kruth, J.-P.P.; Van Humbeeck, J. Microstructure and Mechanical Properties of a Novel β Titanium Metallic Composite by Selective Laser Melting. Acta Mater. 2014, 68, 150–158. [Google Scholar] [CrossRef]
  27. Fan, Z.; Feng, H. Study on Selective Laser Melting and Heat Treatment of Ti-6Al-4V Alloy. Results Phys. 2018, 10, 660–664. [Google Scholar] [CrossRef]
  28. Yılmaz, E.; Gökçe, A.; Findik, F.; Gülsoy, H.Ö. Characterization of Biomedical Ti-16Nb-(0–4)Sn Alloys Produced by Powder Injection Molding. Vacuum 2017, 142, 164–174. [Google Scholar] [CrossRef]
  29. Yılmaz, E.; Gökçe, A.; Fındık, F.; Gülsoy, H.Ö. Electrochemical Corrosion Behavior of Ti and Ti-16Nb Alloy for Implant Applications. In Proceedings of the 8th International Advanced Technologies Symposium (IATS’17), Elazığ, Turkey, 19–21 October 2017; Özdemir, N., Esen, H., Eds.; Fırat University/IATS: Elazığ, Turkey, 2017; Volume 8, pp. 2244–2251. [Google Scholar]
  30. Yılmaz, E.; Gökçe, A.; Findik, F.; Gulsoy, H.Ö. Assessment of Ti–16Nb–XZr Alloys Produced via PIM for Implant Applications. J. Therm. Anal. Calorim. 2017, 134, 7–14. [Google Scholar] [CrossRef]
  31. Yılmaz, E.; Gökçe, A.; Fındık, F.; Gülsoy, H.Ö. Influence of Zr Addition on the Corrosion Behavior of Biomedical PIM Ti-16Nb Alloy in SBF. Int. J. Mater. Res. 2019, 110, 379–381. [Google Scholar] [CrossRef]
  32. Yılmaz, E.; Çakıroğlu, B.; Gökçe, A.; Findik, F.; Gulsoy, H.O.; Gulsoy, N.; Mutlu, Ö.; Özacar, M. Novel Hydroxyapatite/Graphene Oxide/Collagen Bioactive Composite Coating on Ti16Nb Alloys by Electrodeposition. Mater. Sci. Eng. C 2019, 101, 292–305. [Google Scholar] [CrossRef]
  33. ASTM B212-17; Standard Test Method for Apparent Density of Free-Flowing Metal Powders Using the Hall Flowmeter Funnel. ASTM International: West Conshohocken, PA, USA, 2017.
  34. ASTM B527-20; Standard Test Method for Tap Density of Metal Powders and Compounds. ASTM International: West Conshohocken, PA, USA, 2020.
  35. Enneti, R.K.; Morgan, R.; Atre, S.V. Effect of Process Parameters on the Selective Laser Melting (SLM) of Tungsten. Int. J. Refract. Met. Hard Mater. 2018, 71, 315–319. [Google Scholar] [CrossRef]
  36. Nath, S.D.; Clinning, E.; Gupta, G.; Wuelfrath-Poirier, V.; L’Espérance, G.; Gulsoy, O.; Kearns, M.; Atre, S.V. Effects of Nb and Mo on the Microstructure and Properties of 420 Stainless Steel Processed by Laser-Powder Bed Fusion. Addit. Manuf. 2019, 28, 682–691. [Google Scholar] [CrossRef]
  37. Nath, S.D.; Irrinki, H.; Gupta, G.; Kearns, M.; Gulsoy, O.; Atre, S. Microstructure-Property Relationships of 420 Stainless Steel Fabricated by Laser-Powder Bed Fusion. Powder Technol. 2019, 343, 738–746. [Google Scholar] [CrossRef]
  38. Akilan, A.A.; Gökçe, A.; Nath, S.D.; Balla, V.K.; Kate, K.H.; Atre, S.V. Laser Powder Bed Fusion of In-Situ Composites Using Dry-Mixed Ti6Al4V and Si3N4 Powder. J. Manuf. Process. 2020, 59, 43–50. [Google Scholar] [CrossRef]
  39. ISO 4287; Geometrical Product Specifications (GPS), Surface Texture: Profile Method—Terms, Definitions and Surface Texture Parameters. ISO: Geneva, Switzerland, 1997.
  40. ASTM E8/E8M-16a; Standard Test Methods for Tension Testing of Metallic Materials. ASTM International: West Conshohocken, PA, USA, 2016.
  41. Tan, Y.; Zheng, J.; Gao, W.; Jiang, S.; Feng, Y. The Effect of Powder Flowability in the Selective Laser Sintering Process. In Proceedings of the 7th International Conference on Discrete Element Methods, DEM 2016, Dalian, China, 1–8 August 2016; 2016; pp. 629–636. [Google Scholar]
  42. Gibbons, D.W.; Govender, P.; van der Merwe, A.F. Metal Powder Feedstock Evaluation and Management for Powder Bed Fusion: A Review of Literature, Standards, and Practical Guidelines. Prog. Addit. Manuf. 2023, 9, 805–833. [Google Scholar] [CrossRef]
  43. Saker, A.; Cares-Pacheco, M.-G.; Marchal, P.; Falk, V. Powders Flowability Assessment in Granular Compaction: What about the Consistency of Hausner Ratio? Powder Technol. 2019, 354, 52–63. [Google Scholar] [CrossRef]
  44. Fitzpatrick, J. Powder Properties in Food Production Systems. In Handbook of Food Powders; Elsevier: Amsterdam, The Netherlands, 2013; pp. 285–308. [Google Scholar]
  45. Hong, I.-T.; Koo, C.-H. Vacuum-Furnace Brazing of C103 and Ti–6Al–4V with Ti–15Cu–15Ni Filler-Metal. Mater. Sci. Eng. A 2005, 398, 113–127. [Google Scholar] [CrossRef]
  46. Calignano, F.; Manfredi, D.; Ambrosio, E.P.; Iuliano, L.; Fino, P. Influence of Process Parameters on Surface Roughness of Aluminum Parts Produced by DMLS. Int. J. Adv. Manuf. Technol. 2013, 67, 2743–2751. [Google Scholar] [CrossRef]
  47. Han, M.K.; Kim, J.Y.; Hwang, M.J.; Song, H.J.; Park, Y.J. Effect of Nb on the Microstructure, Mechanical Properties, Corrosion Behavior, and Cytotoxicity of Ti-Nb Alloys. Materials 2015, 8, 5986–6003. [Google Scholar] [CrossRef]
  48. Mazumder, J.; Dutta, D.; Kikuchi, N.; Ghosh, A. Closed Loop Direct Metal Deposition: Art to Part. Opt. Lasers Eng. 2000, 34, 397–414. [Google Scholar] [CrossRef]
  49. Kaplan, A.F.H.; Groboth, G. Process Analysis of Laser Beam Cladding. J. Manuf. Sci. Eng. 2001, 123, 609. [Google Scholar] [CrossRef]
  50. Kruth, J.P.; Froyen, L.; Van Vaerenbergh, J.; Mercelis, P.; Rombouts, M.; Lauwers, B. Selective Laser Melting of Iron-Based Powder. J. Mater. Process. Technol. 2004, 149, 616–622. [Google Scholar] [CrossRef]
  51. Król, M.; Tański, T. Surface Quality Research for Selective Laser Melting of Ti-6Al-4V Alloy. Arch. Metall. Mater. 2016, 61, 1291–1296. [Google Scholar] [CrossRef]
  52. Chen, Z.; Lu, Y.; Luo, F.; Zhang, S.; Wei, P.; Yao, S.; Wang, Y. Effect of Laser Scanning Speed on the Microstructure and Mechanical Properties of Laser-Powder-Bed-Fused K418 Nickel-Based Alloy. Materials 2022, 15, 3045. [Google Scholar] [CrossRef]
  53. Zhang, L.C.; Klemm, D.; Eckert, J.; Hao, Y.L.; Sercombe, T.B. Manufacture by Selective Laser Melting and Mechanical Behavior of a Biomedical Ti–24Nb–4Zr–8Sn Alloy. Scr. Mater. 2011, 65, 21–24. [Google Scholar] [CrossRef]
  54. Kruth, J.-P.; Levy, G.; Klocke, F.; Childs, T.H.C. Consolidation Phenomena in Laser and Powder-Bed Based Layered Manufacturing. CIRP Ann. 2007, 56, 730–759. [Google Scholar] [CrossRef]
  55. Malý, M.; Höller, C.; Skalon, M.; Meier, B.; Koutný, D.; Pichler, R.; Sommitsch, C.; Paloušek, D. Effect of Process Parameters and High-Temperature Preheating on Residual Stress and Relative Density of Ti6Al4V Processed by Selective Laser Melting. Materials 2019, 12, 930. [Google Scholar] [CrossRef]
  56. Torkamany, M.J.; Malek Ghaini, F.; Poursalehi, R. Dissimilar Pulsed Nd:YAG Laser Welding of Pure Niobium to Ti–6Al–4V. Mater. Des. 2014, 53, 915–920. [Google Scholar] [CrossRef]
  57. Borgman, J.M.; Wang, J.; Zani, L.; Conway, P.P.; Torres-Sanchez, C. The Effect of Energy Density and Nb Content on the Microstructure and Mechanical Properties of Selective Laser Melted Ti-(10-30 Wfile:///C:/Users/User/Downloads/1-S2.0-S1044580323000049-Main.Pdft.%) Nb. J. Mater. Eng. Perform. 2021, 30, 8771–8783. [Google Scholar] [CrossRef]
  58. Ren, Y.; Wu, H.; Du, J.; Liu, B.; Wang, X.; Jiao, Z.; Tian, Y.; Baker, I. Effect of Laser Scannings Speed on Microstructure, Tribological and Corrosion Behavior of Ti-23Nb Alloys Produced by Laser Metal Deposition. Mater. Charact. 2023, 197, 112647. [Google Scholar] [CrossRef]
  59. Li, Z.; Xu, H.; Dong, A.; Cai, X.; He, L.; Du, D.; Xing, H.; Zhu, G.; Sun, B. Mechanical Anisotropy of Laser Powder Bed Fusion Fabricated Ti-41Nb Alloy Using Pre-Alloyed Powder: Roles Played by Grain Morphology and Crystallographic Orientation. J. Alloys Compd. 2022, 925, 166572. [Google Scholar] [CrossRef]
  60. Li, Z.; Qiu, J.; Xu, H.; Dong, A.; He, L.; Zhu, G.; Du, D.; Xing, H.; Liu, X.; Sun, B. Characteristics of β-Type Ti-41Nb Alloy Produced by Laser Powder Bed Fusion: Microstructure, Mechanical Properties and in Vitro Biocompatibility. J. Mater. Sci. Technol. 2022, 124, 260–272. [Google Scholar] [CrossRef]
  61. Wang, J.C.; Liu, Y.J.; Qin, P.; Liang, S.X.; Sercombe, T.B.; Zhang, L.C. Selective Laser Melting of Ti–35Nb Composite from Elemental Powder Mixture: Microstructure, Mechanical Behavior and Corrosion Behavior. Mater. Sci. Eng. A 2019, 760, 214–224. [Google Scholar] [CrossRef]
  62. Hooper, P.A. Melt Pool Temperature and Cooling Rates in Laser Powder Bed Fusion. Addit. Manuf. 2018, 22, 548–559. [Google Scholar] [CrossRef]
  63. Foltz, J.W.; Welk, B.; Collins, P.C.; Fraser, H.L.; Williams, J.C. Formation of Grain Boundary α in β Ti Alloys: Its Role in Deformation and Fracture Behavior of These Alloys. Metall. Mater. Trans. A 2011, 42, 645–650. [Google Scholar] [CrossRef]
  64. Silva, L.M.d.; Claro, A.P.R.A.; Buzalaf, M.A.R.; Grandini, C.R. Influence of the Substitutional Solute on the Mechanical Properties of Ti-Nb Binary Alloys for Biomedical Use. Mater. Res. 2012, 15, 355–358. [Google Scholar] [CrossRef]
  65. Hein, M.; Lopes Dias, N.F.; Pramanik, S.; Stangier, D.; Hoyer, K.P.; Tillmann, W.; Schaper, M. Heat Treatments of Metastable β Titanium Alloy Ti-24Nb-4Zr-8Sn Processed by Laser Powder Bed Fusion. Materials 2022, 15, 3774. [Google Scholar] [CrossRef]
  66. Qi, L.; He, S.; Chen, C.; Jiang, B.; Hao, Y.; Ye, H.; Yang, R.; Du, K. Diffusional-Displacive Transformation in a Metastable β Titanium Alloy and Its Strengthening Effect. Acta Mater. 2020, 195, 151–162. [Google Scholar] [CrossRef]
  67. Wang, Y.B.; Zheng, Y.F. The Microstructure and Shape Memory Effect of Ti–16 at.%Nb Alloy. Mater. Lett. 2008, 62, 269–272. [Google Scholar] [CrossRef]
  68. Qiu, C.; Liu, Q. Multi-Scale Microstructural Development and Mechanical Properties of a Selectively Laser Melted Beta Titanium Alloy. Addit. Manuf. 2019, 30, 100893. [Google Scholar] [CrossRef]
  69. Motyka, M.; Kubiak, K.; Sieniawski, J.; Ziaja, W. Phase Transformations and Characterization of α + β Titanium Alloys. In Comprehensive Materials Processing; Elsevier: Amsterdam, The Netherlands, 2014; pp. 7–36. [Google Scholar]
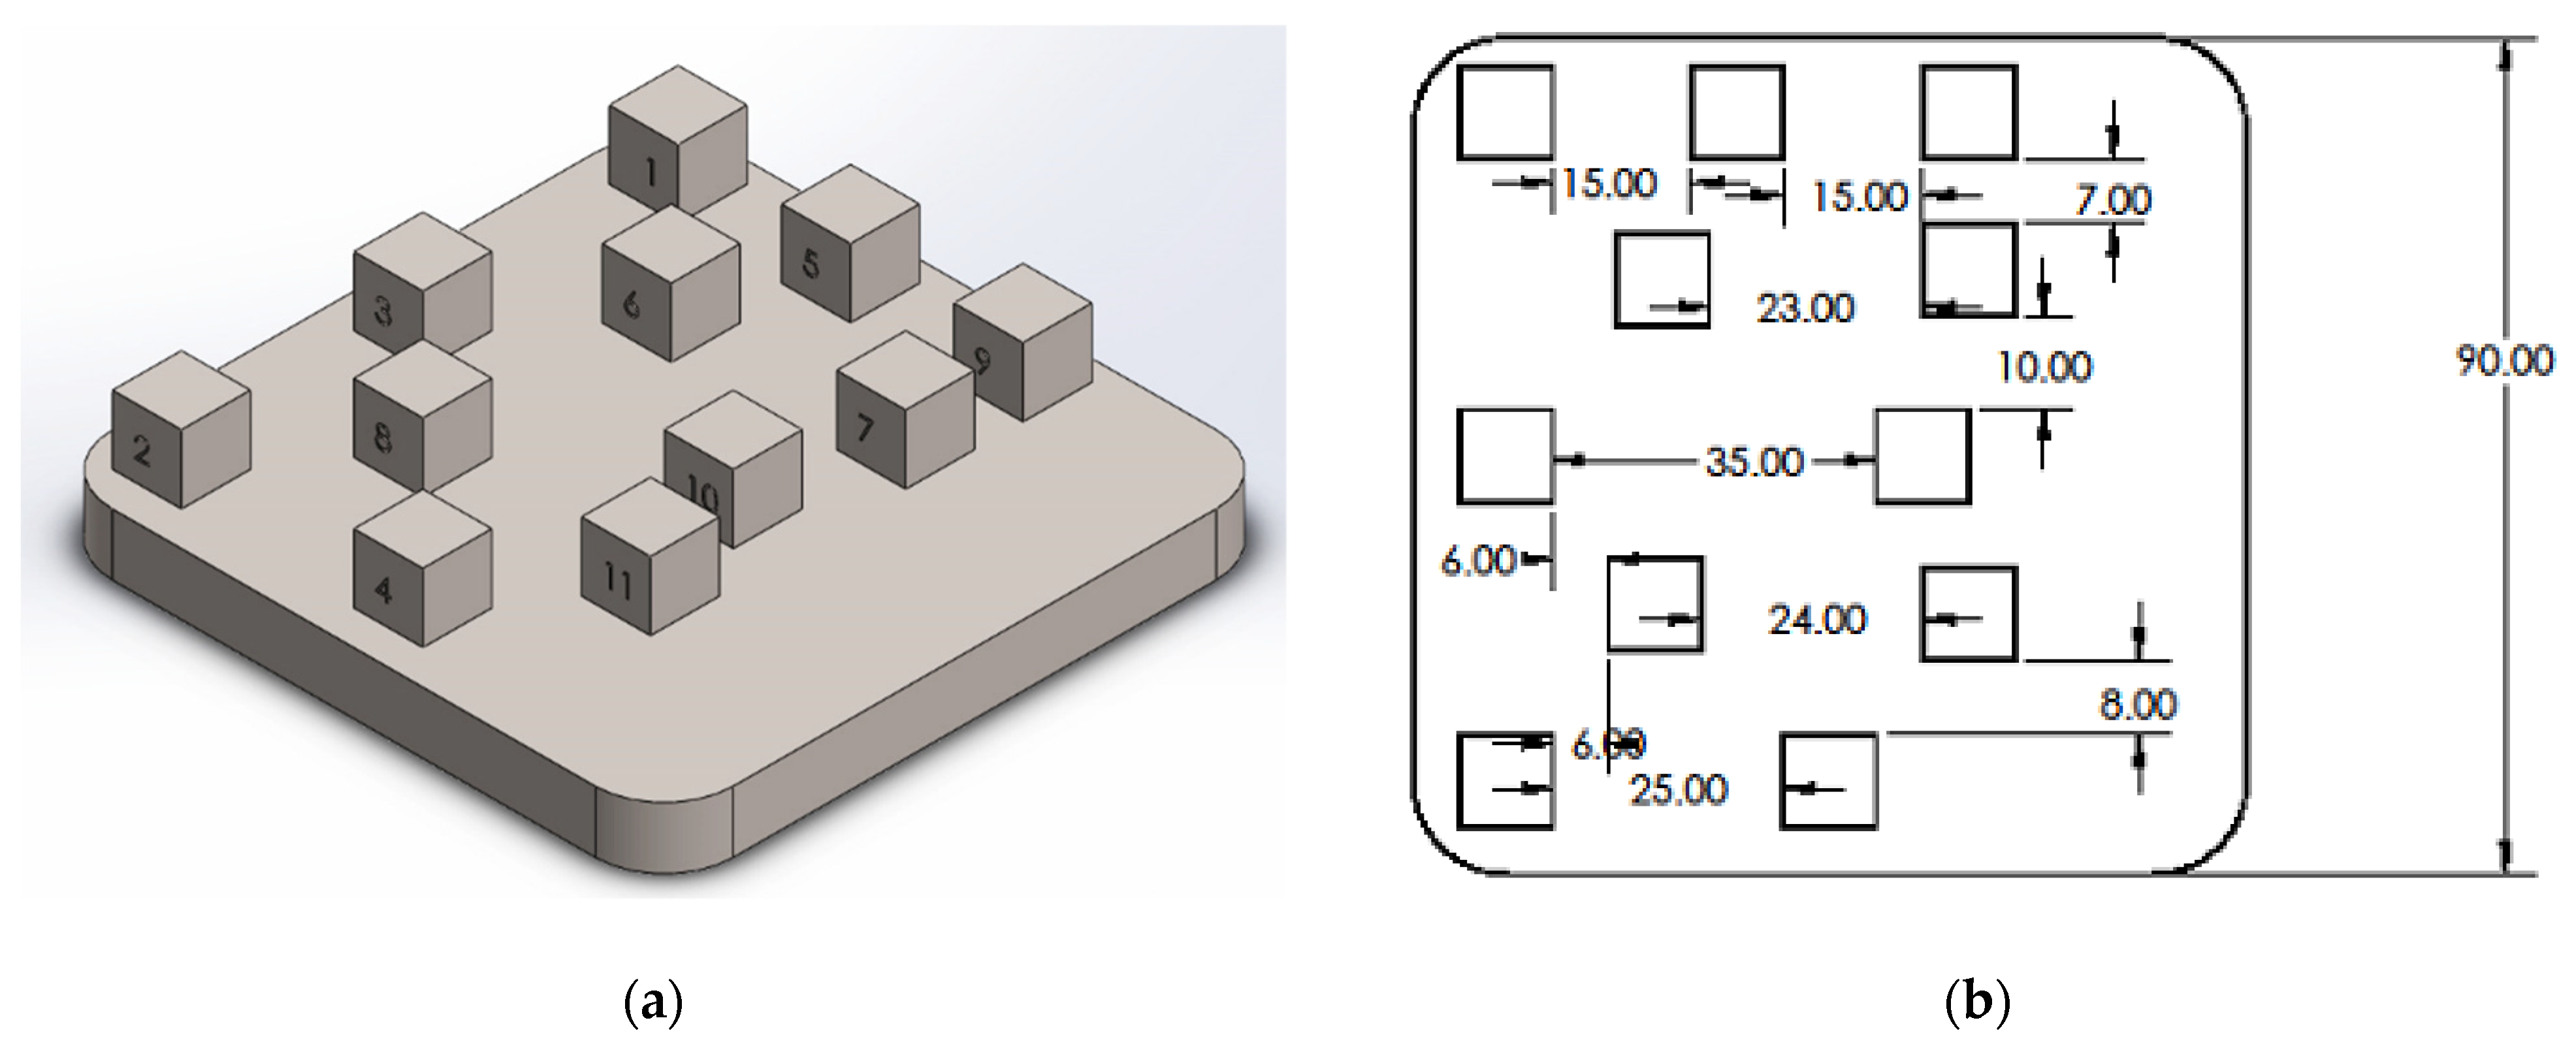
Figure 1. (a) Solid model and (b) the locations of the coupons on the build plate.
Metals 15 00728 g001
Figure 2. SEM images of the (a) Ti6Al4V and (b) C-103 powders used.
Metals 15 00728 g002
Figure 3. Apparent and tap densities of the raw and mixed powders.
Metals 15 00728 g003
Figure 4. XRD patterns of the raw and mixed powders.
Metals 15 00728 g004
Figure 5. The effect of scan speed and hatch space (30–60–90 μm) on surface roughness (Ra) of top and side surfaces.
Metals 15 00728 g005
Figure 6. EDS elemental mapping of the top surface of Sample 1 (266 J/mm3).
Metals 15 00728 g006
Figure 7. X–Z axis of (a) Sample 1 and (b) Sample 9, and (c) EDS spectrum of Sample 9.
Metals 15 00728 g007
Figure 8. The influence of key process parameters on the density of LPBF-manufactured samples. Theoretical density values as a function of scan speed for different hatch spacings (30, 60, and 90 µm) (top). Relative density values plotted against calculated volumetric energy density (J/mm3) (bottom).
Metals 15 00728 g008aMetals 15 00728 g008b
Figure 9. Optical micrographs of etched samples.
Metals 15 00728 g009
Figure 10. Microstructure of the samples under polarized light.
Metals 15 00728 g010
Figure 11. EDS Elemental mapping of Sample 1 (266 J/mm3).
Metals 15 00728 g011aMetals 15 00728 g011b
Figure 12. EDS Elemental mapping of Sample 9 (44 J/mm3).
Metals 15 00728 g012
Figure 13. SEM İmage of the sample produced using the highest energy density.
Metals 15 00728 g013
Figure 14. XRD patterns of the samples produced using various parameters.
Metals 15 00728 g014
Figure 15. Hardness values of the samples as a function of energy density (top), scan speed, and hatch spacing (30, 60, 90 μm) (bottom).
Metals 15 00728 g015
Table 1. Chemical composition of the powders used.
Composition (wt.%)
Ti6Al4VTiAlVFeOCOthers
Balance5.5 (max)3.5–4.50.25 (max)0.13–0.20.08 (max)0.4 (max)
C-103NbHfTiZrTaONOthers
Balance1010.70.50.230.150.4 (max)
Table 2. L-PBF processing parameters and corresponding energy densities used.
Sample
(#)
Layer Thickness (µm)Power (W)Scan Speed (mm/s)Hatch Spacing (µm)Energy Density (J/mm3)
1209660030266
2209660060133
320966009088
4209690030177
520969006088
620969009059
72096120030133
8209612006066
9209612009044
10209640090133
11209640060200
Table 3. Pycnometric densities of the powders.
PowderDensity (g/cm3)
Ti6Al4V4.48 (+0.02–0.01)
C-1038.86 (+0.01–0.03)
18% C-103—82% Ti6Al4V4.91 (+0.01–0.02)
Disclaimer/Publisher’s Note: The statements, opinions and data contained in all publications are solely those of the individual author(s) and contributor(s) and not of MDPI and/or the editor(s). MDPI and/or the editor(s) disclaim responsibility for any injury to people or property resulting from any ideas, methods, instructions or products referred to in the content.