Article

Wear and Corrosion Resistance of Thermally Formed Decorative Oxide Layers on Austenitic Steel

by
Tomasz Borowski
*,
Hubert Wójcik
,
Maciej Spychalski
and
Bogusława Adamczyk-Cieślak
Faculty of Materials Science and Engineering, Warsaw University of Technology, 02-507 Warsaw, Poland
*
Author to whom correspondence should be addressed.
Metals 2025, 15(7), 707; https://doi.org/10.3390/met15070707
Submission received: 13 May 2025 / Revised: 19 June 2025 / Accepted: 19 June 2025 / Published: 25 June 2025

Abstract

This article presents the results of tests on the functional properties of oxide layers (Fe2O3, Cr1.3Fe0.7O3) produced on AISI 316L austenitic steel, which is susceptible to friction wear, using a new, simple, inexpensive, and environmentally friendly process conducted in air at three different temperatures (400 °C, 450 °C and 500 °C). Vickers microhardness tests showed that the process slightly increased hardness only at lower indenter loads, indicating a low thickness of the layers. The greatest increase in hardness was observed in the sample oxidized at the lowest temperature. Tests performed using an optical profilometer showed a tendency for surface roughness to increase with oxidation temperature. Low surface roughness, enhanced microhardness and a low coefficient of friction resulted in the steel oxidized at 400 °C exhibiting the lowest wear rate in the “ball-on-disc” test. The contact angle measurements for all tested samples indicated hydrophilic properties. Potentiodynamic tests showed a deterioration in the corrosion resistance of the steel after oxidation at 450 °C and 500 °C. Oxidation at 400 °C did not cause a significant decrease in pitting corrosion resistance, while an increase in polarization resistance and a decrease in corrosion current density were observed. An interesting phenomenon, requiring further research, is the greatest increase in hardness and wear resistance observed in the layer formed at 400 °C.

Graphical Abstract

1. Introduction

Currently, there is a continuous search for materials that combine high corrosion resistance with long-term durability in products, including bone implants and offshore structures. These materials often demonstrate low hardness and poor resistance to friction wear. AISI 316L austenitic steel, which is relatively inexpensive and widely used—including in implants and medical devices [1,2,3], as well as various other industries [4,5]—suffers from limited surface strength and corrosion resistance, especially in chloride-containing environments. These problems can be mitigated to some extent by using surface engineering methods. Currently, the most commonly used surface treatments for austenitic steels are nitriding [6,7,8,9,10,11,12,13,14,15,16], carburizing [17,18,19,20,21,22], nitrocarburizing [6,23,24,25,26,27,28,29] and DLC (diamond-like carbon) coating deposition [24,30,31,32,33,34,35,36]. The aim of these processes is to increase hardness, resistance to friction wear and corrosion [6,30], as well as to improve hydrophilicity and reduce bacterial adhesion to the surface [37]. One of the most common surface treatments for austenitic steels is ion nitriding [6,7,38]. The properly performed nitriding of austenitic steel provides many benefits, including a significant increase in surface hardness and enhanced resistance to friction wear and corrosion [6,38]. However, all of the above methods require relatively expensive equipment, the use of high-purity gases (e.g. nitrogen, methane or hydrogen) and, in the case of ion treatments, vacuum systems, which further increase their cost.
A promising but unexplored alternative is the thermal oxidation of austenitic steels. Despite the availability of many studies on the surface treatment of austenitic steels, to the best of the authors’ knowledge, no research has addressed the thermal oxidation of austenitic steel in air as a route to enhance its performance properties. There are no scientific publications on this topic, which makes it an area requiring research. An environmentally friendly and inexpensive thermochemical process for austenitic steel can potentially lead to the formation of layers with interesting and useful properties, such as increased corrosion or friction wear resistance, as well as decorative value due to color changes on the steel surface.
The aim of this work was to assess the effects of thermal oxidation of commercially used AISI 316L steel on its phase composition and basic functional properties such as surface roughness, hardness, wettability, friction wear and corrosion resistance of the produced oxide layers and to evaluate their potential industrial applications.

2. Materials and Methods

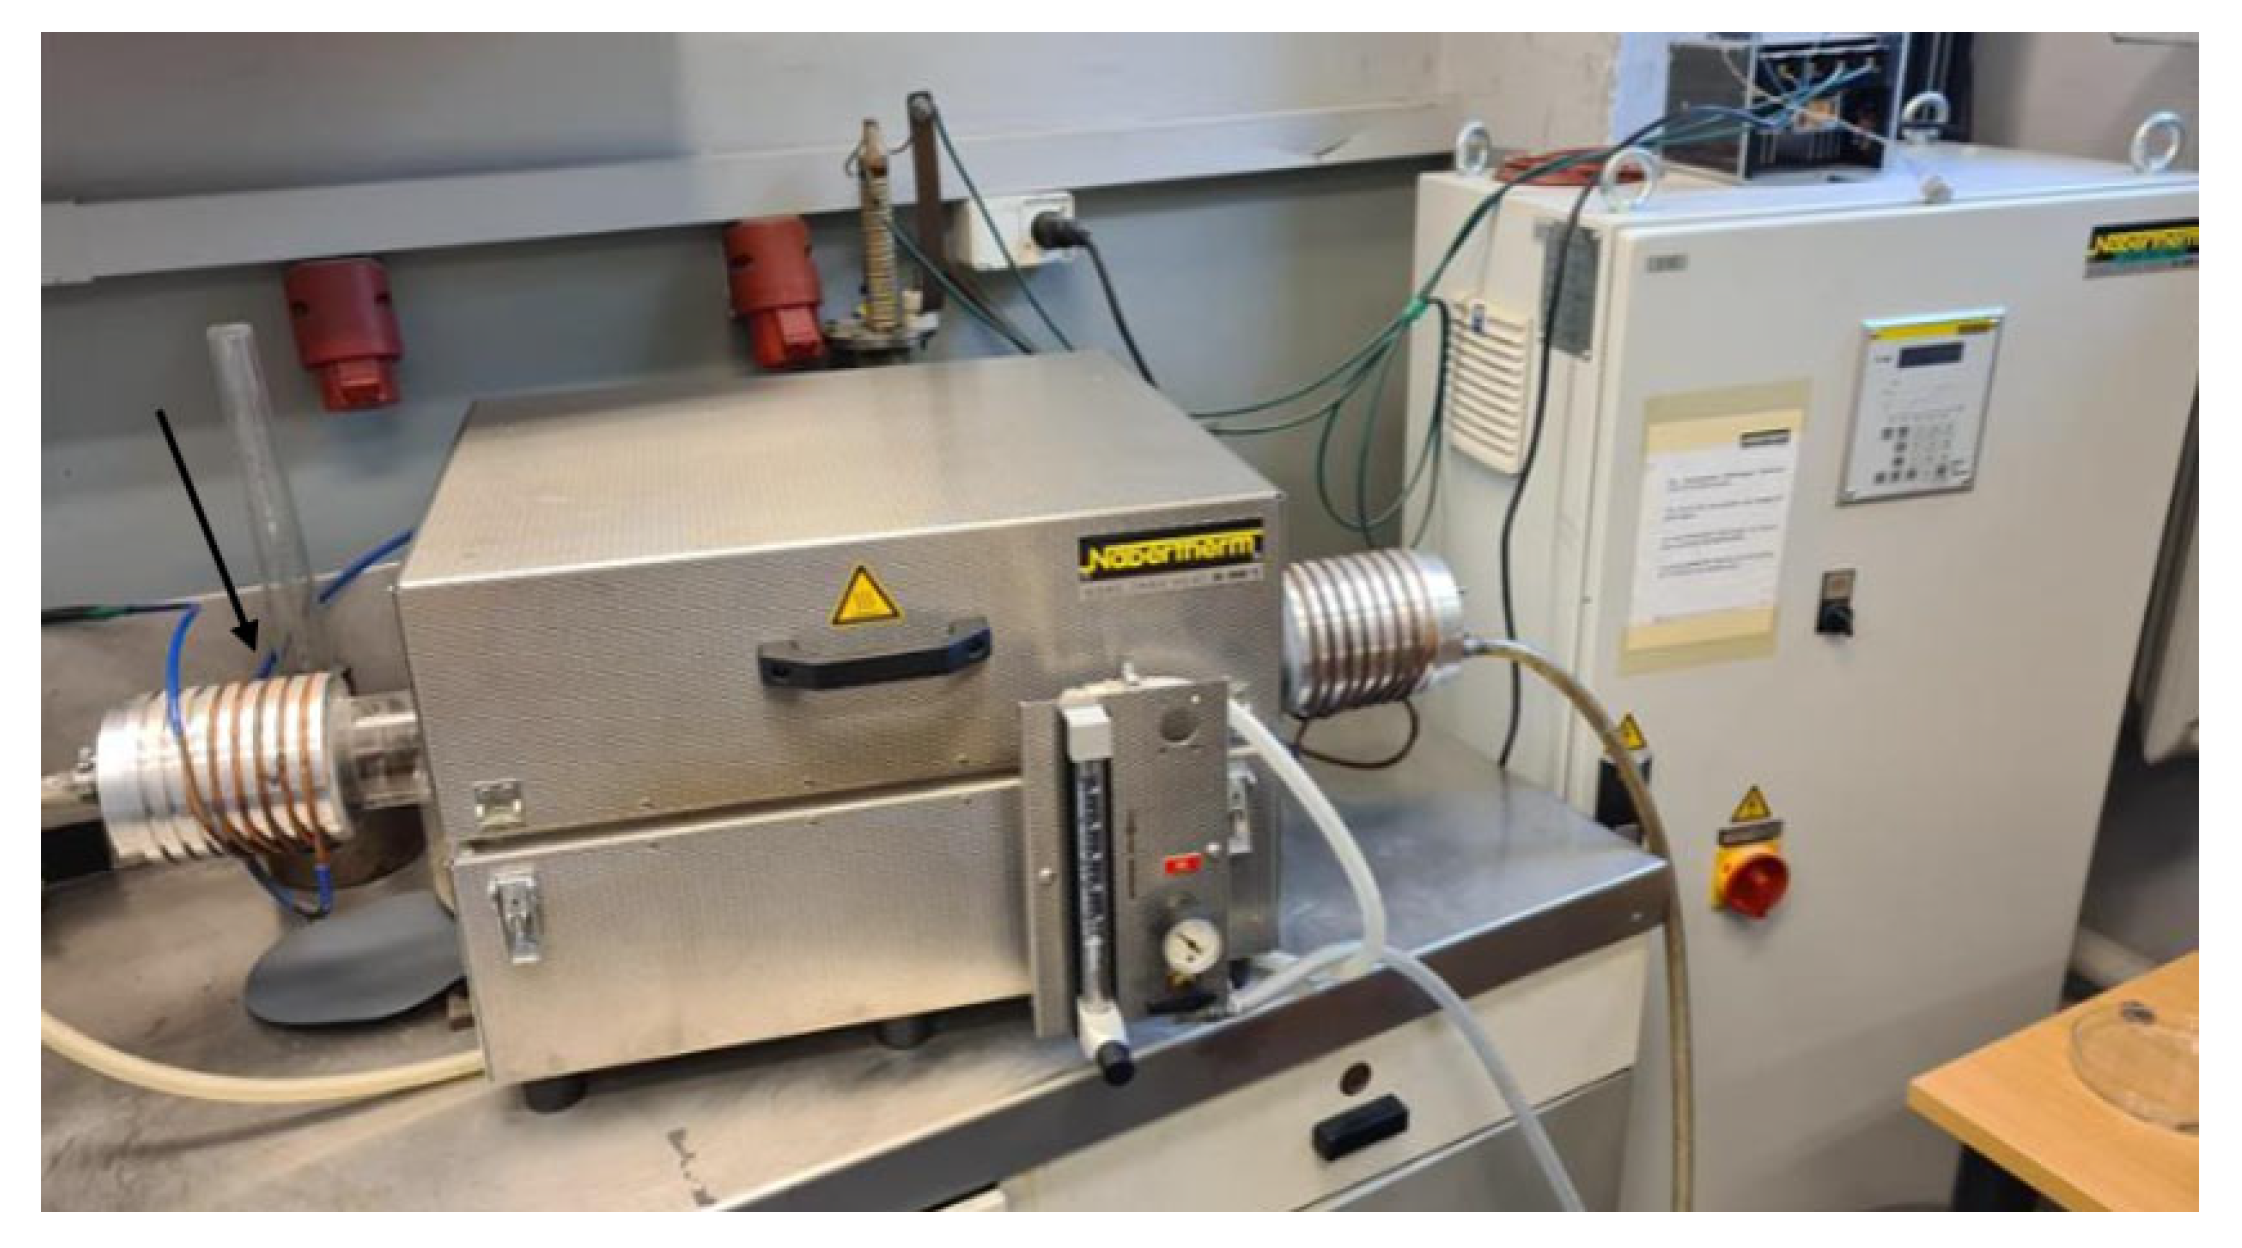
2.1. Specimen Preparation

The flat surfaces of AISI 316L steel samples (Table 1), in the form of ϕ 25 × 6 mm discs cut from a round bar were ground with 240 to 1200 grit abrasive SiC papers (Lam Plan, Gaillard, France), then polished with a 1 μm diamond suspension (Lam Plan, Gaillard, France) and finally degreased in acetone (Chempur, Piekary Śląskie, Poland) using an ultrasonic cleaner (Intersonic, Olsztyn, Poland). The oxide layers were formed by heating the steel in air at three temperatures—400 °C, 450 °C and 500 °C—for 6 h at atmospheric pressure using a tube furnace (Nabertherm, Lilienthal, Germany) (Figure 1).

2.2. Surface Topography and Roughness Tests

Surface topography and roughness of the produced layers were characterized with a Wyko NT9300 optical profilometer (Veeco, Plainview, NY, USA), measuring the Ra (arithmetic mean deviation of the profile from the mean line) and Rz (the sum of the arithmetic mean height of the five highest elevations above the mean line and the average depth of the five lowest depressions below the mean line) parameters at 10× magnification using Vision software, version 4.10. Five roughness measurements were performed for each sample variant, and selected 3D images of the sample surfaces were presented.

2.3. X-Ray Diffraction Measurements

The phase composition of the layers was determined by X-ray diffraction (XRD) using a D8 Advance X-ray diffractometer (Bruker AXS, Karlsruhe, Germany) equipped with a CuKα tube (λ = 0.154056 nm). The tests were carried out at a voltage of 40 kV, a current of 40 mA, a step size of Δ2θ = 0.05° and a counting time of 3 seconds. Thin oxide layers were examined by grazing incidence XRD at an incident angle of 2°. The obtained diffraction patterns were then analyzed using Bruker’s EVA software, version V3.0.

2.4. Microhardness and Friction Wear Resistance Tests

Microhardness was measured using a Shimadzu HMV-G microhardness tester (Shimadzu, Kyoto, Japan) equipped with a Vickers indenter. To assess the effect of oxidation, loads of 0.05 kg, 0.10 kg and 0.20 kg were applied, and seven indents were made for each load and sample.
Dry “ball-on-disc” wear tests were carried out on a T-21 tribotester (ITEE, Radom, Poland) in accordance with ASTM G99–05 and ISO 20808:2004 standards at an ambient temperature of approximately 22 ± 2 °C and a relative humidity of 45%. The tests employed 10 mm diameter Al2O3 balls with a polished finish. They were performed under a load of 5 N for 6000 revolutions at a speed of 145 rpm. Wear resistance was assessed by measuring the groove profile in four locations. Groove geometry was analyzed using a Wyko NT9300 optical profilometer (Veeco, Plainview, NY, USA), and the cross-sectional area was calculated with Vision software. The wear rate (Wv) was calculated using the following equation:
W v = V F n · s m m 3 N · m
where V represents the volume of material worn away, derived from the average cross-sectional area of the grooves and the wear circumference, Fn signifies the axial force, and s denotes the length of the friction track. The wear rates and variations in the friction coefficient were presented on graphs, while the Veeco optical profilometer was employed to visualize selected wear tracks at 3× magnification.

2.5. Corrosion Resistance Tests

The corrosion resistance of AISI 316L steel after surface treatment was tested in a non-deoxygenated 3.5% NaCl solution (Chempur, Piekary Śląskie, Poland). A three-electrode system was used for the tests, with the sample as the working electrode, an Ag/AgCl reference electrode (Eurosensor, Gliwice, Poland), and a platinum wire as the auxiliary electrode. Before testing, the materials were held at open circuit for 2 h using an Atlas-Sollich 1131 potentiostat (Atlas-Sollich, Rębiechowo, Poland) to stabilize their potentials and establish the open circuit potential (Eocp). Potentiodynamic polarization curves were then recorded. In the range of ±250 mV from the Eocp potential, a scan rate of 0.2 mV/s was used; in the remaining range up to 1000 mV, the scan rate was 0.8 mV/s. The measurements were carried out using AtlasCorr11 software, version 1.06. The pitting potentials (Epit) were read from the obtained polarization curves. Using the AtlasLab program, version 2.24, the corrosion current density (icorr), the corrosion potential (Ecorr) with the Tafel method within the scope of applicability, and the polarization resistance (Rpol) using the Stern method were determined. At least three measurements were taken for each layer variant. After potentiodynamic tests, the corroded surfaces were documented using a Nikon Eclipse LV150N microscope (Nikon Instruments, Melville, NY, USA).

2.6. Wettability Tests

In the wettability study, the oxide layers formed on AISI 316L austenitic steel were tested with distilled water. A precision syringe was used to apply droplets to the surface, and a 90 U3 PRO goniometer (ramé-hart Instrument Co., Succasunna, Roxbury, NJ, USA) measured the contact angles. This device was equipped with an adjustable table, LED lamp, and camera. DROPimage software, version 3.22.06.0 was used for angle measurement and image capture. Seven measurements were taken for each variant and averaged.

3. Results and Discussion

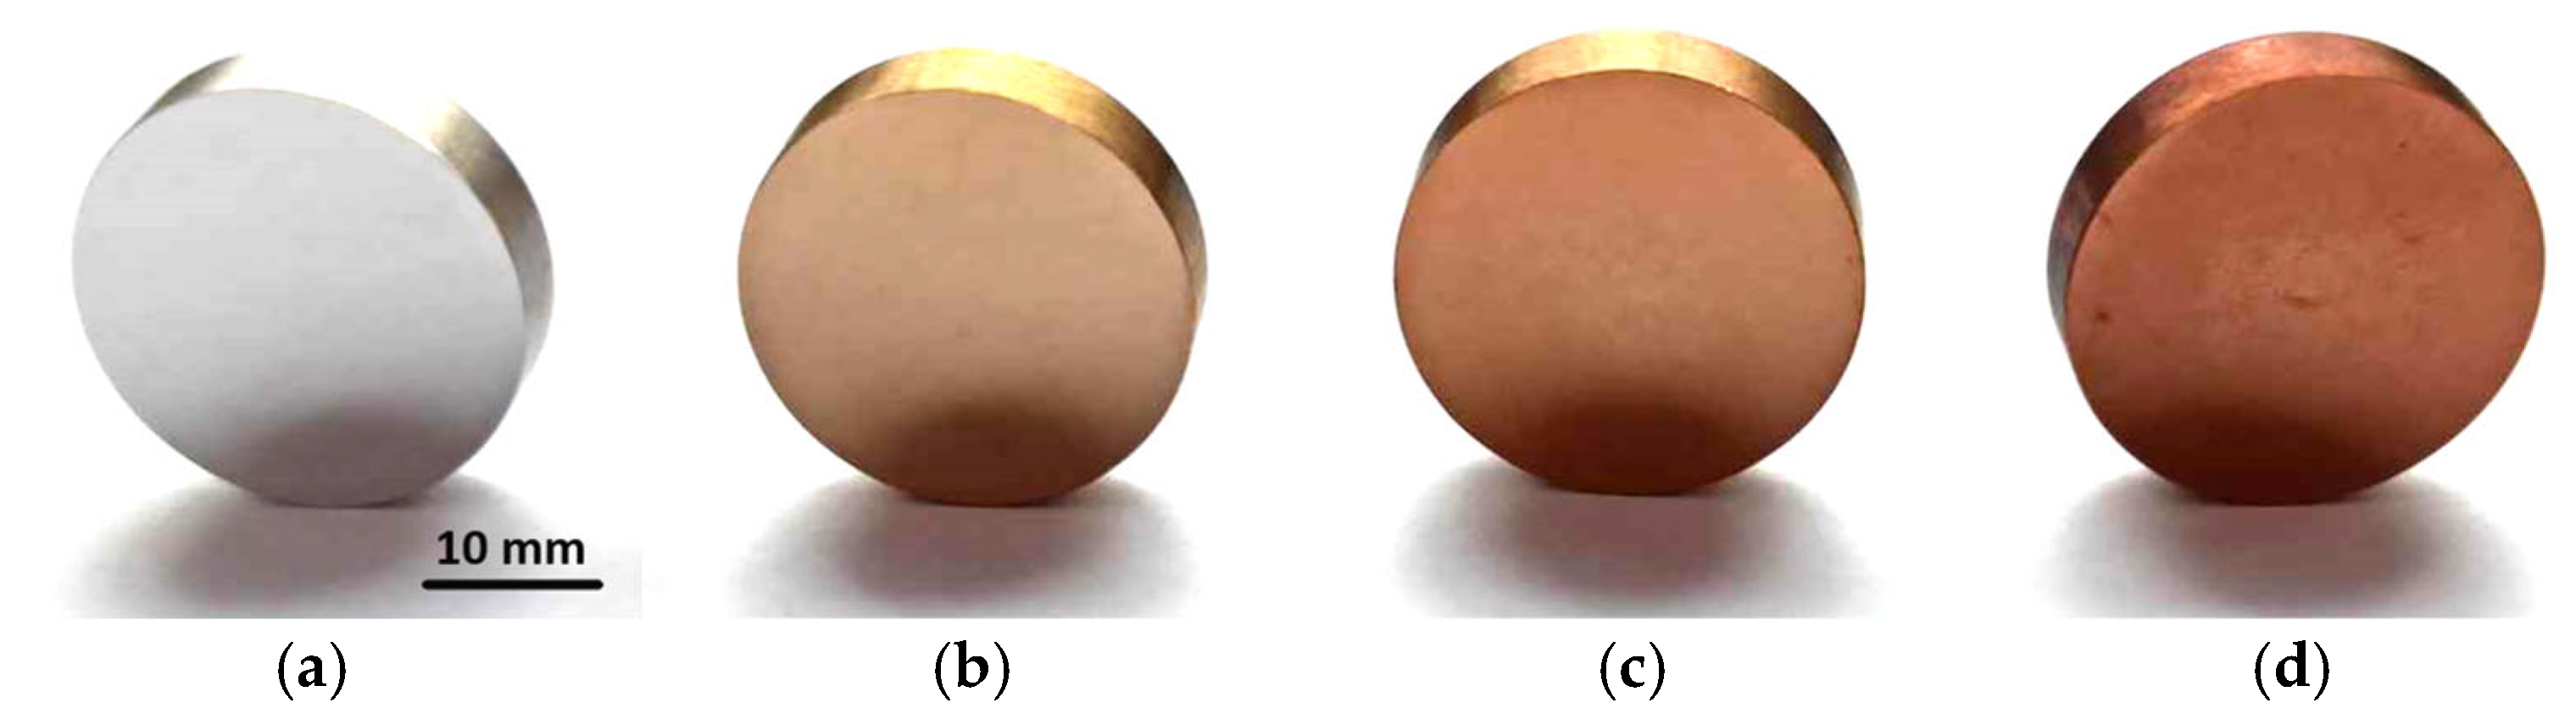
3.1. Surface Appearance

Figure 2 shows the surface appearance of austenitic steel after oxidation in an open furnace under air atmosphere. The initial state exhibits a silver color, typical of polished austenitic steel (Figure 2a). After oxidation at 400 °C, the colour changed to light gold (Figure 2b). A further increase in process temperature darkens the gold shade (Figure 2c), and steel oxidized at 500 °C acquires a rose gold hue (Figure 2d). The darker color may suggest that the layer formed after oxidation is thicker. Oxidation imparts an additional aesthetic appeal to AISI 316L steel.

3.2. Surface Topography and Roughness

Based on tests performed with an optical profilometer, the roughness parameters Ra and Rz were determined (Table 2). The control sample with a polished surface shows the lowest roughness, i.e., Ra = 33.1 nm and Rz = 989.6 nm. The parameters Ra and Rz after the oxidation process conducted at 400 °C were almost double those of the initial state. By contrast, the highest values of roughness parameters were obtained for steel oxidized at 500 °C. Thus, as the oxidation temperature increases, so does the roughness of the steel surface.
The 3D images shown in Figure 3 confirm the increase in surface development with the rising in oxidation temperature of the 316L austenitic steel, which made the material more uneven due to oxide formation. The shift from light gold to dark gold shades (Figure 2b–d) may also be due to the significant surface development (Table 2, Figure 3).

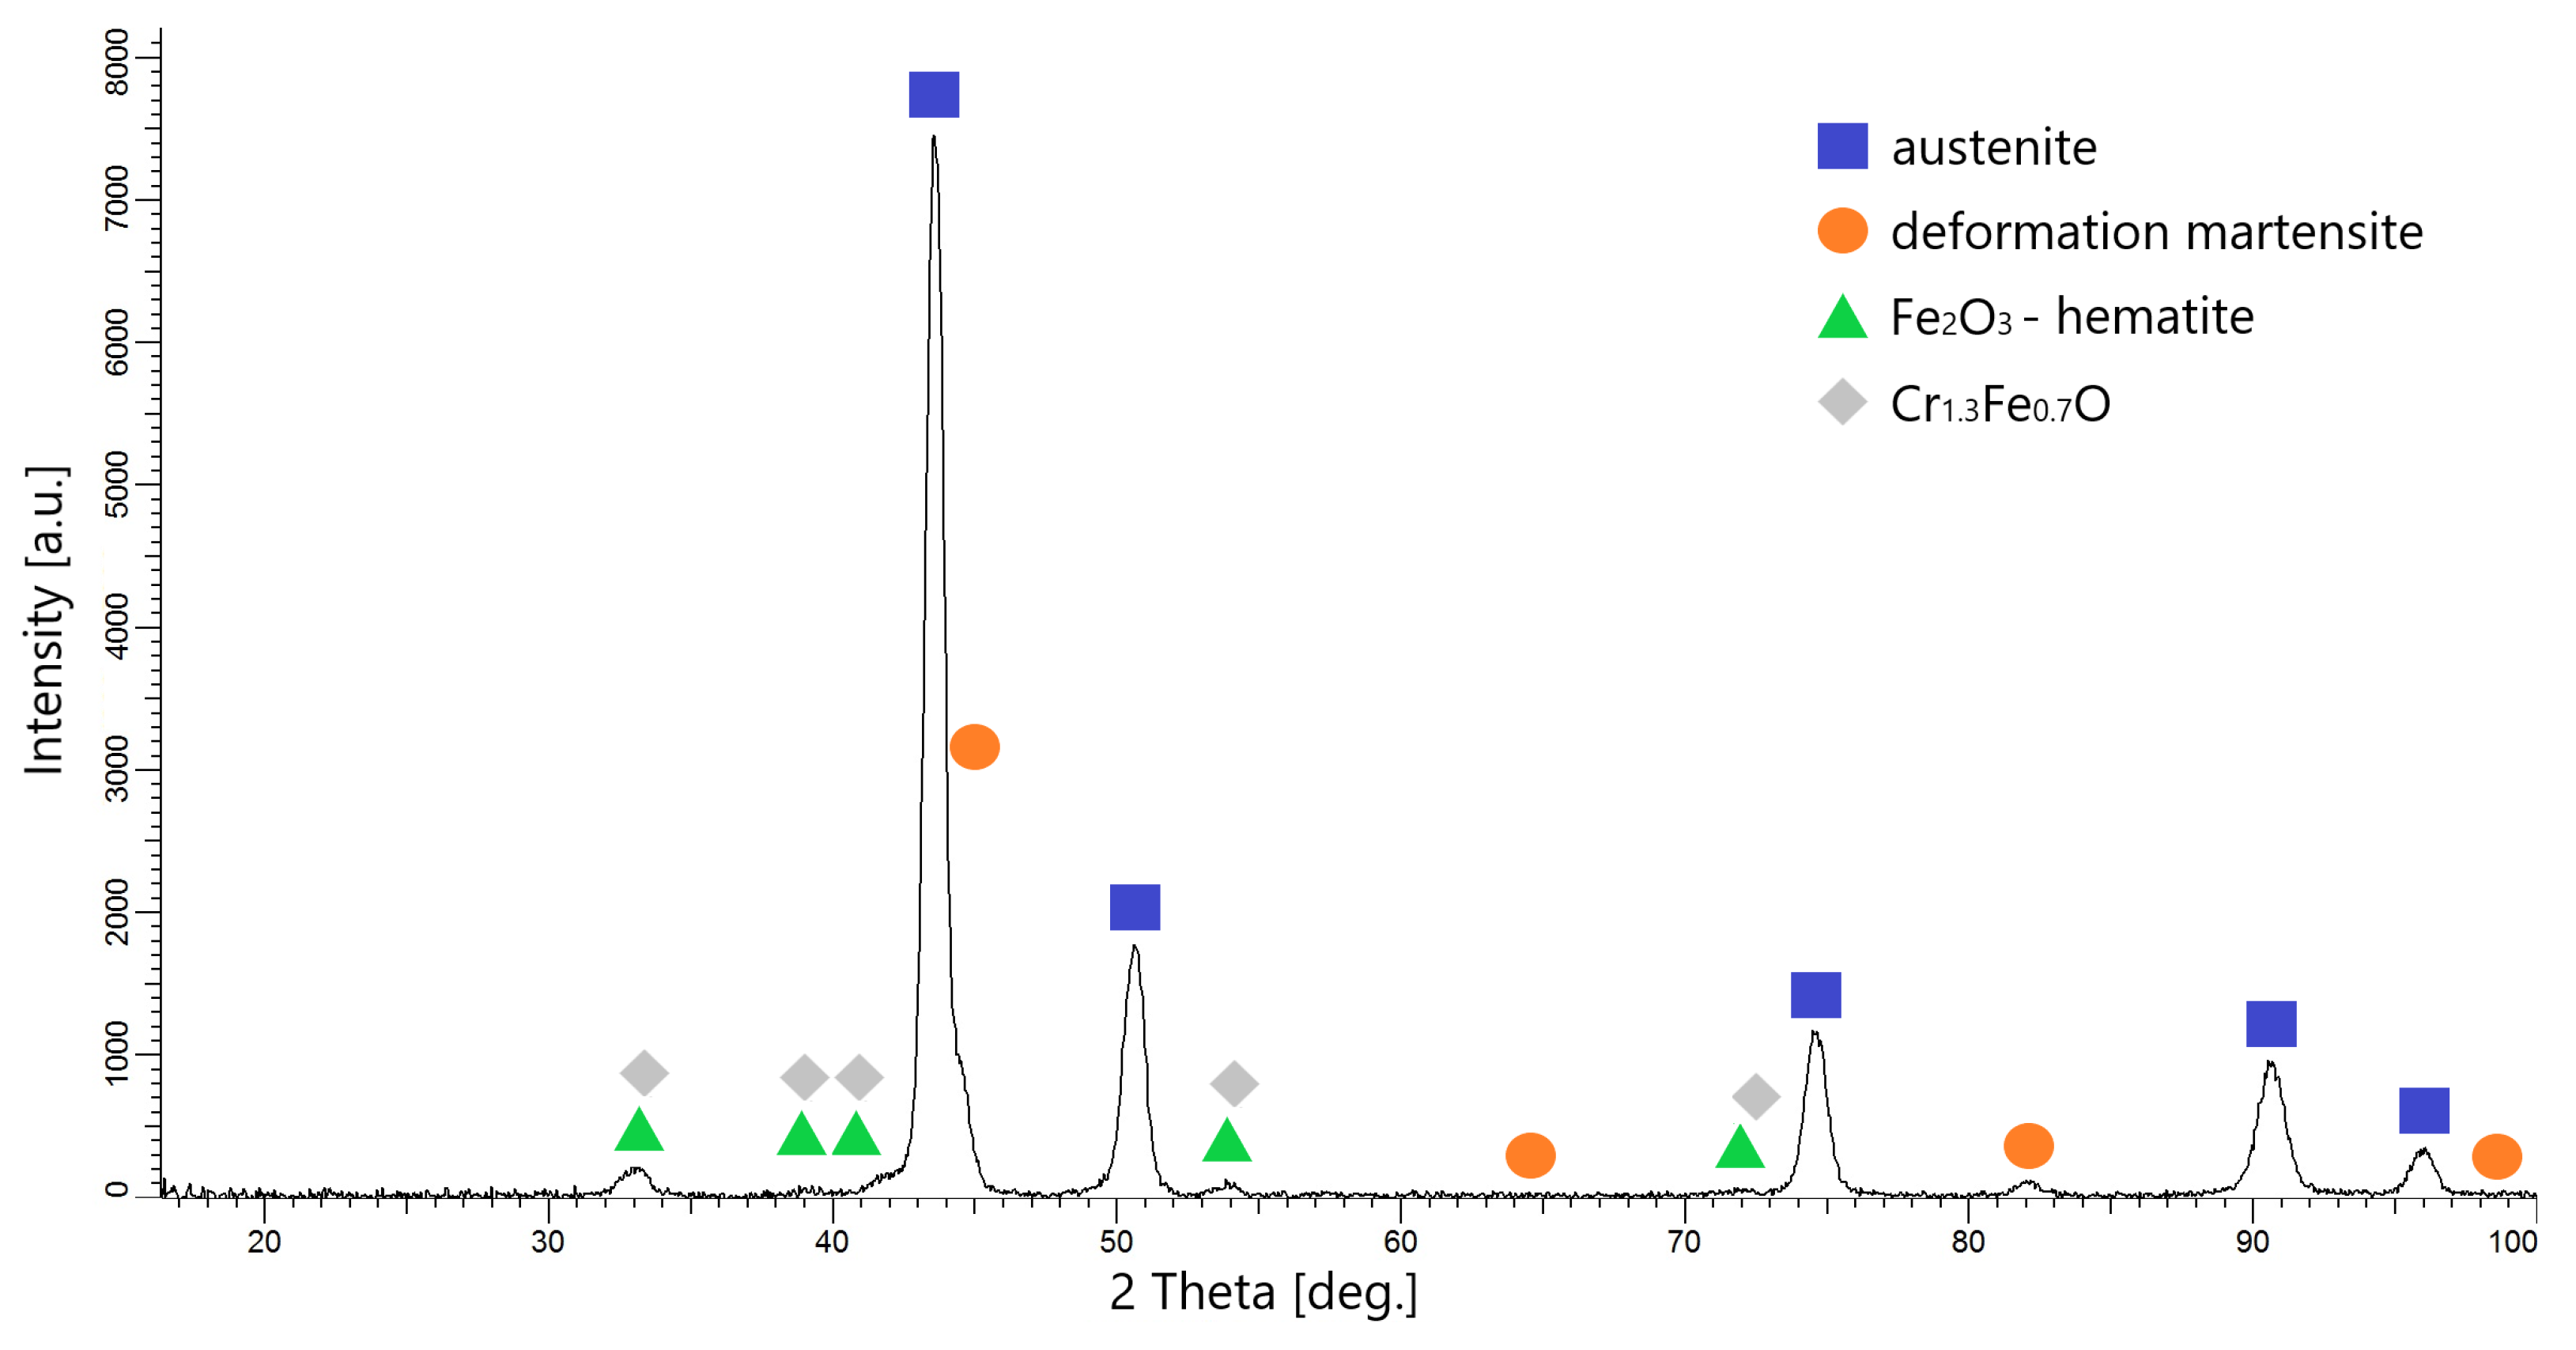
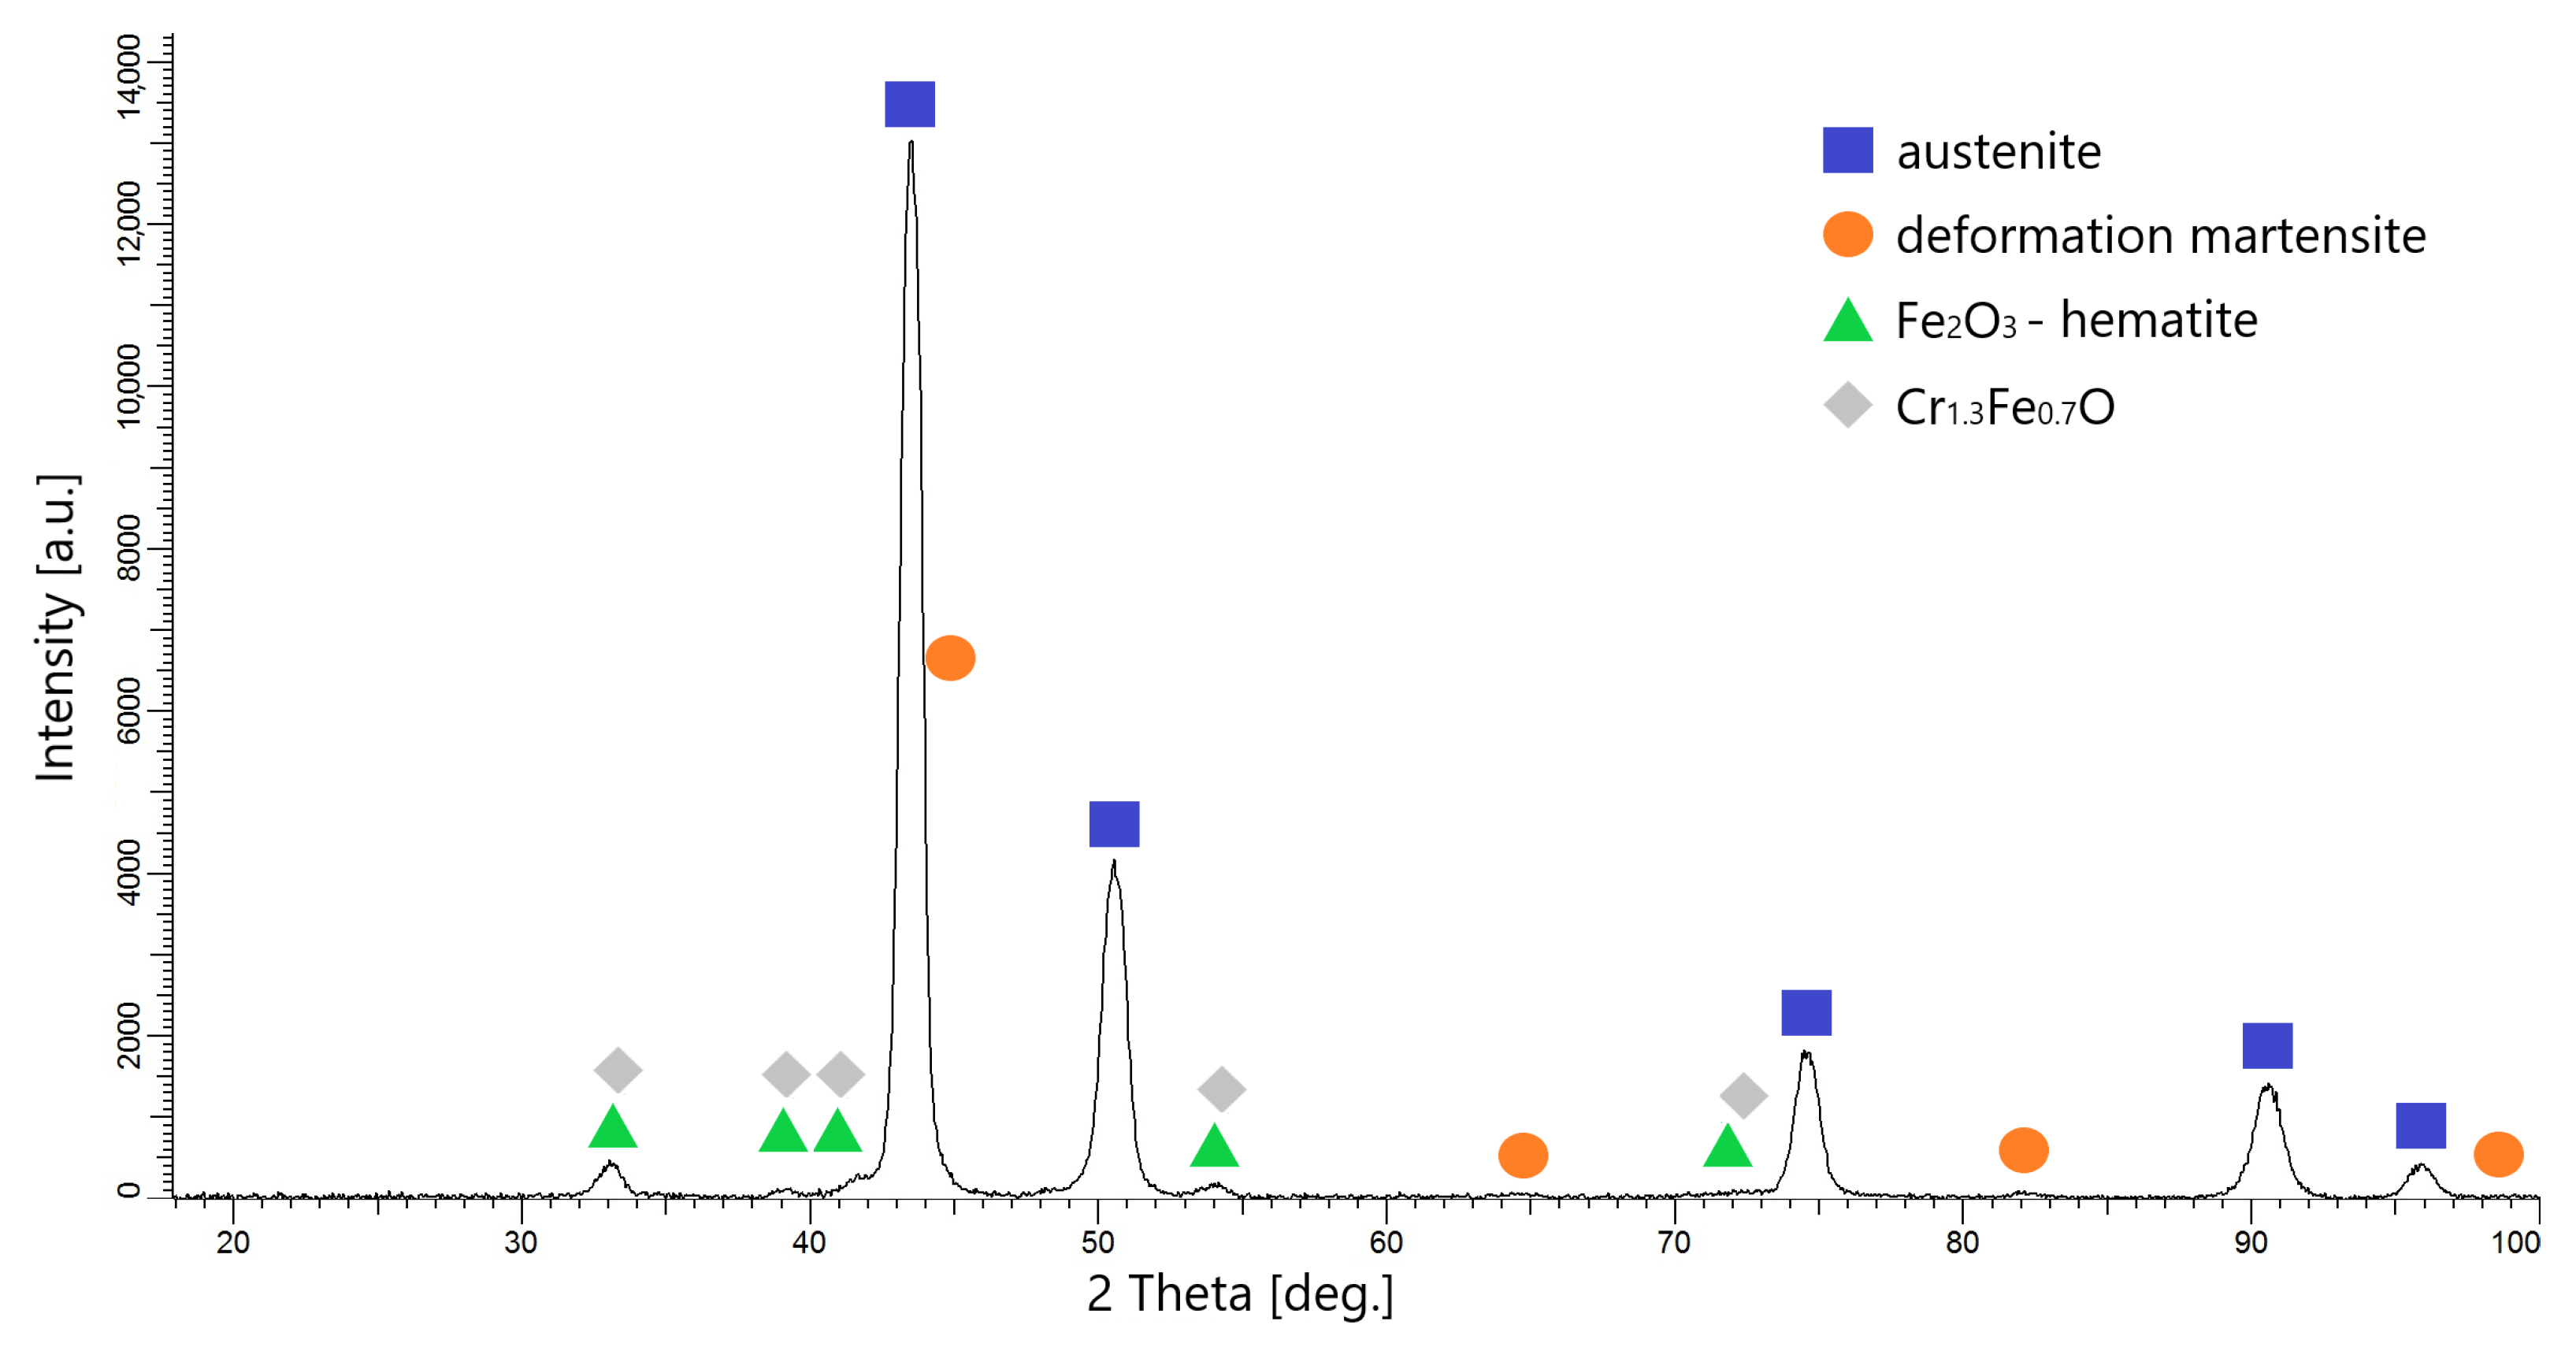
3.3. Microstructure Analysis

Figure 4 shows X-ray diffraction patterns for the steel in its initial state, and Figure 5 and Figure 6 present patterns for steel oxidized at 400 °C and 500 °C, respectively. All patterns for oxide layers were similar with no significant differences in peak intensities and positions. AISI 316L steel was composed of austenite and deformation martensite, which formed in the surface layer as a result of grinding and polishing (Figure 4). Due to the pressure exerted on the sample surface during mechanical preparation, a martensitic transformation induced by plastic deformation occurred (TRIP effect) [12,39,40,41,42]. The XRD analysis confirmed the presence of oxide layers on the steel surface after oxidation processes (Figure 5 and Figure 6). At all process temperatures (400 °C, 450 °C, and 500 °C), two types of oxides were detected (Fe2O3 (hematite) and Cr1.3Fe0.7O3) and their peaks in each variant were of very low intensity. Another phase identified after the oxidation processes was austenite originating from the substrate. The peaks from austenite showed high intensity, and those from oxides were relatively low, indicating that the layers were very thin. This interpretation is supported by the low incident angle of 2° used during XRD. Due to their very small thickness, the oxide layers could not be observed on cross-sections by SEM. Deformation martensite is still visible after oxidation at 400 °C (Figure 5), but its peaks disappear after oxidation at 500 °C (Figure 6), owing to the reverse transformation of martensite to austenite at that temperature.

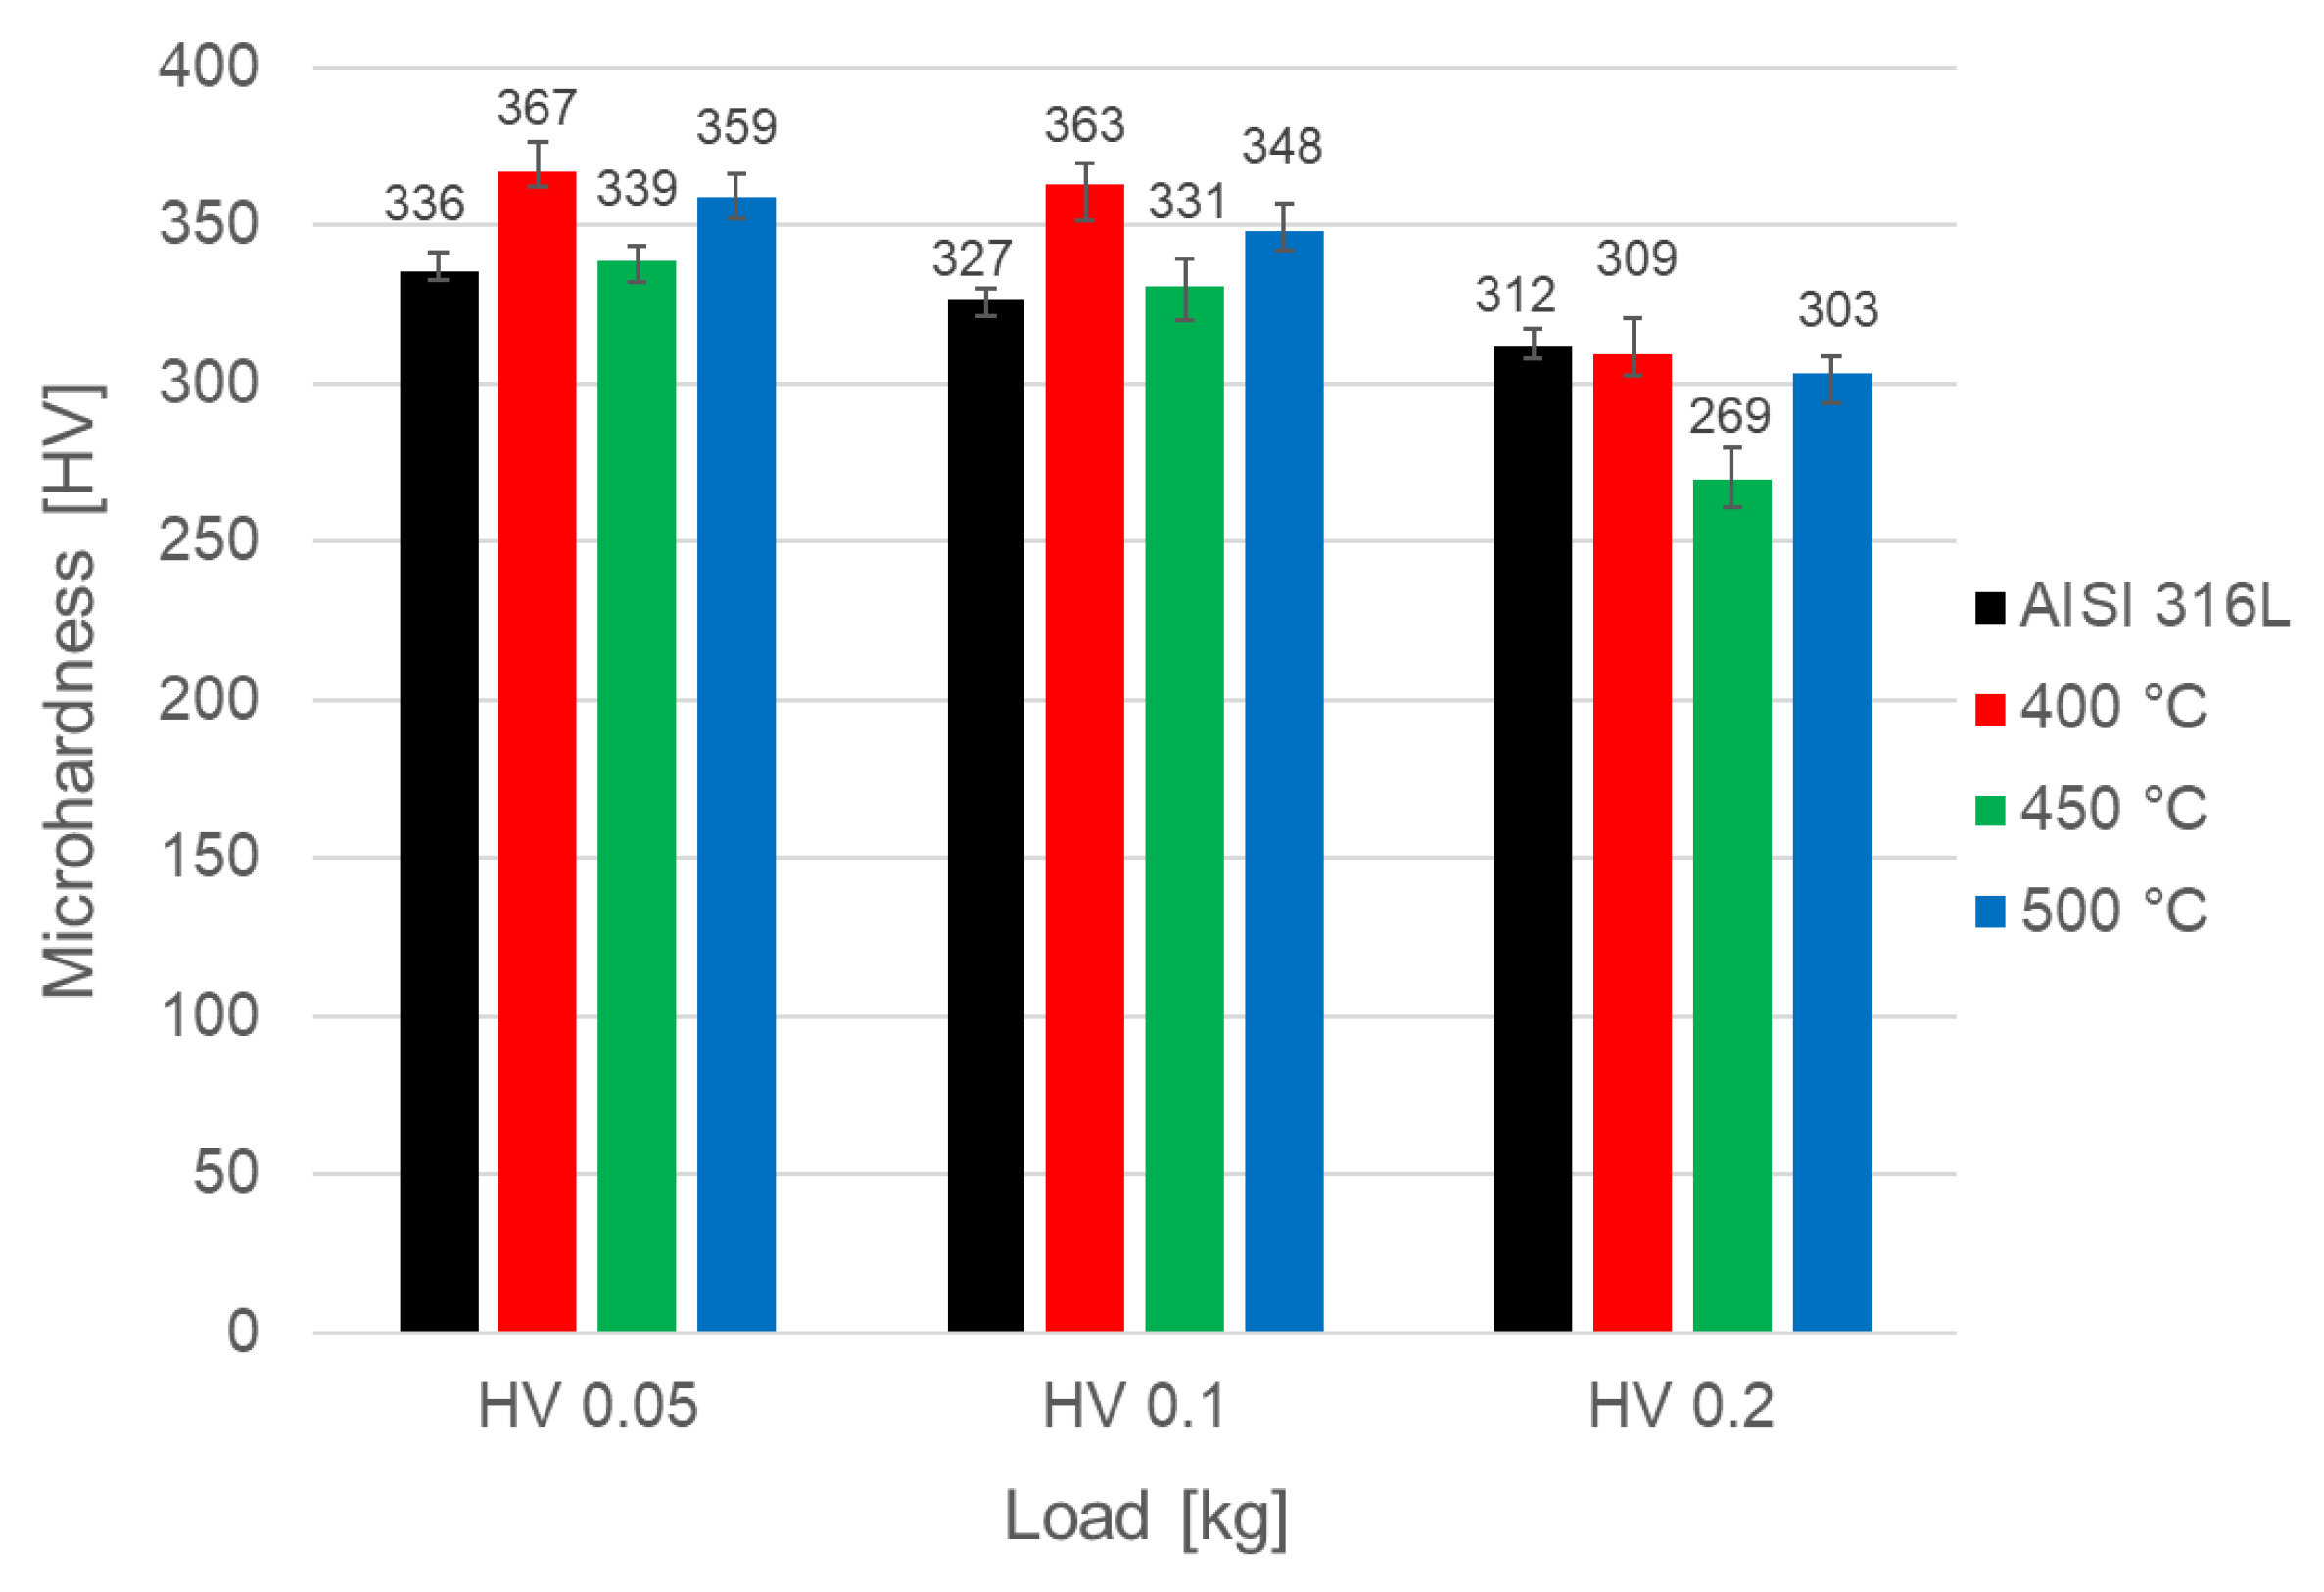
3.4. Microhardness and Friction Wear Resistance Analysis

To investigate the effect of oxidation on hardness, Vickers microhardness tests were carried out at different loads (Figure 7). The measurements show that the oxidation does not significantly affect hardness. A slight increase is visible at the lowest loads (HV0.1 and HV0.05). Among the oxidized layers, the lowest microhardness occured after oxidation at 450 °C, yet even this layer exhibited slightly higher values than the steel in the initial state at loads of 0.05 kg and 0.1 kg. At a load of 0.2 kg, all oxidized layers were characterized by lower microhardness values, with the most pronounced decrease in the layer oxidized at 450 °C. In turn, the highest microhardness was recorded for the sample oxidized at 400 °C (363 HV0.1 and 367 HV0.05). This increase may result from deformation martensite remaining beneath the oxide layer, which did not undergo a reverse transformation to austenite at that temperature (Figure 5). Steel oxidized at 500 °C exhibits intermediate hardness between the other two oxidation variants (348 HV0.1 and 359 HV0.05). The surface hardness here is probably mainly influenced by the greater oxide thickness, because deformation martensite has vanished through reverse transformation (Figure 6). Overall, the hardness differences between samples were small, possibly owing to the thin, brittle oxide layers and the influence of the soft substrate.
In the “ball-on-disc” test, the greatest wear resistance is observed for steel oxidized at 400 °C (Figure 8b and Figure 9). The wear track produced with a corundum ball is shallowest in this case, indicating the lowest wear. The other samples wear more extensively, with similar track widths and depths (Figure 8a,c,d and Figure 9).
From Figure 10, it can be concluded that during the tribological "ball-on-disc" test, the surface oxidized at 400 °C behaves differently from the others. Throughout the test, its friction coefficient is the lowest, and at about 4000 revolutions, it stabilized and oscillated around 0.4, which is a value comparable to the coefficient of friction of a carbon coating produced on AISI 316L steel under DC glow discharge conditions measured at the same load of 5N [24]. The friction coefficient for steels—the initial state and steels oxidized at 450 °C and 500 °C—remained in the range of about 0.6–1. The average friction coefficient (0.8) for the layers oxidized at 450 °C and 500 °C was higher than that of the steel in the initial state (0.7), likely reflecting the greater roughness of the oxide layers (Table 2).
Thus, the 400 °C layer combined the lowest friction coefficient (Figure 10) with the highest microhardness (Figure 7) and low roughness (Table 2), yielding the most favorable wear rate—more than 40 times lower than the initial state (Figure 11). The steel in its initial state and oxidized at 450 °C performed almost identically, while the 500 °C layer shows the worst wear rate. Despite its higher hardness (Figure 7), the rough surface (Table 2), oxide detachment, and generation of abrasive particles probably account for this behavior.

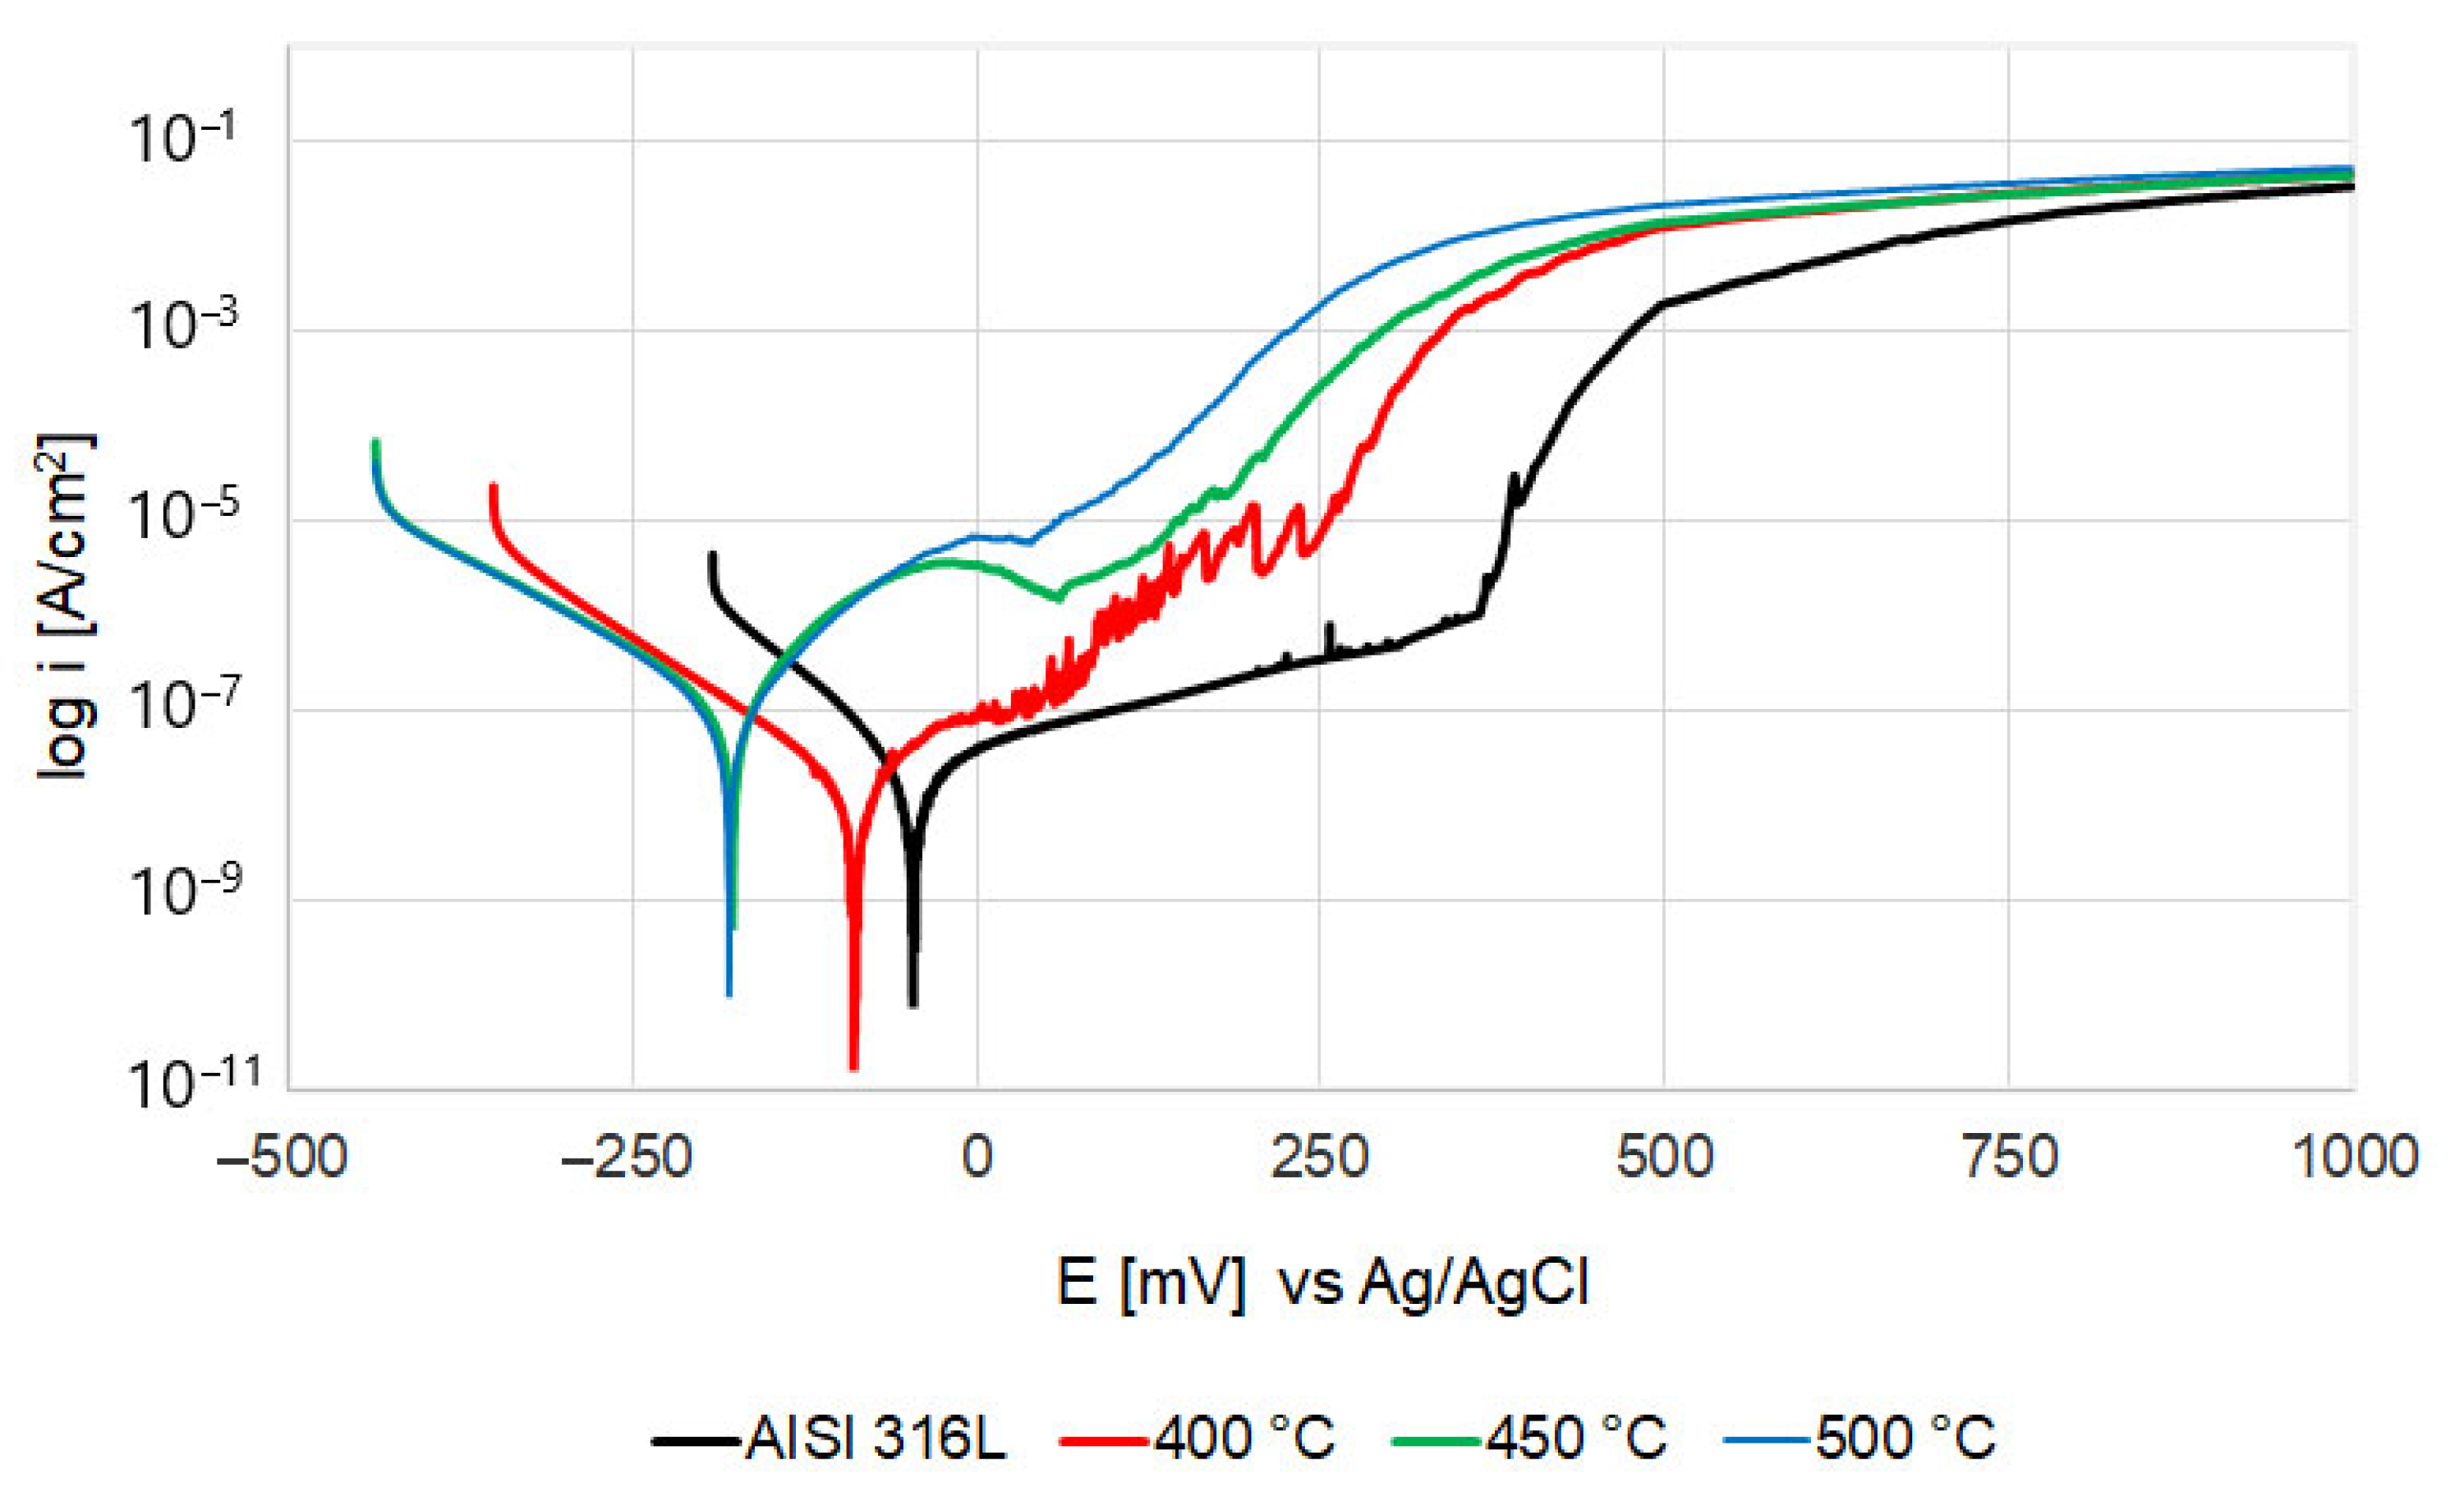
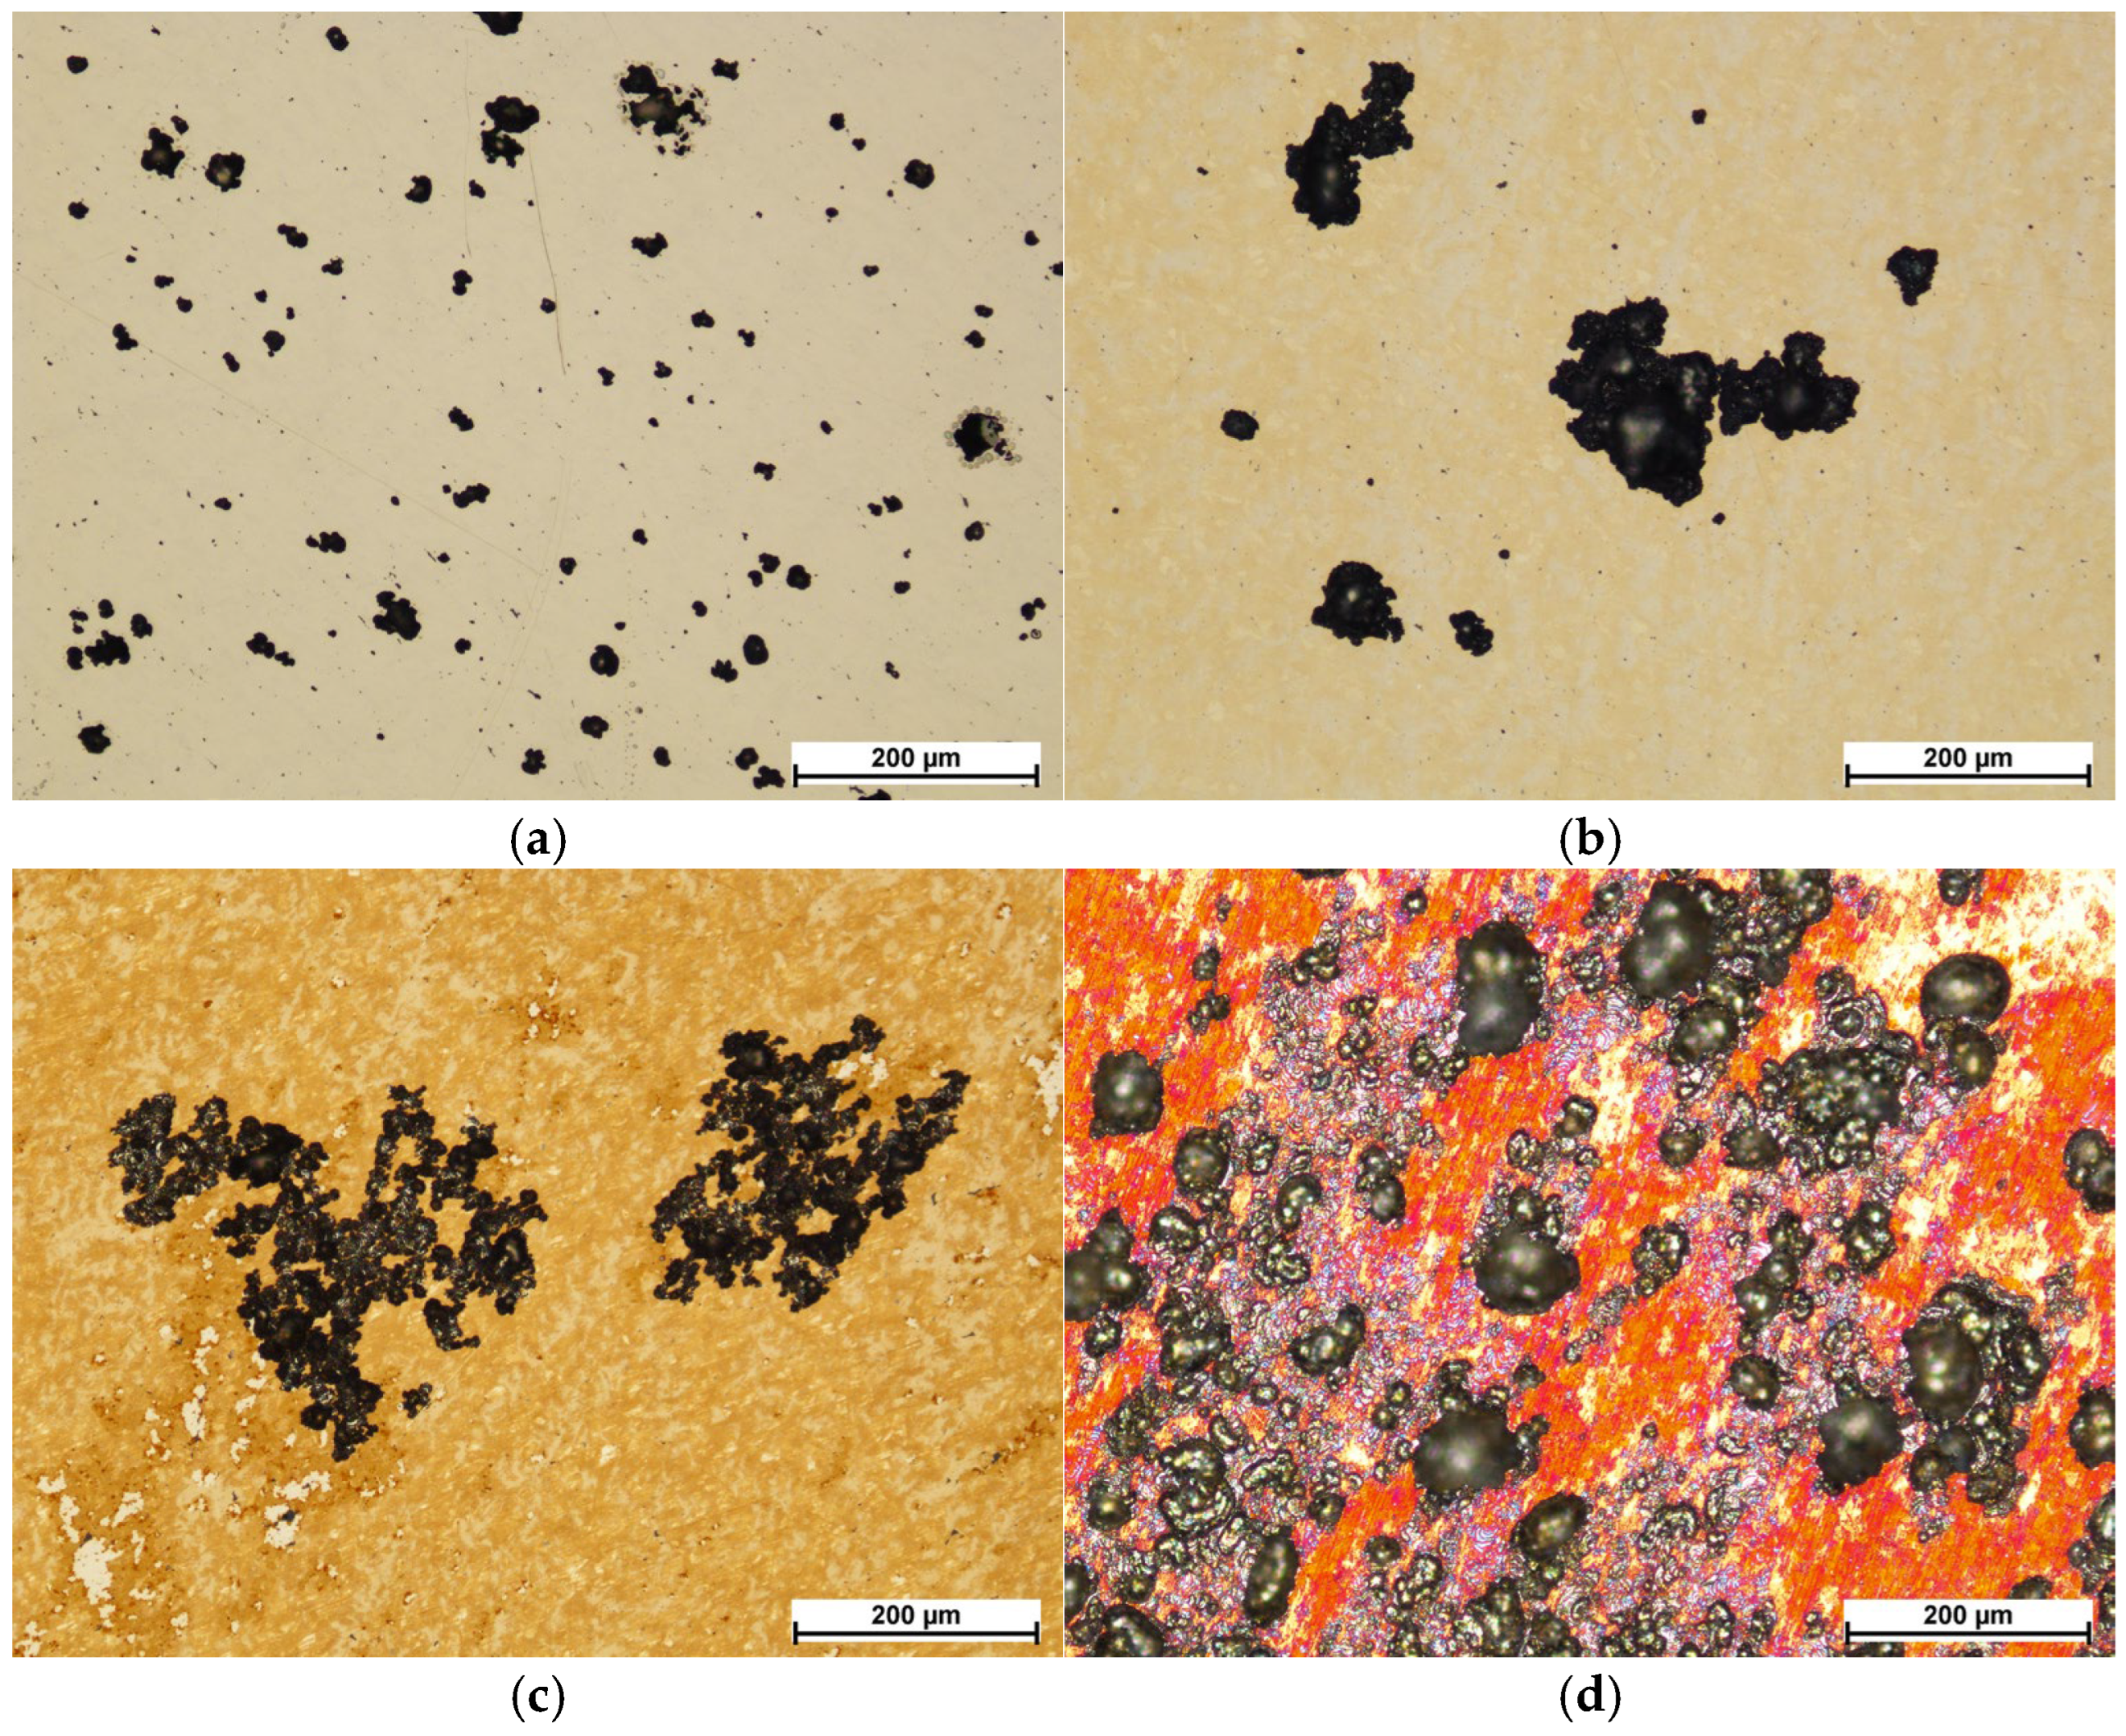
3.5. Corrosion Resistance Analysis

From the corrosion potential Ecorr, it can be stated that the highest resistance in the 3.5% NaCl environment was characteristic of the steel in the initial state entering the active state at the highest potential (−28 mV) (Figure 12, Table 3). There is a visible trend showing that, with the increase in the oxidation temperature, the corrosion potential decreased reaching −196 mV at 500 °C. The same holds for the breakdown (pitting) potential Epit. The lowest value of Epit (160 mV) was observed for the sample after oxidation at 500 °C. Only the sample after the process at 400 °C exhibits a value of Epit comparable to the initial state (22 mV lower). In turn, the clearly best value of the corrosion current density icorr (41 nA/cm2) and polarization resistance Rpol (909 kΩ∙cm2) was observed for steel oxidized at 400 °C, indicating the highest dielectric properties and most difficult electron exchange. Layers oxidized at 450 °C and 500 °C show lower polarization resistance Rpol and higher corrosion current density icorr than the layer oxidized at 400 °C, while their Rpol and icorr values are lower than those for the steel in its initial state. The highest corrosion current density icorr is observed for the initial state (227 nA/cm2), probably due to the thinnest naturally formed passive layer compared to the thicker, more dielectric furnace-oxidized layers. Despite the reduced corrosion potential Ecorr and slightly lower breakdown potential Epit compared to the steel in its initial state, oxidation at 400 °C guaranteed an almost two-fold increase in polarization resistance Rpol and an over fivefold decrease in corrosion current density icorr, which may resulted from the high homogeneity of the oxide layer formed under these process conditions.
Figure 13 depicts the surfaces after corrosion testing. As expected, exceeding the breakdown potential resulted in the formation of corrosion pits in all cases. In the case of AISI 316L steel in the initial state, pit diameters reach 100 μm, with numerous smaller pits that have just started to form. The number of pits here is high, but they did not reach large sizes (Figure 13a). The layer oxidized at 400 °C showed pits of larger diameters (Figure 13b), but much fewer compared to the steel in the initial state. The largest pits in this case were bigger than 100 μm. A few small pits, which have only just started to form, were also visible. In turn, the pits formed on the steel oxidized at 450 °C were even larger than those observed on the layer after the process at 400 °C or in the initial state (Figure 13c). They showed a less regular shape, and no spherical pits were observed, as in the case of the initial state or steel oxidized at 400 °C. Their branched shape suggests that they were formed by combining a larger number of small pits. The pits present on the steel after oxidation at 500 °C were the deepest in comparison to the other variants and were characterized by an irregular shape and high density on the surface of the layer (Figure 13d).
The number and size of pits correlate with the values of the breakdown potential (Table 3). It can be seen that the lower the value of the breakdown potential Epit, the greater the number and size of pits. The influence of surface development (Table 2) cannot be ignored, as it could have impacted the deterioration of corrosion resistance. With the increase in process temperature and roughness, there could have been more areas prone to easier propagation of pits, especially in recesses, which resulted in a greater number and size of pits with increasing roughness. A change in the color of the steel surface after the oxidation processes was also visible, which is related to the formed iron and chromium oxides (Figure 13b–d). In the case of layers oxidized at 450 and 500 °C, bright areas were observed where the oxide layers were most likely dissolved during potentiodynamic tests (Figure 13c,d). Such areas become anodic sites where preferential pitting propagation may occur. In the case of the layer formed at 400 °C, no such dissolution was observed, which again confirms its high homogeneity. The resulting pitting could have initiated in small, single defects in its structure, hence a smaller number of corrosion damages in this case (Figure 13b) compared to AISI 316L steel in the initial state (Figure 13a).

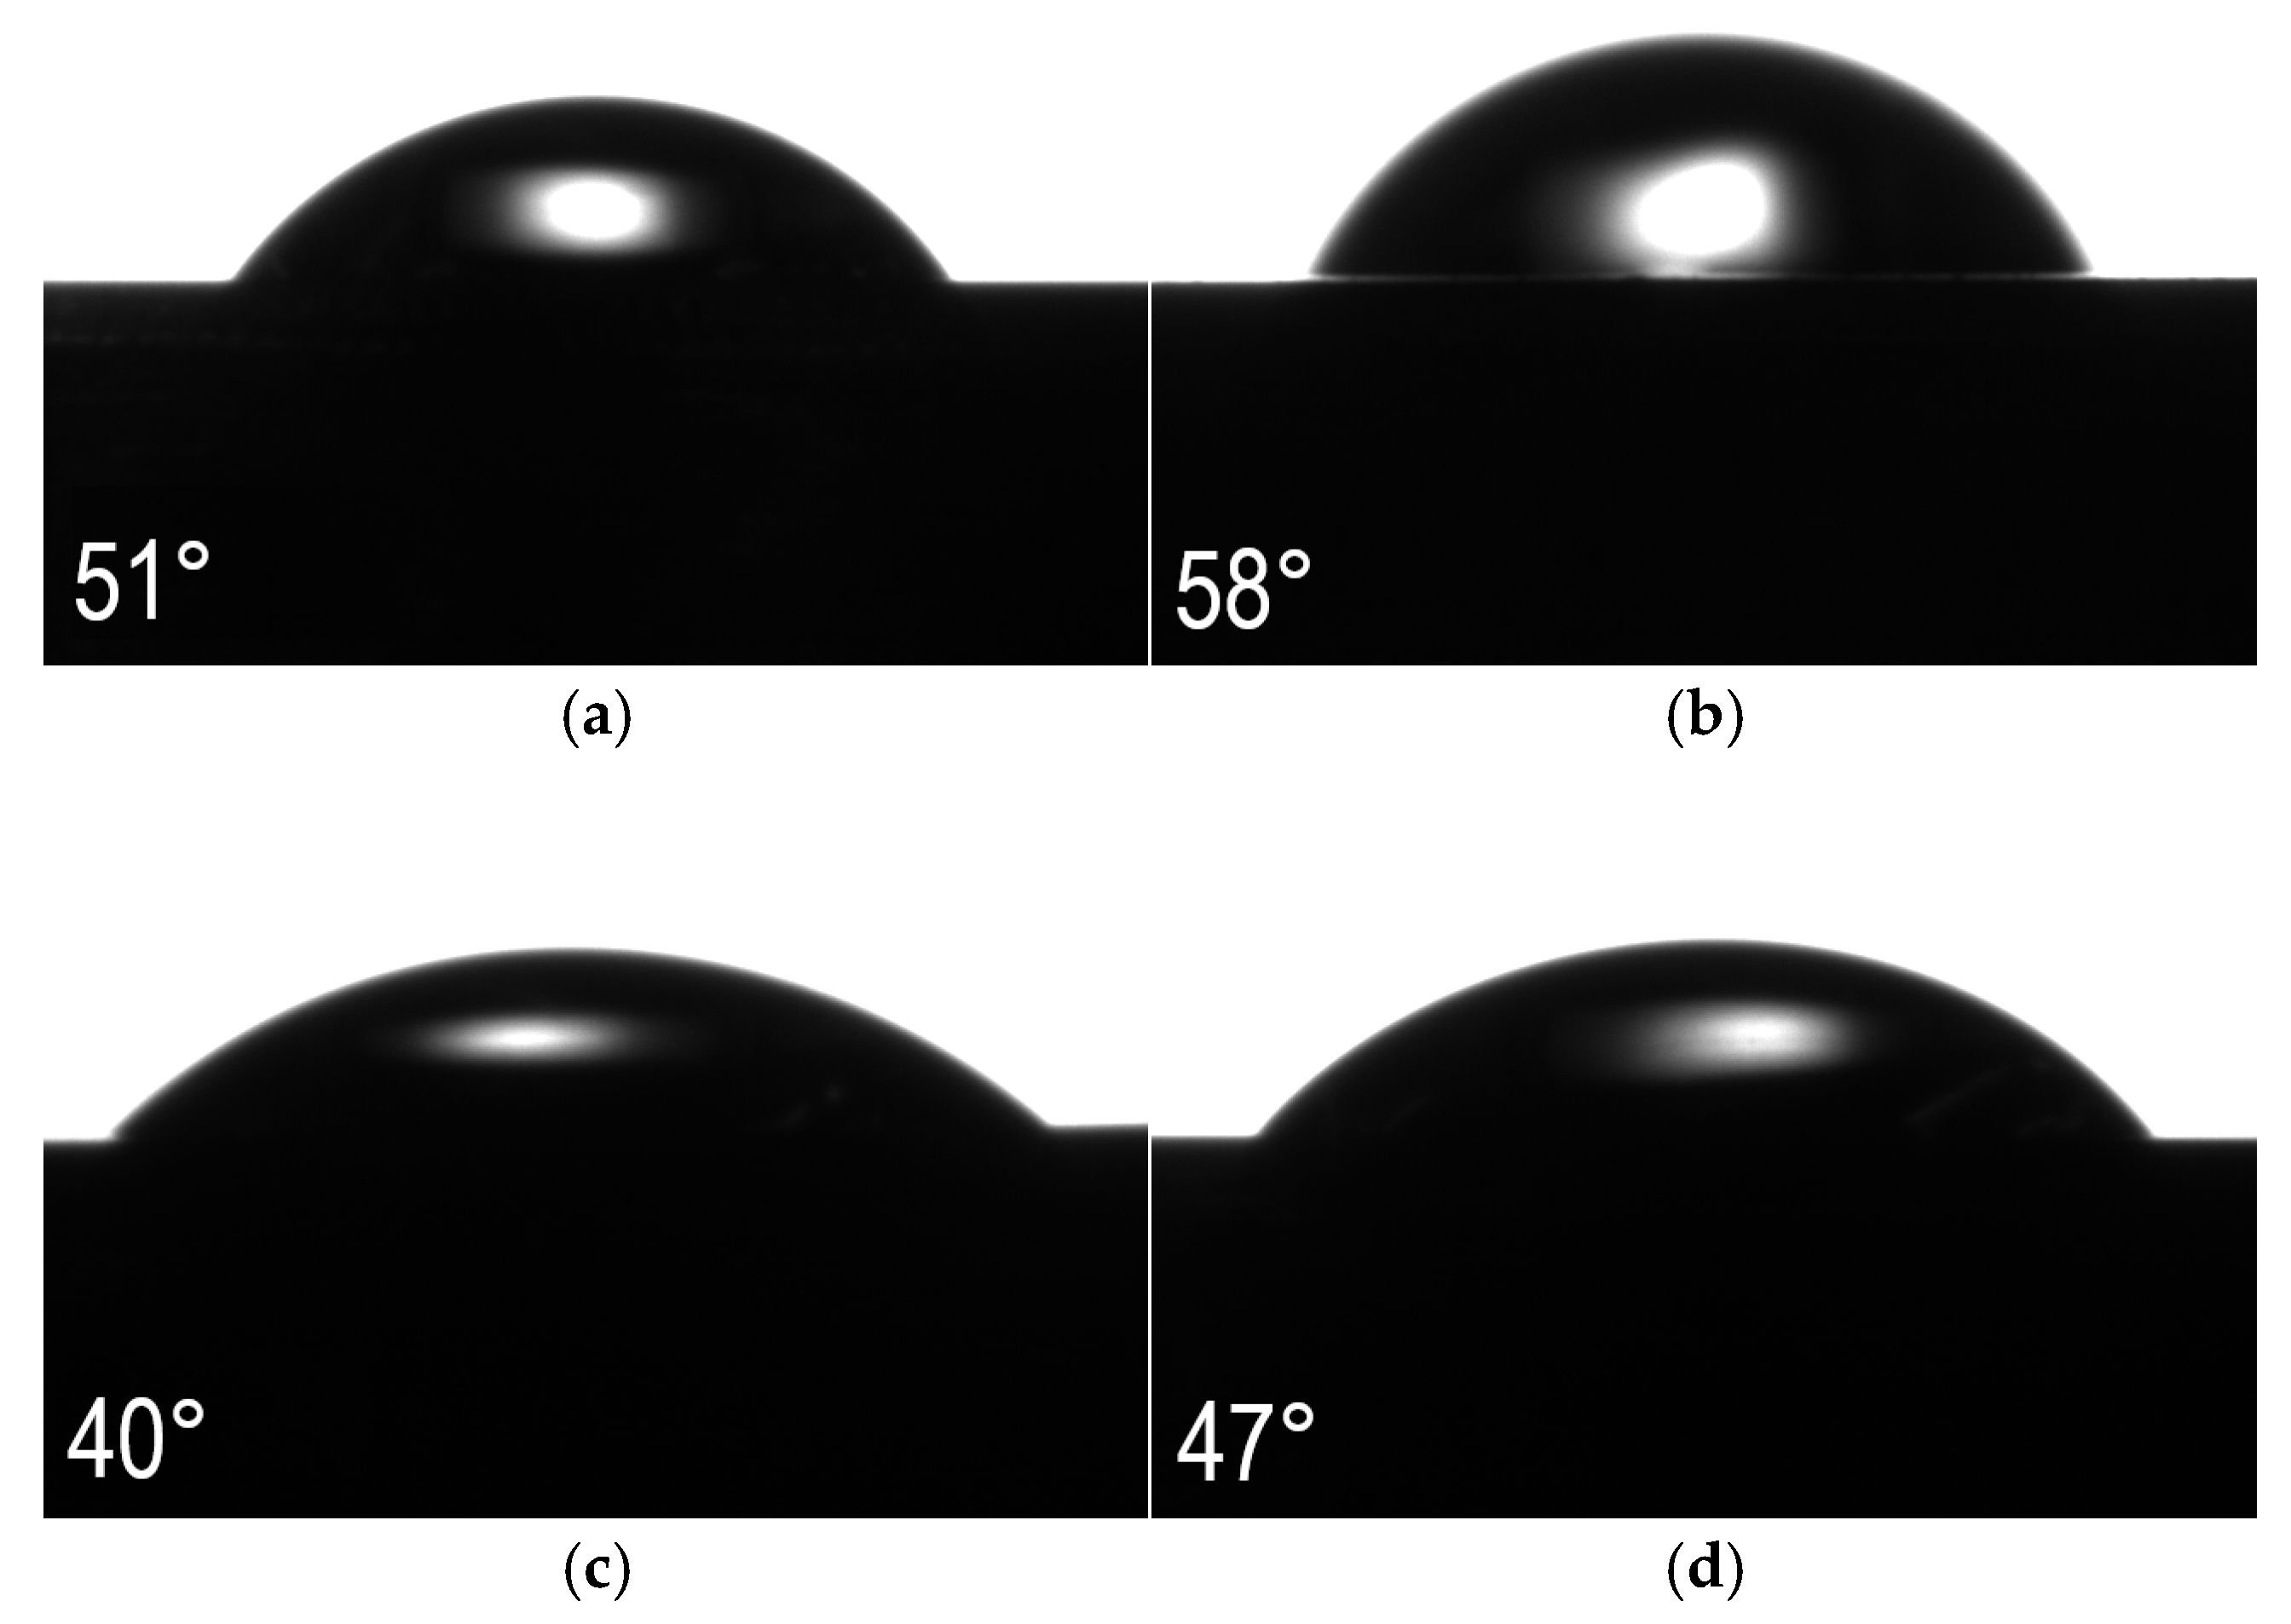
3.6. Wettability Analysis

The contact angle tests performed did not show a clear trend linking this parameter to the increase in steel oxidation temperature (Figure 14). All tested sample variants exhibited smaller or larger hydrophilic properties (<90°). The highest contact angle, approximately 58°, was displayed by the surface oxidized at 400 °C (Figure 14b). The next largest angle, about 51°, was obtained for the polished AISI 316L steel in its initial state (Figure 14a). Lower contact angle values, indicating greater hydrophilic properties, were observed for the steel after oxidation at 450 °C and 500 °C, measuring approximately 40° and 47°, respectively (Figure 14c,d).
In the case of samples oxidized at 450 °C and 500 °C, the most flattened water drops are visible, which indicates their greatest hydrophilicity. Therefore, they may exhibit the best biological properties in contact with human tissue. However, their poor corrosion and friction wear resistance disqualify these materials. Steel oxidized at 400 °C exhibits the highest contact angle but still shows good hydrophilic properties. Combined with its very good wear rate Wv and corrosion resistance values—exceeding the initial state in some parameters (Icorr, Rpol)—it is a prospective and promising material for biomedical applications. Higher contact angle values may also have a positive effect when considering antibacterial properties.

4. Conclusions

The tests carried out on the surfaces of AISI 316L austenitic steel after oxidation in air atmosphere at temperatures of 400 °C, 450 °C and 500 °C allow for the following conclusions:
  • The phases formed on the surfaces after oxidation were Fe2O3 (hemetite) and Cr1.3Fe0.7O. The layers obtained are very thin and were not observable on their cross-sections during microscopic examination.
  • Roughness tests using an optical profilometer showed that roughness tends to increase with the oxidation process temperature.
  • Due to their small thickness, the layers obtained did not significantly increase the microhardness of the tested steel. The hardness measured at the lowest loads (0.05, 0.1 kg) increased the most after oxidation at 400 °C, likely due to the presence of deformation-induced martensite in the surface layer.
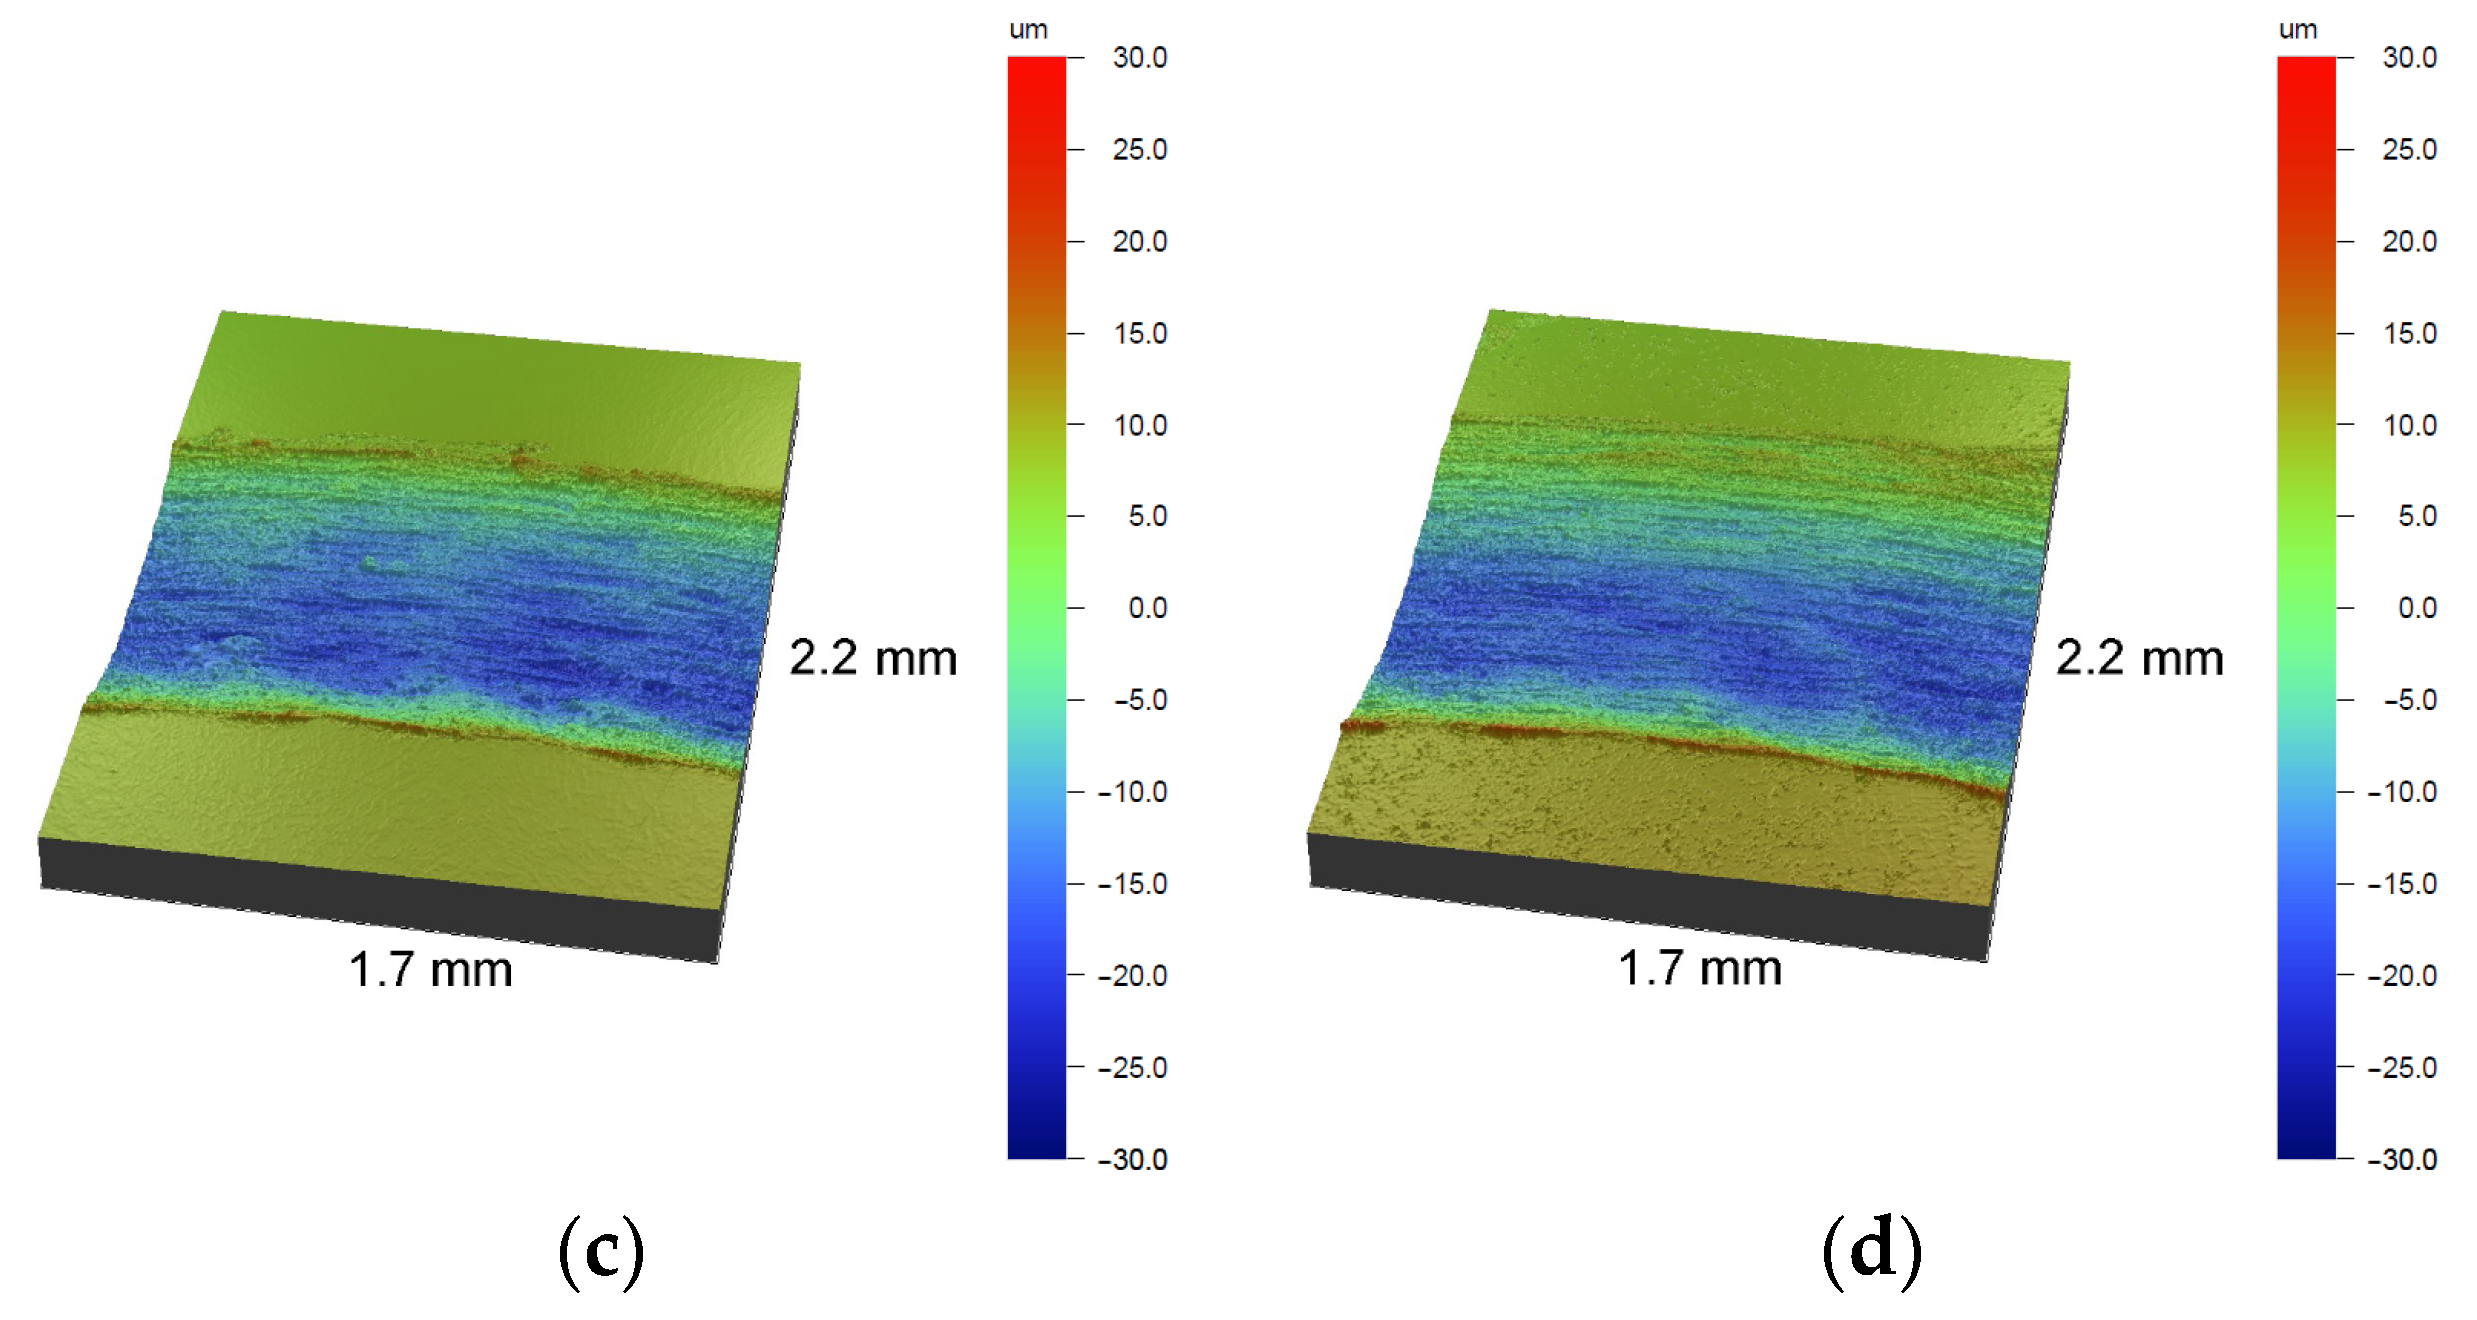
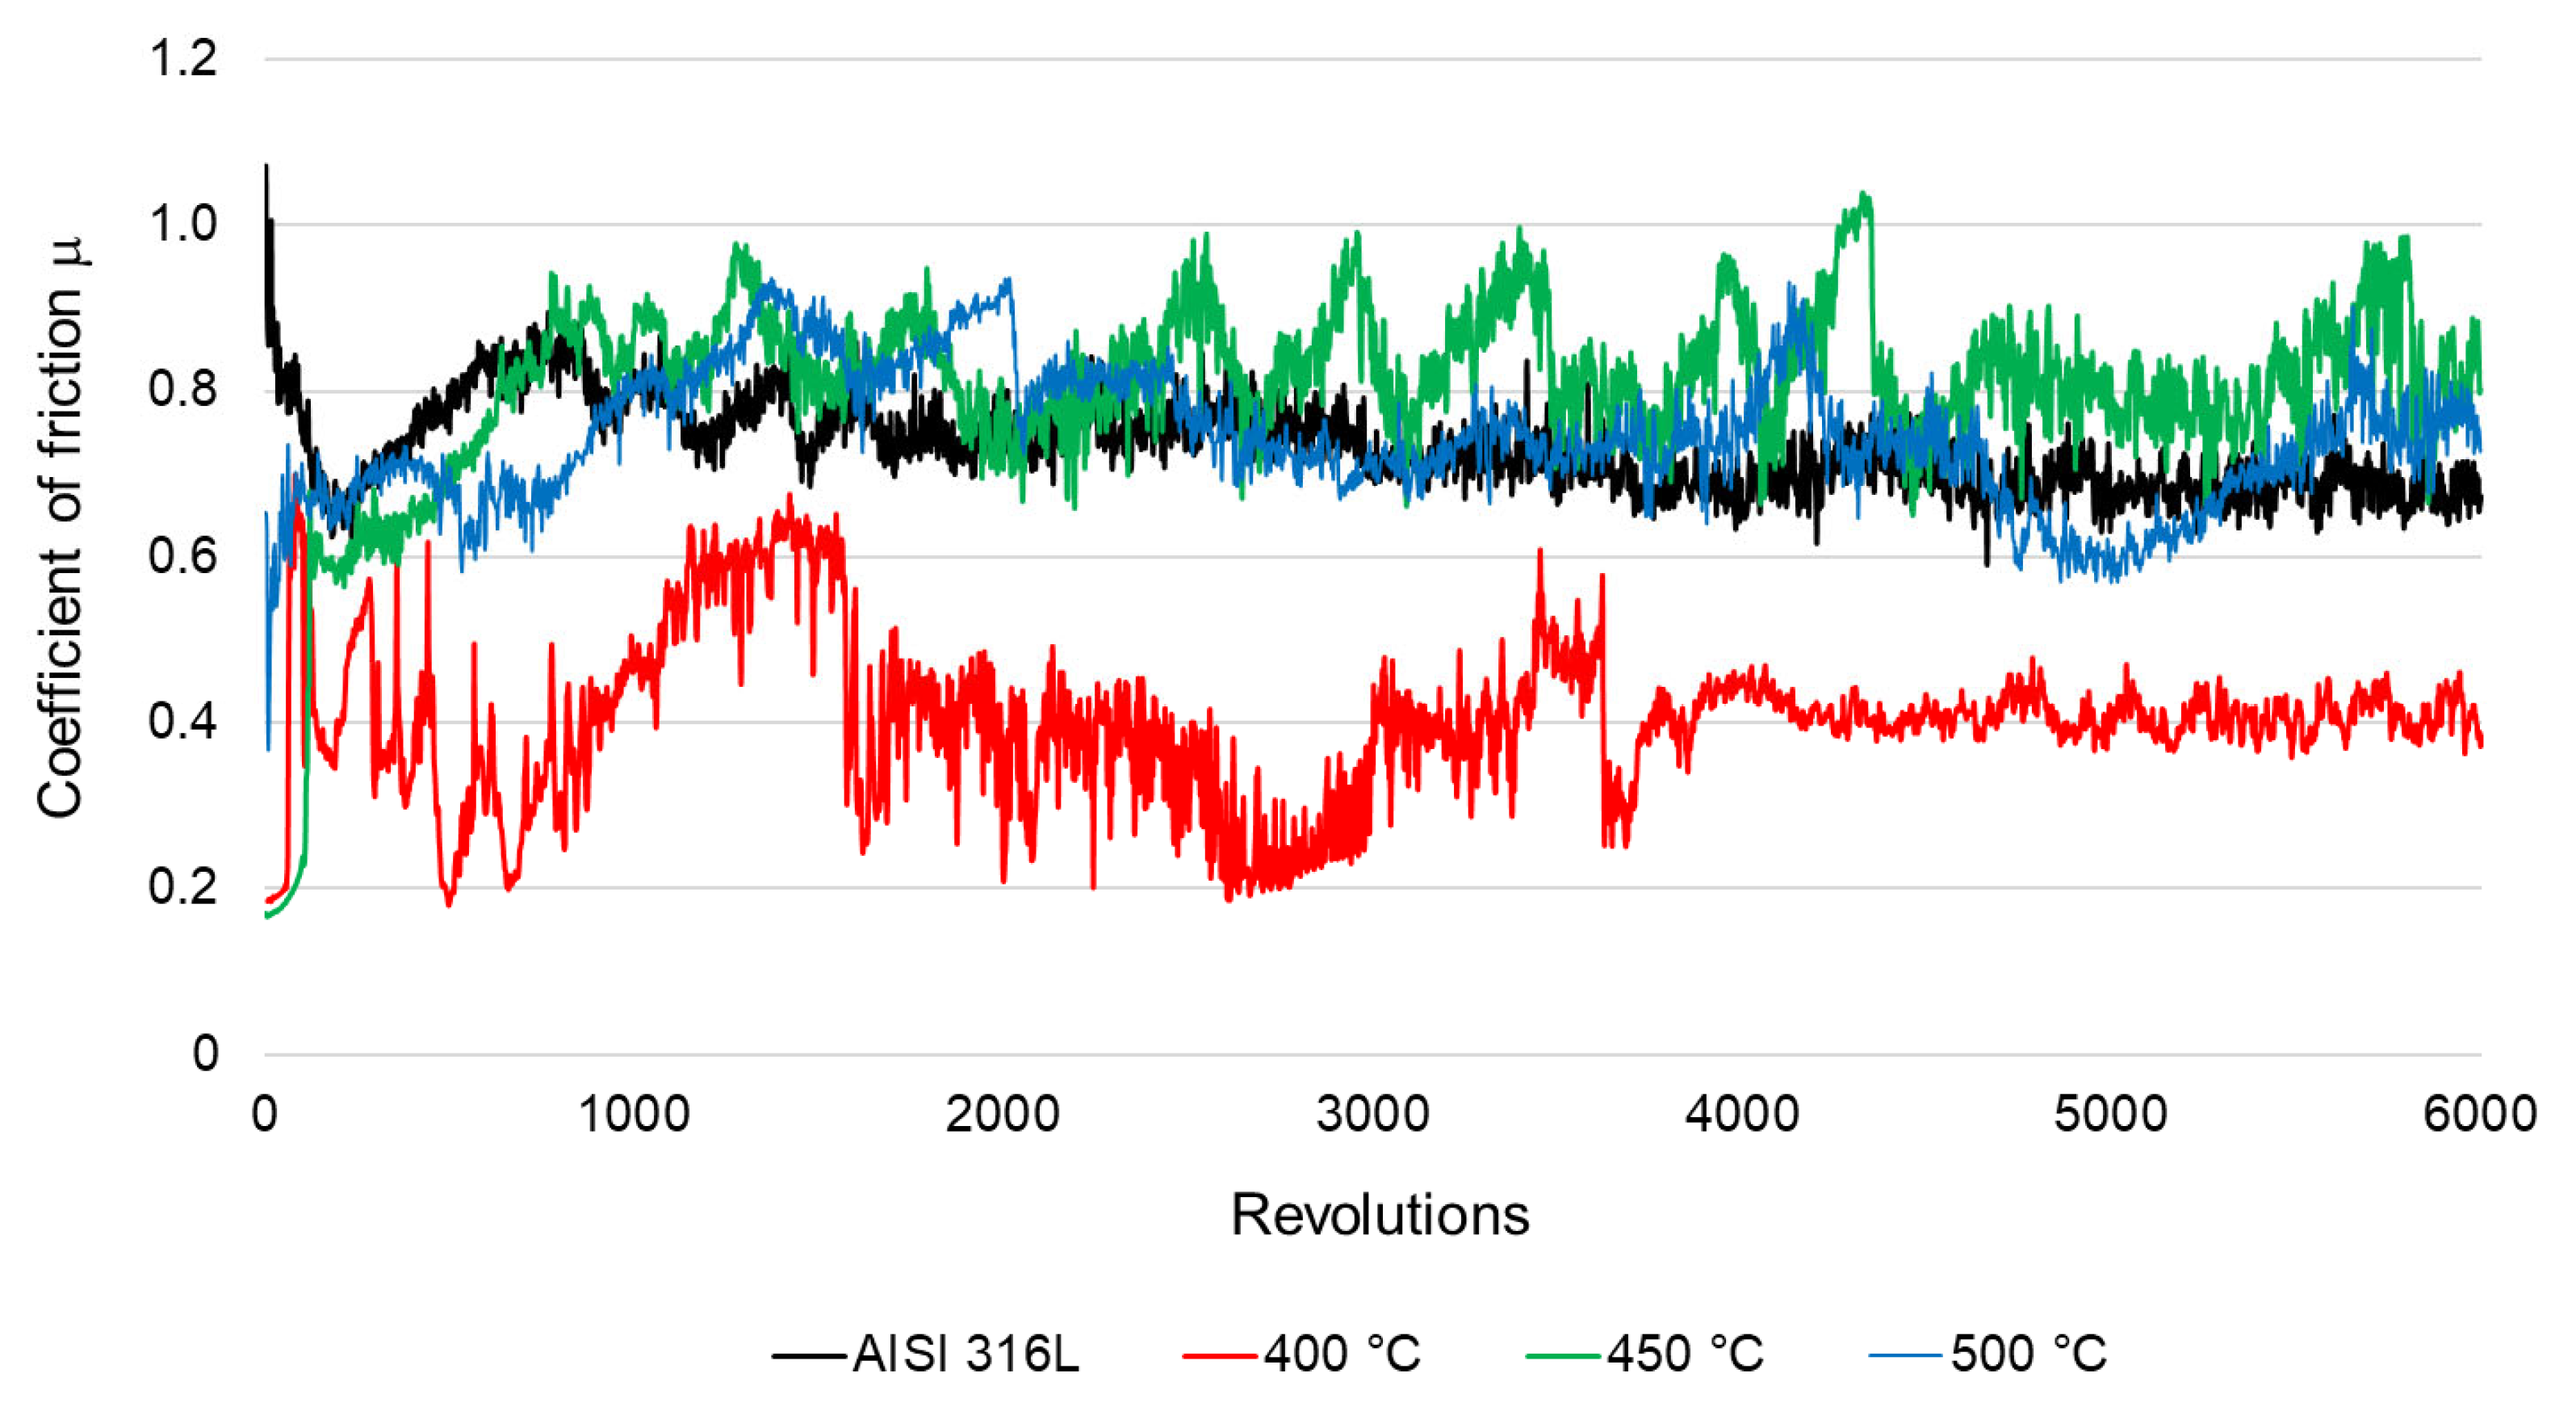
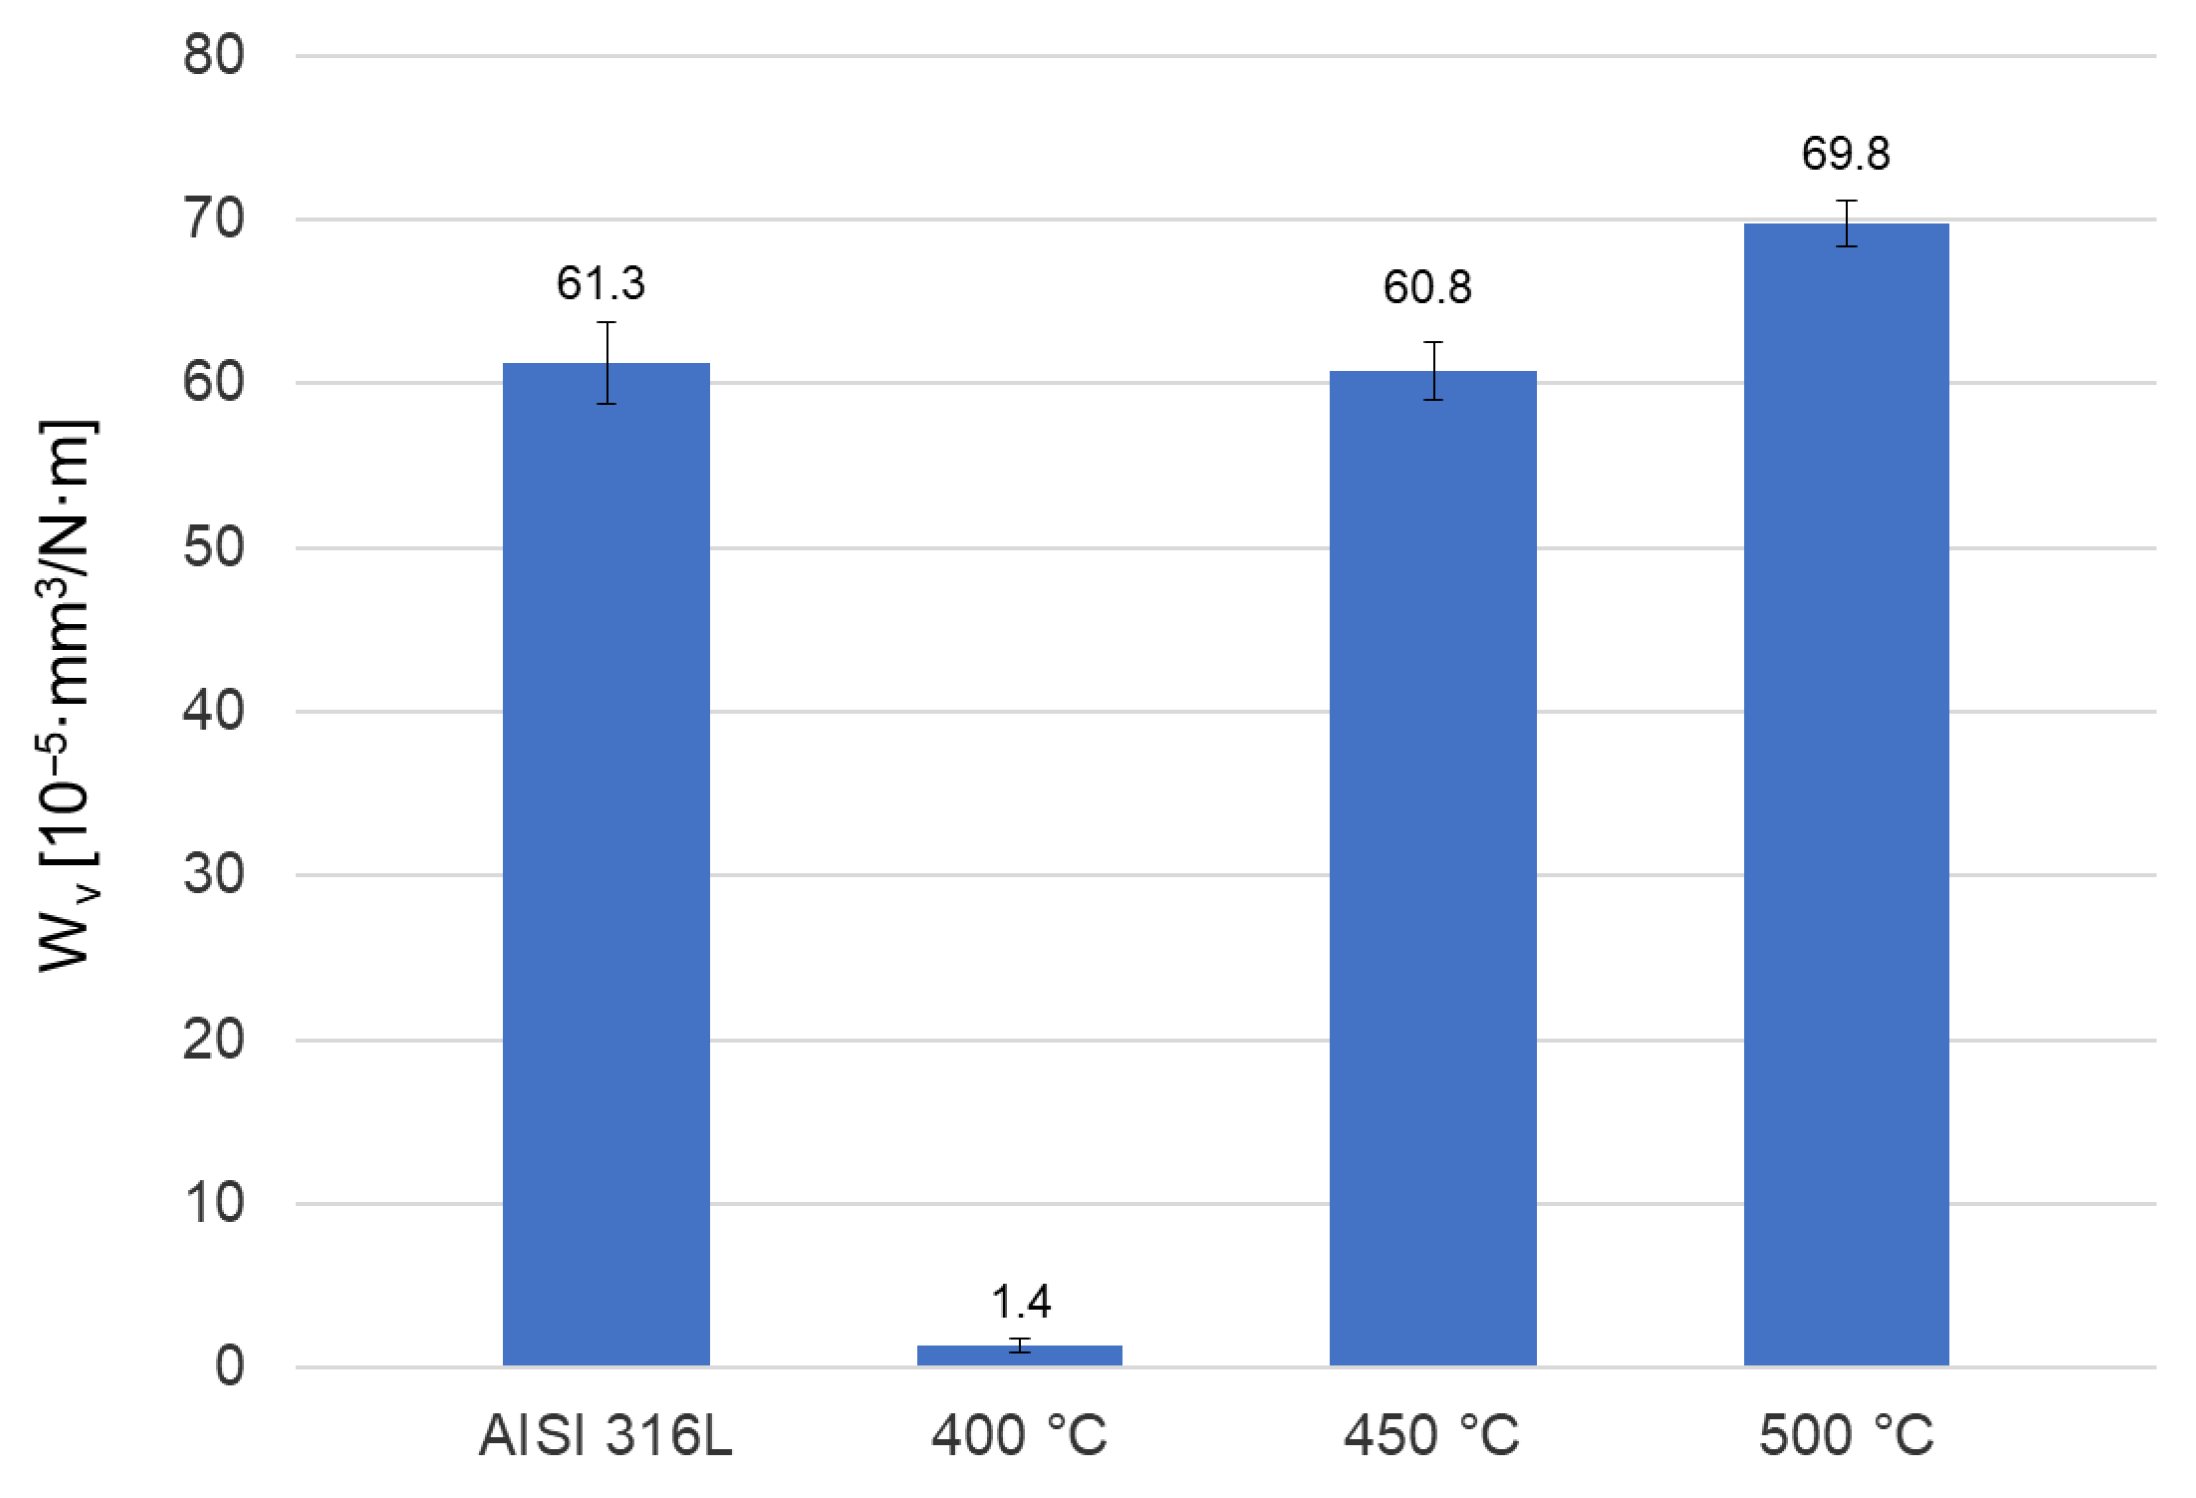
  • The “ball-on-disc” tribological tests showed that the layer formed during oxidation at 400 °C, which had the lowest roughness and highest hardness, had a significant impact on reducing the friction coefficient and the wear rate. Explaining the phenomenon of very good wear resistance obtained after this process requires in-depth analyses, which will be the subject of further research.
  • Corrosion tests showed a clear deterioration of corrosion resistance after oxidation at the two highest temperatures (450 °C and 500 °C). The steel oxidized at 400 °C presented a corrosion potential and a breakdown potential slightly lower than the polished steel in its initial state, but it obtained significantly better corrosion current density and polarization resistance values. After the corrosion tests, larger pits were present than on the steel in its initial state, but there were definitively fewer of them.
  • All tested sample surfaces showed a hydrophilic character. The steel after oxidation at 400 °C had the lowest surface wettability, which may also contributed to the good corrosion resistance of this layer.
  • The steel changed color to gold after oxidation, which may be a positive feature in applications where decorative qualities are important.

Author Contributions

Conceptualization, T.B. and H.W.; methodology, T.B. and H.W.; formal analysis, T.B., H.W. and B.A.-C.; investigation, T.B., H.W., M.S. and B.A.-C.; writing—original draft preparation, T.B. and H.W.; writing—review and editing, T.B.; visualization, T.B., H.W., M.S. and B.A.-C. All authors have read and agreed to the published version of the manuscript.

Funding

This research received no external funding.

Data Availability Statement

The original contributions presented in this study are included in the article. Further inquiries can be directed to the corresponding author.

Conflicts of Interest

The authors declare no conflicts of interest.

References

  1. Nouri, A.; Wen, C. Stainless Steels in Orthopedics. In Structural Biomaterials; Elsevier: Amsterdam, The Netherlands, 2021; pp. 67–101. ISBN 978-0-12-818831-6. [Google Scholar]
  2. Laybidi, F.H.; Bahrami, A. Antibacterial Properties of ZnO-Containing Bioactive Glass Coatings for Biomedical Applications. Mater. Lett. 2024, 365, 136433. [Google Scholar] [CrossRef]
  3. Beni, B.H.; Bahrami, A.; Rajabinezhad, M.; Abbasi, M.S.; Laybidi, F.H. Electrophoretic Deposition of Bioactive Glass 58S- xSi3N4 (0 < x < 20 Wt.%) Nanocomposite Coating on AISI 316L Stainless Steel Substrate for Biomedical Applications. Surf. Interfaces 2024, 55, 105380. [Google Scholar] [CrossRef]
  4. Rossi, C.; De Mongeot, F.B.; Ferrando, G.; Manzato, G.; Meyer, M.; Parodi, L.; Sgobba, S.; Sortino, M.; Vaglio, E. Study on Properties of AISI 316L Produced by Laser Powder Bed Fusion for High Energy Physics Applications. Nucl. Instrum. Methods Phys. Res. Sect. A Accel. Spectrom. Detect. Assoc. Equip. 2023, 1055, 168459. [Google Scholar] [CrossRef]
  5. Lacerda, F.G.B.; Tavares, S.S.M.; Perez, G.; Garcia, P.S.P.; Pimenta, A.R. Failure Investigation of an AISI 316L Pipe of the Flare System in an Off-Shore Oil Platform. Eng. Fail. Anal. 2025, 167, 108939. [Google Scholar] [CrossRef]
  6. Borowski, T. Enhancing the Corrosion Resistance of Austenitic Steel Using Active Screen Plasma Nitriding and Nitrocarburising. Materials 2021, 14, 3320. [Google Scholar] [CrossRef]
  7. Li, C.X.; Georges, J.; Li, X.Y. Active Screen Plasma Nitriding of Austenitic Stainless Steel. Surf. Eng. 2002, 18, 453–457. [Google Scholar] [CrossRef]
  8. Yazıcı, M.; Çomaklı, O.; Yetim, T.; Yetim, A.F.; Çelik, A. Investigation of Mechanical, Tribological and Magnetic Properties after Plasma Nitriding of AISI 316L Stainless Steel Produced with Different Orientations Angles by Selective Laser Melting. Surf. Coat. Technol. 2023, 467, 129676. [Google Scholar] [CrossRef]
  9. Singh, A.; Thirumurugesan, R.; Krishnakumar, S.; Rani, R.; Chandramouli, S.; Parameswaran, P.; Mythili, R. Performance Evaluation of Plasma Nitrided 316L Stainless Steel during Long Term High Temperature Sodium Exposure. Nucl. Eng. Technol. 2023, 55, 1468–1475. [Google Scholar] [CrossRef]
  10. Lu, Y.; Li, D.; Ma, H.; Liu, X.; Wu, M.; Hu, J. Enhanced Plasma Nitriding Efficiency and Properties by Severe Plastic Deformation Pretreatment for 316L Austenitic Stainless Steel. J. Mater. Res. Technol. 2021, 15, 1742–1746. [Google Scholar] [CrossRef]
  11. Hirano, M.; Miura, K.; Ohtsu, N. Hydrogen-Free Plasma Nitriding Process for Fabrication of Expanded Austenite Layer on AISI 316 Stainless Steel Surface. Materials 2025, 18, 140. [Google Scholar] [CrossRef]
  12. Zhang, X.; Zhang, L.; Ma, C.; Hai, X.; Song, K. 316L Austenitic Stainless Steel Deformation Organization and Nitriding-Strengthened Layer Relationships. Appl. Sci. 2025, 15, 2352. [Google Scholar] [CrossRef]
  13. Zatkalíková, V.; Drímalová, P.; Balin, K.; Slezák, M.; Markovičová, L. Electrochemical Behavior of Plasma-Nitrided Austenitic Stainless Steel in Chloride Solutions. Materials 2024, 17, 4189. [Google Scholar] [CrossRef] [PubMed]
  14. Kucharska, B.; Kamiński, J.; Kulikowski, K.; Borowski, T.; Sobiecki, J.R.; Wierzchoń, T. The Effect of Nitriding Temperature of AISI 316L Steel on Sub-Zero Corrosion Resistance in C2H5OH. Materials 2024, 17, 3056. [Google Scholar] [CrossRef] [PubMed]
  15. Andriūnas, P.; Čerapaitė-Trušinskienė, R.; Galdikas, A. Modeling of Plasma Nitriding of Austenitic Stainless Steel through a Mask. Coatings 2024, 14, 1014. [Google Scholar] [CrossRef]
  16. Guardian-Tapia, R.; Rosales-Cadena, I.; Roman-Zubillaga, J.L.; Gonzaga-Segura, S.R. Mechanical and Microstructural Characterization of AISI 316L Stainless Steel Superficially Modified by Solid Nitriding Technique. Coatings 2024, 14, 1167. [Google Scholar] [CrossRef]
  17. Corujeira Gallo, S.; Dong, H. Study of Active Screen Plasma Processing Conditions for Carburising and Nitriding Austenitic Stainless Steel. Surf. Coat. Technol. 2009, 203, 3669–3675. [Google Scholar] [CrossRef]
  18. Souza, R.M.; Ignat, M.; Pinedo, C.E.; Tschiptschin, A.P. Structure and Properties of Low Temperature Plasma Carburized Austenitic Stainless Steels. Surf. Coat. Technol. 2009, 204, 1102–1105. [Google Scholar] [CrossRef]
  19. Liu, Z.; Zhang, S.; Wang, S.; Peng, Y.; Gong, J.; Somers, M.A.J. On the Fatigue Behavior of Low-Temperature Gaseous Carburized 316L Austenitic Stainless Steel: Experimental Analysis and Predictive Approach. Mater. Sci. Eng. A 2020, 793, 139651. [Google Scholar] [CrossRef]
  20. Liu, Z.; Wang, S.; Feng, Y.; Wang, X.; Peng, Y.; Gong, J. Exploration on the Fatigue Behavior of Low-Temperature Carburized 316L Austenitic Stainless Steel at Elevated Temperature. Mater. Sci. Eng. A 2022, 850, 143562. [Google Scholar] [CrossRef]
  21. Tsujikawa, M.; Yoshida, D.; Yamauchi, N.; Ueda, N.; Sone, T.; Tanaka, S. Surface Material Design of 316 Stainless Steel by Combination of Low Temperature Carburizing and Nitriding. Surf. Coat. Technol. 2005, 200, 507–511. [Google Scholar] [CrossRef]
  22. Borgioli, F. The Expanded Phases Formed in Stainless Steels by Means of Low-Temperature Thermochemical Treatments: A Corrosion Perspective. Metals 2024, 14, 1371. [Google Scholar] [CrossRef]
  23. Cheng, Z.; Li, C.X.; Dong, H.; Bell, T. Low Temperature Plasma Nitrocarburising of AISI 316 Austenitic Stainless Steel. Surf. Coat. Technol. 2005, 191, 195–200. [Google Scholar] [CrossRef]
  24. Borowski, T.; Kulikowski, K.; Spychalski, M.; Rożniatowski, K.; Rajchel, B.; Adamczyk-Cieślak, B.; Wierzchoń, T. Mechanical Behavior of Nitrocarburised Austenitic Steel Coated with N-DLC by Means of DC and Pulsed Glow Discharge. Arch. Metall. Mater. 2022, 67, 317–324. [Google Scholar] [CrossRef]
  25. Kajzer, A.; Ceglarska, M.; Sura, N.; Kajzer, W.; Borowski, T.; Tarnowski, M.; Pilecki, Z. Effect of Nitrided and Nitrocarburised Austenite on Pitting and Crevice Corrosion Resistance of 316 LVM Steel Implants. Materials 2020, 13, 5484. [Google Scholar] [CrossRef]
  26. Zhang, M.; Zhai, L.; Xue, Y.; Xu, Y.; Wu, W.; Jiang, Y.; Gong, J. Unusual Intermediate Layer Precipitation in Low-Temperature Salt Bath Nitrocarburized 316L Austenitic Stainless Steel. Surf. Coat. Technol. 2024, 494, 131521. [Google Scholar] [CrossRef]
  27. Jafarpour, S.M.; Dalke, A.; Biermann, H. Different Approaches for Plasma Nitrocarburizing of Austenitic Stainless Steel Using a Plasma-Activated Solid Carbon Precursor in a Hot-Wall Reactor. J. Mater. Res. Technol. 2025, 34, 1791–1802. [Google Scholar] [CrossRef]
  28. Xue, Y.; Zhai, L.; Xu, Y.; Wu, W.; Jiang, Y.; Gong, j. Low-Temperature Nitrocarburized 316L Stainless Steel: Residual Stress and Mechanical Properties. Surf. Interfaces 2025, 62, 106247. [Google Scholar] [CrossRef]
  29. Lee, I.; Barua, A. Behavior of the S-Phase of Plasma Nitrocarburized 316L Austenitic Stainless Steel on Changing Pulse Frequency and Discharge Voltage at Fixed Pulse-off Time. Surf. Coat. Technol. 2016, 307, 1045–1052. [Google Scholar] [CrossRef]
  30. Borowski, T.; Kulikowski, K.; Adamczyk-Cieślak, B.; Rożniatowski, K.; Spychalski, M.; Tarnowski, M. Influence of Nitrided and Nitrocarburised Layers on the Functional Properties of Nitrogen-Doped Soft Carbon-Based Coatings Deposited on 316L Steel under DC Glow-Discharge Conditions. Surf. Coat. Technol. 2020, 392, 125705. [Google Scholar] [CrossRef]
  31. Zhu, W.; Xu, Z.; Su, Z.; Li, Y.; Yi, A.; Zheng, J.; Zhu, J.; Li, K.; Chen, K.; Liao, Z.; et al. Mechanical Property and Biocompatibility of Multilayer Ti-DLC Films with Different Ti Target Power by Hybrid PVD/PECVD on 316L Stainless Steel. Surf. Coat. Technol. 2025, 496, 131672. [Google Scholar] [CrossRef]
  32. Wongpanya, P.; Wongpinij, T.; Photongkam, P.; Siritapetawee, J. Improvement in Corrosion Resistance of 316L Stainless Steel in Simulated Body Fluid Mixed with Antiplatelet Drugs by Coating with Ti-Doped DLC Films for Application in Biomaterials. Corros. Sci. 2022, 208, 110611. [Google Scholar] [CrossRef]
  33. Yazdanpanah, A.; Pietri, A.D.; Ben Hjal, A.; Khodabakhshi, M.; Biasiolo, L.; Dabalà, M. Electrochemical and Localized Corrosion Characteristics of Kolsterised and DLC-Coated 316LVM Stainless Steel for Biomedical Applications. Appl. Surf. Sci. 2025, 693, 162808. [Google Scholar] [CrossRef]
  34. Vicente, F.A.; Ramos, B.B.; Pereira, D.G.; Bendo, T.; Hammes, G.; De Mello, J.D.B.; Binder, C. Effect of Thermochemical Treatment as Buffer Layers on the Tribological Performance of Stainless Steel with DLC Films. Wear 2025, 570, 205998. [Google Scholar] [CrossRef]
  35. Zhang, X.; Liu, Y.; Ma, Z.; Chen, S.; Ma, M.; Yang, D.; An, X.; Zhao, Y.; Chen, L.; Liu, L.; et al. High-Loading 316L Stainless Steel by Integrated Low-Temperature Surface Nitriding and DLC Deposition. Surf. Coat. Technol. 2025, 496, 131716. [Google Scholar] [CrossRef]
  36. Jellesen, M.S.; Christiansen, T.L.; Hilbert, L.R.; Møller, P. Erosion–Corrosion and Corrosion Properties of DLC Coated Low Temperature Gas-Nitrided Austenitic Stainless Steel. Wear 2009, 267, 1709–1714. [Google Scholar] [CrossRef]
  37. Liu, C.; Zhao, Q.; Liu, Y.; Wang, S.; Abel, E.W. Reduction of Bacterial Adhesion on Modified DLC Coatings. Colloids Surf. B Biointerfaces 2008, 61, 182–187. [Google Scholar] [CrossRef]
  38. Li, C.X.; Bell, T. Corrosion Properties of Active Screen Plasma Nitrided 316 Austenitic Stainless Steel. Corros. Sci. 2004, 46, 1527–1547. [Google Scholar] [CrossRef]
  39. Zhao, Y.; Peng, K.; Wen, W.; Lu, D.; Long, J.; Meng, Y.; Peng, M.; Wei, F. Coupled Effects of TRIP and TWIP in Metastable Austenitic Stainless Steel via Optimization of Stacking Fault Energy. Mater. Charact. 2025, 220, 114656. [Google Scholar] [CrossRef]
  40. Das, A.; Chakraborti, P.C.; Tarafder, S.; Bhadeshia, H.K.D.H. Analysis of Deformation Induced Martensitic Transformation in Stainless Steels. Mater. Sci. Technol. 2011, 27, 366–370. [Google Scholar] [CrossRef]
  41. Tian, Y.; Borgenstam, A.; Hedström, P. Comparing the Deformation-Induced Martensitic Transformation with the Athermal Martensitic Transformation in Fe-Cr-Ni Alloys. J. Alloys Compd. 2018, 766, 131–139. [Google Scholar] [CrossRef]
  42. Borowski, T.; Jeleńkowski, J.; Psoda, M.; Wierzchoń, T. Modifying the Structure of Glow Discharge Nitrided Layers Produced on High-Nickel Chromium-Less Steel with the Participation of an Athermal Martensitic Transformation. Surf. Coat. Technol. 2010, 204, 1375–1379. [Google Scholar] [CrossRef]
Figure 1. Nabertherm tube furnace used for oxidation.
Metals 15 00707 g001
Figure 2. Macroscopic appearance of the surface of AISI 316L steel in its initial state (a) and after oxidation processes at temperatures of 400 °C (b), 450 °C (c) and 500 °C (d).
Metals 15 00707 g002
Figure 3. 3D images from an optical profilometer of the polished AISI 316L steel surface in its initial state (a) and after oxidation processes at temperatures of 400 °C (b), 450 °C (c) and 500 °C (d).
Metals 15 00707 g003
Figure 4. X-ray diffraction pattern of AISI 316L steel in its initial state.
Metals 15 00707 g004
Figure 5. X-ray diffraction pattern of AISI 316L steel oxidized at 400 °C.
Metals 15 00707 g005
Figure 6. X-ray diffraction pattern of AISI 316L steel oxidized at 500 °C.
Metals 15 00707 g006
Figure 7. Microhardness of AISI 316L steel surface in the initial state and after oxidation processes at temperatures of 400 °C, 450 °C and 500 °C.
Metals 15 00707 g007
Figure 8. 3D images of wear tracks of the polished surface of AISI 316L steel in its initial state (a) and after oxidation processes at temperatures of 400 °C (b), 450 °C (c) and 500 °C (d).
Metals 15 00707 g008aMetals 15 00707 g008b
Figure 9. Wear profiles of polished AISI 316L steel in the initial state and after oxidation processes at temperatures of 400 °C, 450 °C and 500 °C.
Metals 15 00707 g009
Figure 10. Friction coefficient versus the number of revolutions of AISI 316L steel in the initial state and after oxidation processes at temperatures of 400 °C, 450 °C and 500 °C.
Metals 15 00707 g010
Figure 11. Wear rate of AISI 316L steel in the initial state and after oxidation processes at temperatures of 400 °C, 450 °C and 500 °C.
Metals 15 00707 g011
Figure 12. Polarization curves of AISI 316L steel in the initial state and after oxidation processes at temperatures of 400 °C, 450 °C and 500 °C.
Metals 15 00707 g012
Figure 13. Corrosion damage of AISI 316L steel surface in initial condition (a) and after oxidation processes at temperatures of 400 °C (b), 450 °C (c) and 500 °C (d).
Metals 15 00707 g013
Figure 14. Contact angles and drops of distilled water on the surface of AISI 316L steel in the initial state (a) and after oxidation processes at temperatures of 400 °C (b), 450 °C (c) and 500 °C (d).
Metals 15 00707 g014
Table 1. Chemical composition of AISI 316L (EN 1.4404) steel (wt%).
CCrMnMoNNiPSSi
≤0.0316–18≤22–3≤0.110–14≤0.045≤0.03≤1
Table 2. Roughness parameters Ra and Rz of steel in the initial state and oxidized layers at 400, 450 and 500 °C.
MaterialRa [nm]Rz [nm]
AISI 316L33.1 ± 2.9989.6 ± 76.6
400 °C51.1 ± 1.11933.0 ± 274.8
450 °C84.2 ± 2.05266.7 ± 222.7
500 °C190.7 ± 8.611,231.6 ± 71.7
Table 3. Electrochemical values obtained from potentiodynamic curves for AISI 316L steel in the initial state and after oxidation processes at temperatures of 400 °C, 450 °C and 500 °C.
Materialicorr [nA/cm2]Ecorr [mV]Rpol [kΩ∙cm2]Epit [mV]
AISI 316L227 ± 138−28 ± 14468 ± 153420 ± 8
400 °C41 ± 14−62 ± 19909 ± 217398 ± 26
450 °C79 ± 18−177 ± 8275 ± 51267 ± 14
500 °C109 ± 14−196 ± 15190 ± 17160 ± 16
Disclaimer/Publisher’s Note: The statements, opinions and data contained in all publications are solely those of the individual author(s) and contributor(s) and not of MDPI and/or the editor(s). MDPI and/or the editor(s) disclaim responsibility for any injury to people or property resulting from any ideas, methods, instructions or products referred to in the content.

