1. Introduction
Using traditional techniques, electrical discharge machining (EDM) is frequently used to process hard materials and complex shapes that are difficult to machine. Wire EDM (WEDM) cutting has become a necessary equipment for tool, mold, manufacturing, automotive, and aerospace industries, etc. The advantage of this WEDM technique is that there is no direct contact between the wire and the workpiece during the machining process. Therefore, the high hardness of the workpiece poses no problem with machinability [
1]. WEDM could create small, minimal radius angles with wires electrodes having a radius of 0.025–0.15 mm [
2]. In WEDM, surface roughness (SR), deviation dimension (DD), and machining time (MT) are the criteria to evaluate the machining quality [
3].
There are many input parameters, such as pulse on time (Ton), pulse off time (Toff), waveform, and servo voltage (SV), that could impact the WEDM quality. Optimizing the process parameters for some popular materials is critical to improve the WEDM technique [
4]. Many authors have reported optimization when applying WEDM to Ti6Al4V, aluminum composite, AISI P20 steel, SKD61 steel, EN41B steel, Al
2O
3–TiC composite, and Al 2219 alloy [
5,
6,
7,
8,
9,
10,
11]. Rana et al. [
12], for instance, reported the optimization of the cutting speed of the WEDM process for Al 2219 alloy by controlling Ton, Toff, and SV. They applied Box-Behnken design (BBD) experimentation combined with the Response Surface Methodology (RSM) technique. It was discovered that cutting speed varies directly with pulse on time and spark gap voltage but inversely with pulse off time. Wang et al. [
13] indicated that the discharge current wave forms such as rectangular, triangular, and trapezoidal can impact the machining quality. The triangular waveform has the highest material removal rate (MRR), followed by the trapezoidal one. The result showed that the SR and residual stress of the triangular wave form are also higher than those of the other forms. Zhou et al. [
14] increased EDM efficiency by applying a gap servo voltage during machining. By adaptively controlling the gap servo voltage to change the gap distance, arcing ratios were compelled to adhere closely to an arcing ratio expectation with little deviation. Thus, it is possible to achieve both stabilized and efficient machining simultaneously. Comparable tests showed that EDM performance significantly increased, with the machined depth being almost three times better than traditional EDM.
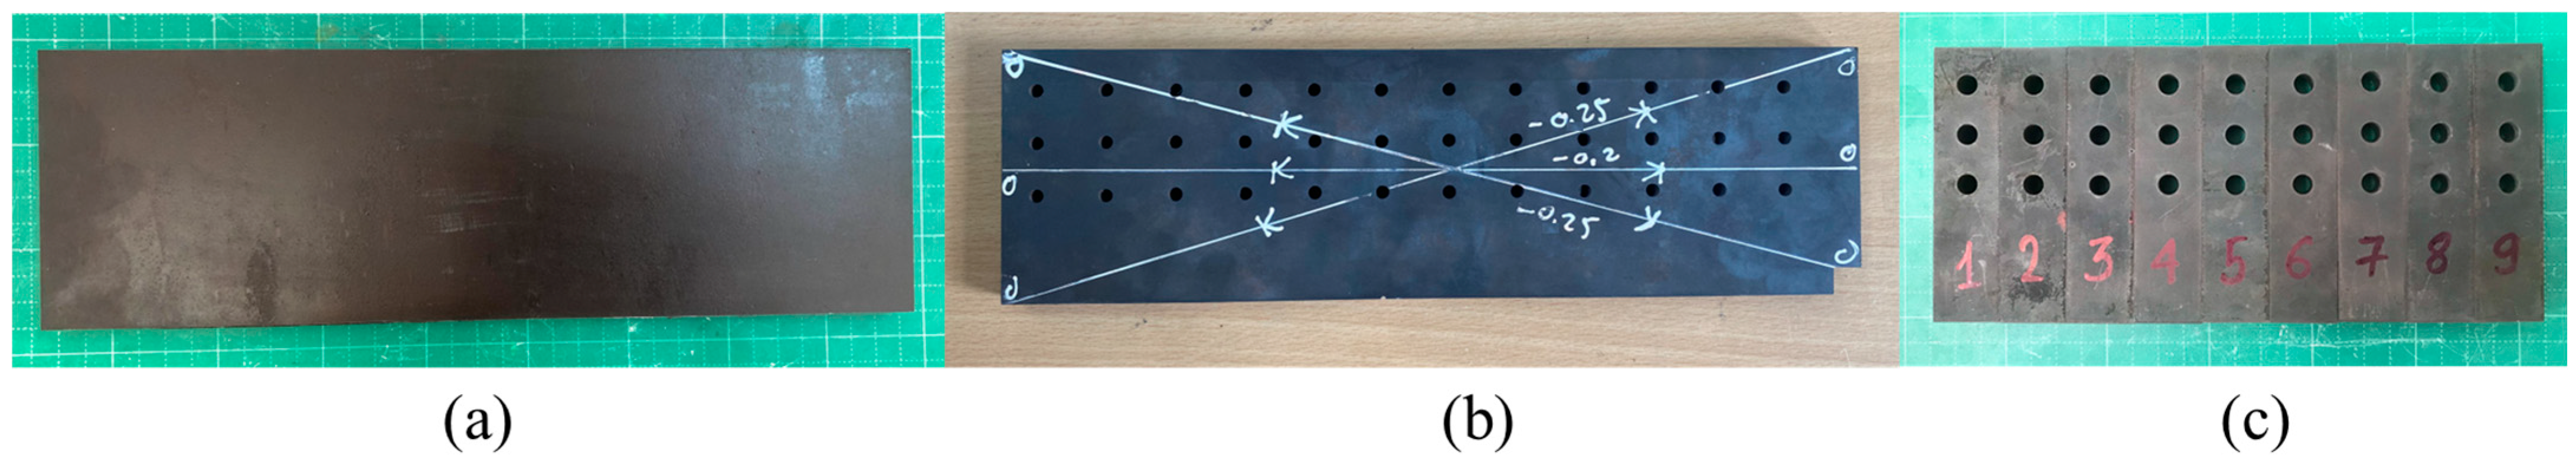
AISI D2 material is utilized in various practical applications, including producing punching tools, mandrels, mechanical press forging dies, plastic molds, die casting dies, aircraft landing gear, helicopter rotor blades, and shafts [
15]. Many studies have investigated optimizing input parameters when machining D2 material, such as V. Singh et al. [
15] optimized five numbers of machining parameters (pulse on time, pulse off time, peak current, servo voltage, and wire feed) of WEDM of AISI D2 steel (workpiece) with five numbers of performance parameters (gap current, cutting rate, gap voltage, MRR, and SR) and compare the results through Taguchi, RSM, and ANOVA optimization techniques. S. Sharma et al. [
1] investigated various input process parameters (Ton, Toff, Ip, Tw) on the response characteristics (MRR, gap voltage, MT) by using a Taguchi L9 orthogonal array. Signal-to-noise ratio and ANOVA were employed in the study of response parameters. S. Kumar Chaubey et al. [
16] observed the effect of peak current (IP), pulse on time (Ton), wire tension (WT), and wire feed rate (WF) on the material removal rate (MRR) and the surface roughness (SR). A. Kumar et al. [
17] used Taguchi L16 array experimental design for four process input control parameters, wire speed, flushing pressure, gap voltage, and current, which are investigated for MRR and surface roughness. ANOVA and Signal-to-Noise based analysis show that MRR is influenced by these input parameters in the order of current, followed by gap voltage, wire speed, and flushing pressure. S. A. Afridi et al. [
18] employed the Taguchi approach to experimental design to conduct cutting experiments at varying levels of pulse on time, pulse on time, servo voltage, and wire tension (L16). Experimental results were optimized using ANOVA and Grey Relational Analysis to refine the process inputs and achieve performance measures that minimize surface roughness, power consumption, and kerf width while maximizing material removal rate.
Besides the processing parameter optimization, many investigations report the surface integrity improvement [
19,
20,
21], the effects of wave discharge current [
13,
19], and analysis of inaccuracies in cutting angles [
17]. There are many optimization methods used, such as the Analytic Hierarchy Process, the PROMETHEE Method [
22], TOPSIS, the Analytical Hierarchy Process (AHP) [
23,
24], deep learning neural networks, and supervised machine learning [
3,
25]. However, the study [
26] demonstrated the advantages of using the Taguchi method, such as the simplicity of use and the ability to reduce variations when using an outer array. The Taguchi approach is less quick and efficient than Response Surface Methodology [
27]. One advantage of the Taguchi method is that it enables researchers and engineers to identify which factors most significantly affect the response variable, even with limited statistical knowledge and resources [
28]. To optimize the processing parameter, Taguchi method and Analysis of Variance (ANOVA) [
29,
30,
31,
32], Japanese statistician Genichi Taguchi [
33] developed the Taguchi method to address the multi-factor modeling issue. By recognizing and lessening the impact of disturbances, the Taguchi method’s basic idea is to ascertain the inputs required to attain maximum efficiency [
34]. An input variable known as “Credit” is a helpful signal that influences the outcome in two ways: it moves the outcome closer to the target. When using statistical methods, one way to verify calculation results is to apply the variance analysis, or ANOVA method. This approach is frequently employed in numerous domains [
34]. ANOVA examines whether variations exist between various experiments. Notable values from an ANOVA include the
p-value, sum of squared deviations (SS), and degrees of freedom (D.O.F.), where P stands for the testing process’s reliability. The baseline and S/N data were subjected to ANOVA to identify significant and non-significant variables and to determine how they affected the response characteristics [
35].
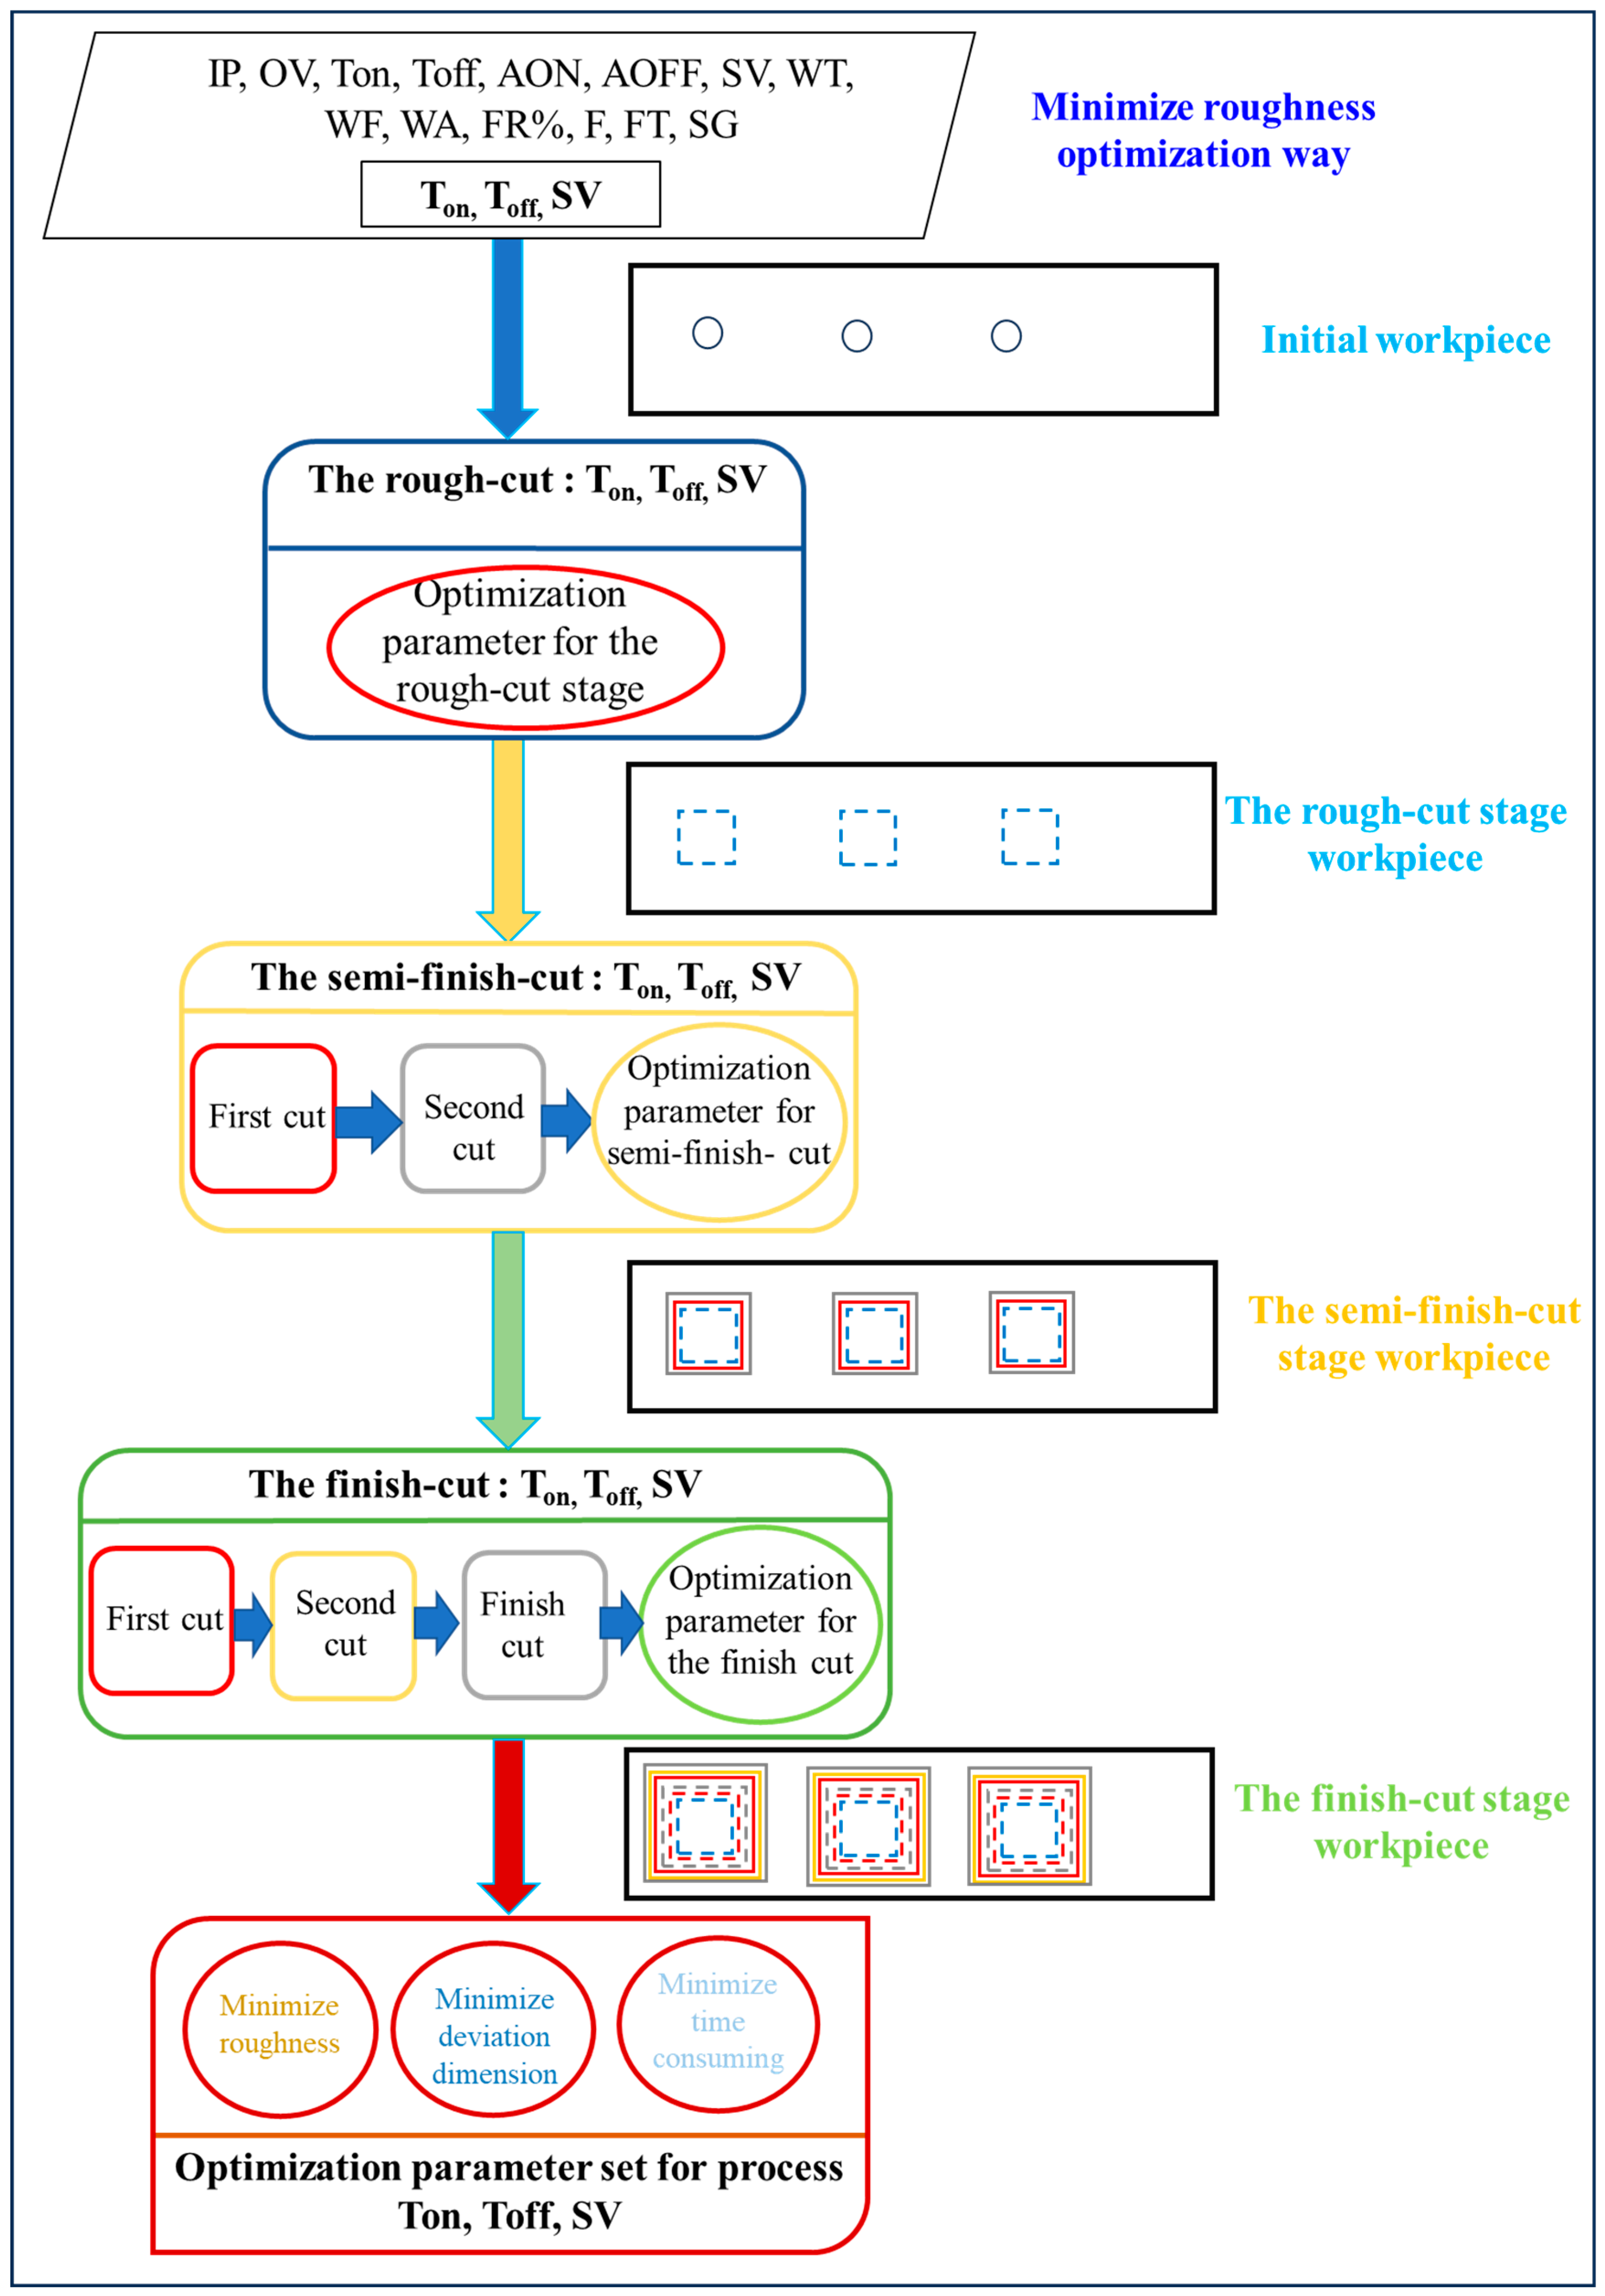
After a comprehensive study of the existing literature, several gaps have been noted in optimizing WEDM process parameters. The studies above primarily focus on determining the optimal input parameters to achieve accuracy for different materials within a single machining stage. They have not comprehensively evaluated the machining process to achieve accuracy and minimize machining time. Meanwhile, modern machine parts have increasingly high accuracy requirements. To meet these demands, EDM-machined parts are often processed in multiple steps (roughing, semi-finishing, and finishing), where dimensional deviation and surface roughness are crucial parameters affecting machining accuracy. Additionally, machining time is a key factor in determining accuracy and production efficiency. The machining conditions of a previous step can influence the results of a subsequent machining step. However, despite numerous studies optimizing machining parameters for D2 steel using WEDM, these studies have only focused on one stage, with few studies investigating the influence of technological parameters on the overall machining process concerning accuracy and machining time. To analyze the ambiguous problem, the Taguchi method is used in this study to optimize the WEDM processing input parameters, such as Ton, Toff, and SV, for the individual output responses, such as DD, SR, and MT, for D2 material. The study results could provide novel insight into the WEDM technique and the product quality.
4. Conclusions
Based on the result, the conclusion can be written as follows:
- -
These results would improve the machine’s surface properties and productivity while lowering machining costs, errors, and operation time.
- -
The quality of the machine part from D2 tool steel in the WEDM belongs to the input parameter. In each cutting step, the degree of influence of the factors will be different.
- -
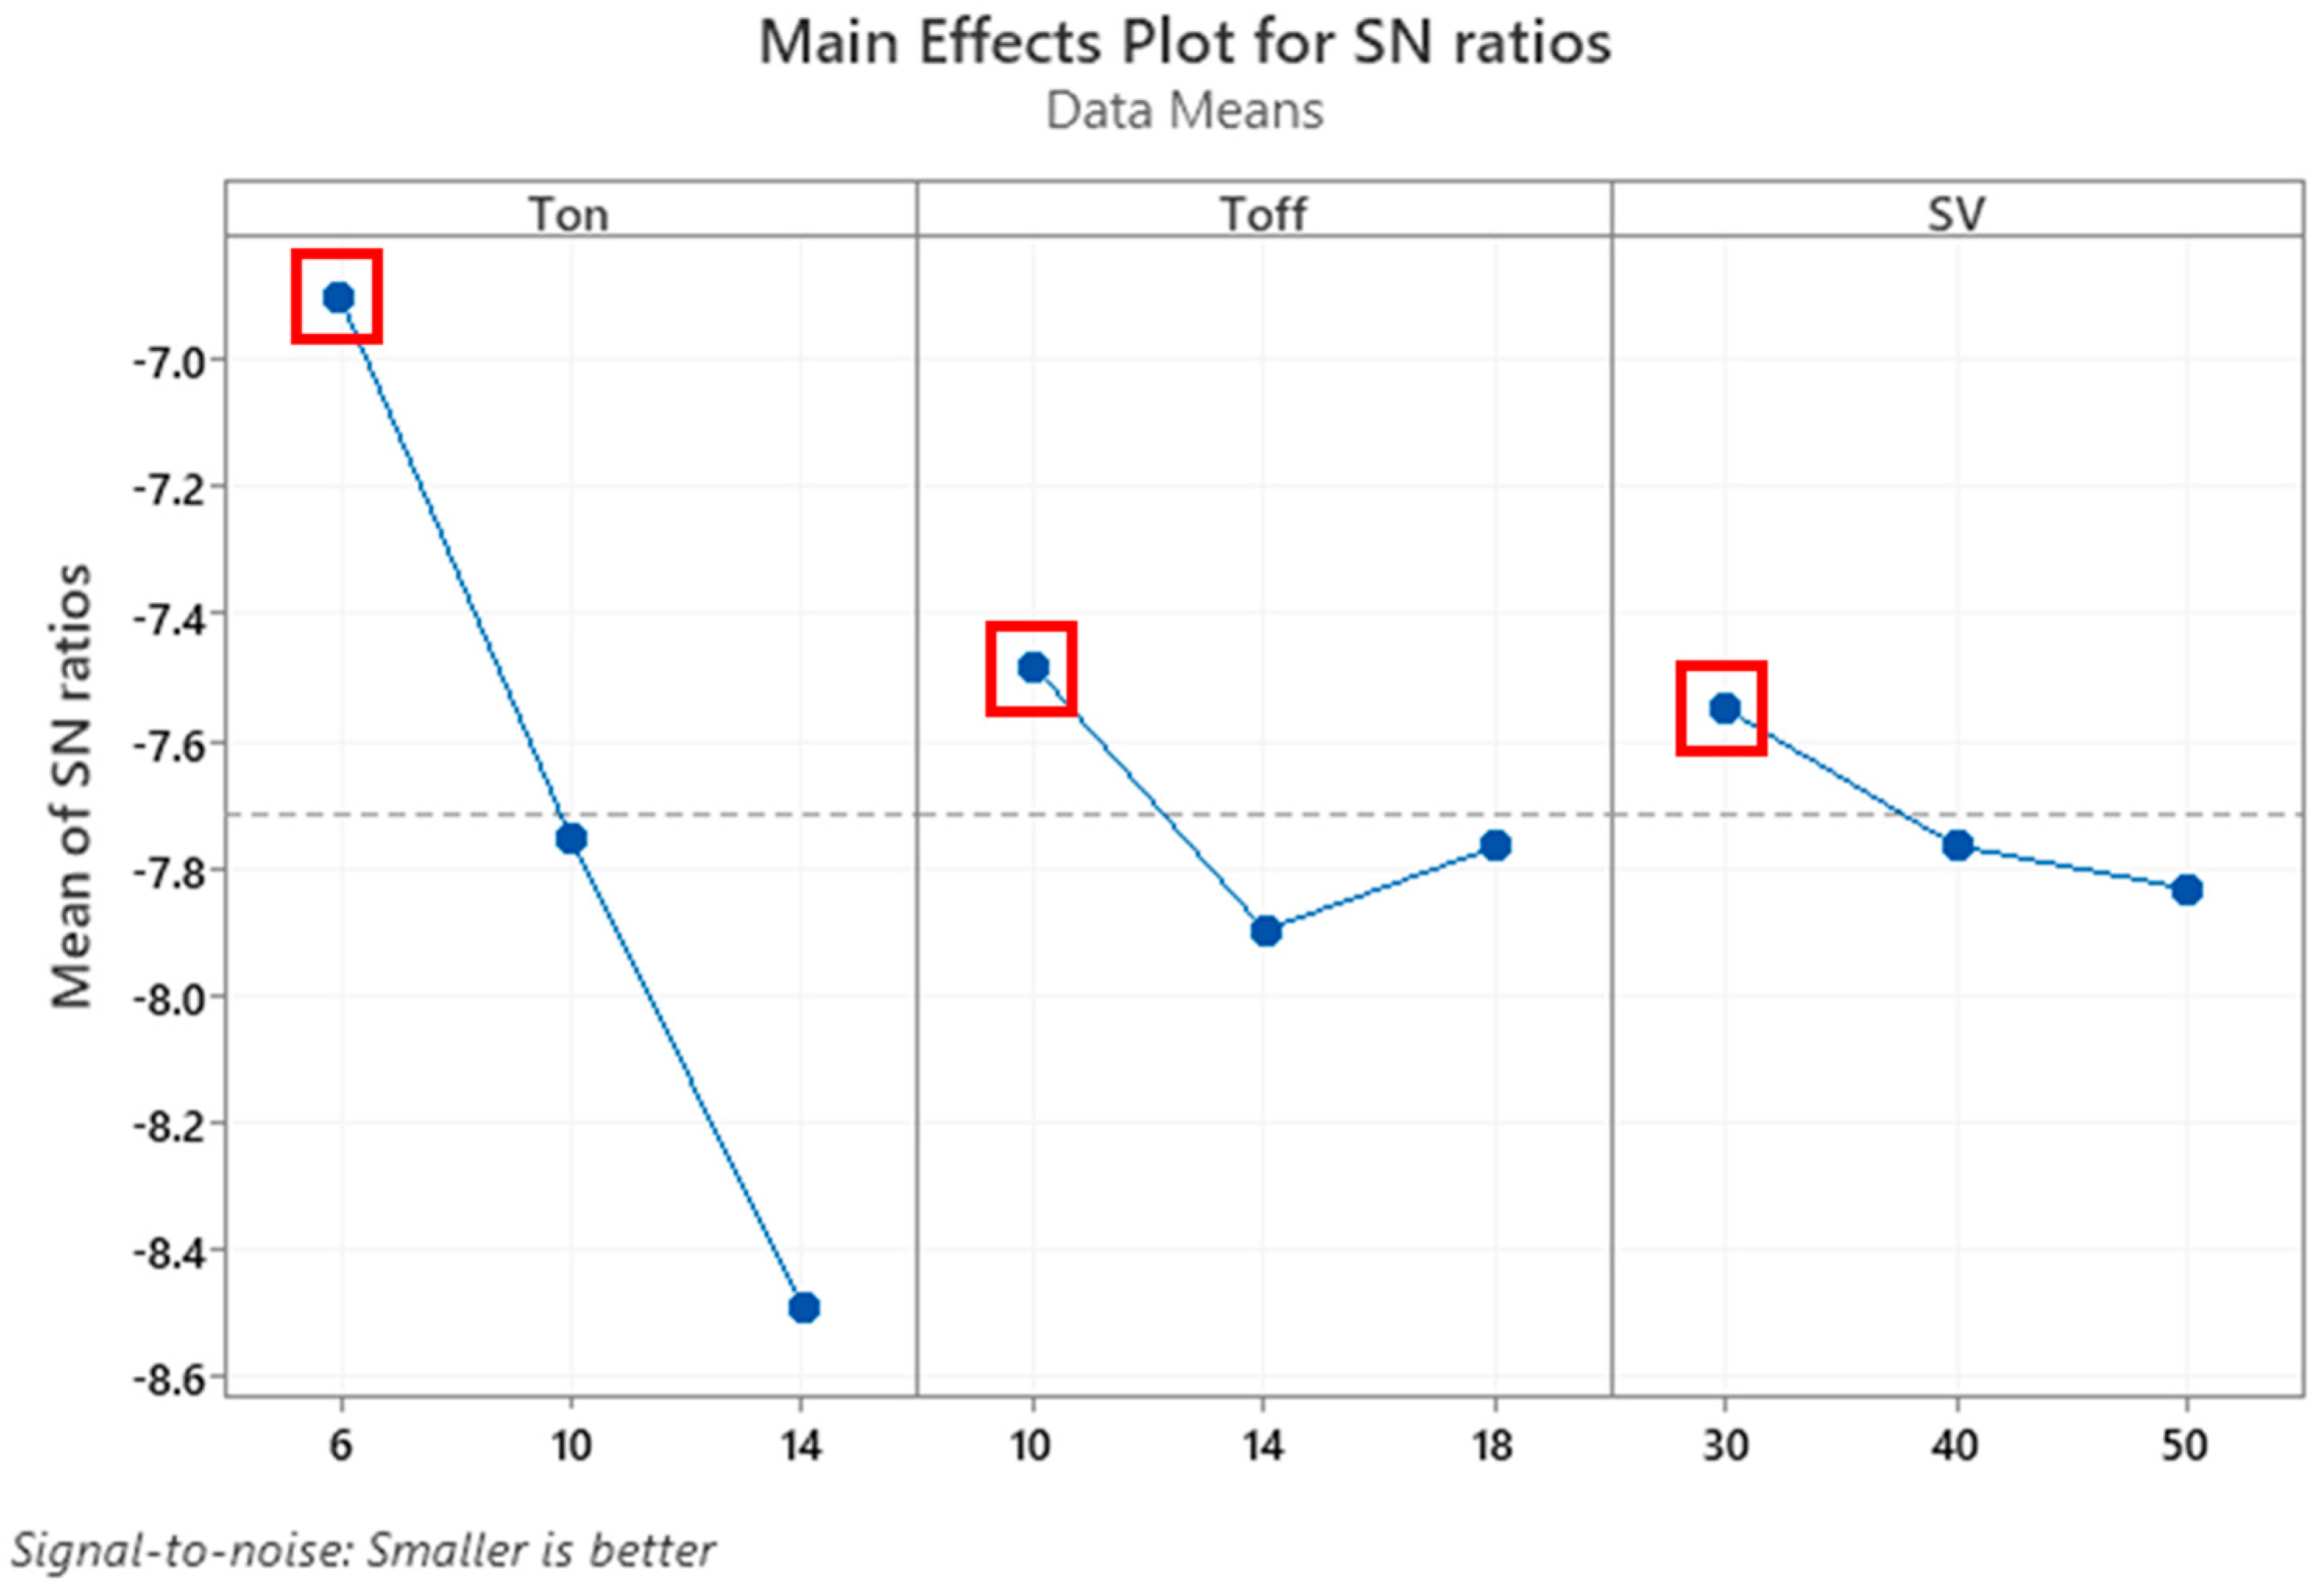
In the rough-cut stage
The results indicate that Ton was the most influential factor to the SR, then Toff and SV. The most significant factor influencing surface roughness during rough-cut staging is pulse on time (73.11%), followed by pulse off time (4.82%) and servo voltage (1.42%). The parameter sets of Ton = 6 μs, Toff = 10 μs, and SV = 30 V are the optimal values with SR = 2.03 µm.
- -
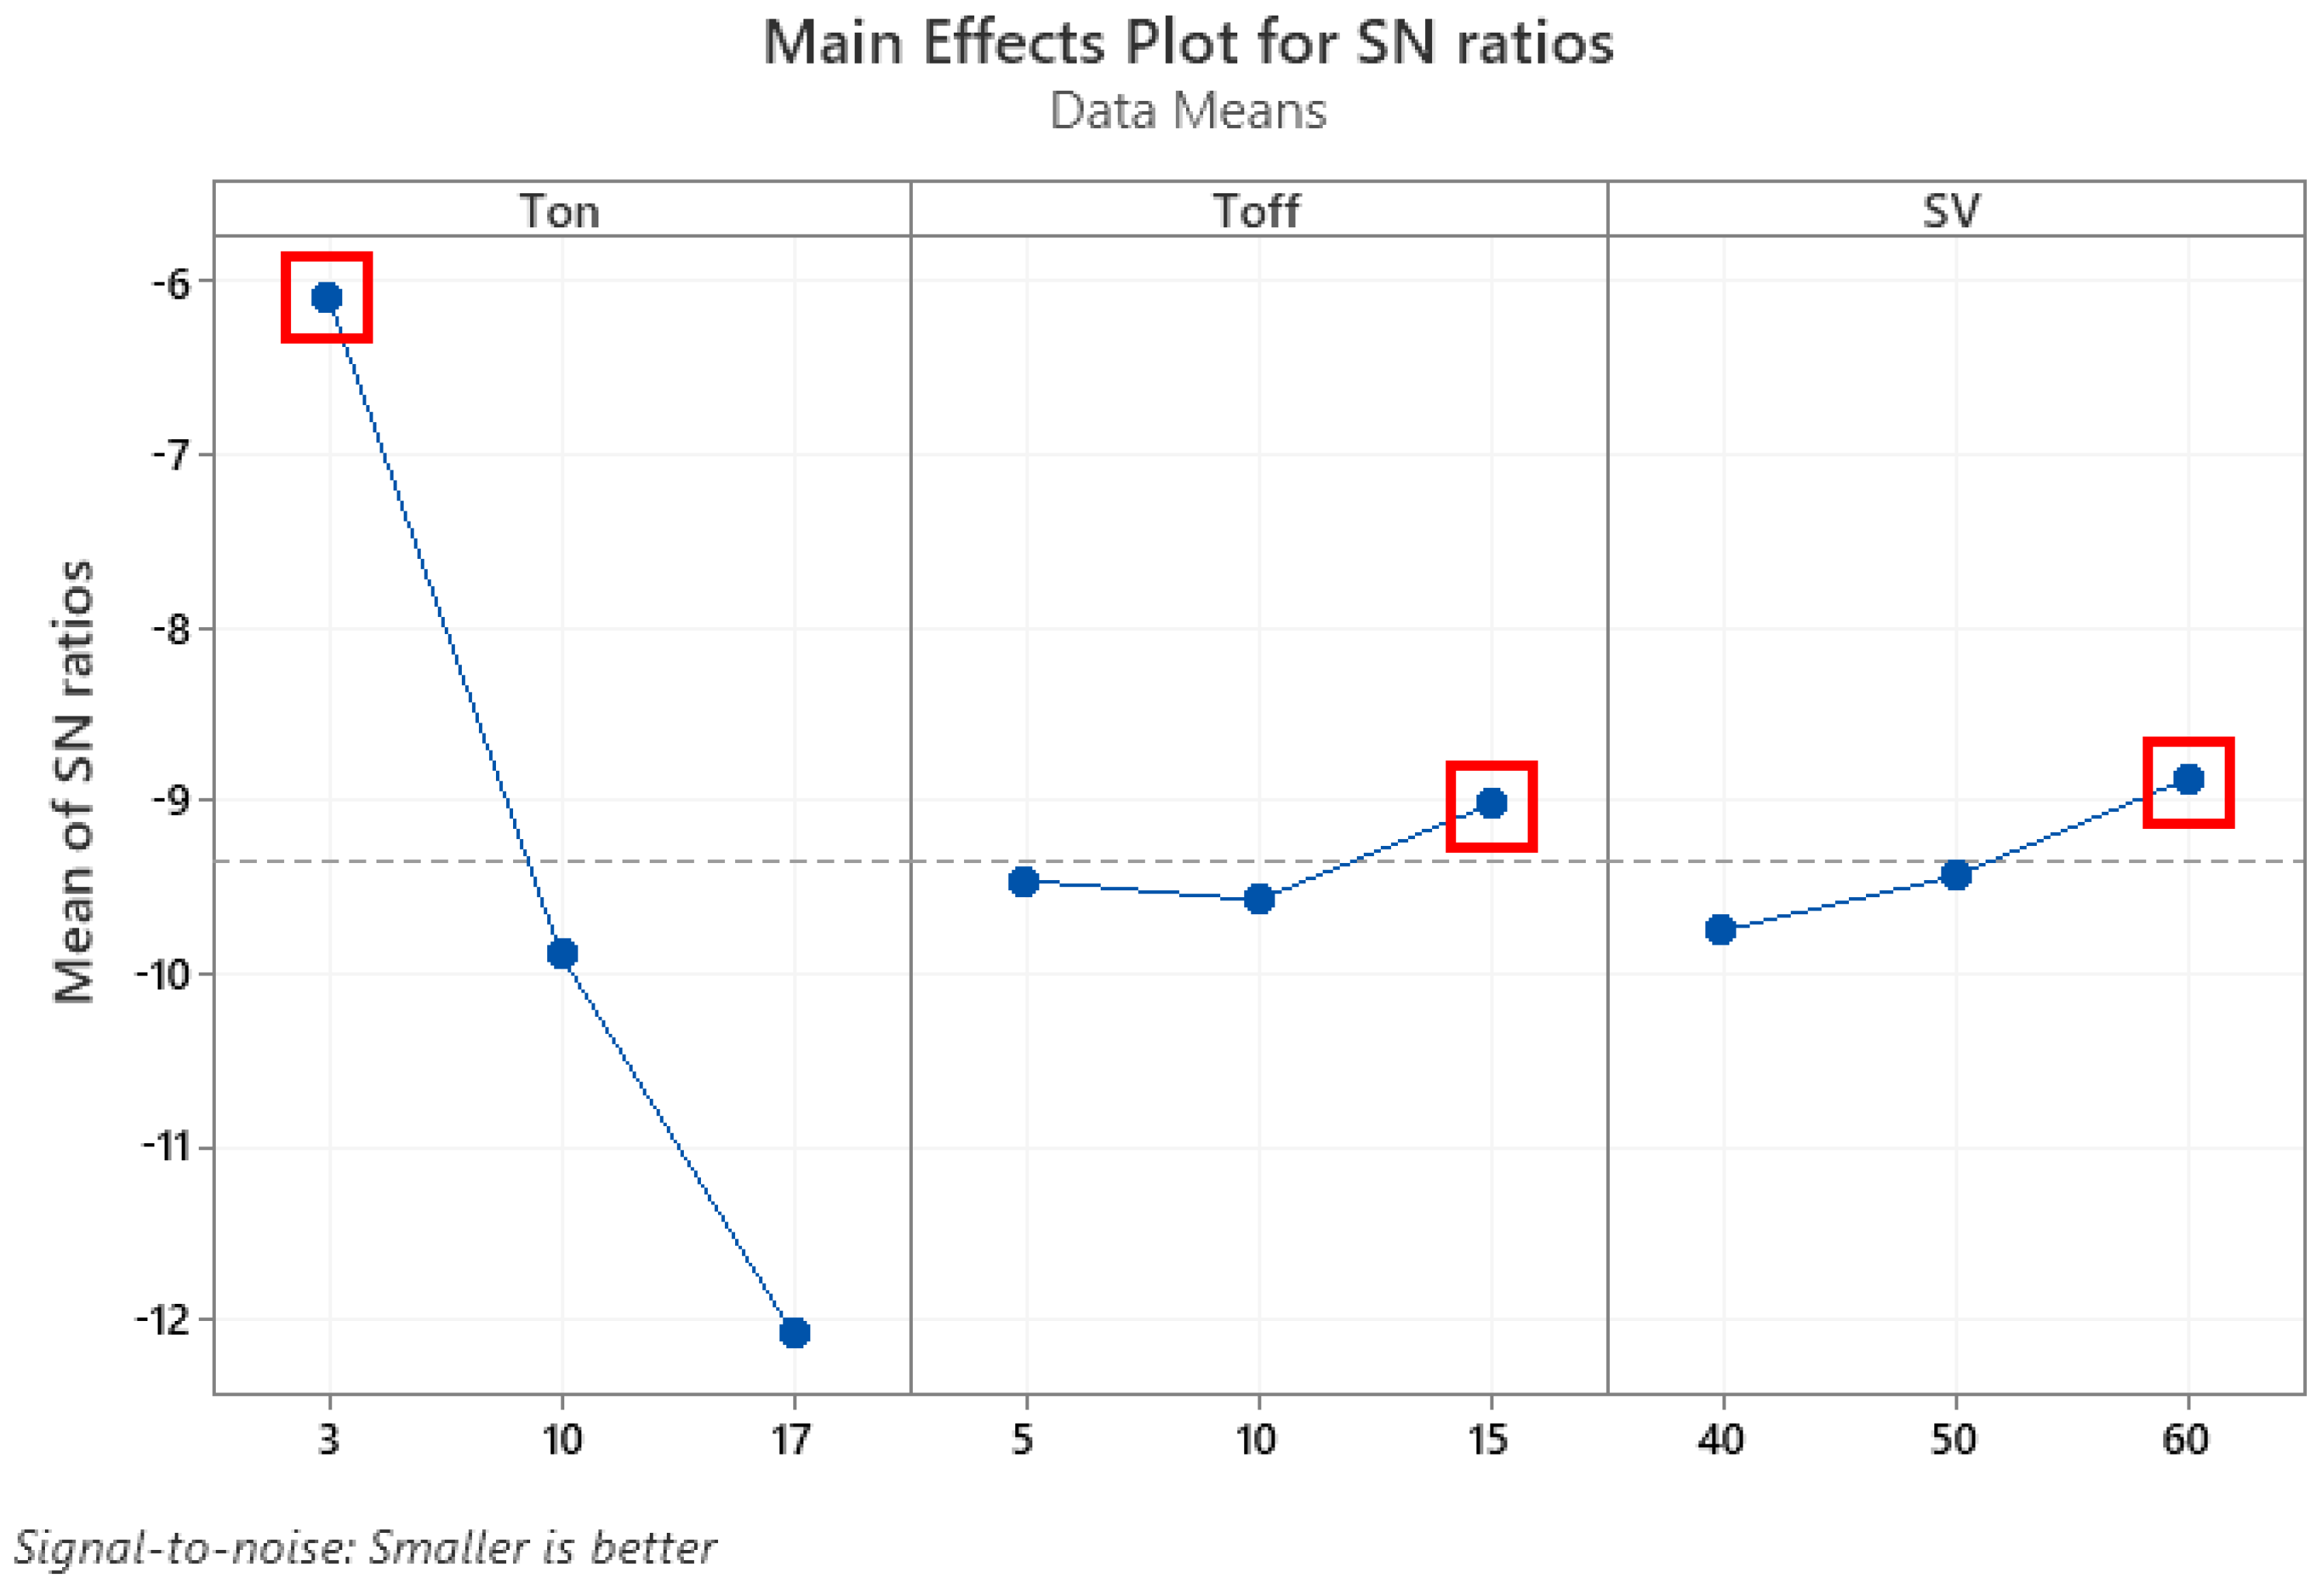
In the semi-finished-cut stage
A higher Ton value corresponds to a lower surface quality. Surface quality is inversely correlated with Toff and SV values (a higher value for Toff and SV indicates a higher quality surface). Pulse on time (97.13%), servo voltage (1.54%), and pulse off time (0.46%) affect surface roughness. Ton = 3 μs, Toff = 15 μs, and SV = 60 V are the set of optimal parameters with SR = 1.77 µm.
- -
In the finish-cut stage
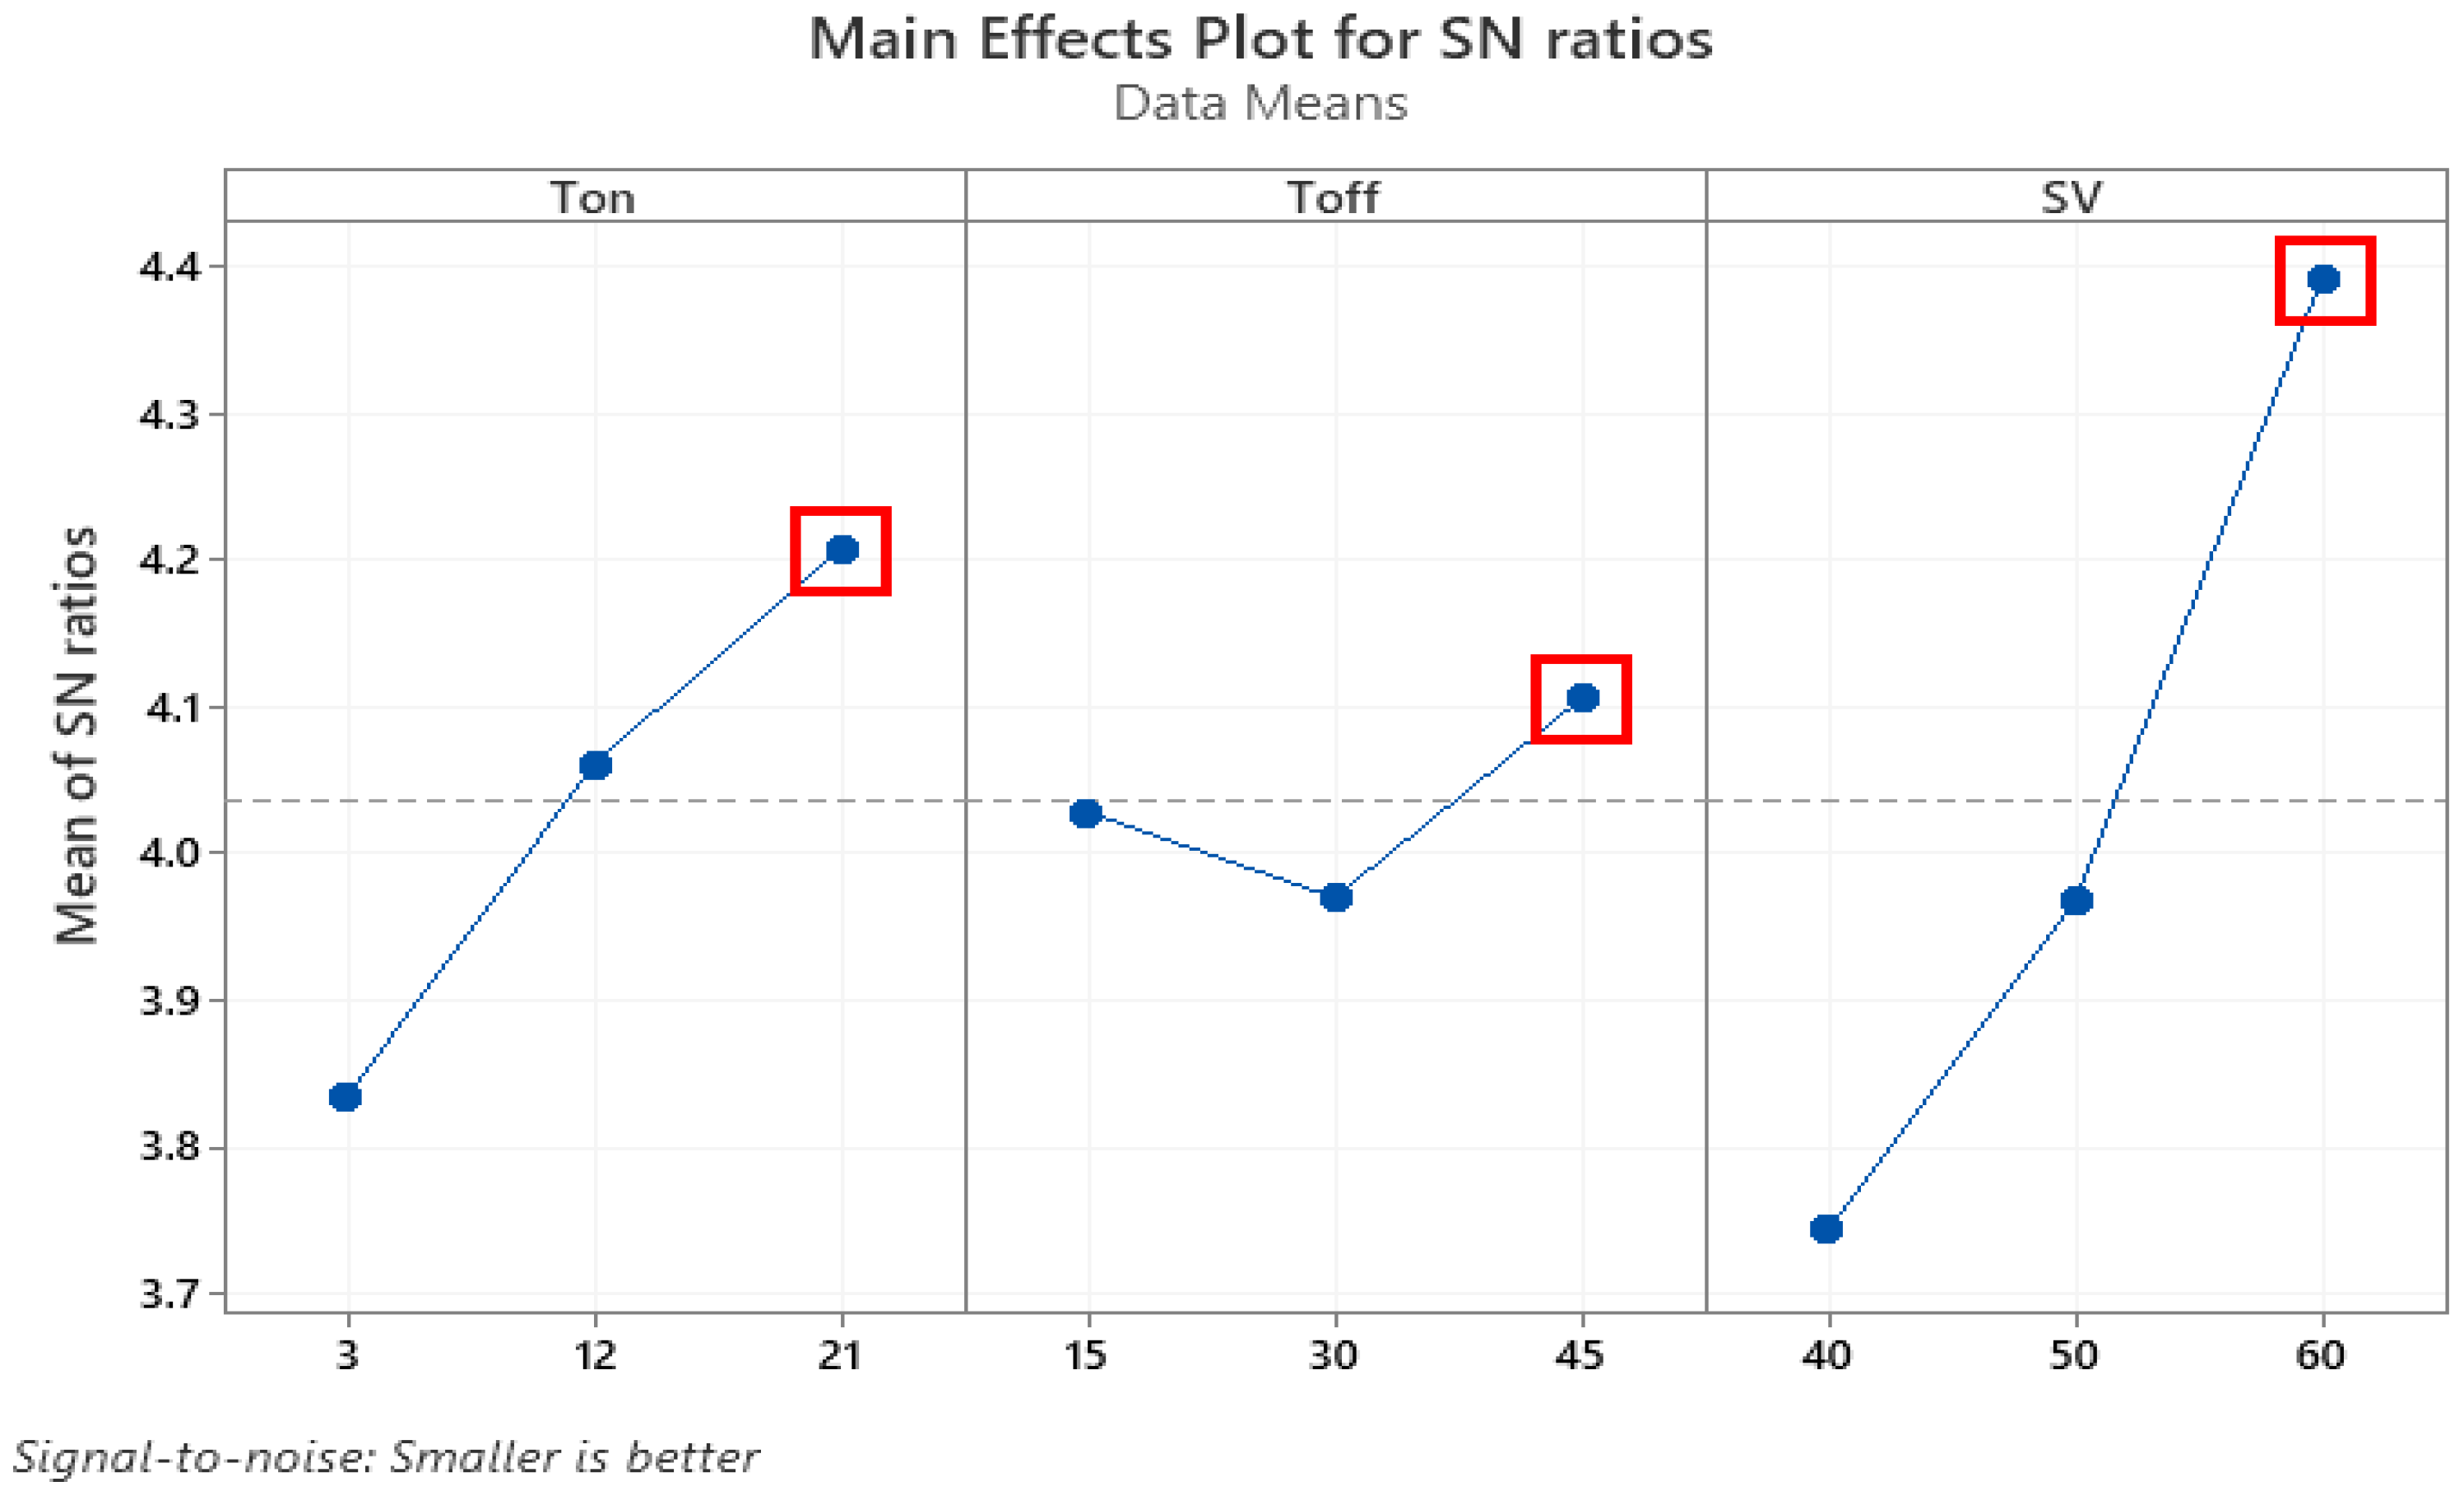
Minimize surface roughness in the finish-cut stage
The higher the values of Toff and SV, the better the surface roughness. Servo voltage (52.6%) is the factor that affects surface roughness the most after finishing cutting; pulse on time (18.36%) is the second-most important factor, and pulse off time (18.36%) is the third factor (1.64%) that affects surface roughness. SR = 0.57 µm with Ton = 21 μs, Toff = 45 μs, and SV = 60 V.
Minimize dimension deviation in the finish-cut stage
Servo voltage (61.95%) is the factor that affects size error the most after finishing cutting; pulse on time (10.01%) is the second most important factor, and pulse off time (6.87%). The parameters for optimal DD of 0.04% are Ton = 3 μs, Toff = 15 μs, and SV = 40 V.
Minimize machining time tasks in the finish-cut stage
Servo voltage is the factor that affects machining time the most when finishing cutting, accounting for 96.90% of the total. Pulse on time comes in second, with 1.32% of the total influence, and third after the time of machining (0.32%). The optimal value of MT is 218 s, with Ton = 3 μs, Toff = 30 μs, and SV = 40 V.
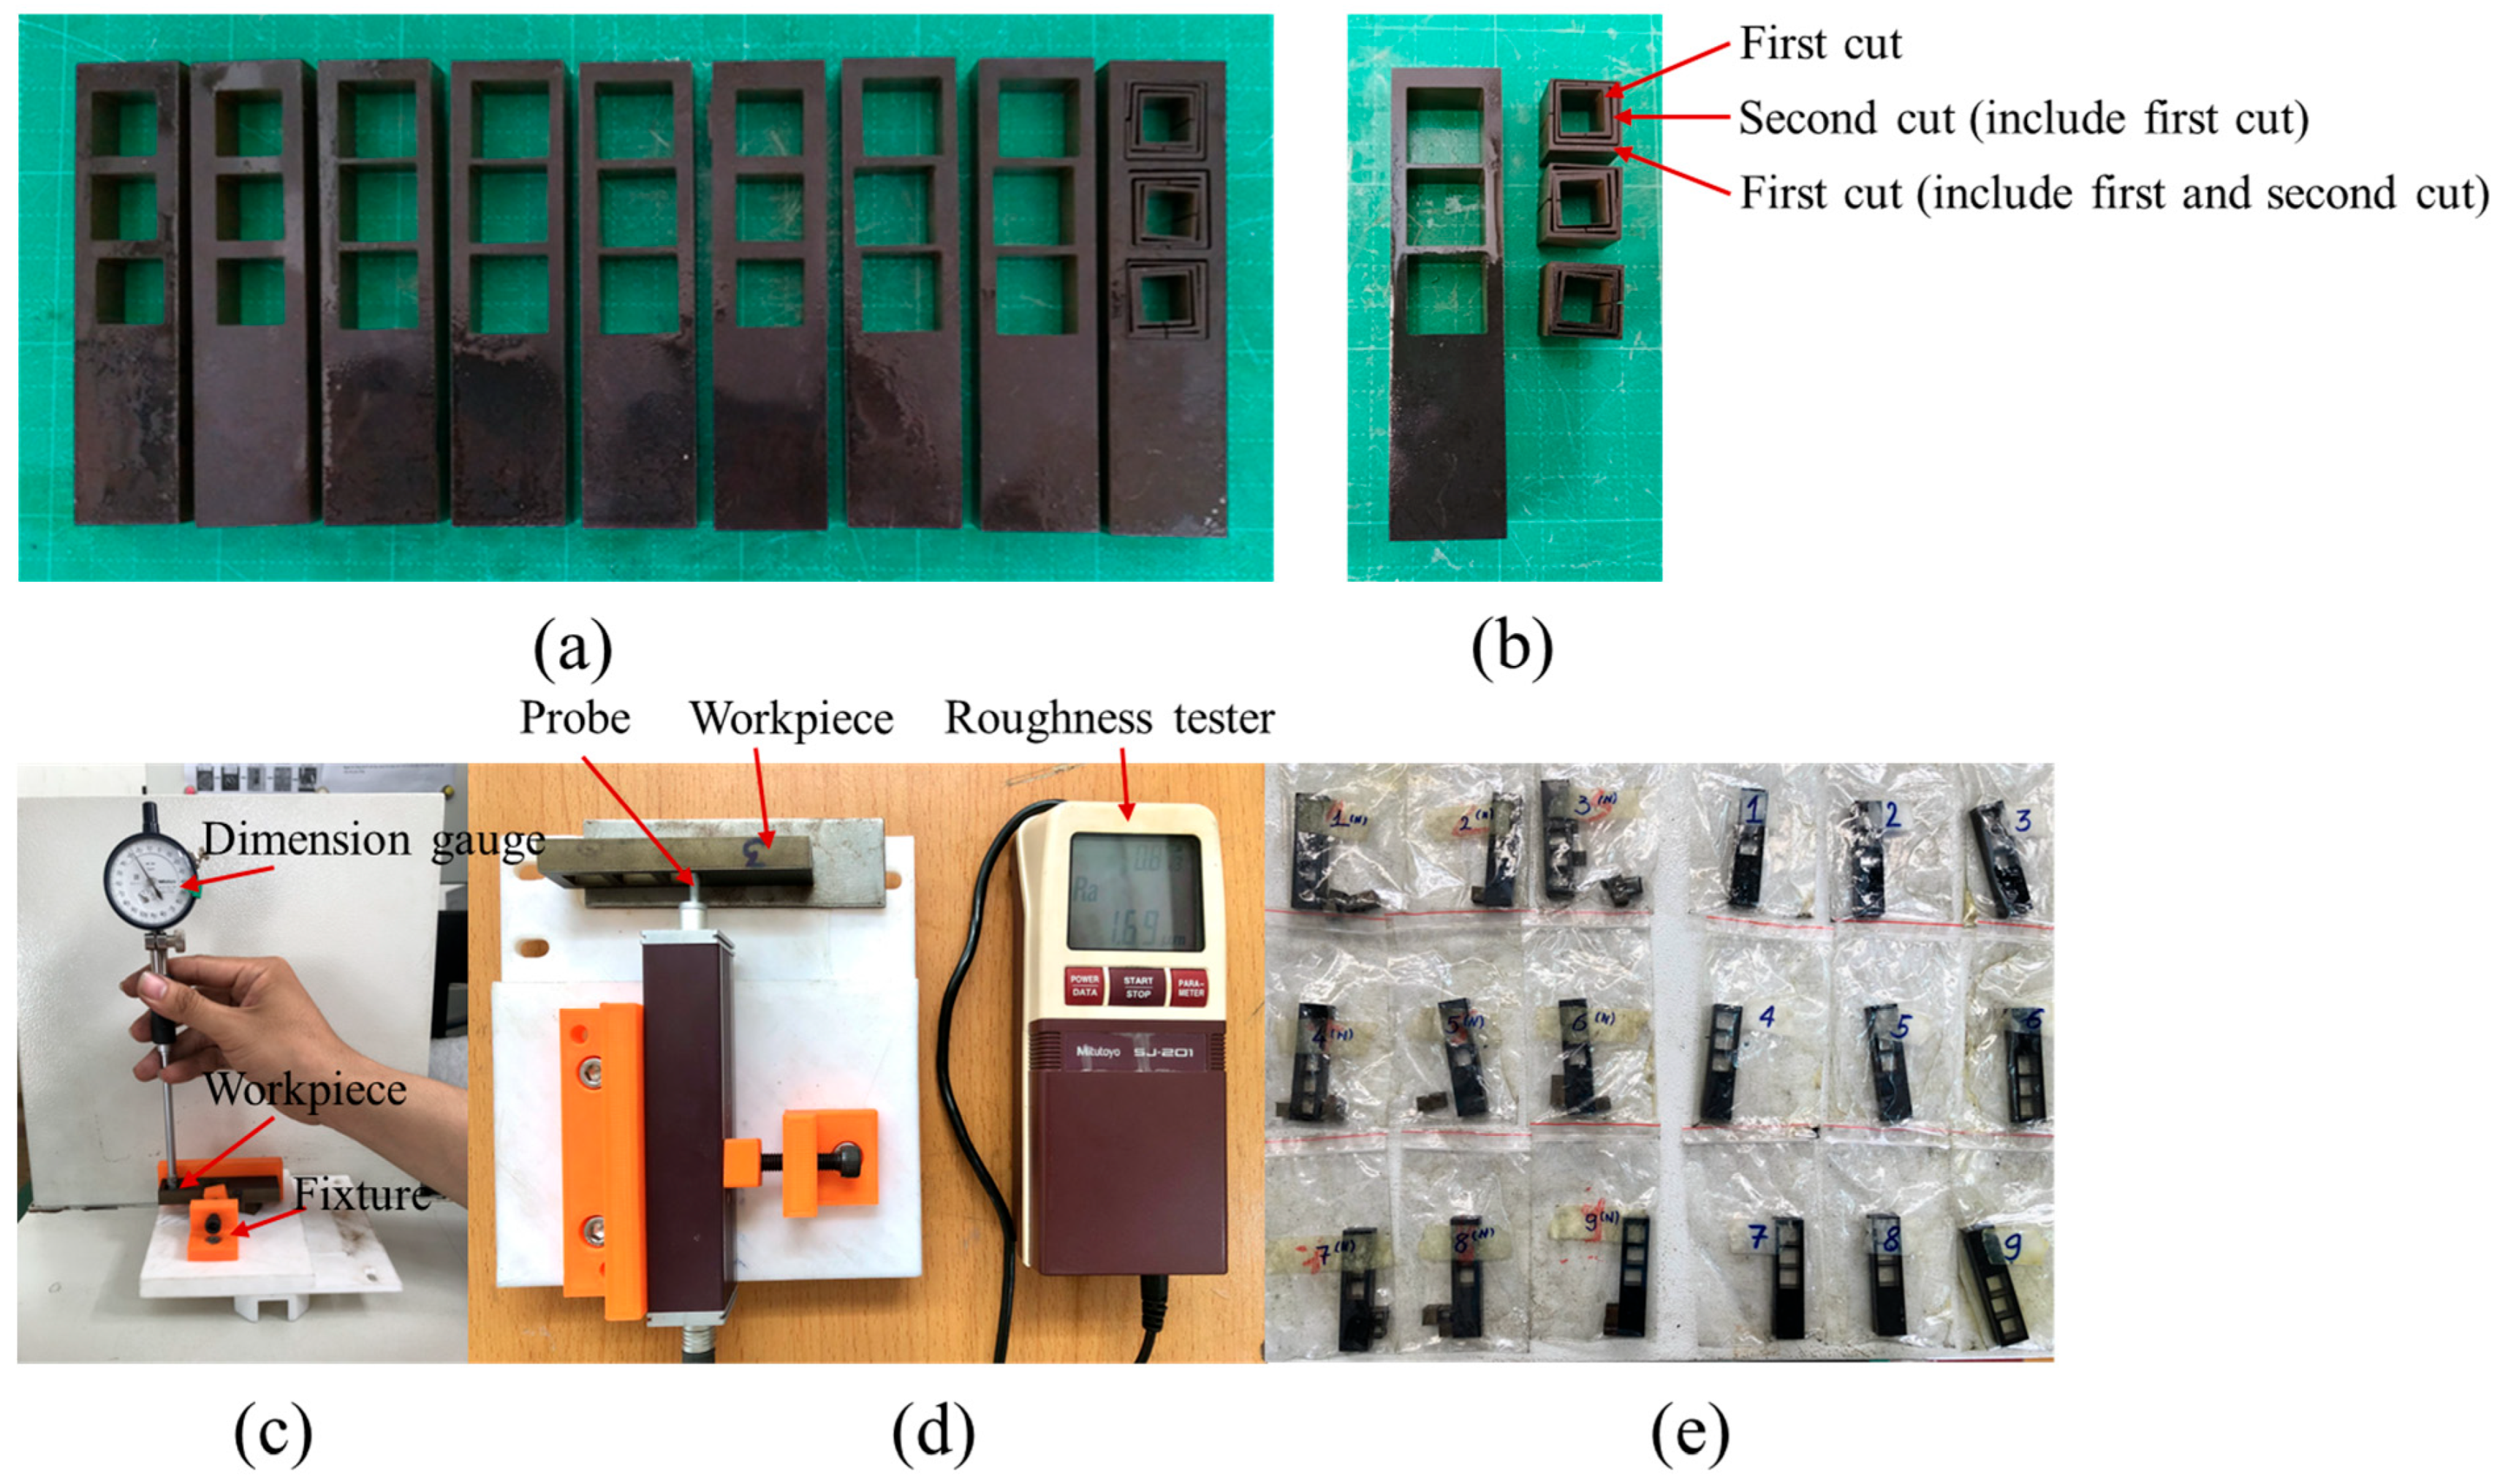
The results of the optimized parameter set have been verified through experimental cutting and AFM inspection. This research provides a basis for optimizing other factors for each machining step to improve accuracy and reduce machining time.


 ,
, 


