Article

Kinetics Study of the Hydrogen Reduction of Limonite Ore Using an Unreacted Core Model for Flat-Plate Particles

1
Jiangxi Provincial Key Laboratory of High-Performance Steel and Iron Alloy Materials, Jiangxi University of Science and Technology, Ganzhou 341000, China
2
School of Metallurgical Engineering, Jiangxi University of Science and Technology, Ganzhou 341000, China
*
Author to whom correspondence should be addressed.
Metals 2025, 15(6), 678; https://doi.org/10.3390/met15060678
Submission received: 3 May 2025 / Revised: 15 June 2025 / Accepted: 16 June 2025 / Published: 19 June 2025
(This article belongs to the Special Issue Recent Developments in Ironmaking)

Abstract

:
The iron and steel industry is a major emitter of carbon. In the context of China’s dual-carbon goals, hydrogen-based reduction ironmaking technology has garnered unprecedented attention. It is considered a crucial approach to reducing carbon dioxide emissions in the steel sector and facilitating the realization of carbon neutrality. This work conducted isothermal thermogravimetric analysis on limonite ore in a N2/H2 atmosphere. The influences of reduction temperature, particle size, and hydrogen partial pressure on the hydrogen reduction reaction process of limonite were investigated. Based on the principles of isothermal thermal analysis kinetics and the unreacted core model for flat-plate particles, the mechanism function and kinetic parameters for the reduction of limonite particles were determined. The research results show that the hydrogen reduction process of limonite ore is influenced by multiple factors, including temperature, hydrogen partial pressure, and particle size. Increasing the reduction temperature and hydrogen partial pressure can significantly speed up the reduction reaction rate and enhance the degree of reduction. The kinetic parameters for the hydrogen reduction of limonite particles were obtained as follows: the reaction activation energy was 44.738 kJ·mol−1, the pre-exponential factor was 31.438 m·s−1, and the rate constant for the hydrogen reduction of limonite was k = 31 . 438 × e 44 . 738 × 1000 R T m s 1 . In addition, contour maps were plotted to predict the reaction time and reaction temperature required for a complete reduction of limonite particles of different sizes to iron (Fe) particles under varying hydrogen partial pressures. The research findings can serve as a scientific basis for optimizing hydrogen-based reduction ironmaking technology in the iron and steel industry and achieving carbon neutrality goals.

Graphical Abstract

1. Introduction

The steel industry is a major contributor to carbon emissions in China. For nearly three decades, China’s crude steel production has consistently ranked first globally [1]. It is projected that, by 2026, China’s crude steel production in the steel sector will reach 1.59 billion tons. If no further measures are taken, total carbon emissions could surge to 3.148 billion tons, accounting for 16.02% of China’s total emissions [2]. As the “linchpin” of the steel industry, the ironmaking process consumes approximately 70% of the industry’s total energy [3,4,5,6]. Particularly in the context of China’s major strategic goals of “carbon peaking by 2030 and carbon neutrality by 2060” [6], using hydrogen instead of carbon for iron ore reduction can eliminate the reliance on coke in traditional roasting and reduction technologies, thereby reducing CO2 emissions and meeting the technical requirements for energy conservation and emission reduction [4,6,7,8,9,10,11,12,13,14,15]. Hydrogen-based low-carbon ironmaking technology will be a crucial factor determining the competitiveness of steel enterprises in the future [7,16,17].
In recent years, numerous scholars have conducted in-depth research on the kinetics of hydrogen reduction of iron ore. They have proposed chemical reaction kinetic equations and quantified various influencing factors [8,9,18,19,20,21,22,23,24,25,26]. For example, Chen et al. [26] studied the kinetics of the hydrogen reduction of hematite concentrate particles at high temperatures. Their research indicated that the activation energy for hematite reduction is 214 kJ/mol, and a reduction degree exceeding 90% can be achieved within seconds. This characteristic makes it well suited for the novel flash smelting process in iron production. Elzohiery et al. [23] utilized a combined approach of advanced experimental techniques and computational fluid dynamics (CFD) simulations to investigate the reduction kinetics of magnetite concentrate particles in hydrogen at high temperatures (1623–1873 K). This study clarified the reduction mechanism of magnetite in a high-temperature molten state, offering essential kinetic parameters and models for the design and optimization of the flash ironmaking process. Furthermore, Ali et al. [21] innovatively proposed a kinetic model based on the porous solid model. This model successfully predicted the direct reduction process of individual hematite particles using H2/CO mixed gas under both isothermal and non-isothermal conditions. It provides profound insights into the complex mechanisms underlying the reduction of iron oxides. Elsherbiny et al. [9] carried out a comprehensive investigation into the kinetic process of the hydrogen reduction of hematite pellets (with an outer radius of approximately 4.6 mm). They integrated CFD with the unreacted shrinking core model. This work laid a theoretical foundation and provided experimental validation for optimizing the direct reduction process of pellets. Lyu et al. [20] examined the reduction kinetics of 100 μm iron ore particles in a hydrogen atmosphere under both isothermal and non-isothermal conditions. By combining thermogravimetric analysis with microstructure observations, they revealed the reaction mechanism of the hydrogen reduction of iron ore. Khani et al. [19] conducted a comprehensive and in-depth kinetic study on the hydrogen-based reduction of hematite to iron using the random pore model (RPM). They not only obtained precise kinetic parameters but also verified the accuracy of the RPM model in predicting complex gas–solid reactions. This finding is of great significance for optimizing hydrogen-based flash ironmaking processes.
The aforementioned studies primarily focused on the hydrogen reduction kinetics of easily exploitable iron ores, such as hematite and magnetite. However, in recent years, with the depletion of these easily accessible resources, the exploitation and utilization of refractory iron ores have gradually drawn increasing attention [27,28,29,30]. Limonite ore is a ubiquitous and widely distributed type of refractory oxidized iron ore globally. In China, limonite reserves are abundant, totaling approximately 1.23 billion tons, accounting for 2.3% of the country’s total iron ore reserves. However, its current utilization rate is only about 11.39% [31]. Given the gradual depletion of easily processable iron ore resources in China, the continually increasing demand for steel, and the prominent issue of the supply–demand imbalance, the development of refractory iron ores, represented by limonite, holds great potential [29]. Some scholars have already initiated preliminary explorations into the reduction mechanism of limonite ore. For instance, Zhu et al. [32] conducted magnetic roasting of limonite ore in a fluidized bed reactor. They used a mixture of CO and CO2 at temperatures ranging from 500 to 600 °C and investigated the reduction mechanism of porous hematite in the process of fluidization magnetization roasting. The study revealed that porous hematite, formed after the dehydroxylation of limonite ore, reduces to magnetite following the nucleation and growth model A3/2, with a calculated apparent activation energy of 18.43 kJ/mol. Additionally, de Alvarenga Oliveira et al. [33] studied the kinetic process of the hydrogen reduction of limonite-type nickel ore at different temperatures. Their study revealed the reaction mechanism and corresponding apparent activation energy for the reduction of hematite to magnetite and metallic iron. Liu et al. [34] investigated the fluidized magnetic roasting process of limonite ore using hydrogen as a reductant and explored the phase transformation, structural evolution, and reduction kinetics of iron ore under different roasting conditions. The results indicated that the reduction process of limonite ore follows the nucleation and growth model A2, with an apparent activation energy of 29.62 kJ/mol. These studies provide a valuable reference for the present research. However, overall, systematic studies on the hydrogen reduction kinetics of limonite ore lack sufficient depth. Investigating the hydrogen reduction mechanism of limonite ore can elucidate the reaction mechanism and kinetic parameters during its reduction process, thus providing theoretical support for the efficient utilization of limonite ore. Moreover, it is of great significance for promoting the efficient utilization of iron ore resources and the development of hydrogen-based ironmaking technology.
In this work, thermal analysis testing techniques and the principles of thermal analysis kinetics were employed to comprehensively investigate the effects of crucial parameters—namely, reduction temperature, particle size of limonite ore, and hydrogen partial pressure—on the hydrogen reduction process of limonite ore. By applying the principle of isothermal thermal analysis kinetics, the mechanism functions of limonite particles under varying hydrogen concentrations in the reduction atmosphere were elucidated, thus revealing the fundamental mechanism of its reduction reaction. Moreover, based on the unreacted core model (UCM) for flat-plate particles, the kinetic parameters were calculated. Building on these results, the intrinsic relationship between the reaction time required for the complete reduction of limonite to metallic iron and the reaction temperature was explored, providing theoretical support for the efficient utilization of limonite and the advancement of hydrogen-based ironmaking technology.

2. Materials and Experimental Methods
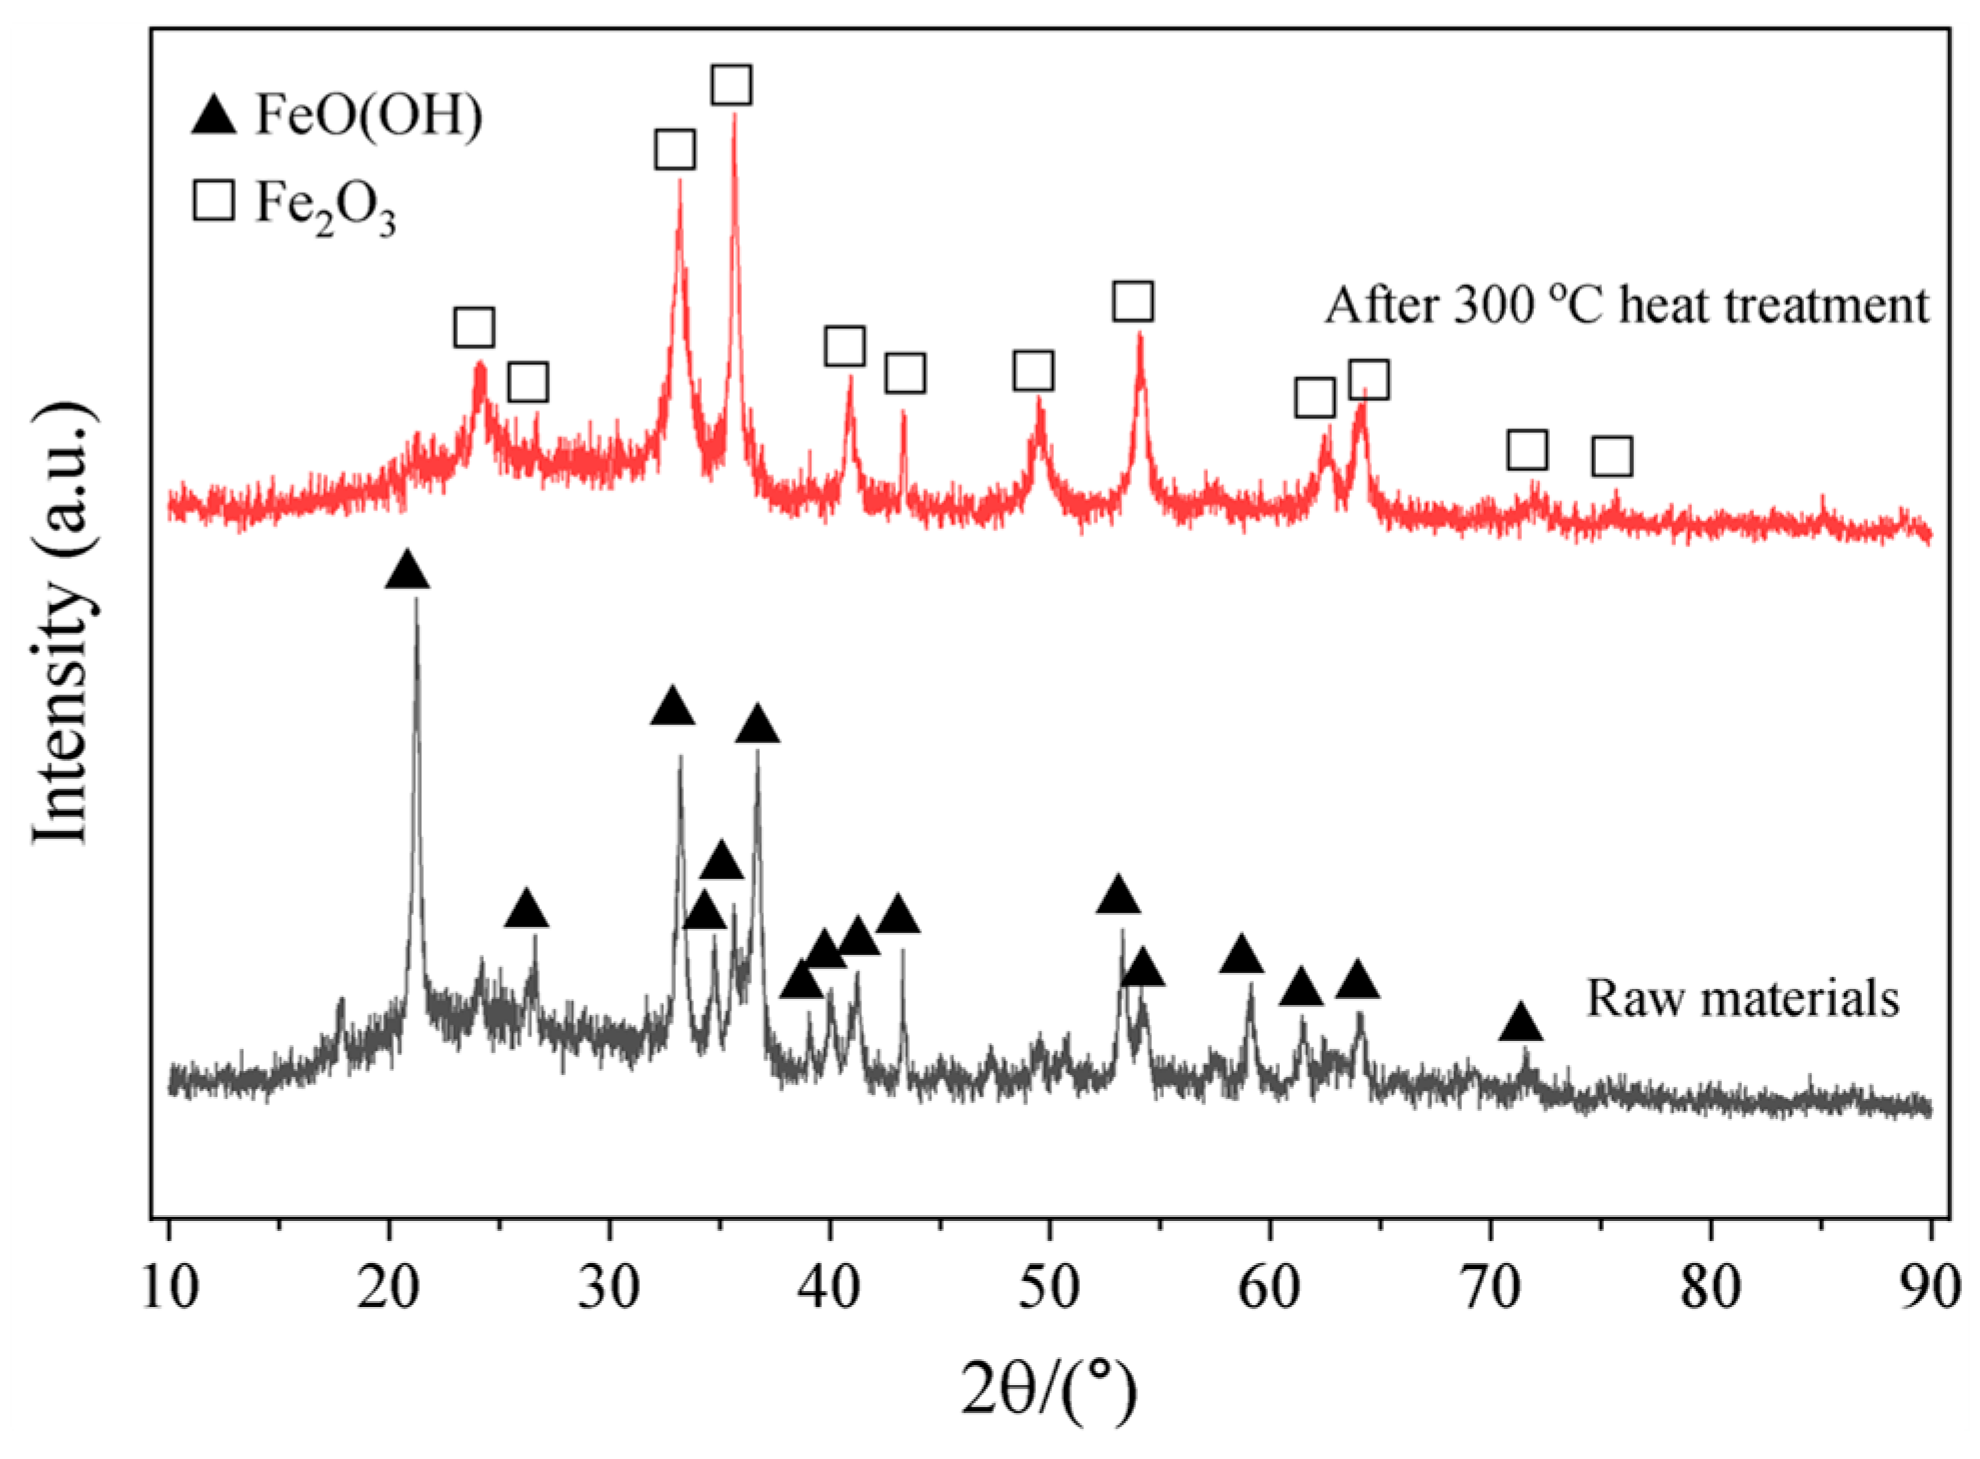
2.1. Materials

The iron ore sample used in this study was provided by China Baowu Steel Group Co., Ltd (Shanghai, China). The composition of the iron ore particles was analyzed using an X-ray diffractometer (XRD, Rigaku SmartLab, Tokyo, Japan). Figure 1 displays the XRD patterns of the limonite sample before and after heat treatment at 300 °C for 24 h. As shown in Figure 1, upon heating limonite (FeO(OH)) to 300 °C, the main reaction is the dehydration of crystal water. As crystal water is removed, limonite undergoes transformation into hematite (Fe2O3), which is consistent with the findings of Sun et al. [35]. Therefore, the high-temperature hydrogen reduction of limonite primarily involves the reduction of hematite.
The main chemical components of the iron ore particles were determined through X-ray fluorescence (XRF, Zetium, Almelo, Netherlands) analysis and are presented in Table 1. According to Table 1, the total iron (TFe) content in the iron ore sample is 62.35%. Given that X-ray fluorescence (XRF) analysis is unable to distinguish between different chemical states of iron, and as demonstrated in Figure 1, limonite undergoes transformation into Fe2O3 upon heat treatment; it is hypothesized that the chemical state of iron in the raw material, when present as an oxide, is Fe2O3, accounting for 89.15% of the iron content. Following the conversion of other impurity elements into their respective oxides, it is observed that the predominant impurities are SiO2 and Al2O3, with contents of 6.19% and 3.56%, respectively.

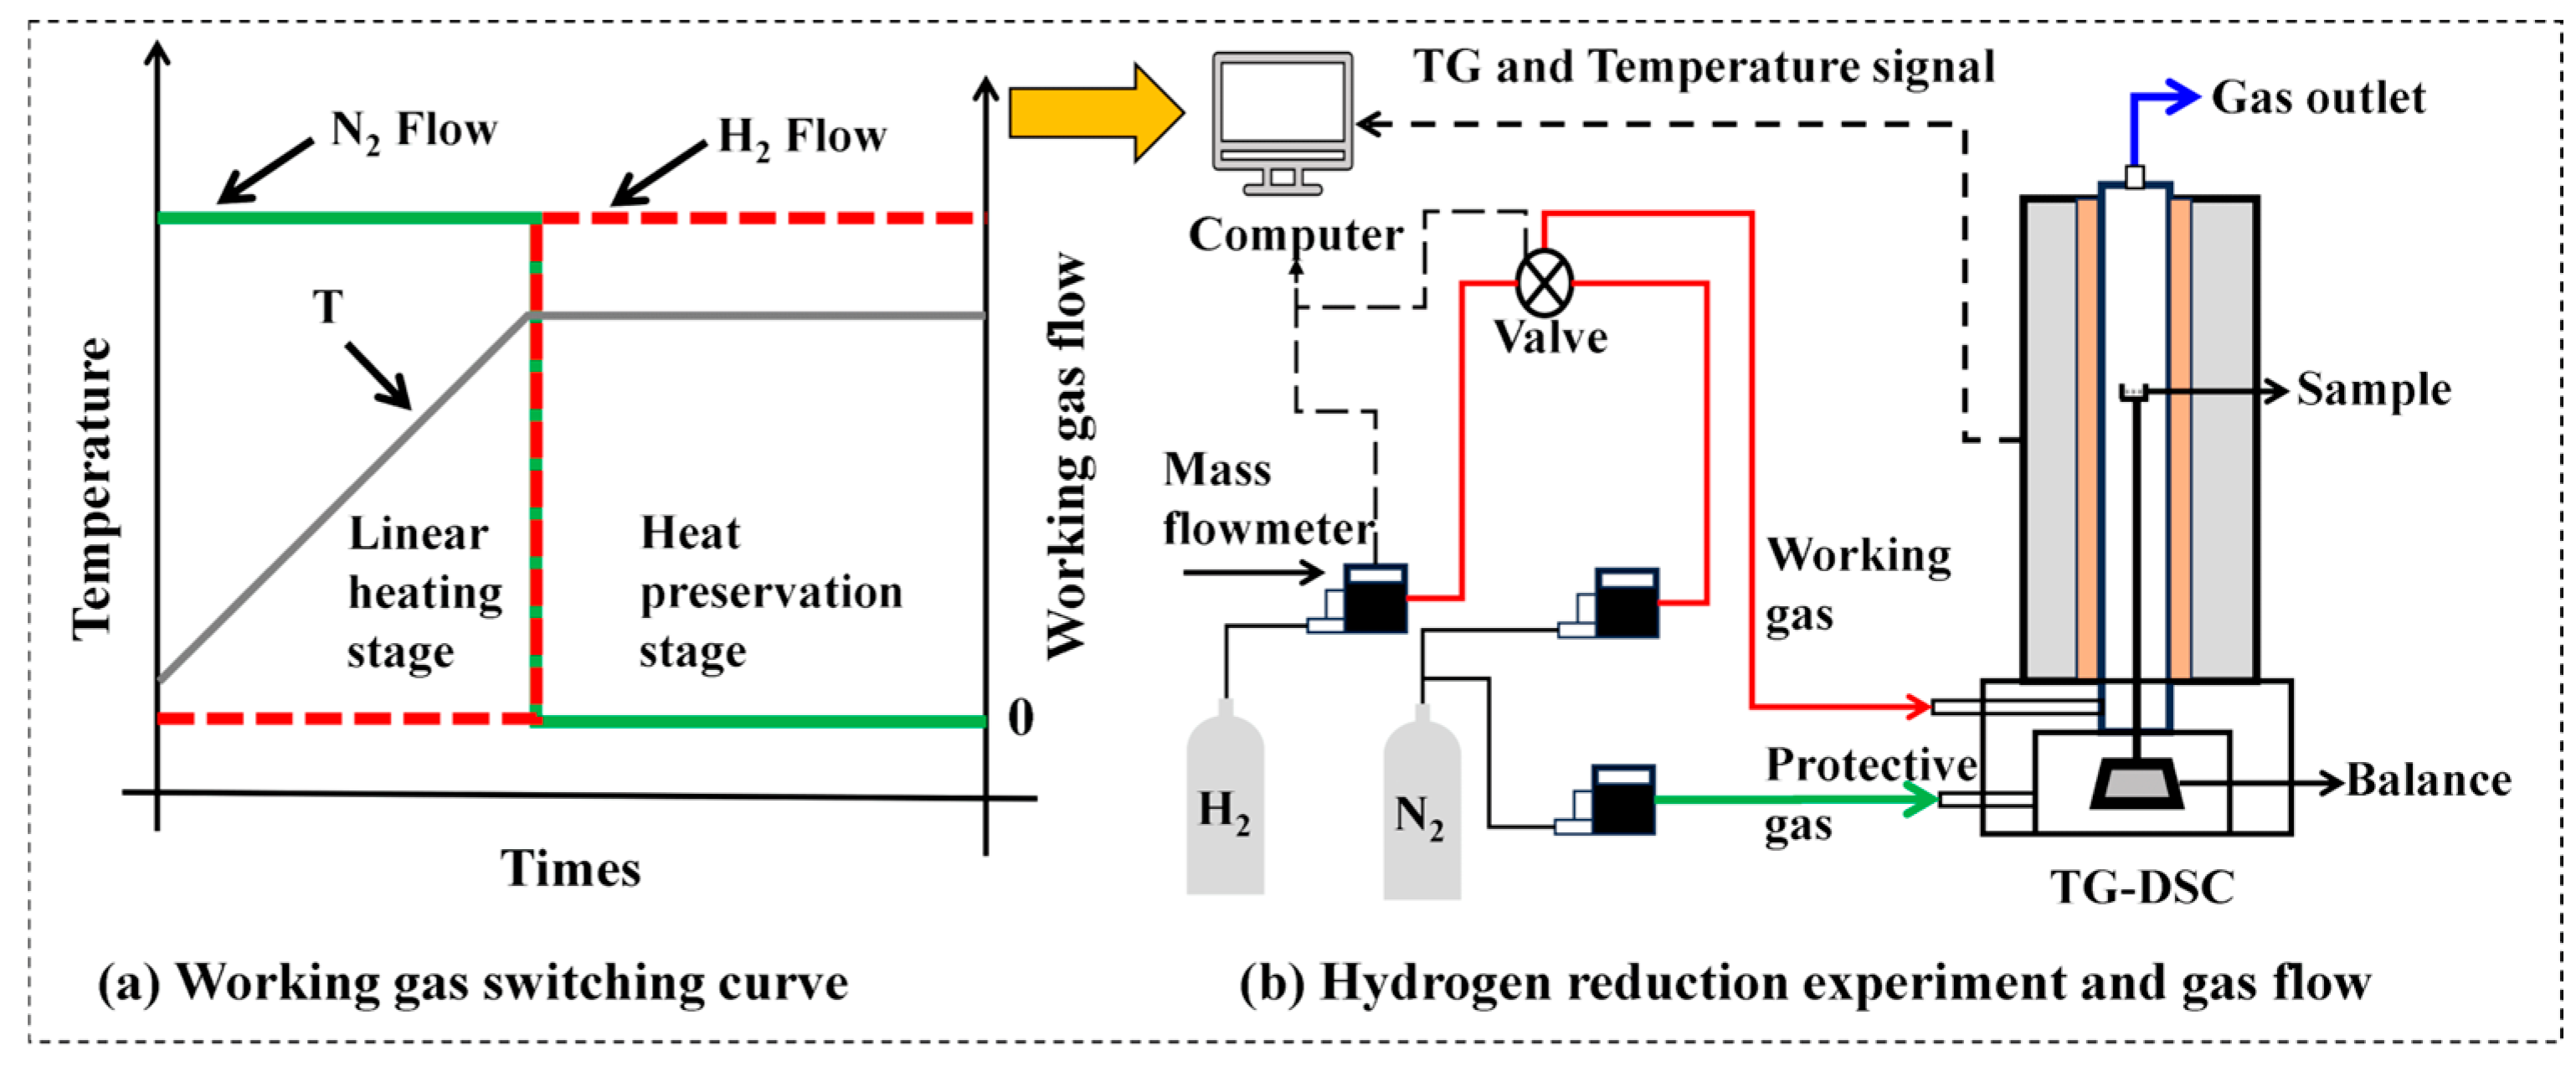
2.2. Experimental Method

The isothermal reduction process of iron ore particles at various temperatures was analyzed using a thermogravimetric analyzer (TGA) (ZCT-B, Beijing Jingyi Gaoke Instrument Co., Ltd., Beijing, China). A schematic diagram of the experimental apparatus is shown in Figure 2. The limonite particles were sieved through 100- and 300-mesh screens according to the Chinese standard GB/T 6003.1-2022 [36]. In each experiment, a sample of 15.0 ± 1.0 mg iron ore was weighed and placed in an alumina crucible. Prior to the experiment, high-purity nitrogen (99.999%) was introduced into the thermal analyzer at a flow rate of 40 mL/min for 30 min to purge the air from the instrument. Subsequently, the furnace temperature was ramped up to the target reduction temperature at a heating rate of 10 °C/min. Throughout the heating process, both protective and working gases (N2) were continuously introduced at a flow rate of 40 mL/min. When the furnace reached the preset reduction temperature range of 600–1000 °C, the working gas was switched to high-purity hydrogen (99.999%) with flow rates of 20, 40, 60, and 80 mL/min. The reduction process occurs in a N2/H2 mixed atmosphere. The reduction temperature was maintained for 60 min. After the experiment, the working gas was switched back to N2 and continued to flow until the furnace was fully cooled.
The partial pressure of hydrogen (PH2) in the mixed gas can be calculated according to Dalton’s law of partial pressures, which states that the partial pressure of a component in a mixed gas is equal to the volume fraction of that component multiplied by the total pressure of the mixed gas.
The specific calculation formula is as follows:
P H 2 = φ H 2 P 0 = Q H 2 Q total P 0 = Q H 2 Q H 2 + Q N 2 P 0
where ϕ H2 is the volume fraction of hydrogen, which refers to the proportion of hydrogen flow rate to the total gas flow rate, %; QN2 is the flow rate of the protective gas (nitrogen), mL·min−1; QH2 is the flow rate of the working gas (hydrogen), mL·min−1; Qtotal is the total flow rate of the mixed gas flowing through the crucible, mL·min−1; and P0 is the actual total pressure inside the furnace, atm.
Table 2 shows the corresponding flow rates of working gas and protective gas in different hydrogen partial pressure (PH2) conditions. Specifically, the PH2 conditions are 0.33, 0.50, 0.60, and 0.67 atm, calculated by Equation (1).

3. Kinetic Analysis Method

3.1. Chemical Reactions

The phase transition of limonite to hematite, induced by thermal treatment at approximately 300 °C, involves the dehydration of limonite, lattice rearrangement, and the evolution of the pore structure.
2 FeO OH Fe 2 O 3 + H 2 O
When the reduction temperature is below approximately 570 °C, hematite transforms into magnetite (Fe3O4) under the influence of hydrogen reduction.
3 Fe 2 O 3 + H 2 2 Fe 3 O 4 + H 2 O
When the reduction temperature exceeds 570 °C, magnetite transforms into wustite, and subsequently, wustite is further reduced to metallic iron [9].
Fe 3 O 4 + H 2 3 FeO + H 2 O
FeO + H 2 Fe + H 2 O

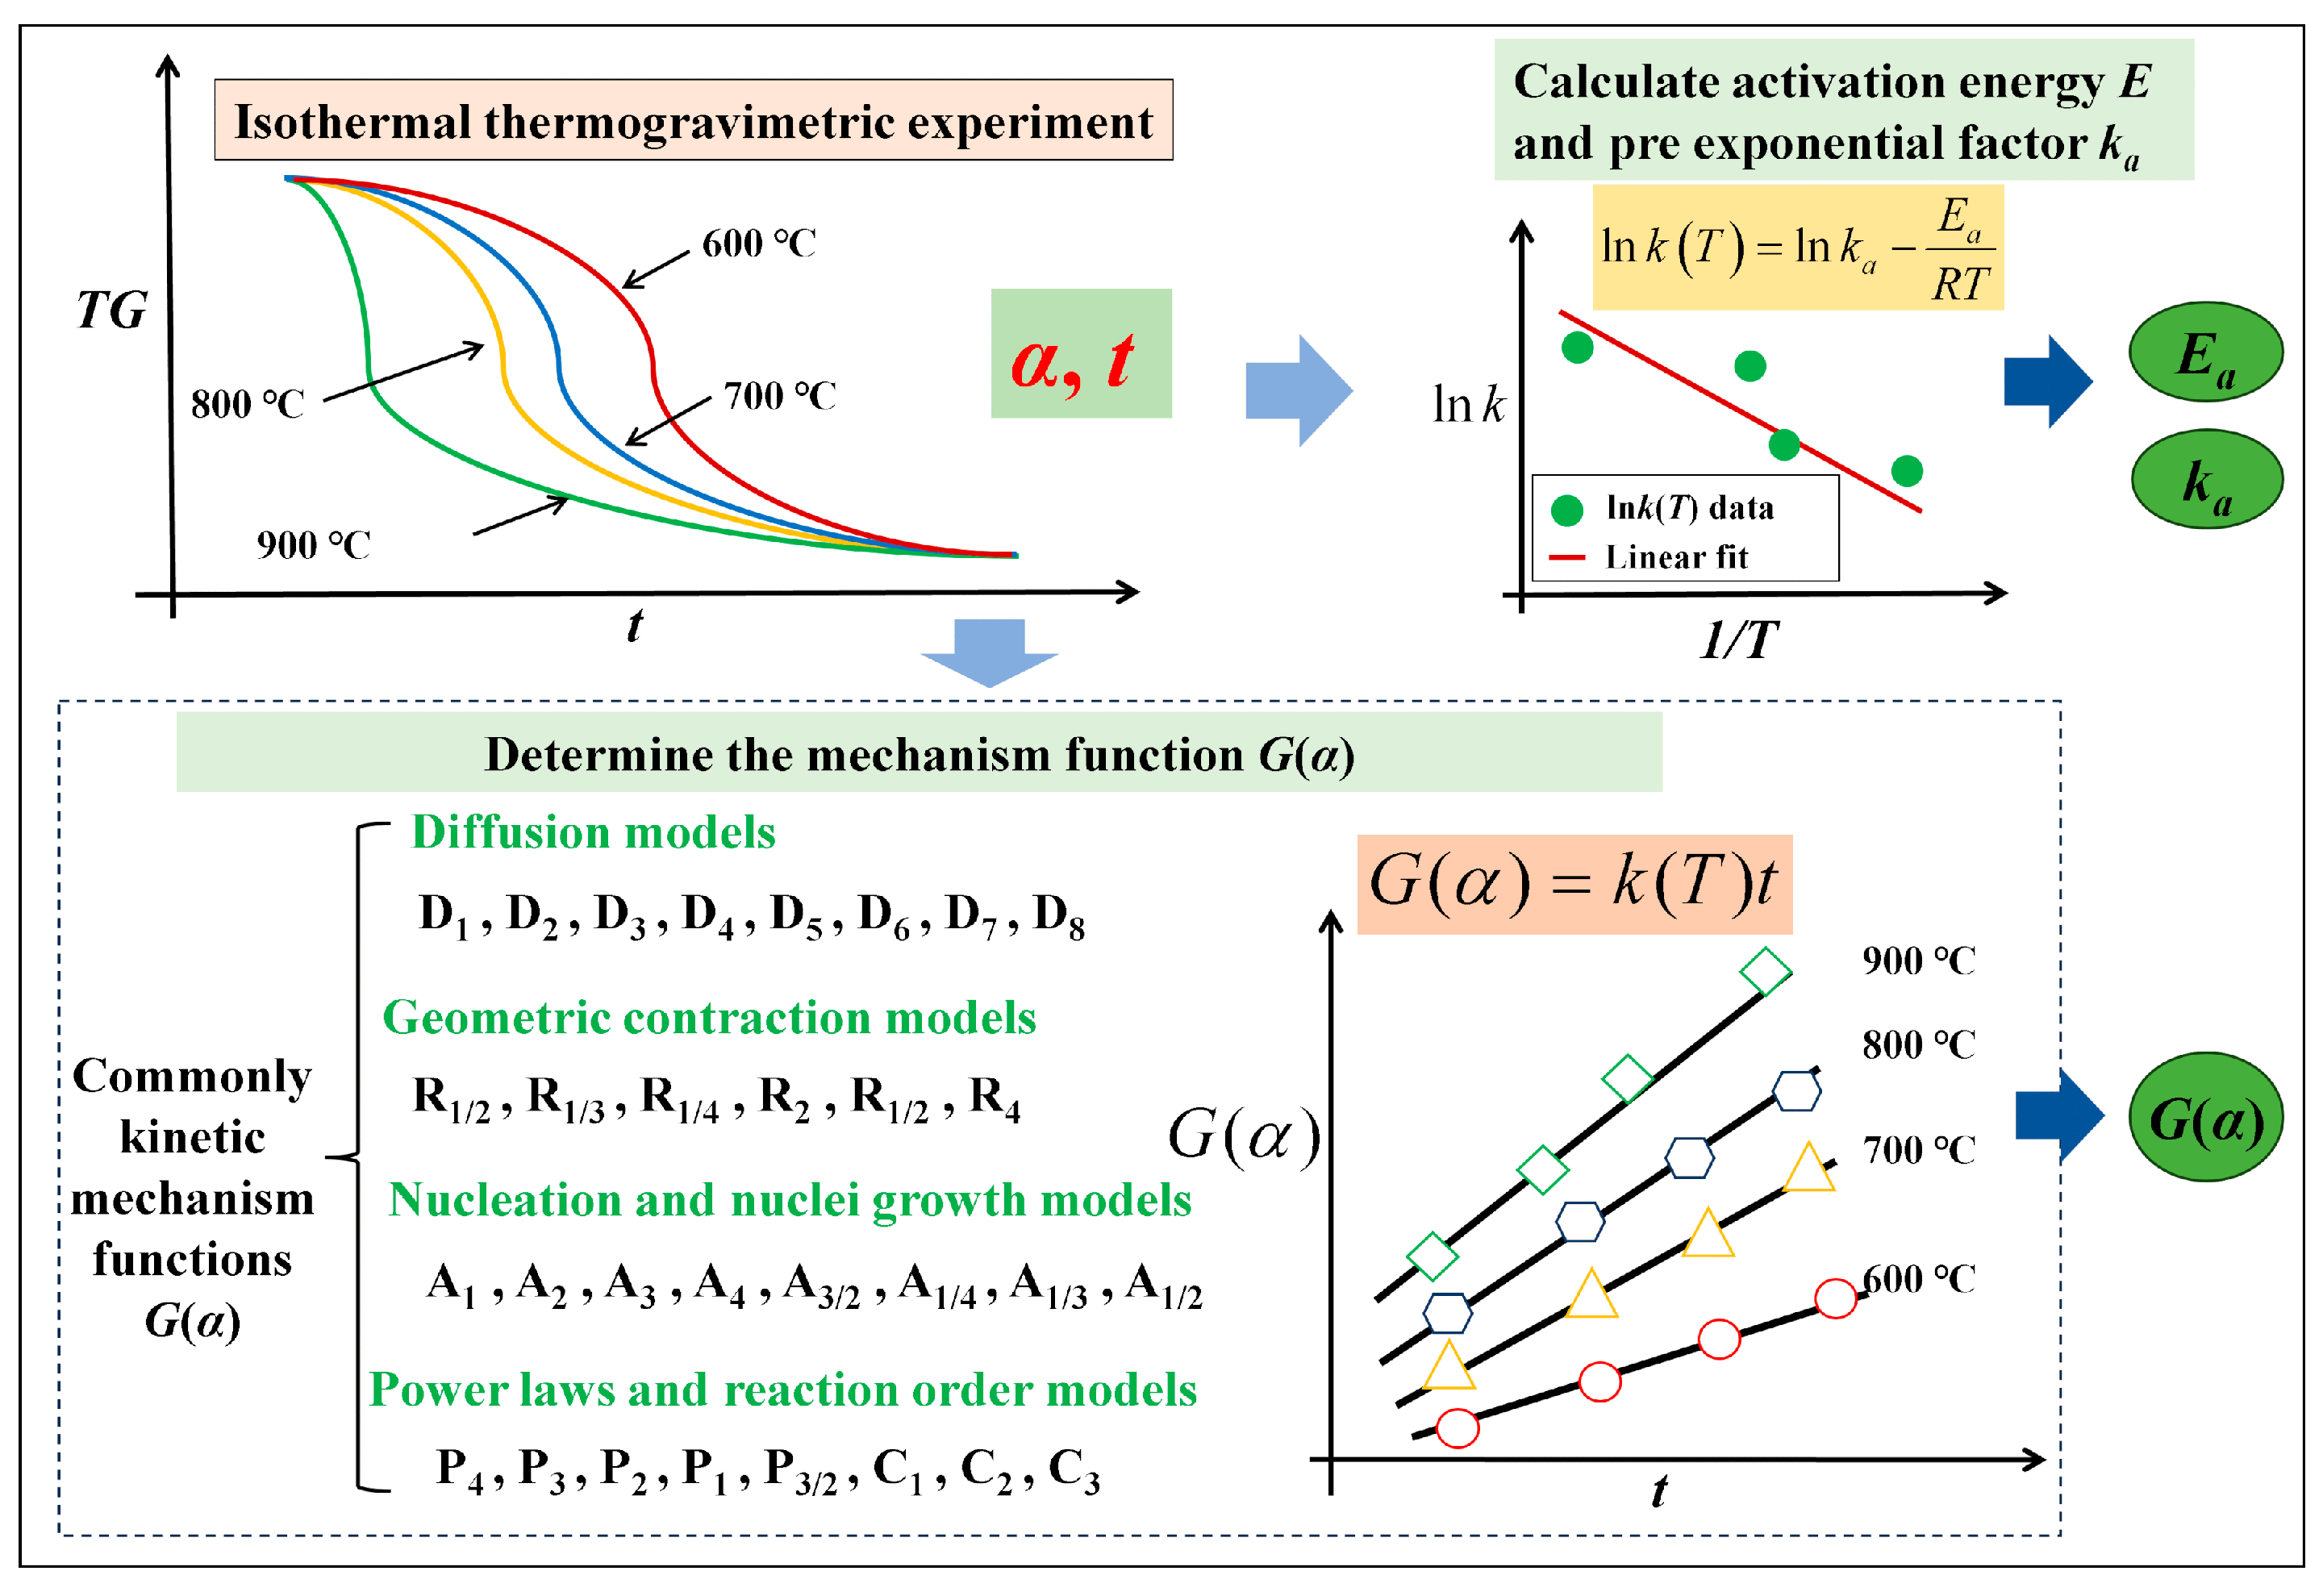
3.2. Conventional Kinetic Analysis

In the process of the hydrogen reduction of iron ore particles, it is generally accepted that substances such as SiO2, Al2O3, and MgO present in limonite are not reducible, and the reduction process specifically targets the oxygen contained within the iron oxides. The reduction degree of the limonite particles is then defined as:
α = m 0 m t m 0 m
where α signifies the reduction degree of the limonite particles, %; m0, mt and m represent the initial mass (mg), the mass at time t (mg), and the final mass of the limonite particles (mg), respectively.
The non-isothermal chemical reaction rate /dt of limonite particles can be expressed as:
d α d t = k ( T ) f α
k ( T ) = k a exp ( E a R T )
where k(T) is the Arrhenius rate constant, s−1; ka is the pre-exponential factor, s−1; f ( α ) is the reaction mechanism function; Ea is the apparent activation energy, kJ·mol−1; R is the ideal gas constant, J·(mol·K)-1; and T is the temperature, K.
For isothermal reaction kinetics, the integral method is more appropriate [36]. Figure 3 illustrates a technical roadmap for the approach employed in this work to determine the isothermal kinetic parameters and the mechanistic function G(α) for the hydrogen reduction of limonite particles via the integral method. The mechanistic function G(α) is described below:
G ( α ) = 0 α d α f ( α ) = 0 t k a exp ( E a R T ) d t = κ ( T ) t
where G(α) is the integral function of f(α). The kinetic mechanism functions G(α), which are commonly employed for isothermal reactions, can be found in the literature, specifically in references [34,37].
The thermogravimetric experimental data are converted into conversion degree (α) data, which are then substituted into the G(α) function to plot against time (t). The R2 values of linear fittings under different kinetic models are calculated, and the one with the highest R2 value is considered as the optimal reaction kinetic model function.
Equation (8) can be transformed into:
ln k T = ln k a E R T
The k values are taken at different temperatures, and a linear fit is performed on lnk (T) versus −1/T to obtain lnk and E/R, from which the kinetic parameters ka and E are subsequently determined.

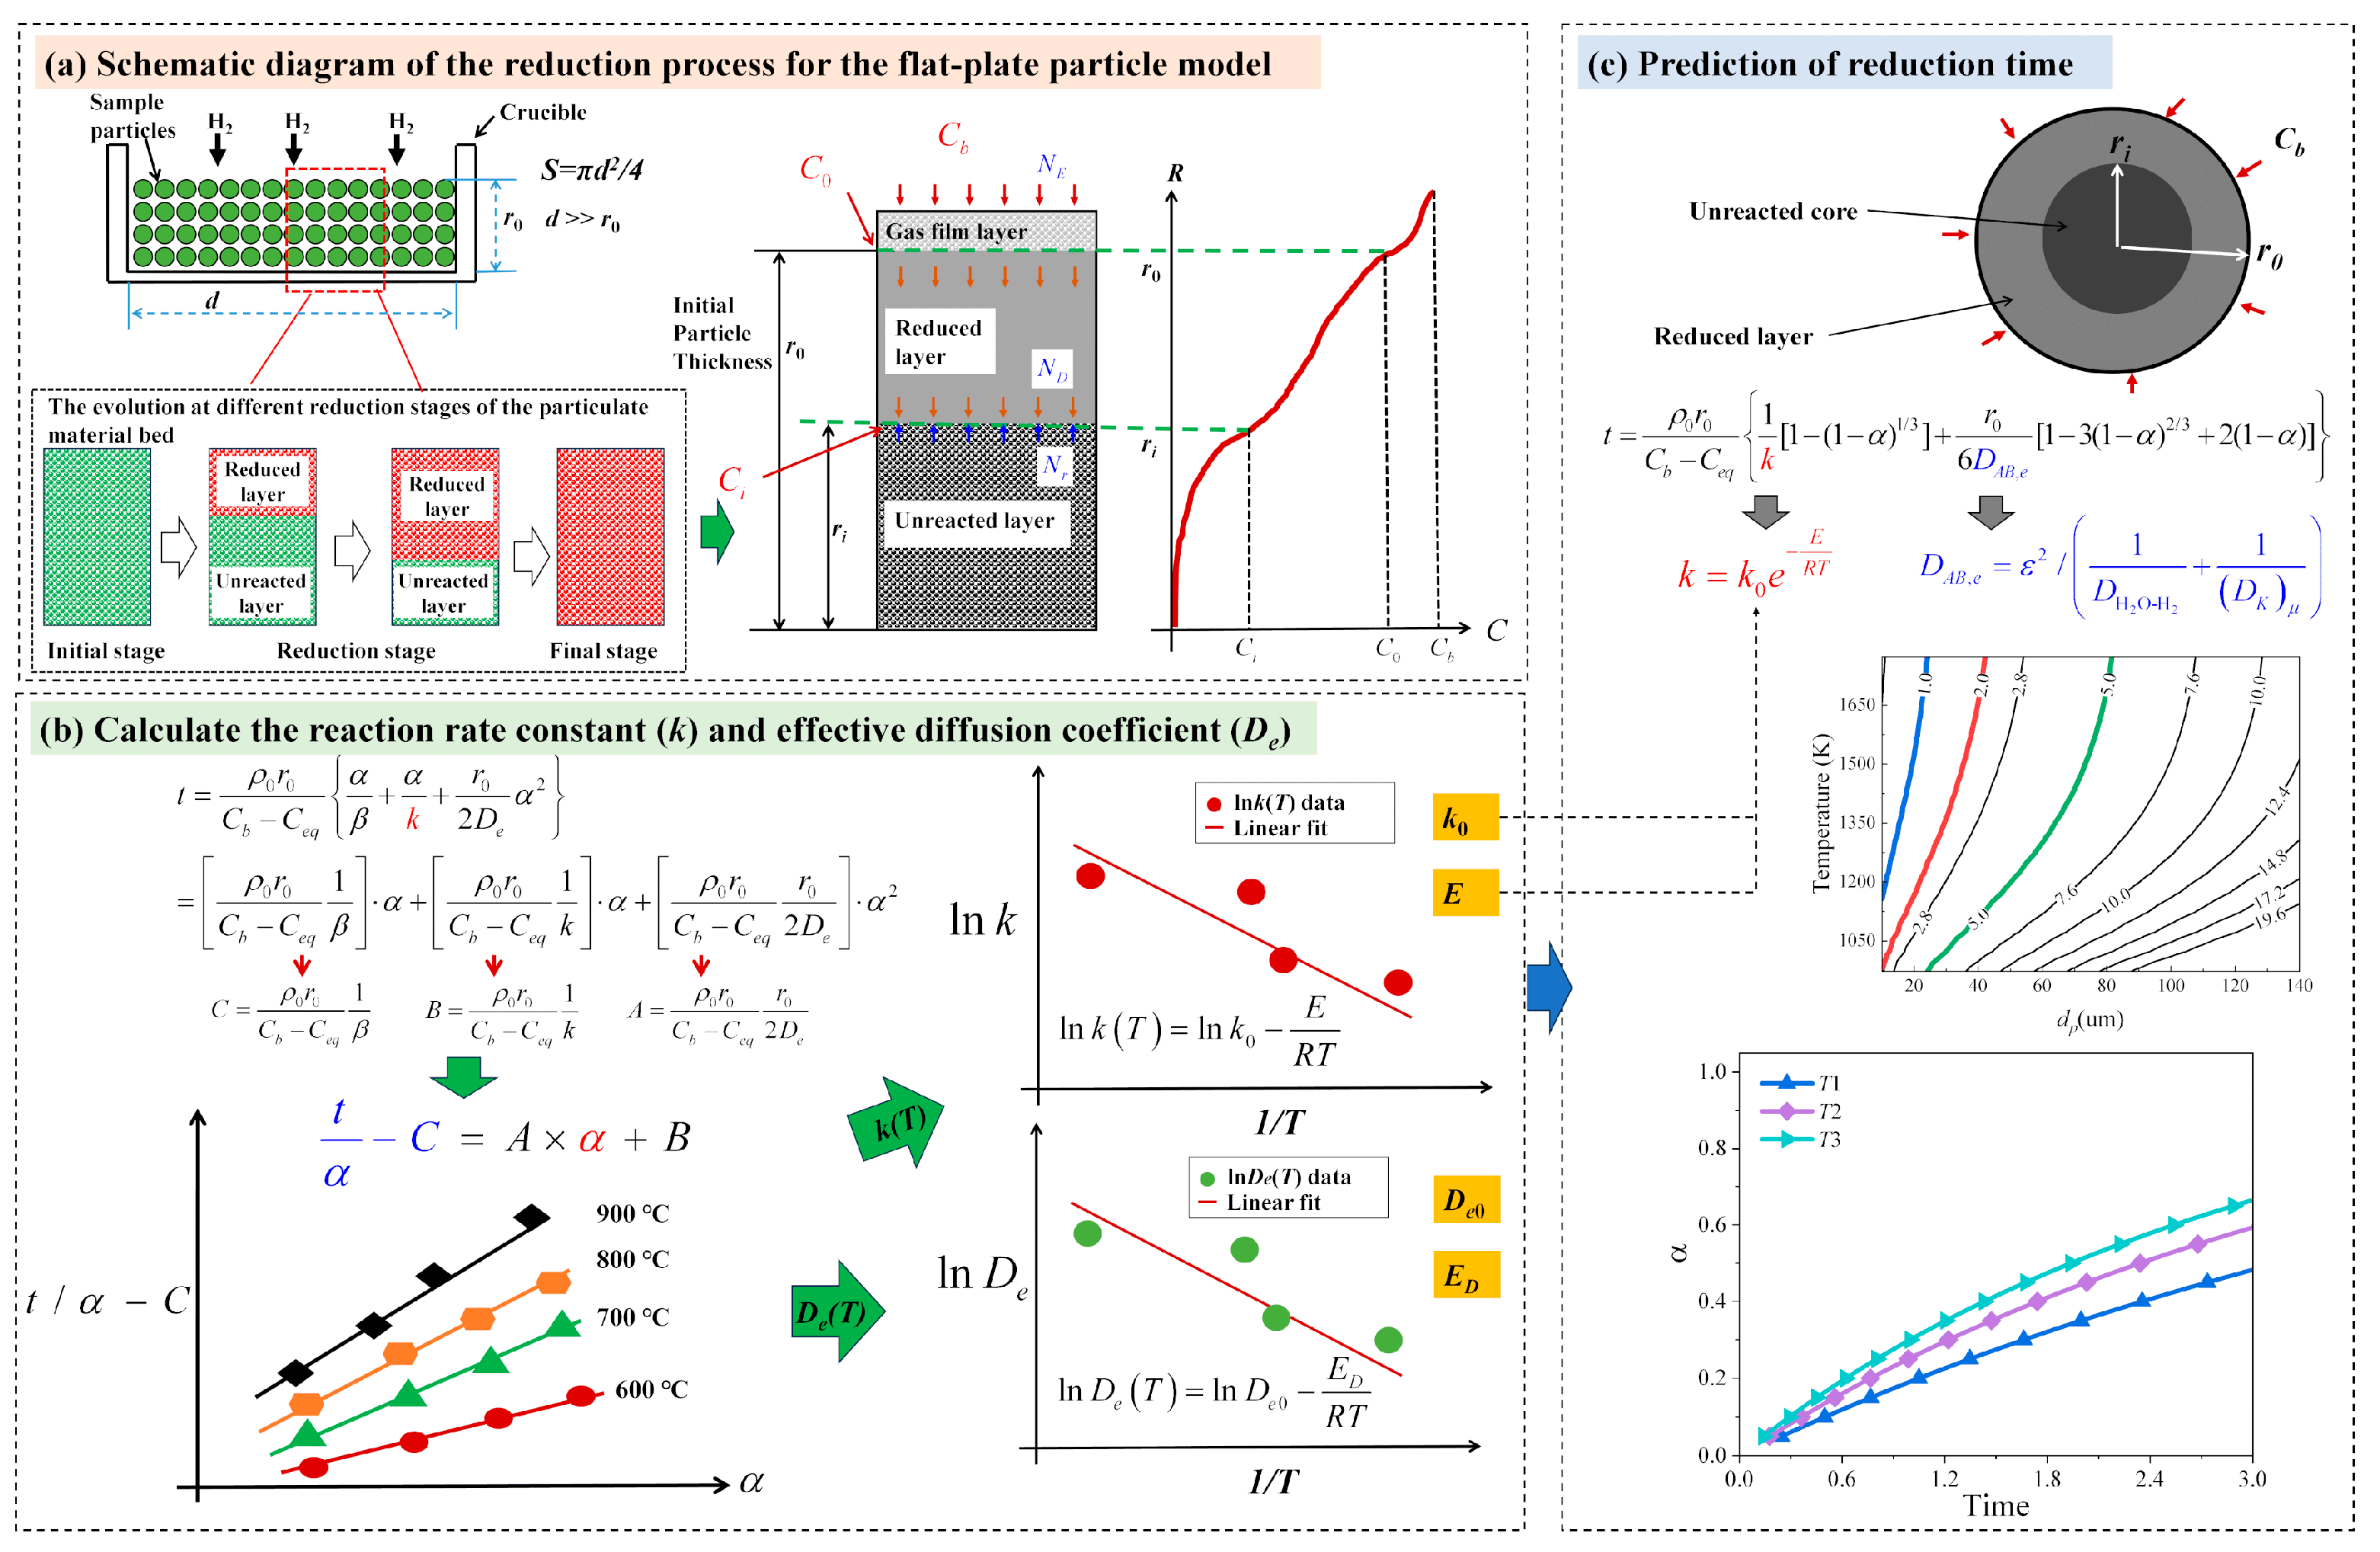
3.3. Unreacted Core Model (UCM) for Flat-Plate Particles

During the hydrogen reduction experiments conducted on limonite, it was observed that the temperature distribution within the particle layer in the cylindrical crucible used for the experiment was relatively uniform. The iron ore powder particles were evenly spread and accumulated inside the alumina crucible. The interface where hydrogen gas interacts with the iron ore powder is the upper surface of the particle layer, which corresponds to the base area S inside the crucible. Throughout the entire reduction process, the contact area between the iron ore powder particle layer and the external gas remains constant. The sides and bottom of the accumulated iron ore powder layer are in direct contact with the walls of the alumina crucible, and, thus, it can be assumed that no gas diffusion occurs in these directions. Consequently, the reaction interface of the hydrogen reduction process of iron ore powder can be assumed to advance one-dimensionally.
In iron ore reduction research, common kinetic models include the single-interface unreacted core model, the grain (microparticle) model, the shrinking core (uniform) model, and the multi-interface unreacted core model. Upon comparison, the flat-plate particle model is deemed the best fit for our study. Our hydrogen reduction experiments on limonite reveal a uniform temperature distribution within the particle layer and a constant gas–particle contact area, which aligns with the model’s assumption of a one-dimensional reaction interface. Furthermore, the flat-plate particle model is simple, widely applicable, and computationally efficient, thereby avoiding the need for complex calculus.

3.3.1. Basic Assumptions

The premises of the UCM for flat-plate particles are as follows:
  • It is assumed that the particle bed retains a constant shape and volume throughout the reaction, disregarding any expansion or contraction of the iron ore powder particles.
  • The impact of internal structural changes within the porous packed particle bed is disregarded.
  • It is assumed that the diffusion of solid products entails equimolar counter-diffusion between the reducing gas and the product gas under isothermal and isobaric conditions. Volume flow rate variations resulting from diffusion are omitted.
  • It is assumed that the reaction occurring within the particles is a first-order, isothermal, and irreversible reaction.
  • The entire reduction process attained a quasi-steady state.

3.3.2. Mathematical Model and Calculation Process

Given the aforementioned factors, a UCM for flat-plate particles was employed to analyze the reduction kinetics of iron oxides in this work [38,39,40]. For infinitely large, flat-plate-shaped particles, the reaction interface is considered to advance one-dimensionally along the thickness direction. The model can be described as follows:
N E = S β ( C b C 0 )
N D = S D e C 0 C i r 0 r i
N r = S k ( C i C e q )
where S represents the top surface area of the iron ore particle-packed bed layer, m2; β is the gas–film mass-transfer coefficient, m·s−1; Cb denotes the concentration of the external gaseous reducing agent, mol·m−3; C0 is the concentrations of the gaseous reducing agent at the gas–film boundary layer, mol·m−3; Ci is the concentrations of the gaseous reducing agent at the reaction interface, mol·m−3; Ceq is the equilibrium concentration of the reducing gas in the reaction, mol·m−3; r0 is the thickness of the material layer, m; ri is the position of the reaction interface, m; k is the interface reaction rate constant, m·s−1; NE is the mass-transfer rate of the reducing gas through the gas–film boundary layer, mol·s−1; De is the effective diffusion coefficient of the iron ore particle layer, m2·s−1; ND is the internal diffusion rate, mol·s−1; and Nr is the chemical reaction rate, mol·s−1.
Based on the quasi-steady-state assumption, the rates of the three steps are equal, namely, NE = ND = Nr = N. By combining these three equations and eliminating the interface concentrations C0 and Ci, which are not directly measurable, Equation (14) is obtained.
N = S ( C b C e q ) 1 β + r 0 r i D e + 1 k
The relationship between the conversion rate of flat-plate particles and the radius of the reaction interface, denoted as, ri, is as follows:
r i = r 0 ( 1 α )
By inserting Equation (15) into Equation (14), the subsequent equation is derived:
N = S ( C b C e q ) 1 β + r 0 D e α + 1 k
Additionally, the reduction rate N can also be formulated in terms of the quantity of oxygen lost from the iron oxide.
N = d n 0 d t = d d t ( S r i ρ 0 ) = S ρ 0 d r i d t
By substituting Equation (15) into Equation (17), the differential expression of the conversion rate with respect to time is derived.
N = S r 0 ρ 0 d α d t
where ρ0 represents the oxygen density of iron ore particles, mol·m−3.
By coupling Equations (16) and (18), the differential form of the overall reaction rate equation can be obtained.
d α d t = 1 ρ 0 r 0 ( C b C e q ) 1 β + r 0 D e α + 1 k
By integrating the aforementioned equation over the intervals from 0 to α and from 0 to t, the integral representation of the rate equation can be derived.
t = ρ 0 r 0 C b C e q α β + r 0 2 D e α 2 + α k
The reduction rate α at various times can be measured experimentally, and subsequently, the effective diffusion coefficient and the reaction rate constant can be calculated using Equations (21)–(23).
A = ρ 0 r 0 C b C e q r 0 2 D e
B = ρ 0 r 0 C b C e q 1 k
C = ρ 0 r 0 C b C e q 1 β
By substituting the aforementioned relationship into Equation (20), Equation (24) is obtained:
t α C = A × α + B
By plotting (t/α − C) against α, the effective diffusion coefficient of the iron ore particle layer (De) and the positive reaction rate constant for hydrogen reduction of iron ore (k) can be determined from the slope and intercept of the resulting straight line. Figure 4 illustrates the principles of the UCM for flat-plate particles, along with a technical roadmap for calculating the reaction rate constant, effective diffusion coefficient and predicting the reduction time. During data processing, experimental data points from the initial and final stages of the reduction process are excluded to ensure a linear approximation of the remaining data points.

4. Results and Discussion

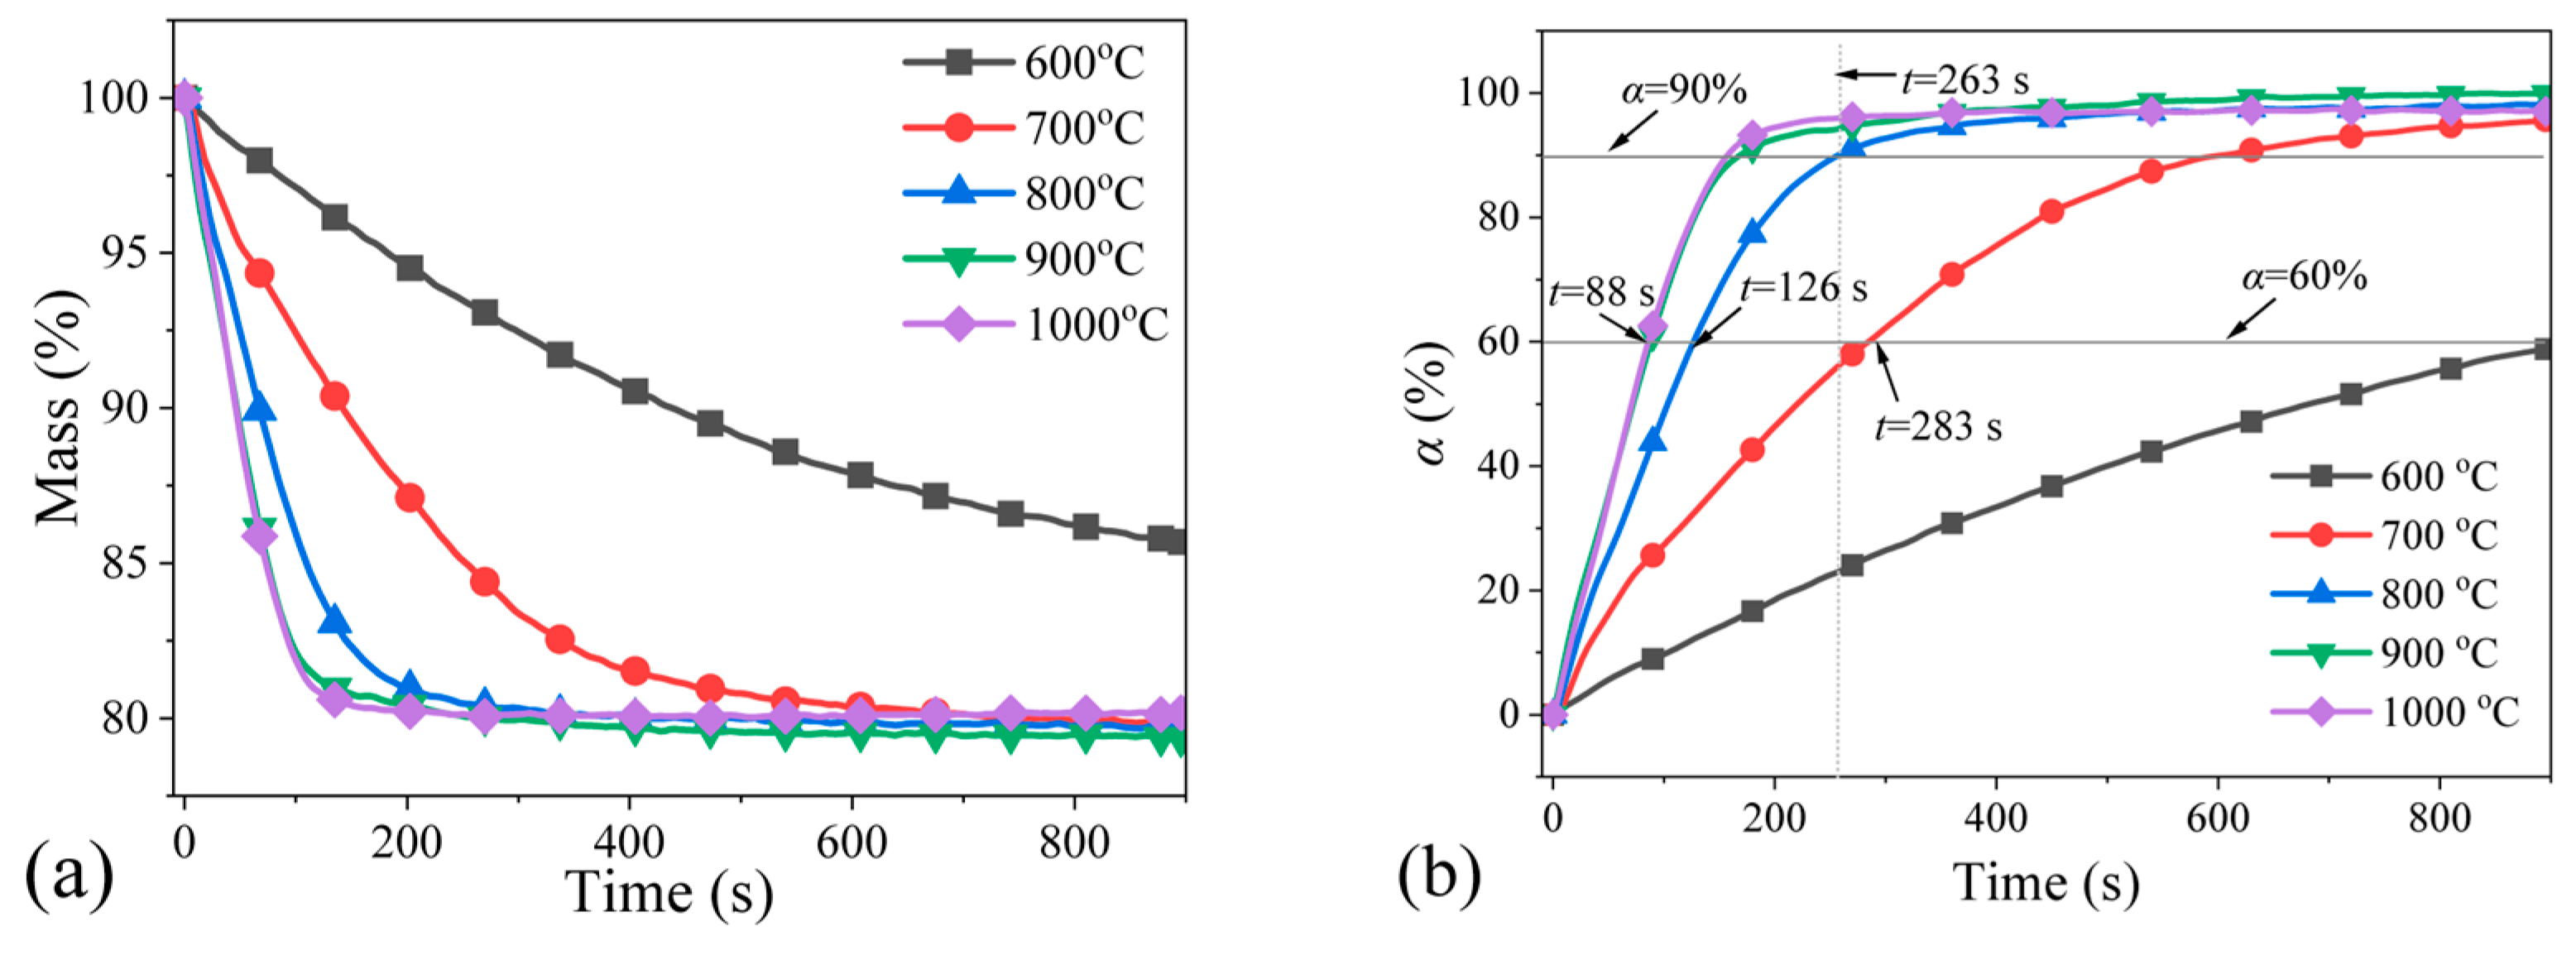
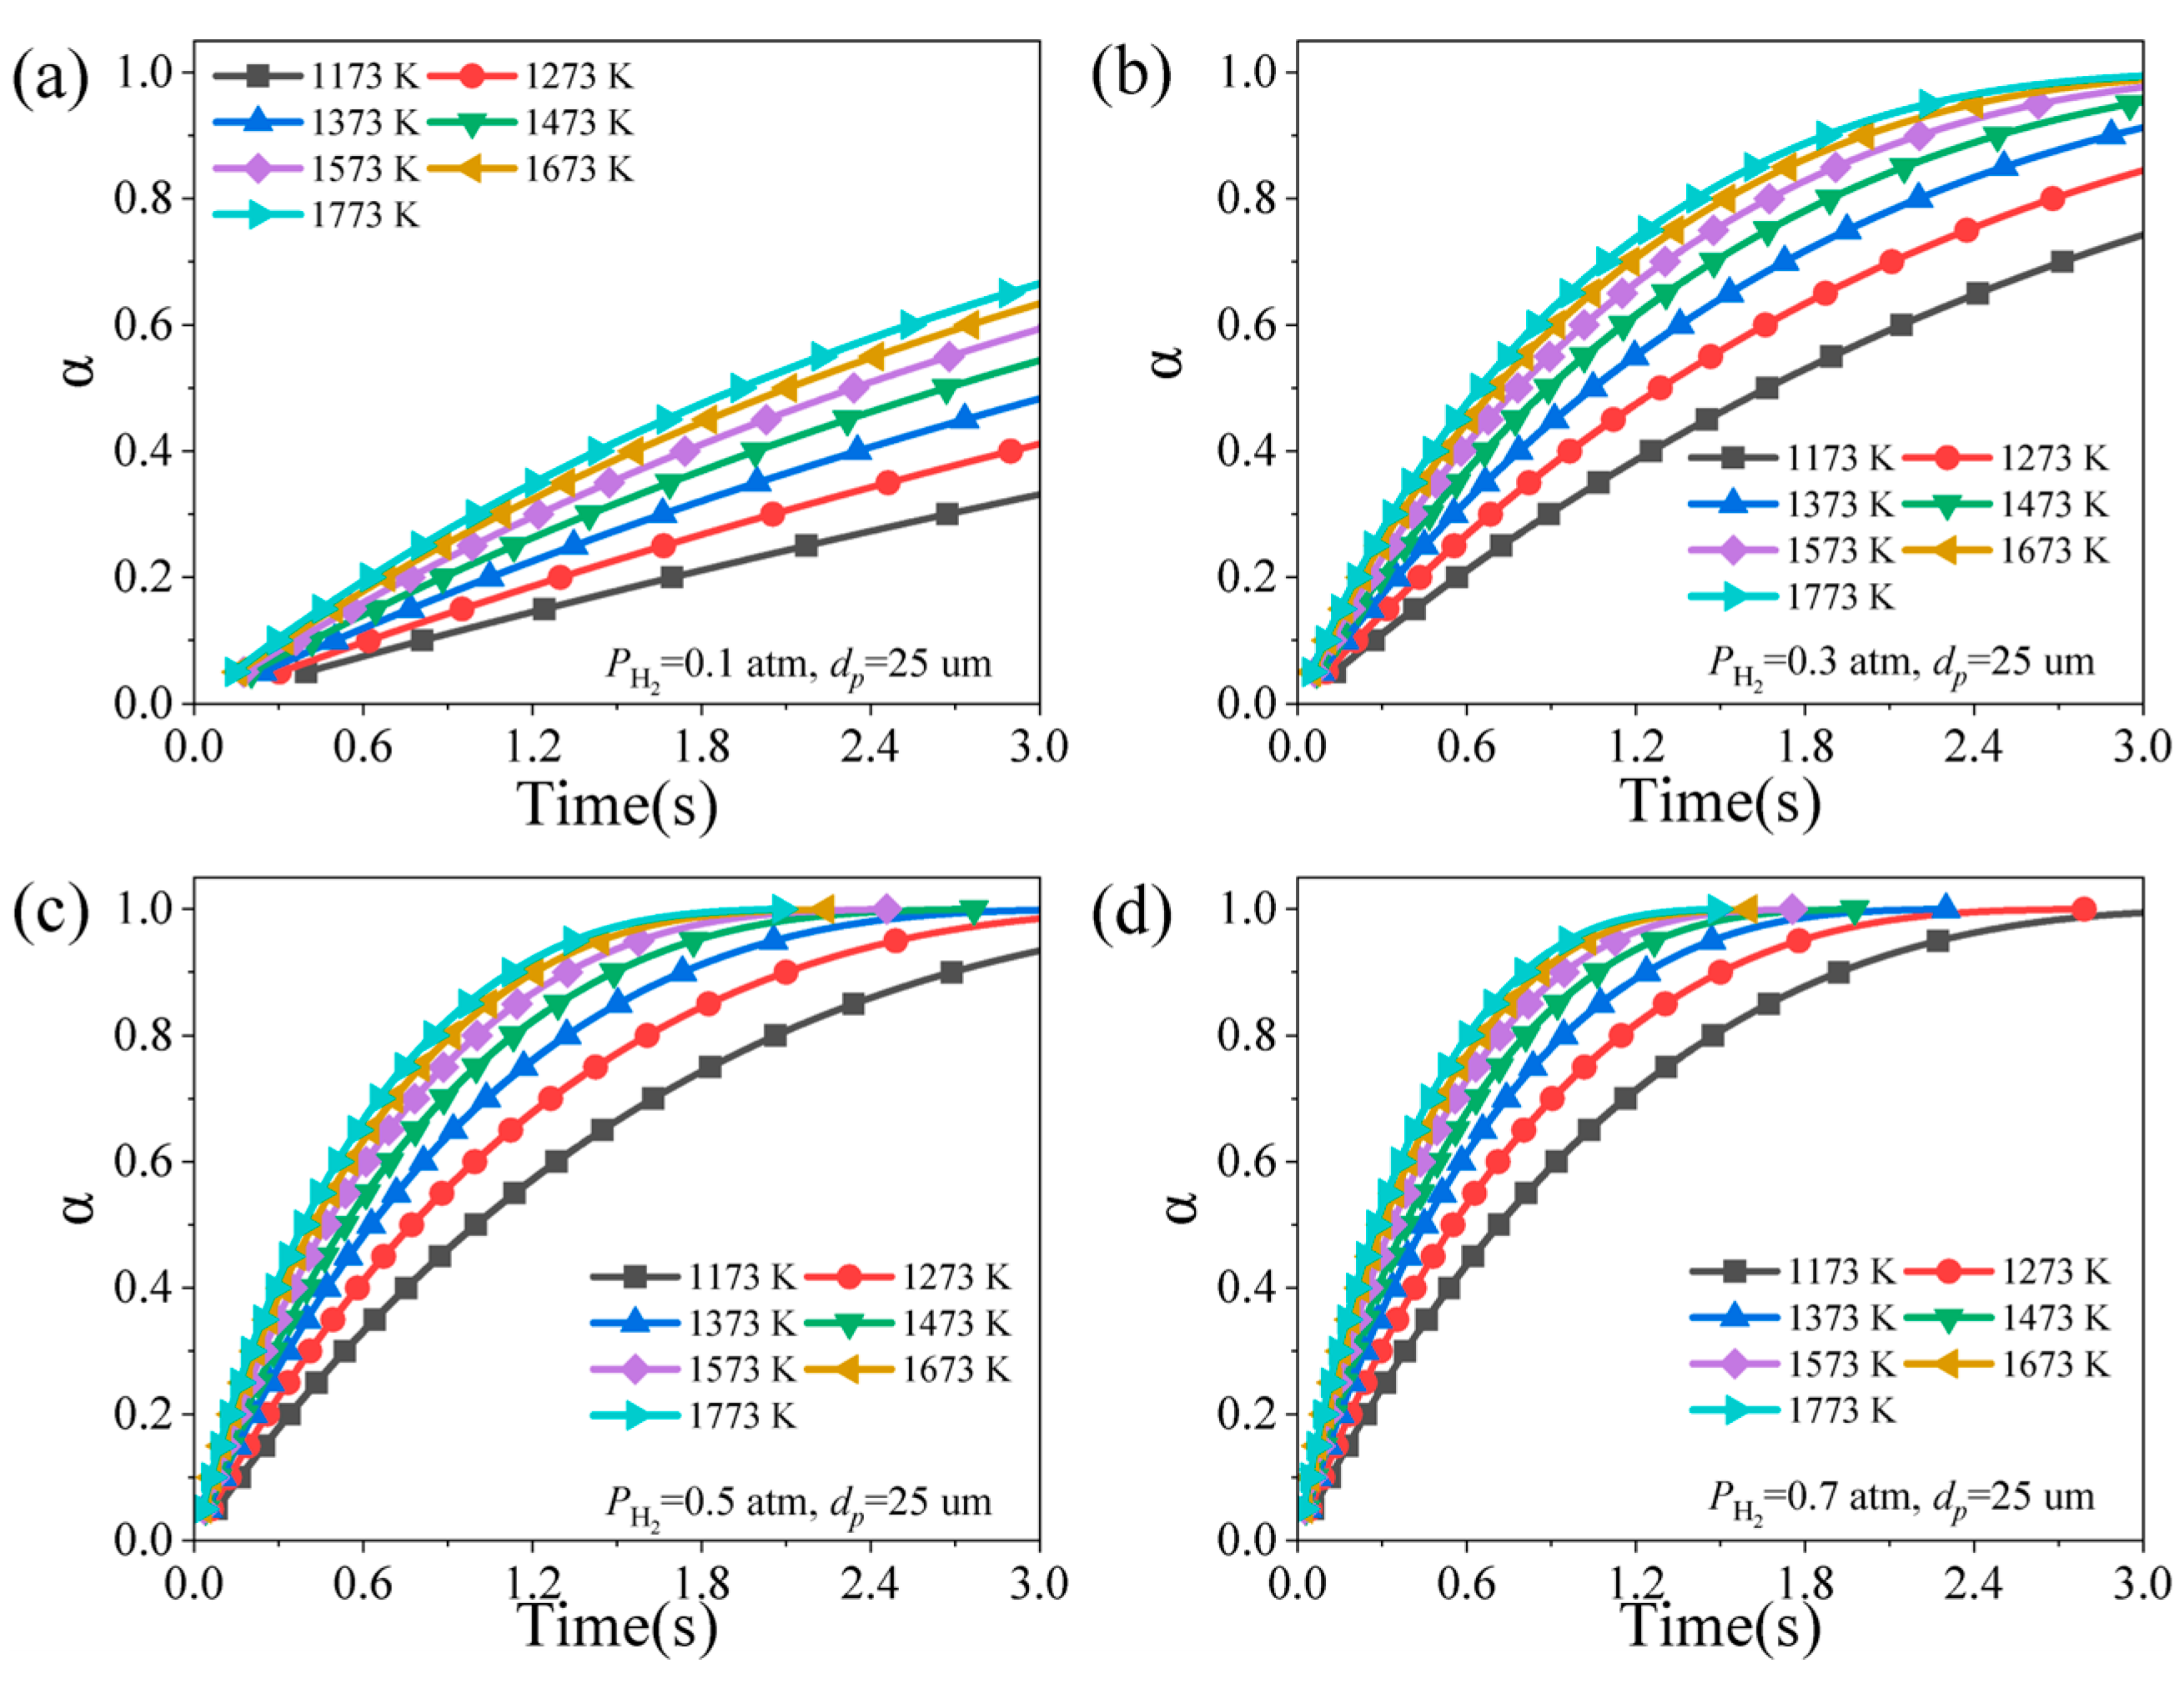
4.1. Effect of Reduction Temperature

Figure 5 presents the thermogravimetric (TG) and reduction degree (α) curves of limonite as a function of time at different constant reduction temperatures. As illustrated in Figure 5a, the higher the reduction temperature, the faster the mass loss of limonite. When the reduction temperature exceeds 800 °C, the mass loss curve of limonite tends to be stable after approximately 200 s, indicating that the reduction reaction is basically completed. Moreover, as can be seen from Figure 5b, the degree of reduction increases with an increase in reduction temperature. At 600 °C, it takes 900 s to achieve a reduction degree of approximately 60%. Under the same reduction degree, it only takes 283 s at 700 °C, 126 s at 800 °C, and 88 s at 900 °C. Furthermore, it is observed that the reduction rate of limonite particles increases rapidly as the temperature increases. When the temperature exceeds 800 °C, the time required for the limonite particles to reach a 90% reduction degree is less than 263 s. This is because, according to the Arrhenius equation, the rate of chemical reactions accelerates with increasing temperature. During the reduction process of limonite, higher temperatures result in more frequent and vigorous collisions between iron oxide and H2 molecules, thereby accelerating the reduction reaction. This finding is consistent with the research results of Khani et al. [19].

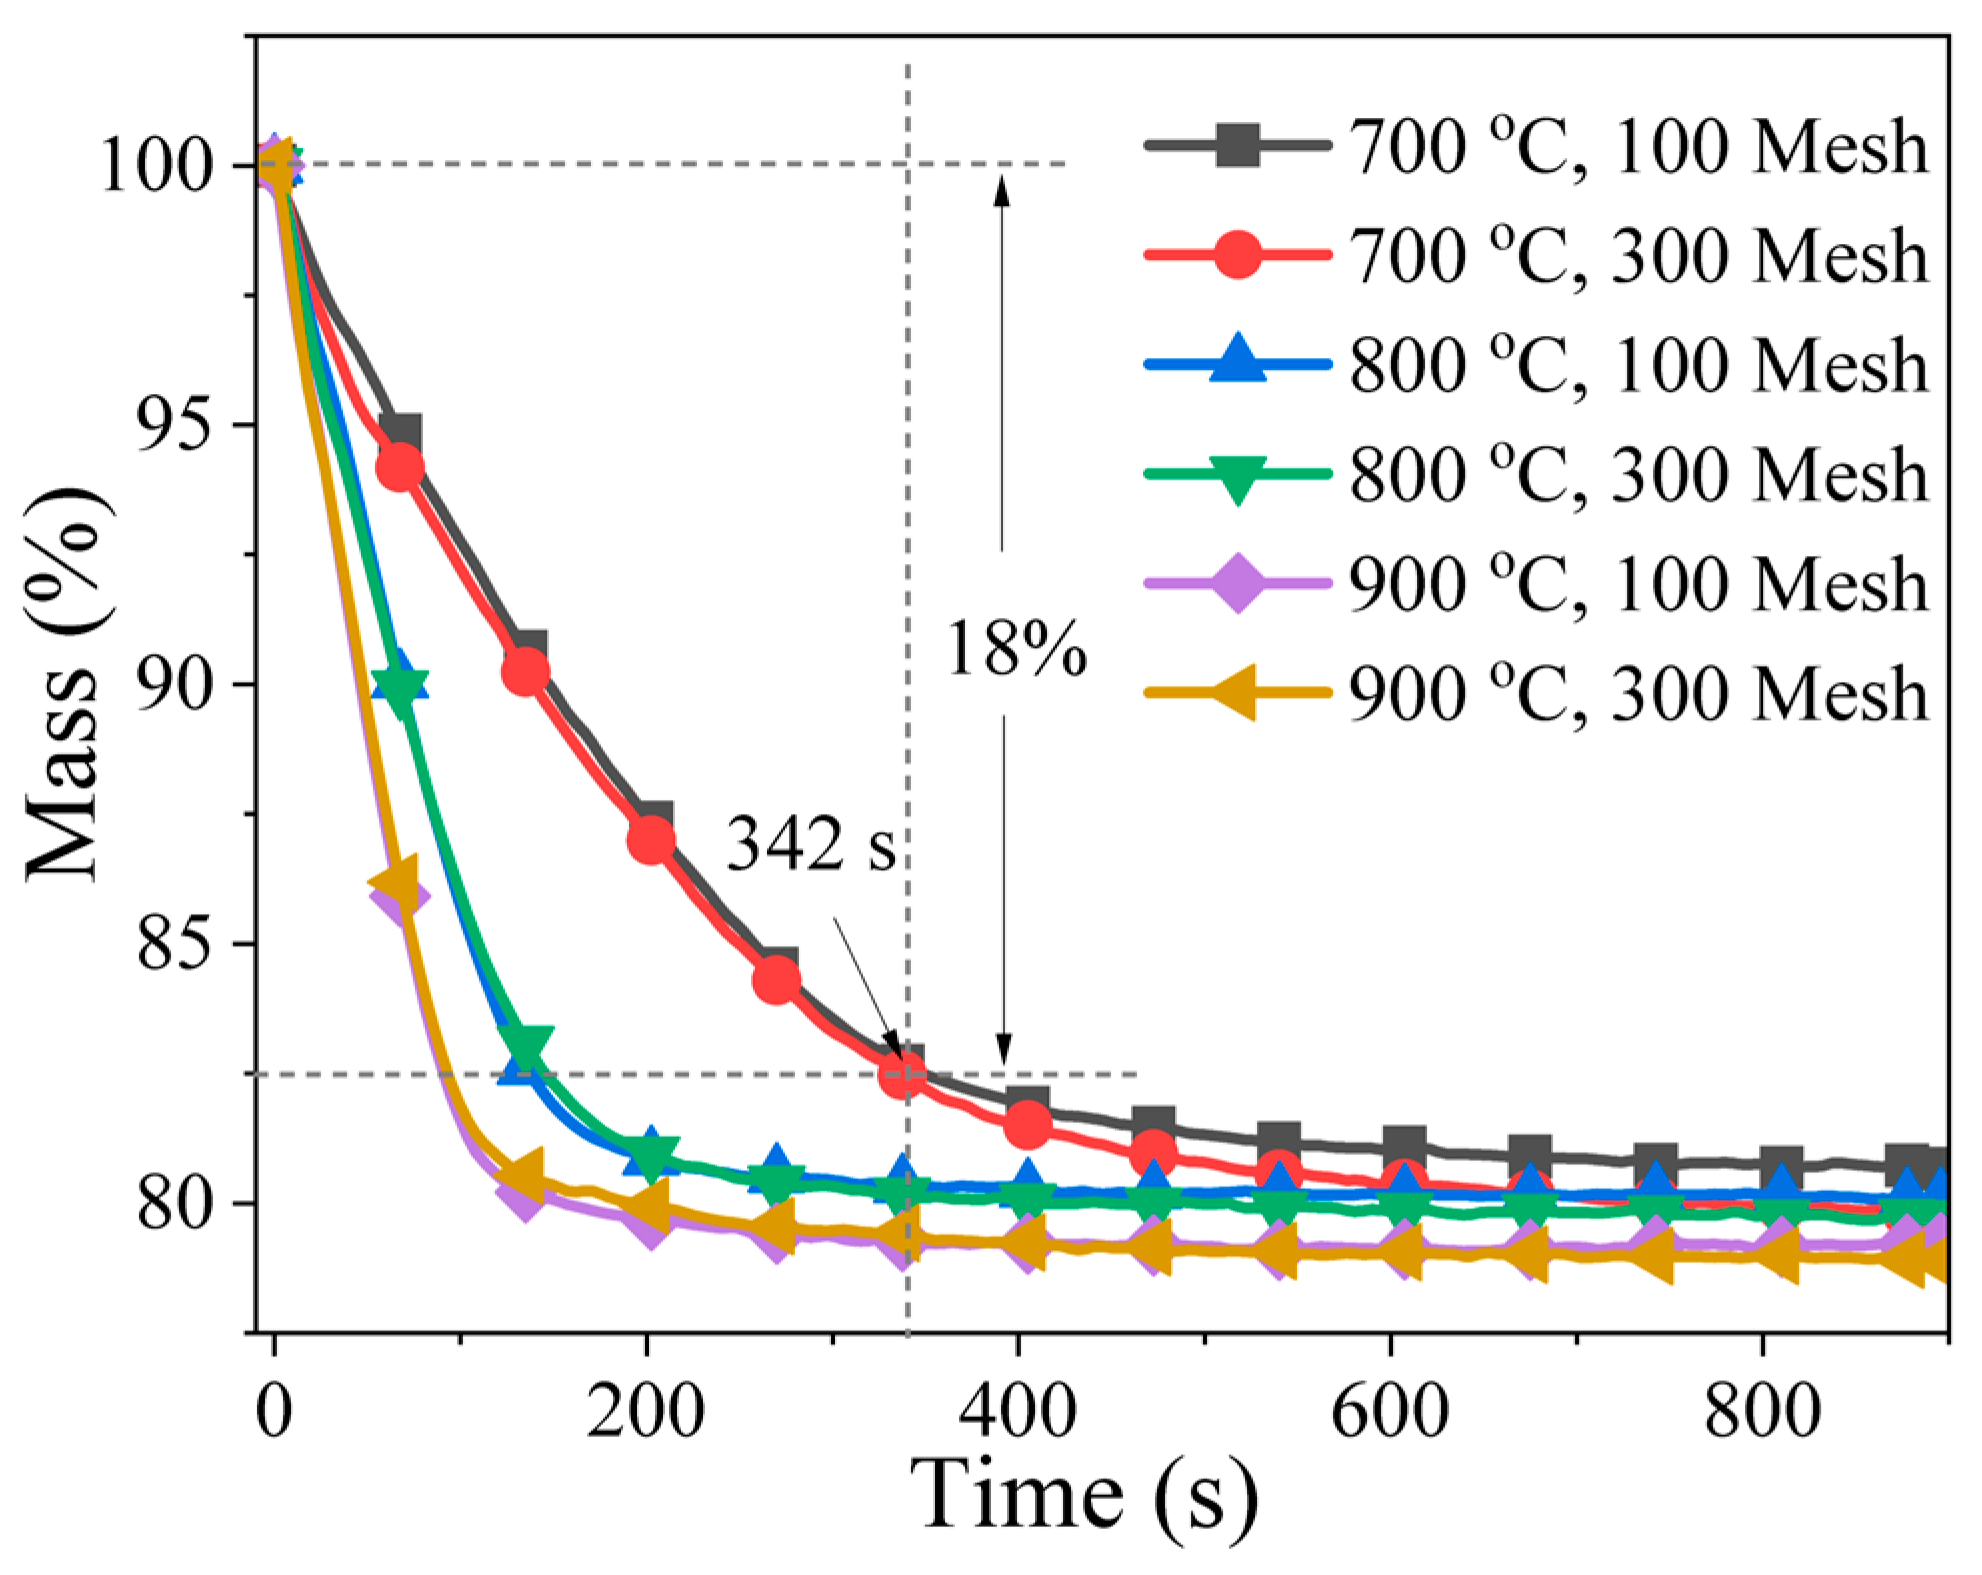
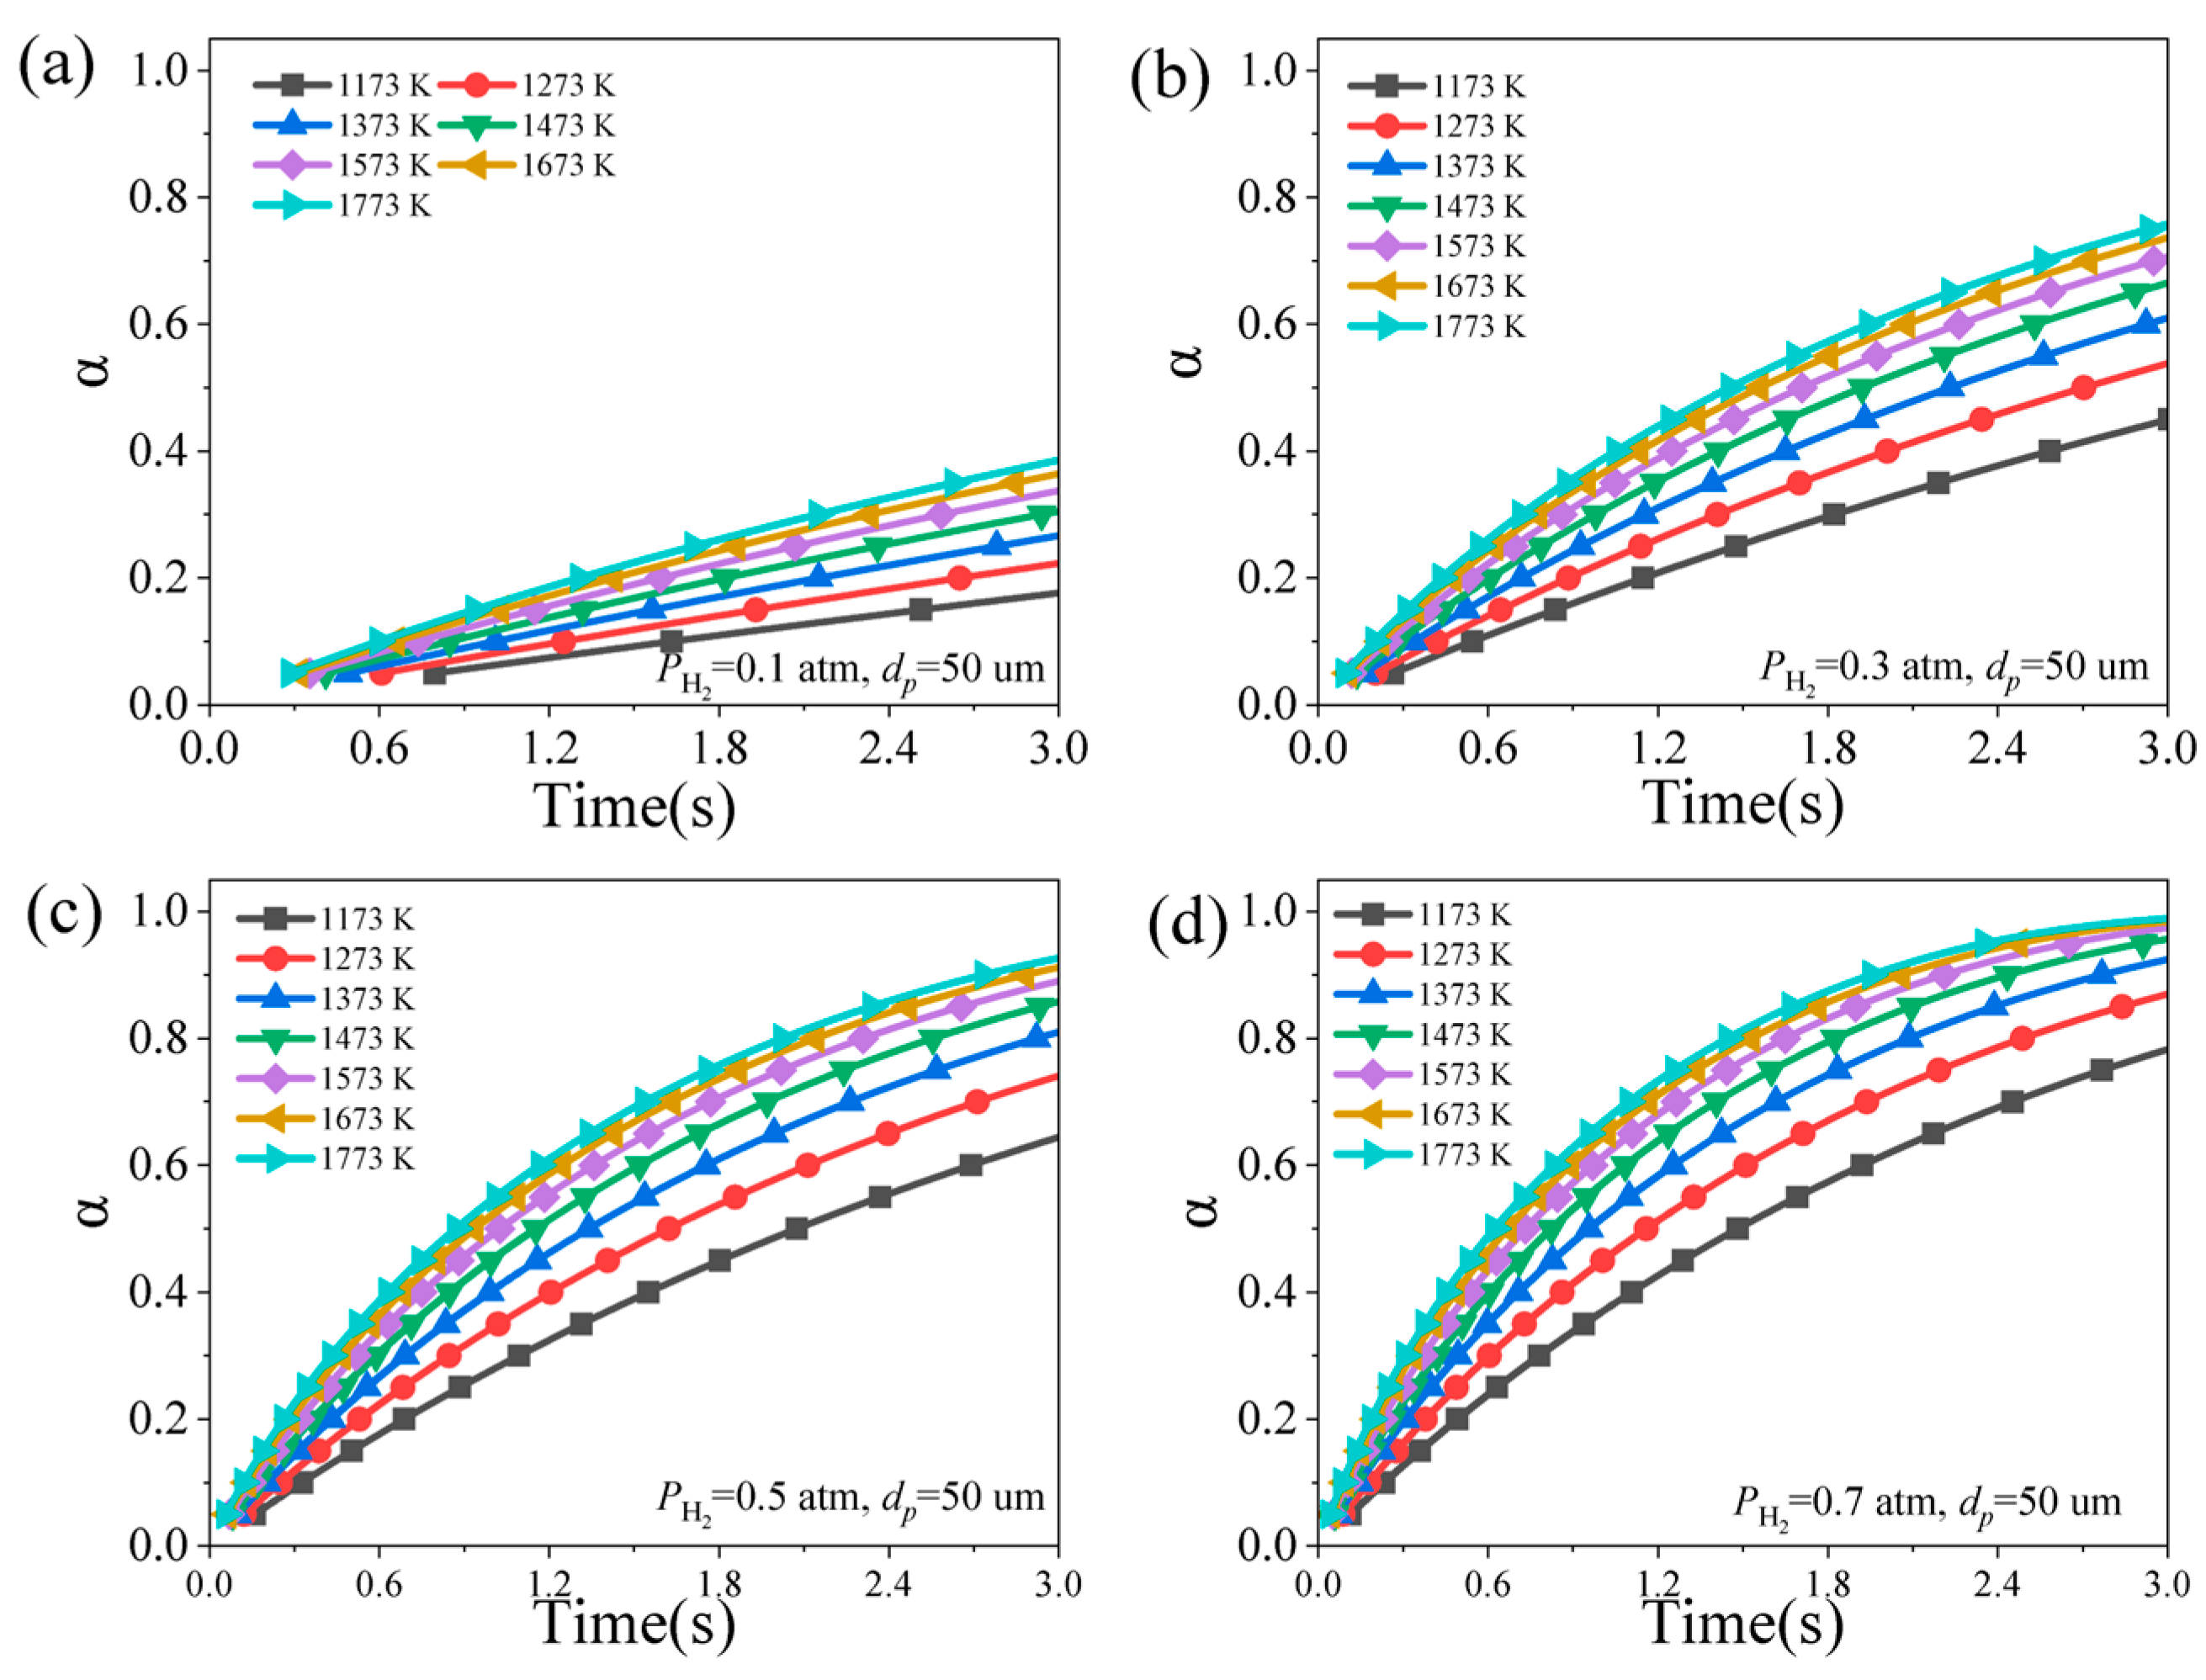
4.2. Effect of Particle Size

Figure 6 presents curves illustrating the variation in limonite mass over time for different particle sizes (100 and 300 meshes) and reduction temperatures (700–900 °C). As depicted in Figure 6, at the lower reduction temperature of 700 °C, the larger the particle size of the iron ore powder, the slower the reduction rate. This trend becomes more pronounced, especially after a reduction time of 342 s (when the mass loss reaches 18%). This is because, at low temperatures, the diffusion path of the reducing gas is longer, and the diffusion resistance is higher for larger iron ore particles. Additionally, the smaller specific surface area and fewer reaction sites for larger particles collectively contribute to the slower reduction rate. However, when the reduction temperature rises to 800 °C and 900 °C, the reduction reaction curves for iron ore powders of different particle sizes tend to overlap. This phenomenon is attributed to the accelerated diffusion rate and enhanced reactivity of hydrogen at high temperatures, making the influence of particle size on the reduction rate insignificant.

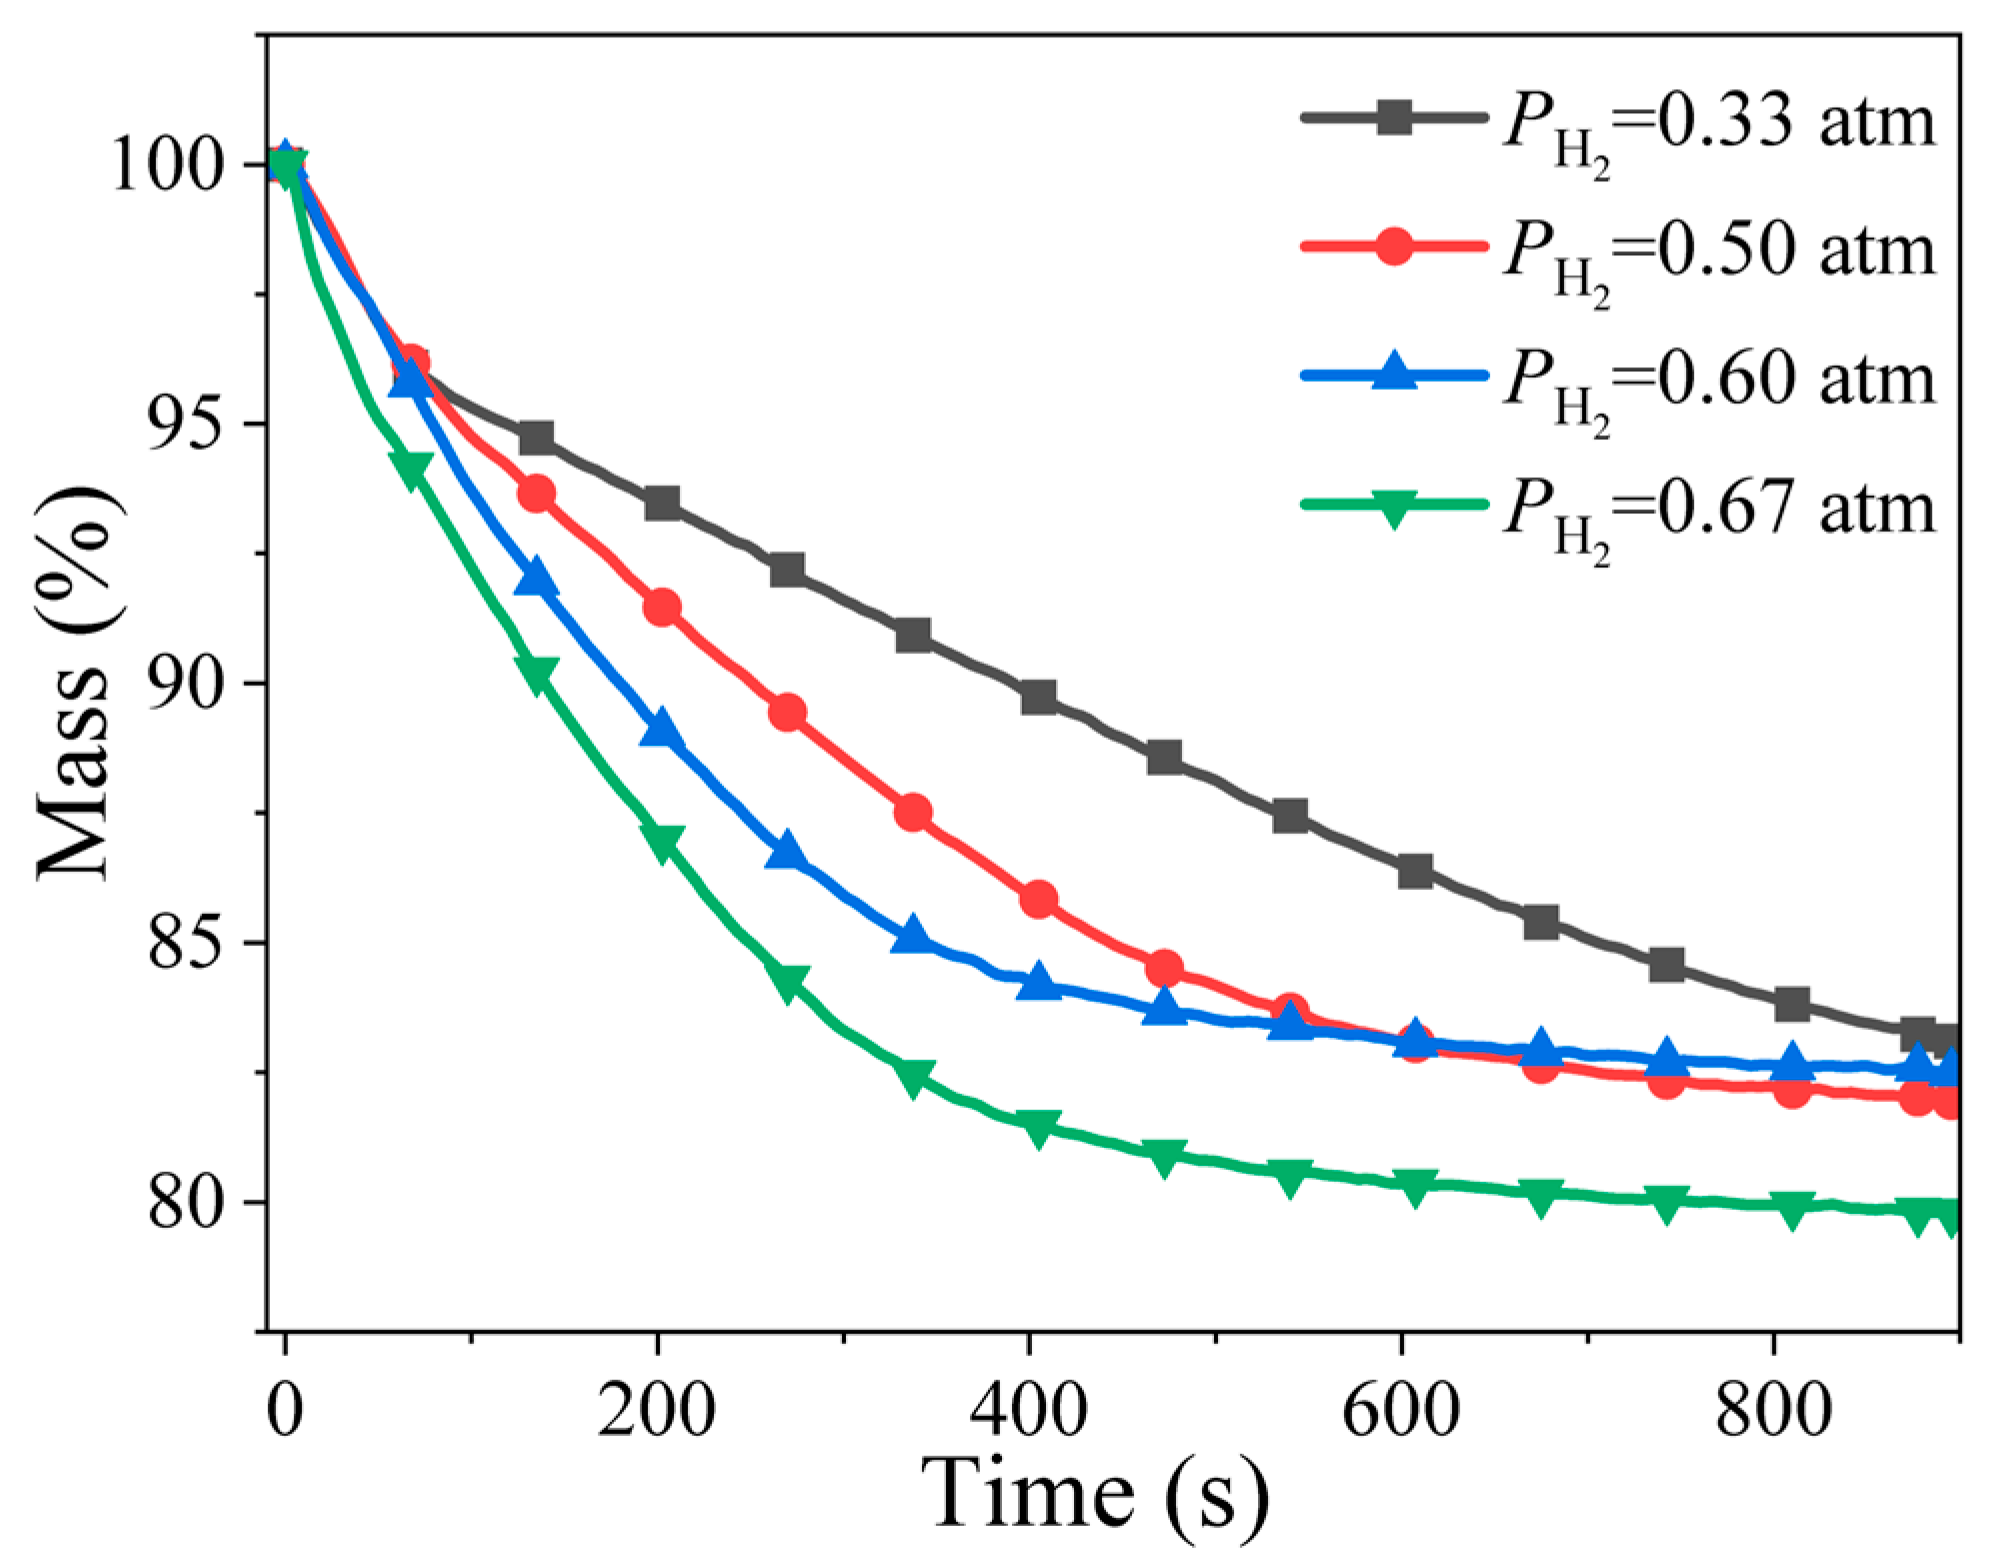
4.3. Effect of Hydrogen Partial Pressure

Figure 7 presents the variation in the mass of limonite particles with a particle size of 300 mesh over time during the reduction process under different hydrogen partial pressures. As shown in Figure 7, the degree of reduction of limonite increases with higher hydrogen partial pressures at the same time point. At 600 s, the mass losses are 13.51%, 16.79%, 17%, and 19.67% under hydrogen partial pressures of 0.33, 0.50, 0.60, and 0.67 atm, respectively. This indicates that hydrogen partial pressure is a significant factor affecting the reduction rate of limonite. Therefore, special consideration should be given to the influence of hydrogen partial pressure in subsequent kinetic studies.

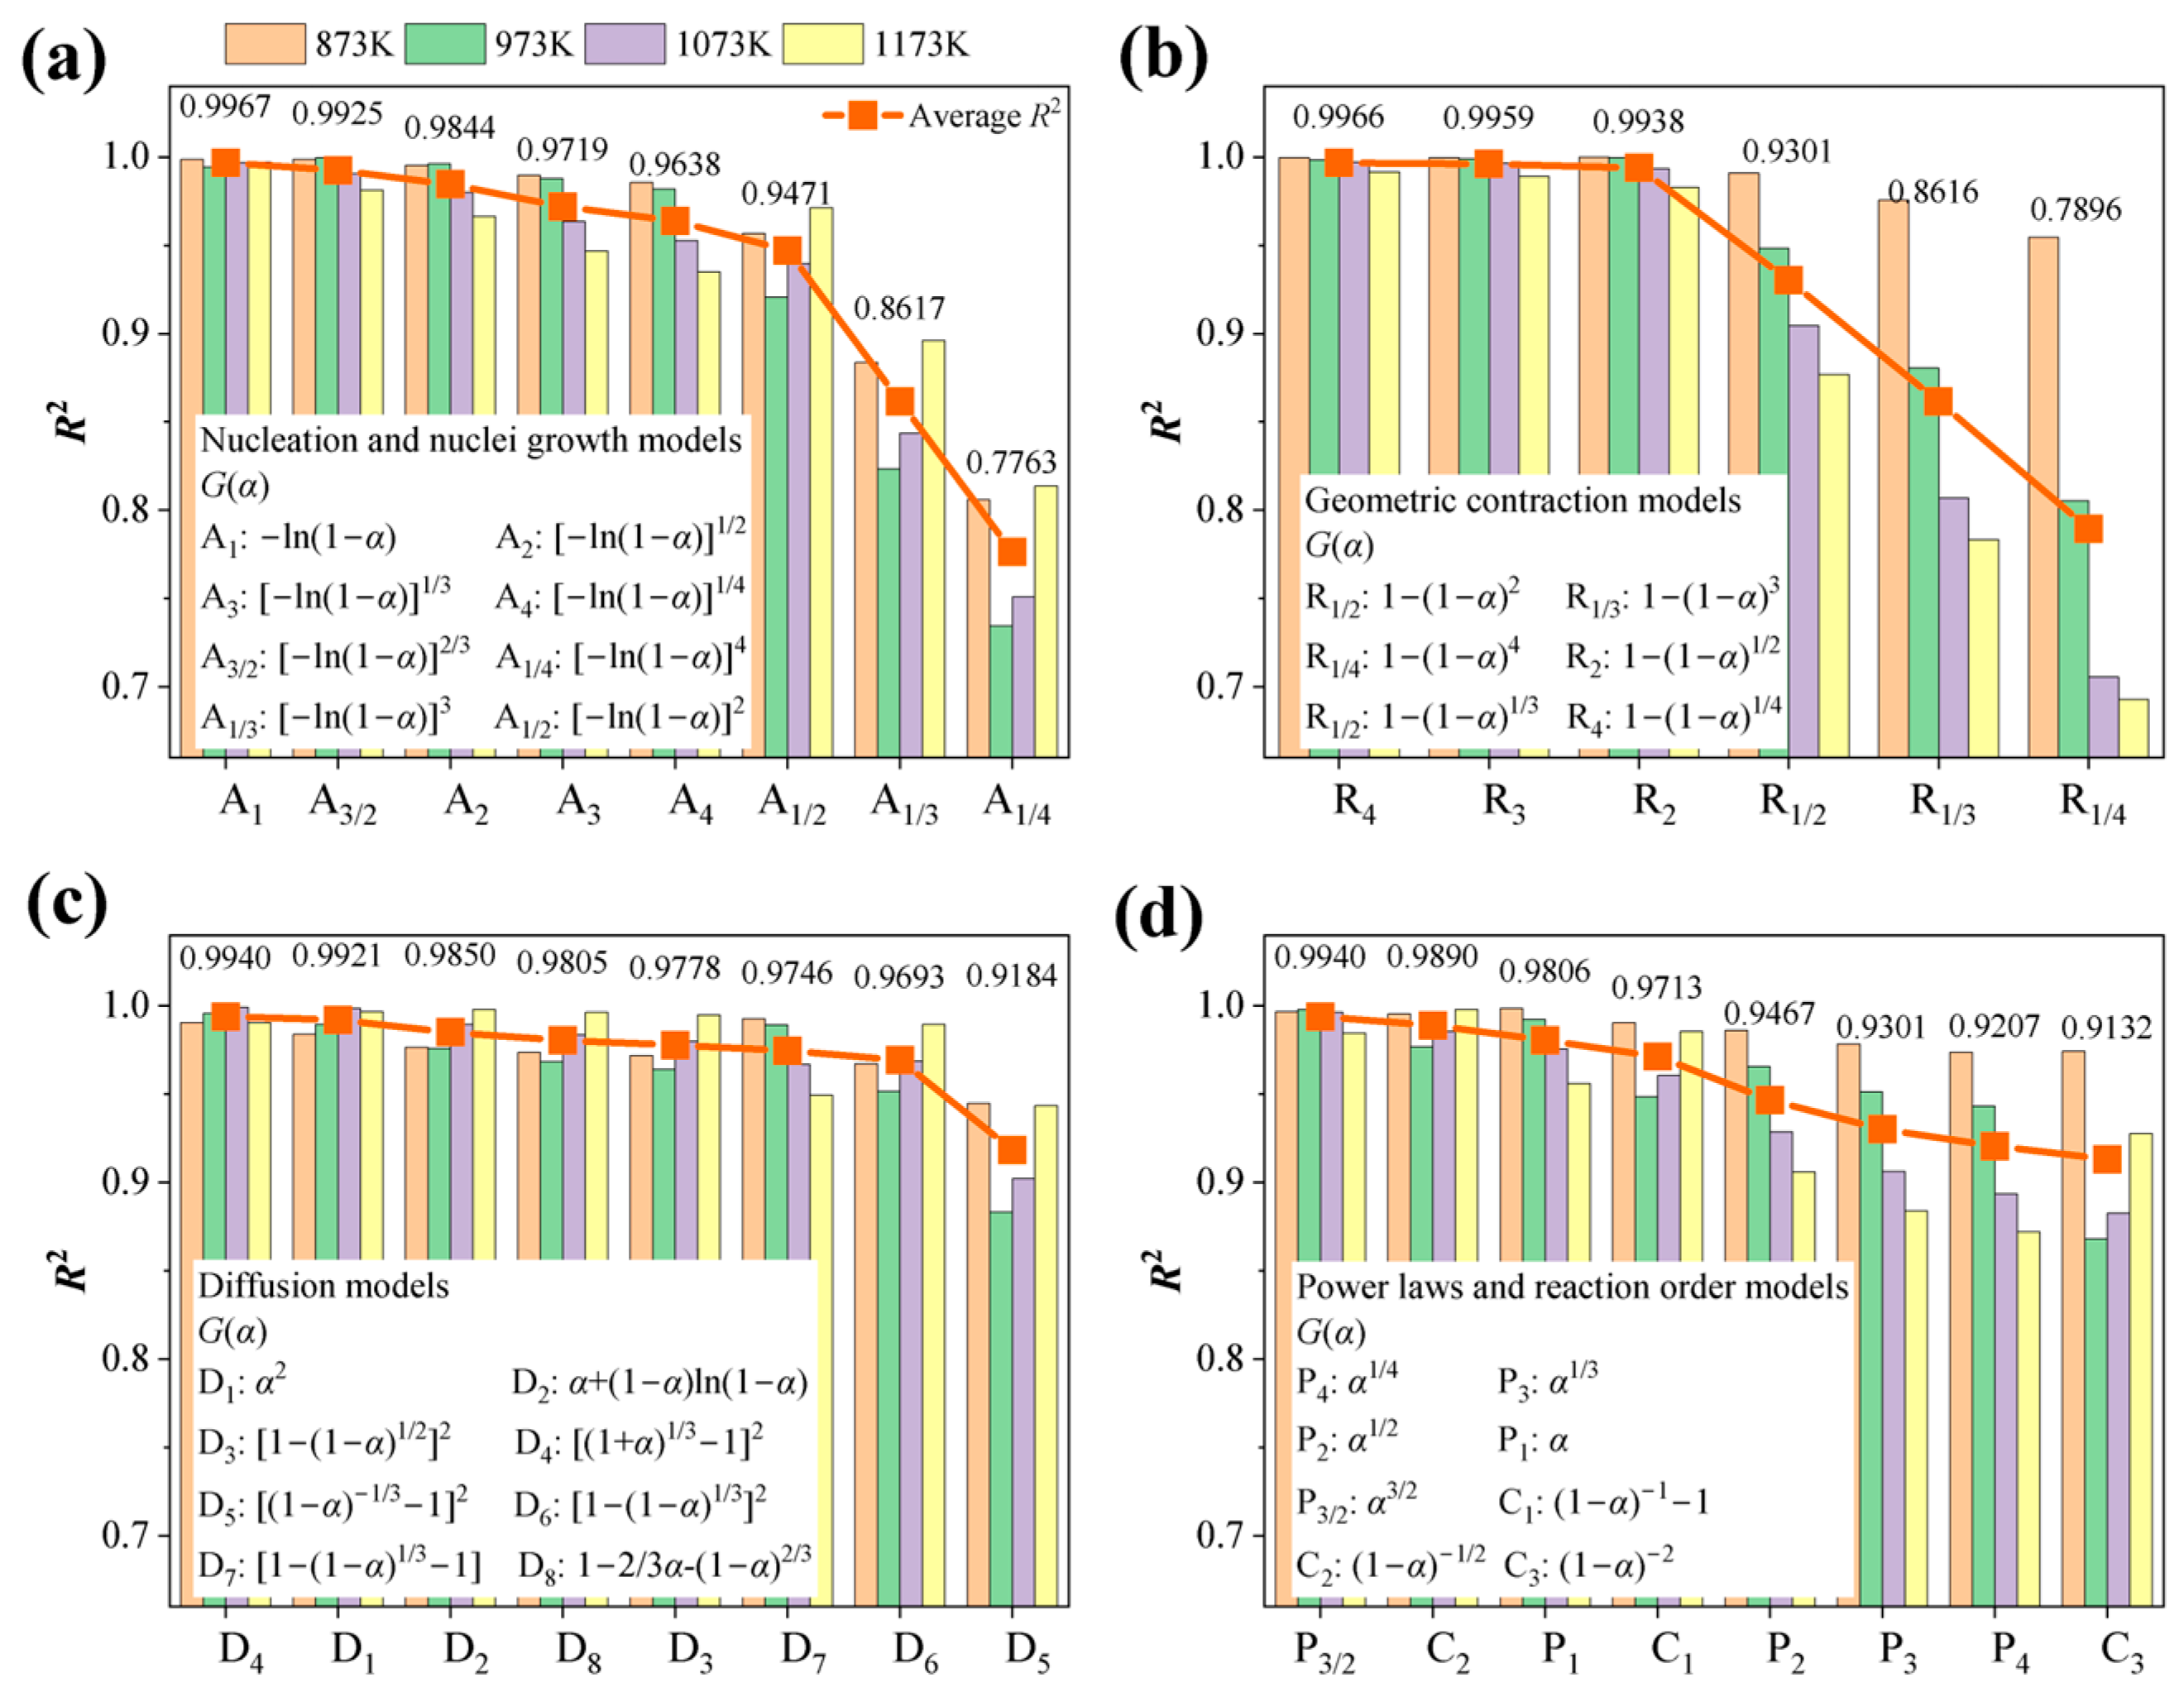
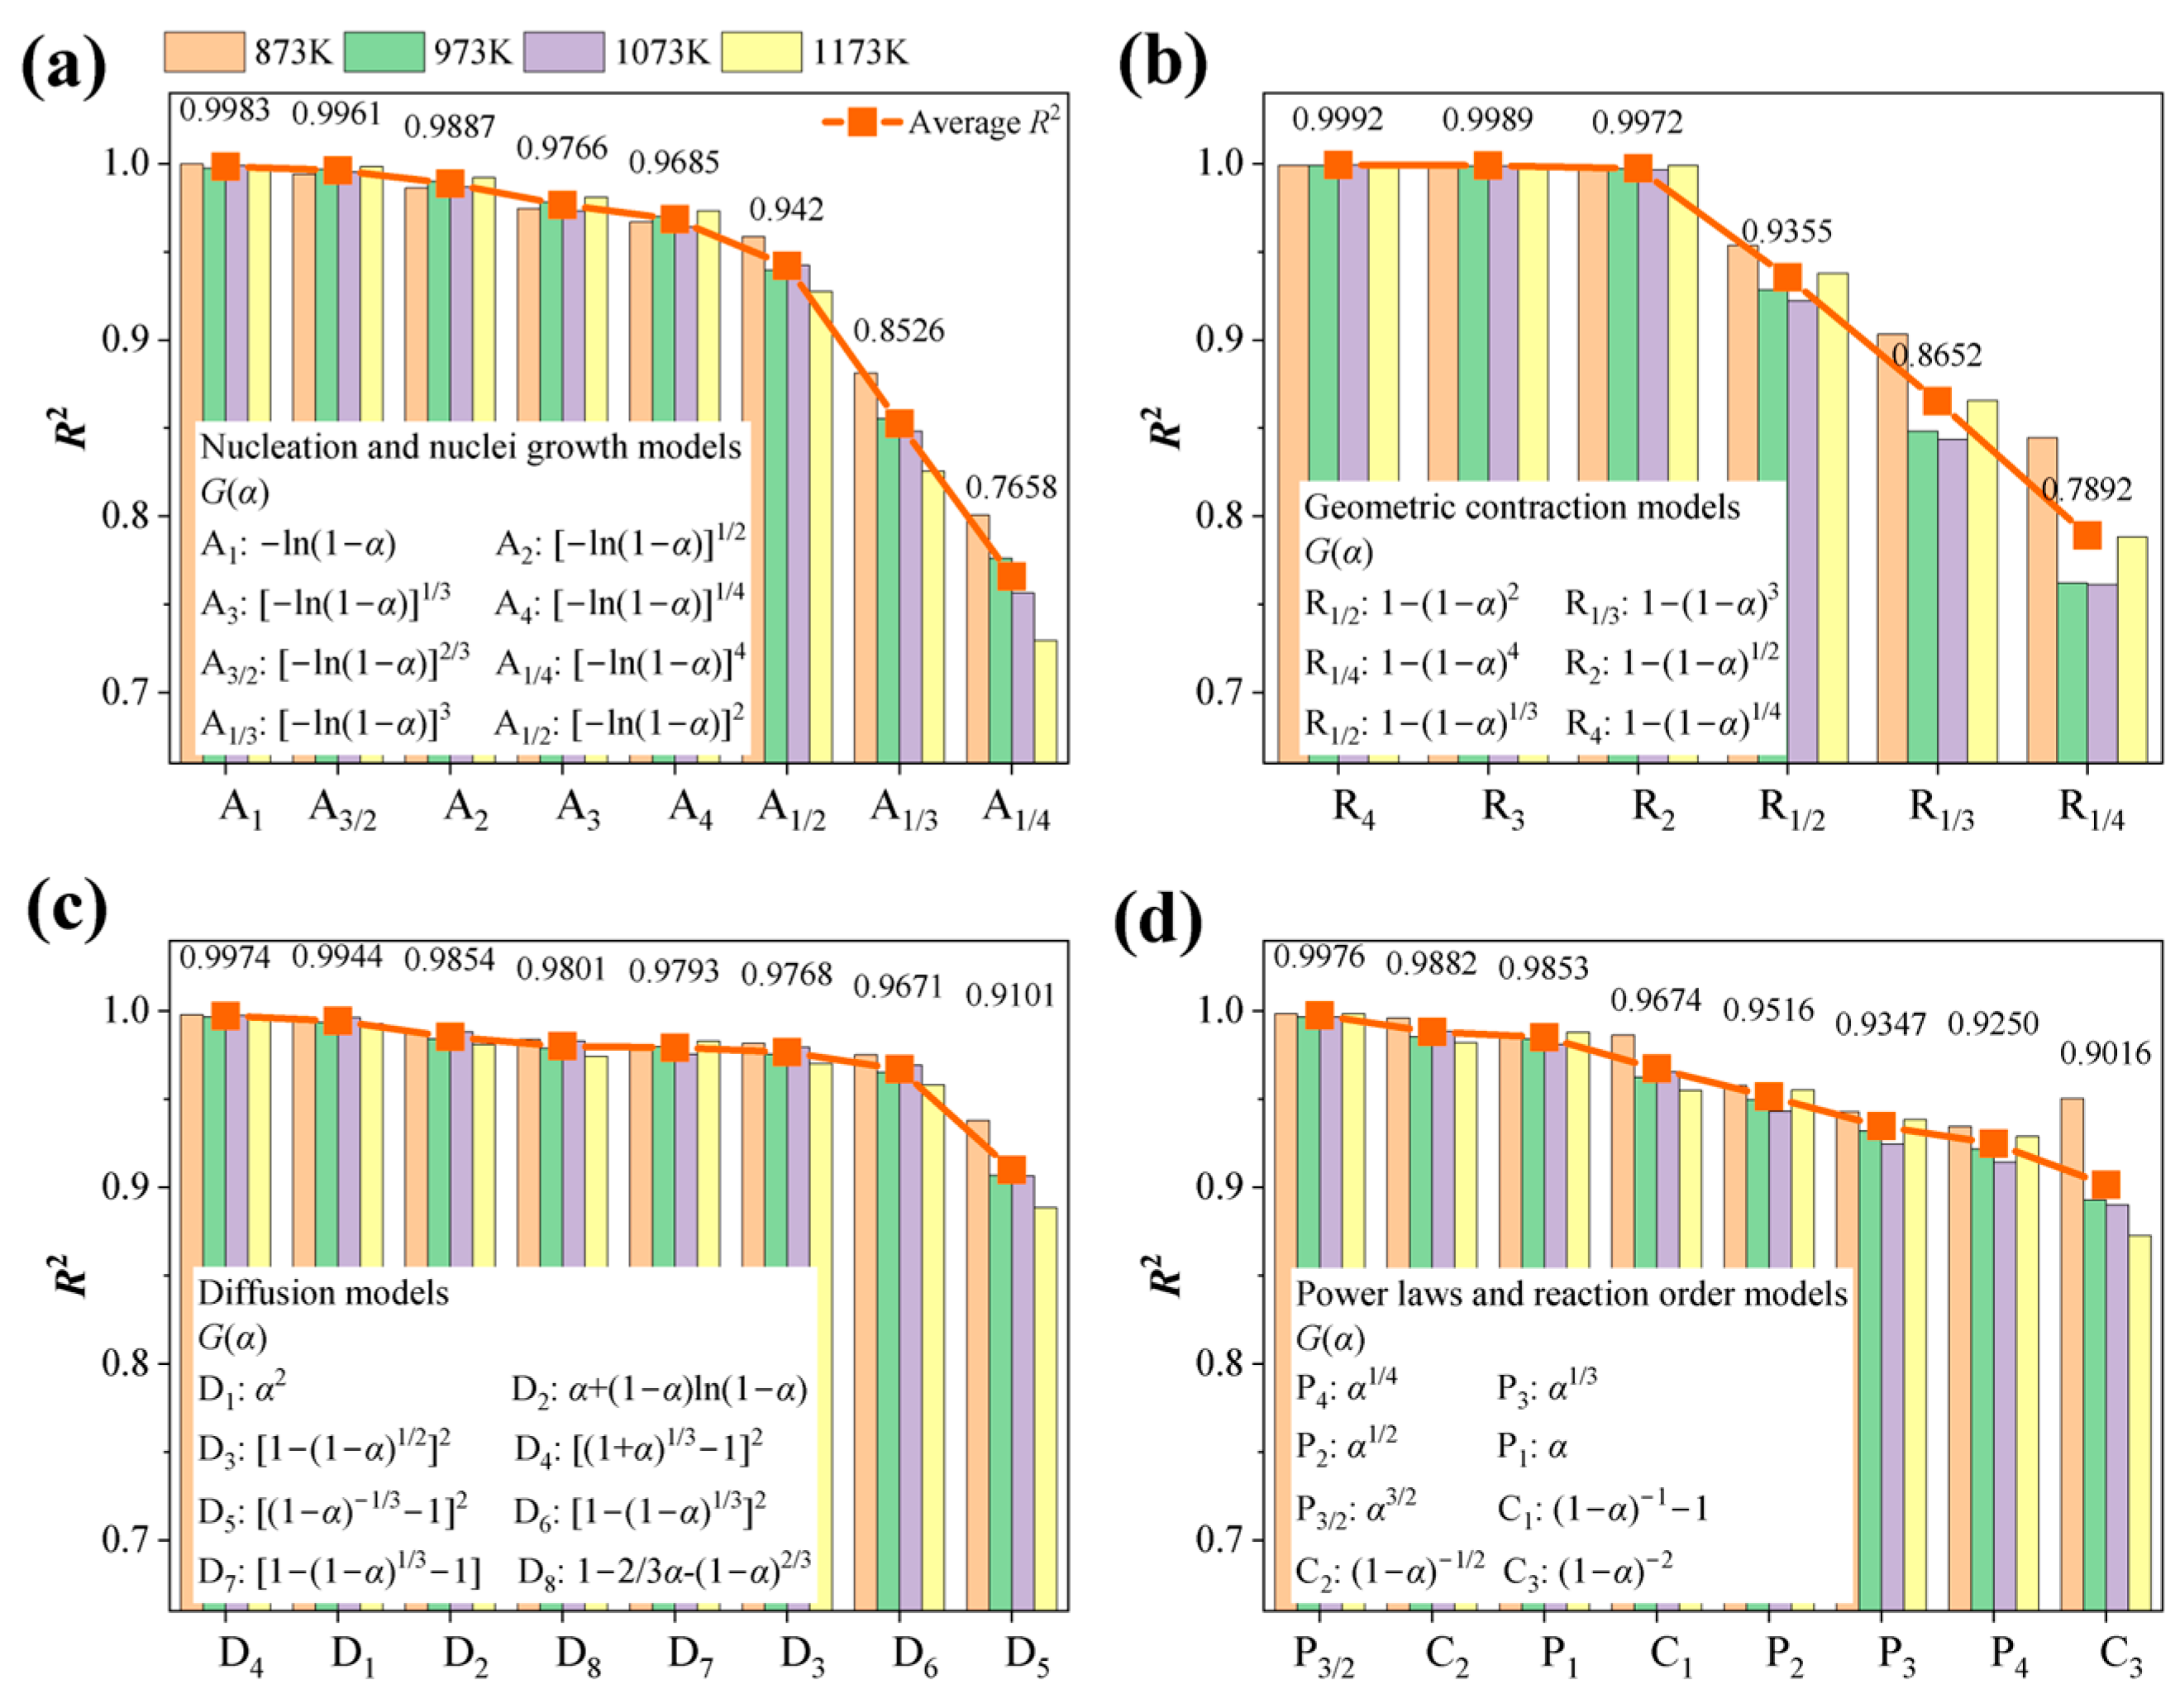
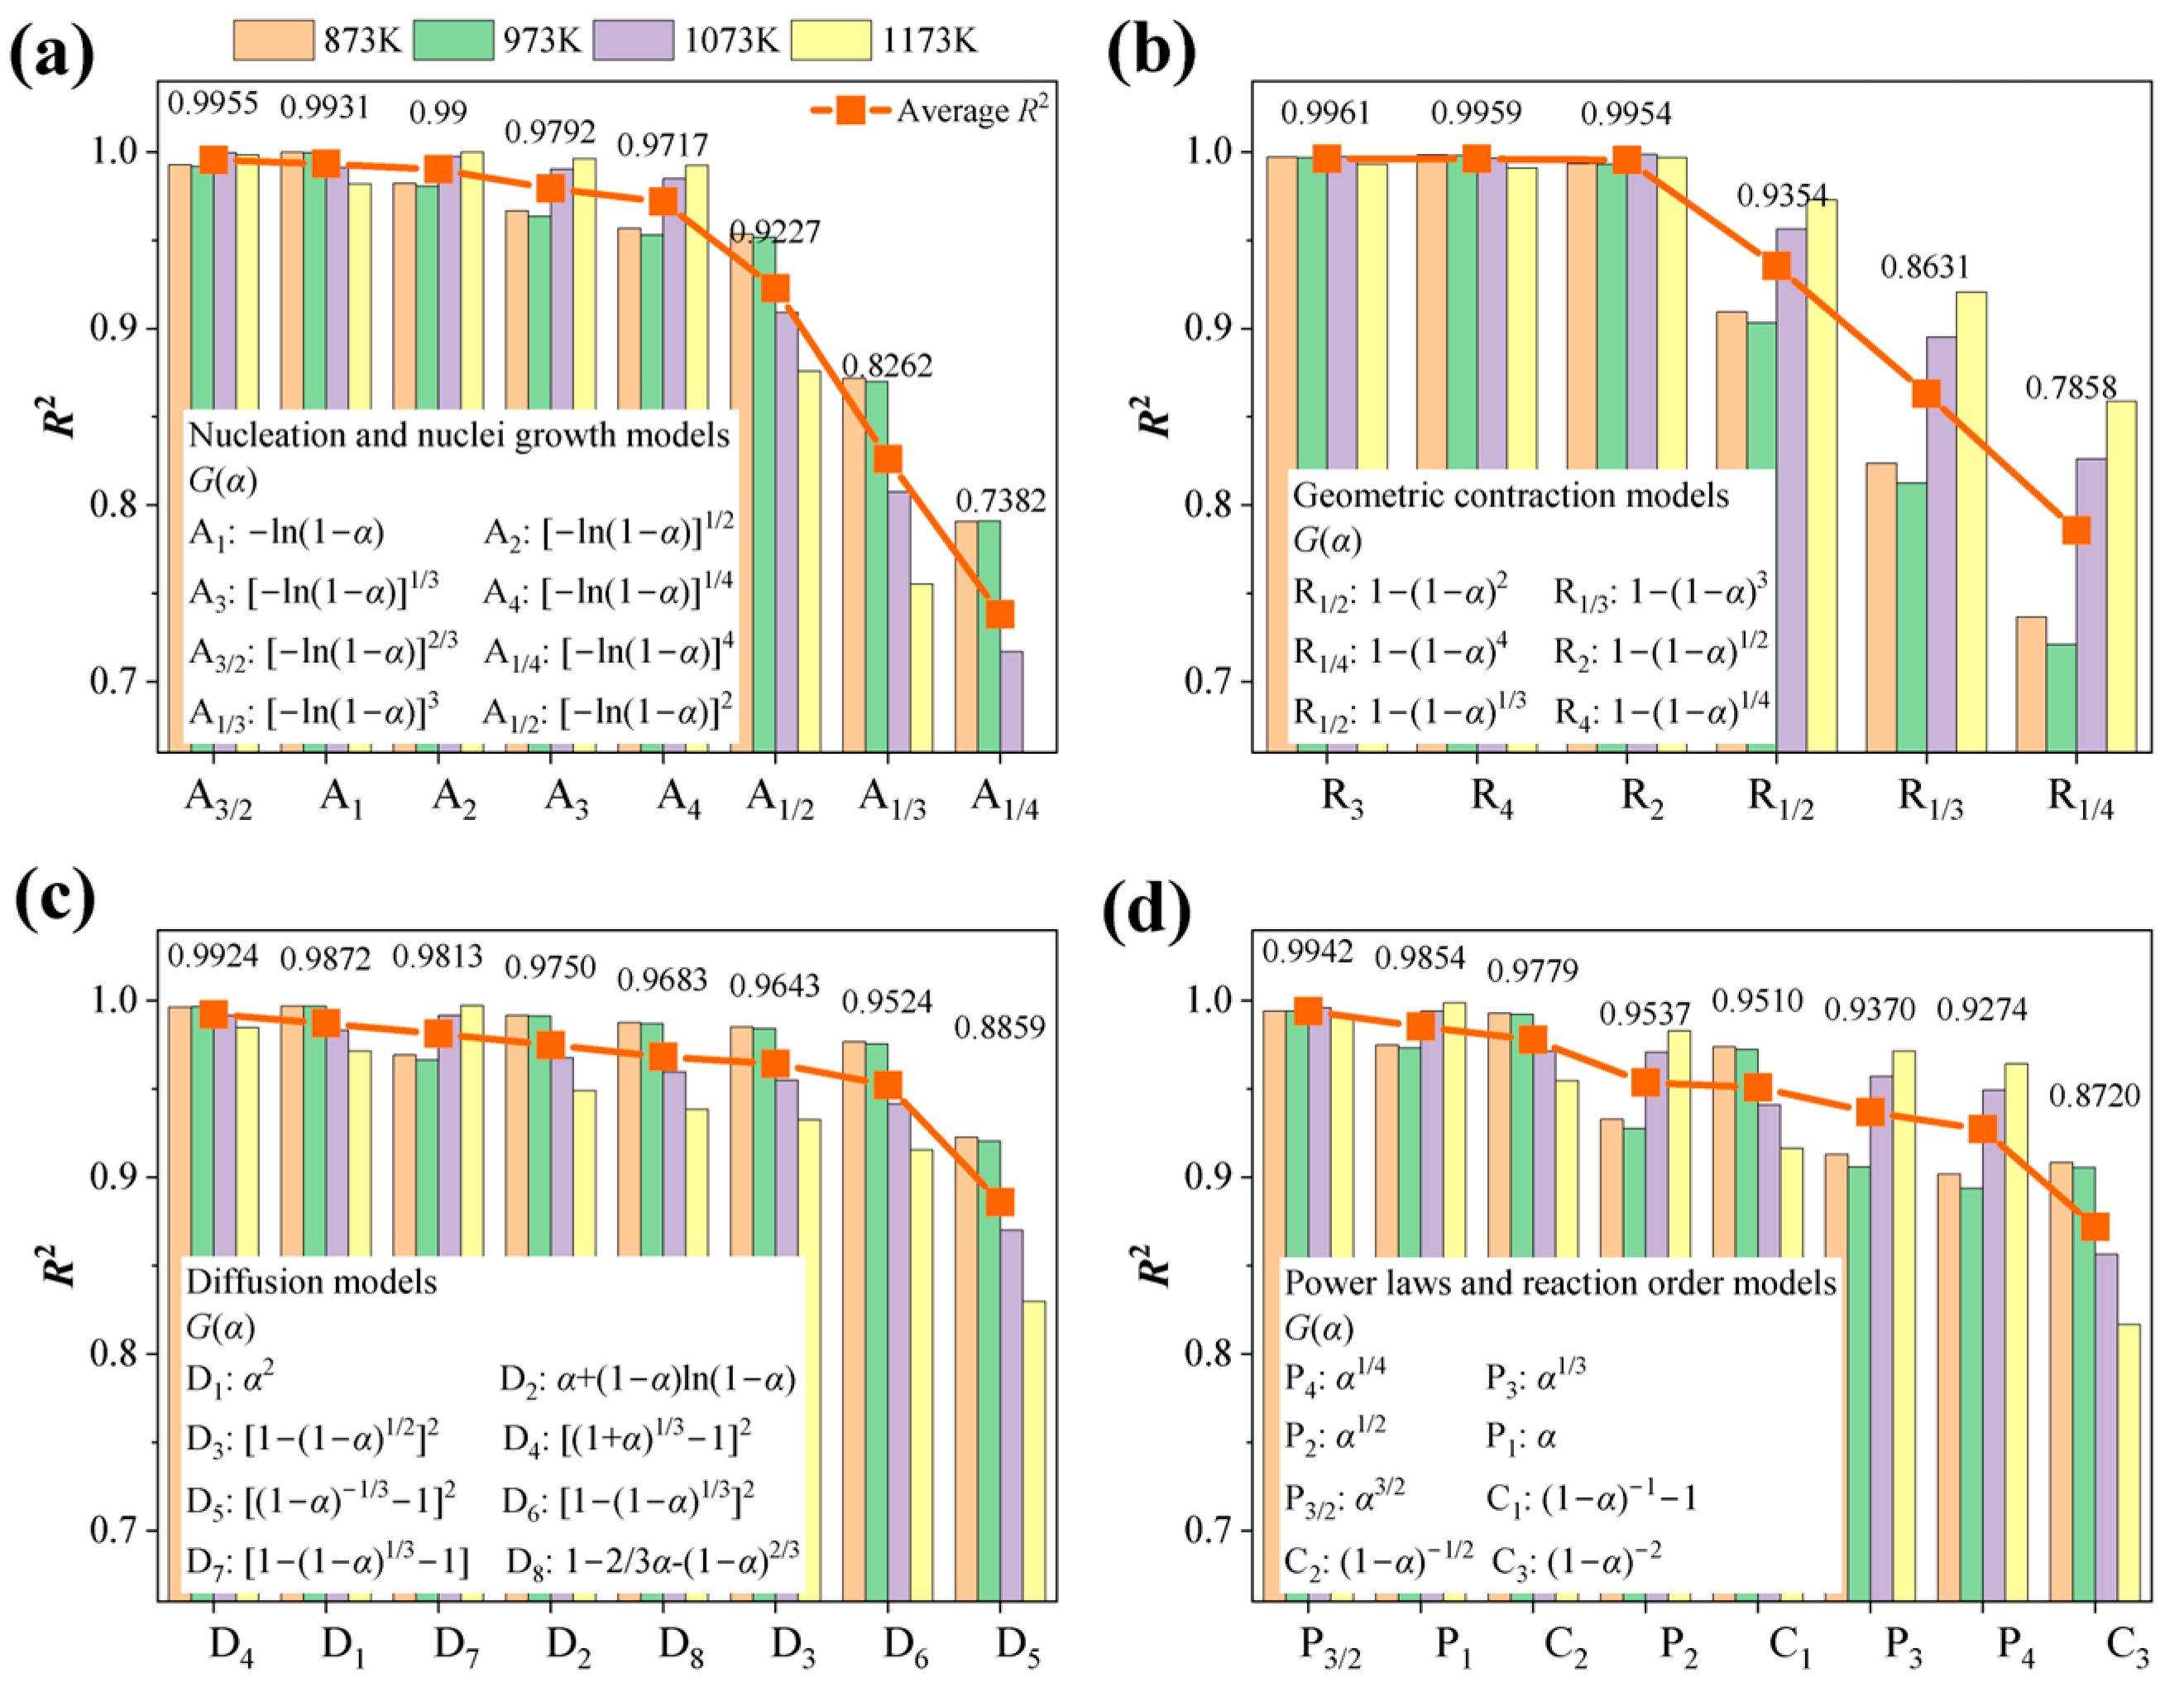
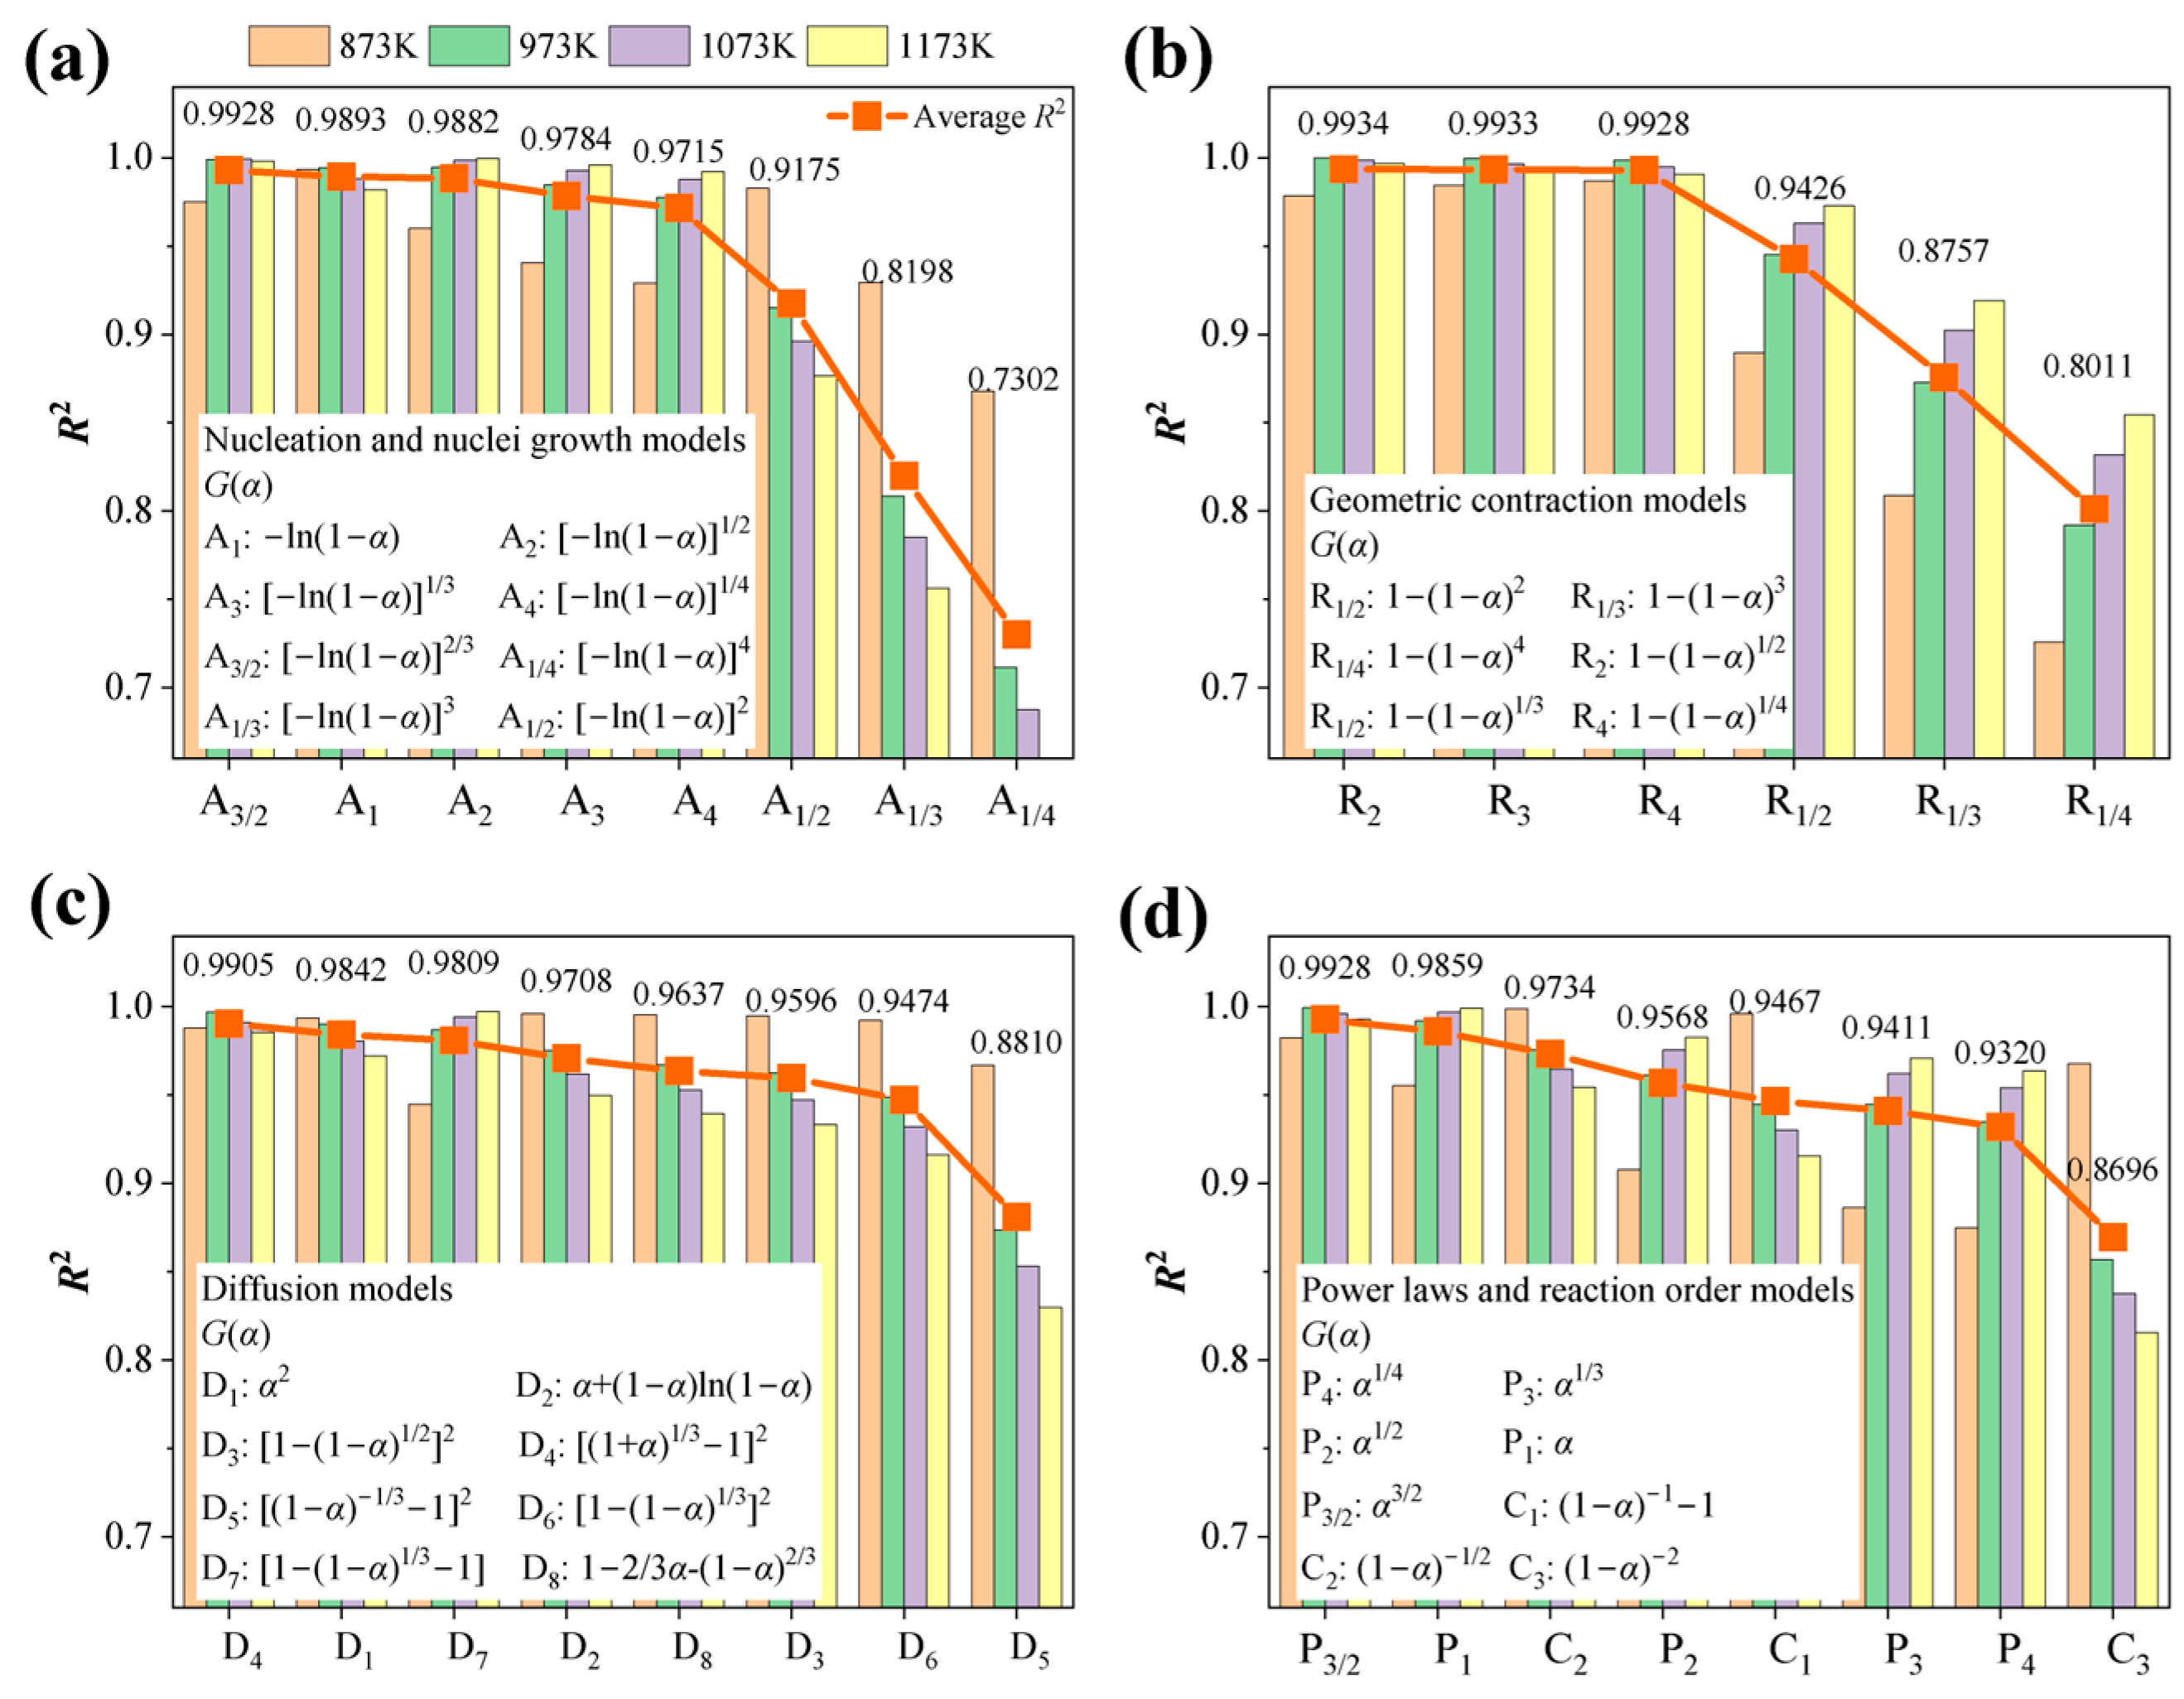
4.4. Mechanism Functions Analysis

Figure 8 presents the computational results of 30 commonly used kinetic mechanism functions, under a hydrogen partial pressure (PH2) of 0.33 atm for reduction conditions. The numerical values at the top of the histograms indicate the average R2 values for the model at different temperatures. As illustrated in Figure 8a–d, under lower hydrogen partial pressure conditions, the reduction reaction follows the nucleation and nuclei growth model, with the mechanism function designated as A1 ( ln ( 1 α ) ). The average R2 value across different reduction temperatures is 0.9967. This is because, under a low hydrogen concentration, the frequency and amount of hydrogen (the reactant) coming into contact with the reaction interface decrease. Consequently, the reduction reaction is more likely to initiate nucleation at specific active sites, making nucleation a crucial step. Meanwhile, the driving effect of reactant diffusion on the reaction progress becomes relatively weak, and the reaction rate is constrained by the nucleation and nuclei growth stages.
Figure 9 presents the computational results of the most probable kinetic mechanism function under reduction conditions with a PH2 of 0.50 atm. As illustrated in Figure 9a–d, when the hydrogen partial pressure increases to 0.50 atm, the reduction reaction follows the geometric contraction model (R4, 1 1 α 1 / 4 ). The average R2 value across different reduction temperatures is 0.9992.
Figure 10 and Figure 11 present the computational results of the most probable kinetic mechanism function under reduction conditions with a PH2 of 0.60 and 0.67 atm. As illustrated in Figure 10, when the hydrogen partial pressure increases to 0.60 atm, the reduction reaction is primarily controlled by the geometric contraction model, with the mechanism function designated as R3 ( 1 ( 1 α ) 1 / 3 ). The average R2 value across different reduction temperatures is 0.9961. As illustrated in Figure 11, when the hydrogen partial pressure increases to 0.67 atm, the reduction reaction shifts back to following the geometric contraction model (R2, −ln(1−α)1/2). The average R2 value across different reduction temperatures is 0.9934.
Figure 12 presents the variation curves of kinetic parameters and mechanism functions for limonite under different hydrogen partial pressure conditions. By combining the information from Figure 8, Figure 9, Figure 10, Figure 11 and Figure 12, it is evident that the hydrogen concentration is a crucial factor influencing the hydrogen reduction process of limonite particles. The hydrogen partial pressure significantly affects the kinetic mechanism of the entire reduction process, albeit with minimal differences in the activation energies. Under lower hydrogen concentrations (PH2 of 0.33 atm), the nucleation and nuclei growth model, with the mechanism function designated as A1 ( ln ( 1 α ) ), is the rate-limiting step in the hydrogen reduction of iron ore particles. The apparent activation energy under this condition is 75.166 kJ/mol. At higher hydrogen concentrations (0.50–0.67 atm), the reduction reaction is primarily controlled by the geometric contraction models.
For a hydrogen partial pressure of 0.50 atm, the mechanism function is designated as R4 (1−(1−α)1/4), with an apparent activation energy of 69.367 kJ/mol. For 0.6 atm, the mechanism function is designated as R3 (1−(1−α)1/3), with an apparent activation energy of 70.720 kJ/mol. For 0.67 atm, the mechanism function is designated as R2 (1−(1−α)1/2), with an apparent activation energy of 68.590 kJ/mol. This shift in the reaction mechanism is the result of a combination of factors, including the balance between hydrogen concentration and diffusion rate, dynamic changes at the reaction interface, the influence of temperature on reaction kinetics, and the microstructure and phase transitions of the iron ore. This also reflects the complexity of how reaction conditions influence the reaction mechanism during the hydrogen reduction of iron ore, as well as the dynamic nature of the reaction mechanism under different conditions.

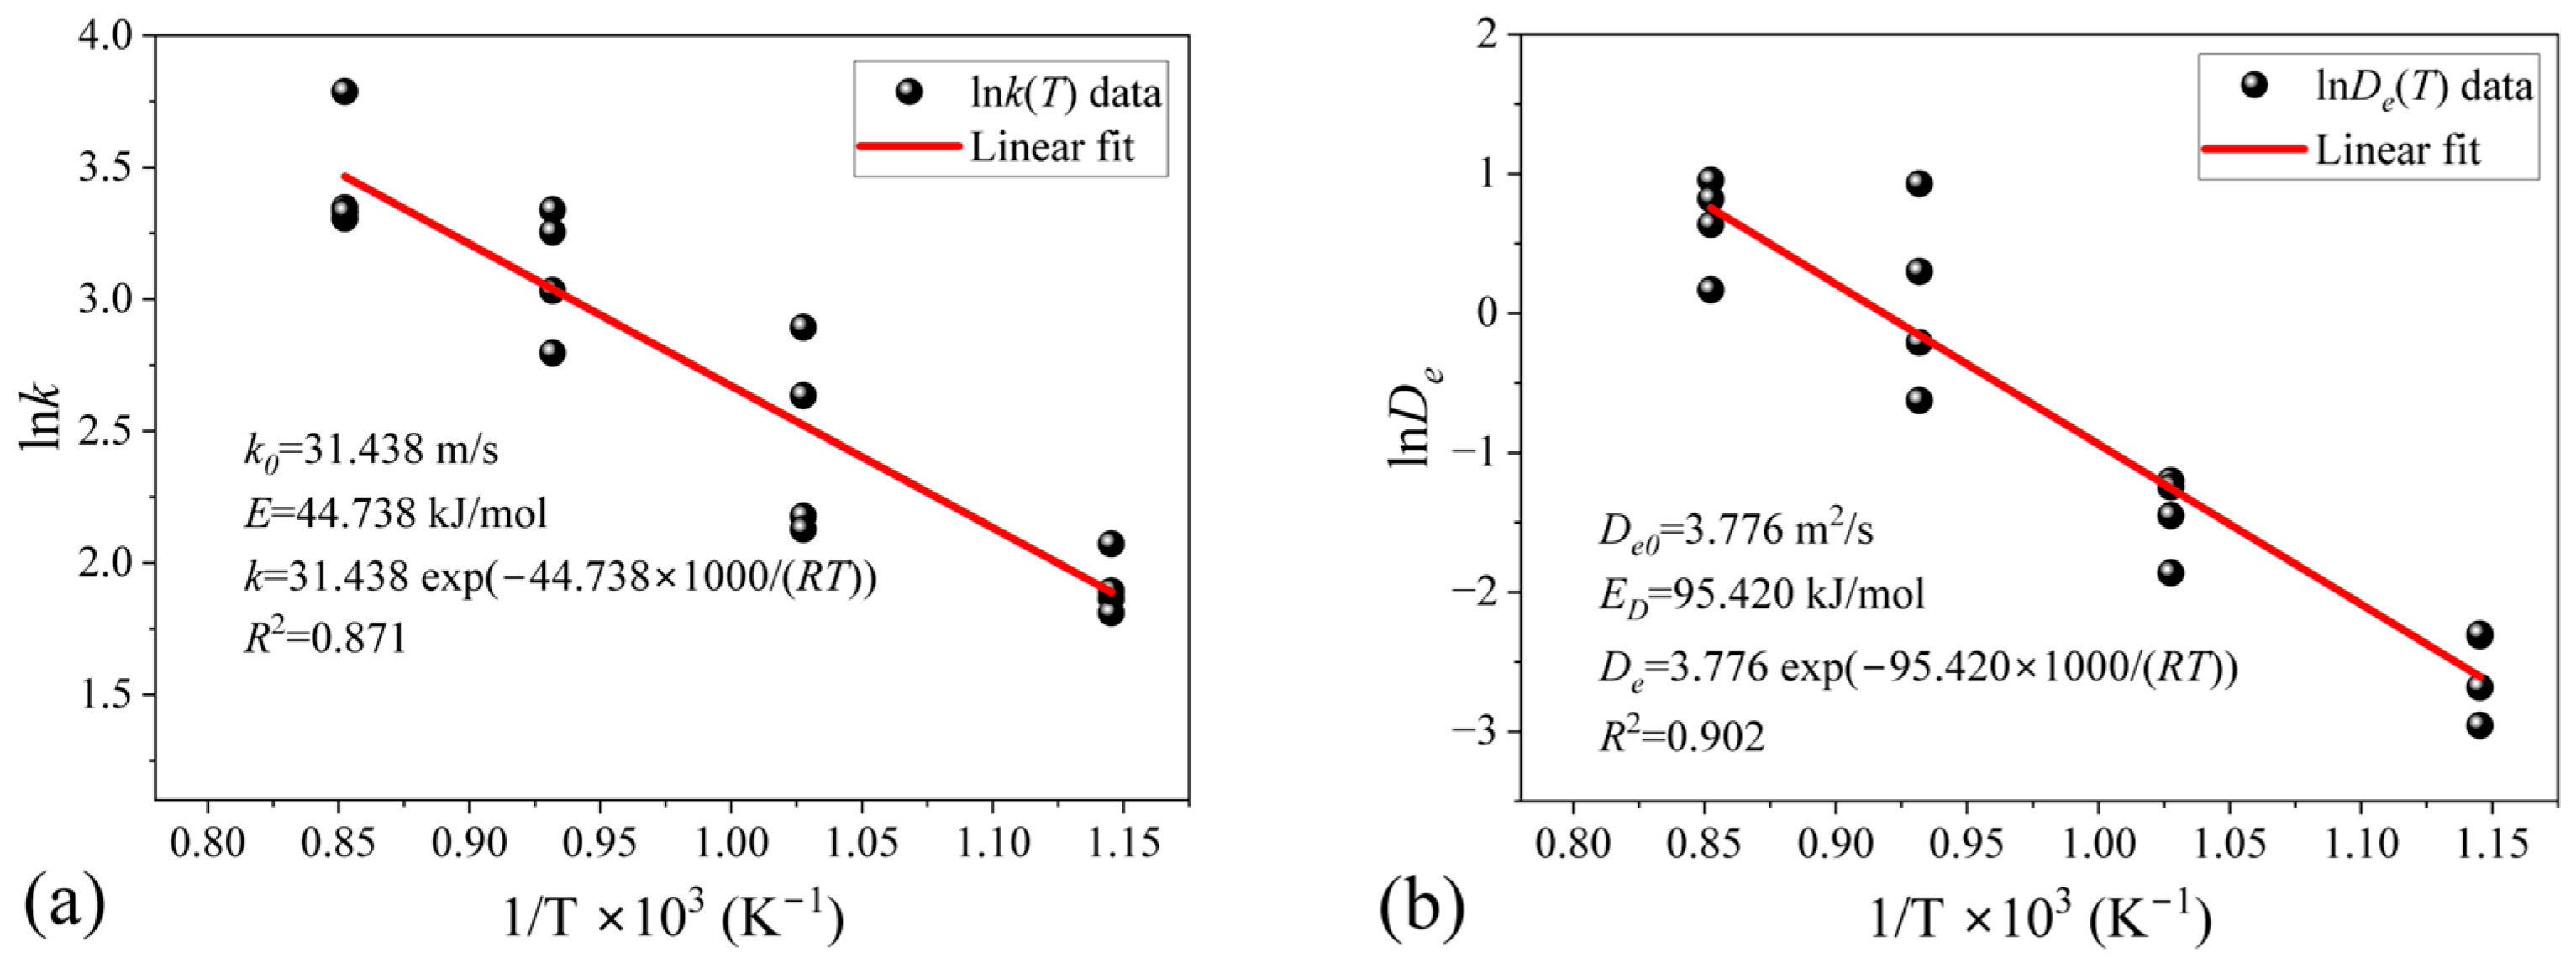
4.5. Determination of Intrinsic Kinetic Parameters

Based on the UCM for flat-plate particles, the apparent activation energy was determined from the slope of the plot of ln k versus 1/T, as shown in Figure 13a. The kinetic parameters for the hydrogen reduction of limonite were determined within a temperature range of 873 K to 1173 K and a hydrogen partial pressure range of 0.33 to 0.67 atm. The apparent activation energy was found to be 44.738 kJ/mol, and the pre-exponential factor was 31.438 m/s. Thus, the rate constant for the reduction of limonite can be obtained as k = 31 . 438 × e 44 . 738 × 1000 R T m s 1 .
Given that the temperature dependences of both the reaction rate constant (k) and the effective diffusion coefficient (De) conform to the Arrhenius equation, it follows that their pre-exponential factors and activation energies can be correlated through the following analysis.
k = k 0 e E R T
D e = D e 0 e E D R T
The following conclusion can be drawn: the apparent activation energy (Ea) is the arithmetic mean of the reaction activation energy (E) and the diffusion activation energy (ED).
E a = 1 2 E + E D
Based on the UCM for flat-plate particles, the diffusion coefficients De under various temperature and atmospheric conditions were calculated. Subsequently, the diffusion activation energy ED was derived using Equation (26), as demonstrated in Figure 13b. As shown in Figure 13b, the diffusion activation energy ED is 95.420 kJ/mol, and the reaction activation energy is 44.738 kJ/mol. By applying Equation (27), the apparent activation energy (Ea) was determined to be 70.079 kJ/mol, which is in good agreement with the apparent activation energy values presented in Figure 13.

4.6. The Prediction of Reduction Degree

For accurate prediction of the flash reduction kinetics of iron ore fines particles in a flash furnace, the unreacted core shrinking model for spherical geometry is adopted.
t = ρ 0 r 0 C b C e q r 0 6 D A B , e [ 1 3 ( 1 α ) 2 / 3 + 2 ( 1 α ) ] + 1 k [ 1 ( 1 α ) 1 / 3 ]
Equation (28) represents the total rate expression for a reaction involving spherical particles. The derivation of this equation explicitly accounts for three sequential steps: external mass transfer of the reducing gas to the particle surface, internal diffusion of the reactants through the product layer (or ash layer), and interfacial chemical reaction at the unreacted core boundary. For the binary diffusion coefficient of H2 and H2O in the gas phase (DH2O-H2), the Fuller–Schettler–Giddings (FSG) correlation is employed, defined as:
D H 2 O - H 2 = 1.0 × 10 7 T 1.75 1 M H 2 O + 1 M H 2 P v H 2 O 1 / 3 + v H 2 1 / 3 2 1 / 2
For Knudsen diffusion within particles, the following Equation is adopted
D K μ = 9.70 × 10 3 r T M A 1 / 2
where D K u is the Knudsen diffusion coefficient, cm2·s−1; r is the pore radius, cm; and MA is the molecular weight of the gas.
The effective diffusion coefficient within the particle is given by:
D A B , e = ε 2 / 1 D H 2 O - H 2 + 1 D K μ
Figure 14 and Figure 15 illustrate the time-dependent reduction degree (α) profiles of 25 μm and 50 μm limonite particles, as predicted by the UCM for flat-plate particles under varying reduction temperatures and hydrogen partial pressures. As shown in these figures, α exhibits a consistent trend with time across different hydrogen partial pressures: it increases sharply during the initial reaction stage and subsequently approaches a plateau.
Taking a hydrogen partial pressure of 0.1 atm as an example, Figure 14a illustrates that when the reaction temperature is raised from 1173 K to 1773 K for the same reaction time, the conversion rate increases dramatically. At a reaction time of 1.5 s, the conversion rate (α) rises from 0.18 to 0.41, indicating that within this temperature range, an increase in temperature accelerates the reduction reaction and enhances the reduction efficiency.
A comparison of Figure 14a–d reveals that as the hydrogen partial pressure increases from 0.1 atm to 0.7 atm, the conversion rate at the same reaction time and temperature rises with the increase in hydrogen partial pressure. Furthermore, at the same conversion rate, the reaction time decreases as the hydrogen partial pressure increases. Taking a hydrogen partial pressure of 0.7 atm as an example, Figure 14d demonstrates that as the reaction temperature increases from 1173 K to 1773 K at a constant reaction time (approximately 0.95 s), the conversion rate (α) rises from 0.6 to 0.95. This indicates that within this temperature range, an increase in hydrogen partial pressure significantly boosts the efficiency of the reduction reaction. At a temperature of 1673 K, when the conversion rate reaches 0.5, the required reaction times for hydrogen partial pressures (PH2) of 0.1, 0.3, 0.5, and 0.7 atm are 2.11 s, 0.70 s, 0.42 s, and 0.30 s, respectively.
A comparison of Figure 14 and Figure 15 indicates that when the particle size increases from 25 μm to 50 μm, the trend of the conversion rate (α) over time remains largely consistent across different hydrogen partial pressures, with only minor numerical variations. Similarly, it is observed that elevating the reaction temperature and hydrogen partial pressure is advantageous for enhancing the reduction effect. Furthermore, as the particle size increases, both the conversion rate and the required reaction time increase at a given temperature. For instance, at a temperature of 1673 K and a PH2 of 0.5 atm, for particles with sizes of 25 μm and 50 μm, the reaction times needed to attain the same conversion rate (0.5) are 0.42 s and 0.94 s, respectively. This is attributed to the fact that larger particle sizes reduce the reactive surface area and restrict the diffusion rate of hydrogen within the iron ore particles, consequently diminishing the efficiency of the reduction reaction and prolonging the time required to reach the same conversion rate.

4.7. The Prediction of Reduction Time

Figure 16 displays a contour plot that predicts the reaction time and temperature necessary for the complete reduction of limonite particles of various sizes to Fe metal particles at various hydrogen partial pressures (ranging from 0.1 to 1.0 atm), based on the UCM for flat-plate particles. In the figure, the blue lines represent a reduction time of 1.0 s, the red lines represent a reduction time of 2.0 s, and the green lines represent a reduction time of 5.0 s. As depicted in Figure 16, both particle size and reaction temperature have a significant impact on the reduction time. Specifically, Figure 16a indicates that, at a hydrogen partial pressure of 0.3 atm, fine limonite powder particles (20 μm) require 13.68 s for 100% reduction to metallic Fe at a low temperature (973 K), whereas the reduction time decreases to 2.98 s when the temperature is elevated to 1623 K. This reduction in time is attributed to the fact that increasing the reduction temperature accelerates the reaction rate, enhances hydrogen diffusion, and lowers the activation energy required for the reaction, as supported by kinetic studies. Consequently, the reduction process is facilitated, and the reduction time is further shortened. For limonite particles with a size of 40 μm, the time required for 100% reduction to metallic Fe at 973 K is 28.07 s, compared to 6.84 s at 1623 K. Doubling the particle size approximately doubles the reduction time, as larger particles necessitate a longer duration for hydrogen to penetrate their interior, thereby extending the reduction time accordingly. For large limonite particles (120 μm), the time needed for 100% reduction to metallic Fe at 1623 K is 31.07 s.
As illustrated in Figure 16b–f, when the hydrogen partial pressure is raised from 0.5 atm to 1 atm for 40 μm limonite particles undergoing reduction at a high temperature of 1623 K, the time required for the complete formation of metallic Fe is reduced from 4.11 s to 2.05 s. This reduction in time is attributed to the fact that an increase in hydrogen partial pressure accelerates the reduction rate, facilitates gas diffusion and penetration into the iron ore particle surfaces, and advances the hydrogen reduction reaction with the iron ore powder, thereby significantly shortening the overall reduction reaction time.

5. Conclusions

Leveraging thermal analysis testing technology and the kinetic principles of thermal analysis, this study examined the impacts of reduction temperature, particle size, and hydrogen partial pressure on the hydrogen reduction reaction process of limonite particles. By employing the isothermal kinetic principles of thermal analysis, the mechanism functions for limonite particles in various hydrogen concentration reduction environments were identified. Moreover, by utilizing the UCM for flat-plate particles, the kinetic parameters were obtained. The key conclusions are as follows:
(1)
The hydrogen reduction process of limonite particles is affected by multiple factors, including temperature, heating rate, hydrogen partial pressure, and particle size. Elevating the reduction temperature markedly accelerates the reduction reaction rate, whereas an increase in the heating rate shifts the reduction reaction to occur at higher temperatures. Furthermore, a rise in hydrogen partial pressure promotes a greater degree of reduction for limonite particles.
(2)
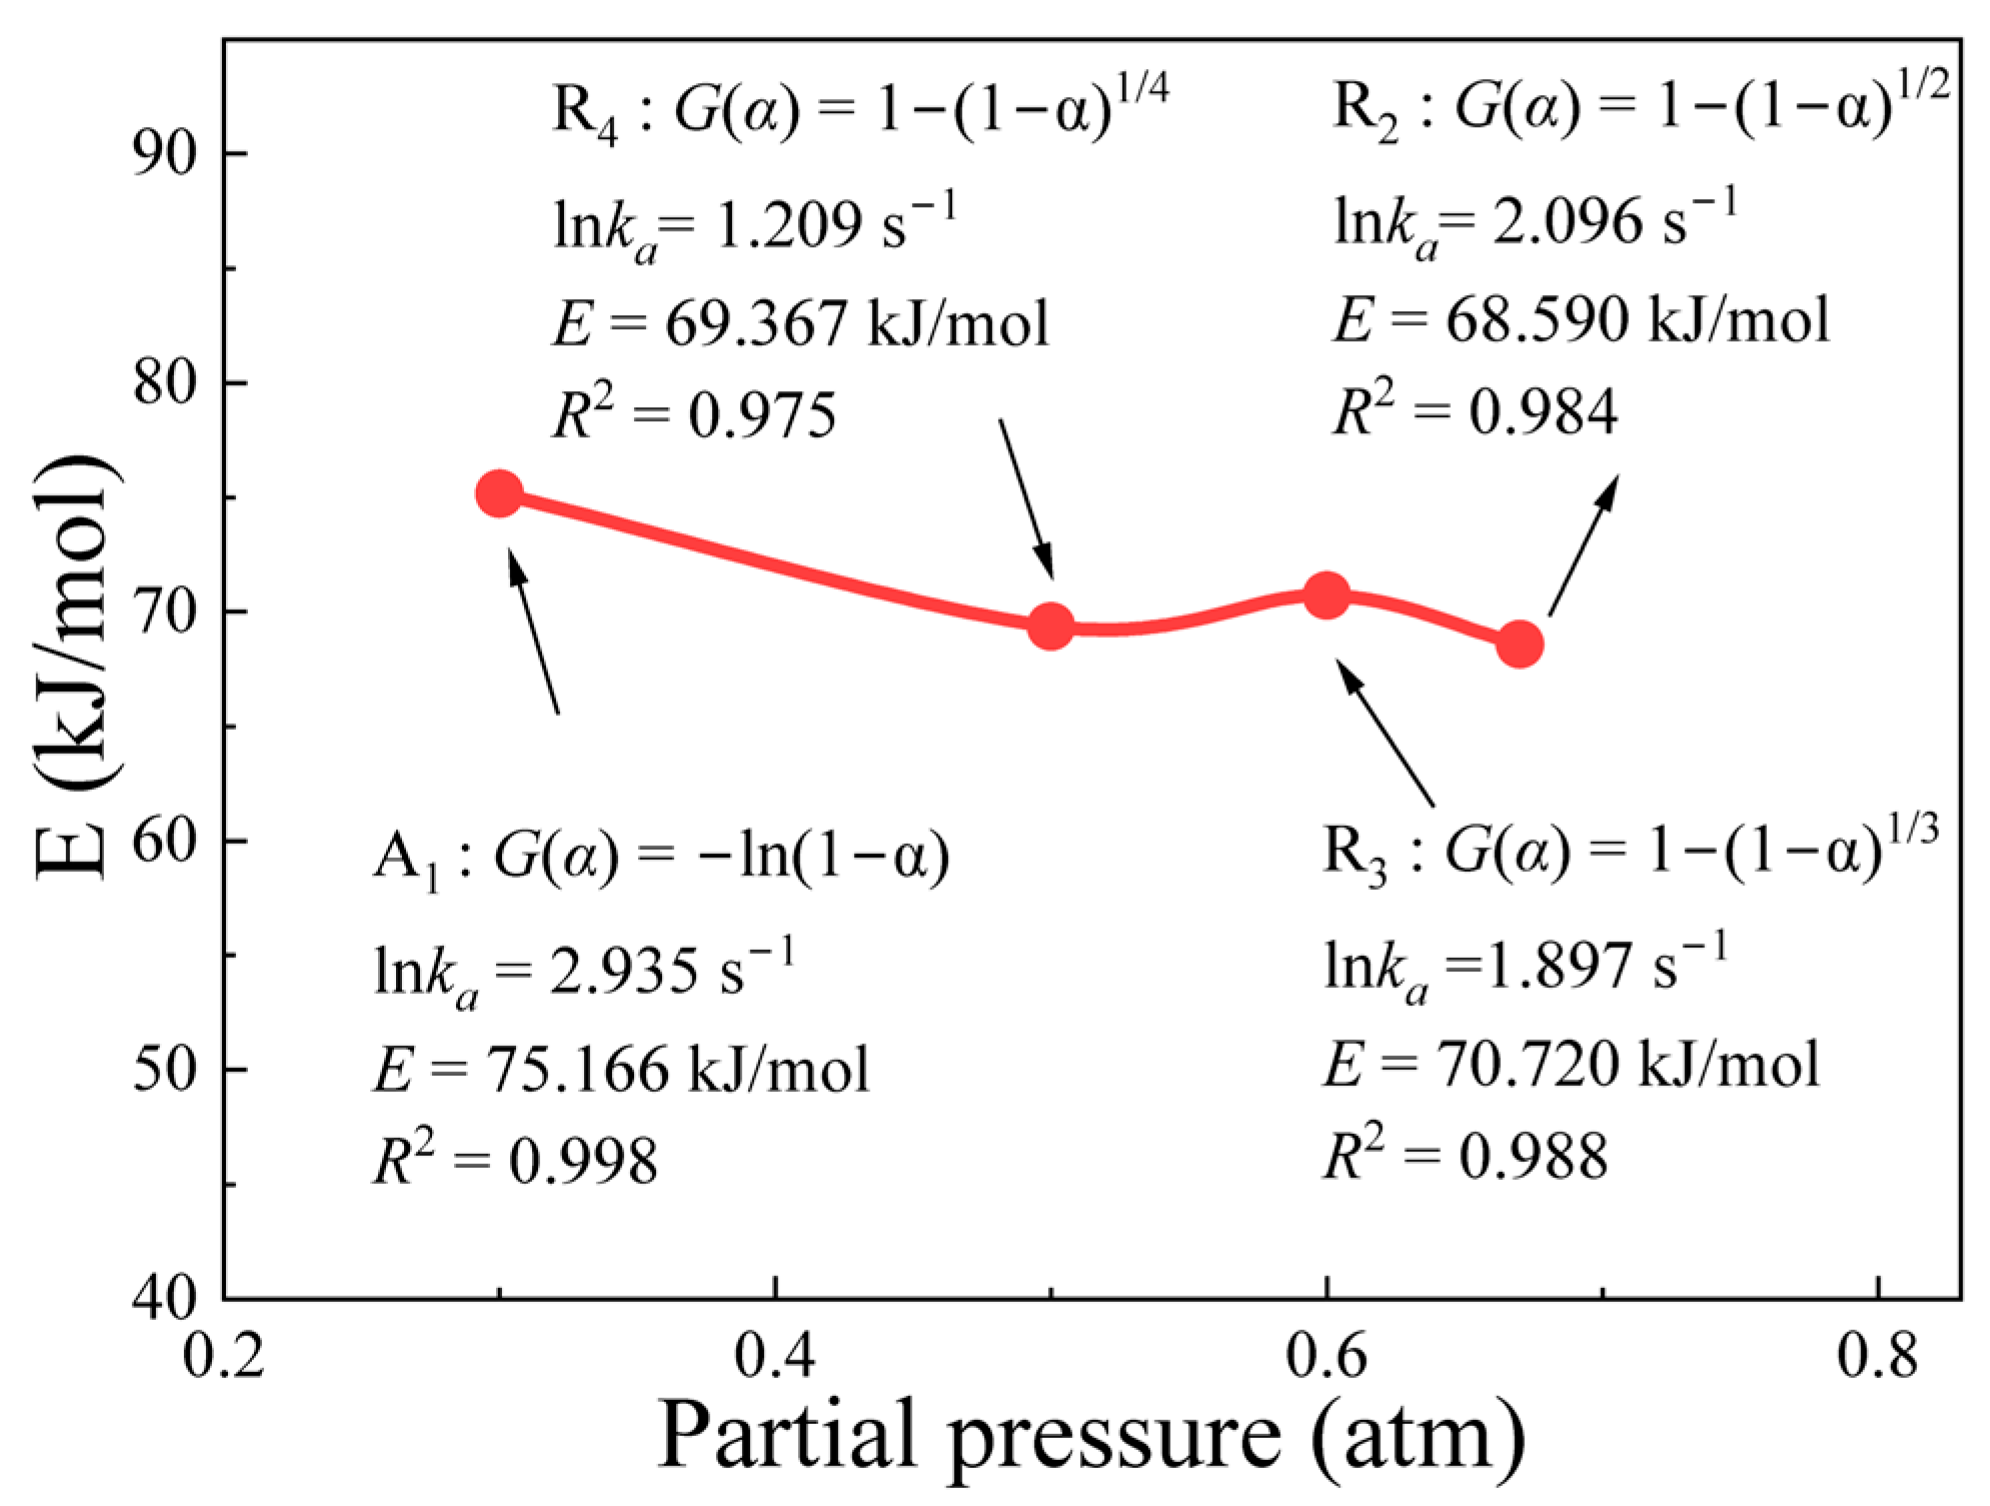
Based on the isothermal thermal analysis kinetic principles, the mechanism functions for limonite particles in reduction atmospheres with varying hydrogen concentrations were determined. The research findings reveal that hydrogen partial pressure significantly impacts the kinetic mechanism throughout the entire reduction process, despite the relatively minor differences in activation energy (ranging from 68.590 kJ·mol−1 to 75.166 kJ·mol−1). At low hydrogen partial pressures (0.33 atm), the kinetic mechanism of the limonite hydrogen reduction reaction predominantly follows the nucleation and nuclei growth model A1 ( ln ( 1 α ) ). At an intermediate hydrogen partial pressure of 0.50 atm, the reduction reaction is primarily governed by the geometric contraction model (R4, 1−(1−α)1/4). At a slightly higher intermediate hydrogen partial pressure of 0.60 atm, the reaction mechanism further transforms into the geometric contraction model (R3, −ln(1−α)). Under high hydrogen partial pressures (0.67 atm), the reduction reaction reverts to a geometric contraction model (R2, −ln(1−α)1/2).
(3)
Based on the UCM for flat-plate particles, the kinetic parameters for the hydrogen reduction of limonite were determined. The reaction activation energy is 44.738 kJ/mol, and the pre-exponential factor is 31.438 m/s. The rate constant for the hydrogen reduction of limonite is k = 31 . 438 × e 44 . 738 × 1000 R T m s 1 .
(4)
Contour plots were constructed to predict the reaction time and temperature required for the complete reduction of limonite particles of various sizes to Fe metal particles under hydrogen partial pressures ranging from 0.1 to 1.0 atm. These findings can offer valuable guidance for optimizing the hydrogen-based flash reduction process of limonite.

Author Contributions

Conceptualization, J.H. and J.L.; data curation, T.Y.; formal analysis, M.L.; funding acquisition, J.W.; investigation, J.L.; methodology, J.H.; project administration, J.W.; resources, F.L.; software, J.L.; supervision, F.L. and J.W.; validation, J.H., T.Y. and M.L.; visualization, J.L., F.L. and J.W.; writing—original draft, J.H. and J.L.; writing—review and editing, J.H., J.L. and T.Y. All authors have read and agreed to the published version of the manuscript.

Funding

This work is financially supported by the China Baowu Low Carbon Metallurgy Innovation Foundation (No. BWLCF202121), the Jiangxi Provincial Key Laboratory of High-Performance Steel and Iron Alloy Materials (No.2024SSY05041), the Program of Qingjiang Excellent Young Talents of Jiangxi University of Science and Technology (No. JXUSTQJYX2020016), and the Scientific Research Foundation of Jiangxi University of Science and Technology (No. 205200100517).

Data Availability Statement

The original contributions presented in this study are included in the article; further inquiries can be directed to the corresponding author.

Conflicts of Interest

The authors declare that they have no conflicts of interest.

References

  1. Ma, K.H.; Deng, J.Y.; Wang, G.; Zhou, Q.; Xu, J. Utilization and impacts of hydrogen in the ironmaking processes: A review from lab-scale basics to industrial practices. Int. J. Hydrog. Energy 2021, 46, 26646–26664. [Google Scholar] [CrossRef]
  2. Shangguan, F.Q.; Zhou, J.C.; Wang, H.F.; Li, X. Climate change and decarbonization development of steel industry. Iron Steel 2021, 56, 1–6. [Google Scholar] [CrossRef]
  3. He, K.; Wang, L.; Li, X.Y. Review of the energy consumption and production structure of China’s steel industry: Current situation and future development. Metals 2020, 10, 302. [Google Scholar] [CrossRef]
  4. Shahabuddin, M.; Brooks, G.; Rhamdhani, M.A. Decarbonisation and hydrogen integration of steel industries: Recent development, challenges and technoeconomic analysis. J. Clean. Prod. 2023, 395, 136391. [Google Scholar] [CrossRef]
  5. Yue, Q.; Chai, X.C.; Zhang, Y.J.; Wang, Q.; Wang, H.; Zhao, F.; Ji, W.; Lu, Y. Analysis of iron and steel production paths on the energy demand and carbon emission in China’s iron and steel industry. Environ. Dev. Sustain. 2023, 25, 4065–4085. [Google Scholar] [CrossRef]
  6. Wei, N.; Liu, S.N.; Jiao, Z.S.; Li, X.-C. A possible contribution of carbon capture, geological utilization, and storage in the Chinese crude steel industry for carbon neutrality. J. Clean. Prod. 2022, 374, 133793. [Google Scholar] [CrossRef]
  7. Zhang, X.Y.; Jiao, K.X.; Zhang, J.L.; Guo, Z. A review on low carbon emissions projects of steel industry in the world. J. Clean. Prod. 2021, 306, 127259. [Google Scholar] [CrossRef]
  8. Küster, F.; Scharm, C.; An, F.; Reinmöller, M.; Volkova, O.; Richter, A.; Guhl, S.; Gräbner, M. Direct reduction of iron ore pellets by N2/H2 mixture: In-situ investigation and modelling of the surface temperature during reduction progression. Miner. Eng. 2024, 215, 108827. [Google Scholar] [CrossRef]
  9. Elsherbiny, A.A.; Qiu, D.J.; Wang, K.; Li, M.; Ahmed, M.; Hammam, A.; Zhu, Y.; Song, W.; Galal, A.M.; Chen, H.; et al. Parametric study on hematite pellet direct reduction by hydrogen. Powder Technol. 2024, 435, 119434. [Google Scholar] [CrossRef]
  10. Fei, Y.; Guan, X.P.; Kuang, S.B.; Yu, A.; Yang, N. A review on the modeling and simulation of shaft furnace hydrogen metallurgy: A chemical engineering perspective. ACS Eng. Au 2024, 4, 145–165. [Google Scholar] [CrossRef]
  11. Boretti, A. The perspective of hydrogen direct reduction of iron. J. Clean. Prod. 2023, 429, 139585. [Google Scholar] [CrossRef]
  12. Ye, S.X.; Xie, Z.Y.; Wang, Y.; Wu, W.; Wang, R.; Zhang, Y.; Lu, X. New insights into the influence of hydrogen on important parameters of blast furnace. J. Clean. Prod. 2023, 425, 139042. [Google Scholar] [CrossRef]
  13. Metolina, P.; Ribeiro, T.R.; Guardani, R. Hydrogen-based direct reduction of industrial iron ore pellets: Statistically designed experiments and computational simulation. Int. J. Min. Met. Mater 2022, 29, 1908–1921. [Google Scholar] [CrossRef]
  14. Wang, L.; Guo, P.M.; Kong, L.B.; Zhao, P. Industrial application prospects and key issues of the pure-hydrogen reduction process. Int. J. Min. Met. Mater 2022, 29, 1922–1931. [Google Scholar] [CrossRef]
  15. Souza Filho, I.R.; Springer, H.; Ma, Y.; Mahajan, A.; da Silva, C.C.; Kulse, M.; Raabe, D. Green steel at its crossroads: Hybrid hydrogen-based reduction of iron ores. J. Clean. Prod. 2022, 340, 130805. [Google Scholar] [CrossRef]
  16. Zhao, J.; Zuo, H.B.; Wang, Y.J.; Wang, J.; Xue, Q. Review of green and low-carbon ironmaking technology. Ironmak. Steelmak. 2020, 47, 296–306. [Google Scholar] [CrossRef]
  17. Abdul Quader, M.; Ahmed, S.; Dawal, S.Z.; Nukman, Y. Present needs, recent progress and future trends of energy-efficient Ultra-Low Carbon Dioxide (CO2) Steelmaking (ULCOS) program. Renew. Sust. Energ. Rev. 2016, 55, 537–549. [Google Scholar] [CrossRef]
  18. Sun, M.; Pang, K.; Barati, M.; Meng, X. Hydrogen-based reduction technologies in low-carbon sustainable ironmaking and steelmaking: A review. J. Sustain. Metall. 2024, 10, 10–25. [Google Scholar] [CrossRef]
  19. Khani, M.; Ale Ebrahim, H.; Habibzadeh, S. A comprehensive random pore model kinetic study of hematite to iron reduction by hydrogen. Chem. Eng. Sci. 2023, 281, 119116. [Google Scholar] [CrossRef]
  20. Lyu, B.B.; Wang, G.; Yang, F.; Zuo, H.; Xue, Q.; Wang, J. Kinetic analysis of isothermal and non-Isothermal reduction of iron ore fines in hydrogen atmosphere. Metals 2022, 12, 1754. [Google Scholar] [CrossRef]
  21. Ali, M.L.; Fradet, Q.; Riedel, U. Kinetic mechanism development for the direct reduction of single hematite pellets in H2/CO atmospheres. Steel Res. Int. 2022, 93, 2200043. [Google Scholar] [CrossRef]
  22. Li, P.; Li, Y.; Yu, J.; Gao, P.; Han, Y. Kinetics and microstructural changes during fluidized reduction of magnetite with hydrogen at low temperatures. Int. J. Hydrog. Energy 2022, 47, 31140–31151. [Google Scholar] [CrossRef]
  23. Elzohiery, M.; Fan, D.Q.; Mohassab, Y.; Sohn, H.Y. Kinetics of hydrogen reduction of magnetite concentrate particles at 1623-1873 K relevant to flash ironmaking. Ironmak. Steelmak. 2021, 48, 485–492. [Google Scholar] [CrossRef]
  24. Wang, R.R.; Zhang, J.L.; Liu, Y.R.; Zheng, A.-Y.; Liu, Z.-J.; Liu, X.-L.; Li, Z.-G. Thermal performance and reduction kinetic analysis of cold-bonded pellets with CO and H2 mixtures. Int. J. Min. Met. Mater. 2018, 25, 752–761. [Google Scholar] [CrossRef]
  25. Elzohiery, M.; Sohn, H.Y.; Mohassab, Y. Kinetics of hydrogen reduction of magnetite concentrate particles in solid state relevant to flash ironmaking. Steel Res. Int. 2017, 88, 1600133. [Google Scholar] [CrossRef]
  26. Chen, F.; Mohassab, Y.; Jiang, T.; Sohn, H.Y. Hydrogen reduction kinetics of hematite concentrate particles relevant to a novel flash ironmaking process. Metall. Mater. Trans. B 2015, 46, 1133–1145. [Google Scholar] [CrossRef]
  27. Song, S.; Lu, S.; Lopez-Valdivieso, A. Magnetic separation of hematite and limonite fines as hydrophobic flocs from iron ores. Miner. Eng. 2002, 15, 415–422. [Google Scholar] [CrossRef]
  28. Lu, Y.; Wei, Z.; Wang, Y.; Zhang, J.; Li, G.; Zhang, Y. Research on the characteristics and kinetics of direct reduction of limonite ore fines under CO atmosphere in a rotary drum reactor. Powder Technol. 2019, 352, 240–250. [Google Scholar] [CrossRef]
  29. Tang, Z.; Li, P.; Gao, P.; Li, Y.; Han, Y. Minerals phase transformation by hydrogen reduction technology: A new approach to recycle iron from refractory limonite for reducing carbon emissions. Adv. Powder Technol. 2022, 33, 103870. [Google Scholar] [CrossRef]
  30. Jin, J.; Zhu, X.; Li, P.; Han, Y. Clean utilization of limonite ore by suspension magnetization roasting technology. Minerals 2022, 12, 260. [Google Scholar] [CrossRef]
  31. Wu, F.; Cao, Z.; Wang, S.; Zhong, H. Novel and green metallurgical technique of comprehensive utilization of refractory limonite ores. J. Clean. Prod. 2018, 171, 831–843. [Google Scholar] [CrossRef]
  32. Zhu, X.; Han, Y.; Liu, P.; Li, Y. Reduction mechanism of the porous hematite in limonite ore magnetization roasting. Miner. Process. Extr. Metall. Rev. 2024, 45, 85–90. [Google Scholar] [CrossRef]
  33. de Alvarenga Oliveira, V.; de Jesus Taveira Lana, R.; Da Silva Coelho, H.C.; Brigolini, G.J.S.; dos Santos, C.G. Kinetic studies of the reduction of limonitic nickel ore by hydrogen. Metall. Mater. Trans. B 2020, 51, 1418–1431. [Google Scholar] [CrossRef]
  34. Liu, P.; Zhu, X.; Han, Y.; Li, Y.; Gao, P. Fluidization magnetization roasting of limonite ore using H2 as a reductant: Phase transformation, structure evolution, and kinetics. Powder Technol. 2023, 414, 118107. [Google Scholar] [CrossRef]
  35. Sun, Y.; Zhu, X.; Han, Y.; Li, Y.; Gao, P. Iron recovery from refractory limonite ore using suspension magnetization roasting: A pilot-scale study. J. Clean. Prod. 2020, 261, 121221. [Google Scholar] [CrossRef]
  36. GB/T 6003.1-2022; Test Sieves-Technical Requirements and Testing-Part 1: Test Sieves of Metal Wire Cloth. Standards Press of China: Beijing, China, 2022.
  37. Dilmaç, N. Isothermal and non-isothermal reduction kinetics of iron ore oxygen carrier by CO: Modelistic and model-free approaches. Fuel 2021, 296, 120707. [Google Scholar] [CrossRef]
  38. Kwon, E.; Lee, J.; Han, J. Modified unreacted core model for reduction of manganese ore by CO gas. Met. Mater. Int. 2022, 28, 1517–1524. [Google Scholar] [CrossRef]
  39. Gou, L. Iron Ore Reduction Kinetics Model Considering Multicomponent Gas Diffusion. Master’s Thesis, Northeastern University, Shenyang, China, 2018. [Google Scholar]
  40. Yuan, Z.; Sohn, H.Y.; Olivas-Martinez, M. Re-oxidation Kinetics of Flash-Reduced Iron Particles in H2-H2O(g) Atmosphere Relevant to a Novel Flash Ironmaking Process. Metall. Mater. Trans. B 2013, 44, 1520–1530. [Google Scholar] [CrossRef]
Figure 1. XRD patterns of the limonite sample before and after heat treatment at 300 °C for 24 h.
Metals 15 00678 g001
Figure 2. Schematic diagram of the experimental apparatus.
Metals 15 00678 g002
Figure 3. Technical roadmap for solving isothermal kinetic parameters and determining the mechanistic function for hydrogen reduction of limonite particles.
Metals 15 00678 g003
Figure 4. The principles of the UCM for flat-plate particles, along with the technical roadmap for calculating the reaction rate constant, effective diffusion coefficient and predicting reduction time.
Metals 15 00678 g004
Figure 5. Thermogravimetric and reduction degree curves of limonite at different temperatures with hydrogen partial pressure (PH2) of 0.67 atm: (a) thermogravimetric curves, (b) reduction degree curves.
Metals 15 00678 g005
Figure 6. Thermogravimetric curves of limonite as a function of time under different particle sizes and reduction temperatures with hydrogen partial pressure (PH2) of 0.67 atm.
Metals 15 00678 g006
Figure 7. Weight loss curves of limonite particles during reduction at 700 °C under different hydrogen partial pressures.
Metals 15 00678 g007
Figure 8. Linear fitting results of various models at different temperatures under a hydrogen partial pressure (PH2) of 0.33 atm: (a) nucleation and nuclei growth models, (b) geometric contraction models, (c) diffusion model, and (d) power laws and reaction order models.
Metals 15 00678 g008
Figure 9. Linear fitting results of various models at different temperatures under a hydrogen partial pressure (PH2) of 0.50 atm: (a) nucleation and nuclei growth models, (b) geometric contraction models, (c) diffusion model, and (d) power laws and reaction order models.
Metals 15 00678 g009
Figure 10. Linear fitting results of various models at different temperatures under a hydrogen partial pressure (PH2) of 0.60 atm: (a) nucleation and nuclei growth models, (b) geometric contraction models, (c) diffusion model, and (d) power laws and reaction order models.
Metals 15 00678 g010
Figure 11. Linear fitting results of various models at different temperatures under a hydrogen partial pressure (PH2) of 0.67 atm: (a) nucleation and nuclei growth models, (b) geometric contraction models, (c) diffusion model, and (d) power laws and reaction order models.
Metals 15 00678 g011
Figure 12. Variation curves of kinetic parameters and mechanism functions for limonite under various hydrogen partial pressure conditions.
Metals 15 00678 g012
Figure 13. Linear fit plot of lnk and lnDe versus 1/T based on an UCM for flat-plate particles. (a) reaction kinetic parameters, and (b) diffusion kinetic parameters.
Metals 15 00678 g013
Figure 14. The conversion profiles (α) of 25 μm limonite particles plotted against time under varying reduction temperatures and hydrogen partial pressures obtained through calculations using the UCM for flat-plate particles: (a) 0.1 atm, (b) 0.3 atm, (c) 0.5 atm, and (d) 0.7 atm.
Metals 15 00678 g014
Figure 15. The conversion profiles (α) of 50 μm limonite particles plotted against time under varying reduction temperatures and hydrogen partial pressures obtained through calculations using the UCM for flat-plate particles: (a) 0.1 atm, (b) 0.3 atm, (c) 0.5 atm, and (d) 0.7 atm.
Metals 15 00678 g015
Figure 16. Contour plot predicting the time required for complete (100%) reduction of limonite particles of various sizes under different hydrogen partial pressures (PH2): (a) 0.1 atm, (b) 0.3 atm, (c) 0.5 atm, (d) 0.7 atm, (e) 0.9 atm, and (f) 1.0 atm.
Metals 15 00678 g016
Table 1. Chemical composition of iron ore particles.
CompostionTFeFe2O3SiO2CaOMgOAl2O3P2O5SO3Na2OTiO2MnOCo3O4
Content
(wt%)
62.3589.156.190.100.183.560.120.120.200.130.070.15
Table 2. Corresponding flow rates of working gas and protective gas under different hydrogen partial pressure conditions.
Hydrogen Partial Pressure (atm)Flow Rate of the Protective Gas (N2) (mL·min−1)Flow Rate of the Working Gas (H2) (mL·min−1)Total Flow Rate of the Mixed Gas (mL·min−1)Total Gas Pressure (atm)
0.334020601.0
0.504040801.0
0.6040601001.0
0.6740801201.0
Disclaimer/Publisher’s Note: The statements, opinions and data contained in all publications are solely those of the individual author(s) and contributor(s) and not of MDPI and/or the editor(s). MDPI and/or the editor(s) disclaim responsibility for any injury to people or property resulting from any ideas, methods, instructions or products referred to in the content.

