Abstract
Variations in the warm formability of AA7075 sheets are primarily attributed to differences in precipitate morphology resulting from distinct thermal histories. To better understand this relationship, this study systematically investigates the influence of precipitate characteristics—quantified by the product of precipitate volume fraction and average radius—on forming limits across various thermal routes in warm forming processes. A modified Cockcroft–Latham ductile fracture model incorporating this microstructural parameter was developed, calibrated against experimental data from warm isothermal Nakajima tests, and implemented within a finite element framework. The proposed model enables the accurate prediction of forming limit curves with minimal experimental effort, thereby significantly reducing the reliance on extensive mechanical testing. Building upon the validated FE model, a practical methodology for rapid R-value estimation under warm forming conditions was established, involving the design of specimen geometries optimised for isothermal Nakajima testing. This approach achieved R-value predictions within 5% deviation from conventional uniaxial tensile test results. Furthermore, experimental results indicated that AA7075 sheets exhibited nearly isotropic deformation behaviour under retrogression warm forming conditions. Overall, the methodology proposed in this study bridges the gap between formability prediction and process simulation, offering a robust and scalable framework for the industrial optimisation of warm forming processes for high-strength aluminium alloys.
1. Introduction
The AA7075 aluminium alloy, known for its high specific strength and excellent recyclability, is considered a promising lightweight material for carbon reduction efforts and has garnered increasing attention in the automotive industry for structural applications [1]. However, its inherently limited formability at room temperature significantly restricts its broader adoption, particularly in the manufacturing of complex-shaped structural components. To address this limitation, various forming techniques have been developed to improve the formability of AA7075 alloys at elevated temperatures.
Warm forming of AA7075 alloy sheets within the temperature range of 180–250 °C has been demonstrated to significantly enhance formability, thereby supporting the feasibility of processing high-strength aluminium alloys under elevated temperature conditions [2]. However, precipitate coarsening during forming, compounded by the subsequent paint-bake (PB) treatment, significantly degrades the material’s strength, thereby preventing the formed components from meeting the structural performance requirements specified by designers.
To address this issue, various warm forming strategies have been developed by integrating tailored pre-treatments, controlled forming temperatures, and carefully designed post-forming treatments to optimise the final mechanical performance. Ivanoff et al. [3] examined the integration of retrogression and re-ageing (RRA) treatment into the warm forming process as a strategy to mitigate strength loss in AA7075-T6 warm-formed parts. With optimised forming parameters, the material demonstrated a twofold increase in ductility compared to cold forming, and the post-forming strength was successfully restored to levels comparable to the original T6 condition following PB treatment. Kumar et al. [4] investigated the warm forming process parameters for AA 7xxx sheets subjected to various pre-ageing (PA) treatments, analysing the effects of different processing conditions on ductility and post PB mechanical properties. The results demonstrated that, under appropriate forming conditions, ductility was markedly enhanced, while the strength loss following PB treatment was limited to within 5% of the original T6 condition. Additionally, the study highlighted those variations in PA conditions, which alter the characteristics of matrix precipitates (MPts), significantly influence the warm ductility of Al–Zn–Mg–Cu aluminium alloy sheets. A novel warm forming process, referred to as ageing warm forming (AWF), was proposed in the authors’ previous study [5]. In this process, W-tempered AA7075 sheets are heated to the target forming temperature and held to complete the initial stage of artificial ageing prior to deformation. The subsequent PB treatment enables the formed part to achieve approximately 93% of the T6 strength. Compared to retrogression warm forming (RWF) and pre-aged warm forming (PAWF), AWF significantly improves formability and work-hardening behaviour, primarily due to differences in matrix precipitate (MPt) characteristics.
The forming limit diagram (FLD), initially proposed by Keeler and Backofen and refined by Goodwin [6], remains a standard tool for predicting fracture in sheet metal forming. Nakajima tests are widely employed to determine the critical strains required for constructing forming limit curves (FLCs) at room temperature (RT), and their applicability has since been extended to elevated temperature conditions. Feister et al. [7] established the FLD for AA7075-T6 sheets through Nakajima tests conducted between RT and 220 °C. The resulting FLD was subsequently utilised in the forming analysis of side beams, demonstrating the accurate prediction of surface cracking when combined with bending failure considerations.
Determining FLCs requires extensive testing across multiple strain paths, making the process costly and time-consuming. This challenge becomes more critical at elevated temperatures, where predictive models are commonly employed to reduce experimental complexity. Among these, the Marciniak–Kuczynski (M–K) model [8], which attributes fracture to diffuse necking, remains one of the most widely adopted approaches for predicting FLCs in aluminium alloy sheets under elevated temperatures. Chen et al. [9] and Zhou et al. [10] employed the M–K model, combined with various yield criteria and the Fields–Backofen equation, to predict the FLCs of AA5182 and AA2060 sheets under elevated temperatures and different strain rates. The model effectively captured the forming limits of aluminium sheets across these conditions. Although the M–K model remains effective, its predictive accuracy is highly sensitive to the calibration of initial geometric imperfections, which significantly impact FLC estimation and constitute a major limitation. Moreover, a previous study [11] has shown that AA7075 sheets exhibit predominantly diffuse deformation with minimal localised necking under warm forming conditions at high strain rates (≥0.1 s−1). As fractures can occur before the onset of visible necking, conventional necking-based models might lose predictive reliability. Therefore, ductile fracture criteria that incorporate stress state and damage accumulation are more suitable for failure prediction under such conditions.
The Cockcroft and Latham (C&L) criterion [12] is a widely used model for predicting the ductile fracture strain limit of sheet metals and has demonstrated reasonable accuracy across various forming conditions. However, traditional C&L predictions often underestimate forming limits under biaxial tensile conditions (i.e., the first quadrant of the FLD) [13]. To address this limitation, several modified versions of the C&L criterion have been developed, showing improved accuracy in predicting fracture strains. Atkins et al. [14] modified the C&L criterion by incorporating strain path effects based on experimental observations, suggesting that strain path dependency should be considered when predicting forming limits in sheet metal forming. Zhuang [15] developed a strain-path-dependent modification of the C&L criterion by introducing the strain ratio (ρ), enabling accurate predictions of FLCs across both the first and second quadrants for steel sheets of varying thicknesses, and highlighting the critical role of strain path sensitivity in energy-based ductile fracture criteria. Its reliability has been validated under various forming conditions, consistently demonstrating high accuracy in simulation-based applications. Building upon Zhuang’s framework, Lee et al. [16] extended the modified C&L criterion to hot stamping conditions for 22MnB5 steel by integrating it into a Gleeble simulator-based experimental-numerical methodology. The study predicted FLCs at various heating temperatures (650 to 850 °C) using specimens designed to isolate different strain paths. Although the model did not explicitly incorporate temperature-dependent parameters, it implicitly captured thermal effects through microstructural and mechanical responses—such as the variation in strain path and matrix strength—as temperature altered the material’s deformation characteristics. These effects were reflected in the accumulated strain energy reaching the fracture threshold C, thus enabling accurate temperature-sensitive formability predictions without direct thermal terms. Efforts have also been made to enhance the C&L model by incorporating microstructural characteristics. Chen et al. [17] modified the normalised C&L model using the thickness-to-grain-size (T/D) ratio to predict microscale sheet forming limits, achieving strong alignment with the experimental results. These developments underscore the effectiveness of incorporating strain path sensitivity and microstructural parameters into ductile fracture models for accurate FLC prediction under diverse forming conditions.
The incorporation of plastic flow models and fracture criteria into FE frameworks has become a widely adopted and effective strategy for predicting deformation and failure during process development and design. Wiesenmayer et al. [18] developed a thermo-mechanically coupled FE model in LS-DYNA, incorporating the GISSMO criterion to simulate temperature-dependent fracture behaviour, successfully predicting joint geometry and fracture locations during the shear-clinching of 7xxx aluminium sheets subjected to localised heat treatment, while also capturing the effects of thermal softening on material flow. Grabner et al. [19] employed LS-DYNA with a GISSMO model calibrated through tensile tests to simulate the warm forming of pre-aged 7xxx alloys, achieving accurate predictions of the deep drawing behaviour of AA7075 and AA7021+ at 120 °C and 160 °C, in strong alignment with the experimental data. Zhou et al. [10] incorporated the M–K model into an FE framework to simulate the hot forming of AA2060 sheets, accurately predicting fracture locations, forming defects, and material deformation behaviour, thereby demonstrating its potential for the comprehensive prediction of material response under hot forming conditions.
The authors’ previous research [5], along with existing studies, has shown that the MPts in AA7075 sheets affect both post-formed strength and deformation behaviour under warm forming conditions. However, their direct influence on formability remains insufficiently understood. Furthermore, FE models incorporating fracture criteria have been demonstrated to effectively predict the forming behaviour of sheet materials at elevated temperatures. In industrial applications, such models assist in identifying suitable warm forming conditions during the design phase by evaluating material deformation behaviour. Nevertheless, overly complex fracture modelling approaches may hinder practical implementation in industrial settings. Therefore, there is a critical need for fracture models that can be rapidly developed and can reliably predict material failure, enabling more efficient application in manufacturing environments. Accordingly, the warm formability of AA7075 sheets subjected to different heat treatments is investigated through warm isothermal Nakajima tests conducted under optimised process parameters identified in previous studies. In addition, critical MPts features influencing warm formability are identified by correlating microstructural characteristics with the warm forming limits determined in the present study. Based on the experimental results, a new model incorporating the MPt characteristics of AA7075 sheets is developed, based on the Zhuang criterion, to predict forming limits under various warm forming conditions. After validating its predictive accuracy through comparison with experimental results, the proposed model is integrated into the FE simulation of the RWF processing condition to develop a new approach for the rapid determination of the Lankford coefficient using isothermal Nakajima tests, thereby ensuring suitability for industrial applications.
2. Materials and Methods
2.1. Material
The AA7075 alloy sheets in the T6 condition, with a thickness of 2 mm, were employed as the experimental material in this study. The sheets were supplied by Austria Metall AG (AMAG, Ranshofen, Austria), and the chemical composition is provided in Table 1. The yield strength (YS) and ultimate tensile strength (UTS) of the as-received material are 543.9 MPa and 582.8 MPa, respectively, with a fracture elongation of 7%.

Table 1.
Chemical composition of as-received AA7075-T6 sheets (mass contents in %; Bal. = Balance).
2.2. Experimental Temperature Profile
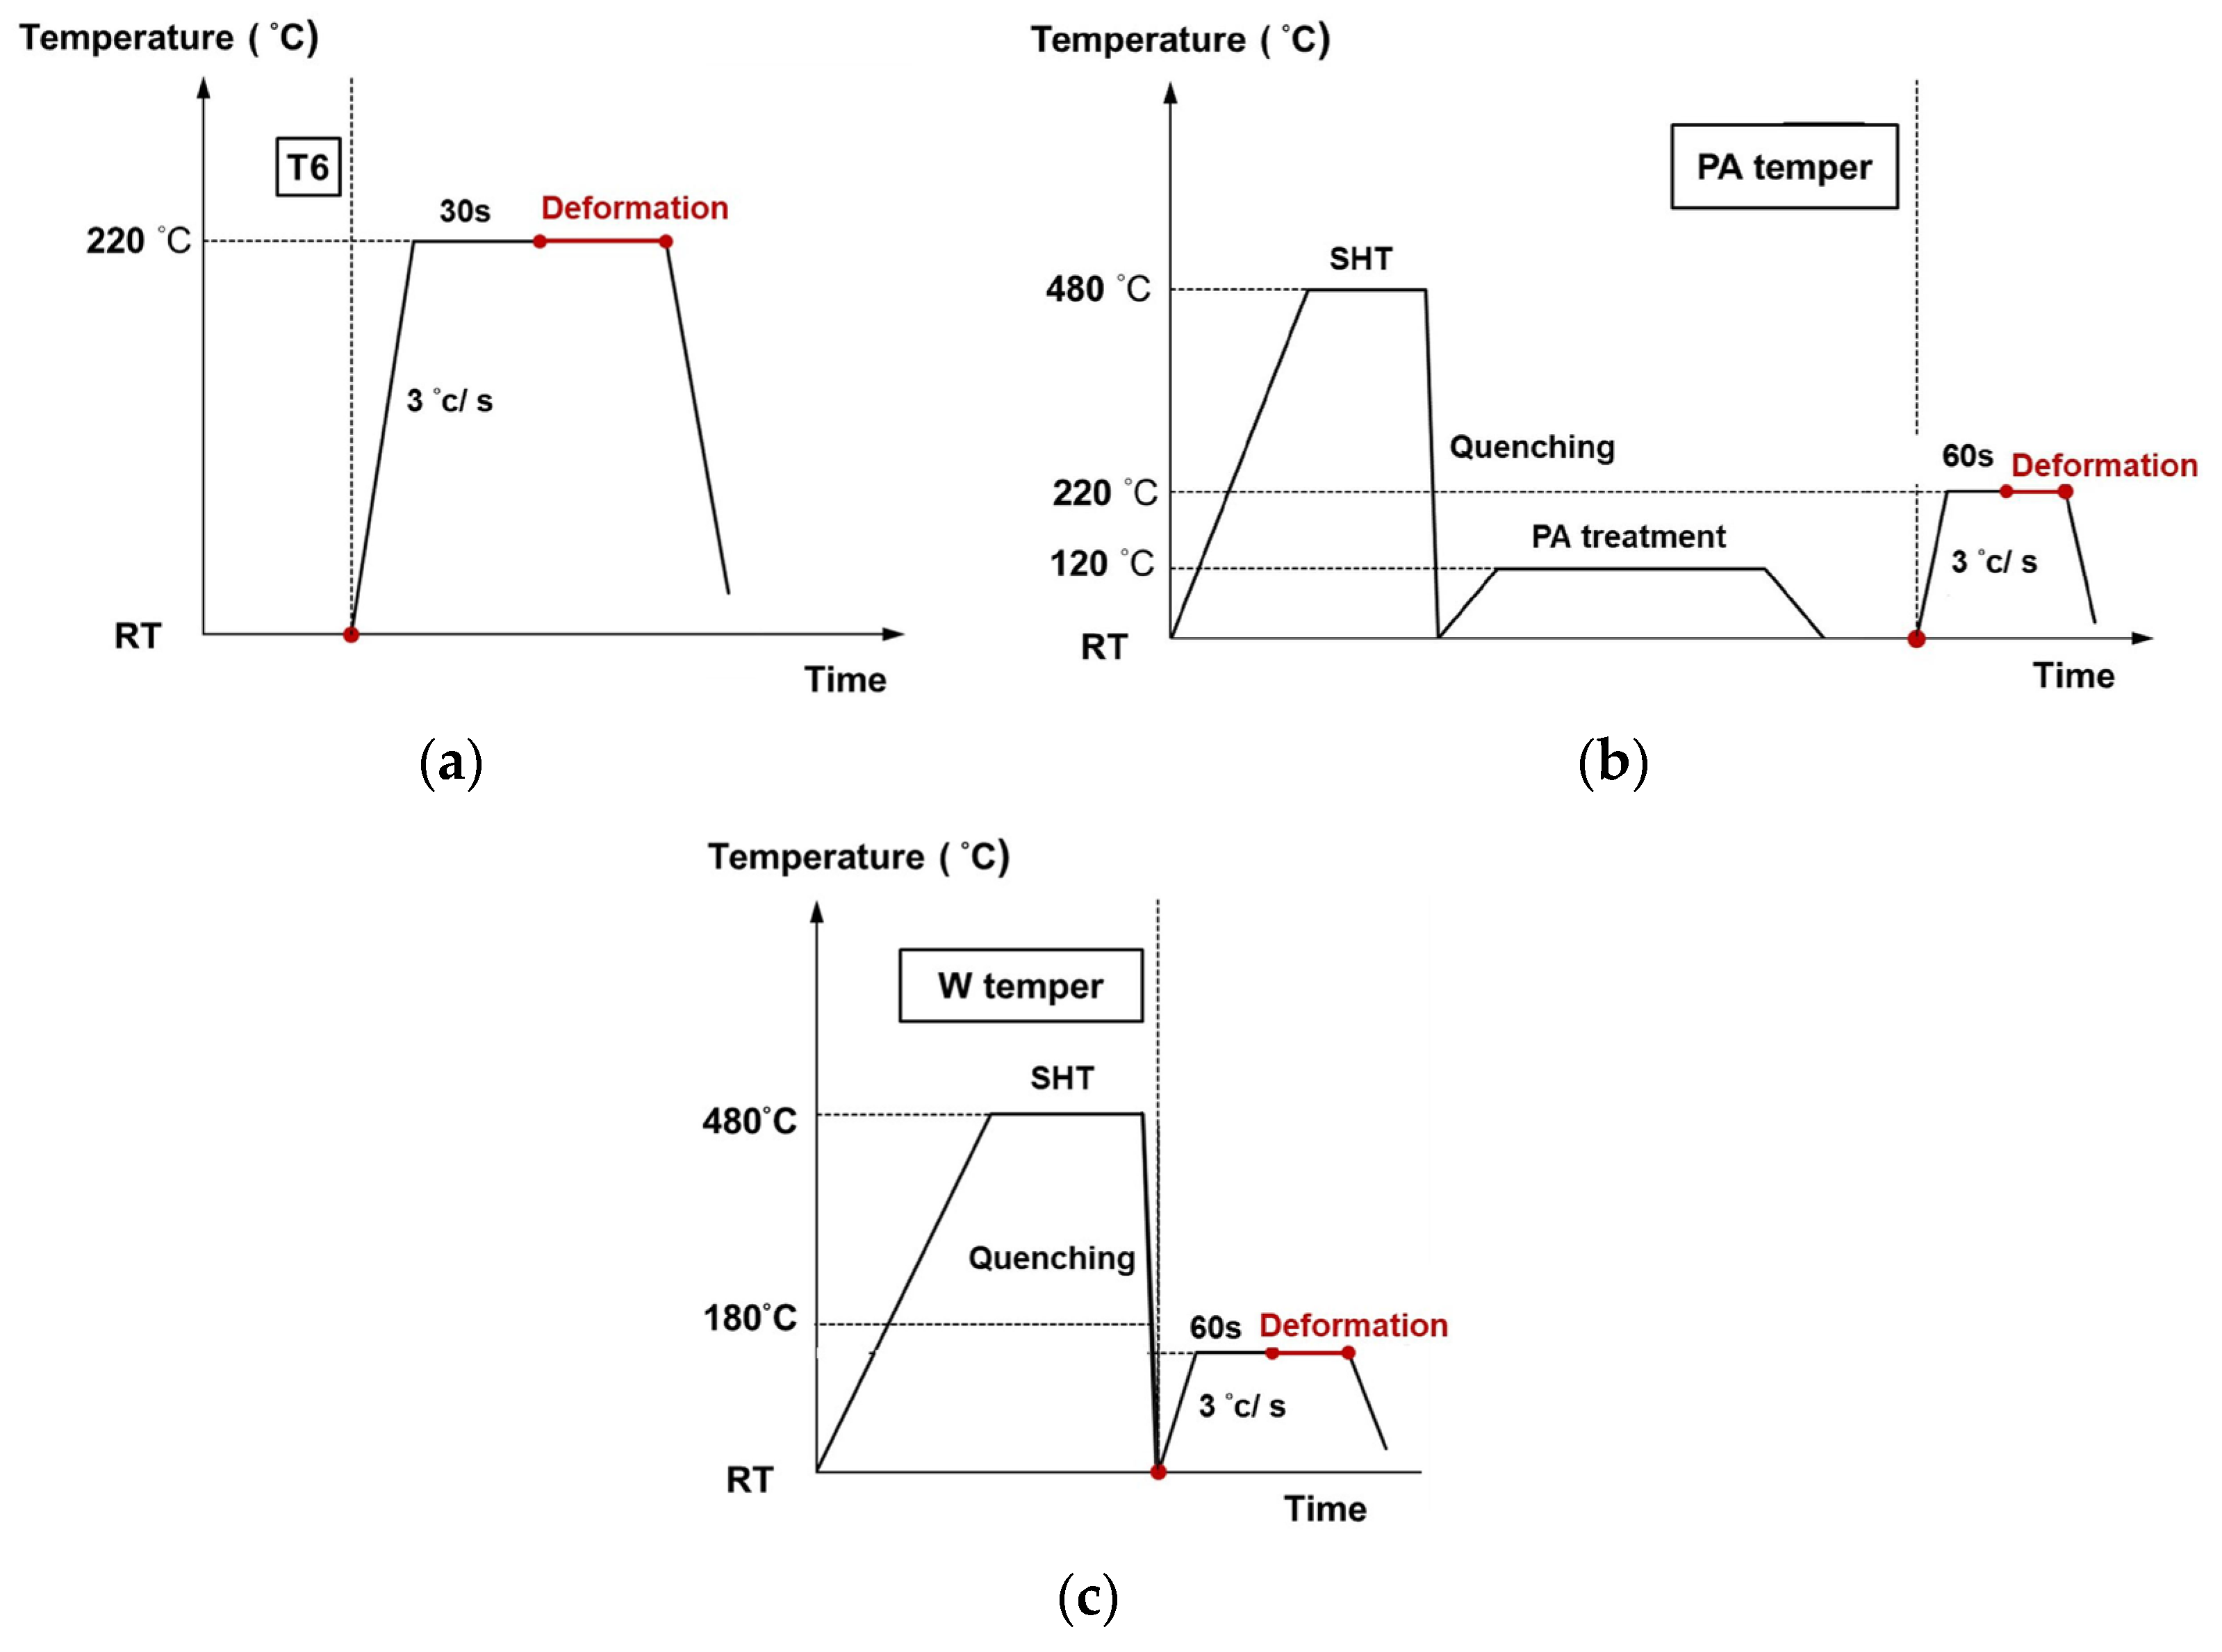
Figure 1 illustrates the experimental temperature profiles for the RWF, PAWF, and AWF processes. The process parameters were selected based on optimised conditions for RWF [3], PAWF [20], and AWF [5], as established in previous studies, with the aim of enhancing warm formability while limiting post PB strength loss to within 10% of the as-received AA7075-T6 condition.

Figure 1.
Experimental temperature profile of (a) RWF, (b) PAWF, and (c) AWF processes.
2.3. Forming Limit Tests Under Various Warm Forming Processes
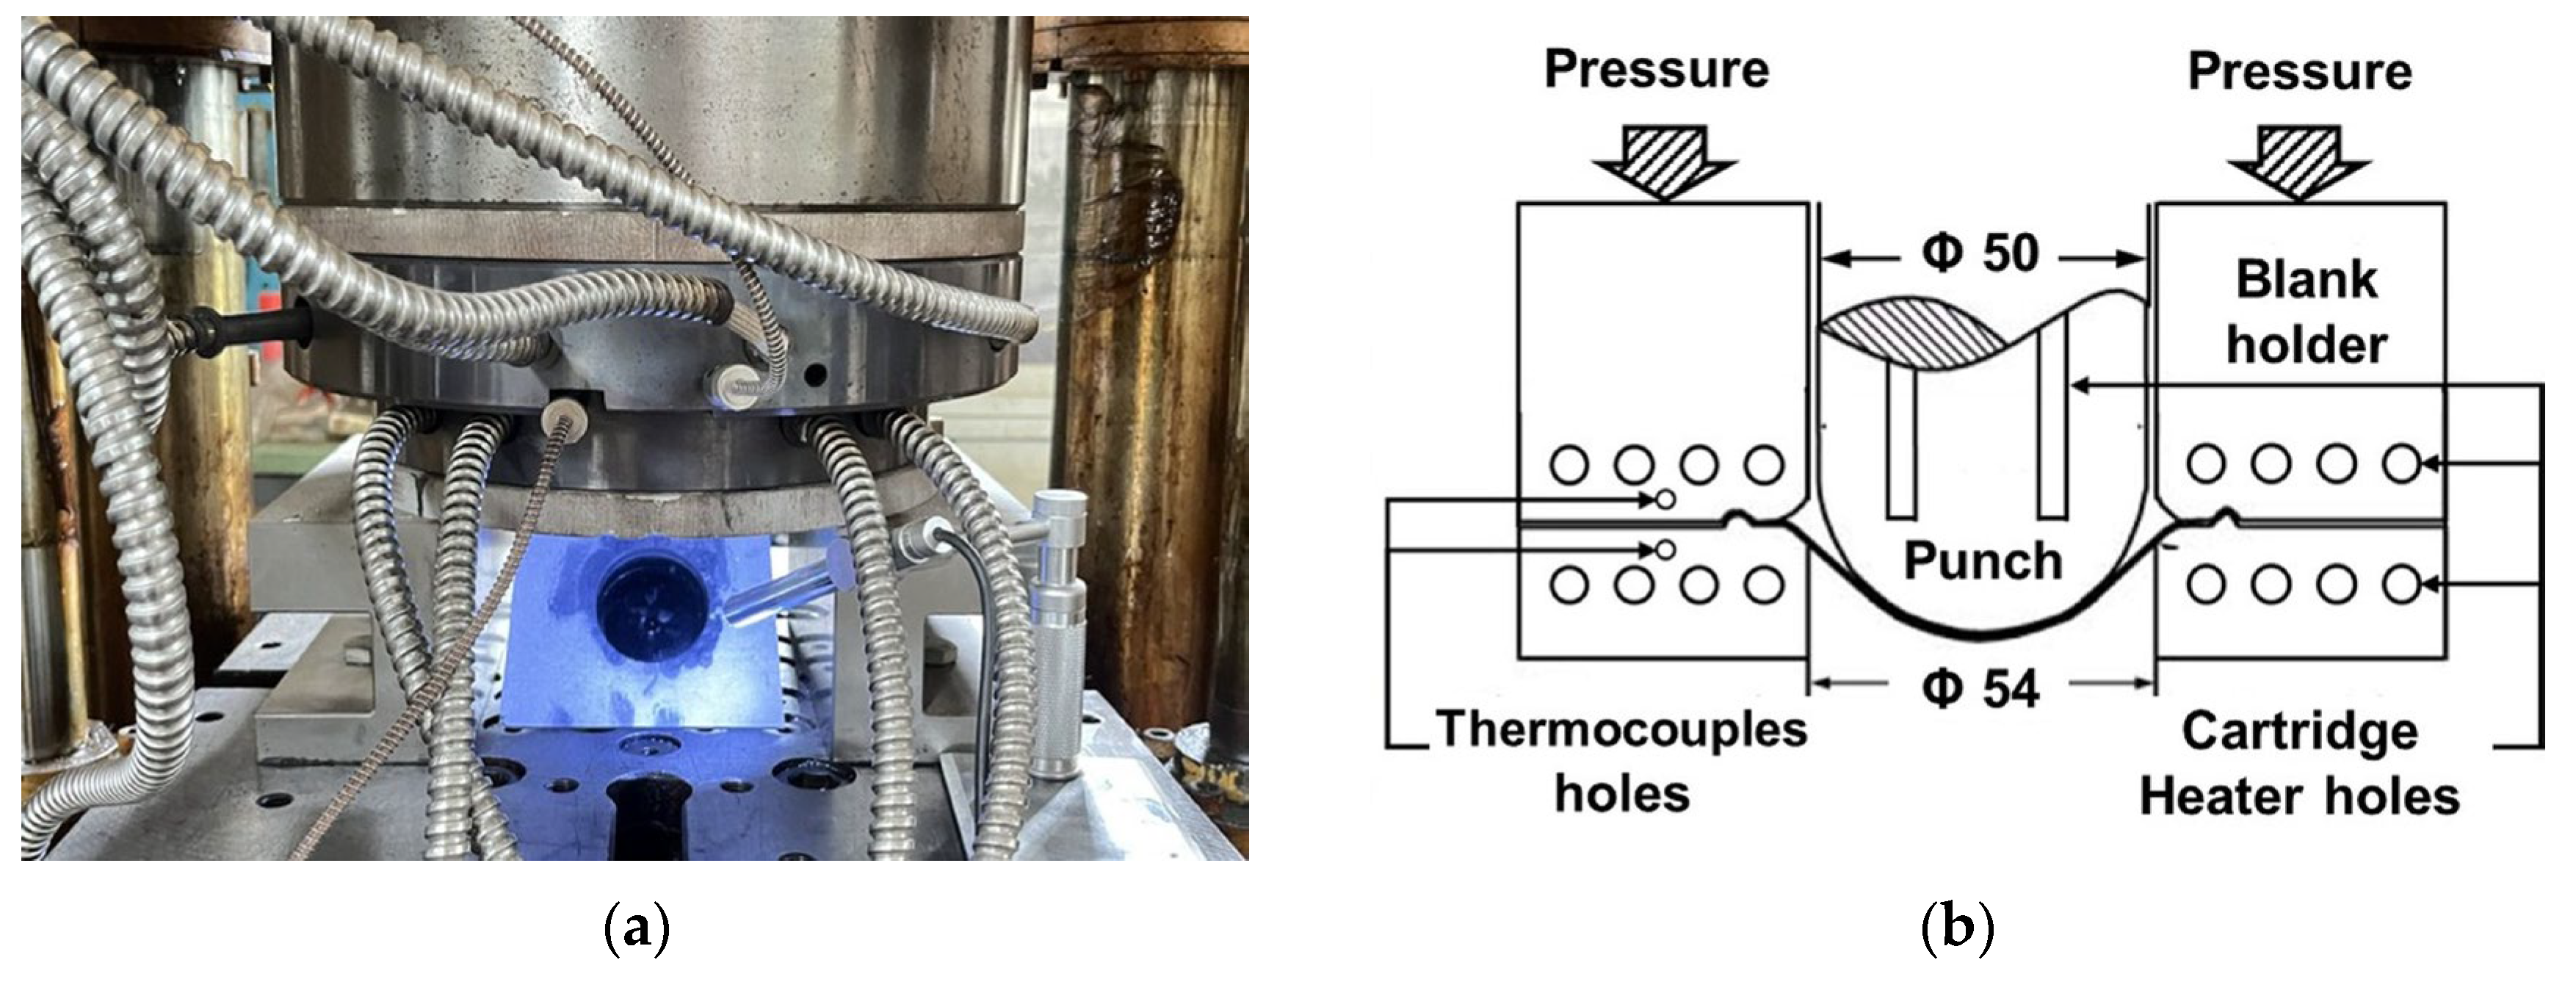
Warm isothermal Nakajima tests for the various warm forming processes were conducted using an 80-ton hydraulic press (Amino UTM-855, Shizuoka Prefecture, Fujinomiya City, Japan). The forming tool system setup is shown in Figure 2. The tooling system was preheated to the target temperature using integrated electric resistance heating cartridges, with the temperature precisely controlled via embedded thermocouples. The system was maintained at the desired temperature throughout the forming process to ensure isothermal conditions.

Figure 2.
Forming tool system setup for isothermal warm Nakajima tests: (a) Experimental configuration; (b) Tooling geometry (unit: mm).
Four Nakajima test specimens with varying widths were designed to generate different strain paths for constructing FLCs, as shown in Figure 3. The major strain direction was aligned with the rolling direction (RD), and 2.5 mm square grids were etched onto the specimen surfaces. Prior to testing, an oil-based graphite lubricant was applied to the specimen surfaces in contact with the punch to reduce friction.
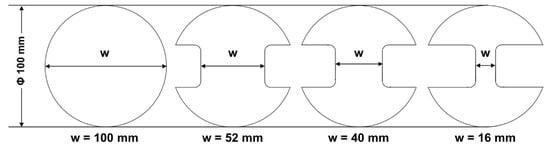
Figure 3.
Geometrical dimensions of warm Nakajima test specimens (unit: mm).
Isothermal Nakajima tests were performed for the RWF, PAWF, and AWF processes using the corresponding T6-, PA-, and W-temper specimens. The samples were heated to the target temperature through direct contact with the forming tools at a rate of approximately 3 °C/s, and soaked according to the conditions specified in Figure 1a–c.
The forming process was carried out at a constant punch speed of 1.5 mm/s, with a blank holder pressure ranging from 10 to 14.5 MPa, depending on the specimen geometry. This pressure was applied to restrict material flow into the die cavity, and the process was continued until the onset of fracture. The strain rates, estimated based on punch speed and displacement, averaged approximately 0.1 s−1 in the maximum deformation region. To ensure reproducibility, each forming test was conducted at least five times. Following the forming process, the critical fracture strains were evaluated in the vicinity of the fracture zone.
2.4. Characteristic of Microstructure Examination
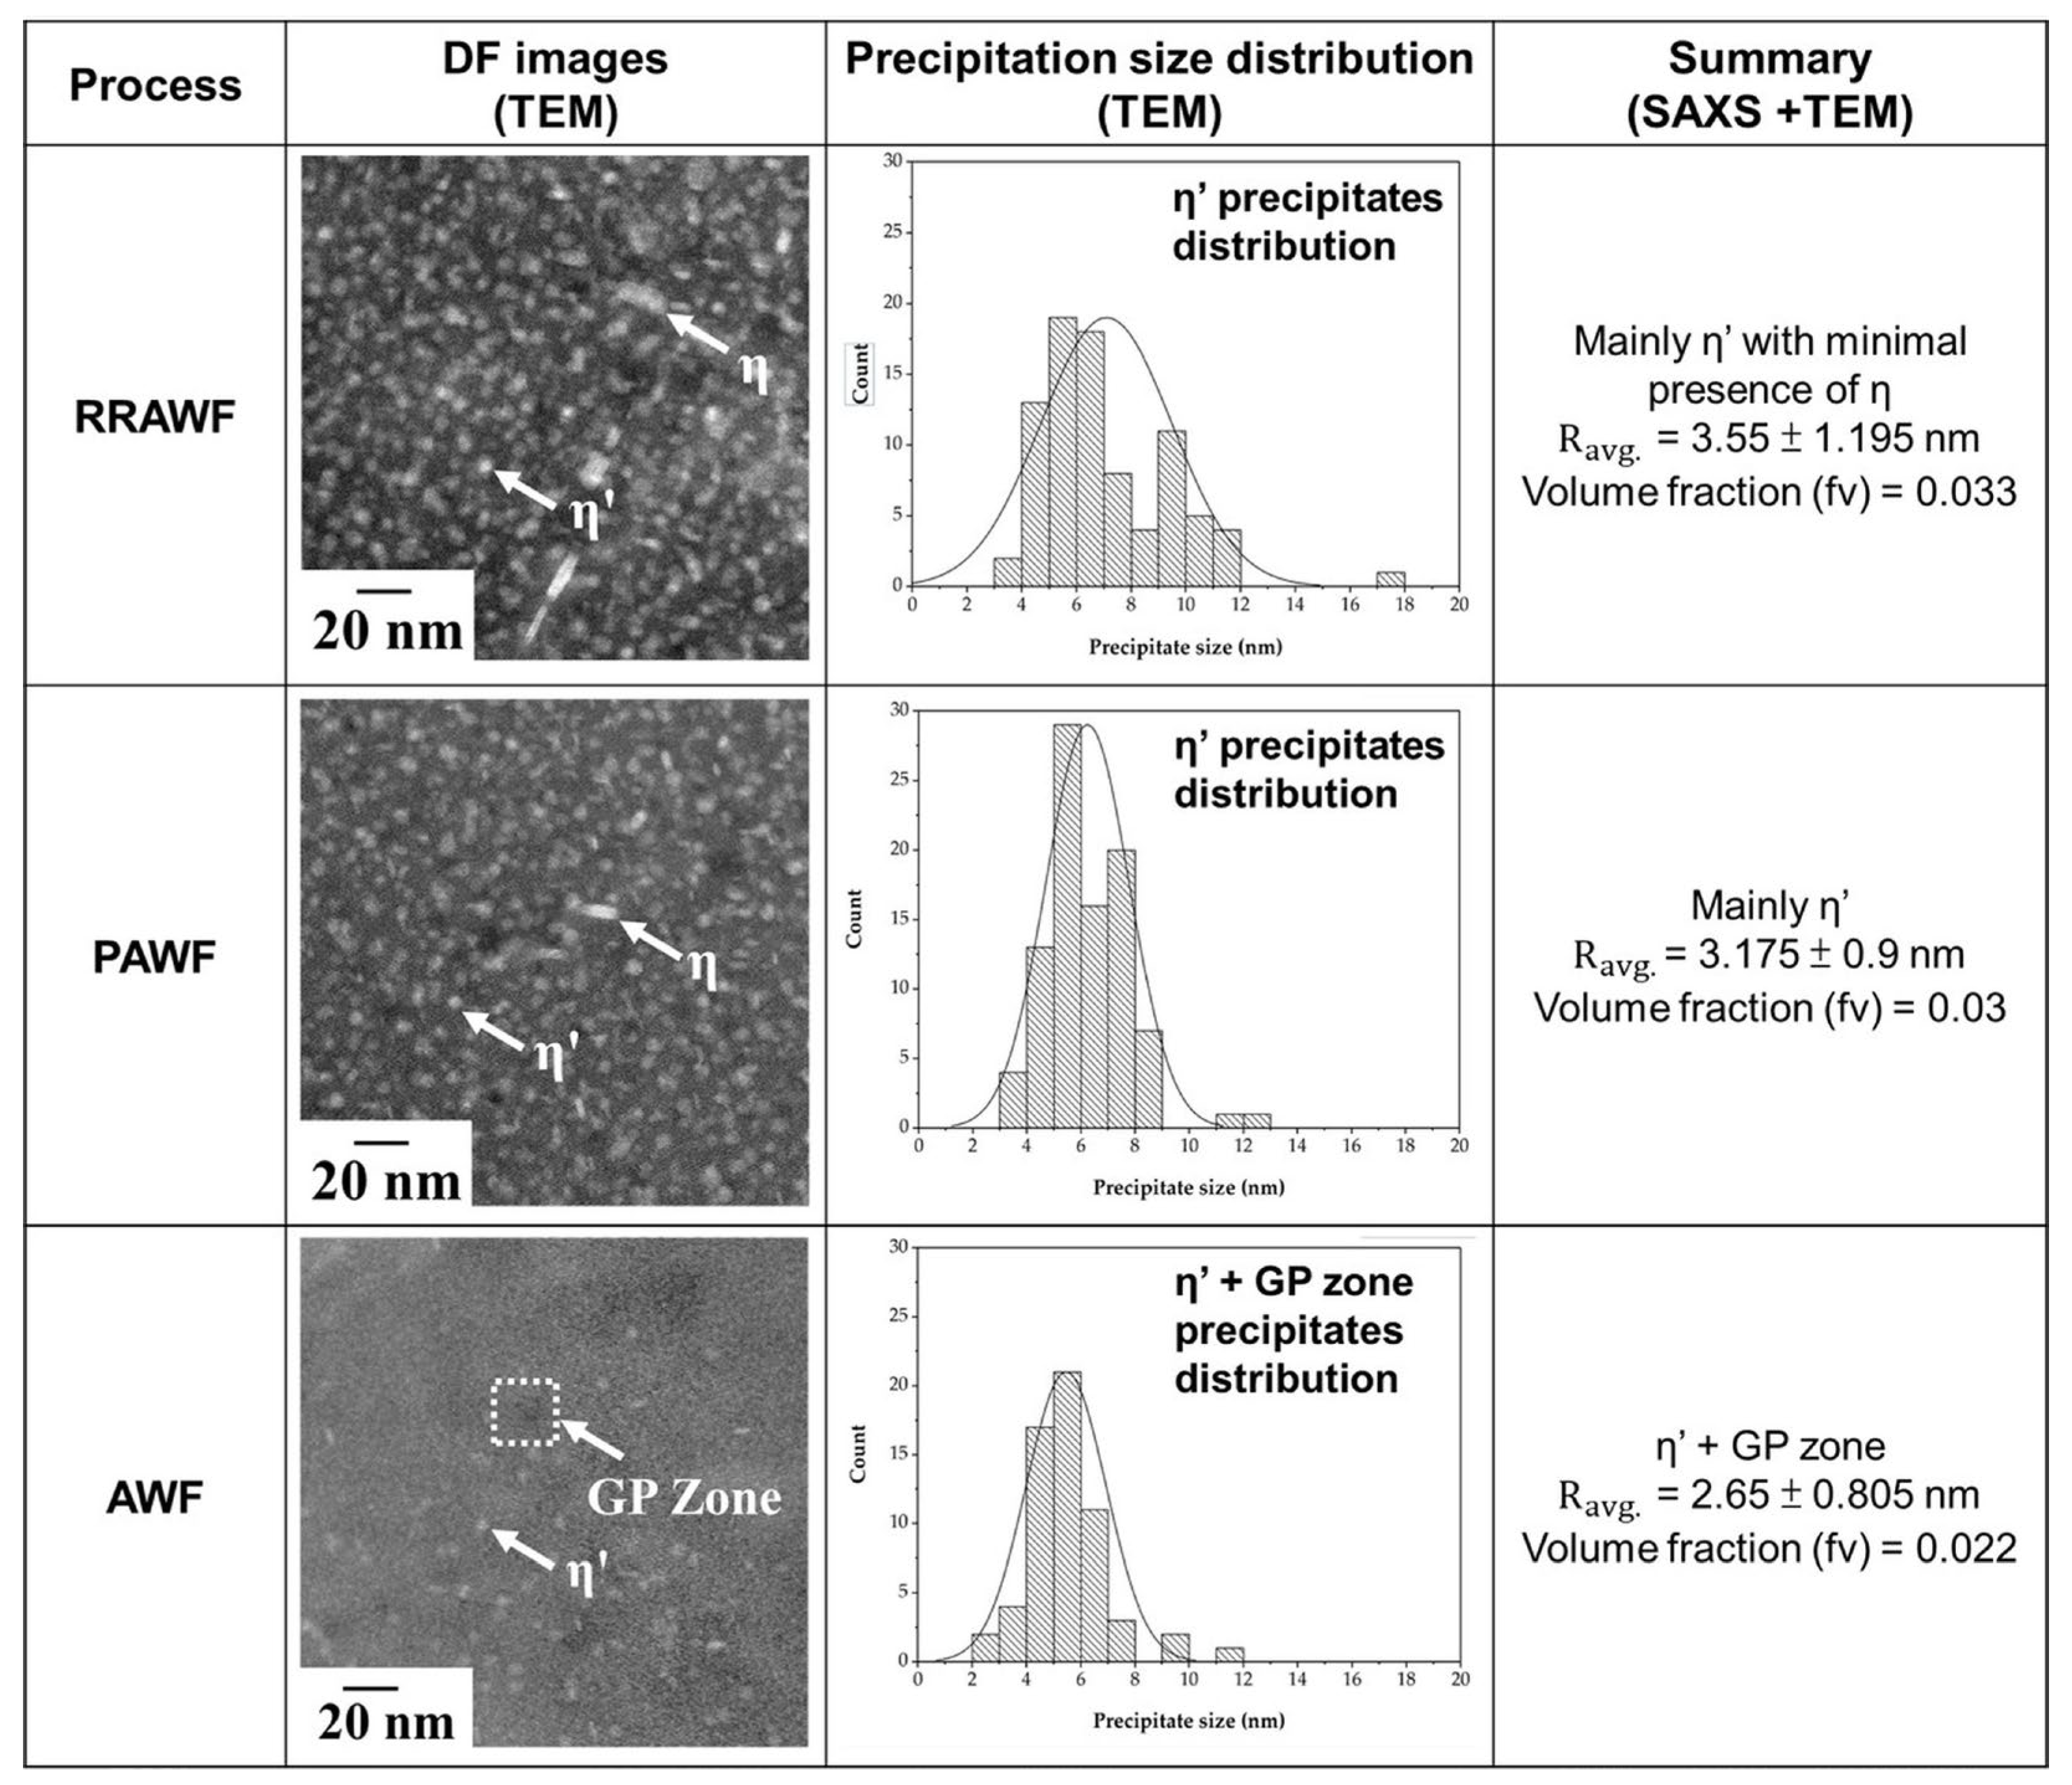
The precipitation microstructures, representing only the thermal histories of the various warm forming processes in the absence of plastic deformation, were characterised using small-angle X-ray scattering (SAXS) (BL23A, National Synchrotron Radiation Research Center, Hsinchu, Taiwan) and transmission electron microscopy (TEM) (JEM-2100F, JEOL Ltd., Tokyo, Japan). SAXS was employed to quantify the precipitate volume fraction (fv) following the procedure established by Chung et al. [21], while TEM analysis provided data on MPts types and average precipitate radius (Ravg), as reported in the authors’ previous study [5].
Figure 4 summarises the microstructural characteristics of specimens subjected to various warm forming conditions prior to deformation. Specimens processed via RWF and PAWF exhibit a uniformly distributed η′ phase with a minor presence of the η phase. The Ravg was measured as 3.55 ± 1.195 nm for RWF and 3.175 ± 0.9 nm for PAWF, with corresponding fv of 0.033 and 0.03, respectively. These findings suggest a comparable precipitation state in both conditions, with RWF showing slightly larger MPts and a marginally higher fv. In contrast, specimens subjected to the AWF condition display a distinct precipitation morphology characterised by the presence of both η′ phases and GP zones, as observed in the TEM dark-field (DF) images presented in Figure 4. The average precipitate size is 2.65 ± 0.805 nm, and the fv is reduced to 0.022 compared to RWF and PAWF. This indicates a finer and less concentrated distribution of MPts under the AWF process. To evaluate the implications of this morphology on mechanical behaviour, it is essential to consider the shearability of these precipitates. According to Yang et al. [22], the critical radius of MPts for the transition from shearable to bypassing (non-shearable) behaviour in 7xxx-series aluminium alloys is approximately 6 nm. As the Ravg of MPts’ three processing conditions remain below this threshold, the precipitates are classified as shearable, which may influence subsequent plastic deformation mechanisms.
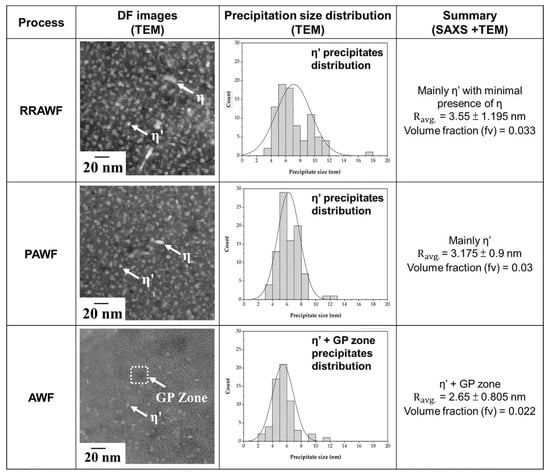
Figure 4.
Precipitation characteristics of specimens subjected to RWF, PAWF, and AWF conditions prior to deformation.
3. The Establishment of Forming Limit Prediction Model
3.1. Effects of Microstructural Characteristics on Formability
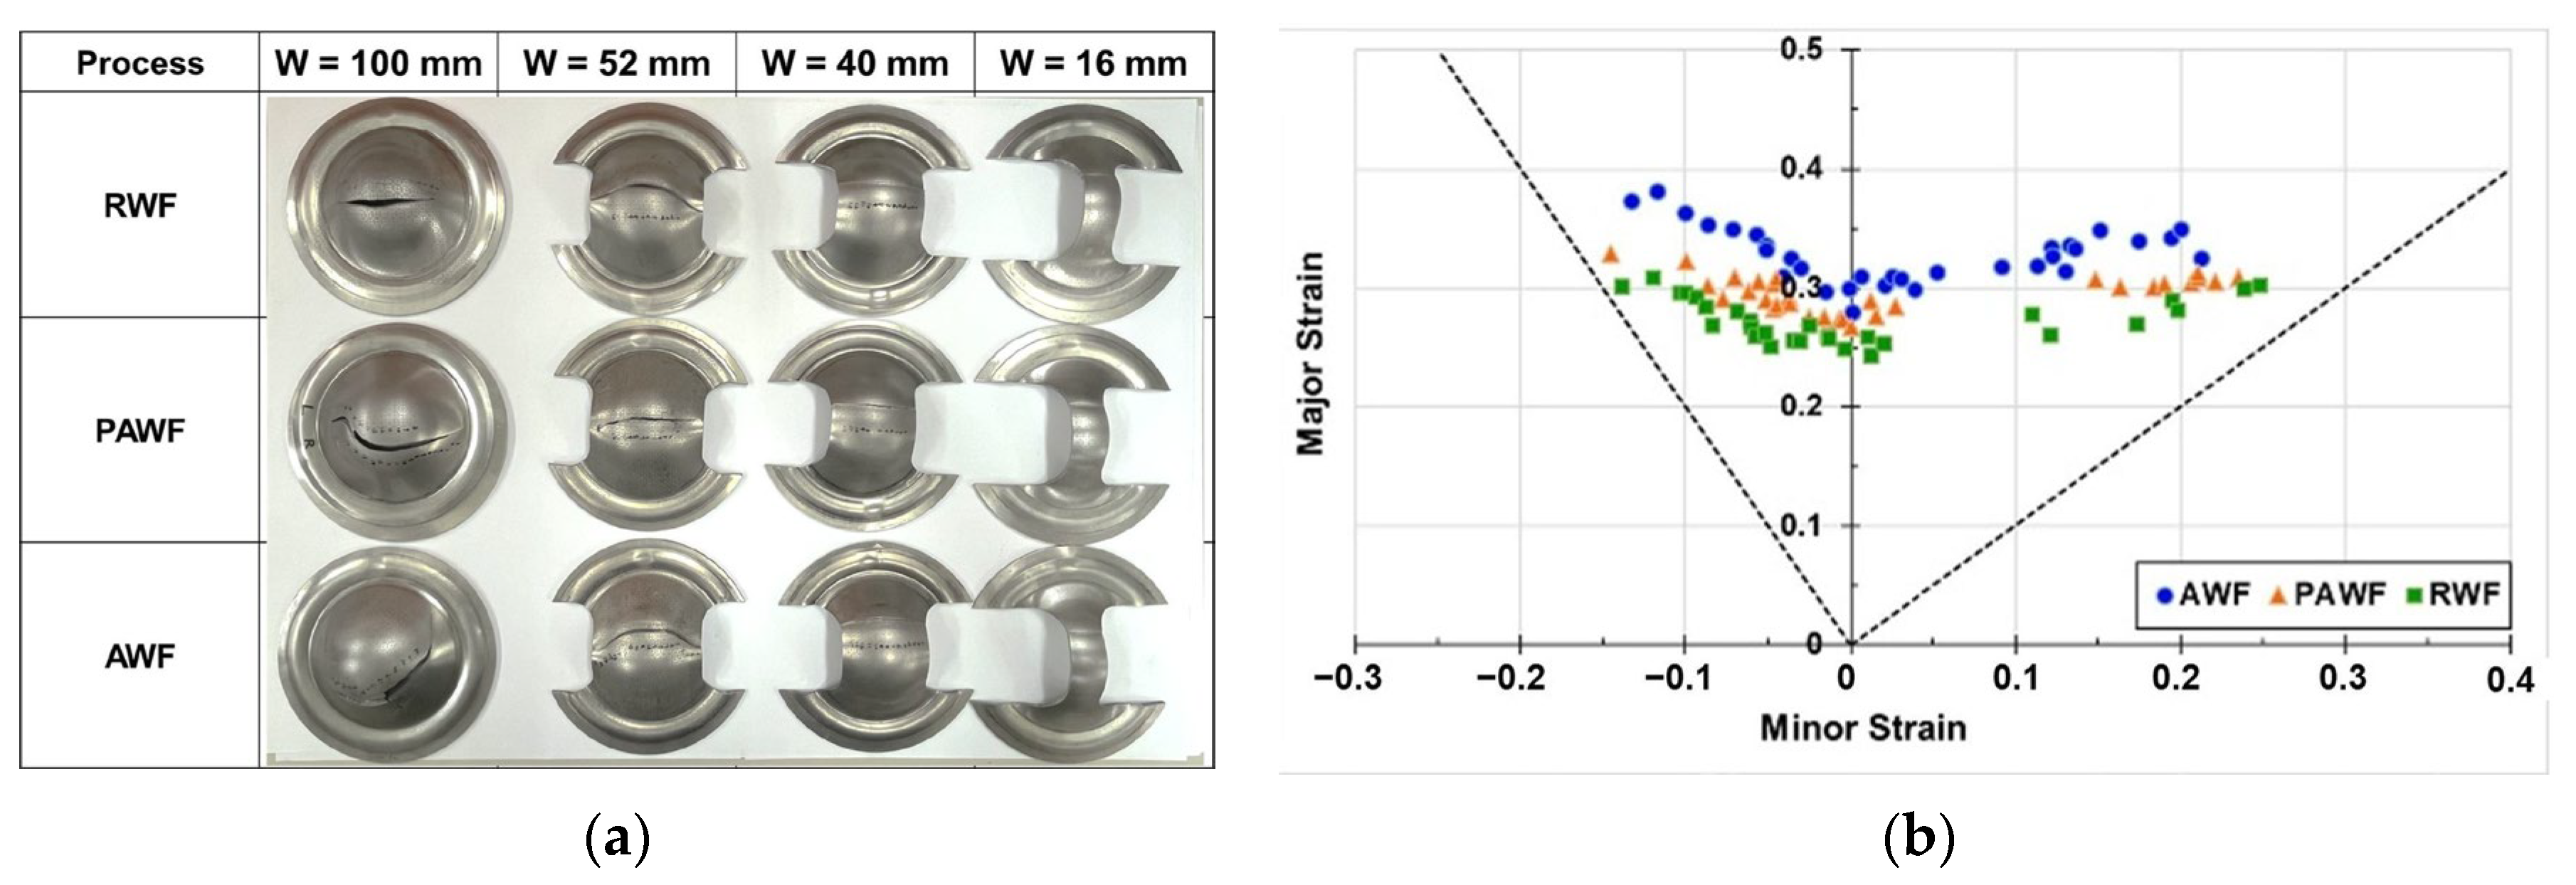
Figure 5 presents the formed parts and the experimental FLCs obtained from the Nakajima tests conducted under different warm forming processes. It can be observed that the AA7075 sheets exhibited the highest forming limits under the AWF process, followed by PAWF, with RWF showing the lowest forming limits.
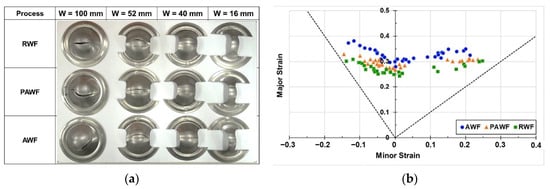
Figure 5.
(a) Formed parts and (b) limit strains obtained from the Nakajima tests.
The authors’ previous research [5] has demonstrated that the differences in formability observed under various warm forming processes can be primarily attributed to variations in MPts. These microstructural features critically influence the material’s thermo-mechanical response during deformation. However, the specific characteristics of the precipitates that most directly influence formability have yet to be clearly identified.
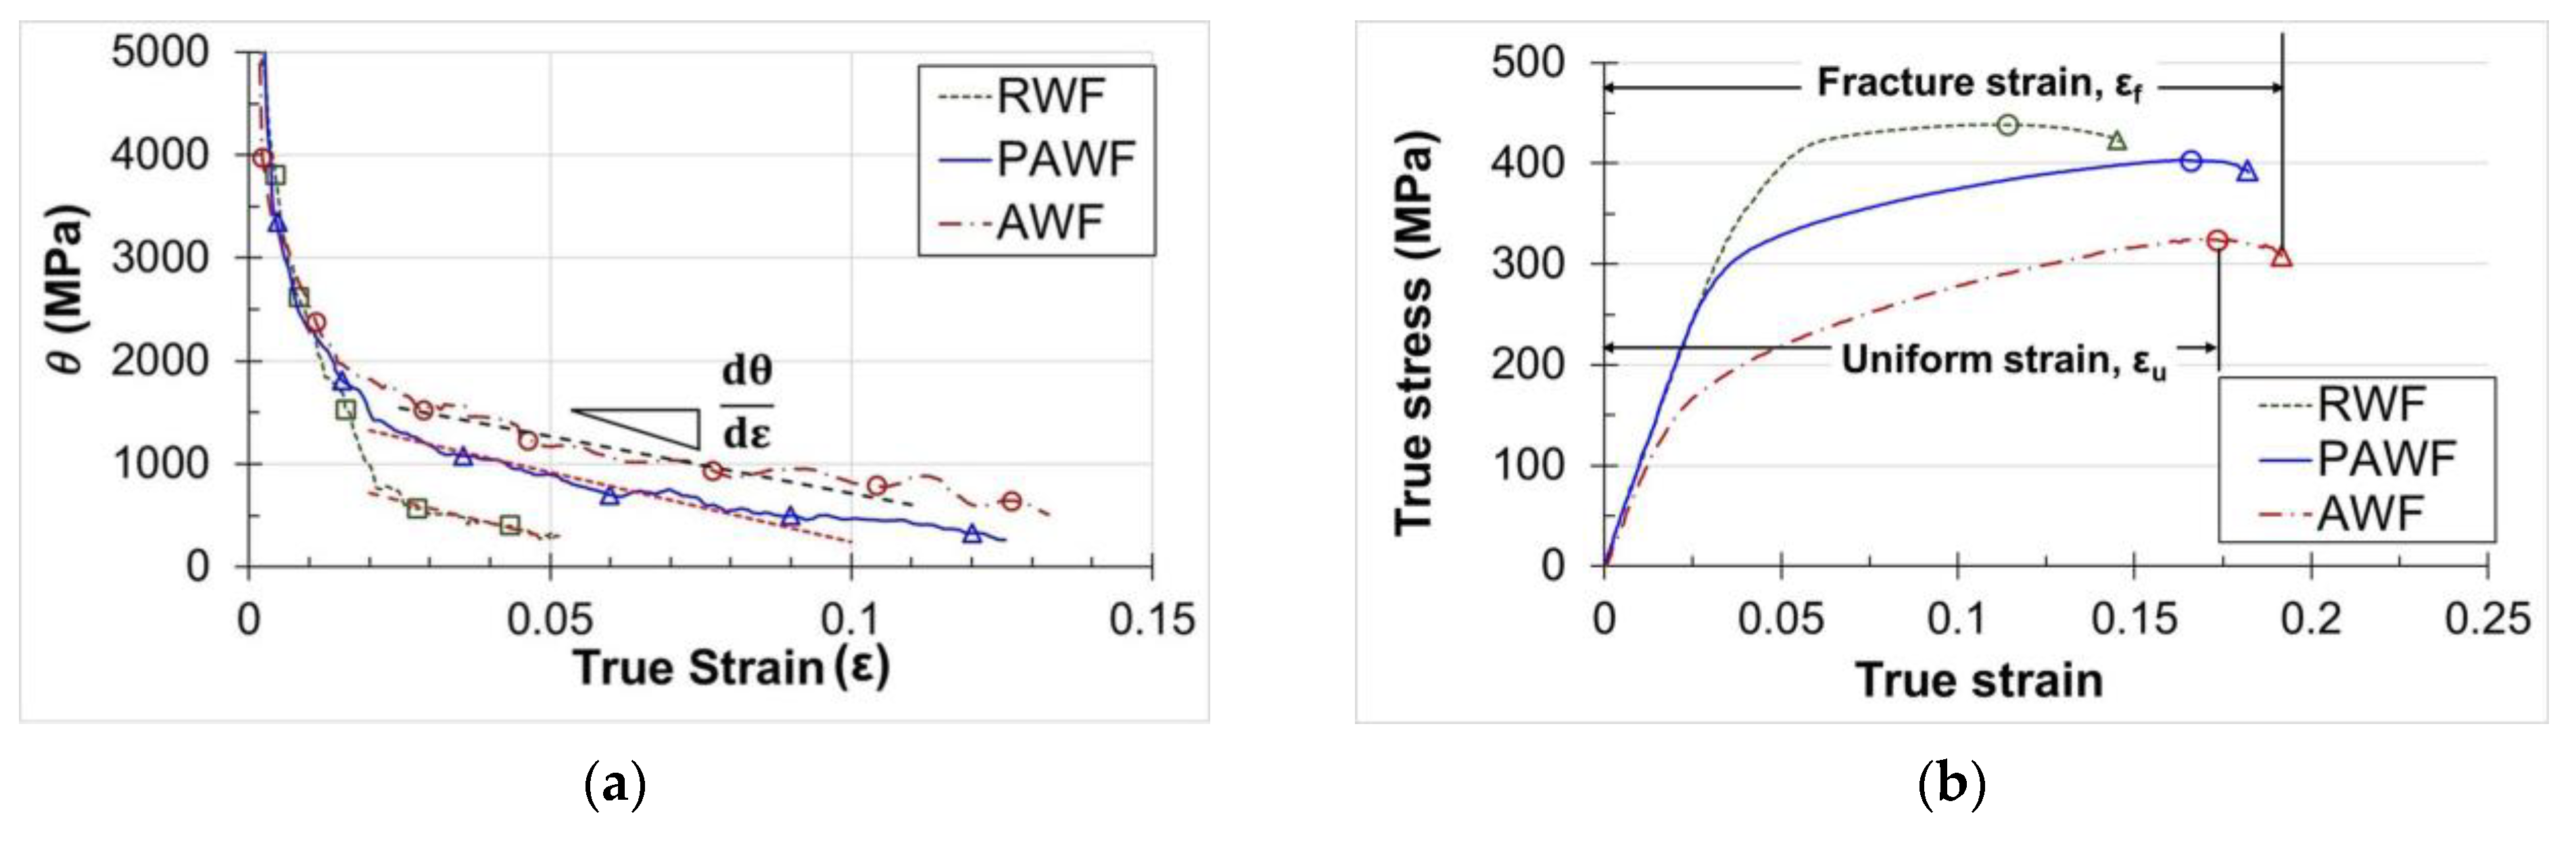
It is well established that deformation resistance and dynamic recovery are the two principal mechanisms governing the warm deformation behaviour of AA7075 aluminium alloy sheets. Since the strain hardening response provides a useful indication of the influence of dynamic recovery, the instantaneous work-hardening rate (θ = dσ⁄dε) as a function of true strain (ε) was derived from true stress–strain curves obtained in the authors’ previous study [5], based on isothermal warm tensile tests conducted under RWF, PAWF, and AWF processing conditions at a strain rate of 0.1 s−1, as illustrated in Figure 6a. Figure 6b presents the corresponding true stress–strain curves, also obtained from the same tests. An investigation of the characteristics of dynamic recovery and deformation resistance under different warm forming conditions was conducted using Figure 6a,b.
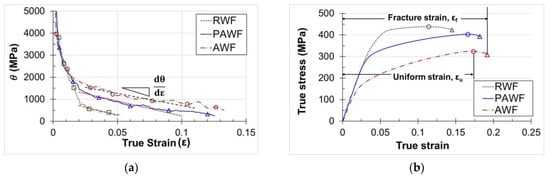
Figure 6.
(a) Work-hardening rate—true strain, and (b) true stress–strain curves at 0.1 s−1 under RWF, PAWF, and AWF conditions.
A post-peak decline in θ was observed under all three warm forming conditions, as shown in Figure 6a, indicating that dynamic recovery is active across the investigated conditions. However, its influence on formability appears to be limited. Although the θ–ε curves for RWF and PAWF exhibit similar reduction trends, their corresponding forming limits and fracture strains (εf), as illustrated in Figure 5 and Figure 6b, differ significantly. This suggests that variations in dynamic recovery behaviour alone cannot account for the observed differences in formability. Instead, deformation resistance emerges as the dominant factor. This is particularly evident in the true stress–strain curves (Figure 6b), where RWF shows the highest flow stress across the entire deformation regime, resulting in earlier necking and reduced ductility. Conversely, AWF exhibits the lowest flow stress and the greatest uniform elongation (εu), reflecting lower resistance to plastic deformation and significantly improved ductility. These trends are consistent with the forming limit curves in Figure 5b, where AWF consistently demonstrates the highest forming limits across all strain paths, outperforming both PAWF and RWF.
These findings align with the existing literature. Huo et al. [2] reported that although increased dynamic recovery reduces uniform elongation and work-hardening capacity, a decrease in deformation resistance improves fracture strain under warm forming conditions. Similarly, Zhang et al. [23] demonstrated that elevated temperatures enhance dynamic recovery in pre-aged AA7075 sheets, thereby lowering uniform elongation. However, the concurrent reduction in deformation resistance led to increased fracture strain and Limit Dome Height (LDH), indicating improved formability. Collectively, these studies support the conclusion that deformation resistance plays a more dominant role than dynamic recovery in determining the forming limits of AA7075 sheets under warm forming conditions.
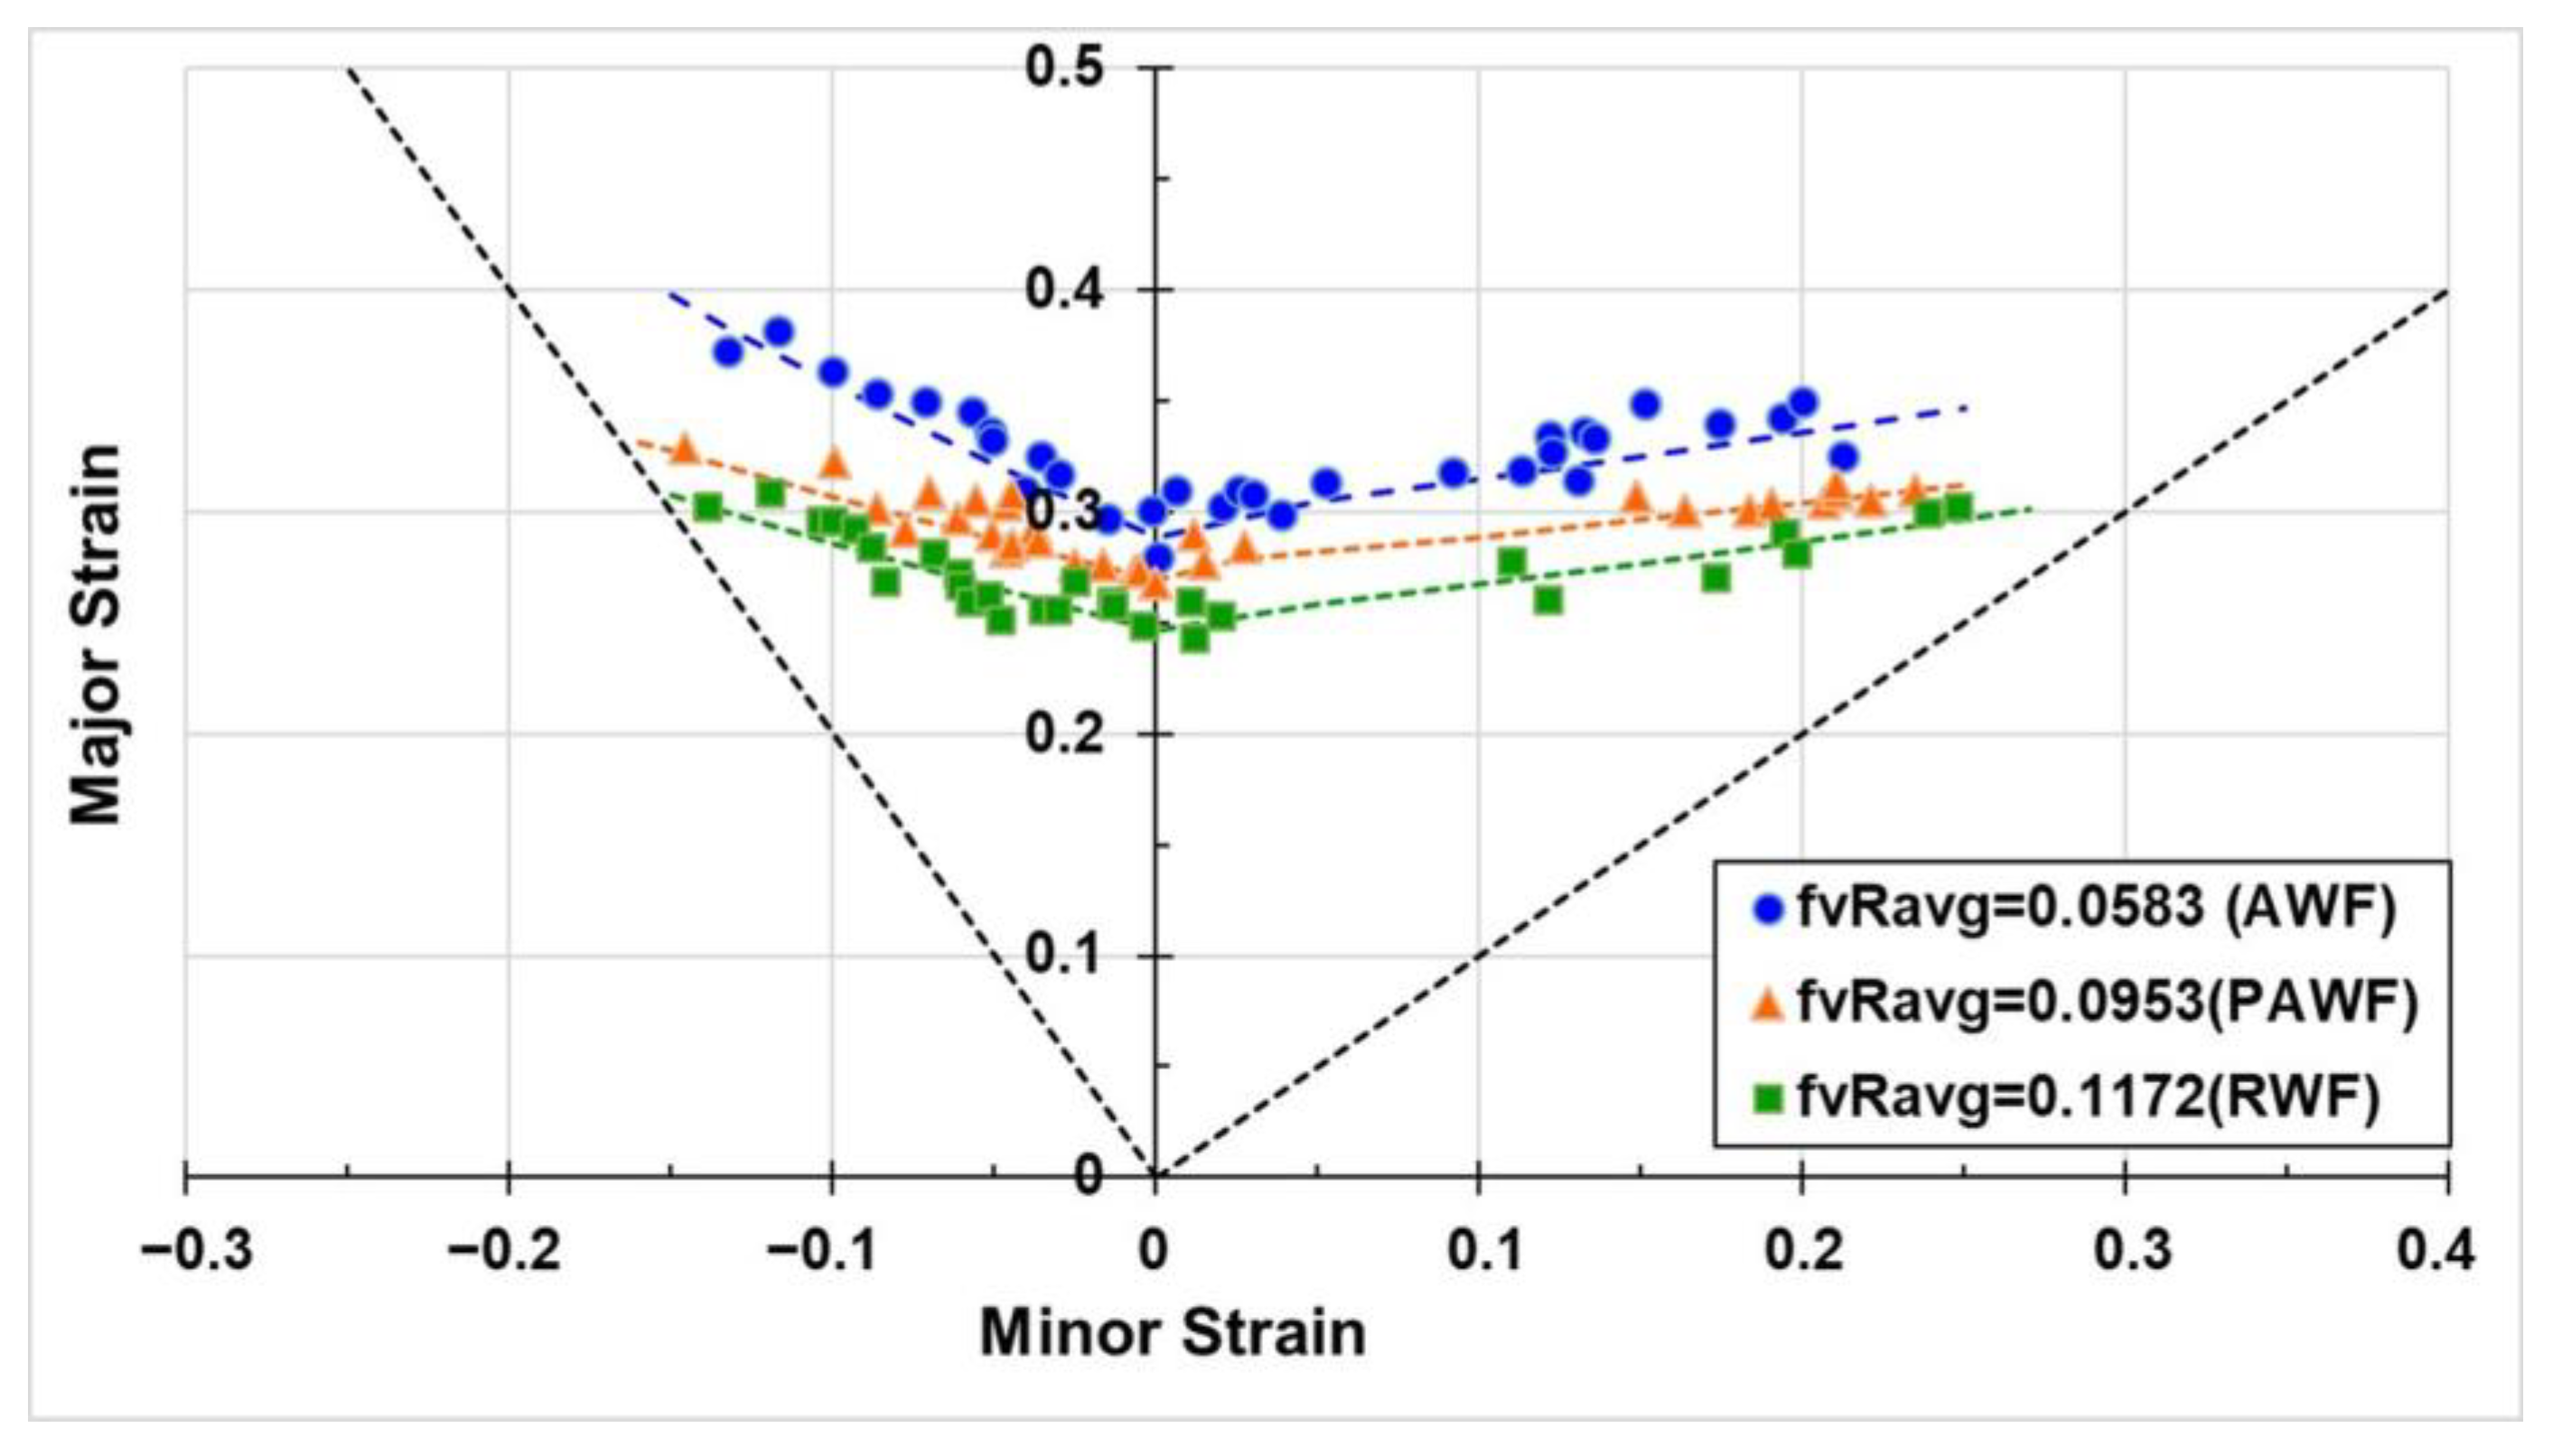
In AA7075 sheets, deformation resistance is primarily governed by precipitation strengthening, which can be characterised by the product of the volume fraction and average radius (fvRavg) of shearable precipitates, where higher fvRavg values indicate greater resistance [24]. The relationship between fvRavg and the forming limit strains under different warm forming processes was analysed to evaluate the influence of MPts characteristics on formability, as shown in Figure 7. A clear trend of increasing forming limits with decreasing fvRavg was observed. Since AA7075 sheets processed via AWF exhibit the lowest fvRavg values, whilst those processed by RWF exhibit the highest, this indicates that fvRavg—as a key precipitation feature—governs the formability differences among various warm forming conditions. Based on these observations, the precipitate characteristic fvRavg for AA7075 sheets processed under different warm forming conditions was incorporated into a modified Cockcroft and Latham (C&L) criterion to develop a revised ductile fracture model.
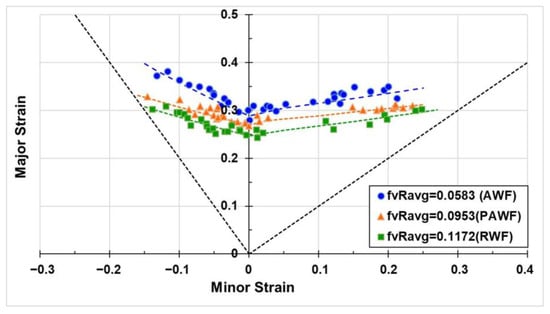
Figure 7.
Effect of fvRavg on the FLCs of AA7075 sheets under different warm forming conditions.
3.2. Development of the Proposed Fracture Criterion
As the accuracy of the modified C&L criterion incorporating strain paths, proposed by Zhuang [15], has been verified across various sheet forming scenarios [16], the present study adopts this model and further integrates —the most influential precipitate parameter governing the formability of AA7075 sheets, as identified in Section 3.1—to develop a new fracture criterion, as defined in Equation (1).
where , , , and represent the maximum principal stress, effective strain increment, effective fracture strain, and strain path ratio, respectively. The parameters α and are material constants identified using two fracture strains obtained from distinct strain paths [15]. The parameter α serves as a calibration factor, derived to ensure that the accumulated fracture energy at failure remains uniform across different strain paths for the same material under identical testing conditions. The constant denotes the calibrated critical fracture energy obtained after this adjustment.
The modified C&L criterion is based on the following assumptions: (a) the material is assumed to be under plane stress conditions (); (b) strain paths are approximately linear across different strain states; and (c) the material’s flow behaviour is effectively described by the Hollomon equation, as defined in Equation (2).
where is true flow stress, ε is true strain, n is the strain hardening exponent, and K is the strength coefficient.
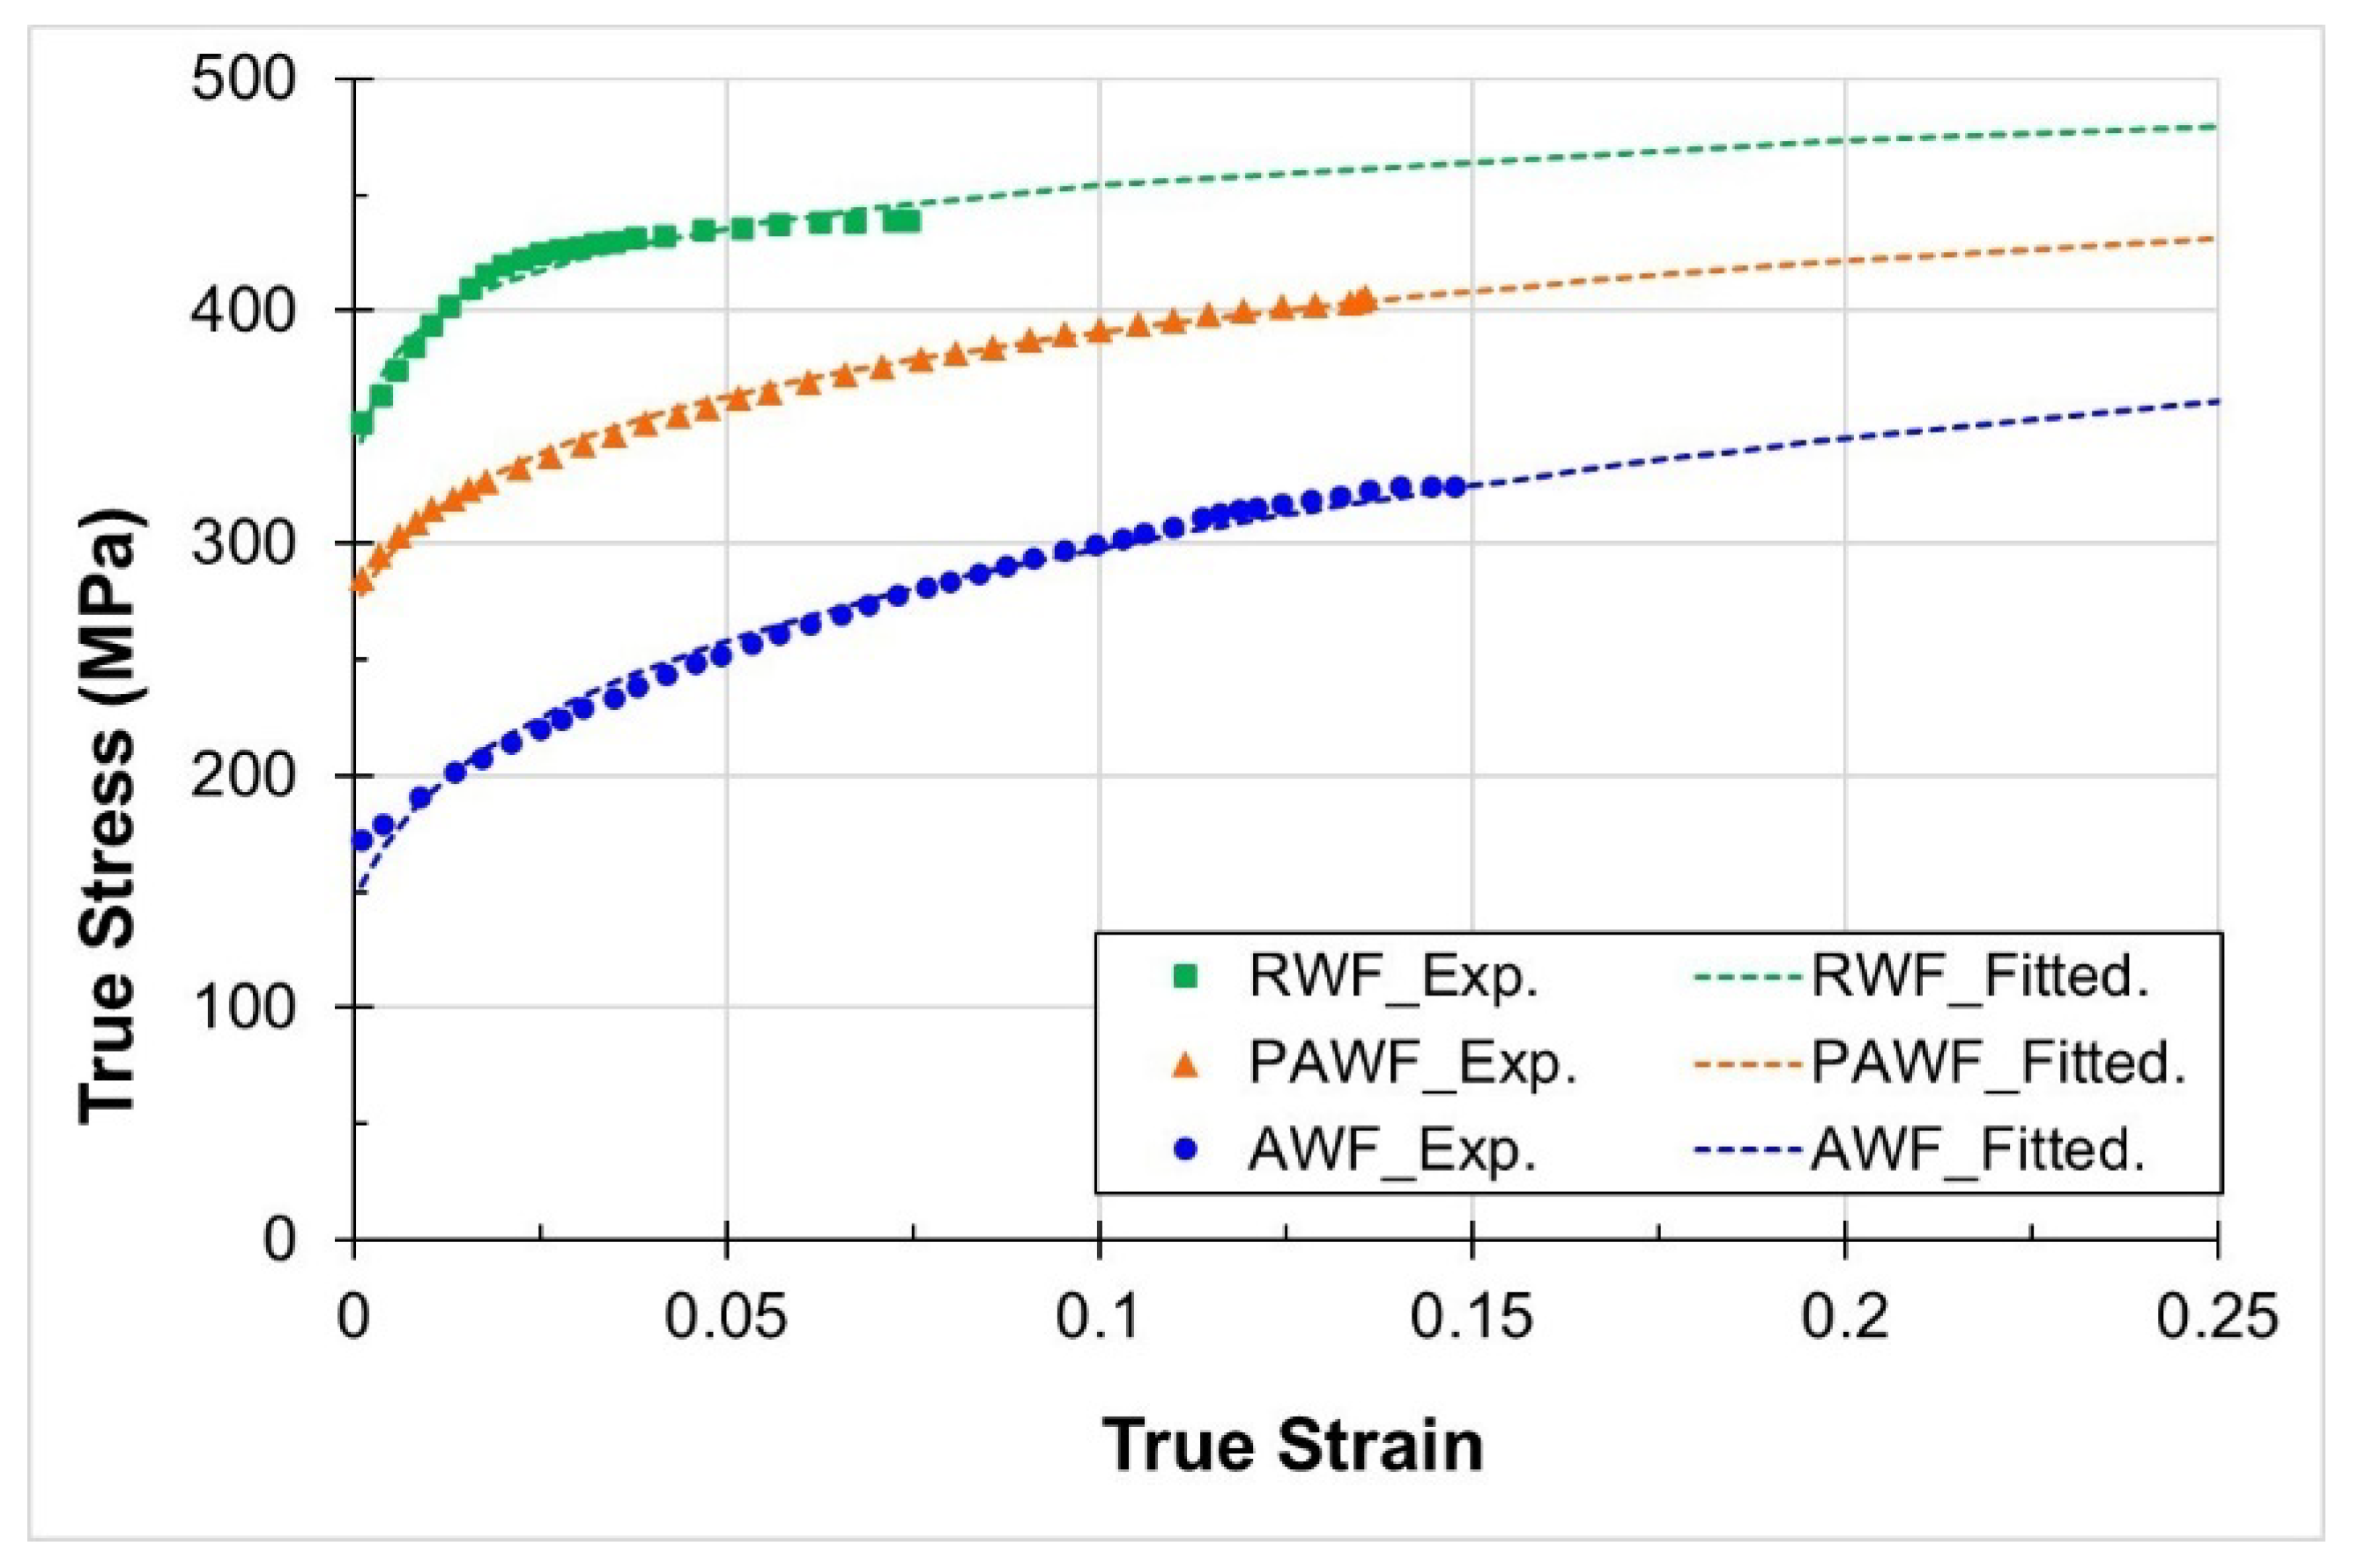
Since strain rate has been shown to have no significant effect on the forming behaviour of AA7075 sheets within the investigated warm forming processes and strain rate range [5], the material response can be reasonably described using the Hollomon equation. Figure 8 compares the fitted curves with the true stress–strain data from isothermal warm tensile tests under RWF, PAWF, and AWF conditions at a strain rate of 0.1 s−1, showing strong alignment with the experimental results [5].
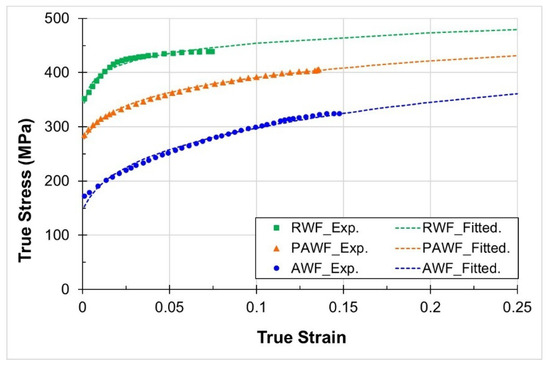
Figure 8.
Comparison between fitted curves and experimental true stress–strain data at a strain rate of 0.1 s−1 for AA7075 sheets under RWF, PAWF, and AWF conditions.
Previous studies have shown that the tensile axis orientation relative to the rolling direction has minimal influence on the flow stress of AA7075 sheets, indicating near-isotropic behaviour [25]. Therefore, AA7075 sheets can be reasonably assumed to exhibit isotropy under warm forming conditions. The validity of the assumption will be verified in the following Section 4.
According to the Levy–Mises flow rule governing sheet metal deformation during forming (, where i,j = 1,2,3) and the assuming plane stress condition (), the effective strain and effective stress can be expressed as follows:
The strain ratio can be defined as , and the stress ratio is defined as . Considering the material’s volume consistency and applying the Levy–Mises equation, the relationship between and is expressed as follows:
The relationship between the effective strain and the maximum principal strain can be further formulated in terms of and expressed as:
The effective stress can be reformulated by substituting the principal stresses in terms of γ and , as shown below:
Under the assumption that the material’s flow behaviour obeys the Hollomon equation, the maximum principal stress can be expressed as:
By incorporating Equations (7) and (8) into the proposed fracture criterion (Equation (1)), the analytical form is obtained, as presented in Equation (9).
denotes the maximum principal fracture strain. To predict the FLC, two forming limit tests are conducted under different strain paths, producing two sets of and values, denoted as , , and , . The constant C2 is determined from one set of and , enabling determination of fracture strains for all paths using Equation (10).
The material constant can be calculated by dividing Equation (10) for by Equation (10) for , or vice versa.
The secondary principal fracture strains () are determined by multiplying the maximum principal fracture strains () by the corresponding .
By varying from −1 to 1, the limit strains on the FLD are determined, and the complete FLCs can be constructed by compiling these values across all strain ratios.
3.3. Validation of the Proposed Fracture Criterion
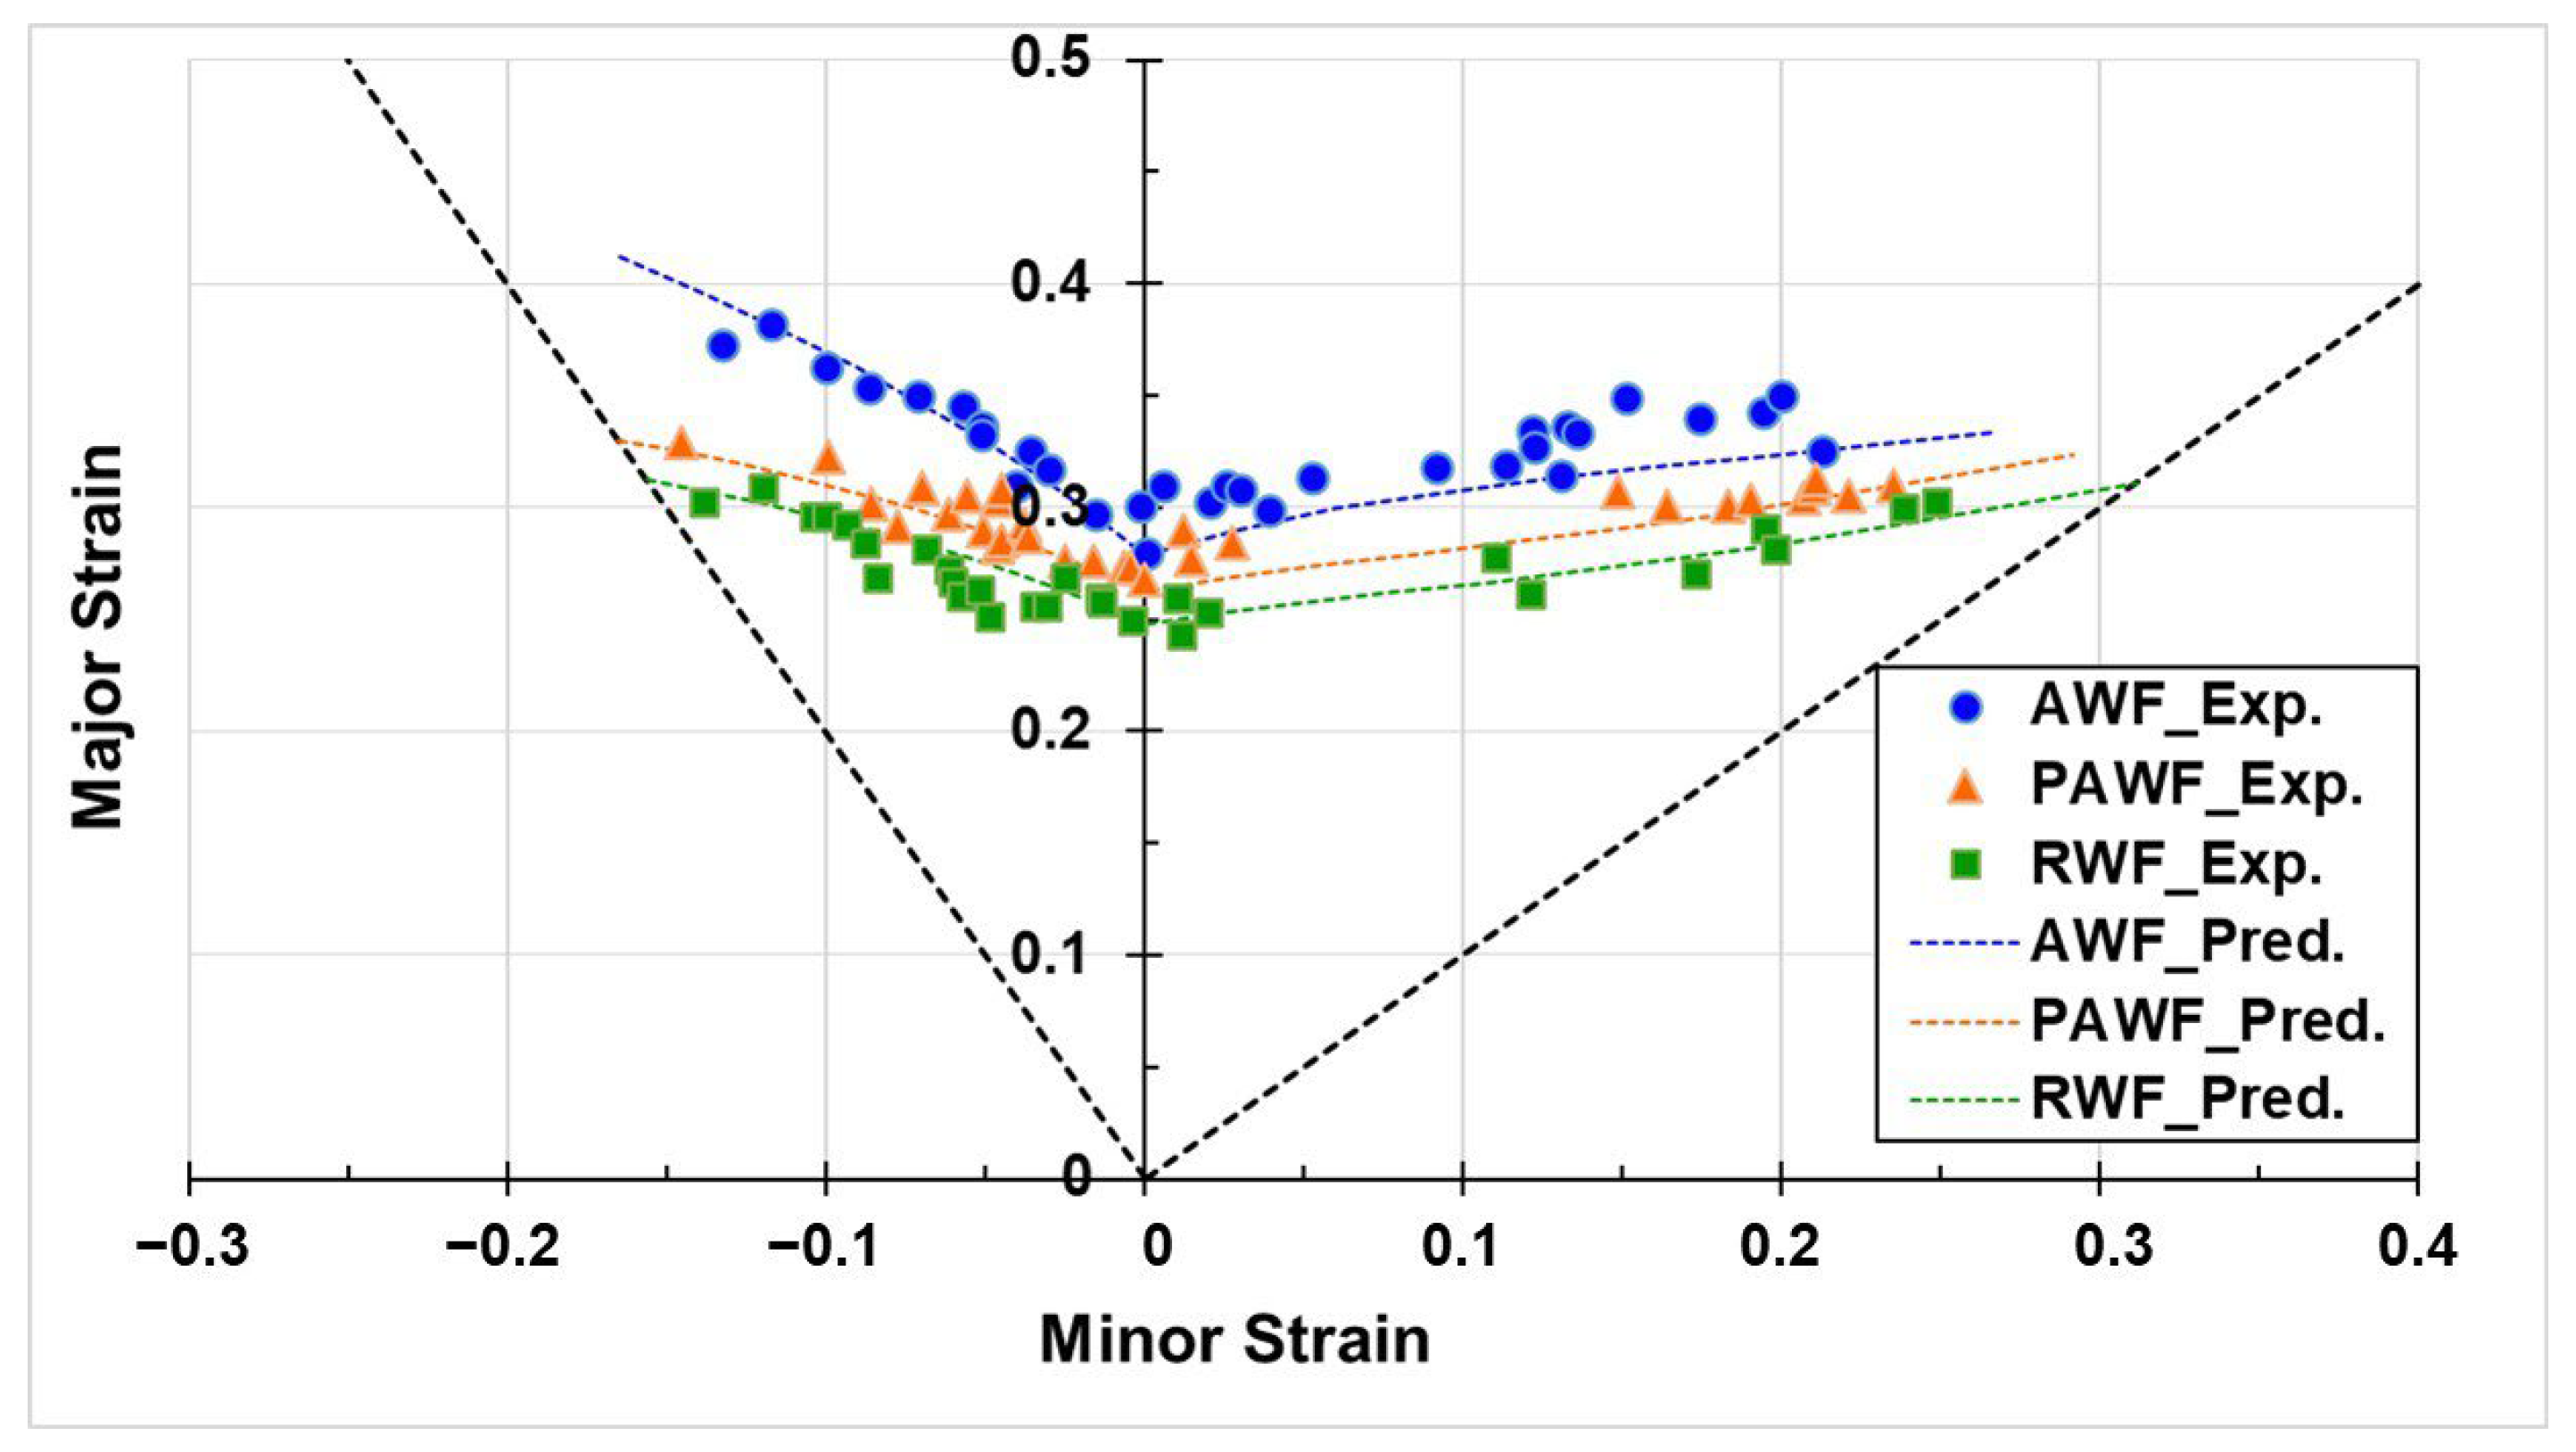
Table 2 summarises the input forming limit strains under uniaxial tensile (UT) and biaxial tensile (BT) strain paths, derived from warm Nakajima test results, along with the calibrated material constants α and C for each processing condition, which were used to predict the FLCs. Figure 9 presents a comparison between the model predictions and experimental data, showing strong alignment and thereby validating the model’s capability in accurately capturing the forming behaviour of AA7075 sheets across various warm forming processes.
Table 2.
The data used for predicting the FLCs under different warm forming processes (UT–BT).
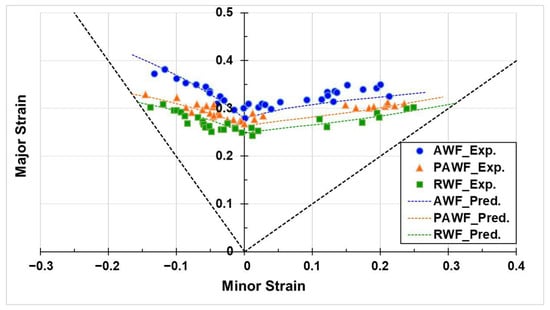
Figure 9.
Comparison between the predicted forming limits and experimental values for AA7075 sheets across various warm forming processes.
The calibrated fracture energy constant C, as presented in Table 2, reflects the variation in deformation resistance of AA7075 across different warm forming conditions. Under AWF, the lowest deformation resistance corresponds to the lowest C value at the fracture threshold, while RWF, which exhibits the highest resistance, shows the highest C. Since deformation resistance is known to scale with the precipitate parameter fvRavg, this indicates a direct correlation between C and fvRavg. The relationship underscores the critical role of matrix precipitate characteristics in fracture behaviour. Accordingly, the calibrated C value offers a quantitative metric for evaluating how microstructural features influence formability under different warm forming regimes, providing a practical basis for assessing fracture resistance in high-strength aluminium alloys.
The proposed model predicts FLCs across all strain paths using two calibrated material constants, α and C, where α accounts for strain path differences, and C represents the critical accumulated strain energy associated with fracture. These constants are determined using selected values of ρ and ε1,f from two strain paths, making the model potentially sensitive to input selection.
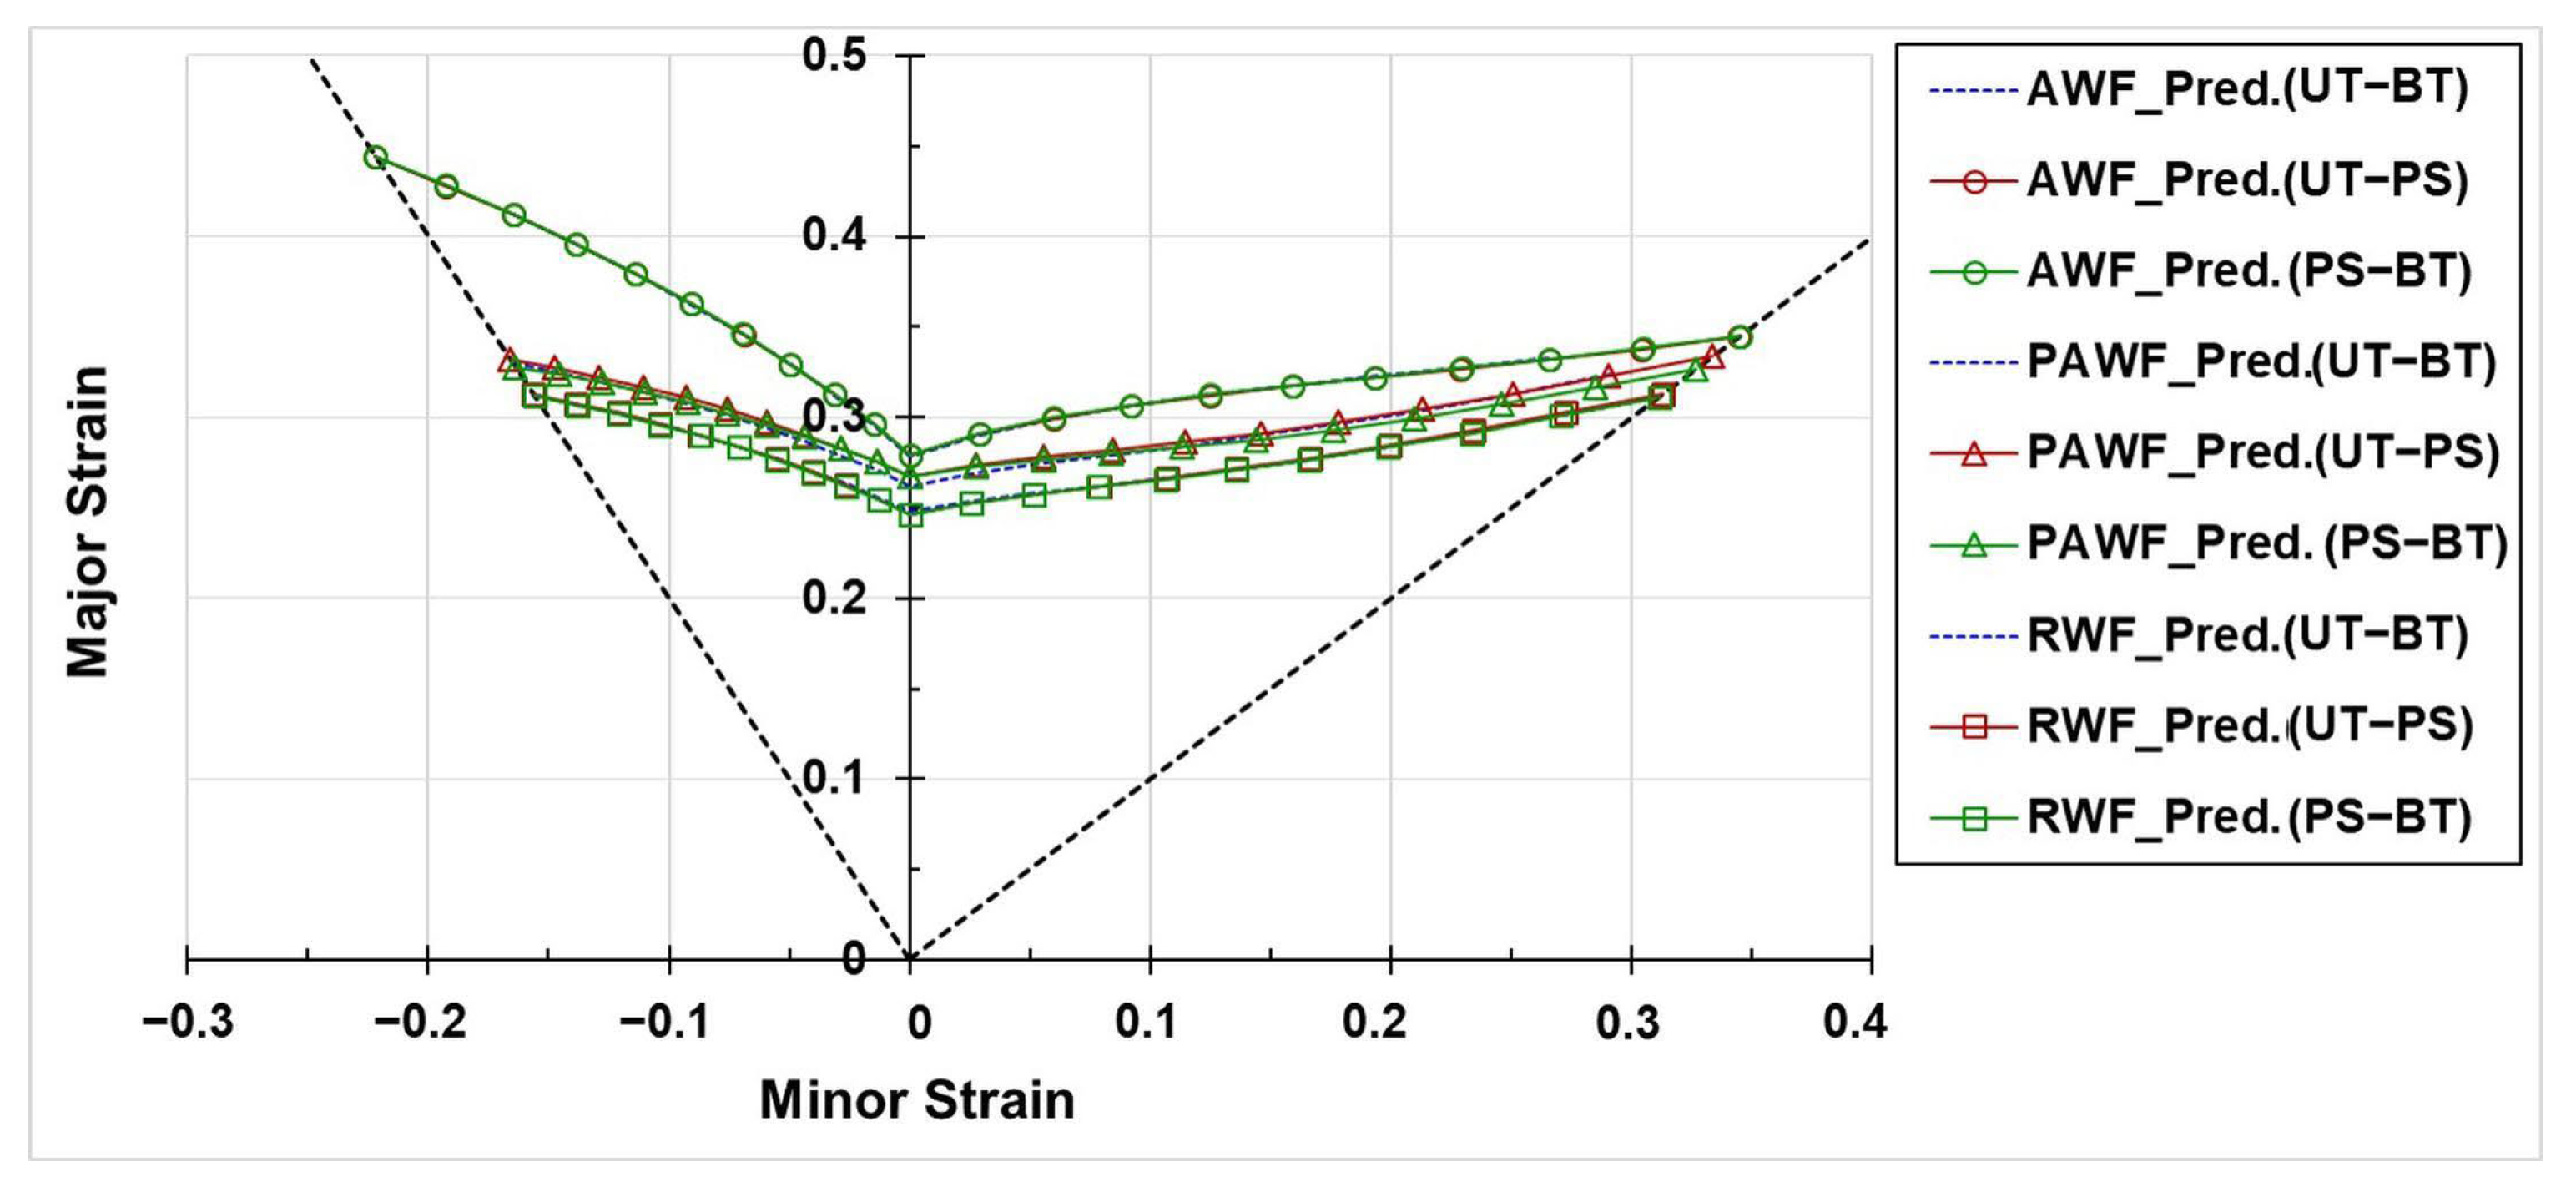
To evaluate this sensitivity, two strain path combinations—uniaxial tension to plane strain (UT–PS) and plane strain to biaxial tension (PS–BT)—were assessed. The corresponding input data and the calibrated values of α and C for each warm forming process are summarised in Table 3 and Table 4. Table 5 provides a consolidated comparison of α and C across three strain path combinations (UT–BT, UT–PS, and PS–BT), including their relative percentage variations. As shown, α exhibits process-dependent variations ranging from −2.2 to +9.0%, reflecting sensitivity to strain path selection. In contrast, the fracture energy constant C remains relatively stable, with deviations limited to approximately ±2.5%, highlighting the robustness of the model in capturing fracture behaviour. Figure 10 compares the predicted FLCs based on three strain path combinations (UT–BT, UT–PS, and PS–BT. The results show minimal differences, supporting the generalised applicability and reliability of the proposed model across varying calibration paths and warm forming conditions.
Table 3.
The data used for predicting the FLCs under different warm forming processes (UT–PS).
Table 4.
The data used for predicting the FLCs under different warm forming processes (PS–BT).
Table 5.
Comparison of calibrated α and C values across three strain path combinations.
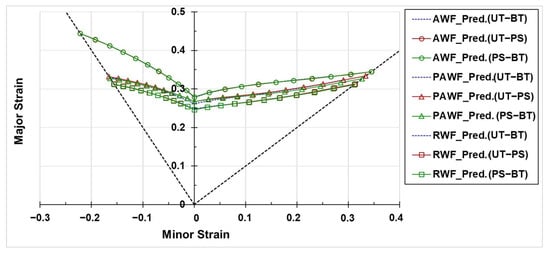
Figure 10.
Comparison of predicted values under three strain path combinations for AA7075 sheets across various warm forming processes.
4. Validation and Application of Proposed New Model
4.1. Modelling of Finite Element
An FE model was developed using the commercial sheet metal forming software PAM-STAMP 2015 to simulate isothermal uniaxial tensile and Nakajima tests for AA7075 sheets processed by the RWF method. As described in Section 3.3, the material was reasonably assumed to exhibit near-isotropic behaviour under warm forming conditions, with its plastic flow characterised by Hollomon’s equation. The true stress–strain curves were fitted to experimental data to replicate the isothermal tensile response observed in the authors’ previous study [5]. This material model was then incorporated into the FE simulation through the von Mises yield criterion. Furthermore, the FLC derived from the fracture model calibrated using the UT–BT strain path combination, as described in Section 3.3, was implemented to predict the onset of fracture in AA7075 sheets under RWF conditions. As the deformation was conducted under isothermal conditions in both the uniaxial tensile and Nakajima tests, the model assumed constant temperatures for the sheet and forming tools, thereby neglecting any heat transfer between them [26]. The forming tools were modelled as analytically rigid bodies, while the AA7075 specimen was treated as a deformable plastic body. An initial mesh size of 2.5 mm was used, consistent with the etched square grids on the Nakajima specimens, and a maximum adaptive refinement level of four was applied to balance computational efficiency and accuracy.
The isothermal uniaxial tensile test under the RWF condition was conducted at a constant temperature of 220 °C. Specimens were clamped at both ends, with one end fully fixed to prevent displacement and the other subjected to axial tension at a strain rate of 0.1 s−1 to simulate forming conditions. These experimental conditions were reproduced in the FE model through appropriate boundary constraints. At the fixed end, all nodes were fully constrained in both translational and rotational directions to prevent movement. At the loading end, nodes were restricted in the transverse and rotational directions but allowed to move along the forming axis. A displacement was applied to match a strain rate of 0.1 s−1 and drive deformation.
For the FE model of the isothermal Nakajima tests under the RWF condition, the geometry and dimensions of the forming system were consistent with those illustrated in Figure 3. A Coulomb friction model was employed, with a friction coefficient of 0.15 applied between the specimen and the punch due to oil-based graphite lubrication. A higher coefficient of 0.3 was assigned to all other contact interfaces within the forming tool system, in accordance with previous studies [26]. Simulations were conducted using boundary and forming conditions identical to those described in Section 2.3.
4.2. Validation of FE Model
Figure 11 compares the simulation and experimental results of uniaxial tensile tests on AA7075 sheets subjected to the RWF process at a strain rate of 0.1 s−1. The simulated minimum width at fracture is 9.557 mm, located at the centre of the specimen, while the experimentally measured value is 9.50 ± 0.052 mm, resulting in a discrepancy of 0.6%. The predicted minimum sheet thickness is 1.638 mm, compared with an experimental measurement of 1.700 ± 0.027 mm, corresponding to a discrepancy of 4%. These results demonstrate a strong alignment between simulation and experiment, confirming that the FE model incorporating the proposed criterion can accurately predict the deformation behaviour of AA7075 sheets under the RWF process.
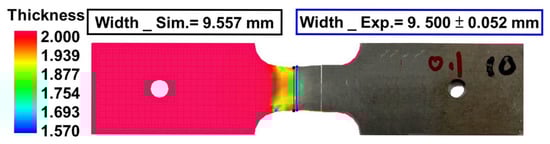
Figure 11.
Comparison of simulated and experimental tensile results for AA7075 sheets under the RWF condition at a strain rate of 0.1 s−1.
Furthermore, it can be observed that necking at the point of fracture is not significant in either the simulation or the experimental results, which is consistent with previous research findings [11], thereby validating the appropriateness of employing a ductile fracture criterion to predict the forming limits of AA7075 sheets under warm forming conditions.
4.3. Application of FE-Based R-Value Prediction and Anisotropy Analysis Under the RWF Process
The Lankford coefficient (R-value) is a key formability index for assessing the uniform plastic deformation capability of sheet metals [27]. It is defined as the ratio of true strain in the width direction () to that in the thickness direction () at the uniformly deformed region near fracture in a uniaxial tensile specimen. Alternatively, it can be expressed in terms of the true strains in the length () and width directions, and is calculated as:
However, accurately determining the R-value under warm forming conditions presents practical challenges. The processing window for AA7075 sheets during warm forming is extremely narrow, and studies have shown that not only the forming temperature but also the heating rate strongly influence the mechanical properties of the material [28]. To replicate warm forming conditions during tensile tests, rapid heating techniques such as induction coil-assisted heating [20] or resistance heating [11] are typically required to rapidly reach and maintain the target temperature under isothermal conditions. These technical demands complicate traditional tensile testing, rendering a traditional R-value measurement impractical for industrial applications.
Given that the R-value can be determined from true strain measurements during deformation, a warm forming-based evaluation method becomes feasible. As shown in Equation (13), the R-value is calculated from the true strains in the length and width directions at the uniformly deformed region near fracture, corresponding to the major (ε1) and minor (ε2) strains obtained from the Nakajima test results. Compared with other approaches, the isothermal warm Nakajima forming tool system (as shown in Figure 2) uniformly heats the sheet to the target temperature via direct tool contact, satisfying thermal requirements for warm forming while offering advantages such as simplified setup and reduced cost. Based on these considerations, a practical method for rapid R-value evaluation using the isothermal warm Nakajima system, with potential for industrial application, is proposed in this study.
Specifically, simulations were performed to replicate the Nakajima test for AA7075 aluminium alloy sheets along the rolling direction (RD) under RWF conditions. A new specimen geometry (FLD 5) was designed based on the strain path (SP) observed at the uniformly deformed centre region, which closely aligned with uniaxial tension. This design enables an accurate capture of the material’s uniaxial tensile strain response during the Nakajima test.
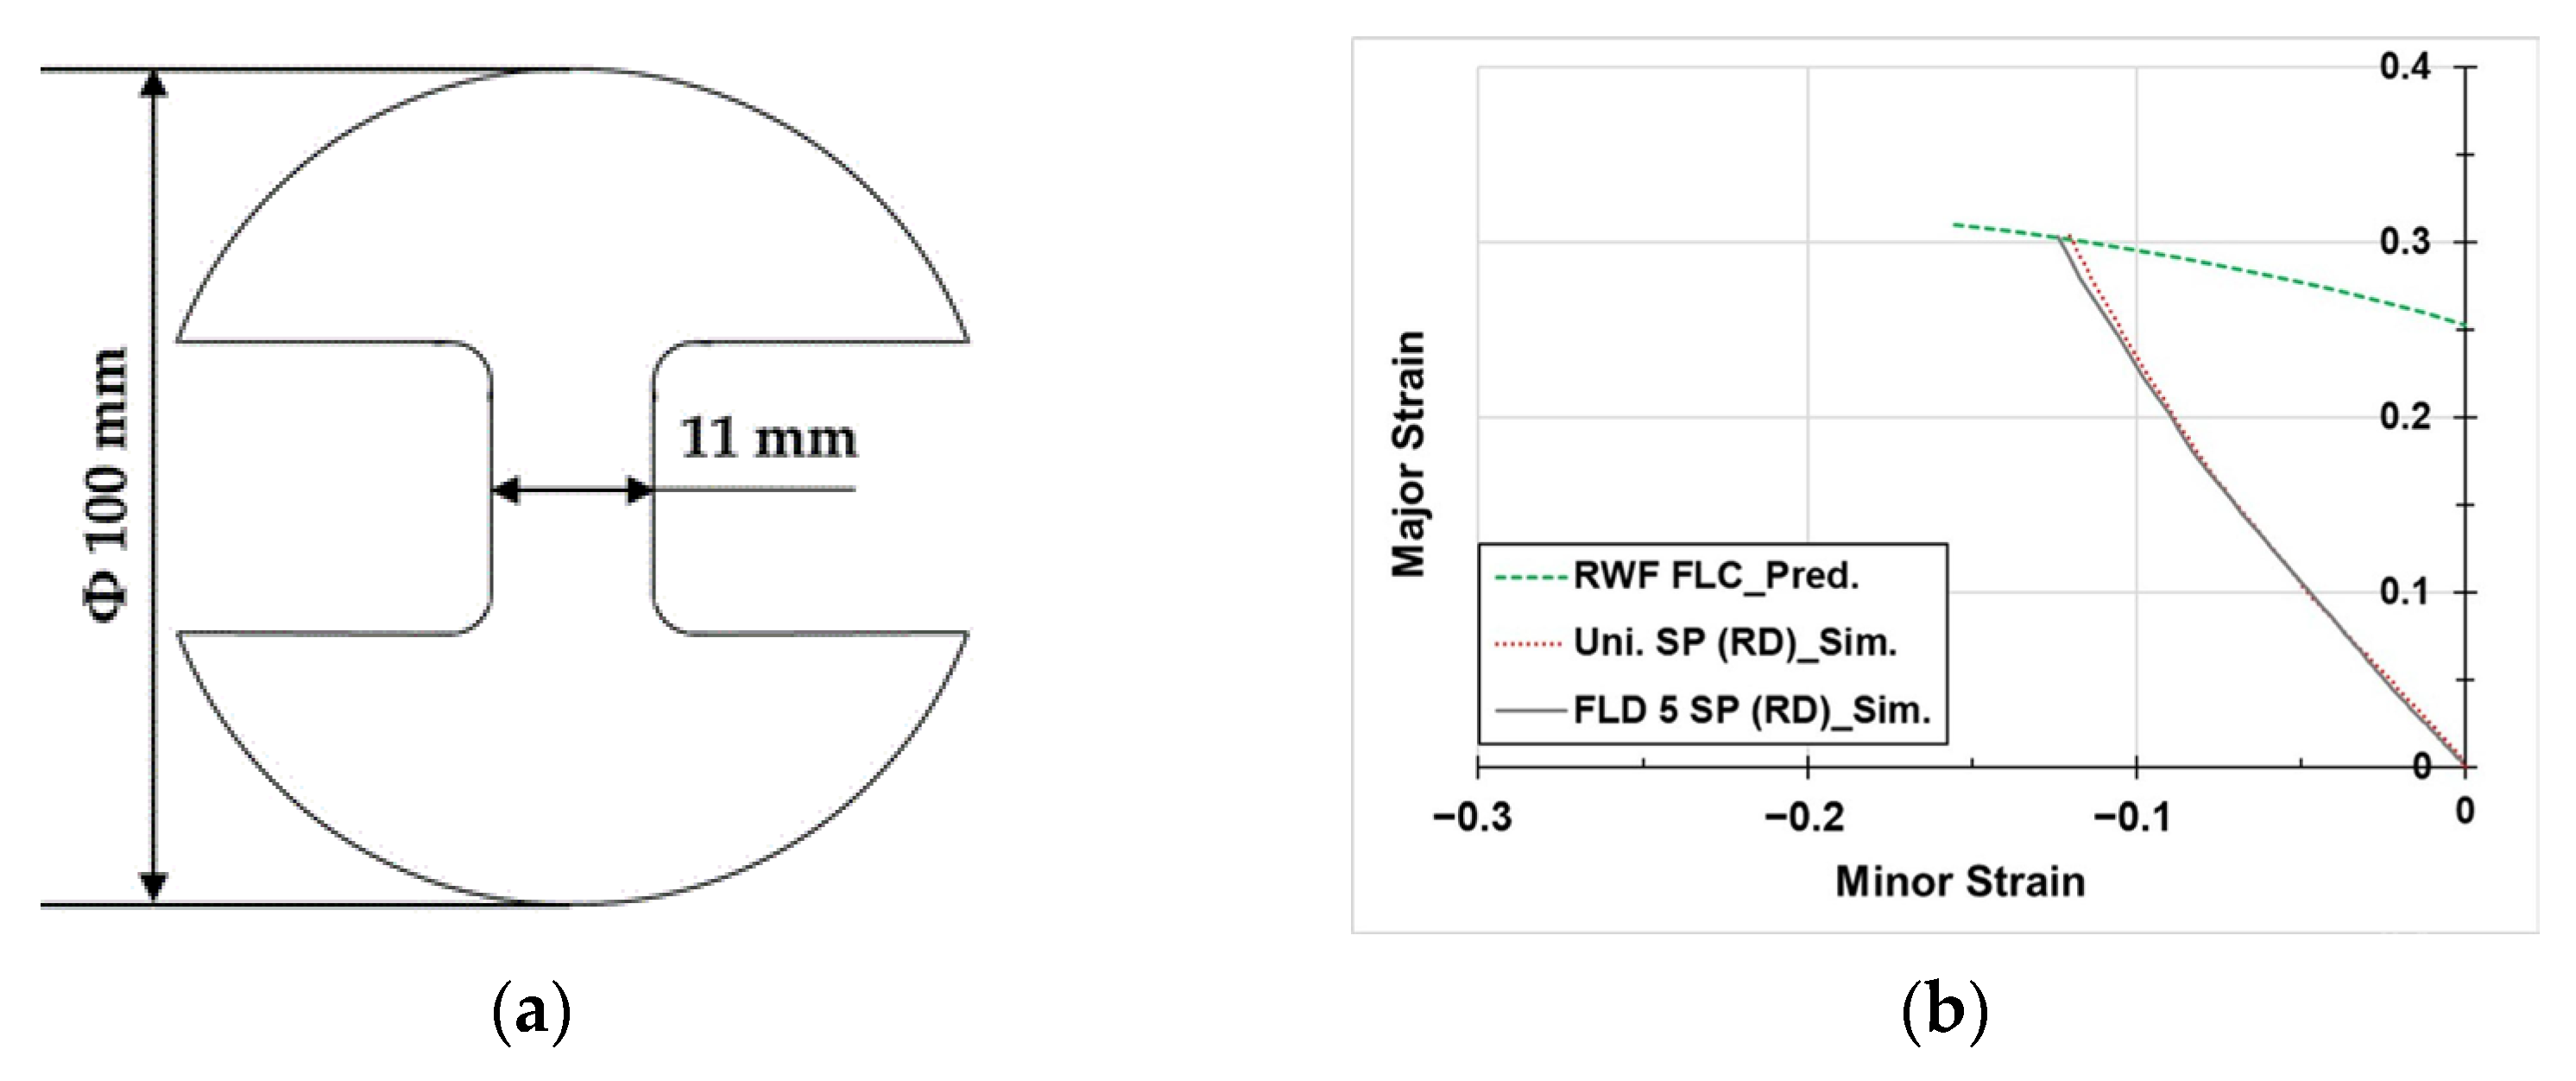
Figure 12 illustrates the geometry of the FLD 5 specimen and compares the SPs between the FLD 5 and uniaxial tensile specimens in the FE model. Table 6 summarises the simulated major and minor fracture strains, as well as the R-values for RD specimens under both Nakajima and uniaxial tensile conditions. Given the validated FE model in Section 3.2, the R-value in the rolling direction (RRD) from uniaxial tension was directly adopted from the simulation. The results indicate that the FLD 5 specimen subjected to the isothermal Nakajima test exhibits a strain path closely matching that of the uniaxial tensile test. The predicted RRD values from both methods differ by less than 5%, confirming that the FLD 5 specimen effectively approximates uniaxial tensile deformation behaviour in the Nakajima test.
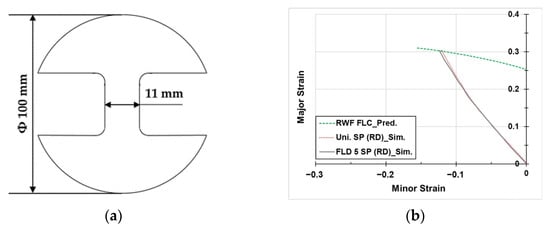
Figure 12.
(a) Geometry of the FLD 5 specimen; (b) SPs comparison between FLD 5 and uniaxial tensile specimens from FE simulation.
Table 6.
Simulated fracture strains and RRD values obtained from the Nakajima and uniaxial tensile tests.
In addition to evaluating the R-value of AA7075 sheets at fracture under warm forming conditions, it is also important to characterise the strain path developed under specific deformation conditions. To preliminarily validate the feasibility of this approach for capturing the strain path of AA7075 under the RWF process, an experiment was conducted by interrupting the punch stroke at 70% of the total fracture stroke. Strain measurements were taken from the uniformly deformed centre region of the FLD 5 specimen.
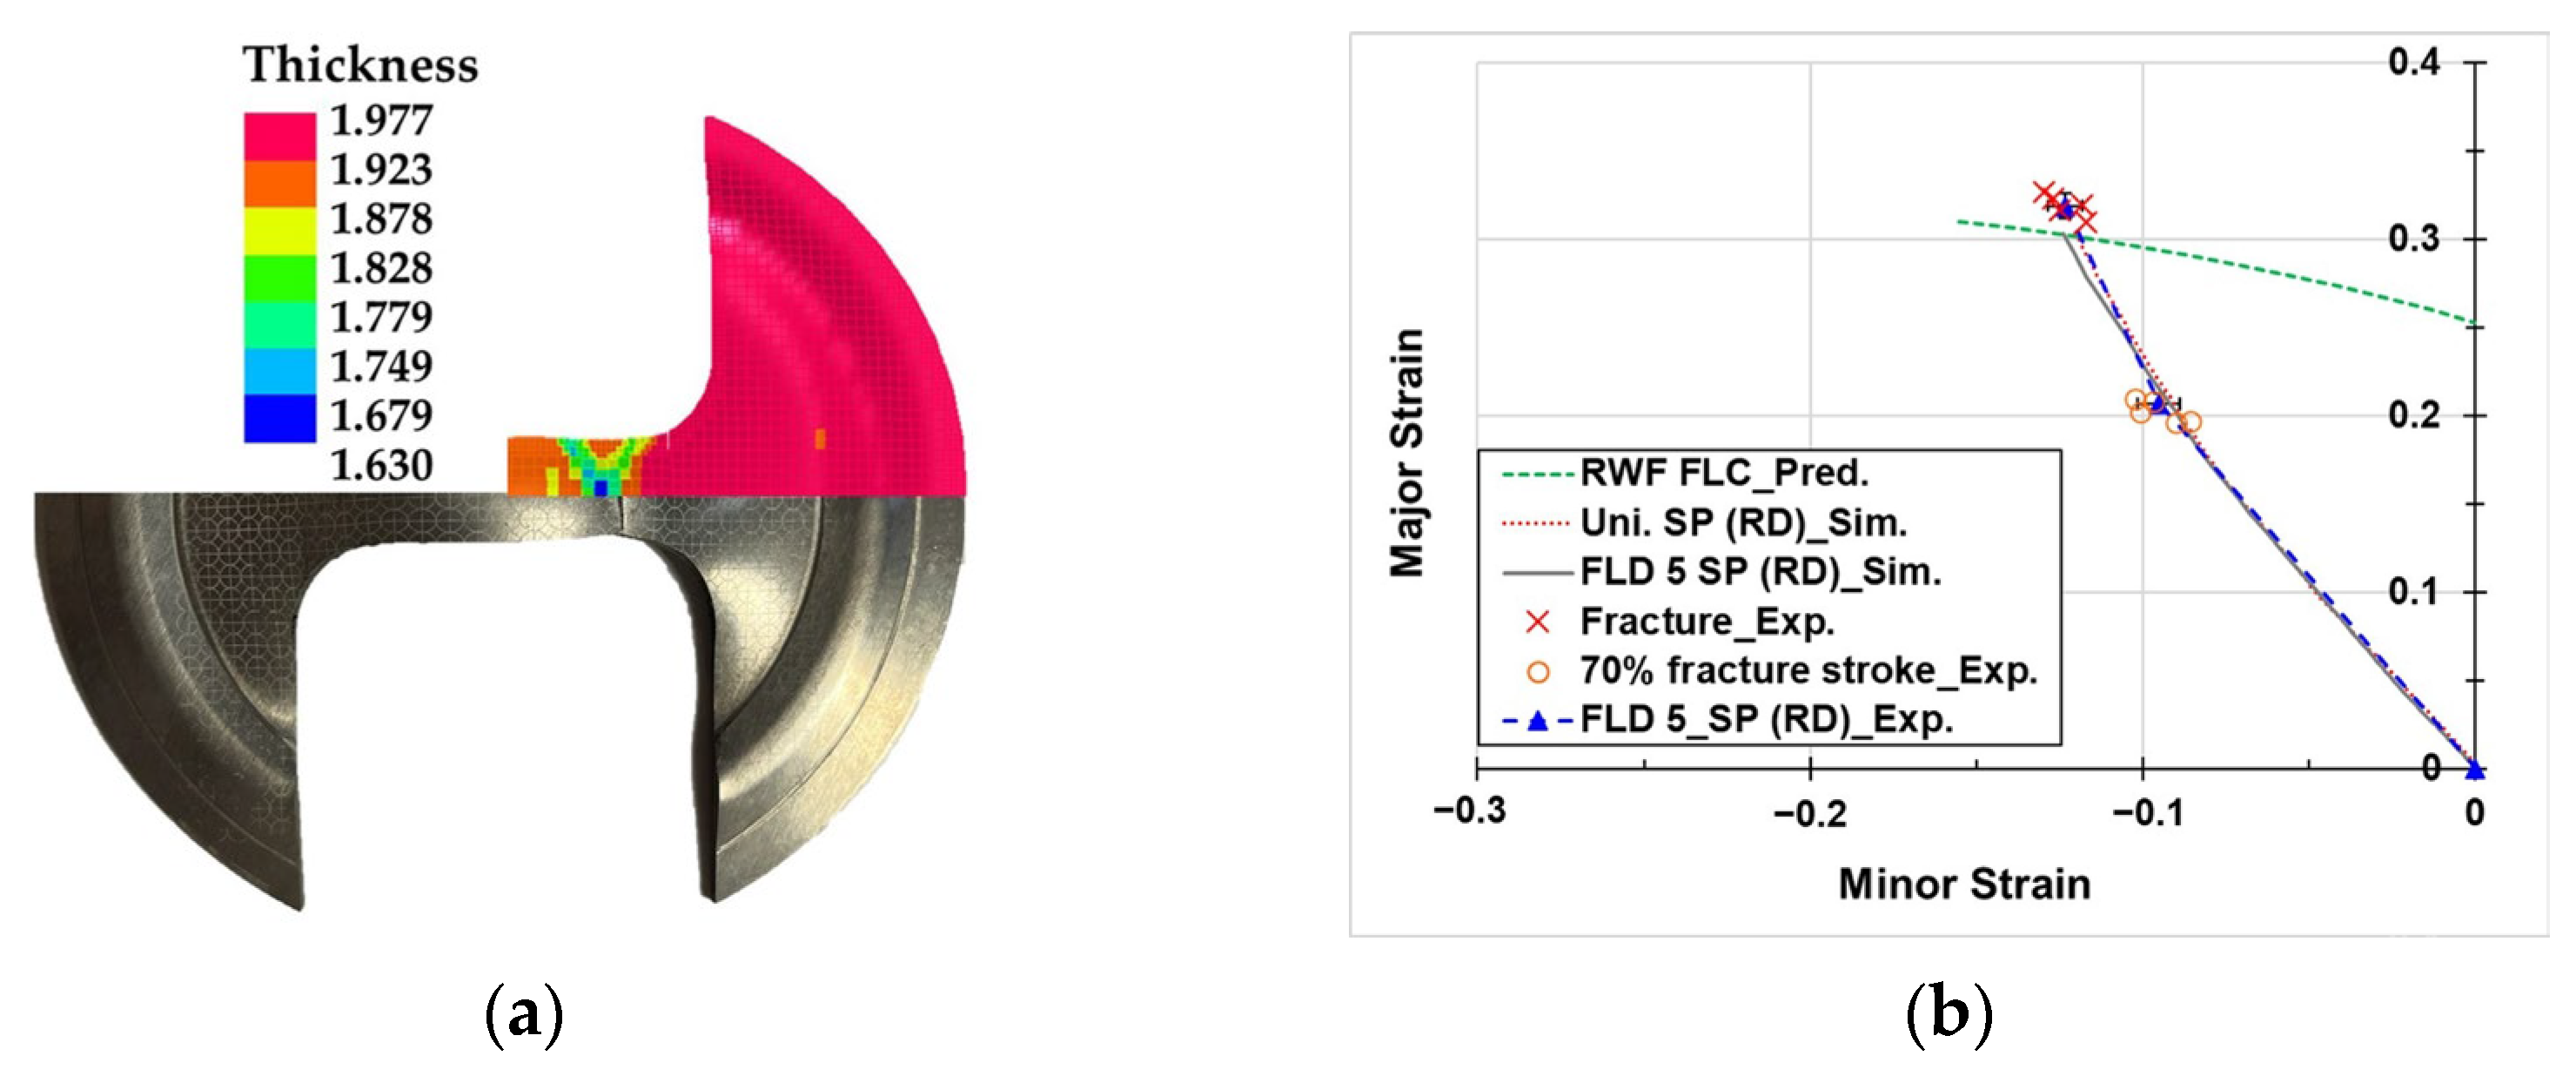
Figure 13a,b compare the experimentally observed and FE-predicted fracture position and strain paths for RD-oriented specimens, respectively. The experimentally measured major and minor fracture strains and R-value from the Nakajima tests, along with the corresponding FE-predicted results under uniaxial tensile conditions, are summarised in Table 7. The comparison results indicate that the fracture location of the FLD 5 specimen in the RD closely matches the simulation, and that its strain path is well aligned with the FE model predictions under both uniaxial tensile and FLD 5 conditions. These results confirm the predictive accuracy of the FE model developed in this study for the RWF process. Furthermore, the RRD value at fracture obtained from the FLD 5 RD specimen differs by less than 5% from that determined under uniaxial tensile testing in the RD, further validating the accuracy and reliability of the proposed method for R-value measurement.

Figure 13.
(a) Geometry of the FLD 5 specimen; (b) SPs comparison between FLD 5 and uniaxial tensile specimens from FE simulation.
Table 7.
Comparison of fracture strains and RRD-values from the Nakajima test and the uniaxial FE prediction.
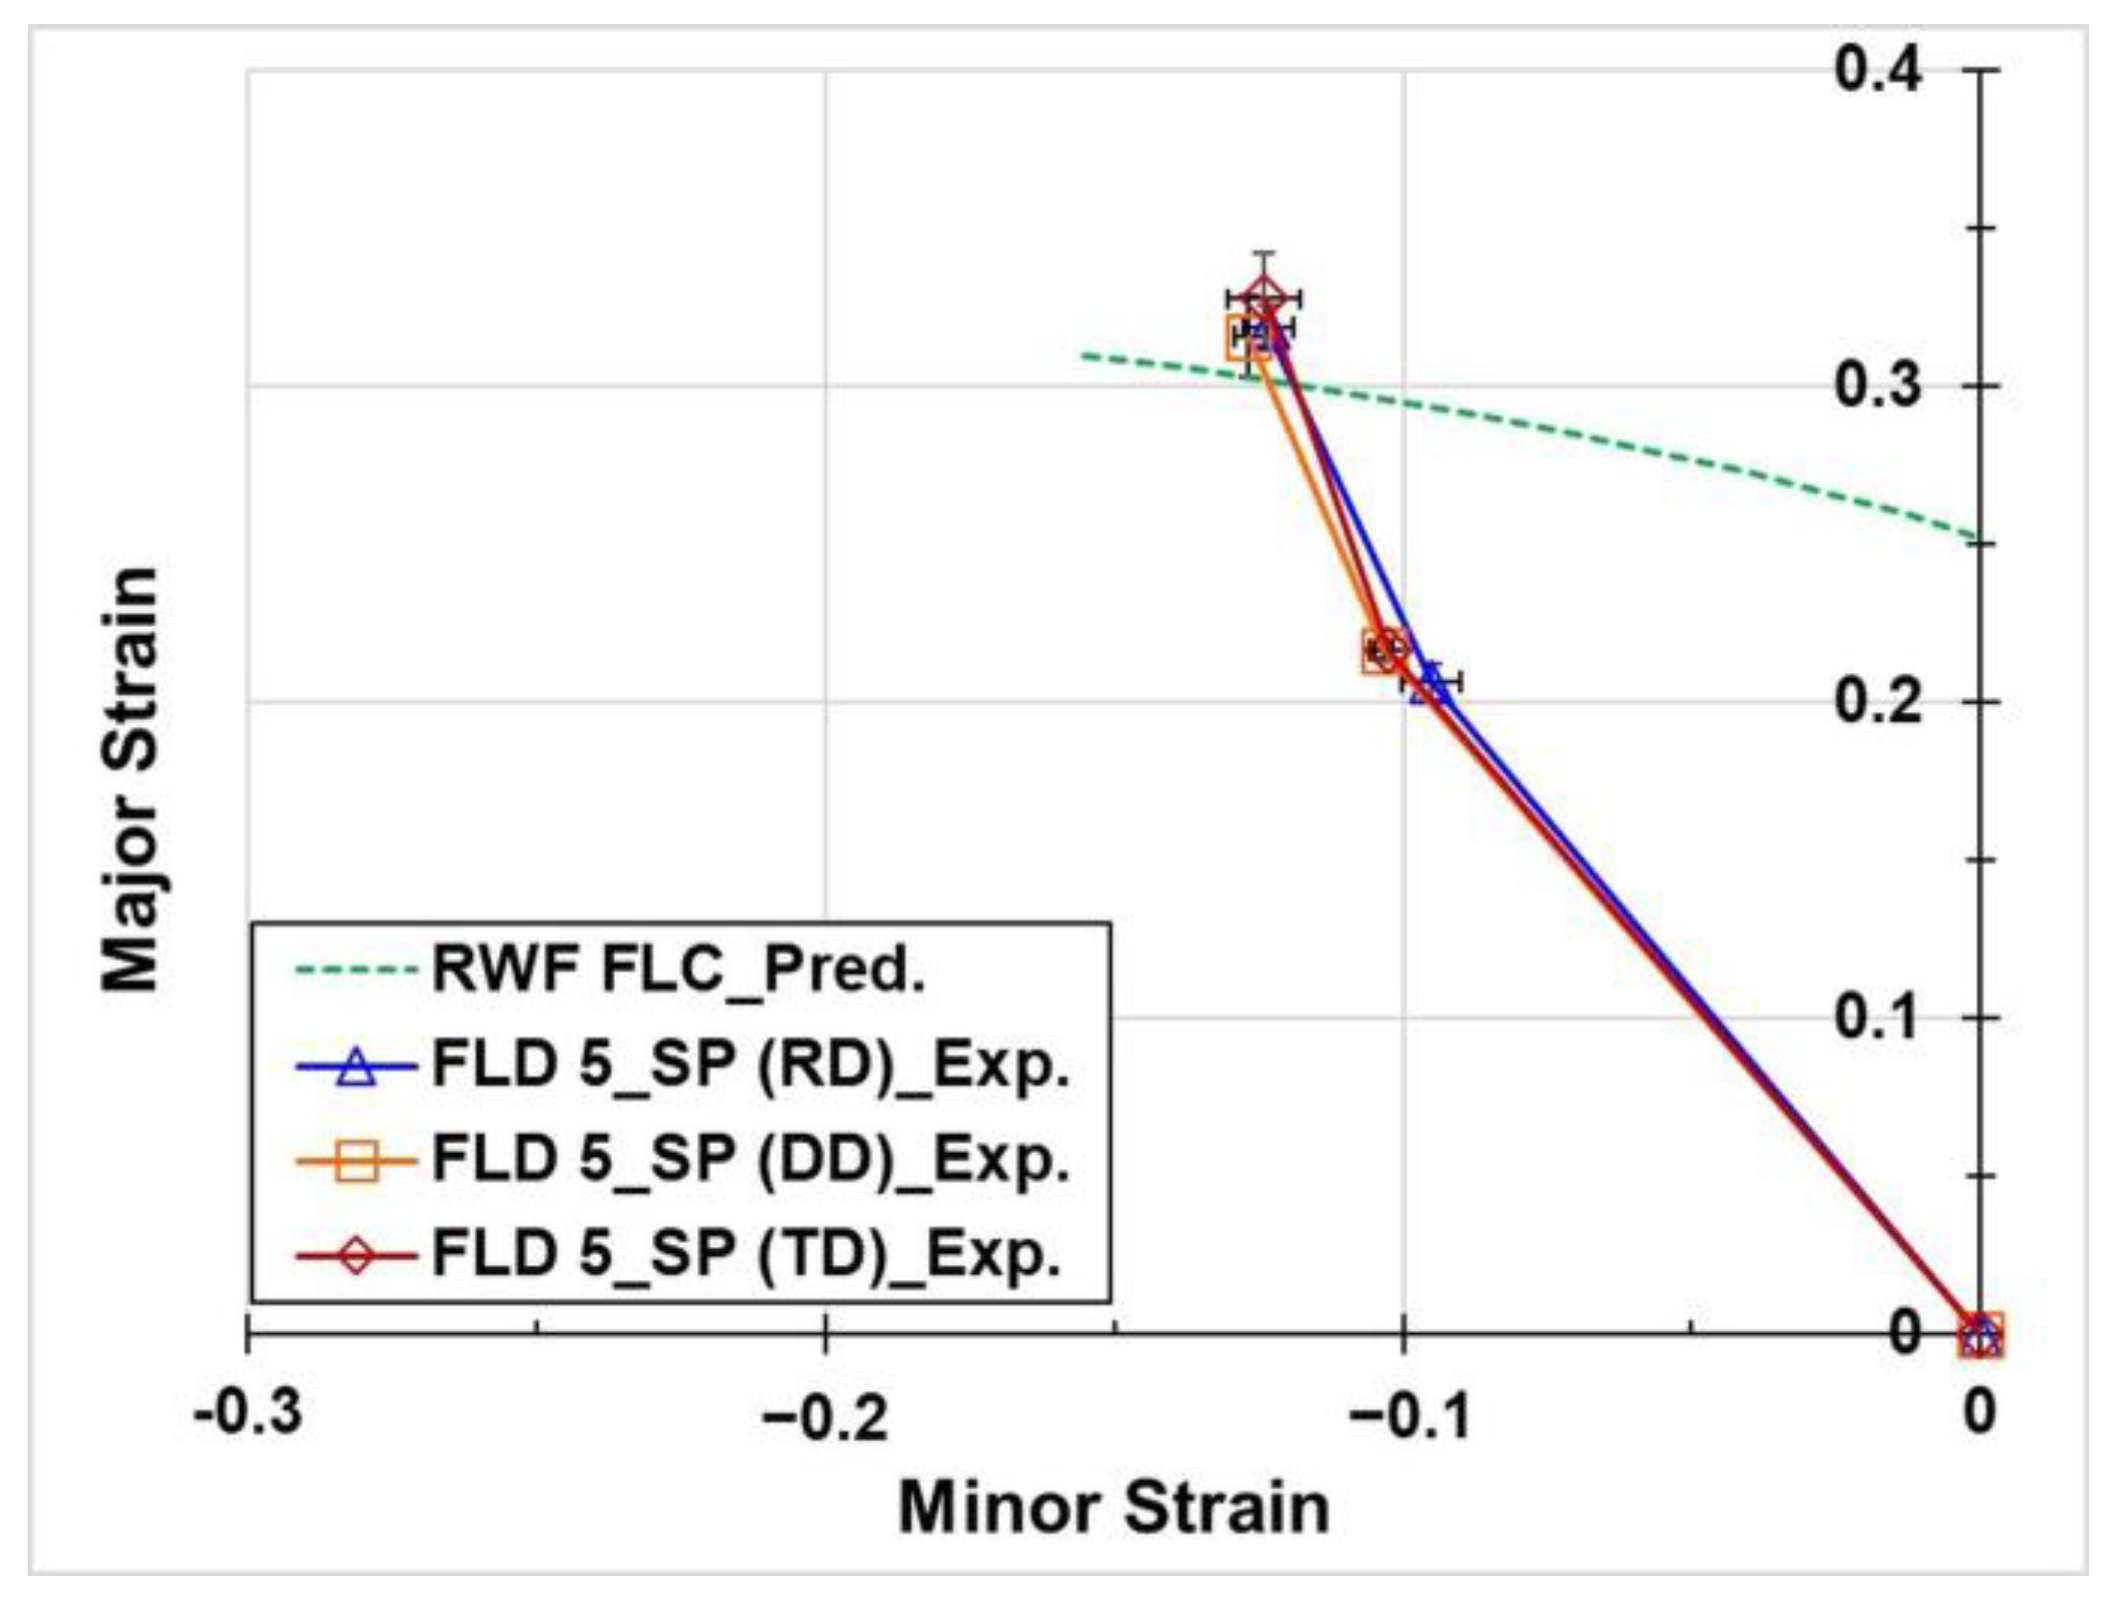
To evaluate the deformation behaviour and anisotropy of AA7075 sheets under the RWF condition, specimens were prepared along the RD, transverse direction (TD), and diagonal direction (DD, 45° to RD). The test results for specimens in the three orientations are shown in Figure 14, while the major and minor fracture strains, R-values, average R (), and planar anisotropy parameter (ΔR) for each orientation are summarised in Table 8.
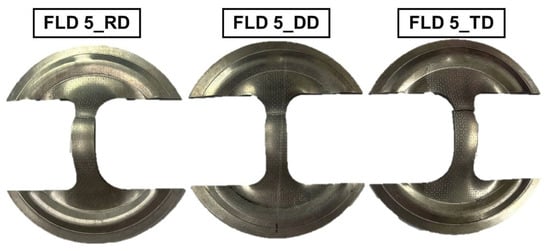
Figure 14.
FLD 5 formed parts in RD, DD, and TD from the Nakajima tests under the RWF process.
Table 8.
Major and minor fracture strains, R, , and for RD, TD, and DD specimens from Nakajima tests under the RWF process.
The experimental results indicate that specimens in all three orientations fracture at similar locations under uniaxial tensile deformation, exhibiting comparable strain paths, as illustrated in Figure 15. Major and minor fracture strains, R-values, , and the for each specimen orientation are summarized in Table 8. The R-values are consistent across directions, and the calculated ΔR is minimal, indicating limited directional dependence. These findings suggest that, under the RWF condition, AA7075 sheets display minimal anisotropy, and their deformation behaviour can be reasonably approximated as isotropic. This minimal anisotropy justifies the assumption of isotropic deformation and supports the use of the von Mises yield criterion in the fracture model developed in this study.
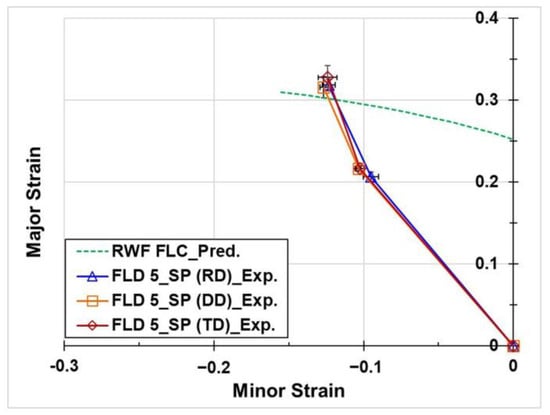
Figure 15.
Experimental strain paths (SPs) of specimens in the three orientations (RD, TD, and DD) from the Nakajima tests under the RWF process.
5. Conclusions
In this study, the critical precipitation characteristics influencing the formability of AA7075 sheets under three warm forming processes—retrogression (RWF), pre-aged (PAWF), and ageing warm forming (AWF)—were systematically identified. This was achieved by correlating the results of isothermal warm Nakajima tests and uniaxial tensile tests (from the authors’ previous research) with quantitative microstructural analysis. Based on these findings, a modified Cockcroft–Latham fracture criterion incorporating matrix precipitate characteristics was proposed to enhance the accuracy of forming limit curves (FLCs) predictions for AA7075 under various warm forming conditions. The main conclusions of this study are summarised as follows:
- Based on the Nakajima and uniaxial tensile test results under the three investigated warm forming conditions, dynamic recovery was active, as evidenced by the post-peak decline in the instantaneous work-hardening rate. However, its influence on fracture strain and formability was limited. Instead, the flow stress level—reflecting deformation resistance—was identified as the primary factor governing formability.
- Across all warm forming conditions, AA7075 specimens contained shearable precipitates, with deformation resistance primarily governed by the product of precipitate volume fraction and average radius (fvRavg). A strong inverse correlation was observed between fvRavg and formability. AWF-treated specimens, with smaller precipitate sizes and lower fvRavg, exhibited superior formability, while RWF specimens, with the highest fvRavg, showed the poorest.
- As fvRavg was identified as the most influential precipitate parameter affecting formability, it was incorporated into the modified C&L fracture criterion. This integration markedly enhanced the prediction accuracy of forming limit curves across different warm forming conditions. The calibrated fracture energy constant C, derived from model predictions, reflects the deformation resistance of AA7075 under each process. Its strong positive correlation with fvRavg highlights the governing role of matrix precipitate morphology in fracture behaviour. Accordingly, C serves as a reliable and quantitative indicator of microstructural influence on the formability of AA 7075 sheets across the investigated warm forming processes.
- The proposed fracture model was validated through finite element (FE) simulations under RWF conditions, confirming its reliability in predicting deformation and fracture behaviour. Building on this validated model, a practical method was developed for estimating R-values by replicating the strain path of the Nakajima tests, achieving less than 5% deviation from conventional tensile tests and addressing key limitations of traditional high-temperature R-value measurements.
- The near-isotropic deformation behaviour observed under RWF conditions supports the validity of the modelling assumptions and justifies the use of the von Mises yield criterion in the fracture framework.
Collectively, by incorporating microstructural parameters into the fracture criterion and integrating material characterisation with finite element-based process simulation, this study bridges the gap between traditional formability models and numerical modelling for comprehensive warm forming simulations. This represents the principal innovation and contribution of the work, offering a robust and scalable framework for predictive modelling, alloy design, and manufacturing optimisation in the warm forming of high-strength aluminium alloys.
Author Contributions
Conceptualization, W.-L.C. and R.-S.L.; methodology, W.-L.C. and R.-S.L.; software, W.-L.C.; validation, W.-L.C.; formal analysis, W.-L.C.; investigation, W.-L.C.; resources, W.-L.C.; data curation, R.-S.L.; writing—original draft preparation, W.-L.C.; writing—review and editing, R.-S.L.; visualization, W.-L.C.; supervision, R.-S.L.; project administration, W.-L.C. and R.-S.L.; funding acquisition, W.-L.C. All authors have read and agreed to the published version of the manuscript.
Funding
This research received no external funding.
Data Availability Statement
The original contributions presented in this study are included in the article; further inquiries can be directed to the corresponding author.
Acknowledgments
The authors would like to express their sincere thanks to the Metal Industries Research and Development Centre (MIRDC) for the equipment and technical support. Special gratitude is also extended to Tsai-Fu Chung from the Department of Materials Science and Engineering at National Yang-Ming Chiao Tung University for the excellent support with the microstructure observation in this study.
Conflicts of Interest
The authors declare no conflicts of interest.
References
- Kaczyński, P.; Skwarski, M.; Jaśkiewicz, K. Development of the technology for press-forming of energy-absorbing elements made of 7075 aluminum alloy. J. Manuf. Process 2020, 50, 676–683. [Google Scholar] [CrossRef]
- Huo, J.; Hou, L.; Zhang, Y.; Zhang, J. Warm formability and post-forming microstructure/property of high-strength AA7075-T6 Al alloy. Mater. Sci. Eng. A 2016, 675, 44–54. [Google Scholar] [CrossRef]
- Ivanoff, T.A.; Carter, J.T.; Hector, L.G., Jr.; Taleff, E.M. Retrogression and reaging applied to warm forming of high-strength aluminum alloy AA7075-T6 sheet. Metall. Mater. Trans. A 2019, 50, 1545–1561. [Google Scholar] [CrossRef]
- Kumar, M.; Ross, N.G. Influence of temper on the performance of a high-strength Al–Zn–Mg alloy sheet in the warm forming processing chain. J. Mater. Process Technol. 2016, 231, 189–198. [Google Scholar] [CrossRef]
- Chen, W.L.; Lee, R.S. Novel aging warm-forming process of Al-Zn-Mg aluminum alloy sheets and influence of precipitate characteristics on warm formability. Metals 2024, 14, 844. [Google Scholar] [CrossRef]
- Ozturk, F.; Lee, D. Experimental and numerical analysis of out-of-plane formability test. J. Mater. Process Technol. 2005, 170, 247–253. [Google Scholar] [CrossRef]
- Feister, T.; Kim, H.; Gwinn, A.; Schiller, T.; Austin, M. Failure predictions in warm forming of 7075-T6 aluminum structural parts. Mater. Sci. Eng. 2018, 418, 012024. [Google Scholar] [CrossRef]
- Marciniak, Z.; Kuczyński, K. Limit strains in the processes of stretch-forming sheet metal. Int. J. Mech. Sci. 1967, 9, 609–620. [Google Scholar] [CrossRef]
- Chen, J.; Gong, P.; Yang, L. Forming limit evaluation for AA5182 aluminum alloy at warm temperatures based on M–K model. J. Mater. Eng. Perform. 2020, 29, 1176–1184. [Google Scholar] [CrossRef]
- Zhou, J.; Yang, X.; Wang, B.; Wang, J. M–K model based forming limit prediction of aluminum–lithium alloy 2060 and its application in hot stamping. Int. J. Adv. Manuf. Technol. 2023, 127, 5293–5306. [Google Scholar] [CrossRef]
- Pishyar, H. Constitutive Behaviour and Formability of Pre-Aged AA7075 Sheet in a Warm Forming Process. Master’s Thesis, University of Waterloo, Waterloo, ON, Canada, 2021. [Google Scholar]
- Cockcroft, M.G.; Latham, D.J. Ductility and the workability of metals. J. Inst. Met. 1968, 96, 33–39. [Google Scholar]
- Ozturk, F.; Lee, D. Analysis of forming limits using ductile fracture criteria. J. Mater. Process Technol. 2004, 147, 397–404. [Google Scholar] [CrossRef]
- Atkins, A.G. Possible explanation for unexpected departures in hydrostatic tension–fracture strain relations. J. Mater. Sci. Technol. 1981, 15, 81–83. [Google Scholar] [CrossRef]
- Zhuang, W.-L. Finite Element Simulation for Predicting the Forming Limit of Sheet Metals. Master’s Thesis, National Cheng Kung University, Tainan, Taiwan, 1990. [Google Scholar]
- Lee, R.S.; Lin, Y.K.; Chien, T.W. Experimental and theoretical studies on formability of 22MnB5 at elevated temperatures by Gleeble simulator. Procedia Eng. 2014, 81, 2343–2348. [Google Scholar] [CrossRef]
- Chen, C.H.; Lee, R.S.; Gau, J.T. Size effect and forming-limit strain prediction for microscale sheet metal forming of stainless steel 304. J. Strain Anal. Eng. Des. 2010, 45, 283–299. [Google Scholar] [CrossRef]
- Wiesenmayer, S.; März, R.; Merklein, M. Numerical study on local short-term heat treatments for joining by forming of high-strength 7xxx aluminum. Prod. Eng. Res. Devel. 2023, 17, 829–845. [Google Scholar] [CrossRef]
- Grabner, F.; Österreicher, J. A materials science-based approach to finite element simulation of warm-forming of Al-Mg-Zn alloys. Key Eng. Mater. 2022, 926, 744–751. [Google Scholar] [CrossRef]
- Österreicher, J.A.; Tunes, M.A.; Grabner, F.; Arnoldt, A.; Kremmer, T.; Pogatscher, S.; Schlögl, C.M. Warm-forming of pre-aged Al–Zn–Mg–Cu alloy sheet. Mater. Des. 2020, 193, 108837. [Google Scholar] [CrossRef]
- Chung, T.F.; Yeh, C.W.; Liaw, Y.S.; Lin, J.R.; Ho, P.L.; Hsiao, C.N.; Tsao, C.S.; Chou, C.M.; Yang, Y.L.; Yang, J.R.; et al. Grain structure and coprecipitation behavior of high-Zn containing Al–Zn–Mg–Cu aluminium alloys during deformation via high-temperature upsetting extrusion. J. Alloys Compd. 2023, 968, 171871. [Google Scholar] [CrossRef]
- Yang, H.; Zhang, Y.; Zheng, S.; Zaki, Z.I.; Huang, R.; Lu, S.; Sun, P.; Ibrahim, M.M.; Hou, H.; Li, M.; et al. Dissolution behavior of dizinc magnesium phase in Al–Zn–Mg–Cu alloy. Adv. Compos. Hybrid. Mater. 2023, 6, 211. [Google Scholar] [CrossRef]
- Zhang, W.; Pang, Q.; Lu, J.; Hu, Z. Comparative study on deformation behavior, microstructure evolution and post-forming property of an AlZnMgCu alloy in a novel warm forming process. J. Mater. Process Technol. 2023, 312, 117854. [Google Scholar] [CrossRef]
- Deschamps, A.; Brechet, Y. Influence of predeformation and ageing of an Al–Zn–Mg alloy—II. Modeling of precipitation kinetics and yield stress. Acta Mater. 1998, 47, 293–305. [Google Scholar] [CrossRef]
- Rader, K.E.; Carter, J.T.; Hector, L.G.; Taleff, E.M. Plastic deformation and ductility of AA7075 and AA6013 at warm temperatures suitable to retrogression forming. Metall. Mater. Trans. A 2021, 52, 4003–4017. [Google Scholar] [CrossRef]
- Xiao, W.; Wang, B. Behaviors and modeling of thermal forming limits of AA7075 aluminum sheet. Arch. Civ. Mech. Eng. 2020, 20, 10. [Google Scholar] [CrossRef]
- Harant, M.; Verleysen, P.; Forejt, M.; Kolomy, S. The effects of strain rate and anisotropy on the formability and mechanical behaviour of aluminium alloy 2024-T3. Metals 2024, 14, 98. [Google Scholar] [CrossRef]
- Royne, S.; Laurent, H.; Maillard, A. Optimum heating time for warm forming of AA7075 aluminum alloy in T6 condition. Int. J. Adv. Manuf. Technol. 2024, 133, 6005–6021. [Google Scholar] [CrossRef]


Disclaimer/Publisher’s Note: The statements, opinions and data contained in all publications are solely those of the individual author(s) and contributor(s) and not of MDPI and/or the editor(s). MDPI and/or the editor(s) disclaim responsibility for any injury to people or property resulting from any ideas, methods, instructions or products referred to in the content. |
© 2025 by the authors. Licensee MDPI, Basel, Switzerland. This article is an open access article distributed under the terms and conditions of the Creative Commons Attribution (CC BY) license (https://creativecommons.org/licenses/by/4.0/).