Article

Influence of Copper Stoichiometric Composition and Compaction Method on Mechanical Properties of CuxSe Thermoelectric Materials

by
Fani Stergioudi
1,2,*,
Georgios Skordaris
3,
Maria Pappa
1,2,
Nikolaos Michailidis
1,2,
Vasileios Pavlidis
4,
Dimitrios Stathokostopoulos
4,
Aikaterini Teknetzi
4,
Lamprini Malletzidou
4,
George Vourlias
4,
Georgios Maliaris
5 and
Ioanna K. Sfampa
6
1
Physical Metallurgy Laboratory, Department of Mechanical Engineering, School of Engineering, Aristotle University of Thessaloniki, 54124 Thessaloniki, Greece
2
Centre for Research & Development of Advanced Materials (CERDAM), Center for Interdisciplinary Research and Innovation, Balkan Centre, Building B’, 10th km Thessaloniki-Thermi Road, 57001 Thessaloniki, Greece
3
Laboratory for Machine Tools and Manufacturing Engineering, School of Mechanical Engineering, Aristotle University of Thessaloniki, 54124 Thessaloniki, Greece
4
Laboratory of Advanced Materials & Devices, School of Physics, Faculty of Sciences, Aristotle University of Thessaloniki, 54124 Thessaloniki, Greece
5
Hephaestus Laboratory, Department of Chemistry, School of Science, Democritus University of Thrace, 65404 Kavala, Greece
6
Group R&D, KLEEMANN, Industrial Area of Kilkis, 61100 Kilkis, Greece
*
Author to whom correspondence should be addressed.
Metals 2025, 15(6), 640; https://doi.org/10.3390/met15060640
Submission received: 5 May 2025 / Revised: 2 June 2025 / Accepted: 3 June 2025 / Published: 6 June 2025

Abstract

This study investigates the structural and mechanical properties of Cu–Se-based thermoelectric materials with varying Cu:Se stoichiometries (1.8, 1.9, and 2.0). Phase composition was examined using X-ray diffraction (XRD), revealing a transition from a mixed α/β-phase in Cu:Se = 2.0 to a fully cubic β-phase Cu2−xSe in Cu:Se = 1.8. Crystallite size analysis showed a reduction with increasing Cu content, which strongly influenced mechanical behavior. Vickers microhardness and nanoindentation tests were employed to assess hardness, elastic modulus, and elastic recovery. The Cu:Se = 2.0 sample exhibited the highest hardness but the lowest elastic recovery and elastic modulus from indentation, suggesting strong intragrain cohesion but limited elastic deformation due to fine grain structure. In contrast, the sub-stoichiometric Cu:Se = 1.8 phase displayed higher elastic modulus and recovery, possibly due to a more rigid Se sub-lattice and defect-mediated deformation mechanisms. Compression tests confirmed the higher bulk modulus in the Cu-deficient phase. Bending tests also showed that the Cu-deficient phase exhibited the highest bending modulus, further supporting its enhanced stiffness under elastic deformation. These results highlight the significant role of stoichiometry and crystallite structure in tuning the mechanical response of thermoelectric Cu–Se compounds, with implications for their durability and performance in practical applications.

1. Introduction

To meet the requirements of practical applications for thermoelectric (TE) materials, they must exhibit both high performance and mechanical robustness. Recently, progress has been made in the design of high-efficiency thermoelectric materials. However, the mechanical properties of these materials remain unsatisfactory.
Measuring or accurately evaluating the mechanical properties of TE materials can bridge the gap between atomic-level (mechanical) and physical-level (electronic/transport) understanding. This would enable the development of fully optimized functional units, improving both aspects. In this way, material selection for specific applications will become more efficient. Knowledge and control of the mechanical properties of TE materials are essential for advancing practical thermoelectric applications and moving the entire TE technology towards a higher Technology Readiness Level (TRL) [1,2].
Key mechanical properties such as elastic constants (e.g., Young’s modulus), strength, and hardness are critical for designing practical devices. Elastic constants provide insights into the stiffness of a material, while strength defines the loading conditions under which the material maintains its shape. Characterizing these mechanical properties (elastic constants, strengths, and hardness) is challenging but provides researchers and manufacturers with valuable data for improving and further developing TE materials.
Most TE materials are brittle, meaning they exhibit little or no plastic deformation (and therefore no yield strength), with failure often occurring catastrophically. Bi2Te3 and its alloys, which have a long history of use in direct energy conversion, were among the first to receive attention for their mechanical strength [3,4]. The low mechanical strength of TE materials not only leads to failures during device fabrication but also limits the degree of miniaturization required for TE units. Strengthening materials can be achieved by tailoring their microstructure at the micron or submicron scale. Additionally, attempts have been made to incorporate nanoparticles to produce composite materials [2,3,4,5,6]. However, this approach often results in a reduced ZT value of the materials, as the reinforcing elements improve mechanical properties without significantly enhancing TE performance [6].
Copper selenide (Cu2Se) and its sub-stoichiometric derivatives (Cu2−xSe) have emerged as promising thermoelectric materials due to their exceptional combination of high electrical conductivity and intrinsically low thermal conductivity, which are critical for achieving a high thermoelectric figure of merit (ZT) [7,8,9,10,11]. Above ~400 K, Cu2Se exhibits superionic behavior where copper ions become highly mobile while the selenium sub-lattice remains relatively rigid [12,13]. This unusual phenomenon decouples electrical and thermal transport, enabling superior thermoelectric performance [14,15,16]. Compared to conventional TE materials such as bismuth telluride (Bi2Te3) and lead telluride (PbTe), which dominate near-room and mid-temperature applications, respectively, Cu2Se-based compounds offer the advantages of lower toxicity, greater elemental abundance, and lower cost. While Bi2Te3 suffers from thermal instability and PbTe raises environmental concerns due to lead content [17,18], Cu2Se provides a more sustainable alternative, particularly suited for medium-to-high-temperature waste heat recovery. Furthermore, the structural flexibility of Cu2Se, stemming from its defect chemistry and variable copper stoichiometry, allows for tailored optimization of its thermoelectric and mechanical properties, further enhancing its viability for next-generation energy conversion devices [19,20].
This study focuses on the mechanical characterization of copper selenide (Cu2Se) materials and investigates strategies to enhance their mechanical performance by optimizing the copper stoichiometric composition. The primary objective was the synthesis of Cu2Se powders via Mechanical Alloying (MA), followed by consolidation through cold compaction. To thoroughly assess their mechanical behavior, both microhardness (Vickers) and nanohardness measurements were conducted. Additionally, to generate a consistent and comparative dataset across all developed compositions, the materials were tested under elastic compressive and three-point bending conditions—representative of real-world mechanical loading scenarios. This methodology was chosen because most existing studies on thermoelectric materials emphasize compressive testing, while bending tests are more sensitive to defects and microstructural inhomogeneities, providing a more comprehensive understanding of mechanical performance. Although not exhaustive, the evaluated mechanical properties are among the most critical for assessing the practical viability of thermoelectric materials in device applications.

2. Experimental Procedures

2.1. Materials and Specimen Preparation

The different Cu–Se samples were prepared following a specific standard procedure. Copper (purity 99.9%, <45 μm) and selenium (purity 99.5%, <45 μm) powders, both supplied by Thermo Fisher Scientific (Thermo Fisher Scientific, Waltham, MA, USA), were weighed on a precision balance at a 2:1 stoichiometric ratio. The study of composition began with a nominal stoichiometry of Cu:Se = 2.0:1.0, after which the copper content was reduced in 0.1 increments, resulting in nominal stoichiometries of Cu:Se = 1.9:1.0 and Cu:Se = 1.8:1.0.
The mixture of the two powders was then introduced into the agate ball milling vessel containing twenty-five (25) agate balls of 10 mm diameter. The volume ratio of the balls to the inner side of the milling vessel was about 80%. The vessel was then sealed and inert gas (argon) was introduced through suitable valves to reduce the oxygen level to a minimum. Mechanical Alloying (MA) synthesis was carried out using a FRITSCH Planetary Micro Mill PULVERISETTE 7 (FRITSCH, Idar-Oberstein, Germany). MA was performed for 20 cycles of 30 min with a 15 min break per cycle using a planetary ball milling process at rotational speeds of 500 rpm. The optimum conditions for the MA were reported in the previous work [21,22].
Cu–Se powders were directly cold-compacted. All powders were loaded into separate 12 mm diameter cylindrical dies for axial compaction under a pressure of 1 GPa. The resulting samples had a cylindrical shape with a 12.5 mm diameter and a thickness ranging from 3 to 4 mm, depending on the specific composition.

2.2. Microstructural Characterization

The structural and phase identification was performed by X-ray diffraction (XRD) analysis using a 2-cycle Rigaku Ultima+ powder X-ray diffractometer (Rigaku Corporation, Shibuya-Ku, Tokyo, Japan) with copper source (Cu Ka radiation), operating at 40 kV/30 mA and Bragg–Brentano geometry. The XRD patterns were collected in the range of 10–90°, with 0.05° step size and 1 s per step. Also, the X-rays obtained, in addition to highlighting the existence of the different phases, are important as they provide information regarding the size of the crystallite and the percentage contribution of each phase present using the Scherrer equation:
D = Ksλ/FWHM × cos(θ)
where D is the size of the crystallite; Ks is a constant with a value equal to 1; λ is the wavelength; FWHM is the full width at half maximum; and θ is the diffraction angle. Finally, depending on the relative intensities of the different diffraction peaks and their shift, preferred crystallization planes and possible strains are identified.

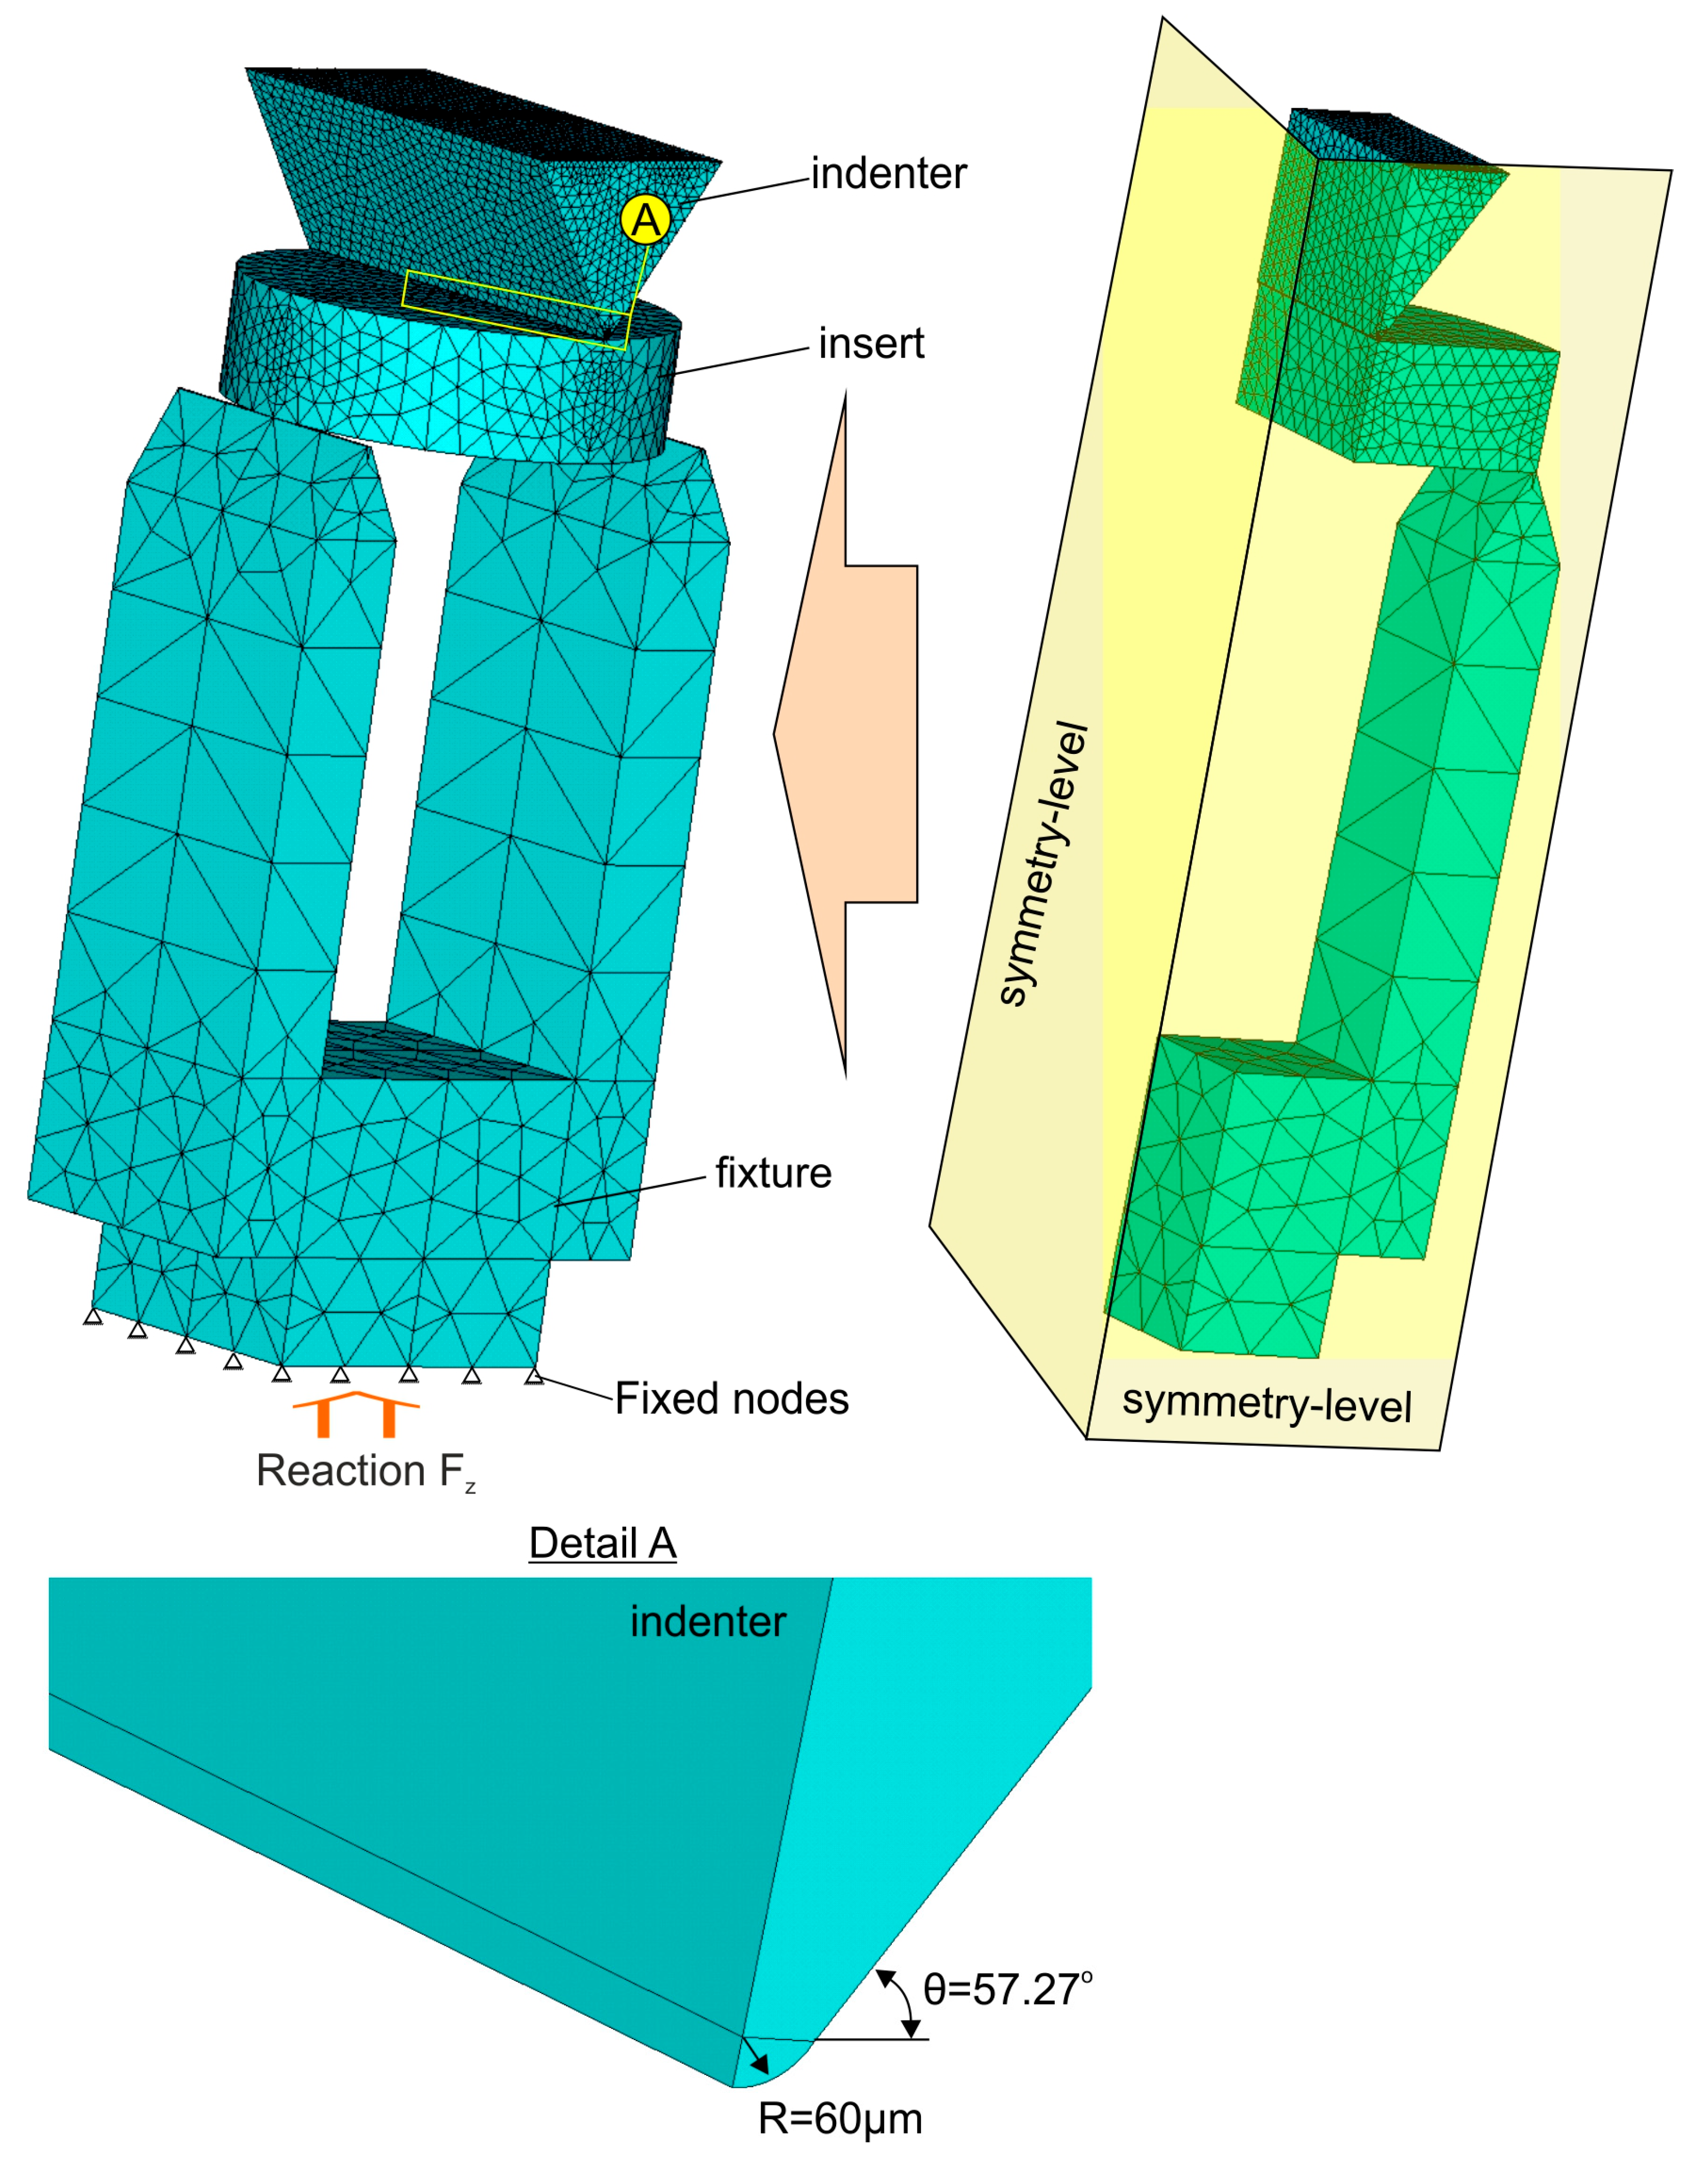
2.3. Mechanical Properties Evaluation and FE Modeling

Mechanical performance, including tensile and three-point bending tests, was evaluated using a DHR-20 Discovery Hybrid Rheometer (TA Instruments, New Castle, DE, USA). The DHR-20 is a Combined Motor and Transducer (CMT) type rheometer capable of operating in both stress-controlled and strain-controlled modes. It enables precise linear Dynamic Mechanical Analysis (DMA) measurements. For this study, axial DMA was performed using both three-point bending and parallel-plate configurations to determine the flexural modulus and the Young’s modulus (E), directly derived from the slope of the linear portion of the stress–strain curve. The three-point bending test was supported by appropriate FEA simulation using the software ANSYS 2024R1 for calculating the flexural modulus. The relative density after the powder compression was almost 98%. This effectively eliminates potential FEA-calculation errors caused by material porosity, thereby justifying the use of 3D solid elements for structural simulation. A constant engineering strain rate of 1 μm/s was applied during testing. Each reported value represents the average of three successful measurements.
The microhardness of the samples was evaluated using a Vickers hardness tester. For each specimen, five successful indentations were performed under a constant load of 200 g with a dwell time of 10 s. This procedure was adopted to ensure measurement accuracy and repeatability. Nanoindentation tests were conducted using a Berkovich diamond indenter. A maximum load of 25 mN was gradually applied during each test, while the resulting penetration depth was continuously recorded. To minimize the influence of surface roughness and improve statistical reliability, 50 indentations were performed on each specimen. The maximum indentation depth reached approximately 800 nm, which, although higher than typical depths, was selected to minimize the influence of surface irregularities and potential secondary phase effects. Prior to testing, all specimens were mechanically ground and polished using SiC papers up to 1200 grit, followed by final polishing with a 3 μm alumina suspension on appropriate polishing cloths to ensure surface uniformity and reduce measurement variability.

3. Results and Discussion

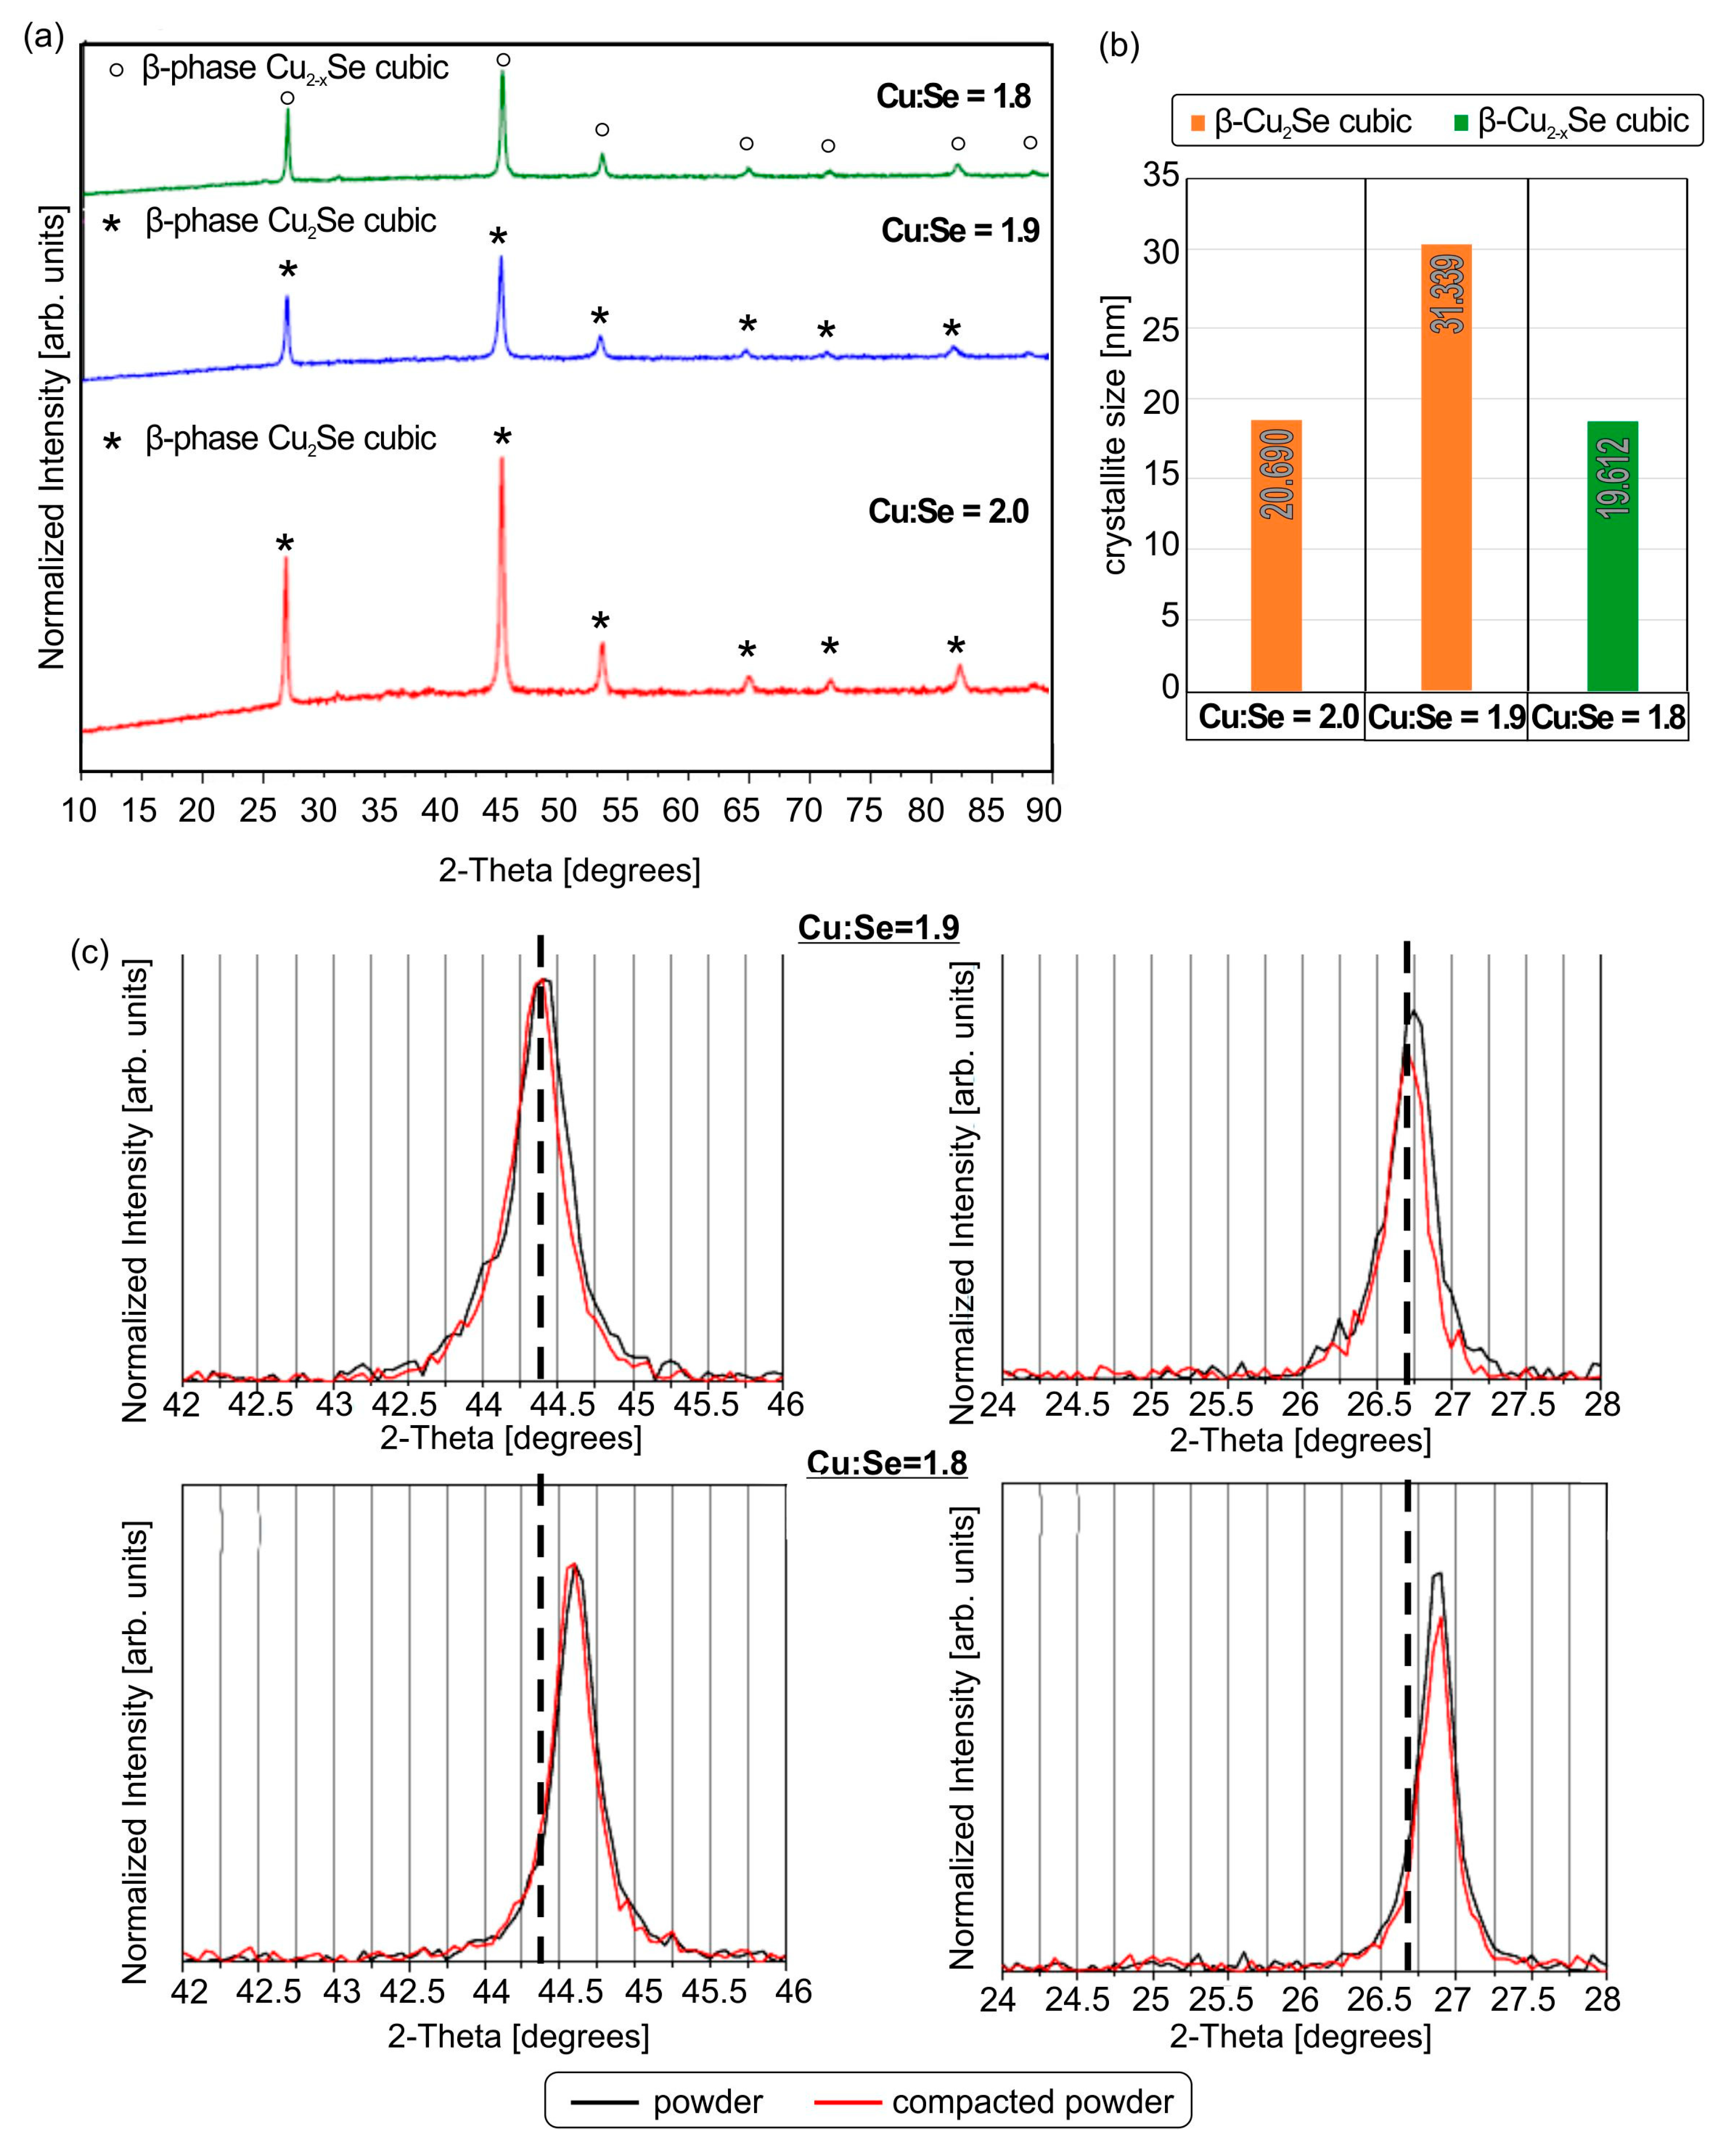
3.1. Microstructural Analysis of Powders Produced

Prior to compaction, all the powders were examined for crystal size range and morphology.
A detailed analysis of the XRD patterns (Figure 1a) leads to the following observations: The identification of all peaks in the X-ray diffraction (XRD) patterns required three distinct reference files: tetragonal α-phase Cu2Se (PDF #29-0575), cubic β-phase Cu2Se (PDF #65-2982), and cubic β-phase Cu2−xSe (PDF #06-0680). These crystal structures have been previously characterized in the literature [23,24]. The cubic Cu2Se (PDF #65-2982) exhibits F-43m (216) symmetry with lattice constants a = 5.760 Å, b = 5.760 Å, c = 5.760 Å, whereas the cubic Cu2−xSe (PDF #06-0680) has F-43m (216) symmetry with slightly smaller lattice constants a = 5.739 Å, b = 5.739 Å, c = 5.739 Å.
A comparison of peak widths among samples with nominal Cu:Se stoichiometries of 1.9 and 1.8 reveals that these two samples exhibit significantly sharper peaks than the sample with Cu:Se = 2.0. This broadening in the Cu:Se = 2.0 sample is attributed to overlapping peaks from the α- and β-phases. In contrast, the Cu:Se = 1.9 sample exhibits minimal peak overlap, while the Cu:Se = 1.8 sample shows no overlap at all, resulting in narrower peaks [21].
From Figure 1b, it is observed that as the nominal copper content decreases, the percentage contribution of the cubic β-phase increases—from 31.5% in Cu:Se = 2.0 to 91.8% in Cu:Se = 1.9—while the proportion of the tetragonal α-phase correspondingly decreases. In the Cu:Se = 1.8 sample, only the cubic β-Cu2−xSe phase remains. This trend indicates that as copper content decreases, a sub-stoichiometric β-phase (β-Cu2−xSe) emerges. The observed increase in the cubic phase with decreasing copper content aligns with previous findings [12]. Lu et al. reported that a Cu:Se ratio of 1.84:1.00 results in a fully cubic structure, consistent with the phase diagram, which shows a reduction in the α-Cu2Se phase at room temperature as copper vacancies increase in Cu2−xSe.
While the Cu:Se = 1.8 sample achieves the desired cubic crystal structure, it is important to note that β-Cu2−xSe is less thermoelectrically efficient than β-Cu2Se, as previously reported [8,25].
Regarding crystallite sizes (Figure 1c), an examination of the produced samples reveals that crystallite sizes remain relatively constant across all compositions, with no significant variations. This suggests that copper content reduction primarily influences the phase composition rather than the grain structure for the powder production.

3.2. Microstructure of Compacted Samples

Figure 2 illustrates the XRD patterns of the cold-compacted samples produced using different Cu/Se stoichiometric ratios. From Figure 2a, it is observed that cold compression results in the complete conversion of samples with a Cu/Se stoichiometric ratio of 1.9 and 2.0 into a cubic β-phase crystal structure. In contrast, the sample with a Cu/Se stoichiometric ratio of 1.8 does not exhibit any significant changes in its crystal structure after cold compression. It remains cubic and retains the non-stoichiometric Cu2−xSe phase.
In Figure 2c, magnified views of the diffraction peaks near 27° and 44° for the Cu:Se = 1.9 and Cu:Se = 1.8 samples are presented to support the phase analysis. A clear shift in the high-angle peak (around 44°) toward higher 2θ values is observed as the Cu content decreases. This shift, commonly associated with lattice contraction, indicates a reduction in the lattice parameter of the β-Cu2−xSe phase as x increases, consistent with the literature reports on copper-deficient selenides. The absence of Cu ions in the sub-stoichiometric composition results in a denser Se framework, which reduces the unit cell dimensions.
These observations indicate that compaction facilitates the complete transformation of the sample with a stoichiometric ratio of 1.9 into a cubic crystal structure, whereas the sample with a stoichiometric ratio of 1.8 remains unchanged. Furthermore, for compacted samples with Cu/Se stoichiometric ratios of 1.8 and 1.9, a noticeable difference in the intensity of the diffraction peak at 26° is observed. Specifically, the applied pressure reduces the intensity of this peak, which corresponds to the (111) plane. This reduction suggests that crystallization along this plane is not favored under compression. Notably, this plane forms a lamellar structure within the system and serves as the primary slip plane [7].
When comparing the compacted samples with the initial powders across all Cu/Se stoichiometric ratios, no peak shifts toward smaller or larger angles are observed, indicating that cold compaction does not induce lattice deformation (either uniform or non-uniform). However, broadening of the diffraction peaks is detected only for the compacted sample with a stoichiometric ratio of 1.9, as evident in Figure 2b, where the crystallite sizes of the different crystal structures in the modified samples are presented. For compacted samples with Cu/Se stoichiometric ratios of 1.8 and 2.0, the crystallite size remains relatively stable compared to the initial powder. However, for the stoichiometric ratio of 1.9, the crystallite size increases by 60%. This confirms that cold compression promotes crystallite growth exclusively in the Cu/Se ratio of 1.9, a result also supported by previous studies [26].

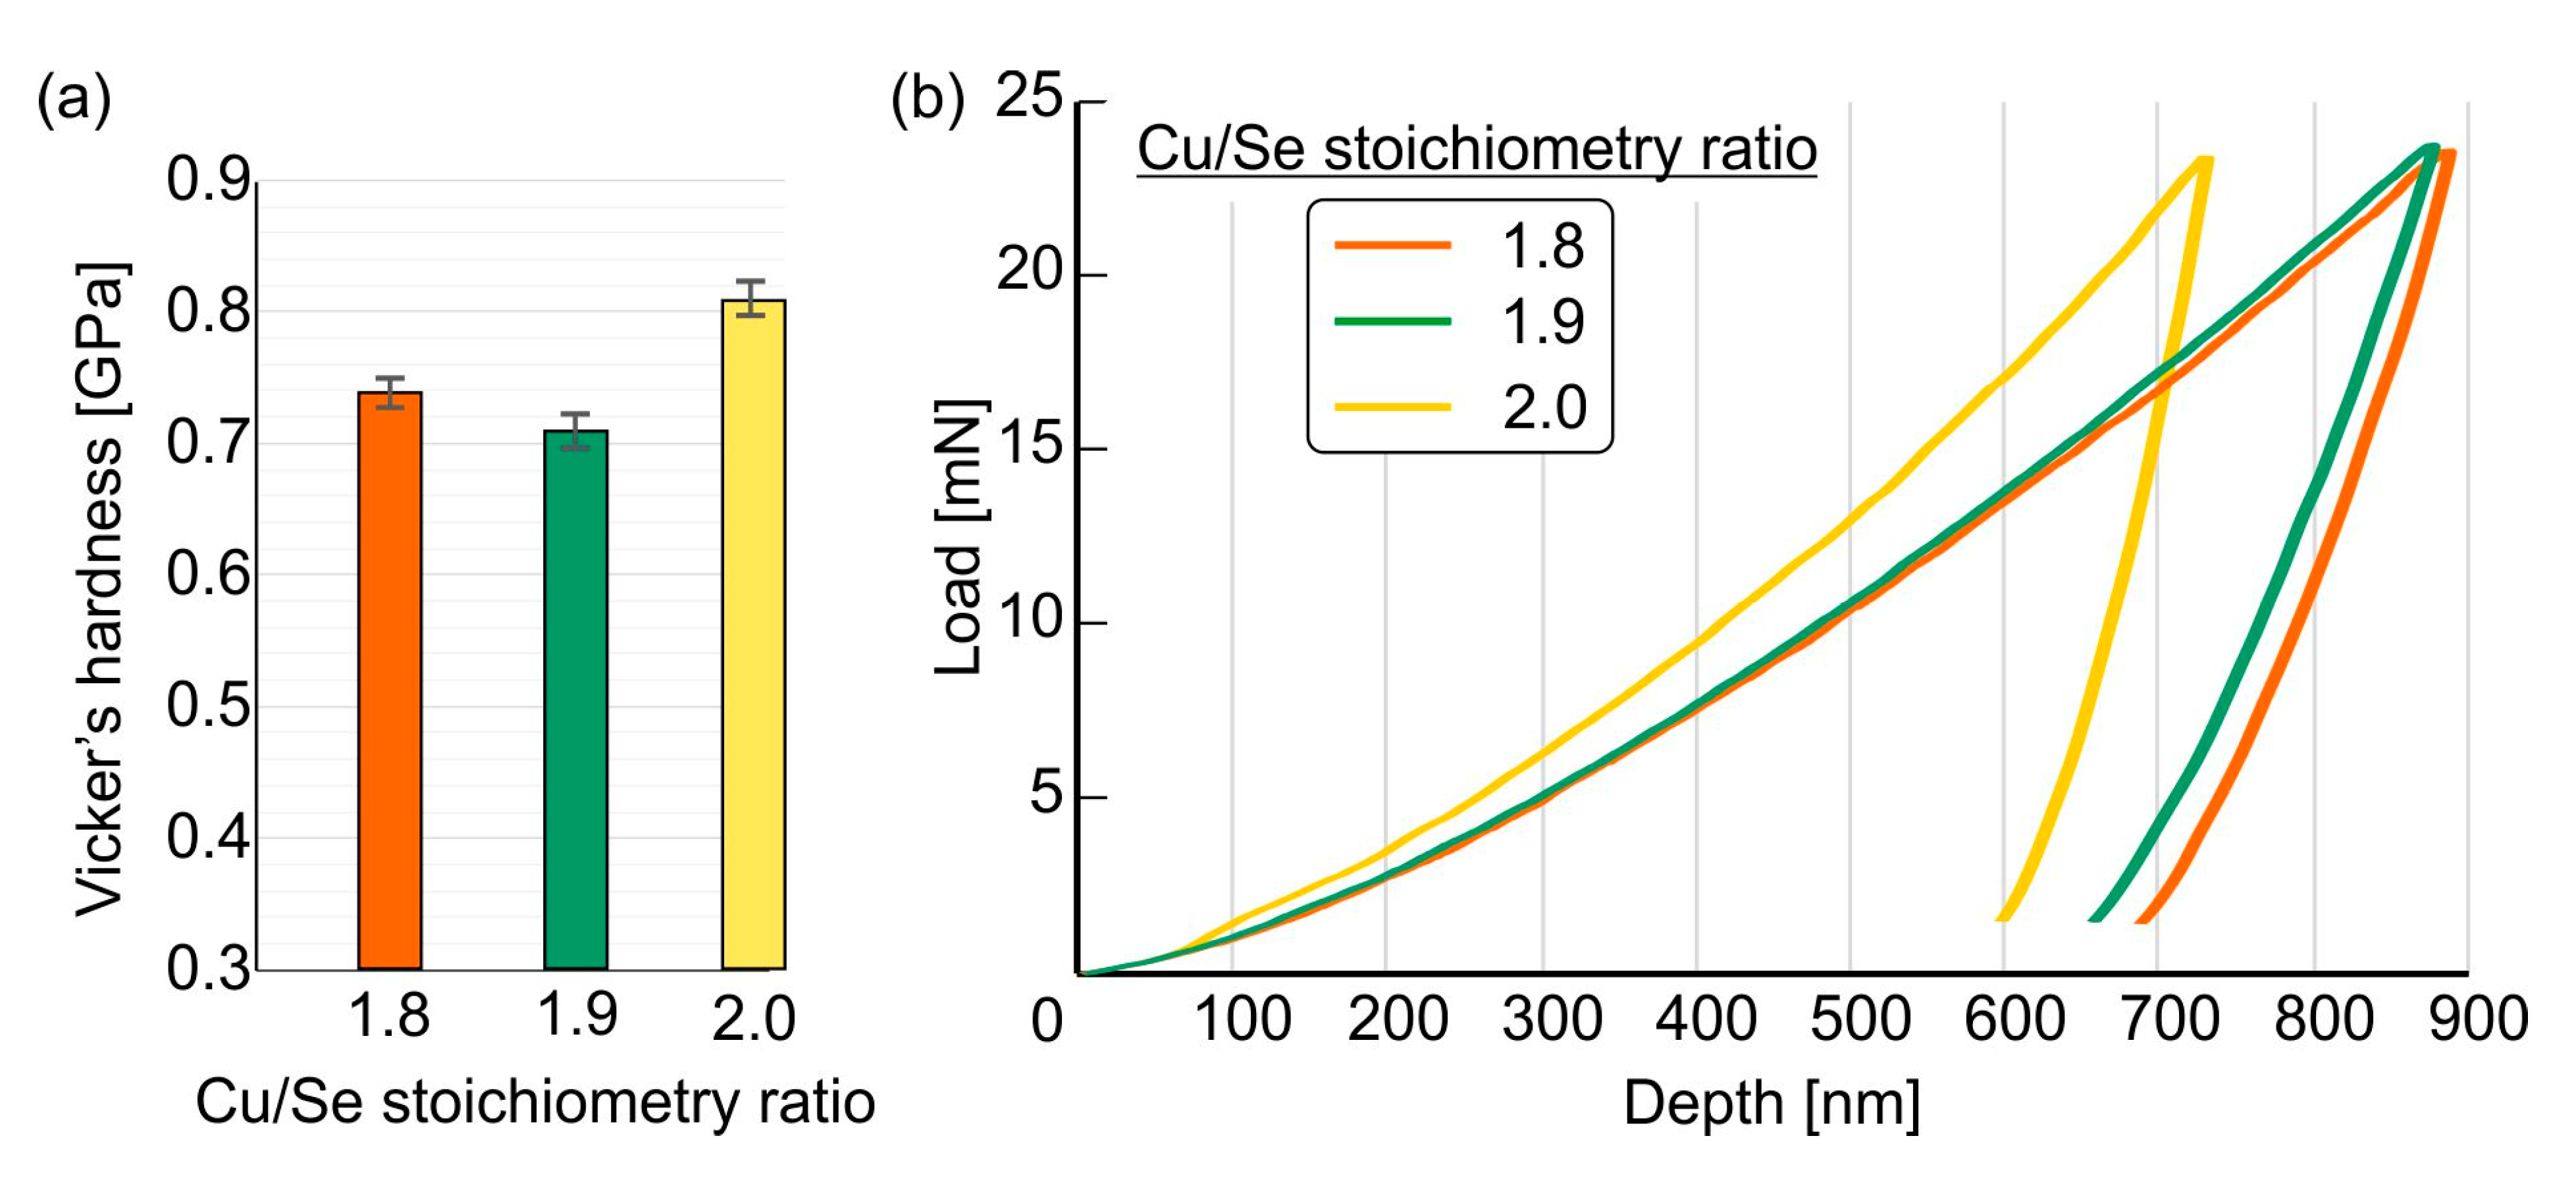
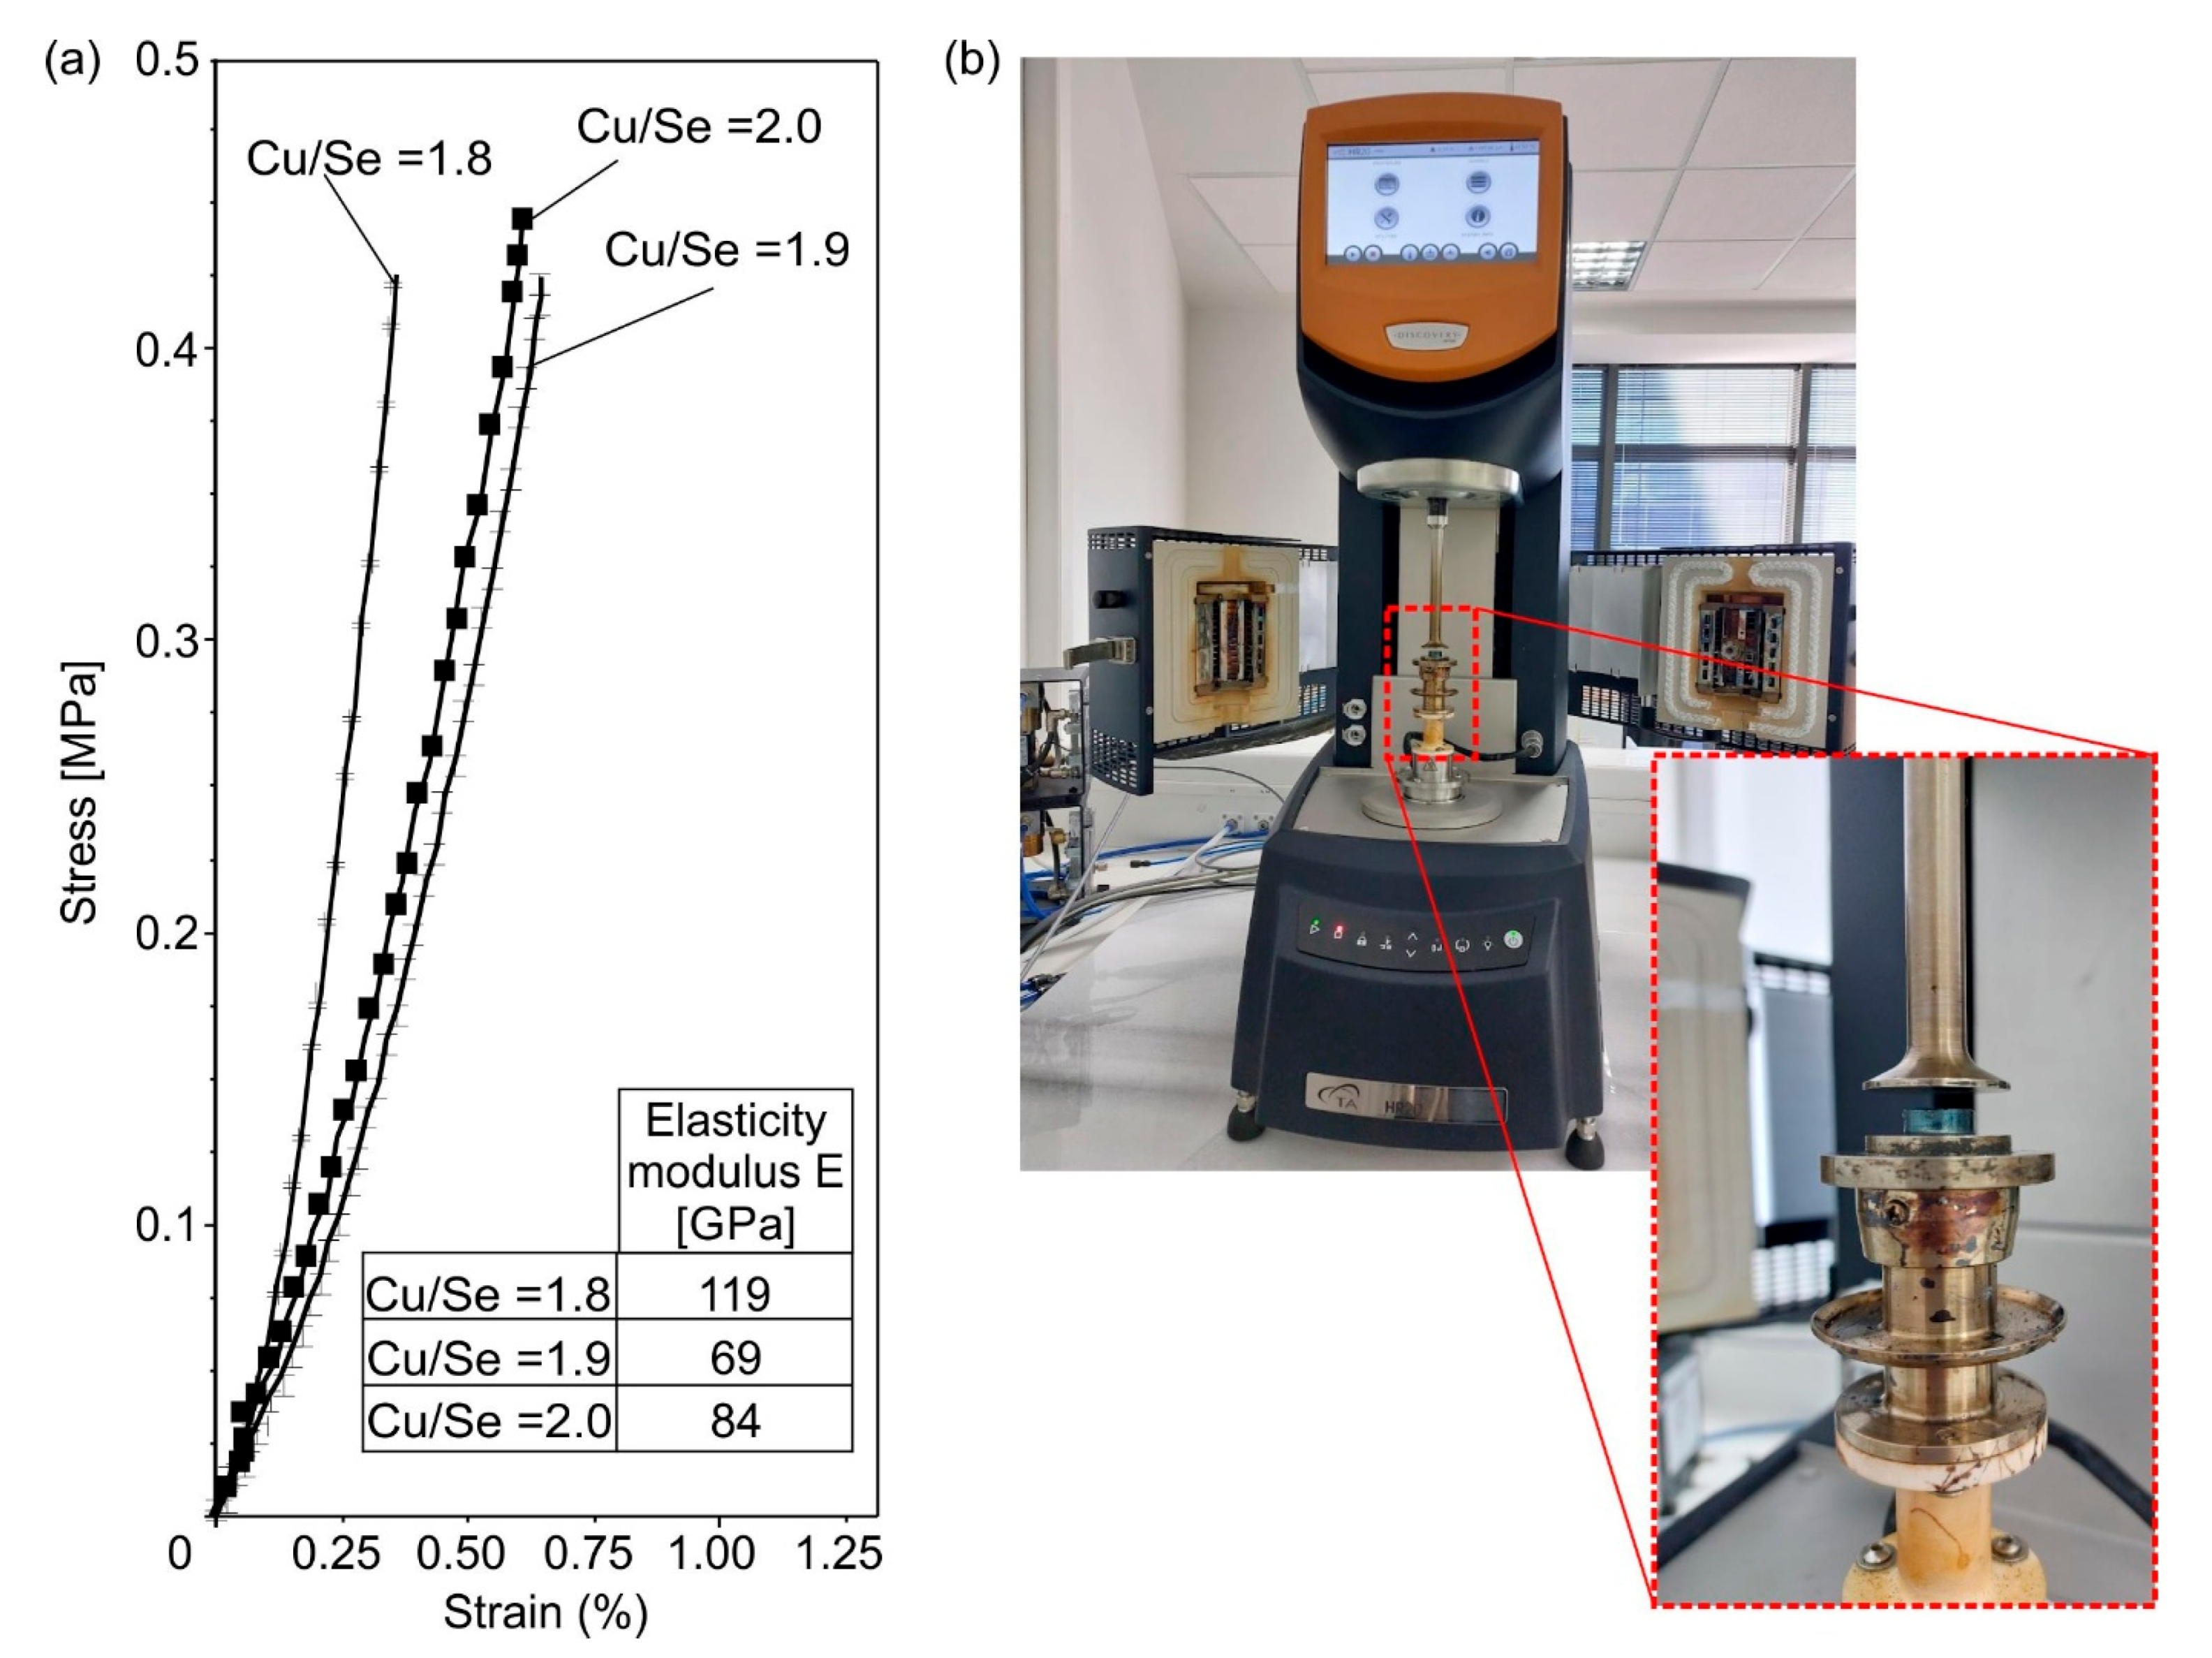
3.3. Mechanical Properties

Figure 3 presents the Vickers microhardness and nanoindentation results for all tested Cu–Se stoichiometries. The data indicate that Cu–Se samples with Cu/Se = 1.8 and 1.9 exhibit similar microhardness values, whereas the Cu/Se = 2.0 stoichiometry (β-phase cubic Cu2Se) demonstrates significantly higher hardness. This suggests that the fully stoichiometric β-Cu2Se phase promotes superior hardness, likely due to stronger atomic bonding and enhanced grain boundary cohesion within the matrix.
From Figure 2, the XRD analysis reveals that Cu/Se = 1.9 compacts exhibit a cubic Cu2Se crystalline structure, while Cu/Se = 1.8 compact displays a copper-deficient cubic β-Cu2−xSe structure. Although these structures are crystallographically similar, their mechanical properties differ significantly, indicating that the microstructural characteristics—particularly grain size—play a dominant role in hardness rather than phase composition alone.
To support the interpretation of mechanical behavior, it is critical to first examine the influence of chemical composition on the microstructure of the compacted Cu–Se samples, as shown in Figure 2. All compositions were synthesized and compacted under identical processing conditions, including mechanical alloying duration, milling parameters, and uniaxial cold pressing pressure. This controlled methodology ensures that variations in crystallite size are primarily a result of stoichiometric differences rather than processing artifacts. X-ray diffraction (XRD) patterns of the compacted powders in Figure 2 demonstrate a clear evolution of phase composition and crystallite size with decreasing copper content. The Cu:Se = 2.0 sample, which initially contained both α- and β-Cu2Se phases, transformed into a fully cubic β-phase upon compaction and exhibited the smallest crystallite size (~19.6 nm). In contrast, the Cu:Se = 1.9 sample showed a larger crystallite size (~31.3 nm), while the Cu:Se = 1.8 sample retained a similar grain size to the Cu:Se = 2.0 composition (~19.6 nm) but was composed of a non-stoichiometric β-Cu2−xSe phase. These crystallite sizes, estimated via the Scherrer equation, highlight a composition-dependent microstructural response. Given the consistency of processing conditions, we attribute these grain size variations to intrinsic effects of copper stoichiometry, such as the density of Cu vacancies and their role in controlling grain boundary dynamics during compaction. This structural framework justifies the subsequent analysis of grain size–dependent mechanical properties, particularly the enhanced hardness observed in finer-grained samples.
To explain this trend, the Hall–Petch equation is considered (assuming validity at the nanoscale) [27]:
σy = σ0 + Ky × d−1/2
where σy is the yield strength; σ0 is the overall resistance of the lattice to dislocation movement; Κy is the grain boundary locking term which measures the relative hardening contribution by the grain boundaries; and d is the grain diameter.
According to the Hall–Petch relation, strength is inversely proportional to grain size. As grain size increases, the stress required to propagate dislocations within the material decreases.
According to this relationship, as grain size decreases, yield strength increases due to greater grain boundary strengthening, which inhibits dislocation motion.
Given that hardness (HV) is proportional to yield strength,
σy = K × HV,
where σy is the yield strength; HV is the Vickers microhardness; K is a material constant (determined experimentally), it follows that a reduction in grain size enhances hardness.
From Figure 2, we observe that despite having the same β-phase cubic Cu2Se structure, the Cu/Se = 1.9 sample exhibits lower hardness than Cu/Se = 2.0. This discrepancy aligns with the measured crystallite sizes, where Cu/Se = 1.9 has a larger crystallite size (~31.3 nm) compared to Cu/Se = 2.0 (~19.6 nm). The increase in crystallite size reduces grain boundary area, thereby weakening grain boundary strengthening effects and lowering hardness.
Furthermore, the minimal hardness difference between Cu/Se = 1.8 and Cu/Se = 2.0 (having the same crystallite size) suggests that copper deficiency in Cu2−xSe does not significantly alter mechanical properties within this range, likely because the structural defects introduced by Cu vacancies do not sufficiently influence dislocation movement at this scale. However, the notable increase in hardness for Cu/Se = 2.0 indicates that maintaining full stoichiometry and reducing crystallite size is key to enhancing mechanical performance in Cu–Se systems.
The mechanical properties of these Cu–Se samples are primarily governed by grain size effects rather than phase composition alone. The higher hardness of Cu/Se = 2.0 is a direct result of its smaller crystallite size, which promotes stronger grain boundary interactions and inhibits dislocation motion. These findings reinforce the importance of microstructural control in optimizing the mechanical properties of thermoelectric materials.
Figure 3b presents the indentation depth curves as a function of the indentation load for various Cu–Se thermoelectric materials. The y-axis represents the indentation depth (in nm), while the x-axis represents the applied load (in mN). Since the measured results are somewhat dependent on the load value, high load value normally will guarantee the accuracy and validity. Therefore, a maximum load of around 25 mN was chosen. The nanoindentation results reinforce the microhardness findings, demonstrating that the mechanical performance in Cu–Se compounds is strongly influenced by crystallite size and stoichiometry. The fully stoichiometric β-Cu2Se phase (Cu/Se = 2) exhibits the best mechanical properties, whereas the copper-deficient phase (Cu/Se = 1.8) shows reduced hardness and lower resistance to deformation.
The indentation curves indicate that Cu:Se = 1.8 exhibits the greatest indentation depth, suggesting the lowest hardness, while Cu:Se = 2.0 shows the shallowest indentation depth, confirming its superior hardness. These results align with the previously analyzed Vickers microhardness data, where the Cu:Se = 2.0 stoichiometry exhibited the highest hardness due to its smaller crystallite size (~19.6 nm), in accordance with the Hall–Petch strengthening mechanism. In Cu:Se = 1.8, which contains a copper-deficient β-Cu2−xSe phase, displayed lower hardness, which is reflected in its greater indentation depth.
The residual indentation depth after unloading reveals differences in elastic recovery, with Cu:Se = 2.0 showing lower residual deformation, indicating lower elastic recovery. The elastic recovery ratio (R), defined as R = (hmax − hres)/hmax, where hmax and hres are the maximum and residual indentation depths, respectively, was calculated as 20% for Cu:Se = 2.0 and 22% and 27% for the 1.8 and 1.9 stoichiometry, respectively. This suggests that although Cu:Se = 2.0 has the highest hardness, it undergoes more permanent plastic deformation upon indentation, which correlates with its lower Young’s modulus.
The elastic recovery effect is further confirmed by analyzing the elastic work ratio of indentation. The total indentation work consists of both elastic (recoverable) and plastic (permanent) deformation, with the unload-to-load work ratio representing the proportion of recovered work relative to the total work performed during indentation. The elastic work ratio, calculated from the area under the load-unload curves, was found to be 8% for Cu:Se = 2.0 and 15% for the other samples. A lower elastic work ratio for Cu:Se = 2.0 indicates that it undergoes more plastic deformation relative to its elastic deformation, reinforcing the observation of lower elastic recovery.
The nanoindentation results, when combined with the microhardness findings, provide further insight into the mechanical behavior of the Cu–Se compounds. The Cu:Se = 2.0 sample, which exhibits the highest hardness, is primarily composed of the β-phase cubic Cu2Se with the smallest crystallite size (~19.6 nm). Its lower elastic recovery suggests that while the material is highly resistant to plastic deformation, it does not effectively recover elastically after indentation. This behavior is likely due to the strengthening effects of fine crystallite size, which restricts dislocation motion but also limits elasticity, potentially due to grain boundary sliding, internal defects, or weak interparticle bonding from the compaction technique. It suggests a brittle material with limited elasticity.
The Cu:Se = 1.9 sample exhibited lower hardness than Cu:Se = 2.0, corresponding to its larger crystallite size (~31.3 nm). The increase in crystallite size results in fewer grain boundaries, reducing grain boundary hardening effects and allowing for slightly higher elastic deformation. Meanwhile, the Cu:Se = 1.8 sample, which consists primarily of β-Cu2−xSe (substoichiometric phase), exhibited the lowest hardness among the three compositions. This phase is known to be mechanically less robust than β-Cu2Se, explaining the reduced hardness. The nanoindentation results suggest that Cu:Se = 1.8 has better elastic recovery compared to Cu:Se = 2.0, indicating that the β-Cu2−xSe phase retains more elasticity, likely due to its more open or defect-rich structure facilitating atomic rearrangement upon unloading.
Figure 4 depicts the elastic compression tests for all tested Cu–Se stoichiometries. The samples with stoichiometry Cu:Se = 1.9 and 2.0 have the same microstructure phase of Cu2Se with different crystallite sizes of 31 and 19.6 nm, respectively. As the grain size of the samples decreases, the elastic modulus of the sample increases. The enhancement in the elastic modulus indicates the improved ability to resist elastic deformation. Cu:Se = 1.8 exhibits higher modulus of elasticity in compression. Since both Cu2Se and Cu2−xSe phases have similar grain sizes, the difference in the elastic modulus cannot be attributed to grain-boundary effects. The Cu:Se = 1.8 sample, although softer, exhibited a higher elastic modulus in compression tests, which may be attributed to a more stable Se sub-lattice and high copper ion mobility within the structure. The Cu:Se = 1.8 sample exhibits a copper-deficient phase. It is known that Cu2−xSe is classified based on the selenium sub-lattice because the copper sub-lattice undergoes a superionic transition at high temperatures, ~400 K and above, leading to extremely high copper ion diffusivity [12]. At temperatures below the superionic transition (~400 K), Cu2−xSe does not maintain this superionic behavior, but the copper sub-lattice is still considered disordered or random, suggesting that the copper atoms do not occupy well-defined, periodic positions, unlike in typical crystalline solids [8,9]. Instead, copper ions randomly distribute across multiple available interstitial sites, leading to a disordered occupation within the selenium framework [12,20]. This randomness in copper positioning can influence mechanical properties, and defect-driven effects. In compression tests, the applied stress is distributed over the entire sample. Since Cu2−xSe retains a rigid selenium framework, the overall elastic response is primarily determined by the Se sub-lattice rather than the highly mobile Cu ions [9]. This leads to a higher measured Young’s modulus, as the bulk structure remains mechanically stable under uniform loading.
It is acknowledged that the stress–strain curves obtained from elastic compression tests do not exhibit perfectly linear behavior, especially at the initial stages of loading. In an ideal single-phase, fully dense, and homogeneous crystalline material, elastic deformation typically results in a linear stress–strain relationship due to Hooke’s law. However, in the case of compacted Cu–Se samples prepared via powder metallurgy, several microstructural factors may contribute to slight deviations from linearity. First, microstructural inhomogeneities, such as grain boundary irregularities or residual interparticle porosity (measured at approximately 2–4% by Archimedes’ method), can introduce local compliance or delayed load transfer under compressive loading. Second, small frictional effects at the platen–sample interfaces may also influence load distribution. Lastly, minor instrumental noise and sensitivity limitations in the low-strain regime—especially when evaluating relatively small samples with high stiffness—can affect the resolution of the initial linear slope. Despite these deviations, the extracted elastic moduli represent the average linear portion of the curve and remain valid for comparative analysis between samples of differing stoichiometry.
Overall, these findings emphasize the significant influence of stoichiometry and crystallite size on the mechanical properties of Cu–Se compounds. The fully stoichiometric β-Cu2Se phase exhibits the highest hardness but lower elastic recovery and Young’s modulus, while the copper-deficient phase demonstrates lower hardness with relatively higher elasticity. These results further confirm that while the β-phase Cu2Se has strong atomic bonding at small scales, its overall intergranular cohesion may be weaker due to grain boundary effects, highlighting a trade-off between hardness and elastic recoverability in these thermoelectric materials.

3.4. Comparative Discussion with the Literature and Scale-Dependent Behavior

The mechanical properties of Cu2Se-based thermoelectric materials vary significantly depending on the synthesis technique, stoichiometry, and microstructure [28]. Reported Vickers microhardness values for stoichiometric Cu2Se typically range from 0.4 to 0.6 GPa, depending on processing conditions and grain size [29]. However, in this study, microhardness values between 0.7 and 0.8 GPa were observed for the Cu-deficient phase (Cu1.8Se), which is notably higher than previously reported values. This suggests that copper deficiency, combined with refined grain structure achieved via mechanical alloying and cold compaction, can enhance hardness. Similarly, the elastic modulus values obtained from compression tests in this work were ~110 GPa for Cu1.8Se and ~75 GPa for stoichiometric Cu2Se, both of which are considerably higher than commonly reported experimental values (~30–50 GPa) [30]. These elevated values may reflect increased density, reduced porosity, or the influence of sub-lattice disorder in the Cu-deficient phase, which could lead to higher stiffness in bulk compression. The contrast between the mechanical behavior of stoichiometric and non-stoichiometric compositions highlights the importance of compositional tuning for optimizing both mechanical and functional properties in Cu2Se-based thermoelectric materials [2]. However, it is important to emphasize that mechanical properties—especially hardness—can vary significantly across studies due to a range of factors. Differences in sample preparation techniques (e.g., casting, ball milling, hot pressing, or spark plasma sintering), surface roughness, indenter type, applied load, residual stresses, and even the measurement procedure itself can all influence the outcome [31]. As such, while literature comparisons are useful for contextualizing results, they should be interpreted with caution and, where possible, under matched experimental conditions.
Importantly, while an idealized trend in mechanical properties such as modulus or hardness might be expected with changing Cu/Se ratio, our experimental data show a non-monotonic behavior. This deviation arises from the complex interplay between crystallite size, phase composition, and lattice-level structural disorder. Specifically, although the Cu:Se = 1.8 sample is copper-deficient and exhibits the lowest hardness, it shows the highest elastic modulus under compression. This seemingly contradictory result is attributed to the structural nature of the β-Cu2−xSe phase, where the selenium sub-lattice remains rigid while the copper sub-lattice becomes increasingly disordered due to Cu vacancies. This rigid Se framework imparts high stiffness under uniform compressive loading despite lower resistance to localized plastic deformation (i.e., hardness). On the other hand, the Cu:Se = 1.9 and Cu:Se = 2.0 samples are both composed of stoichiometric β-Cu2Se but differ significantly in crystallite size. The smaller crystallite size in the Cu:Se = 2.0 sample leads to stronger grain boundary strengthening and thus higher hardness, while the larger grains in the 1.9 sample reduce this effect. Therefore, while a direct modulus vs. composition correlation is not observed across all samples, a consistent and physically meaningful comparison can be made between Cu:Se = 1.9 and 2.0, which isolate the effect of crystallite size within the same phase composition.
Moreover, the observed differences between elastic recovery measured by nanoindentation and that inferred from macroscopic compression tests can be attributed to fundamental scale-dependent deformation mechanisms. Nanoindentation primarily probes localized surface regions and is highly sensitive to features such as crystallite size, grain boundaries, surface roughness, and near-surface defects. These microstructural features influence the degree of elastic recovery as they govern how stress is distributed and relieved at the sub-micron scale. In contrast, bulk compression tests evaluate the response of the entire specimen volume and are more influenced by intergranular cohesion, porosity distribution, and macrostructural integrity. In powder-consolidated materials such as those studied here, interparticle bonding and residual voids (2–4%) can significantly affect the bulk stiffness and apparent elastic modulus but may not influence the nanoindentation response to the same extent. Furthermore, surface confinement in nanoindentation restricts lateral plastic flow, enhancing the measurable elastic recovery, while macro-compression permits full-volume deformation. These differing stress states and scales of material engagement result in the elastic recovery patterns diverging between the two techniques, even for the same composition.

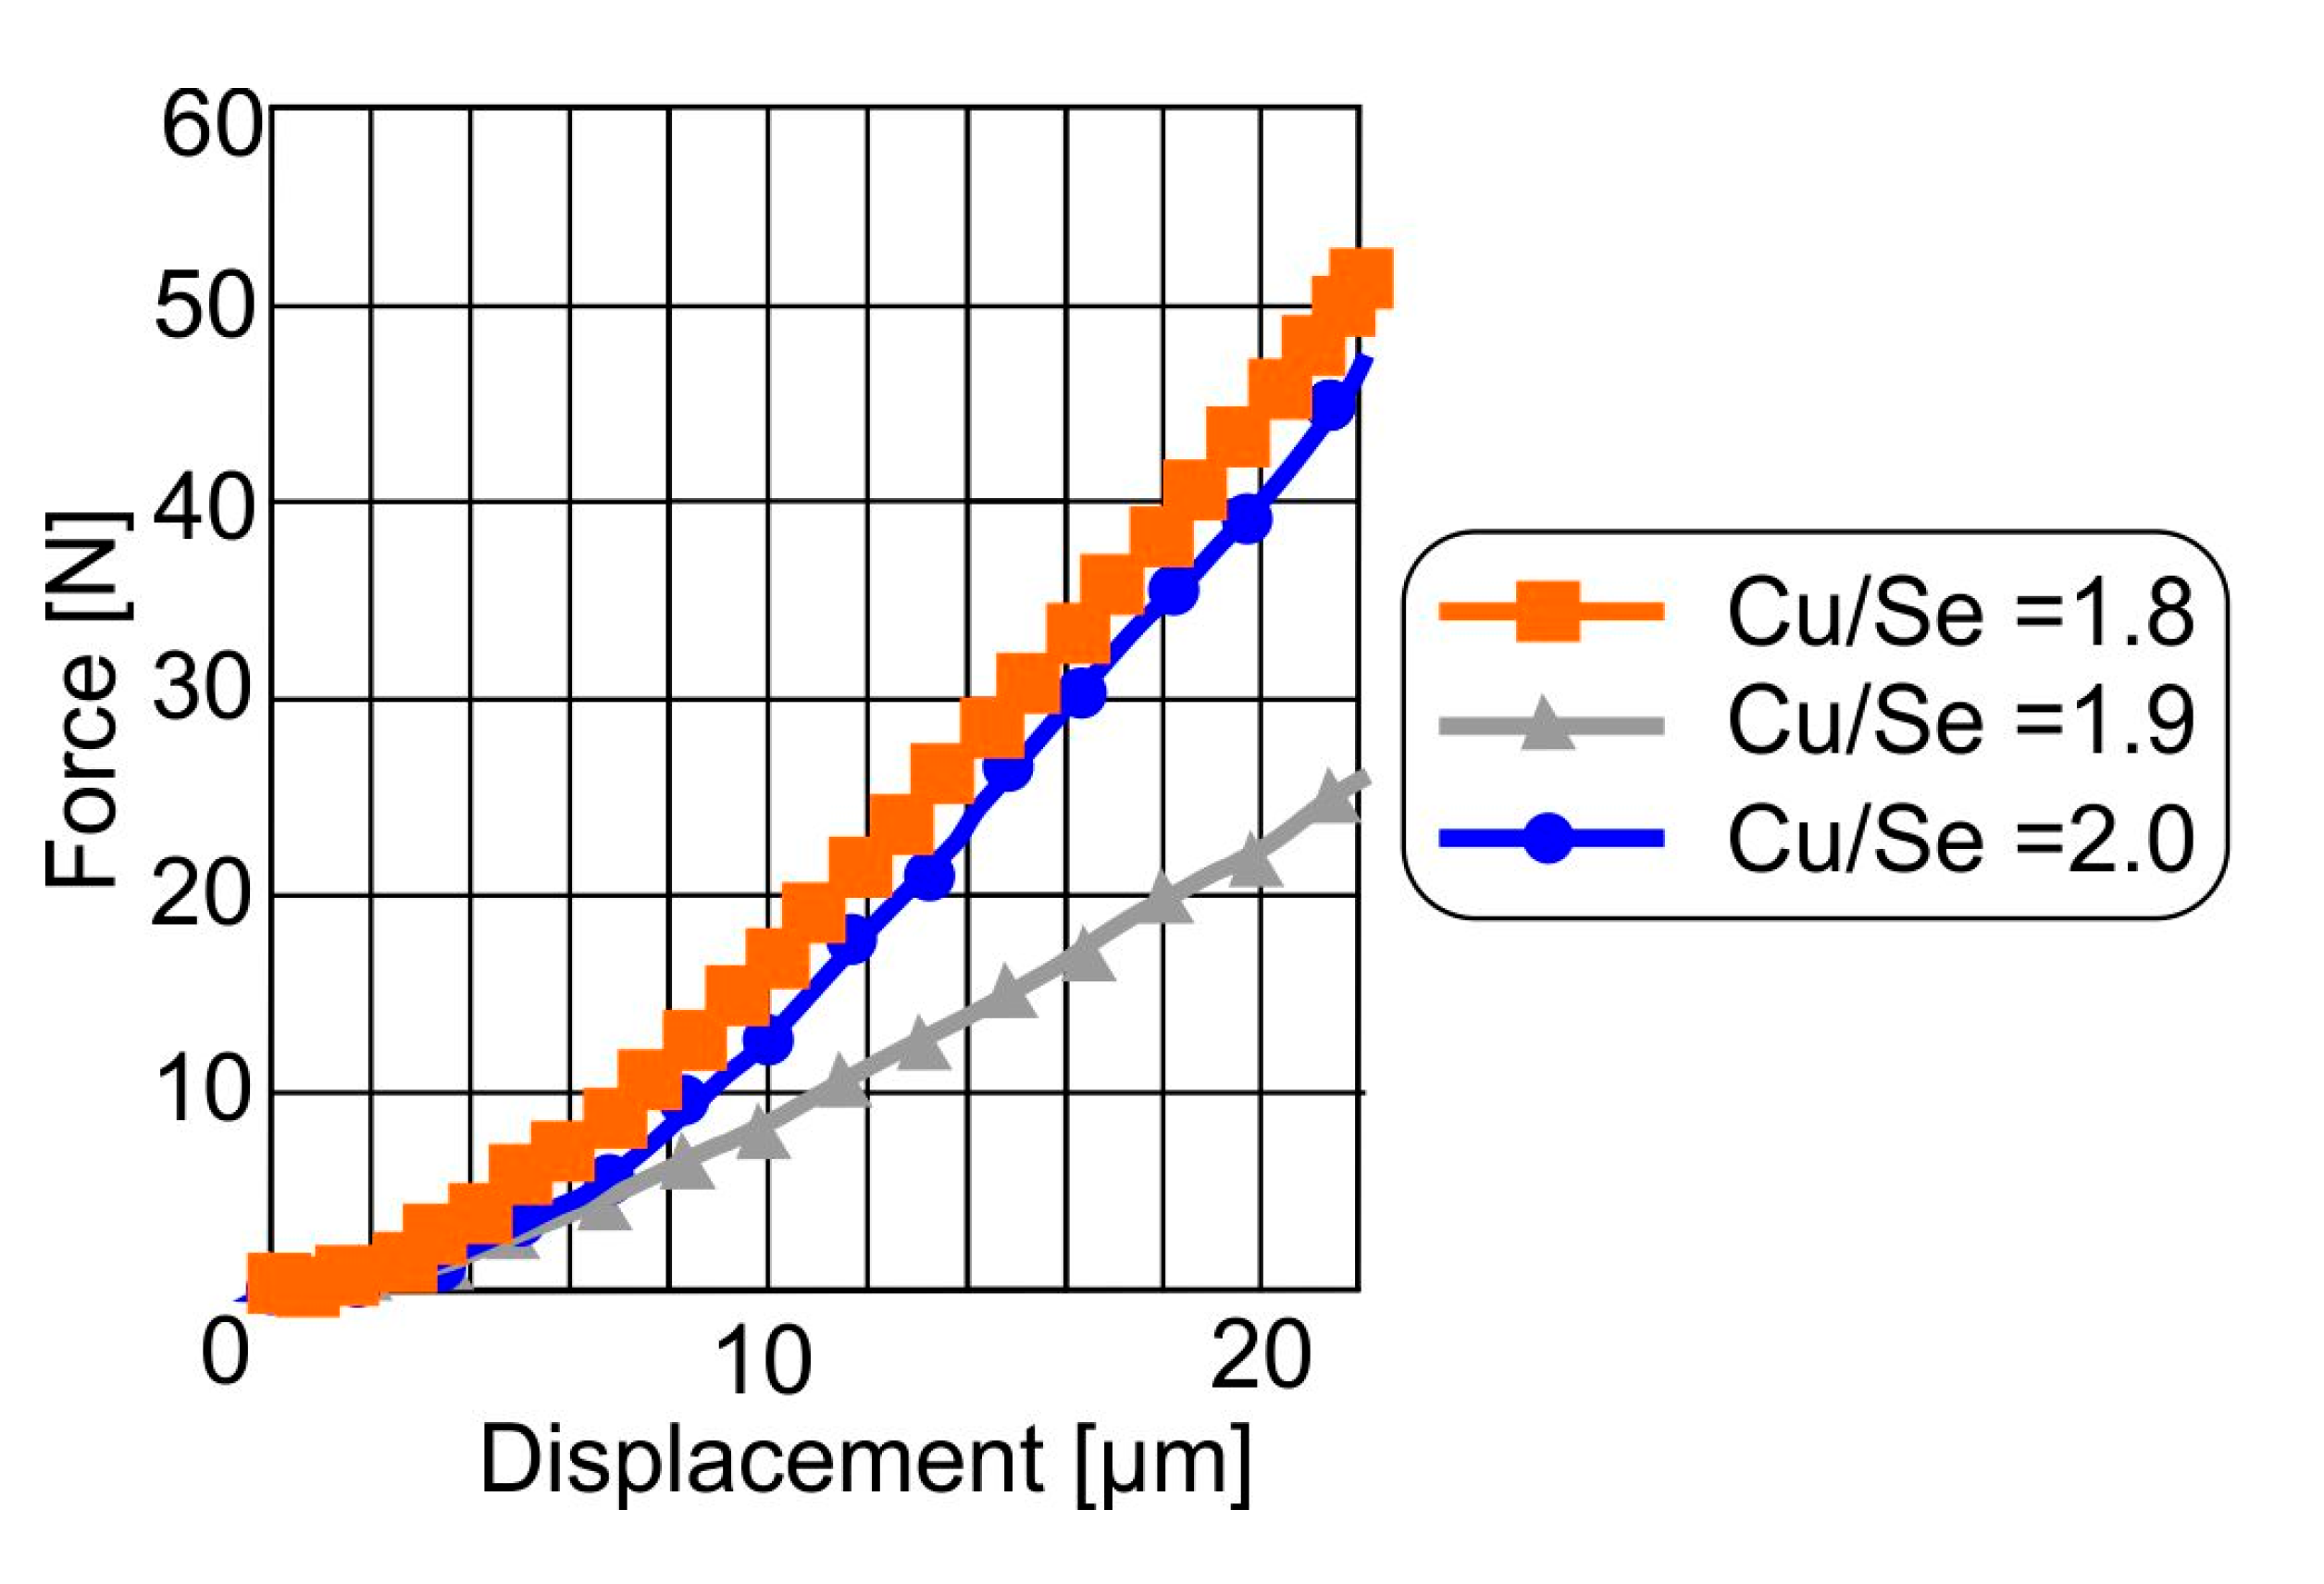
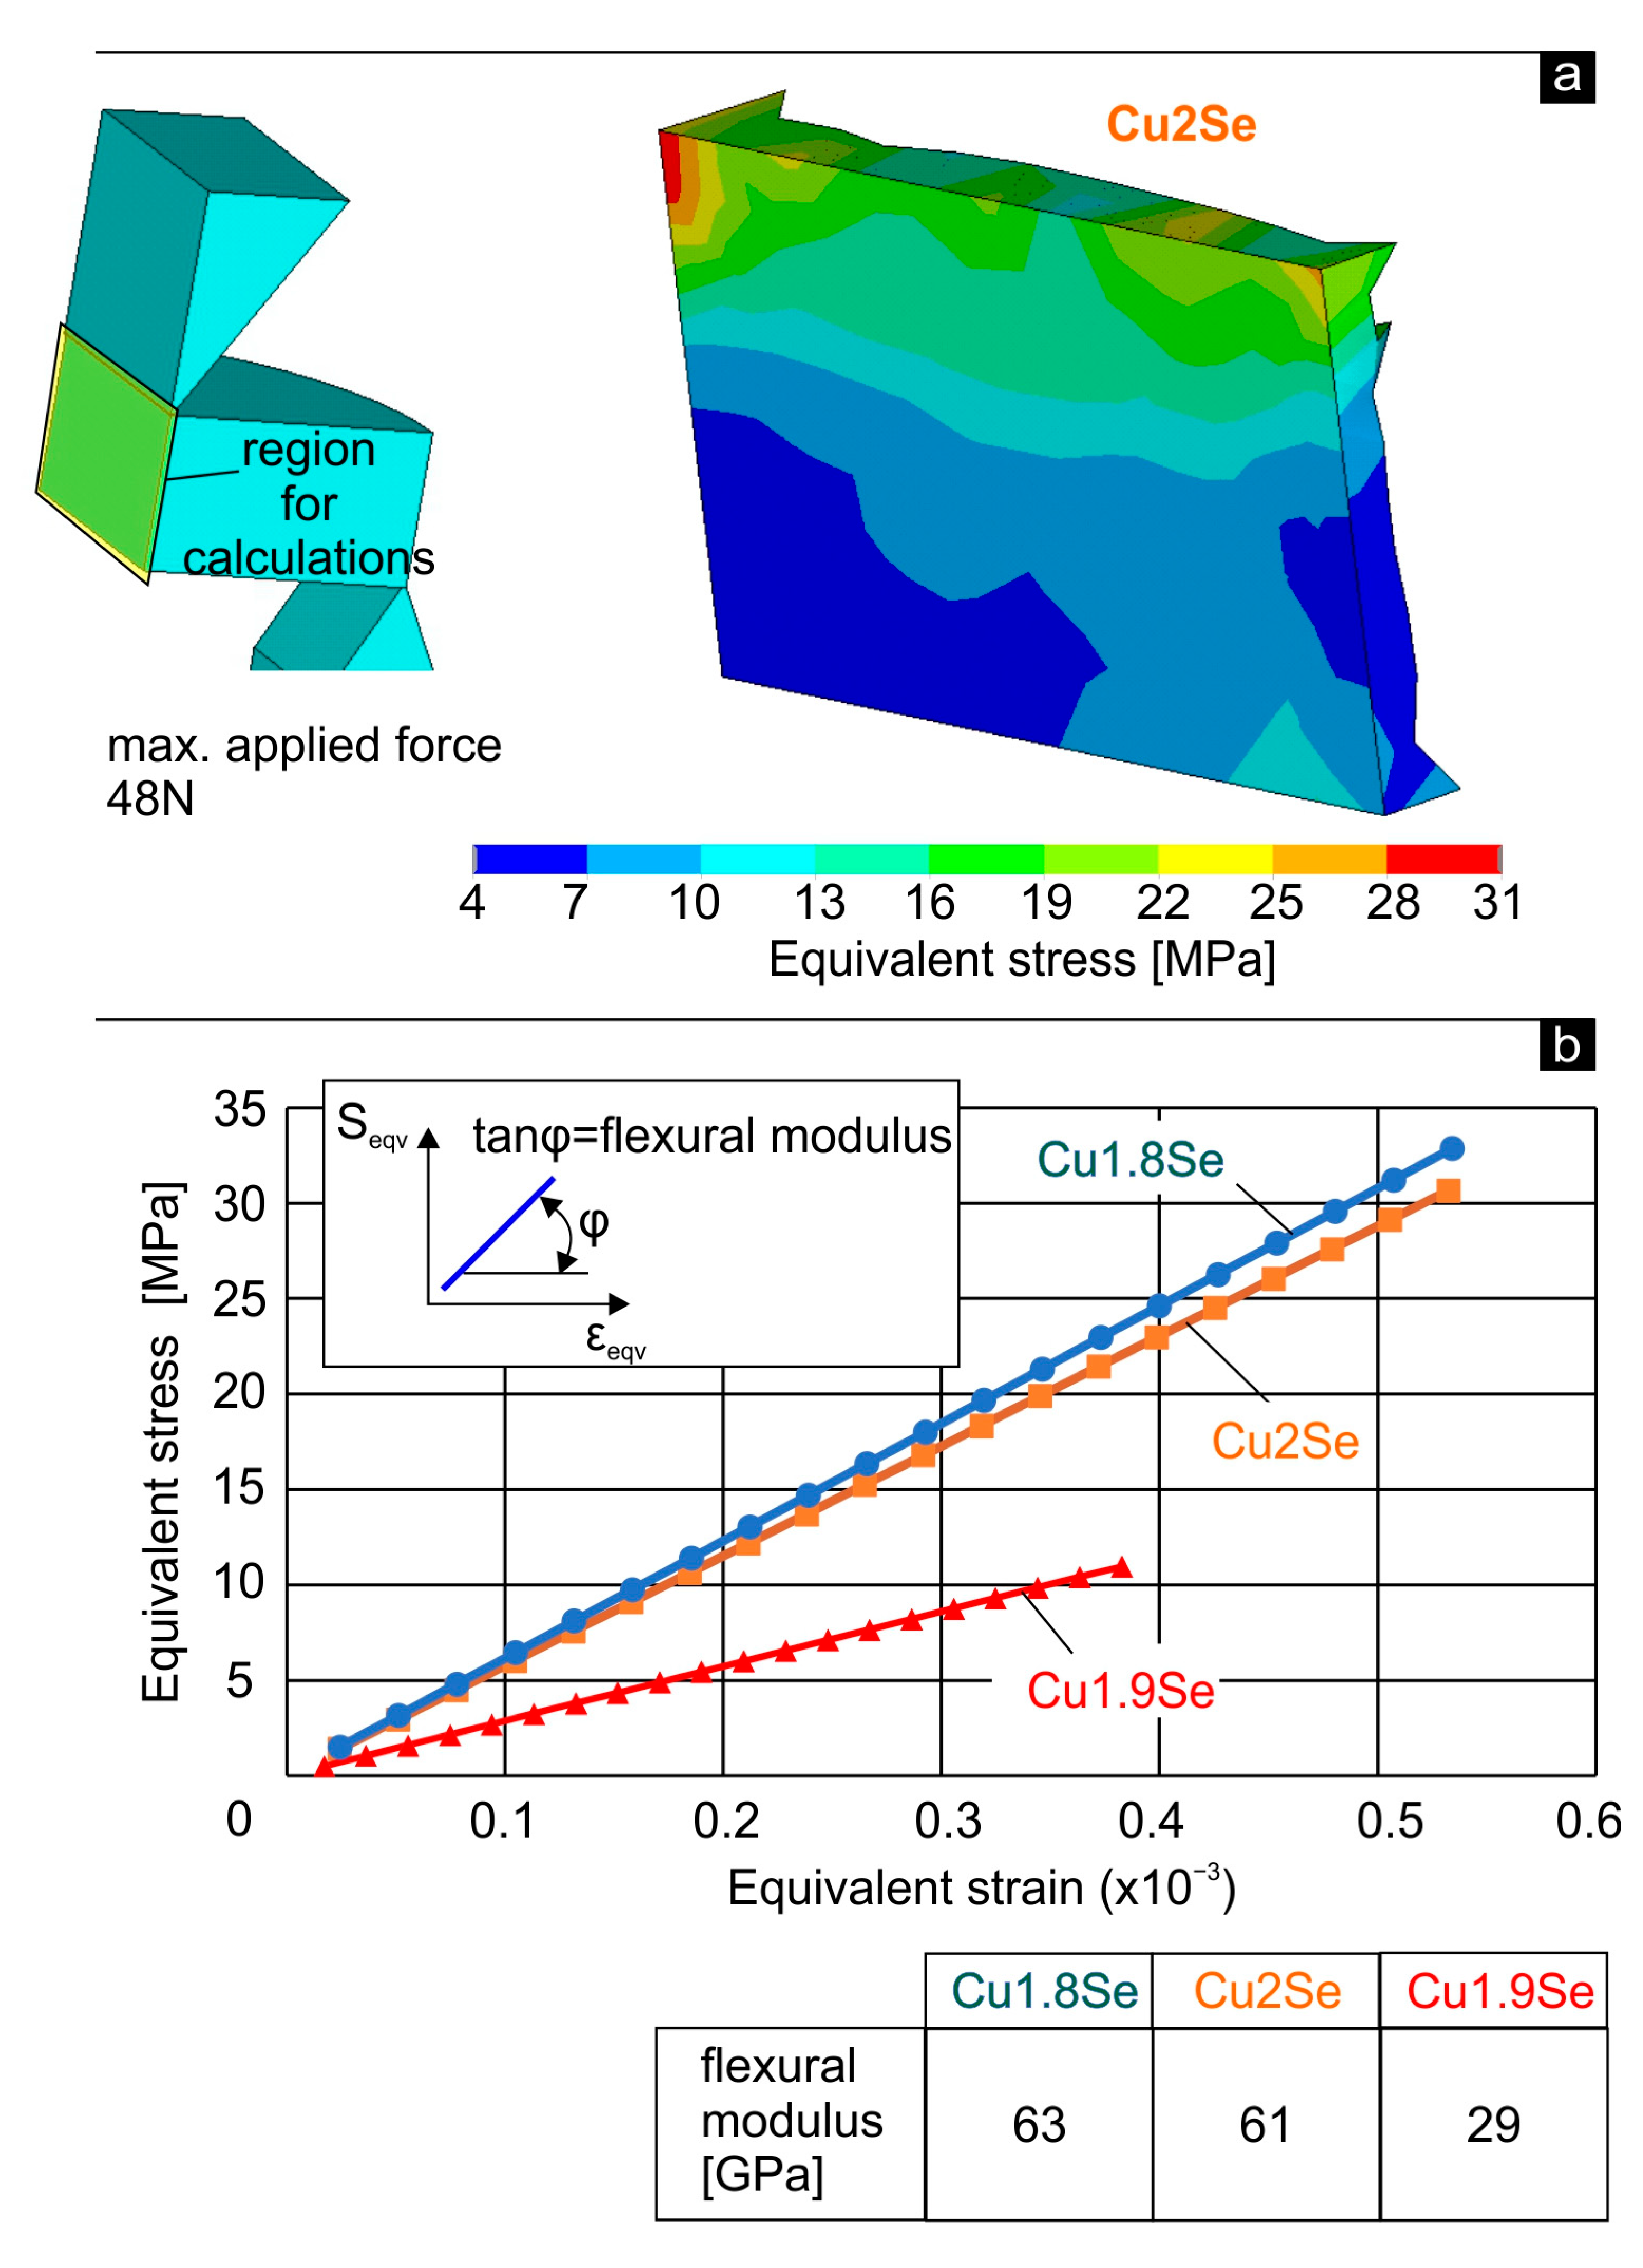
3.5. Determination of the Flexural Moduli of the Examined Materials with FE Modeling

In the conducted research, a FEA-supported experimental methodology was developed for determining the flexural moduli of the investigated materials. In the first stage, three-point bending tests were carried out using the DMA machine. During this test, two supports hold the part, and a load is applied to induce flexure. The related results in terms of the achieved indenter displacement versus the applied force is shown in Figure 5. In these experiments, the applied force was varied until a consistent displacement of approximately 22 μm was achieved in all examined materials. Under the applied conditions, all samples underwent elastic deformation, as the residual deformation after load removal was virtually negligible. According to the results presented in Figure 5, the sample with Cu/Se = 1.8 demonstrates the greatest resistance to the applied load, requiring approximately 52 N to achieve a displacement of 22 μm. The sample with Cu/Se = 2.0, on the other hand, shows slightly lower strength under flexural loads. The sample with Cu/Se = 1.9 exhibits the poorest flexural behavior, requiring only about 25 N for the same displacement.
In the second stage, a 3D-FEM model was developed to simulate the three-point bending test, as illustrated in Figure 6. The simulation software was ANSYS 2024R1. The indenter geometry and the sample fixture accurately represent the actual setup. Isotropic elastic materials were applied for simulating the flexural behavior of the examined samples. The boundary conditions and the finite element discretization network are also depicted in the same figure. To minimize solution time, two levels of symmetry were utilized to describe the entire procedure. Convergence studies were conducted to determine the optimum mesh density and attain a mesh-independent grid. Due to insert geometry and the applied symmetry levels, a free meshing was used to mesh a model. To accurately simulate the three-point bending test, appropriate contact elements were incorporated to model the interfaces between the indenter and the samples, as well as between the samples and the holding fixture. The model parameters—including indenter and fixture geometries, sample thickness and length, and penetration depth—were designed to be variable, allowing for comprehensive analysis under different conditions. This finite element model enables the calculation of deformations, stress, and strain fields both during indenter penetration and after its removal. The developed reaction force Fz is equal to the indenter load; this force and the stress–strain fields depend on the indenter penetration depth. In this way, the load corresponding to a certain indenter penetration depth and moreover the von Mises stress–strain fields during sample loading and relaxation can be determined.
Characteristic result in the case of sample with Cu/Se = 2.0, obtained by the developed FEM model is exhibited in Figure 7a. The developed von Mises stresses correspond to the region as highlighted in the sketch within the same figure. This region is identified as the most endangered during the bending test. A load of 48 N was applied. This was necessary to achieve an indenter displacement of approximately 22 μm. Similar calculations were performed for further indenter penetration depths and corresponding indentation loads for all samples’ cases. Thus, it was possible to calculate the variation in the equivalent stress versus the equivalent strain for all samples’ cases, as shown in Figure 7b. Based on these results, the variation in equivalent stress versus equivalent strain was recorded for all samples, as illustrated in Figure 3b. The slope of the lines in Figure 7b, representing the tangent of the angles, determines the flexural moduli of the examined samples. These results are summarized in the table within Figure 7b. Among the investigated samples, the sample with Cu/Se = 1.8 exhibits the highest flexural modulus, whereas the sample with Cu/Se = 1.9 demonstrates the lowest.

3.6. Conclusions

The mechanical and structural behavior of Cu–Se thermoelectric compounds is significantly influenced by copper stoichiometry. The XRD analysis revealed a stoichiometry-dependent phase evolution, with the Cu:Se = 2.0 sample containing both α- and β-phases, transitioning to a fully cubic β-Cu2−xSe structure in the Cu:Se = 1.8 sample. Crystallite size decreased with increasing Cu content, contributing to enhanced hardness in the fully stoichiometric Cu2Se sample (Cu:Se = 2.0), as demonstrated by both Vickers and nanoindentation results. However, despite its high hardness, this sample showed limited elastic recovery and a lower elastic modulus, indicating a trade-off between resistance to plastic deformation and elastic resilience. On the other hand, the Cu:Se = 1.8 sample, although softer, exhibited a higher elastic modulus in compression tests and better recovery, which may be attributed to a more stable Se sub-lattice and high copper ion mobility within the structure. Overall, the findings underscore the need to balance hardness, elasticity, and phase stability in the design of robust Cu–Se thermoelectric materials for operational reliability.

Author Contributions

Conceptualization, F.S., G.S., N.M. and G.V.; methodology, M.P., V.P., D.S. and A.T.; software, G.S., D.S. and L.M.; validation, F.S., G.S., M.P. and L.M.; formal analysis, F.S., G.S., V.P., L.M. and I.K.S.; investigation, F.S., M.P., V.P., D.S. and A.T.; resources, G.V., G.M. and I.K.S.; data curation, G.M. and I.K.S.; writing—original draft, F.S., G.S., N.M. and G.M.; writing—review and editing, F.S., G.S., N.M., G.V. and G.M.; visualization, G.S., M.P., V.P., D.S. and A.T.; supervision, N.M. and I.K.S.; project administration, N.M., L.M. and I.K.S.; funding acquisition, N.M., G.V. and I.K.S. All authors have read and agreed to the published version of the manuscript.

Funding

This research was carried out as part of the project “Design and implementation of innovative lift’s air-conditioning systems by using thermoelectric devices” (Project code: ΚΜΡ6-0074109) under the framework of the Action “Investment Plans of Innovation” of the Operational Program “Central Macedonia 2021–2027” that is co-funded by the European Regional Development Fund and Greece.

Data Availability Statement

The original contributions presented in this study are included in the article. Further inquiries can be directed to the corresponding author.

Conflicts of Interest

Author Ioanna K. Sfampa was employed by the KLEEMANN. The remaining authors declare that the research was conducted in the absence of any commercial or financial relationships that could be construed as a potential conflict of interest.

References

  1. Guttmann, G.M.; Gelbstein, Y. Mechanical Properties of Thermoelectric Materials for Practical Applications. In Bringing Thermoelectricity into Reality; InTech: Houston, TX, USA, 2018. [Google Scholar] [CrossRef]
  2. Al Malki, M.M.; Snyder, G.J.; Dunand, D.C. Mechanical behaviour of thermoelectric materials–a perspective. Int. Mater. Rev. 2023, 68, 1050–1074. [Google Scholar] [CrossRef]
  3. Yu, J.; Liu, X.; Hu, H.; Jiang, Y.; Zhuang, H.L.; Li, H.; Su, B.; Li, J.W.; Han, Z.; Wang, Z.; et al. Ultralow thermal conductivity and high ZT of Cu2Se-based thermoelectric materials mediated by TiO2−n nanoclusters. Joule 2024, 8, 2652–2666. [Google Scholar] [CrossRef]
  4. He, H.; Wang, Z.; Duan, S.; Wang, X.; Yin, L.; Hou, S.; Chen, C.; Liu, K.; Wei, L.; Sui, J.; et al. Improving the Mechanical Properties of Bi2Te3-based Thermoelectric Materials by K2Ti6O13 Whiskers. Chemnanomat 2023, 9, e202200389. [Google Scholar] [CrossRef]
  5. Zhang, Y.-X.; Zhu, Y.-K.; Feng, J.; Ge, Z.-H. Precious metal nanoparticles dispersing toward highly enhanced mechanical and thermoelectric properties of copper sulfides. J. Alloys Compd. 2022, 892, 162035. [Google Scholar] [CrossRef]
  6. Zhu, Y.-K.; Guo, J.; Chen, L.; Gu, S.-W.; Zhang, Y.-X.; Shan, Q.; Feng, J.; Ge, Z.-H. Simultaneous enhancement of thermoelectric performance and mechanical properties in Bi2Te3 via Ru compositing. Chem. Eng. J. 2021, 407, 126407. [Google Scholar] [CrossRef]
  7. Zhang, T.; Song, Y.; Zhang, X.; He, X.; Jiang, J. Enhanced thermoelectric performance of Cu2Se by tuning the aligned lamella microstructure. Mater. Lett. 2019, 250, 189–192. [Google Scholar] [CrossRef]
  8. Yang, L.; Chen, Z.-G.; Han, G.; Hong, M.; Zou, J. Impacts of Cu deficiency on the thermoelectric properties of Cu2−XSe nanoplates. Acta Mater. 2016, 113, 140–146. [Google Scholar] [CrossRef]
  9. Yang, D.; Benton, A.; He, J.; Tang, X. Novel synthesis recipes boosting thermoelectric study of A2Q (A = Cu, Ag; Q = S, Se, Te). J. Phys. D Appl. Phys. 2020, 53, 193001. [Google Scholar] [CrossRef]
  10. Hu, T.; Yan, Y.; Wang, S.; Su, X.; Liu, W.; Tan, G.; Poudeu-Poudeu, P.; Tang, X. One-step ultra-rapid fabrication and thermoelectric properties of Cu2Se bulk thermoelectric material. RSC Adv. 2019, 9, 10508–10519. [Google Scholar] [CrossRef]
  11. Zhu, Z.; Zhang, Y.; Song, H.; Li, X.-J. Enhancement of thermoelectric performance of Cu2Se by K doping. Appl. Phys. A Mater. Sci. Process. 2018, 124, 871. [Google Scholar] [CrossRef]
  12. Yu, J.; Zhao, K.; Qiu, P.; Shi, X.; Chen, L. Thermoelectric properties of copper-deficient Cu2-Se (0.05 ≤ x ≤ 0.25) binary compounds. Ceram. Int. 2017, 43, 11142–11148. [Google Scholar] [CrossRef]
  13. Zhou, Z.; Huang, Y.; Wei, B.; Yang, Y.; Yu, D.; Zheng, Y.; He, D.; Zhang, W.; Zou, M.; Lan, J.-L.; et al. Compositing effects for high thermoelectric performance of Cu2Se-based materials. Nat. Commun. 2023, 14, 2410. [Google Scholar] [CrossRef]
  14. Ramoshaba, M.; Mosuang, T. Correlations of the Electronic, Elastic and Thermo-Electric Properties of Alpha Copper Sulphide and Selenide. Computation 2023, 11, 233. [Google Scholar] [CrossRef]
  15. Nieroda, P.; Kusior, A.; Leszczyński, J.; Rutkowski, P.; Koleżyński, A. Thermoelectric properties of Cu2Se synthesized by hydrothermal method and densified by SPS technique. Materials 2021, 14, 3650. [Google Scholar] [CrossRef]
  16. Di Liu, W.; Yang, L.; Chen, Z.G. Cu2Se thermoelectrics: Property, methodology, and device. Nano Today 2020, 35, 100938. [Google Scholar] [CrossRef]
  17. Darwiche, M.; Faraj, J.; Chahine, K.; Shaito, A.; Awad, S.; Mortazavi, M.; Khaled, M. A comprehensive recent review and practical insights on the usage of advanced materials and enhancement strategies in thermoelectric applications. Results Eng. 2024, 24, 103354. [Google Scholar] [CrossRef]
  18. Zhang, Y.; Sun, J.; Shuai, J.; Tang, X.; Tan, G. Lead-free SnTe-based compounds as advanced thermoelectrics. Mater. Today Phys. 2021, 19, 100405. [Google Scholar] [CrossRef]
  19. Cao, W.; Wang, Z.; Miao, L.; Shi, J.; Xiong, R. Thermoelectric Properties of Strained β-Cu2Se. ACS Appl. Mater. Interfaces 2021, 13, 34367–34373. [Google Scholar] [CrossRef] [PubMed]
  20. Bo, L.; Zhang, R.; Zhao, H.; Hou, Y.; Wang, X.; Zhu, J.; Zhao, L.; Zuo, M.; Zhao, D. Achieving High Thermoelectric Properties of Cu2Se via Lattice Softening and Phonon Scattering Mechanism. ACS Appl. Energy Mater. 2022, 5, 6453–6461. [Google Scholar] [CrossRef]
  21. Pavlidis, V.; Karagiannis, I.; Sidiropoulos, N.; Teknetzi, A.; Malletzidou, L.; Stergioudi, F.; Michailidis, N.; Vourlias, G.; Stathokostopoulos, D. PoS(BPU11)210 Formation of Copper Selenide Synthesized by Mechanical Alloying. Available online: https://pos.sissa.it/ (accessed on 5 April 2025).
  22. Tarani, E.; Stathokostopoulos, D.; Karfaridis, D.; Malletzidou, L.; Sfampa, I.K.; Stergioudi, F.; Maliaris, G.; Michailidis, N.; Chrissafis, K.; Vourlias, G. Effect of ball milling time on the formation and thermal properties of Ag2Se and Cu2Se compounds. J. Therm. Anal. Calorim. 2023, 148, 13065–13081. [Google Scholar] [CrossRef]
  23. Muthukannan, A.; Sivakumar, G.; Mohanraj, K. Influence of equimolar concentration on structural and optical properties of binary selenides nanoparticles. Part. Sci. Technol. 2014, 32, 392–398. [Google Scholar] [CrossRef]
  24. Butt, S.; Farooq, M.U.; Mahmood, W.; Salam, S.; Sultan, M.; Basit, M.A.; Ma, J.; Lin, Y.; Nan, C.-W. One-step rapid synthesis of Cu2Se with enhanced thermoelectric properties. J. Alloys Compd. 2019, 786, 557–564. [Google Scholar] [CrossRef]
  25. Ivanov, A.A.; Akchrin, R.K.; Bogomolov, D.I.; Bublik, V.T.; Voronov, M.V.; Lavrentev, M.G.; Panchenko, V.P.; Parkhomenko, Y.N.; Tabachkova, N.Y. Phase Composition and Thermoelectric Properties of Materials Based on Cu2–xSe (0.03 ≤ x ≤ 0.23). Nanobiotechnol. Rep. 2021, 16, 351–356. [Google Scholar] [CrossRef]
  26. Qadri, S.B.; Skelton, E.F.; Dinsmore, A.D.; Hu, J.Z.; Kim, W.J.; Nelson, C.; Ratna, B.R. The effect of particle size on the structural transitions in zinc sulfide. J. Appl. Phys. 2001, 89, 115–119. [Google Scholar] [CrossRef]
  27. Liu, X.D.; Nagumo, M.; Umemoto, M. The Hall-Petch Relationship in Nanocrystalline Materials. Mater. Trans. JIM 1997, 38, 1033–1039. [Google Scholar] [CrossRef]
  28. Chen, Z.; Sun, Q.; Zhang, F.; Mao, J.; Chen, Y.; Li, M.; Chen, Z.-G.; Ang, R. Mechanical alloying boosted SnTe thermoelectrics. Mater. Today Phys. 2021, 17, 100340. [Google Scholar] [CrossRef]
  29. Bao, X.; Hou, S.; Wu, Z.; Wang, X.; Yin, L.; Liu, Y.; He, H.; Duan, S.; Wang, B.; Mao, J.; et al. Mechanical properties of thermoelectric generators. J. Mater. Sci. Technol. 2023, 148, 64–74. [Google Scholar] [CrossRef]
  30. Zhang, J.; Zhang, C.; Zhu, T.; Yan, Y.; Su, X.; Tang, X. Mechanical Properties and Thermal Stability of the High-Thermoelectric-Performance Cu2Se Compound. ACS Appl. Mater. Interfaces 2021, 13, 45736–45743. [Google Scholar] [CrossRef]
  31. Bugalia, A.; Gupta, V.; Thakur, N. Strategies to enhance the performance of thermoelectric materials: A review. J. Renew. Sustain. Energy 2023, 15, 032704. [Google Scholar] [CrossRef]
Figure 1. (a) XRD patterns of the produced powders in several Cu/Se stoichiometries. Comparative graph of (b) crystalline phase percentage and (c) crystallite size of the produced powders in several Cu/Se stoichiometries.
Metals 15 00640 g001
Figure 2. Comparative graph of (a) contribution percentages and (b) crystallite sizes for Cu/Se stoichiometries 1.9, 2.0, and 1.8 samples produced via cold pressing. (c) Magnified views of the diffraction peaks near 27° and 44°. Dashed black line represents the diffraction peaks near 27° and 44° for the Cu:Se = 1.9.
Metals 15 00640 g002
Figure 3. (a) Vickers microhardness and (b) nanoindentation for samples modified with varying copper contents with stoichiometric ratio Cu:Se = 1.8, 1.9, and 2.0 produced via cold pressing.
Metals 15 00640 g003
Figure 4. (a) Stress–strain curves for the samples with different Cu stoichiometries tested in elastic compression and elasticity modulus versus the Cu/Se stoichiometric ratio for the produced samples. (b) The apparatus used for the compressive testing.
Metals 15 00640 g004
Figure 5. Characteristic experimental results during bending test for the investigated samples.
Metals 15 00640 g005
Figure 6. The developed FEA model.
Metals 15 00640 g006
Figure 7. (a) Equivalent stress distributions in the Cu2Se sample during bending test. (b) Determination of the flexural moduli of the investigated materials.
Metals 15 00640 g007
Disclaimer/Publisher’s Note: The statements, opinions and data contained in all publications are solely those of the individual author(s) and contributor(s) and not of MDPI and/or the editor(s). MDPI and/or the editor(s) disclaim responsibility for any injury to people or property resulting from any ideas, methods, instructions or products referred to in the content.

