5.1. Process Window Based on MPW Technological Parameters
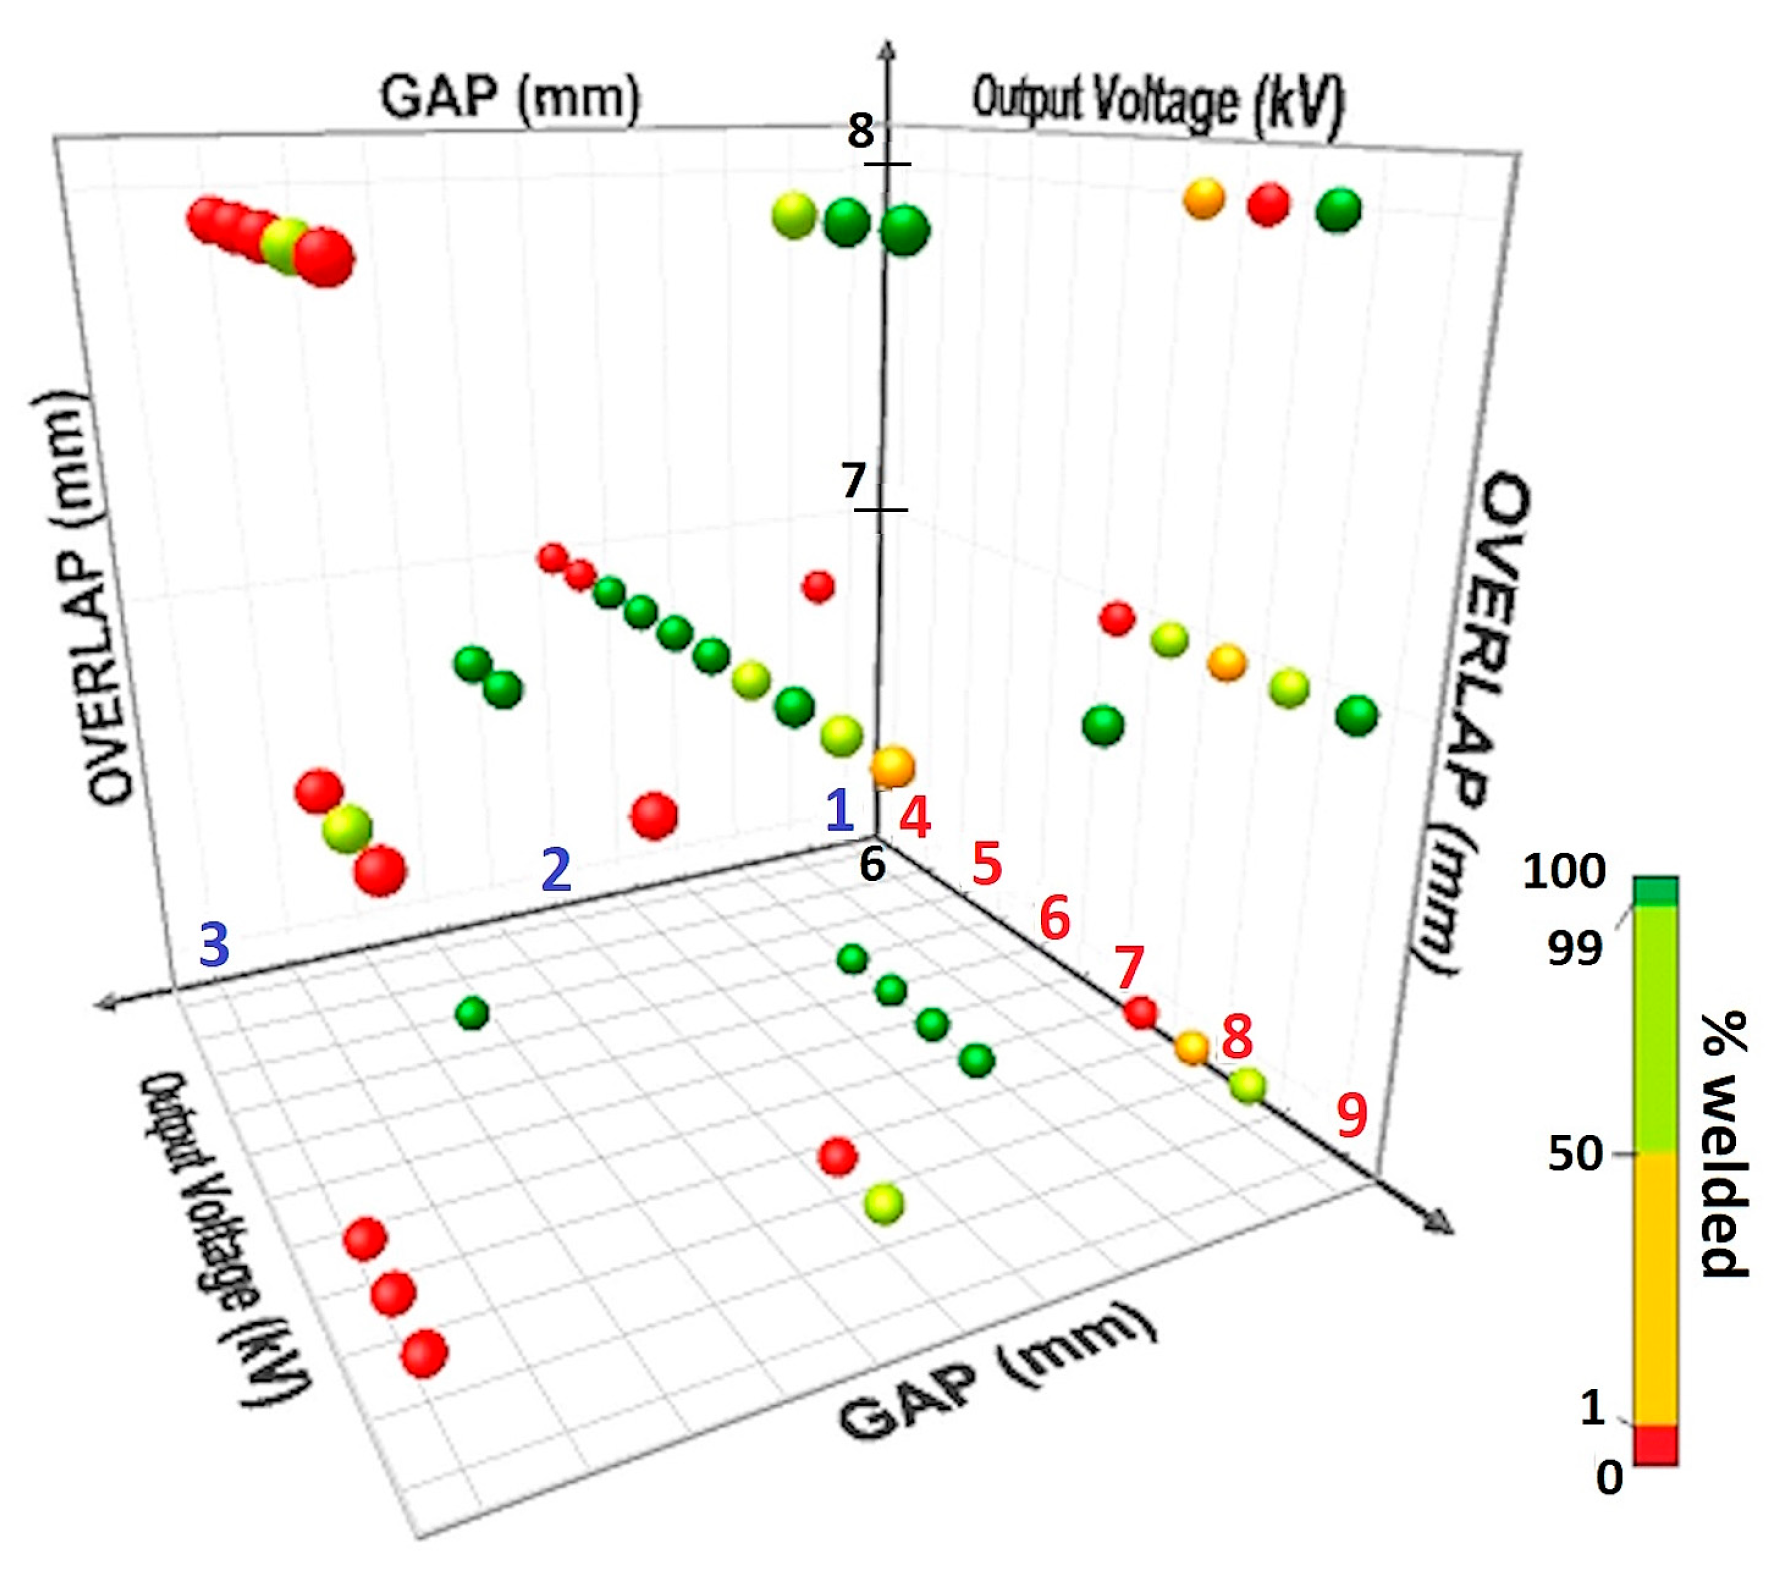
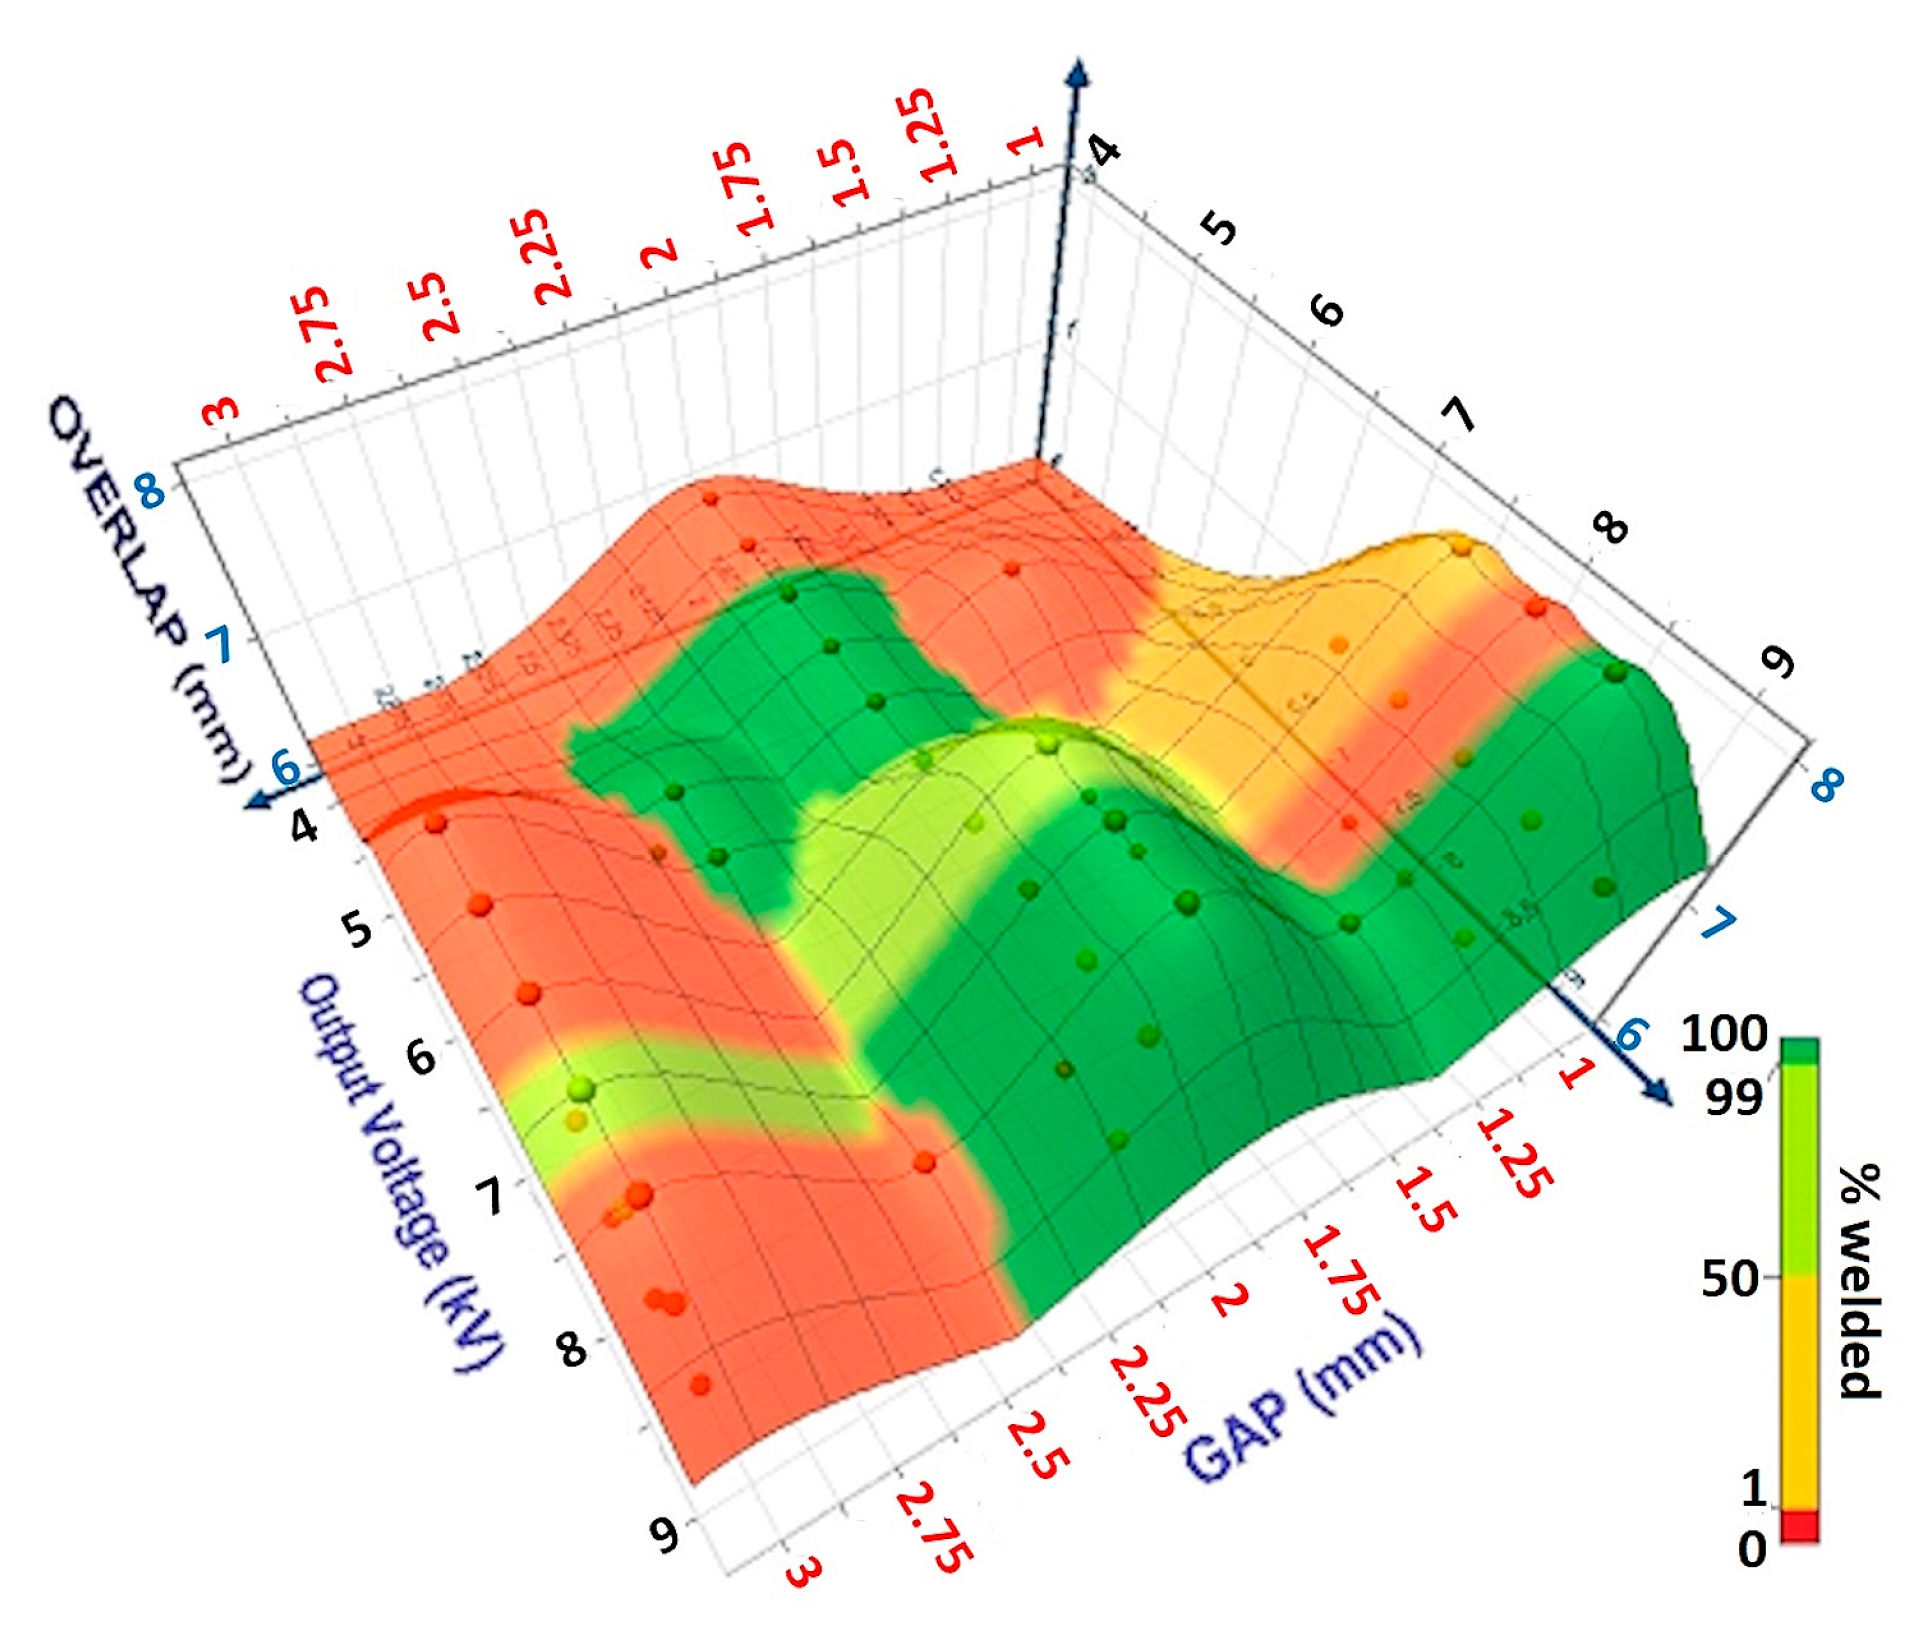
The combination of two parameters gave no real information about the weldability of this process, since different combinations of gap, overlap, and cantilevered can give the same impact angle. A three-parameters window, on the other hand, showed more information (
Figure 15) and clearly pointed out the region where the combination of the three parameters (gap, overlap, and output energy) allowed us to reach 100% of the welded samples. However, this type of process window is, again, dependent on the equipment used and cannot be transposed to equipment where the inductor has a different geometry, the LRC circuit has other characteristics, etc. On the other hand, these parameters are directly programmed on the equipment and, therefore, easier to implement at the level of the process. The 3D representation allowed us to point out different parameter combinations where the process was stable and reached 100% of welded samples.
To generate the visualizations, XLSTAT was used. This is a statistical toolbox for Microsoft Excel that significantly extends Excel’s data analysis capabilities. The figures employ “4D plots” as a multivariable visualization technique. They are structured as follows. The three spatial dimensions (X, Y, Z axes) represent three different quantitative variables from technological or physical process parameters. Each sphere in 3D space (fourth dimension in color) represents an additional quantitative variable. In this case, the color tone encodes the numeric outcome of the welded joint’s success or failure.
The technique typically used by XLSTAT to generate surface plots is Inverse Distance Weighting (IDW) interpolation [
41]. IDW is a spatial interpolation method that estimates values at unsampled locations based on known data points, assuming that closer points exert more influence. This technique is more computationally efficient than 3D splines, has better handling of irregularly spaced data, and produces visually smooth and interpretable surfaces.
The bibliography does not mention overlap as a factor since most research was performed in a whole overlap configuration. However, if the purpose of the weld is to use it in BIW, a partial overlap is needed to be taken into account. The results showed the importance of overlap in the consideration of the welding first requirement. An analysis of variance (ANOVA) was made for both approaches (process parameters and impact parameters) concerning the percentage of welded stacks depending on the input parameters (technological or physical). The chosen model was a multiple linear regression model including the effects of (i) the main parameters, (ii) the two-by-two interactions of these parameters, and (iii) the quadratic effects of the main parameters. The analysis of variance was repeated until a model was obtained where all the parameters were significant (risk < 10%) with a regression coefficient greater than 0.9. The results for the process parameter approach pointed out the significance of the gap and the interactions between gap and overlap, gap and energy, and overlap and energy (
Table 4). This confirmed the importance of the three parameters and that the collision angle, which took into account the gap and the overlap, was not sufficient to properly define the viability zones of the process since different combinations of gap and overlap can result in the same impact angle.
The regression model showed excellent predictive capability with an R-value of 0.9056, indicating that approximately 82% of the variance in welding success percentage is explained by the technological parameters included in the model. The overall F-value of 27.35 with essentially zero risk confirmed the model was highly statistically significant.
Gap emerged as the most influential parameter, with a large positive coefficient (440.7) and the highest t-value (5.52). This suggests that increasing the gap between materials significantly improves welding success, though this effect is moderated by the negative quadratic term (−53.57), indicating an optimal gap distance beyond which performance declines.
Overlap showed a negative linear effect (−89.82) but a positive quadratic component, suggesting a U-shaped relationship where very small or very large overlaps may be detrimental, with an optimal intermediate range.
Output voltage demonstrated a complex relationship through its interactions and quadratic term. The negative quadratic coefficient (−7.46) suggested diminishing returns or an optimal voltage level.
The model revealed important parameter interactions, including:
Gap × Output Voltage showed a negative interaction (−30.76), meaning higher voltages may reduce the beneficial effect of increased gap.
Overlap × Output Voltage showed a positive interaction (24.24), suggesting these parameters work synergistically.
The significant quadratic terms for Gap and Output Voltage, combined with the interaction effects, indicated that this magnetic pulse welding process had well-defined optimal operating windows rather than simple linear relationships. The negative quadratic terms suggested that excessive values of key parameters can be detrimental to welding success.
The low residual variance (906.5) relative to the total variance indicated a good model fit, making this analysis valuable for process optimization and quality control in industrial applications.
5.2. Process Window Based on MPW Physical Parameters
Referring to the works cited above [
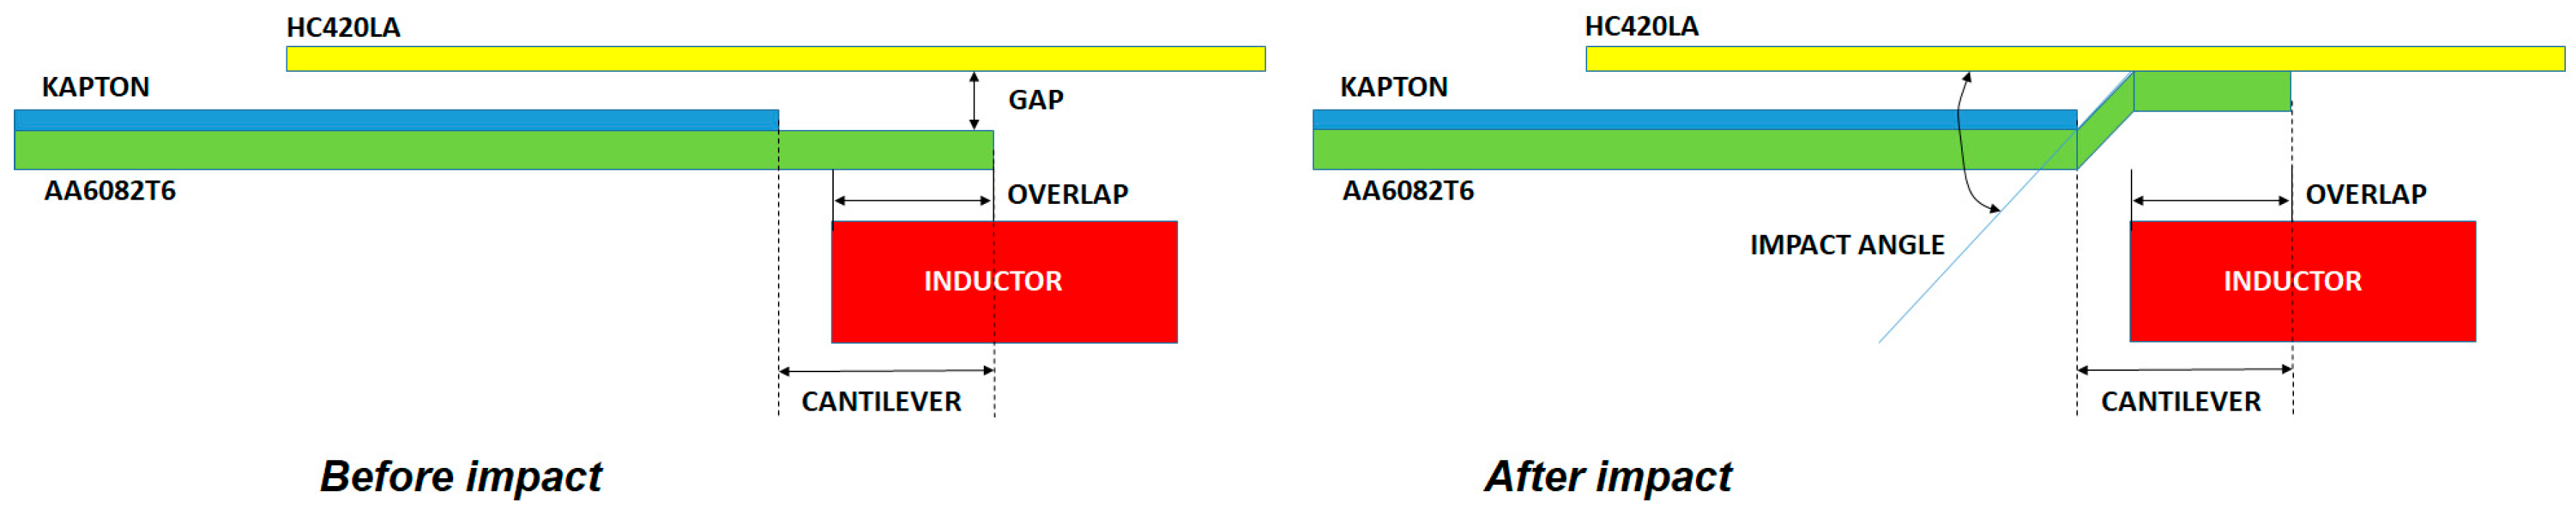
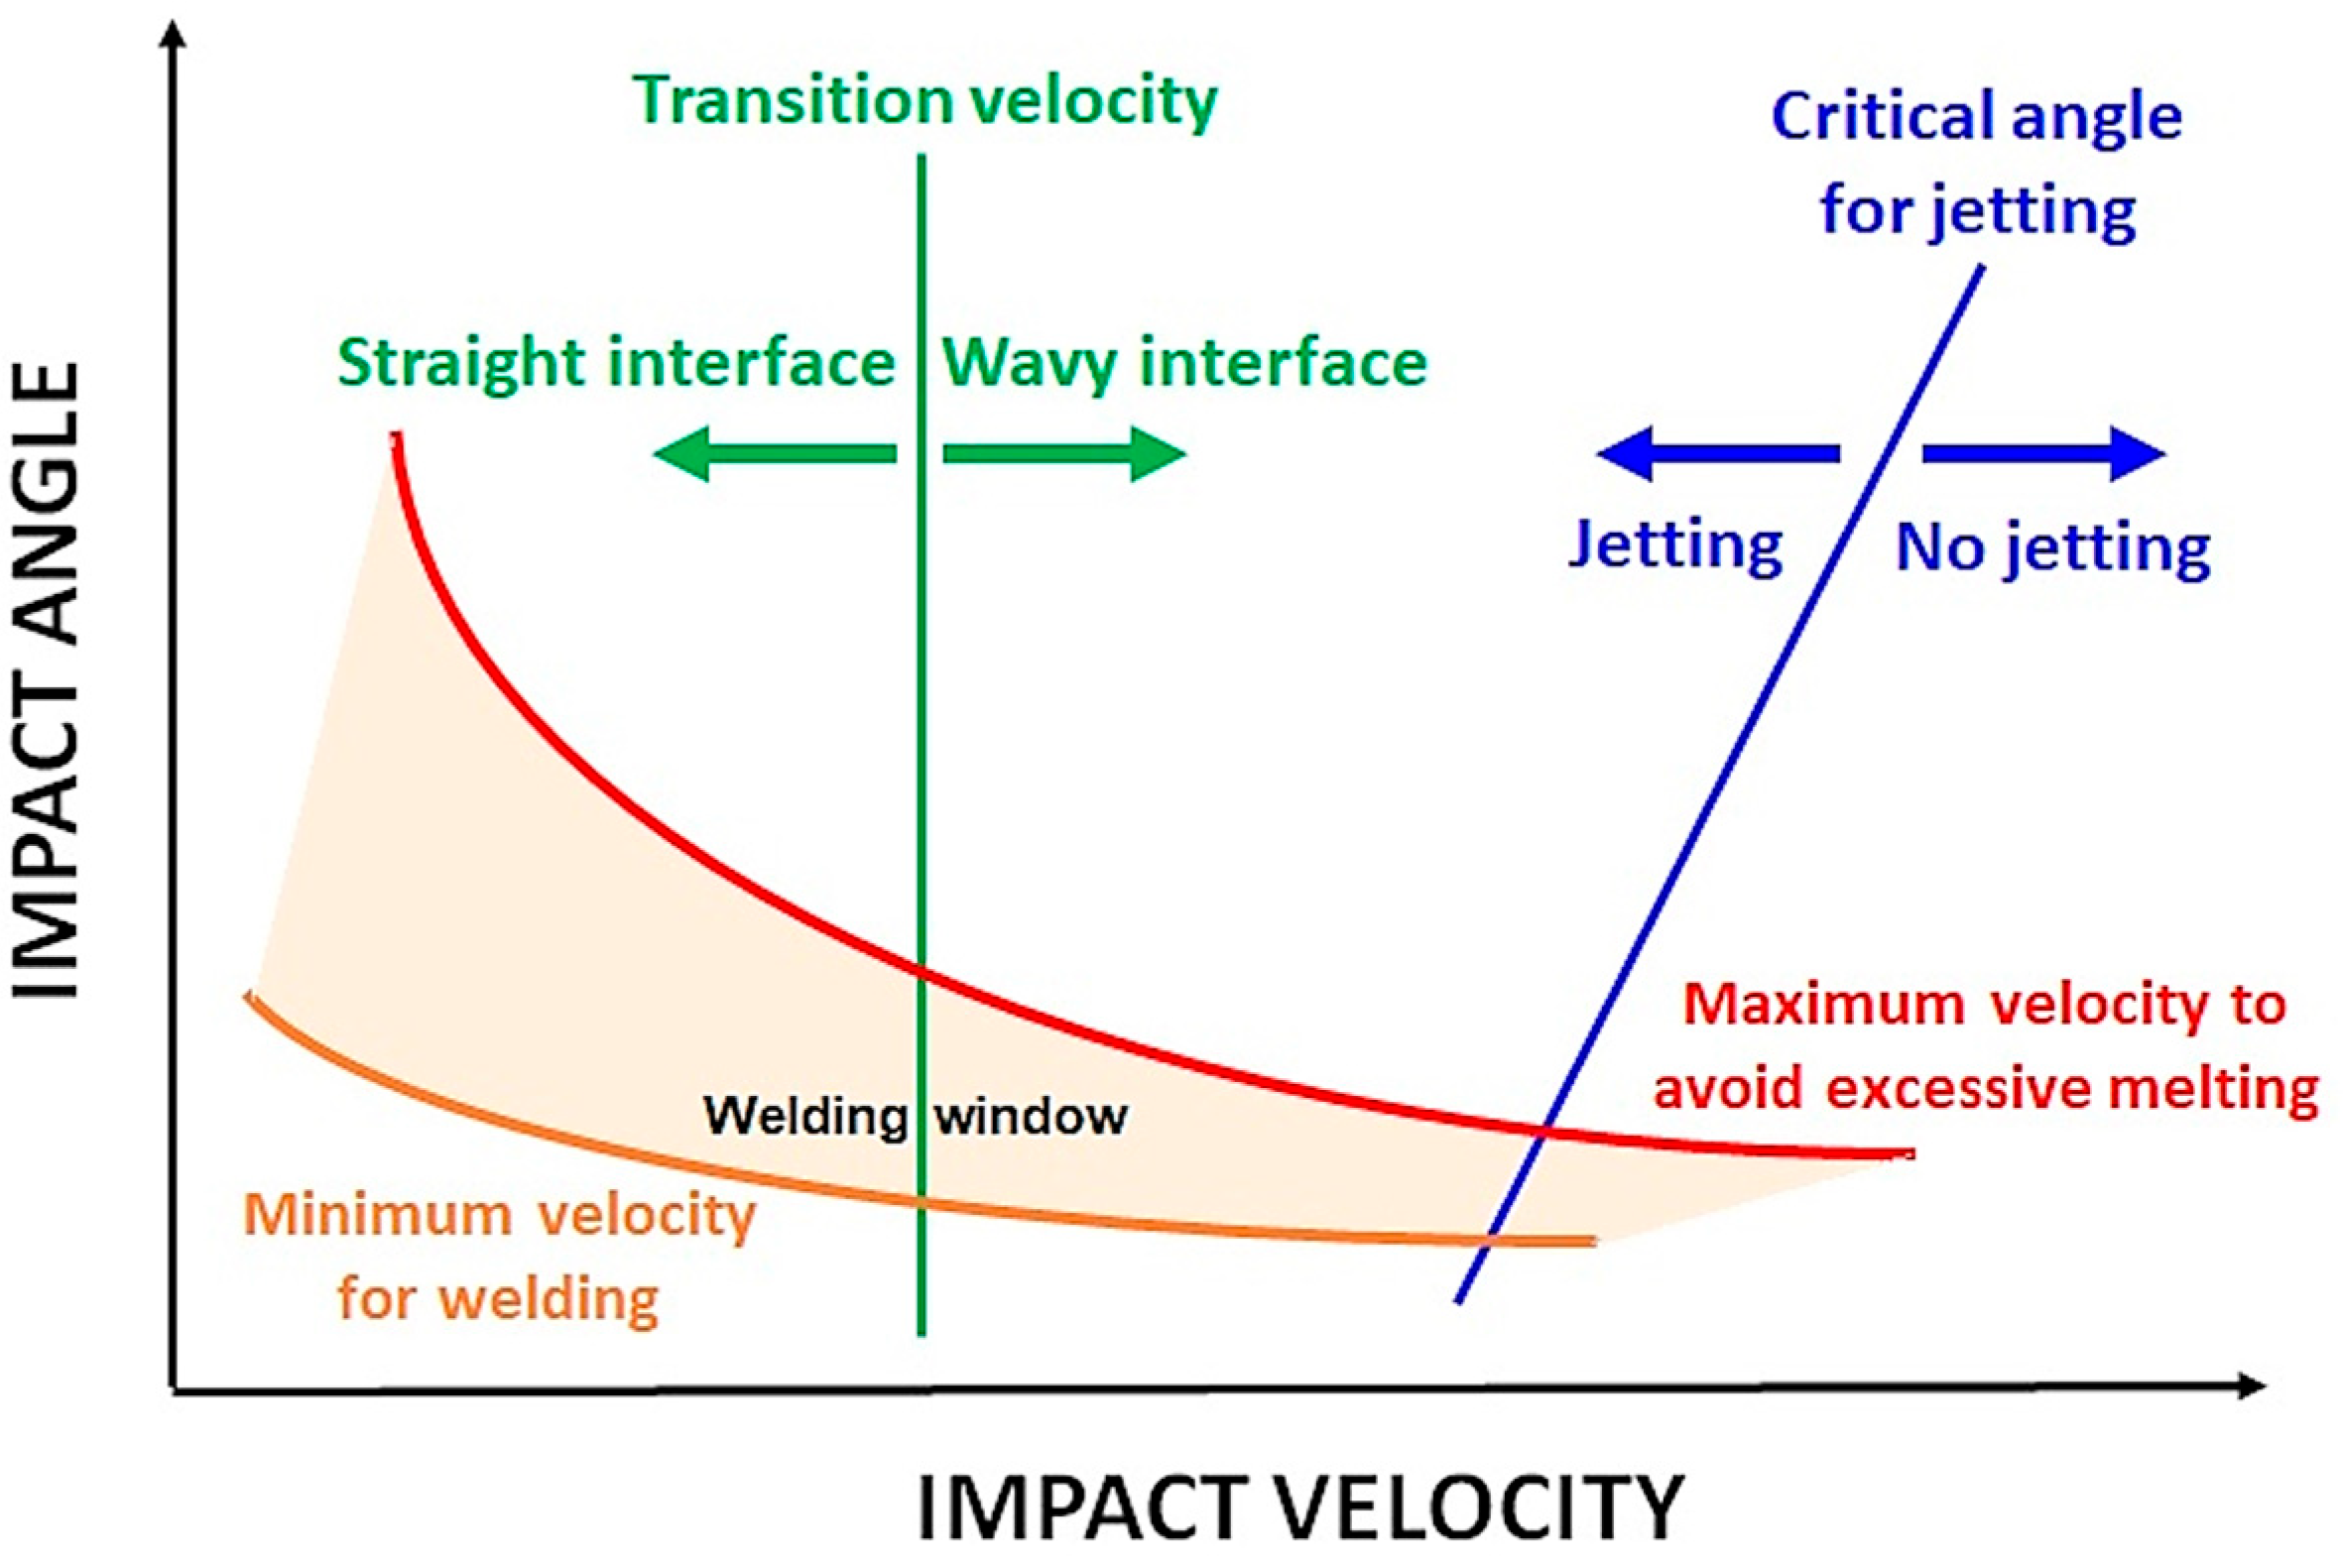
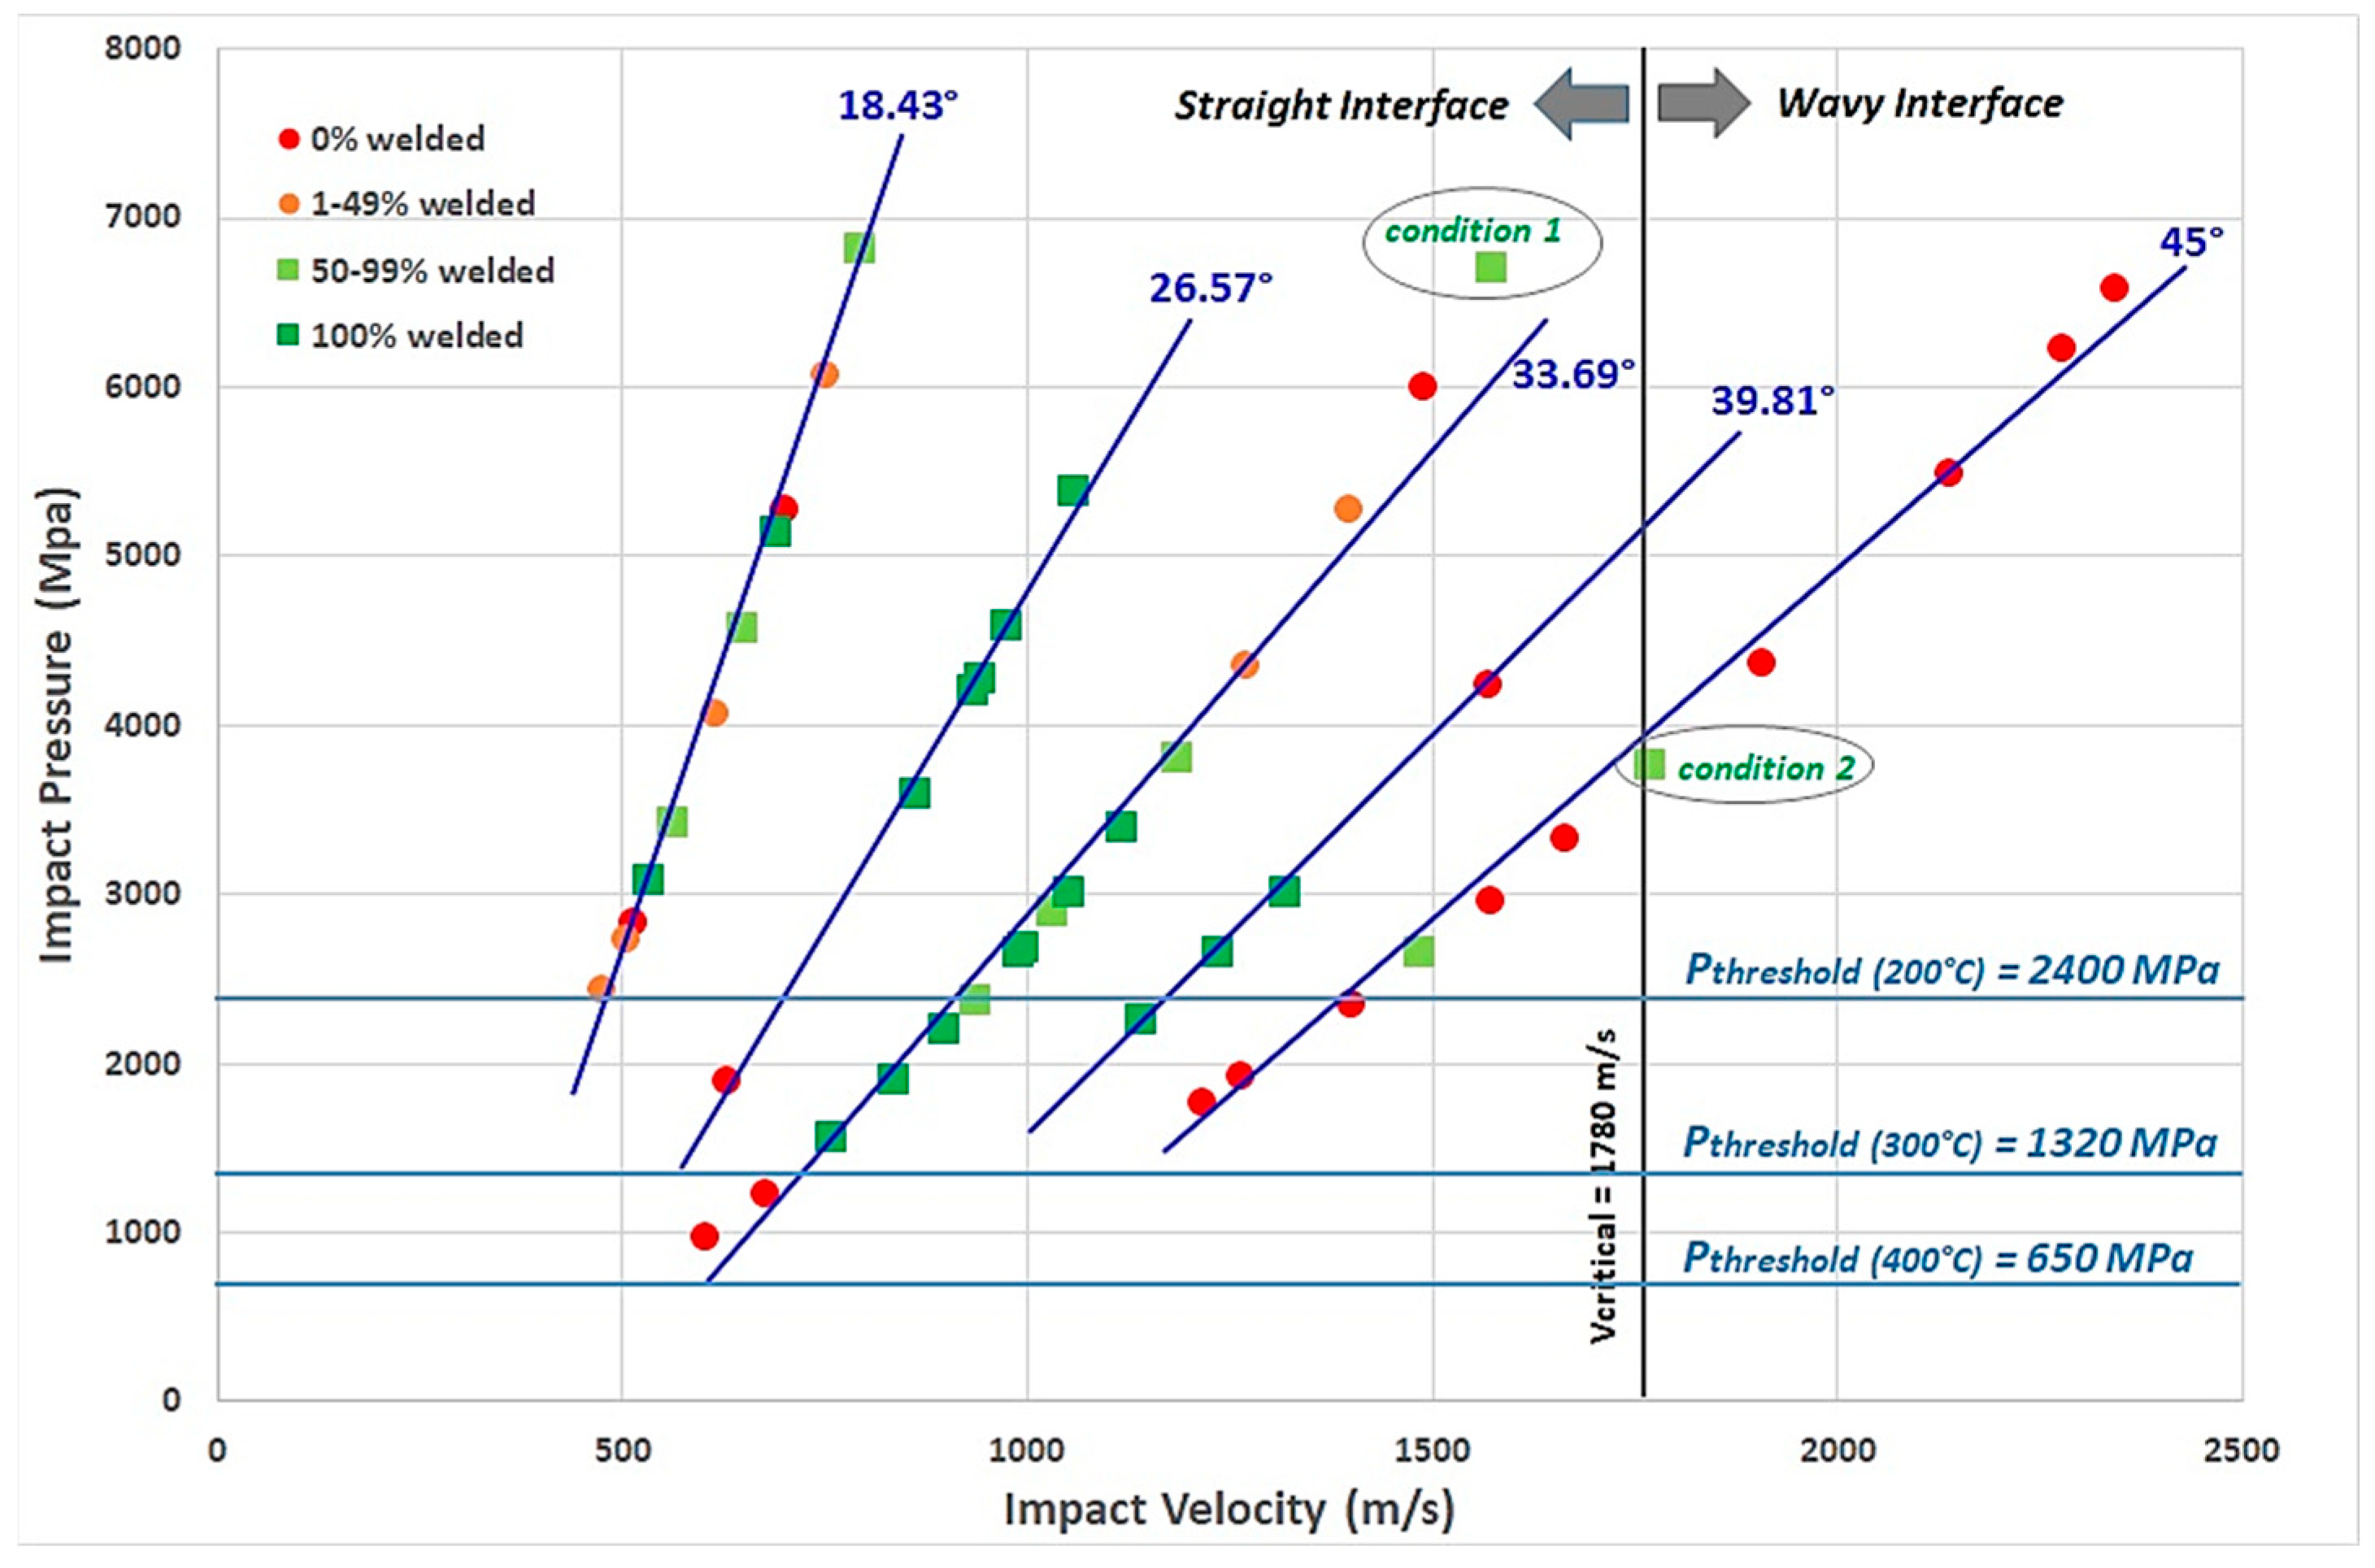
26], which are based on a physical approach to the MPW process, the parameters that really controlled the weld generation between the two materials were the impact pressure, the impact velocity, and the impact angle. These parameters were independent to the process implemented to perform the MPW and, therefore, allowed us to define a window of the process independently of the MPW equipment used. The only problem was linking these three impact parameters to the different process parameters (gap, overlap, mean energy, frequency, voltage, etc.).
They also allowed us to define different thresholds, guaranteeing the quality of the weld: critical impact speed for a straight or wavy welded interface, threshold pressure to weld the two materials, critical impact velocity to obtain the jetting phenomenon, etc. (
Figure 12).
In order to promote the phenomenon of jetting, the collision has to be subsonic compared to the speed of sound in the flyer material. In the case of AA6082-T6, the sound speed in the material was around 3040 m/s. In all the tests, this value was not overcome, which means that the condition of jetting, the ability to clean the surface of both materials, was reached.
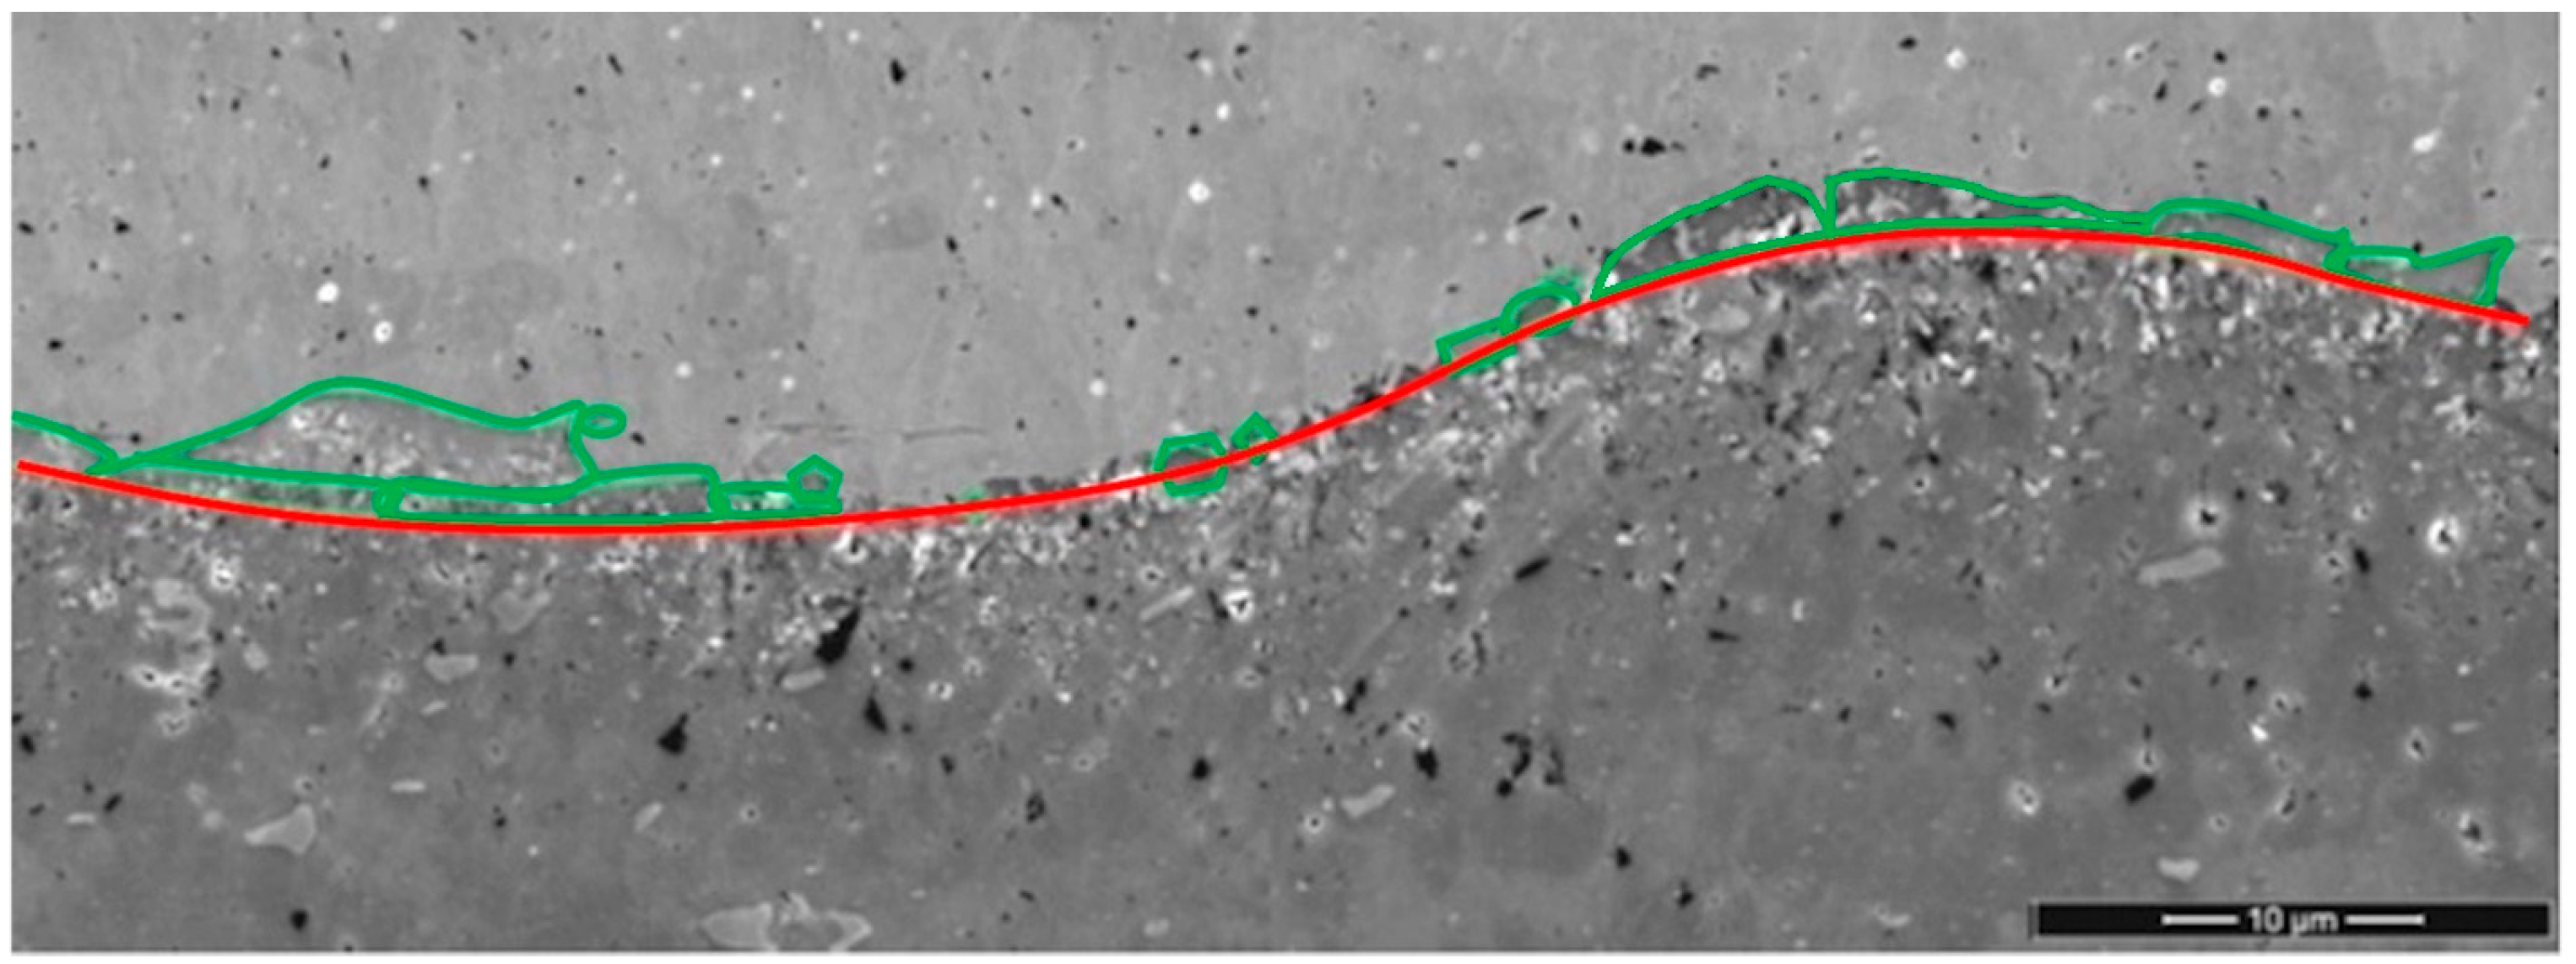
The waving morphology of the interface is also a characteristic of high-impact welding processes. This is due to the transition from a laminar to a turbulent flow of the flyer material during the collision. Cowan and Carpenter [
42] developed an analytical formula for explosive welding for determining this critical velocity,
Vc, by linking wave formation to fluid flow around an obstacle.
where
Re trans is the critical Reynolds number for transitioning from a laminar to a turbulent flow (~8.9 for aluminum alloys [
42]),
H is the Vickers hardness (46 HV at 400 °C for A6082 used in this study), and
ρ is the density (2700 kg/m
3 for A6082 and 7800 kg/m
3 for HC420LA). The flyer velocity overcomes a critical collision velocity required for a shear instability to develop for MPW [
43]. The value obtained from the experiments and from Equation (12) are in agreement (1780 m/s).
Figure 16 points out this difference in hydrodynamic regime for two conditions (noted as condition 1 and condition 2 in
Figure 12), where welding was achieved around this critical velocity.
According to Kapil and Sharm [
13], the threshold pressure necessary for welding the two plates is defined by Equations (7) and (8), and, using the data in
Table 2, we can estimate this minimum pressure being 2400, 1320, and 650 MPa for a temperature of the flyer in the impacted zone, respectively, of 200, 300, and 400 °C.
Kolsky [
29] pointed out a linear relation of the impact pressure with the impact velocity (Equation (5)) depending only on the characteristics of the two materials to be welded (density and speed of sound in each of them).
Figure 12 confirms this trend by highlighting the important role of the impact angle, with a Pi/Vi ratio which decrease when the impact angle increases (
Table 5).
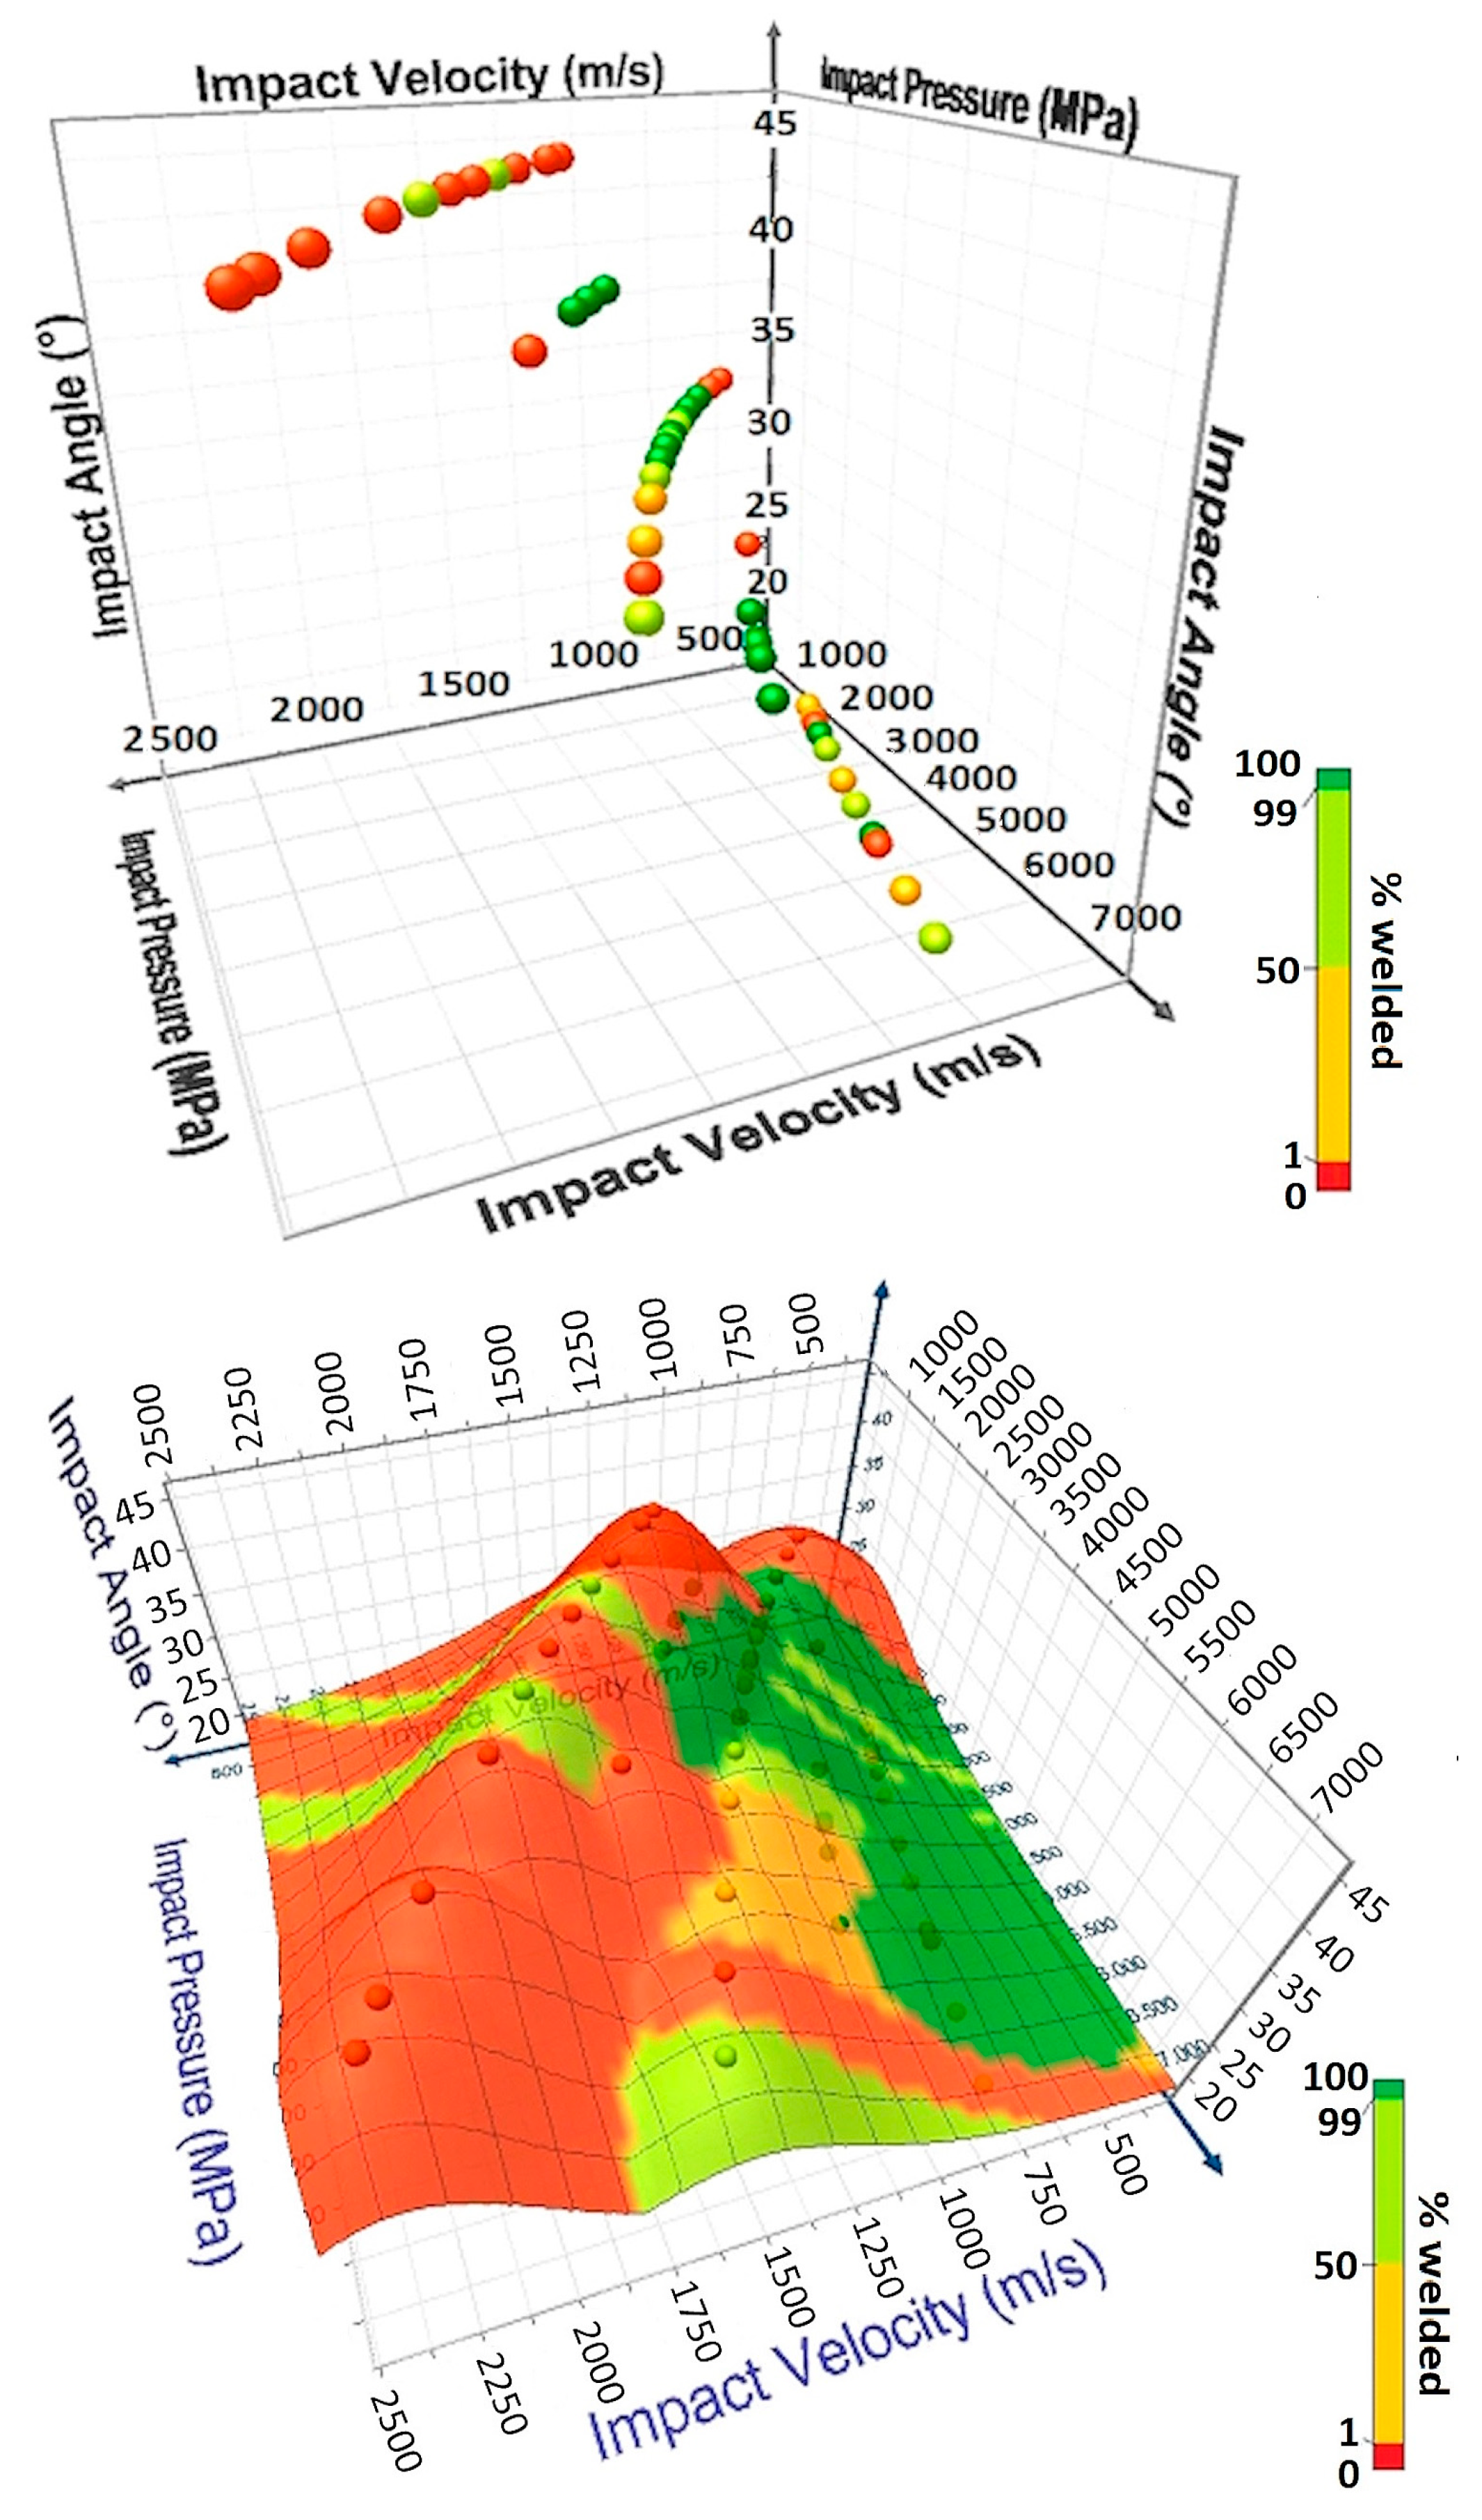
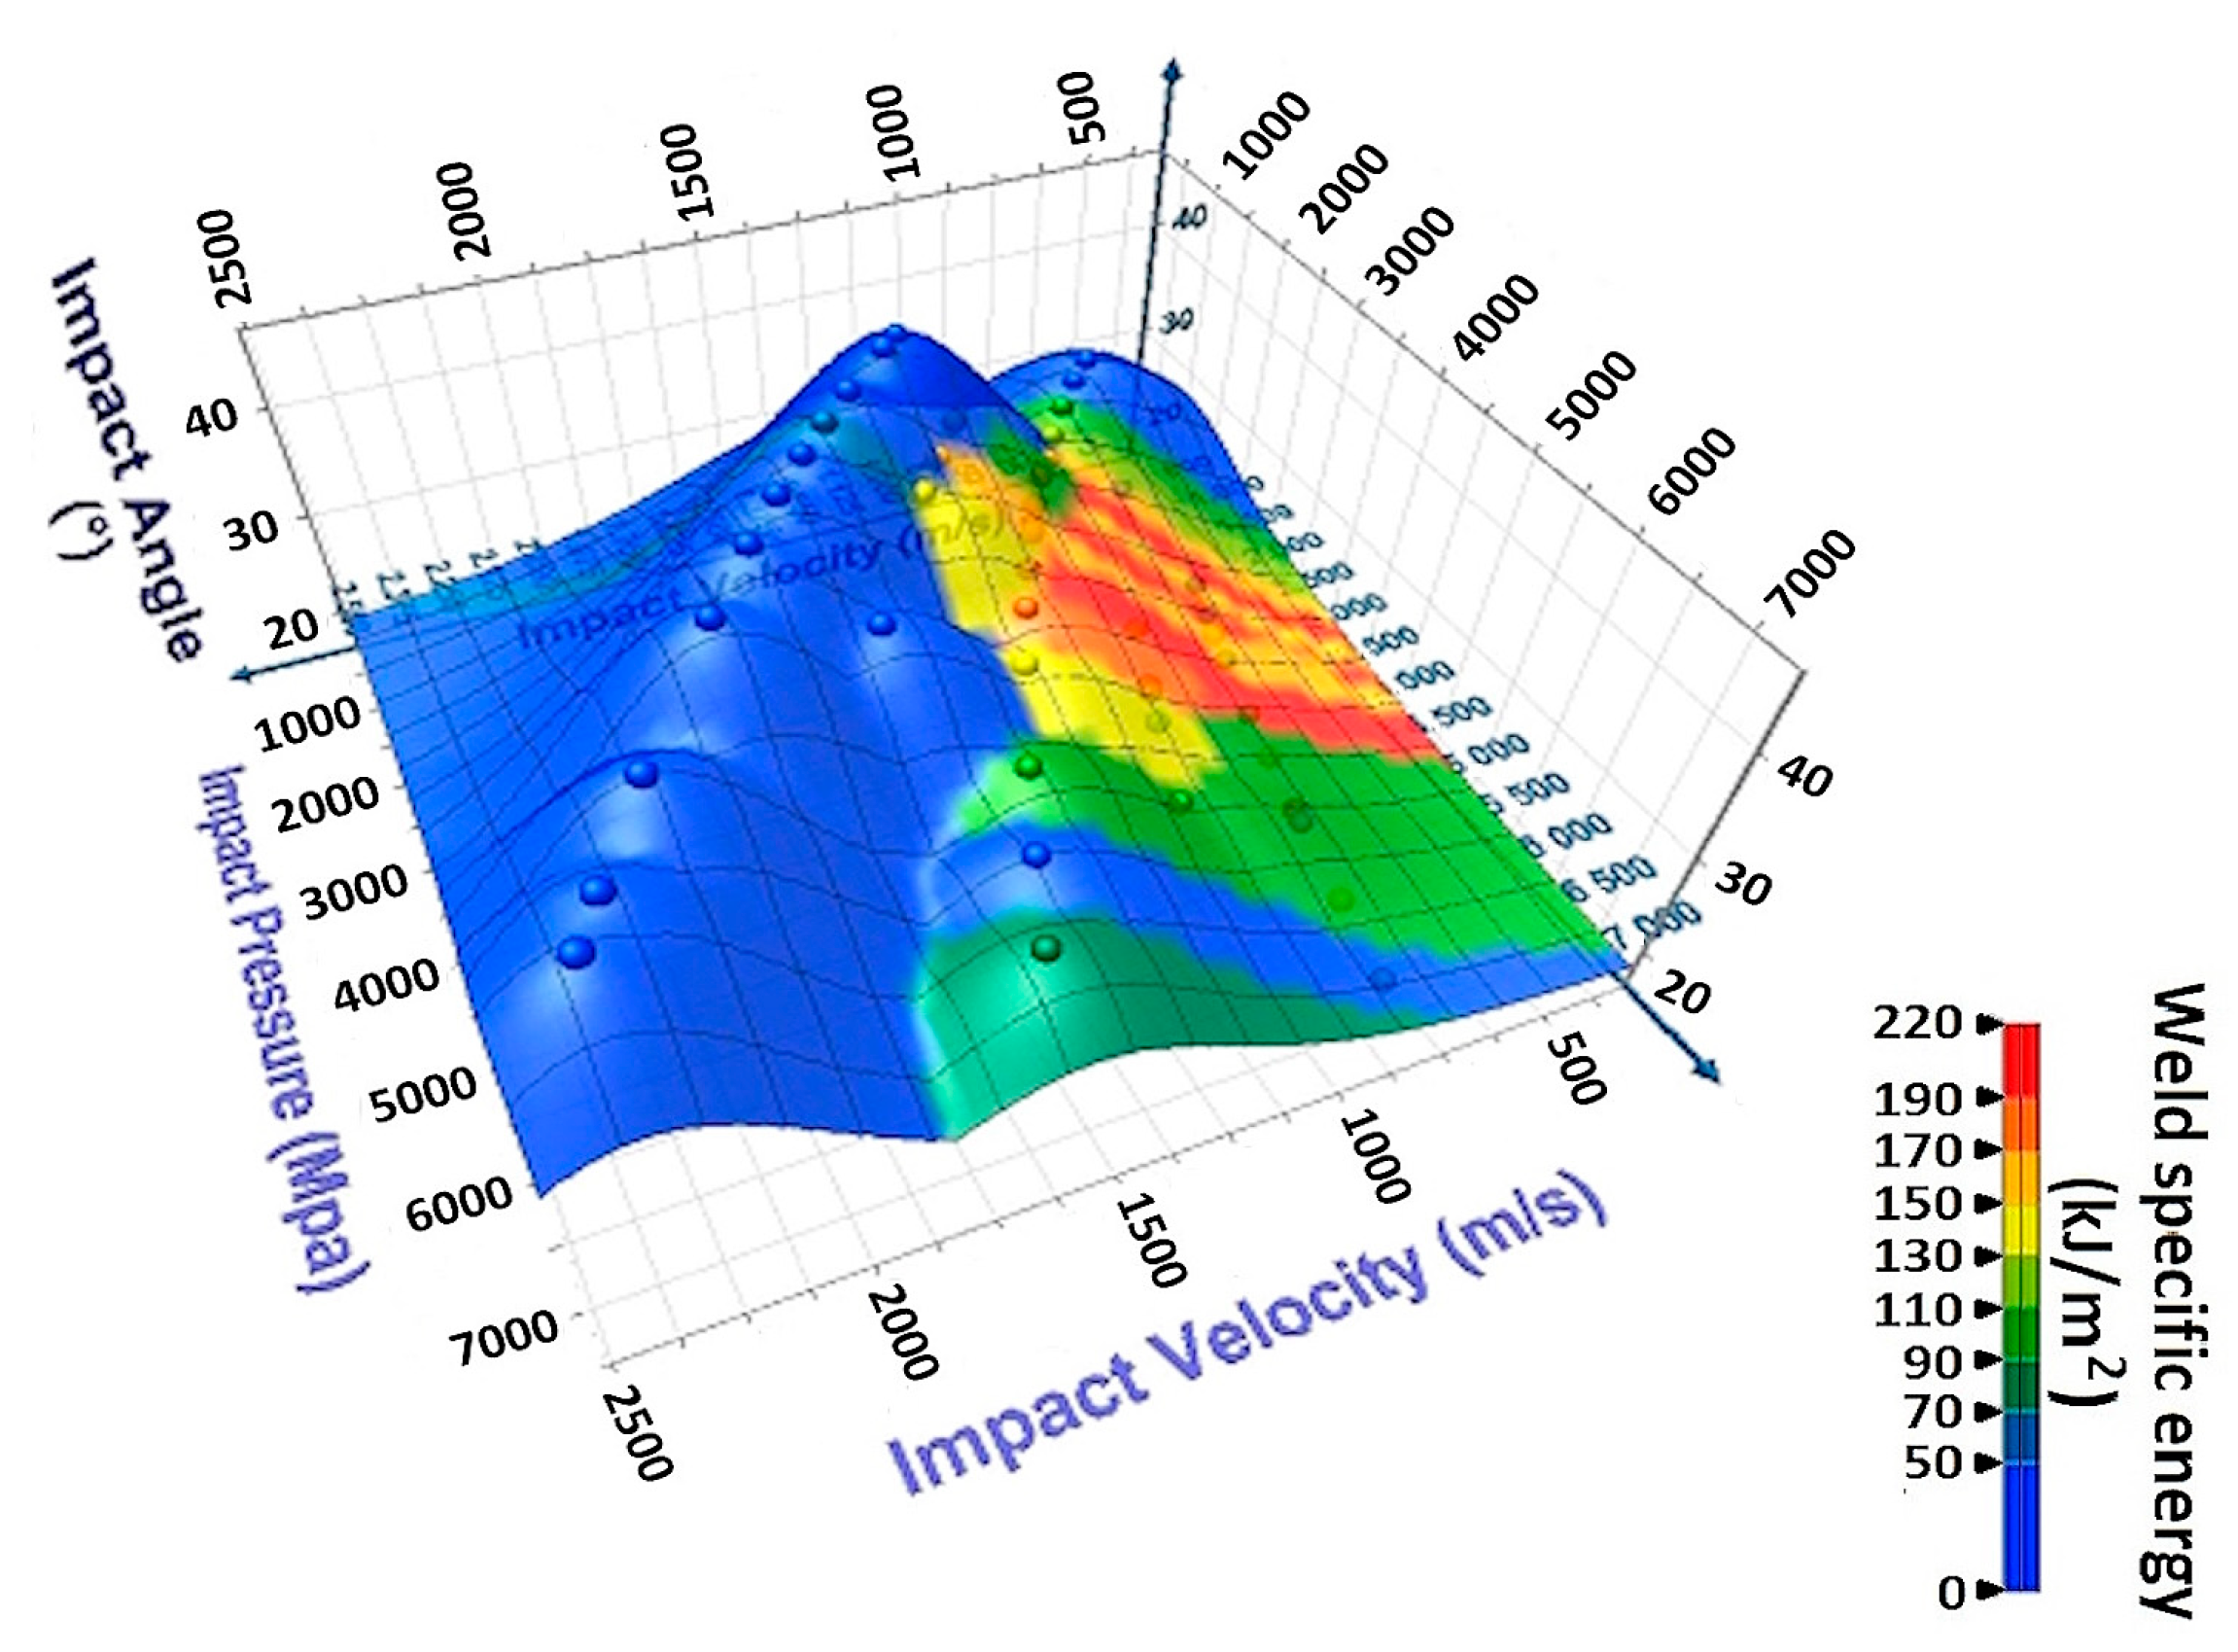
The three-dimensional process window considering the impact parameters is shown in
Figure 17. Here, again, two zones can be pointed out where the process was stable and 100% of the welded samples were successfully achieved.
The analysis of variance of the results confirmed that the impact pressure, the impact velocity, and the interaction between impact velocity and impact angle were the significant parameters of the process (
Table 6). This confirmed the results of the bibliography, where it was specified that a minimum pressure is necessary to ensure welding and that a critical speed defines the type of interface obtained (straight or wavy) and highlights the importance of the impact velocity associated with the collision angle. The impact velocity necessary to generate sufficient impact pressure for welding is intrinsically related to the angle at which the collision occurs.
This impact parameter model demonstrated similarly excellent predictive capability with an R-value of 0.9042, explaining approximately 82% of the variance in welding success percentage. The F-value of 22.41 with zero risk confirmed strong statistical significance, indicating that impact parameters are crucial determinants of welding success.
The impact velocity showed the strongest positive influence (coefficient: 5.89, t-value: 4.81), indicating that higher impact velocities significantly improve welding success. The positive quadratic term (0.0007) suggested this beneficial effect continued to increase, though at a diminishing rate.
The impact pressure exhibited a negative linear effect (−0.1945) but with a small positive quadratic component, suggesting an optimal pressure range where too little pressure is ineffective but excessive pressure may also be detrimental to weld quality.
The impact angle demonstrated a strong negative linear coefficient (−71.03) with a positive quadratic term (1.38), indicating a U-shaped relationship. This suggests there was an optimal impact angle, with performance declining as angles deviated significantly from this optimum in either direction.
The model revealed two important negative interactions, as follows:
Impact Pressure × Impact Angle (−0.0158): higher pressures became less effective at certain angles.
Impact Velocity × Impact Angle (−0.1133): the benefits of higher velocity were reduced at certain impact angles.
These interactions suggest that parameter optimization must consider the combined effects rather than individual parameter optimization.
The dominance of impact velocity as a positive factor, combined with the complex angle-dependent interactions, indicated that achieving optimal collision dynamics is critical for successful magnetic pulse welding. The negative interaction terms suggested that there are specific combinations of pressure, velocity, and angle that maximize welding success. Interestingly, this impact parameter model (R = 0.9042) performed nearly as well as the technological parameter model (R = 0.9056), suggesting that both the setup parameters and the resulting impact dynamics are equally important for predicting welding success. The similar residual variances indicated both models captured the essential physics of the welding process effectively.
5.3. Influence of Weld Microstructure and Role of Intermetallic Compounds
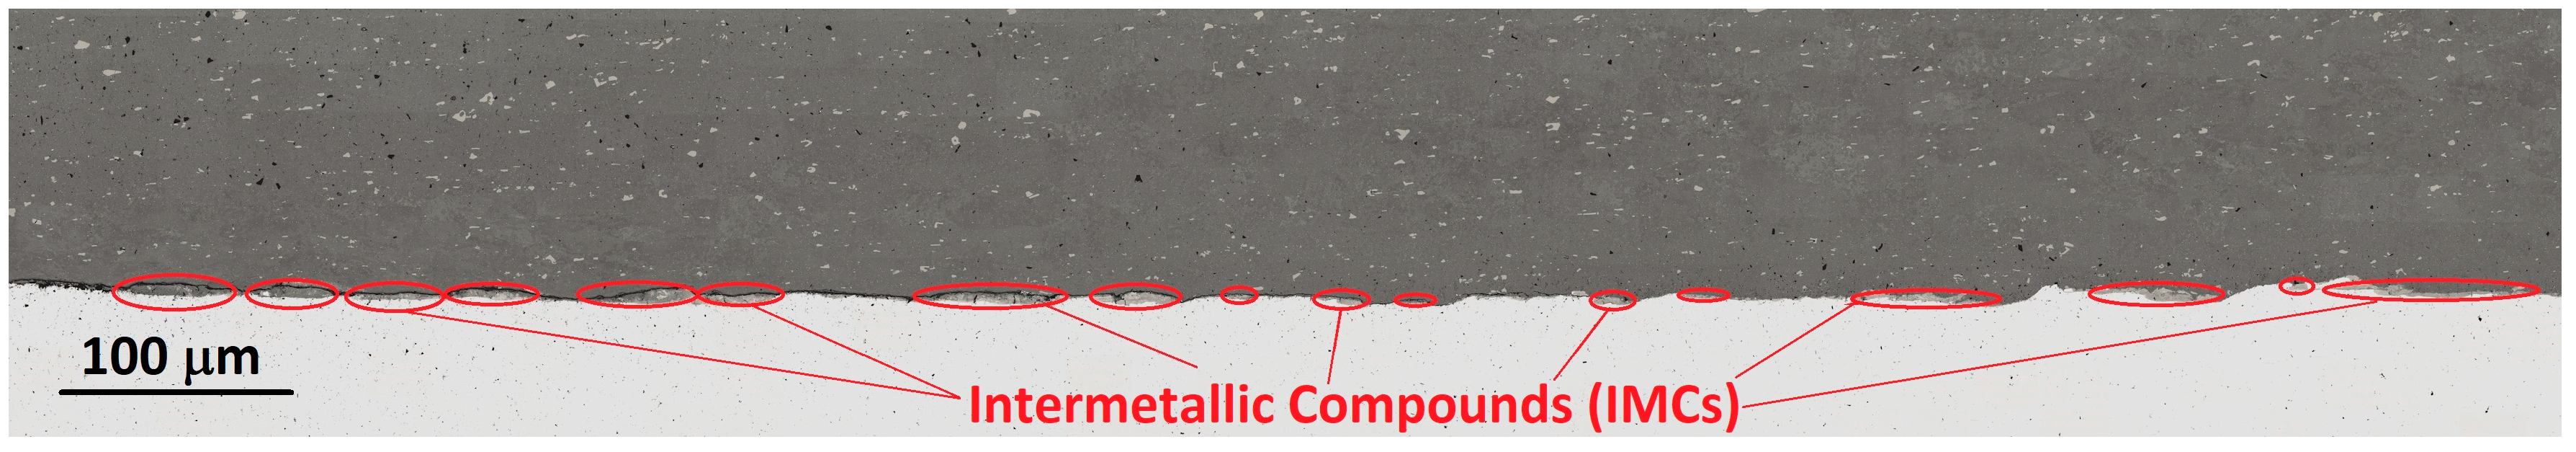
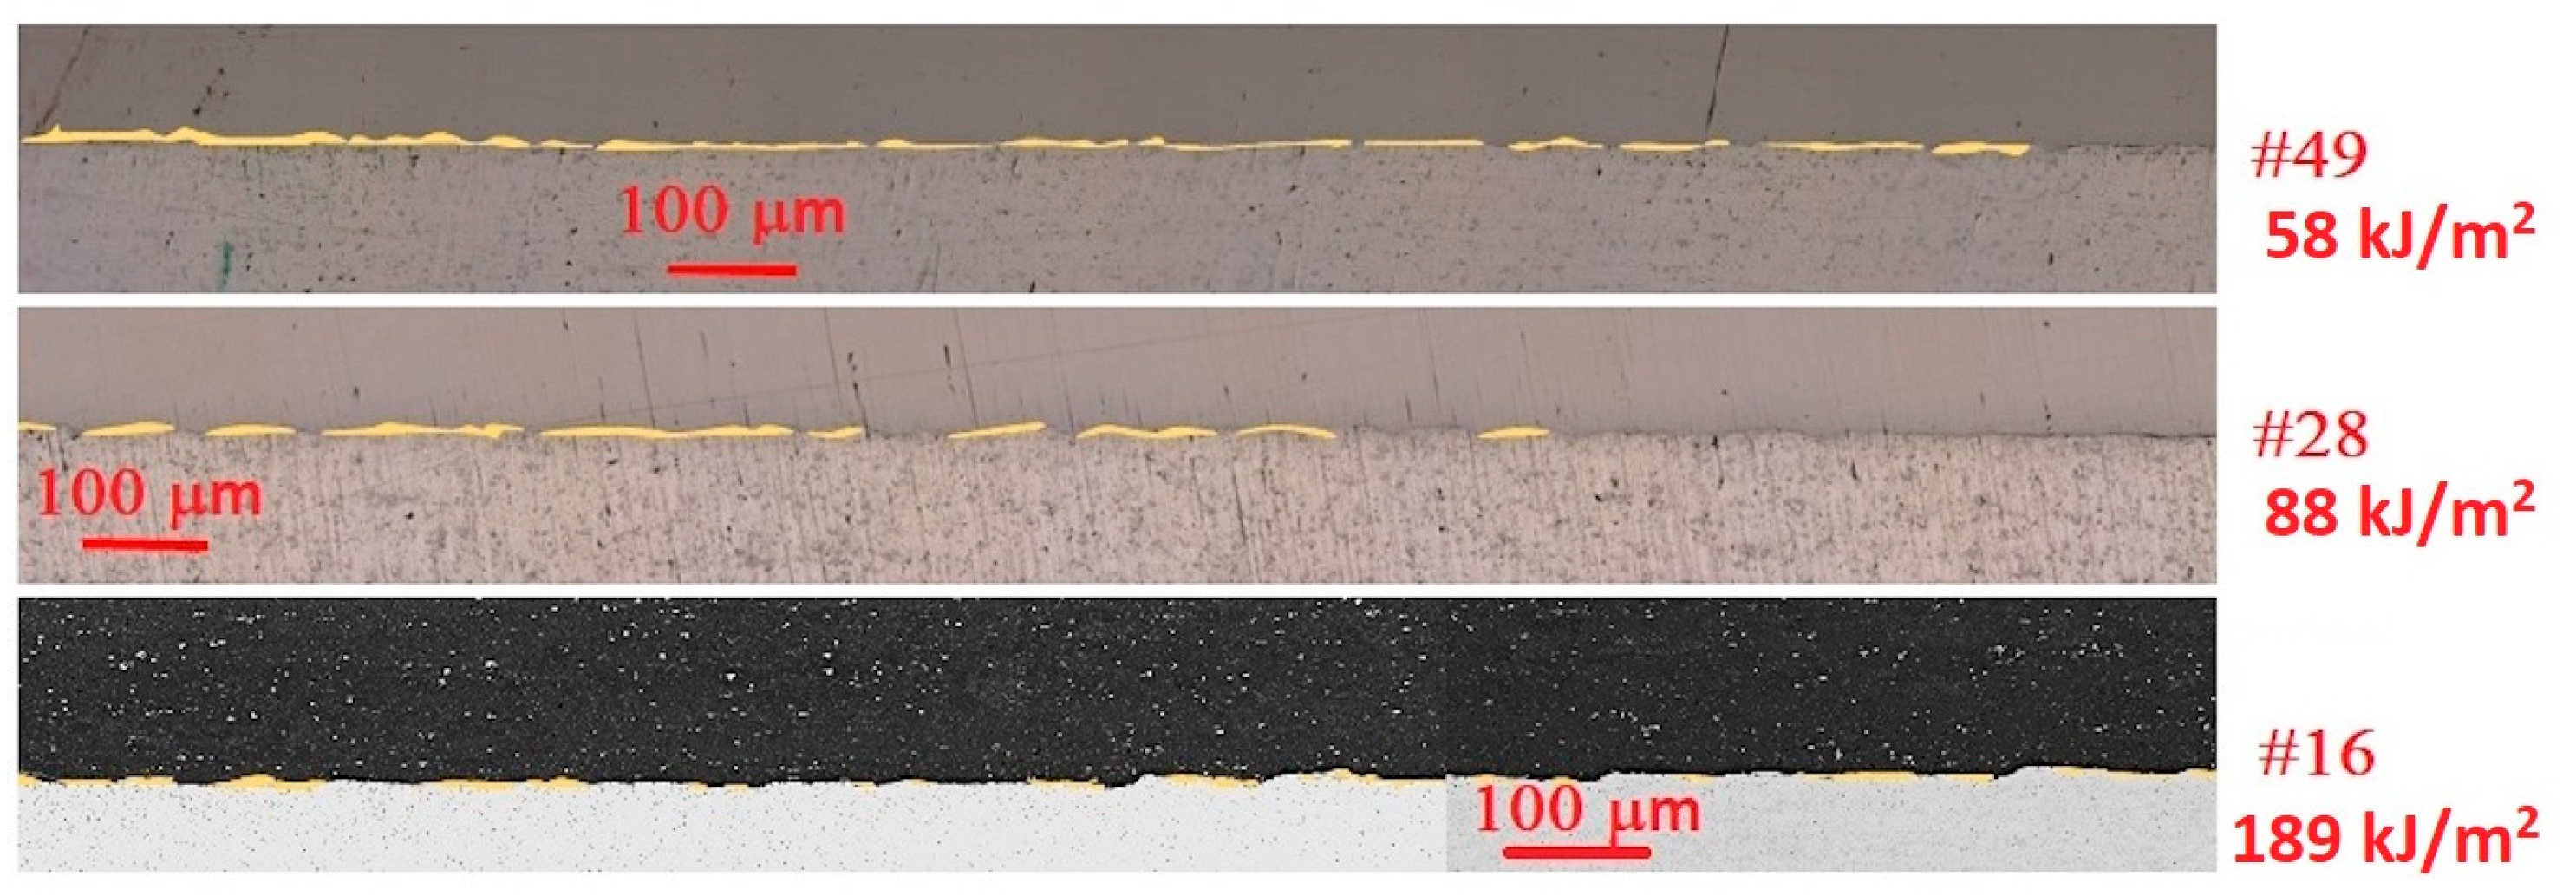
After polishing and chemical etching to highlight the intermetallic compounds, micrographs were made by optical microscopy (
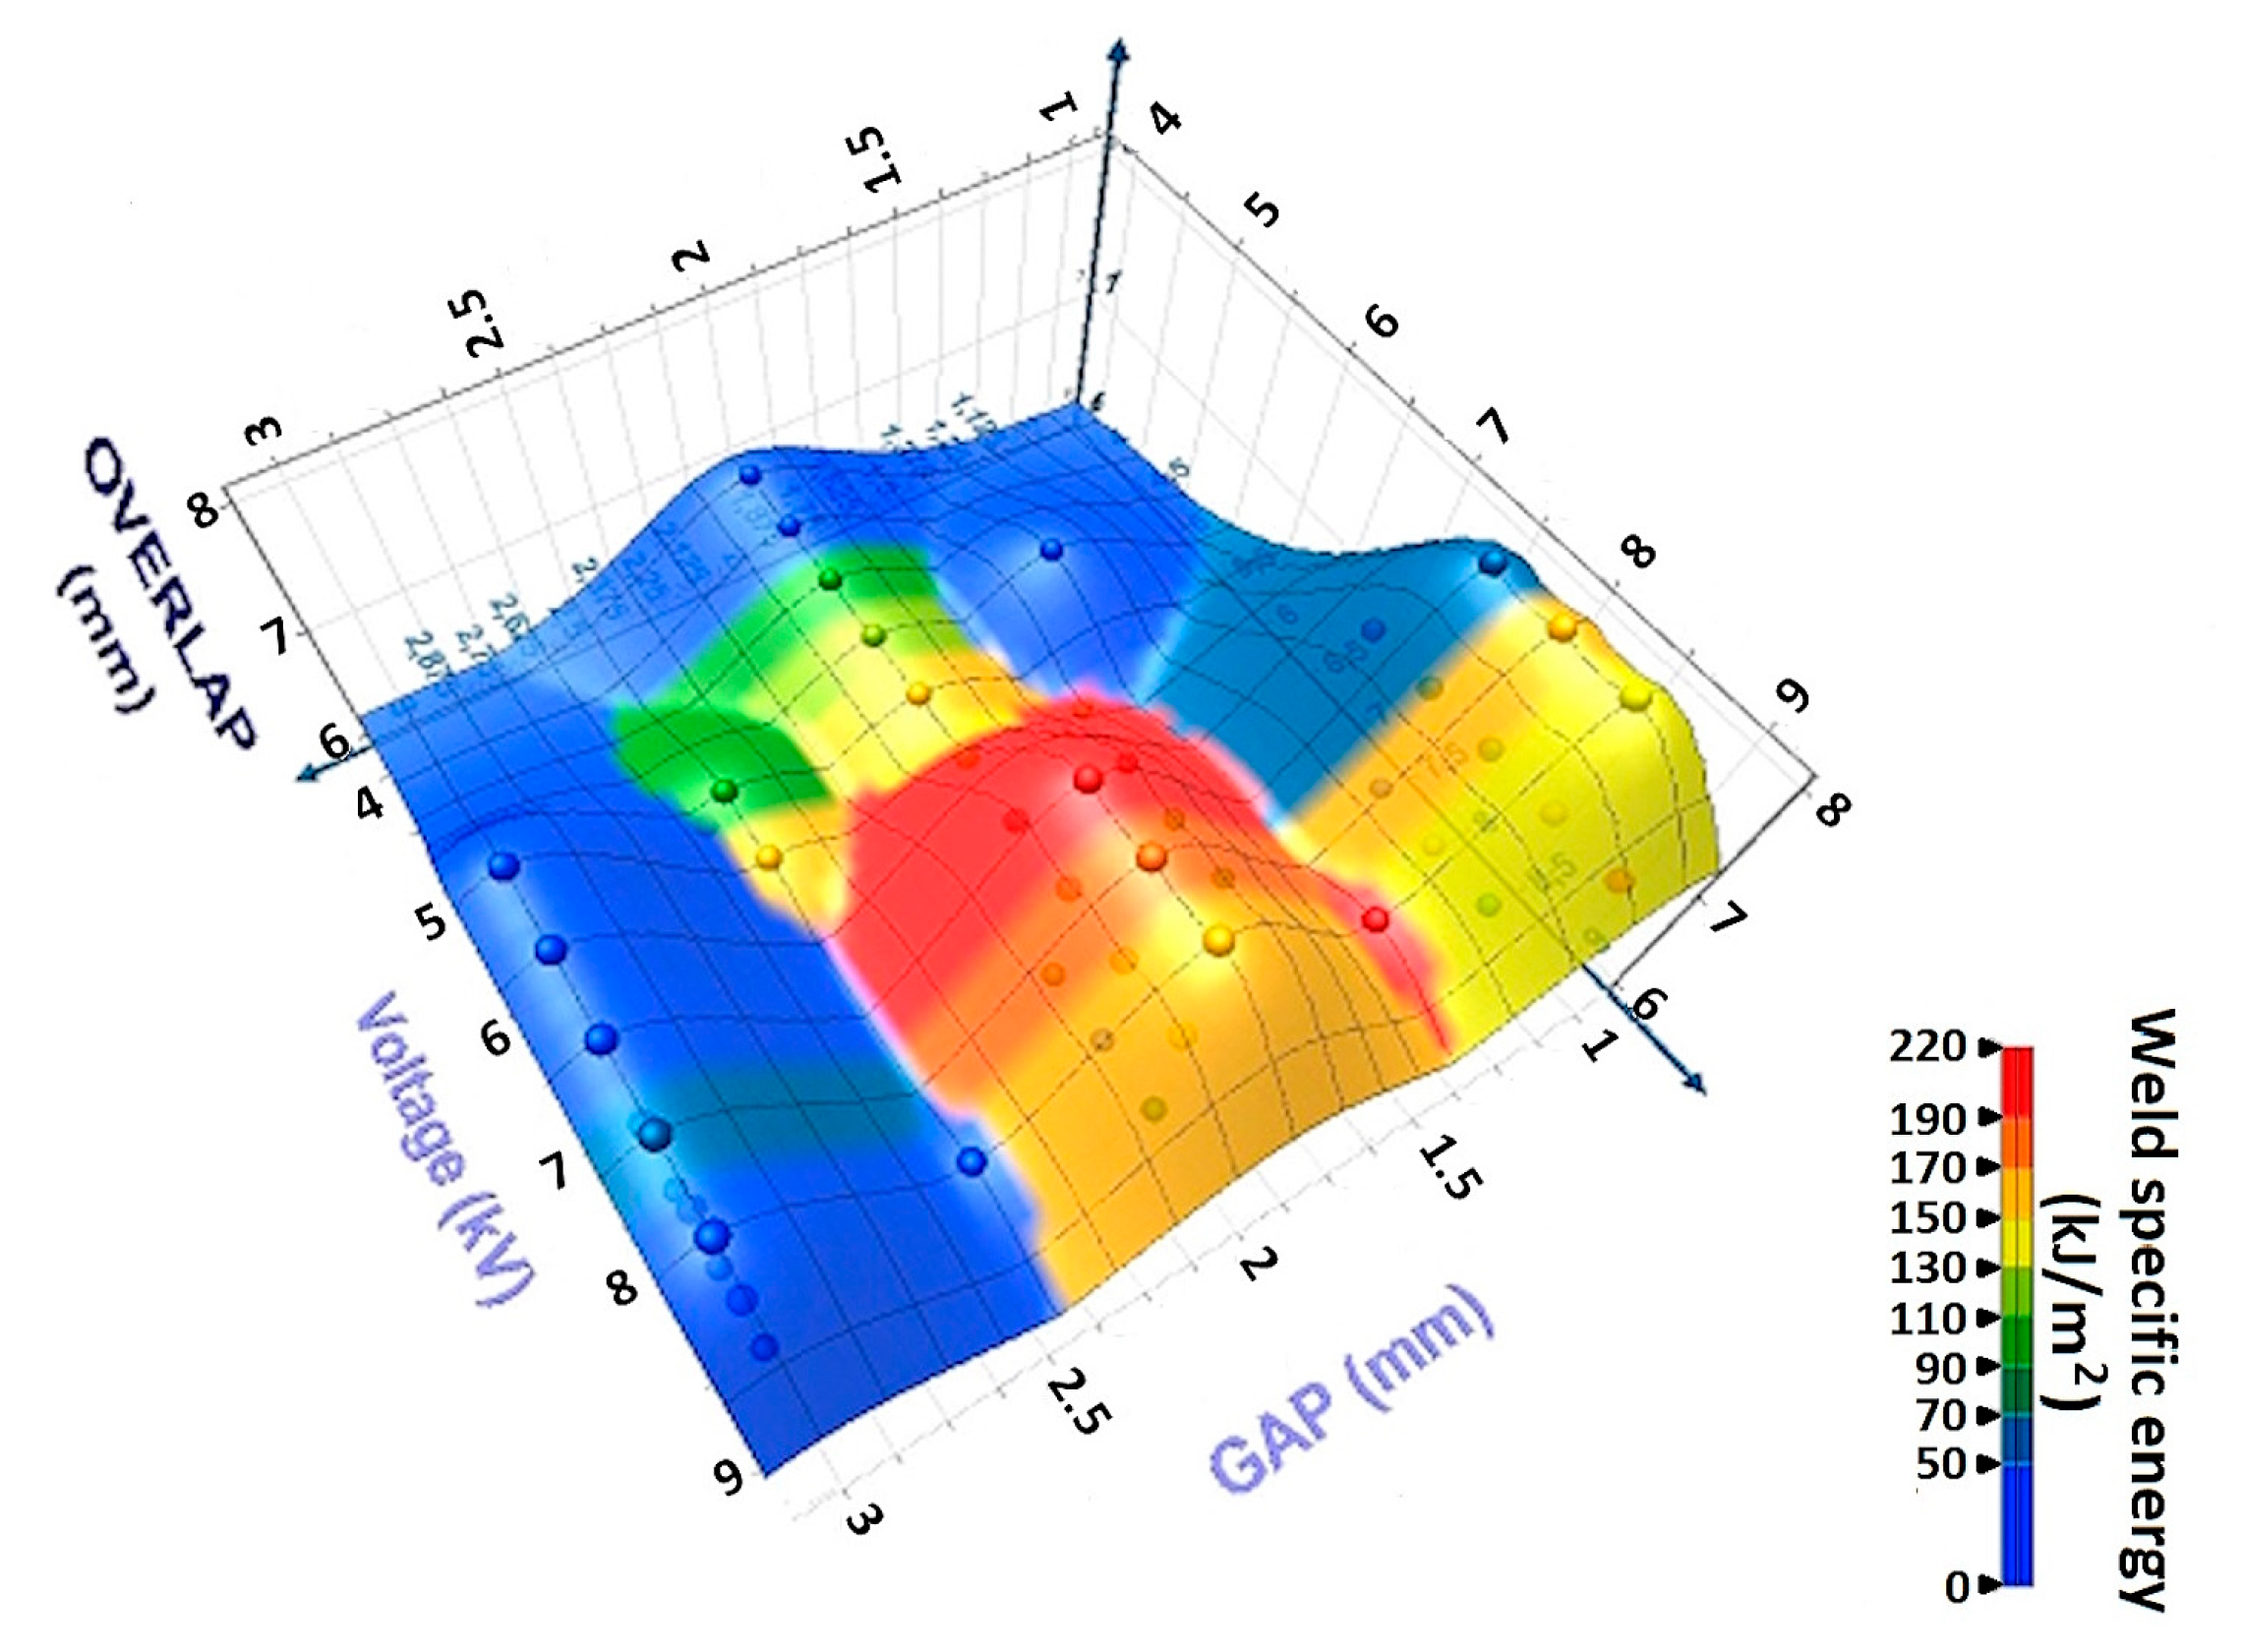
Figure 18) and the area occupied by the intermetallic compounds was measured by image analysis using ImageJ154-win-java8 software. It was clear that the specific energy of the welded part depended on the amount of intermetallic compounds created during the process. The higher the quantity of intermetallic compounds (IMCs) at the interface was, the lower the weld specific energy was (
Figure 19).
Intermetallic compounds can appear in two different ways. First, as a layer through the whole interface [
44] and, second, at the trough of a wave or the nucleus of a vortex [
45,
46] not exceeding the 5 μm thickness on the cross-section. Even though the interface zone may be a layer or pockets of IMCs, the distribution is usually not uniform [
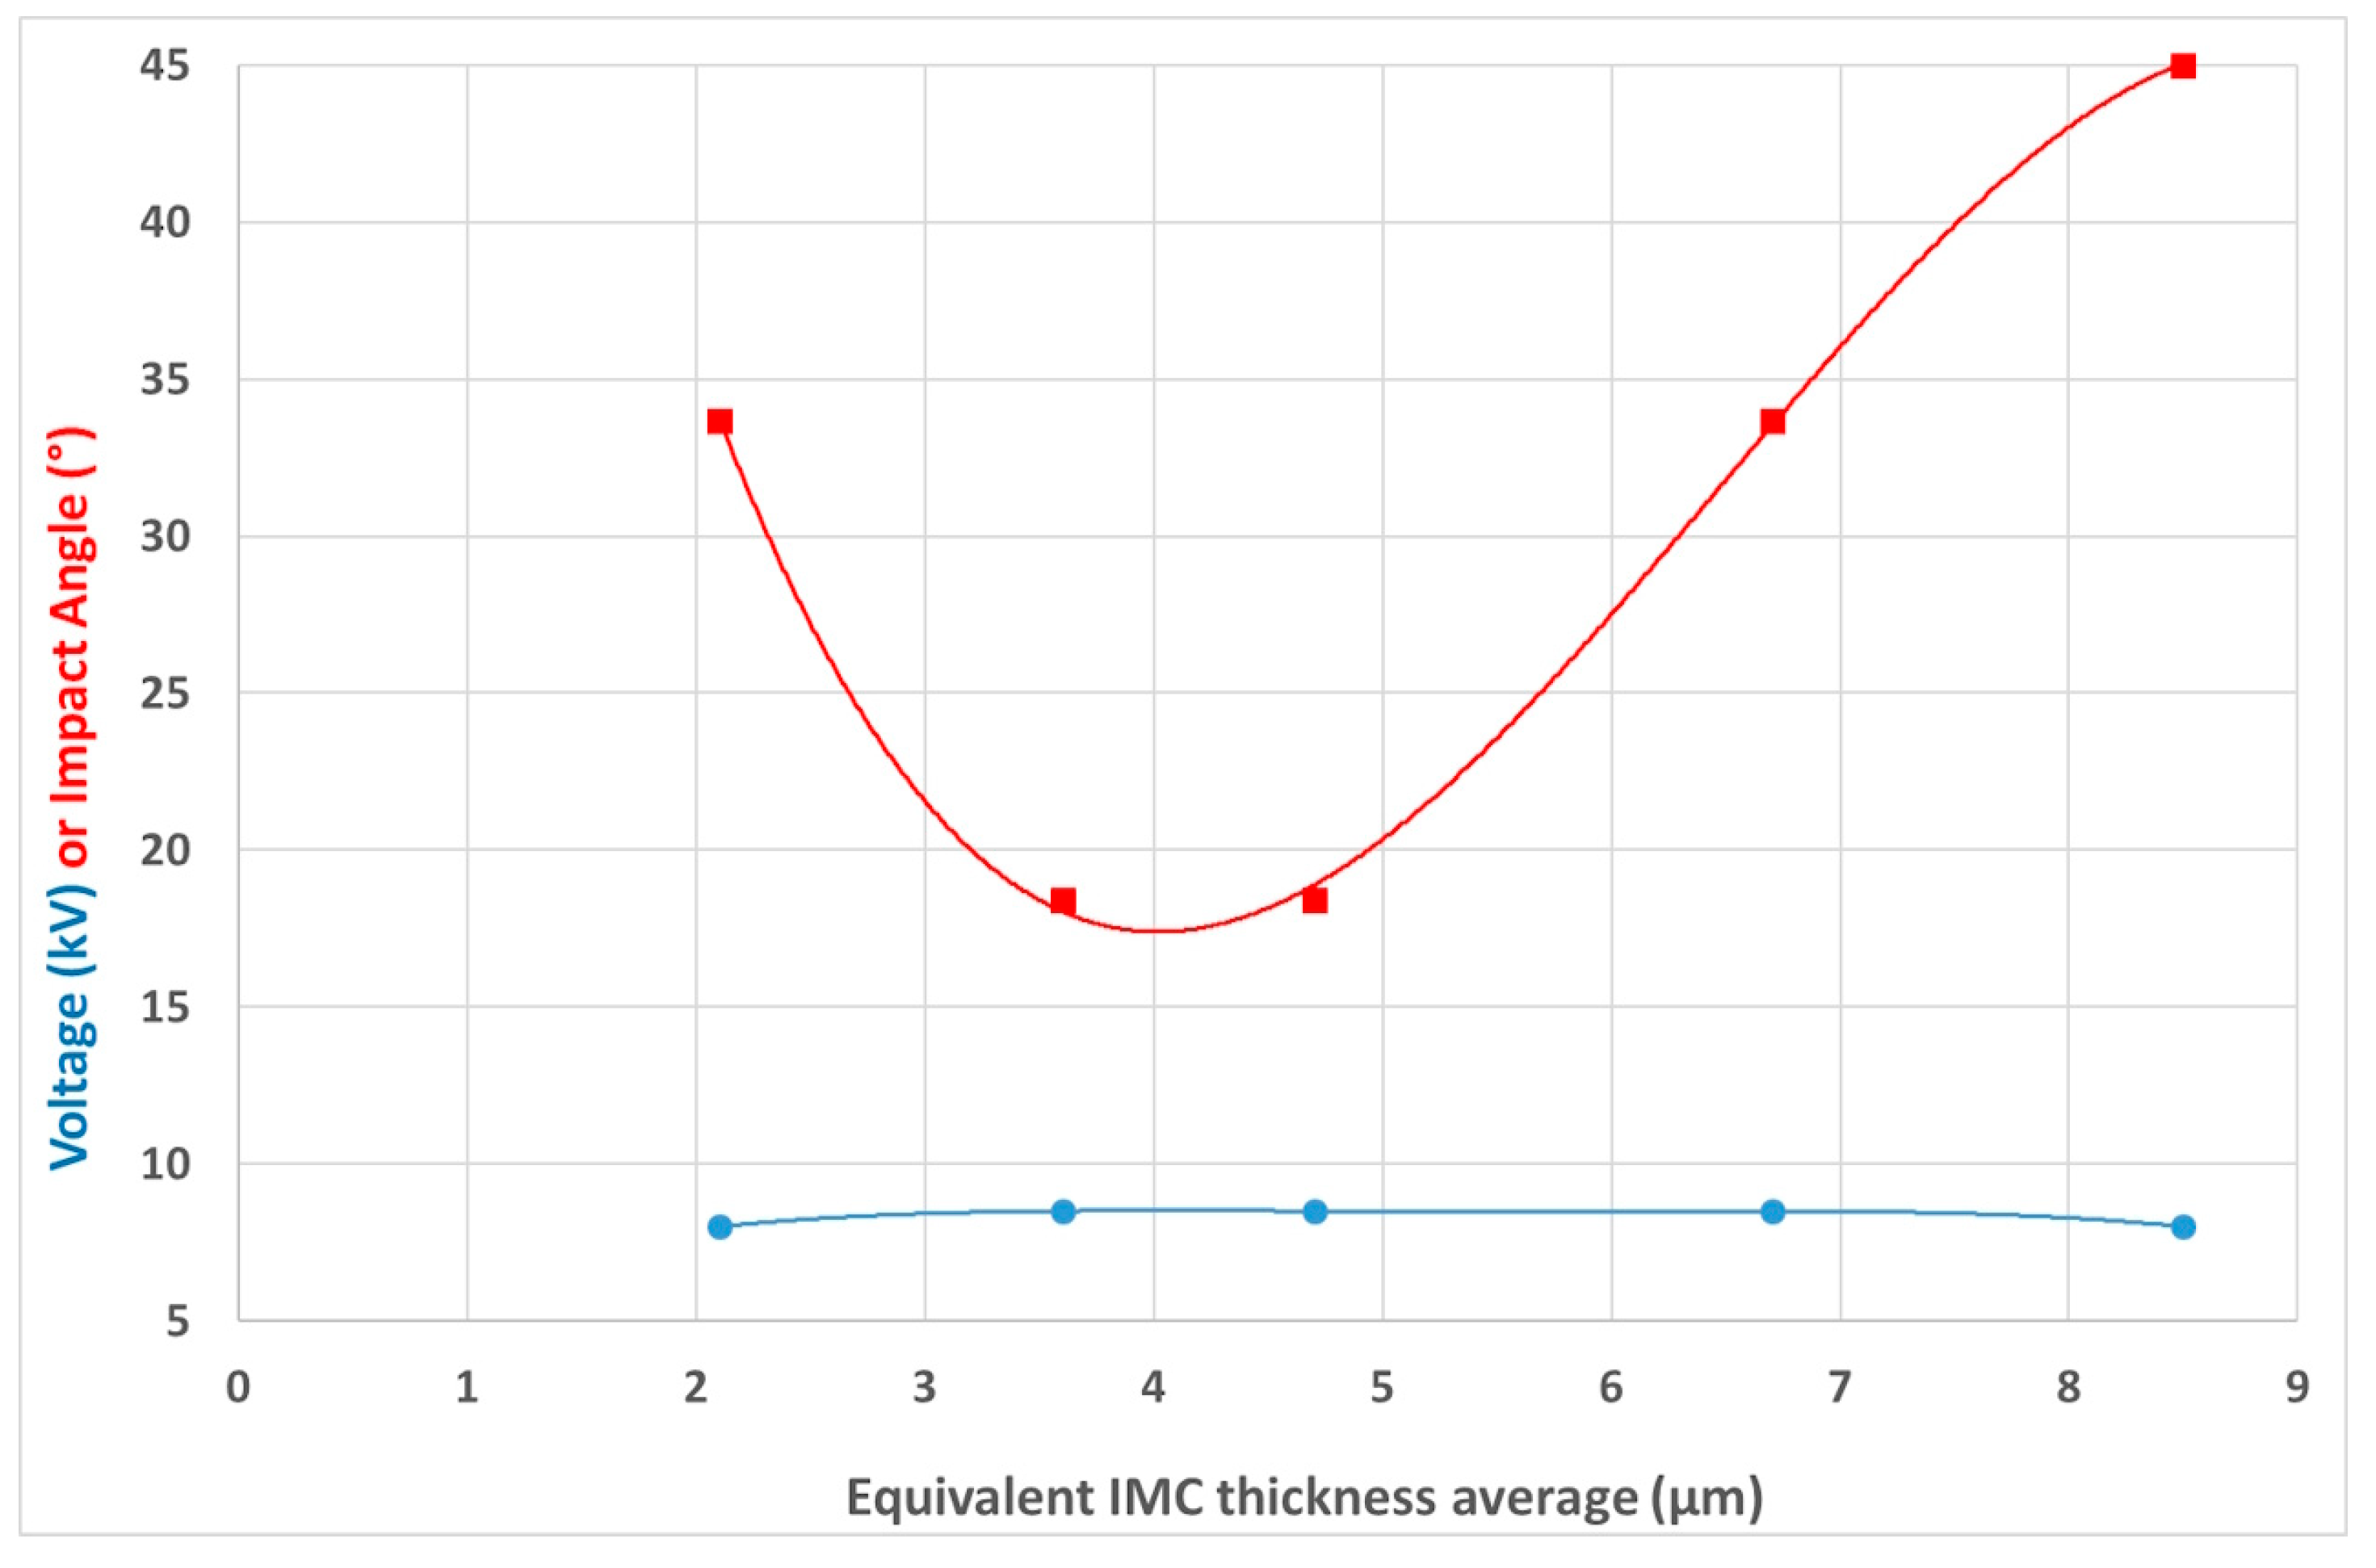
46]. From a performance point of view, continuous IMCs are undesirable, as they can represent a long, continuous brittle path. In contrast, the pocketed intermetallic phases are likely to give acceptable fracture performance. M. Marya et al. related the strength with the intermetallic equivalent layer thickness, with 4–6 μm being the optimum one [
47], in good agreement with results of
Figure 20. T. Lee et al. suggested that when IMC interfaces are separated by IMC-free interfaces, it can provide an effective barrier to the crack propagation and the overall strength of the weld may not be significantly affected by the IMC found elsewhere along the weld interface [
48]. Various authors identified IMC compounds as exhibiting either tongue-shaped Fe
2Al
5 morphology or needle-like FeAl
3 structures [
49,
50]. SEM-EDS analysis conducted in this study confirmed the presence of tongue-shaped Fe
2Al
5, which aligns with findings from previous research [
45,
46]. Among the intermetallic compounds, Fe
2Al
5 exhibited the most negative heat of formation at compositions corresponding to the liquidus temperature in the Al-Fe phase diagram.
The analysis revealed a highly significant and strong inverse relationship between weld specific energy and intermetallic compound thickness. The statistical model demonstrated exceptional predictive capability with 97% correlation and less than 1% risk of error (
Table 7), indicating also that IMC formation became more efficient at lower energy inputs (
Figure 21). This finding has important implications for optimizing magnetic pulse welding processes, suggesting that energy consumption can be reduced while maintaining or improving weld quality through better IMC formation.
The model provided a reliable foundation for process control and quality assurance in industrial magnetic pulse welding applications, though expanding the dataset would further strengthen these conclusions.
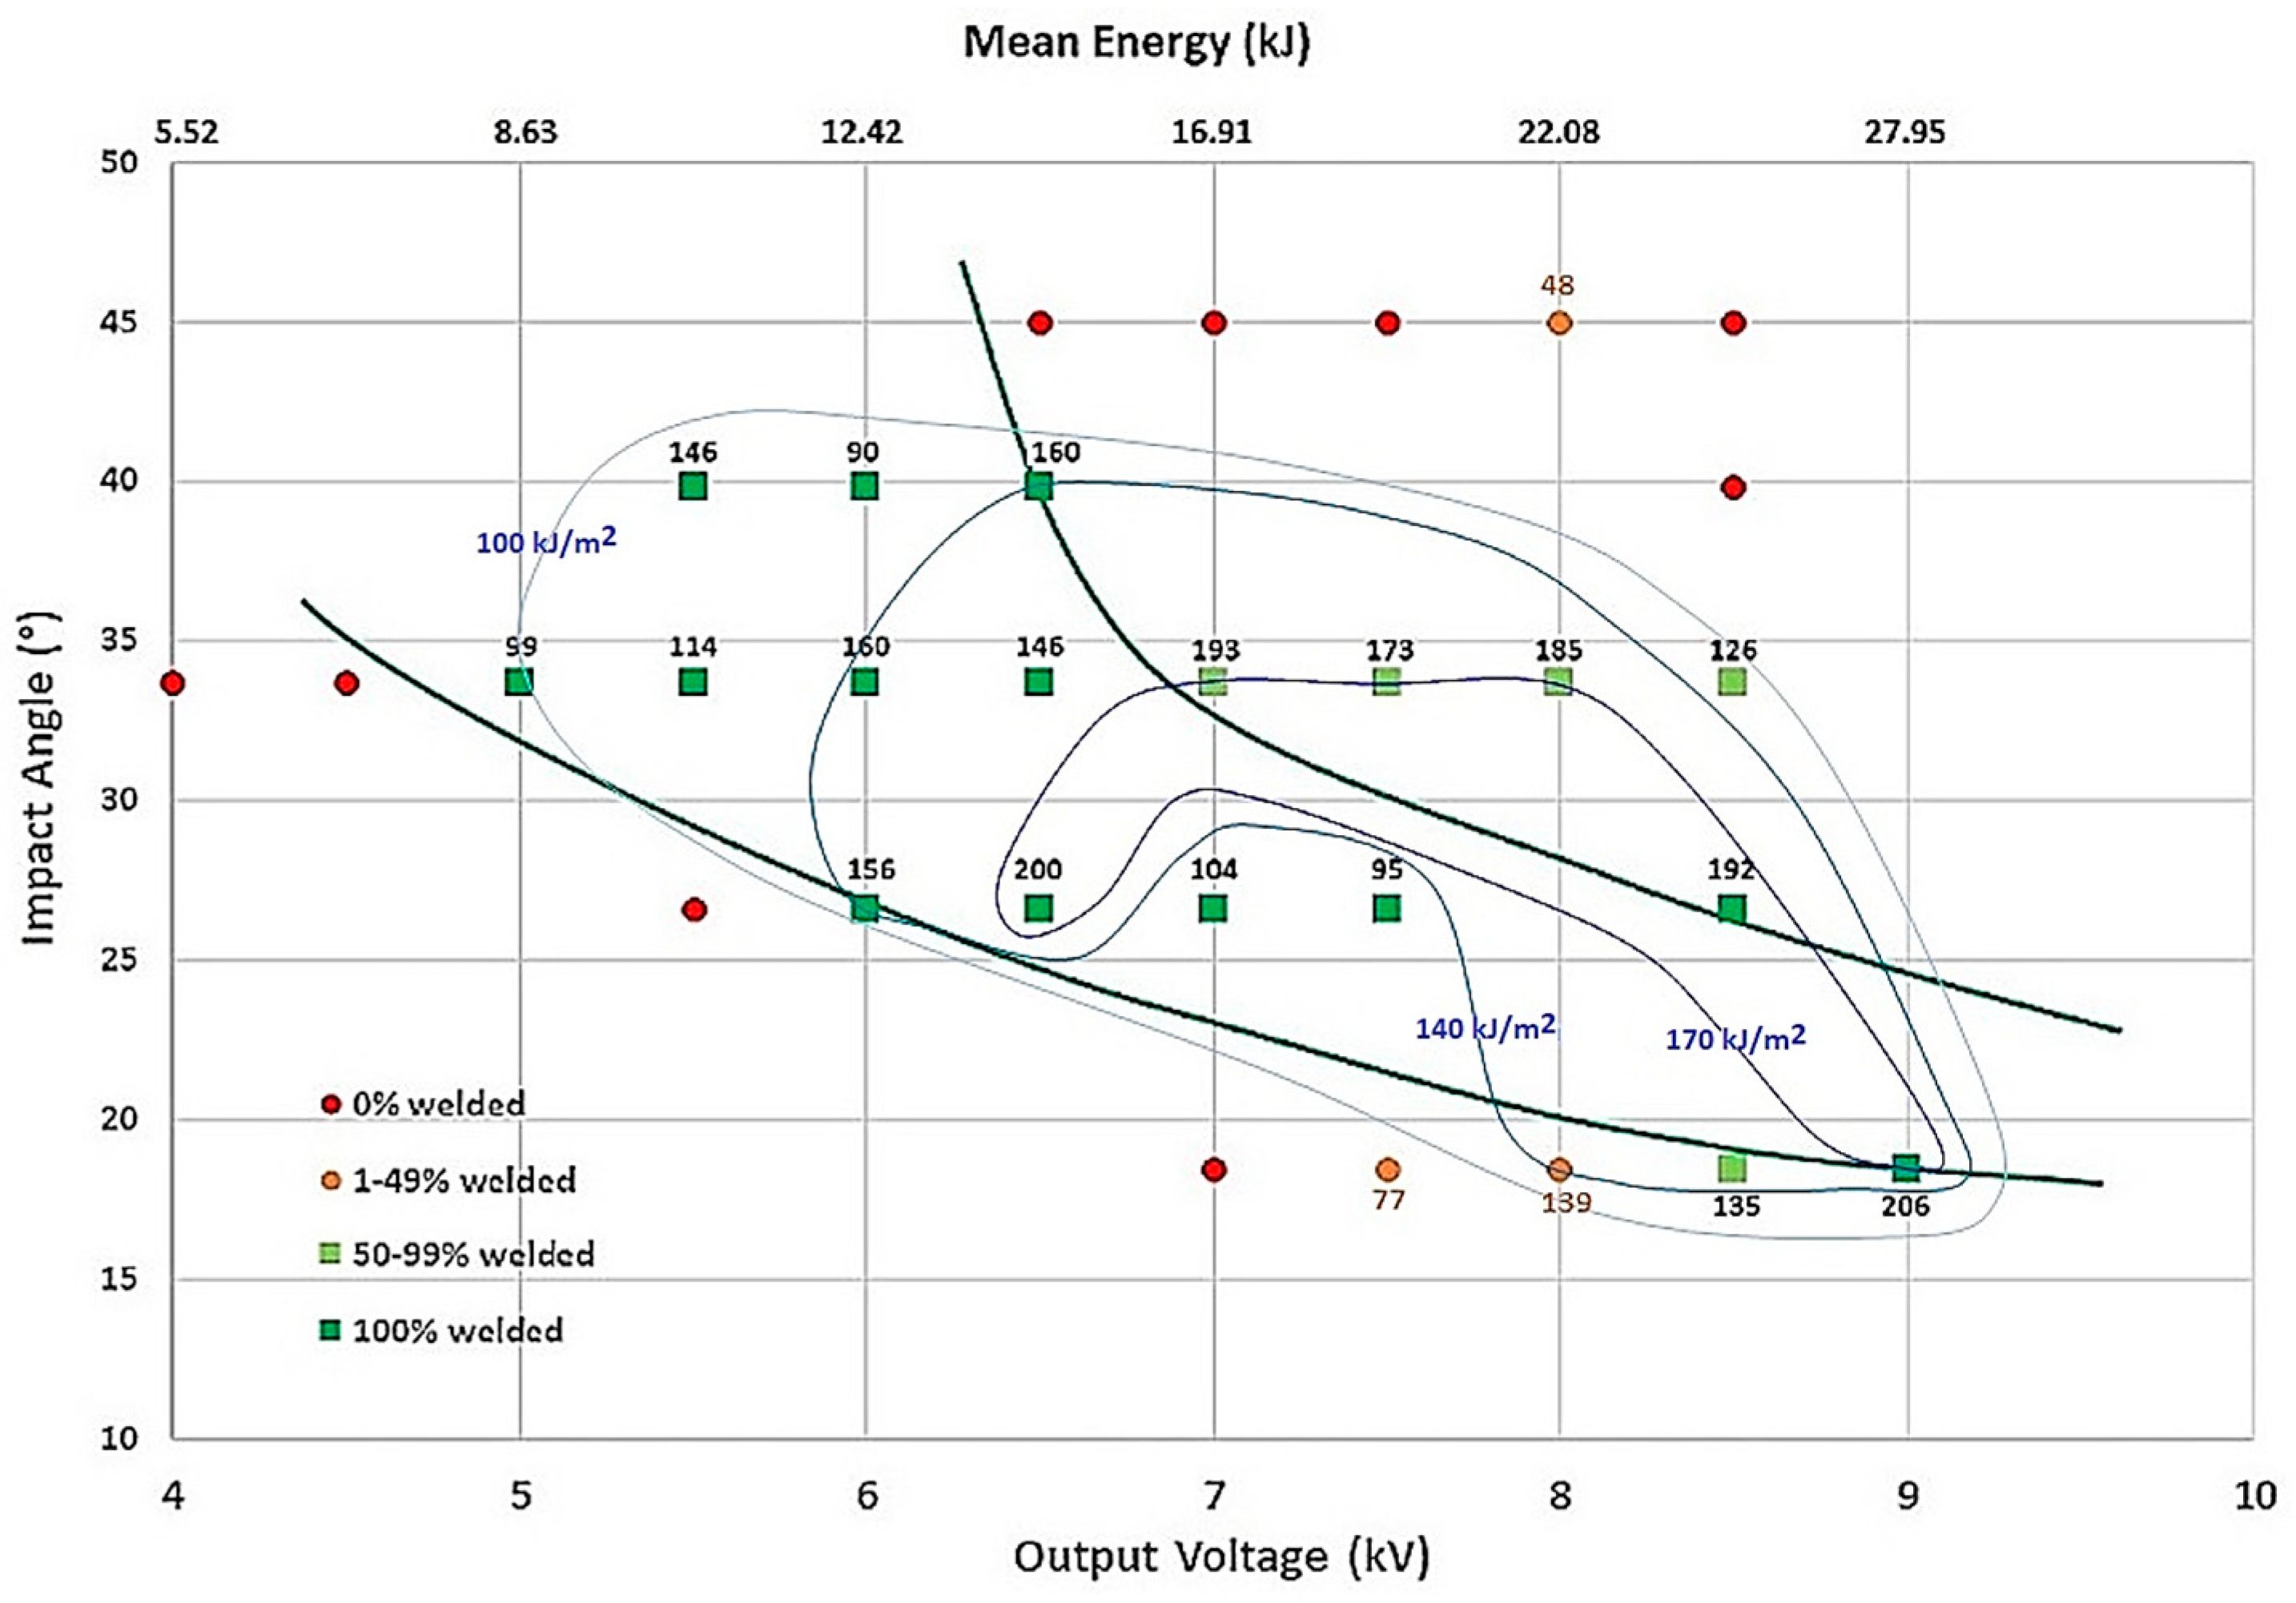
However, the dependence of the level of IMCs with the output energy as mentioned by different researchers (Psyk et al. [
21], Lee et al. [
23], Zhang et al. [
25]) was not so clear and seemed to be related also to the impact angle, as shown in
Figure 21.
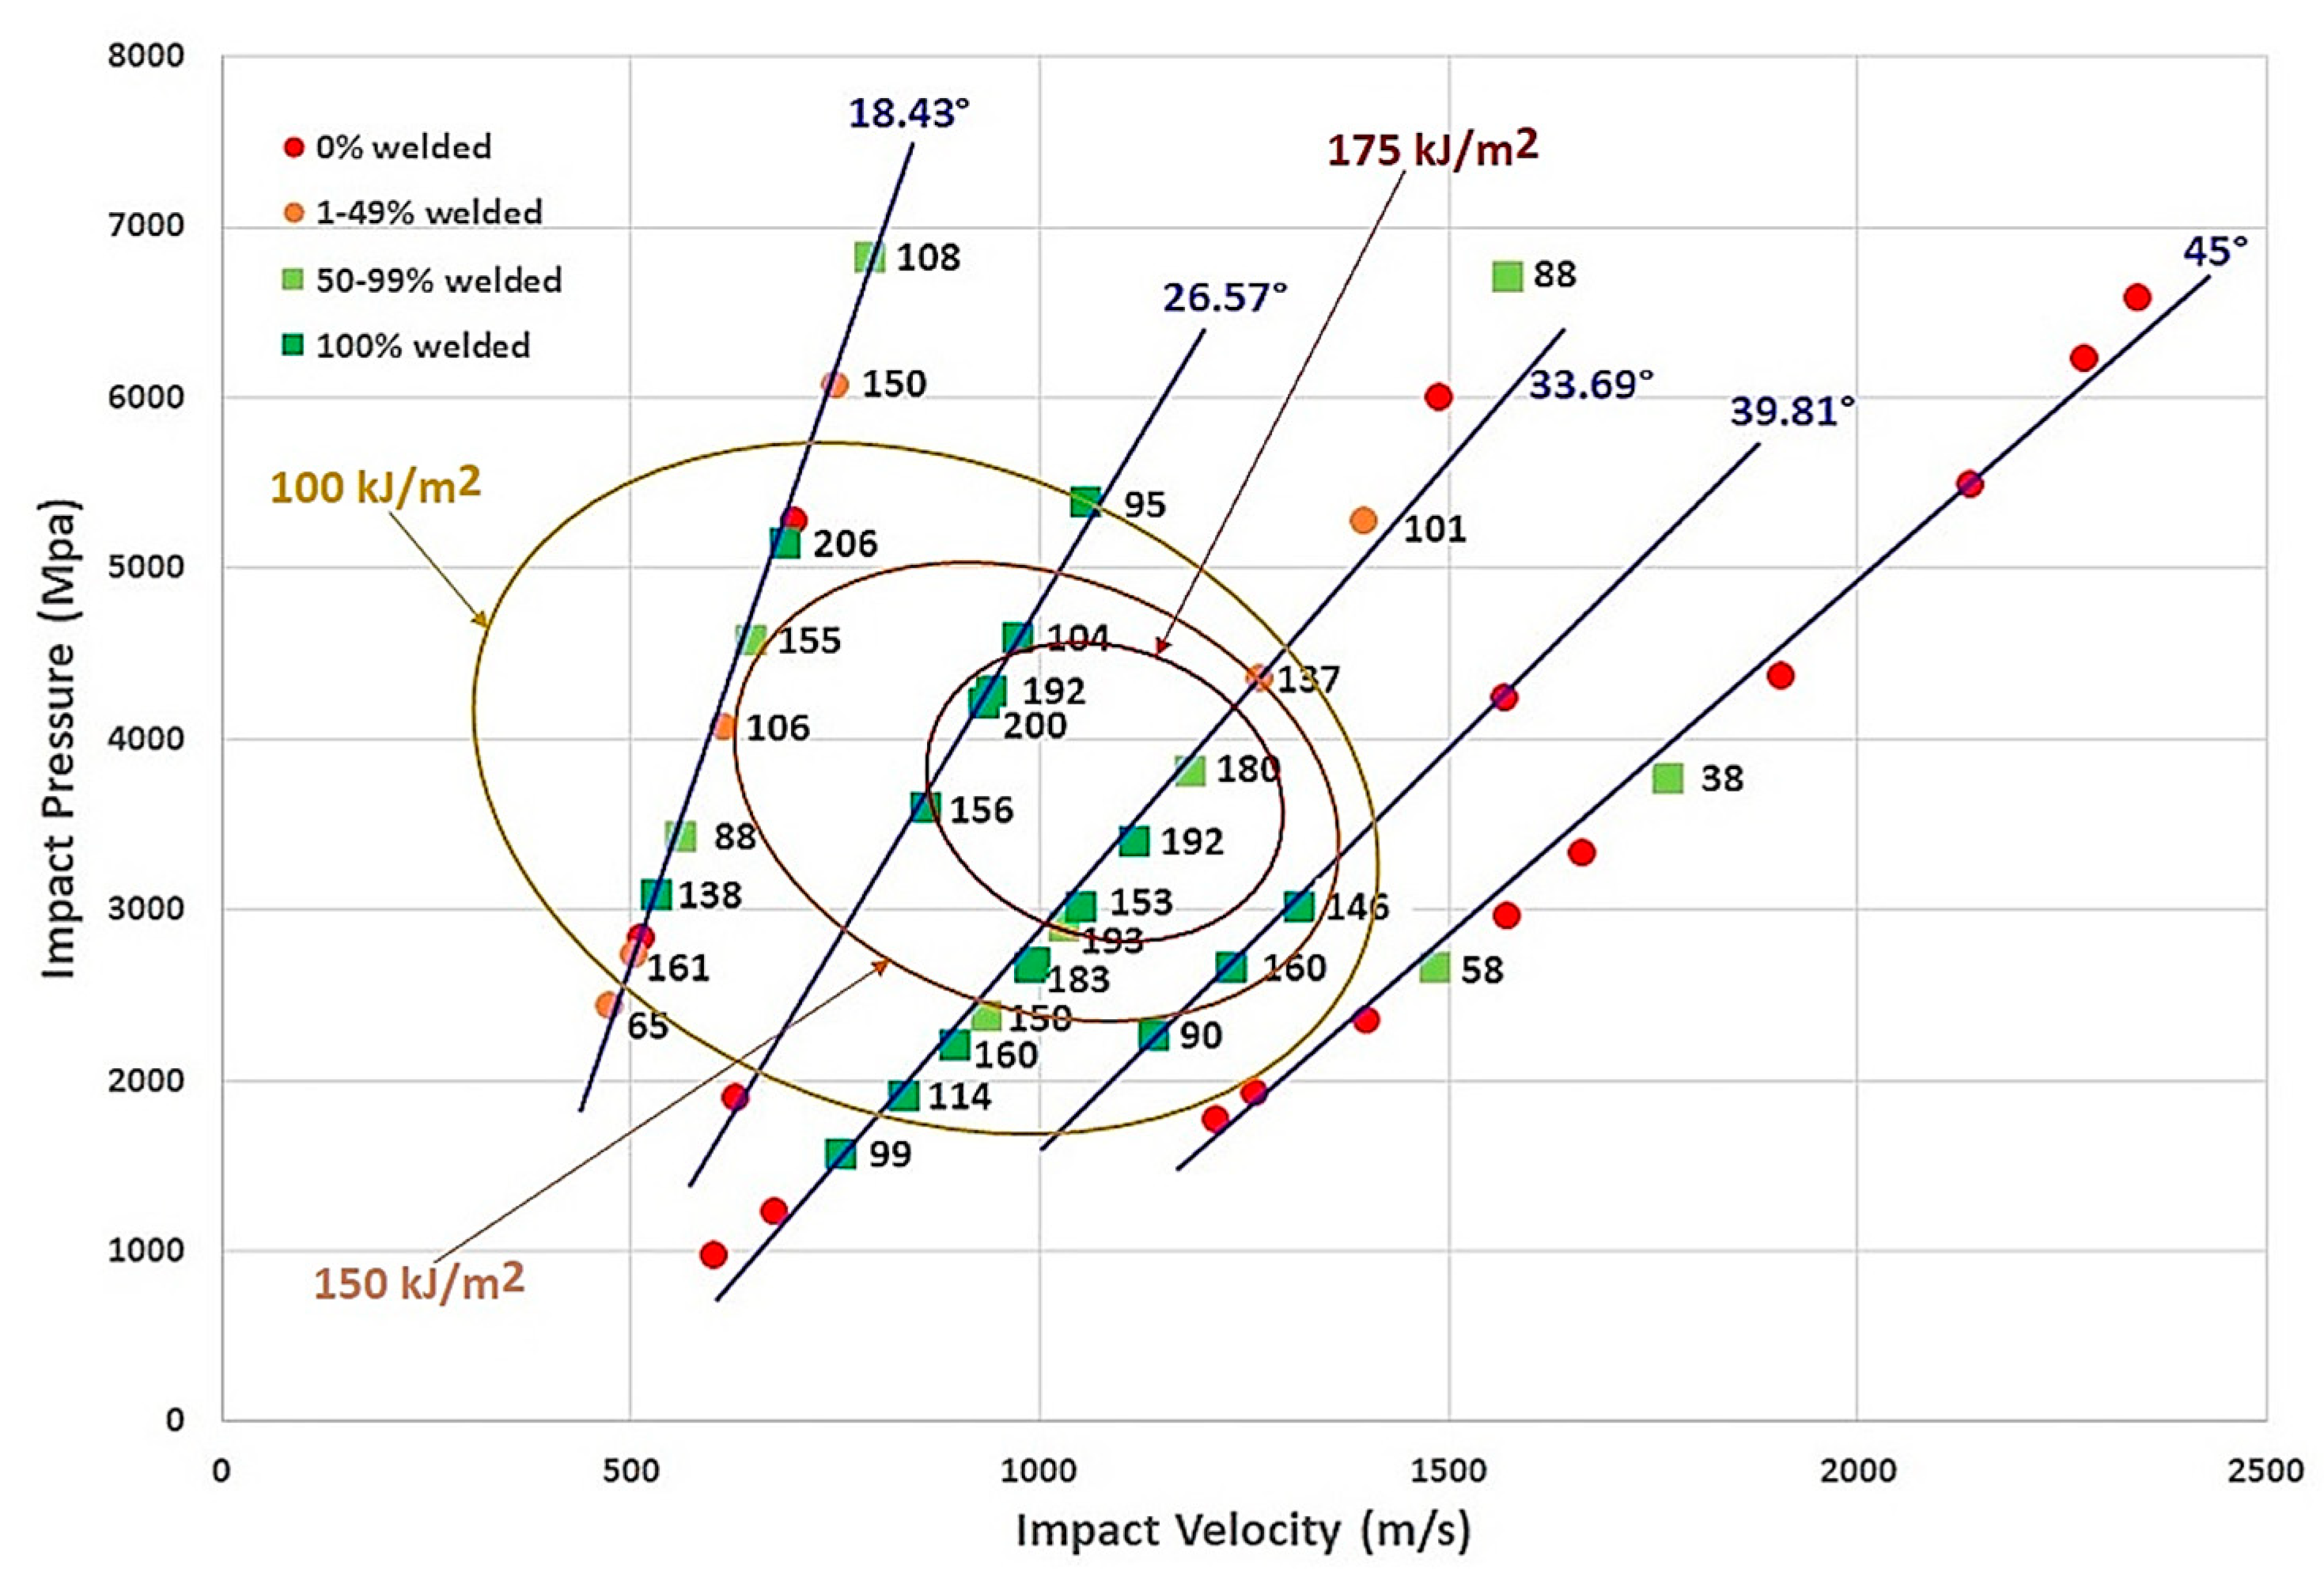
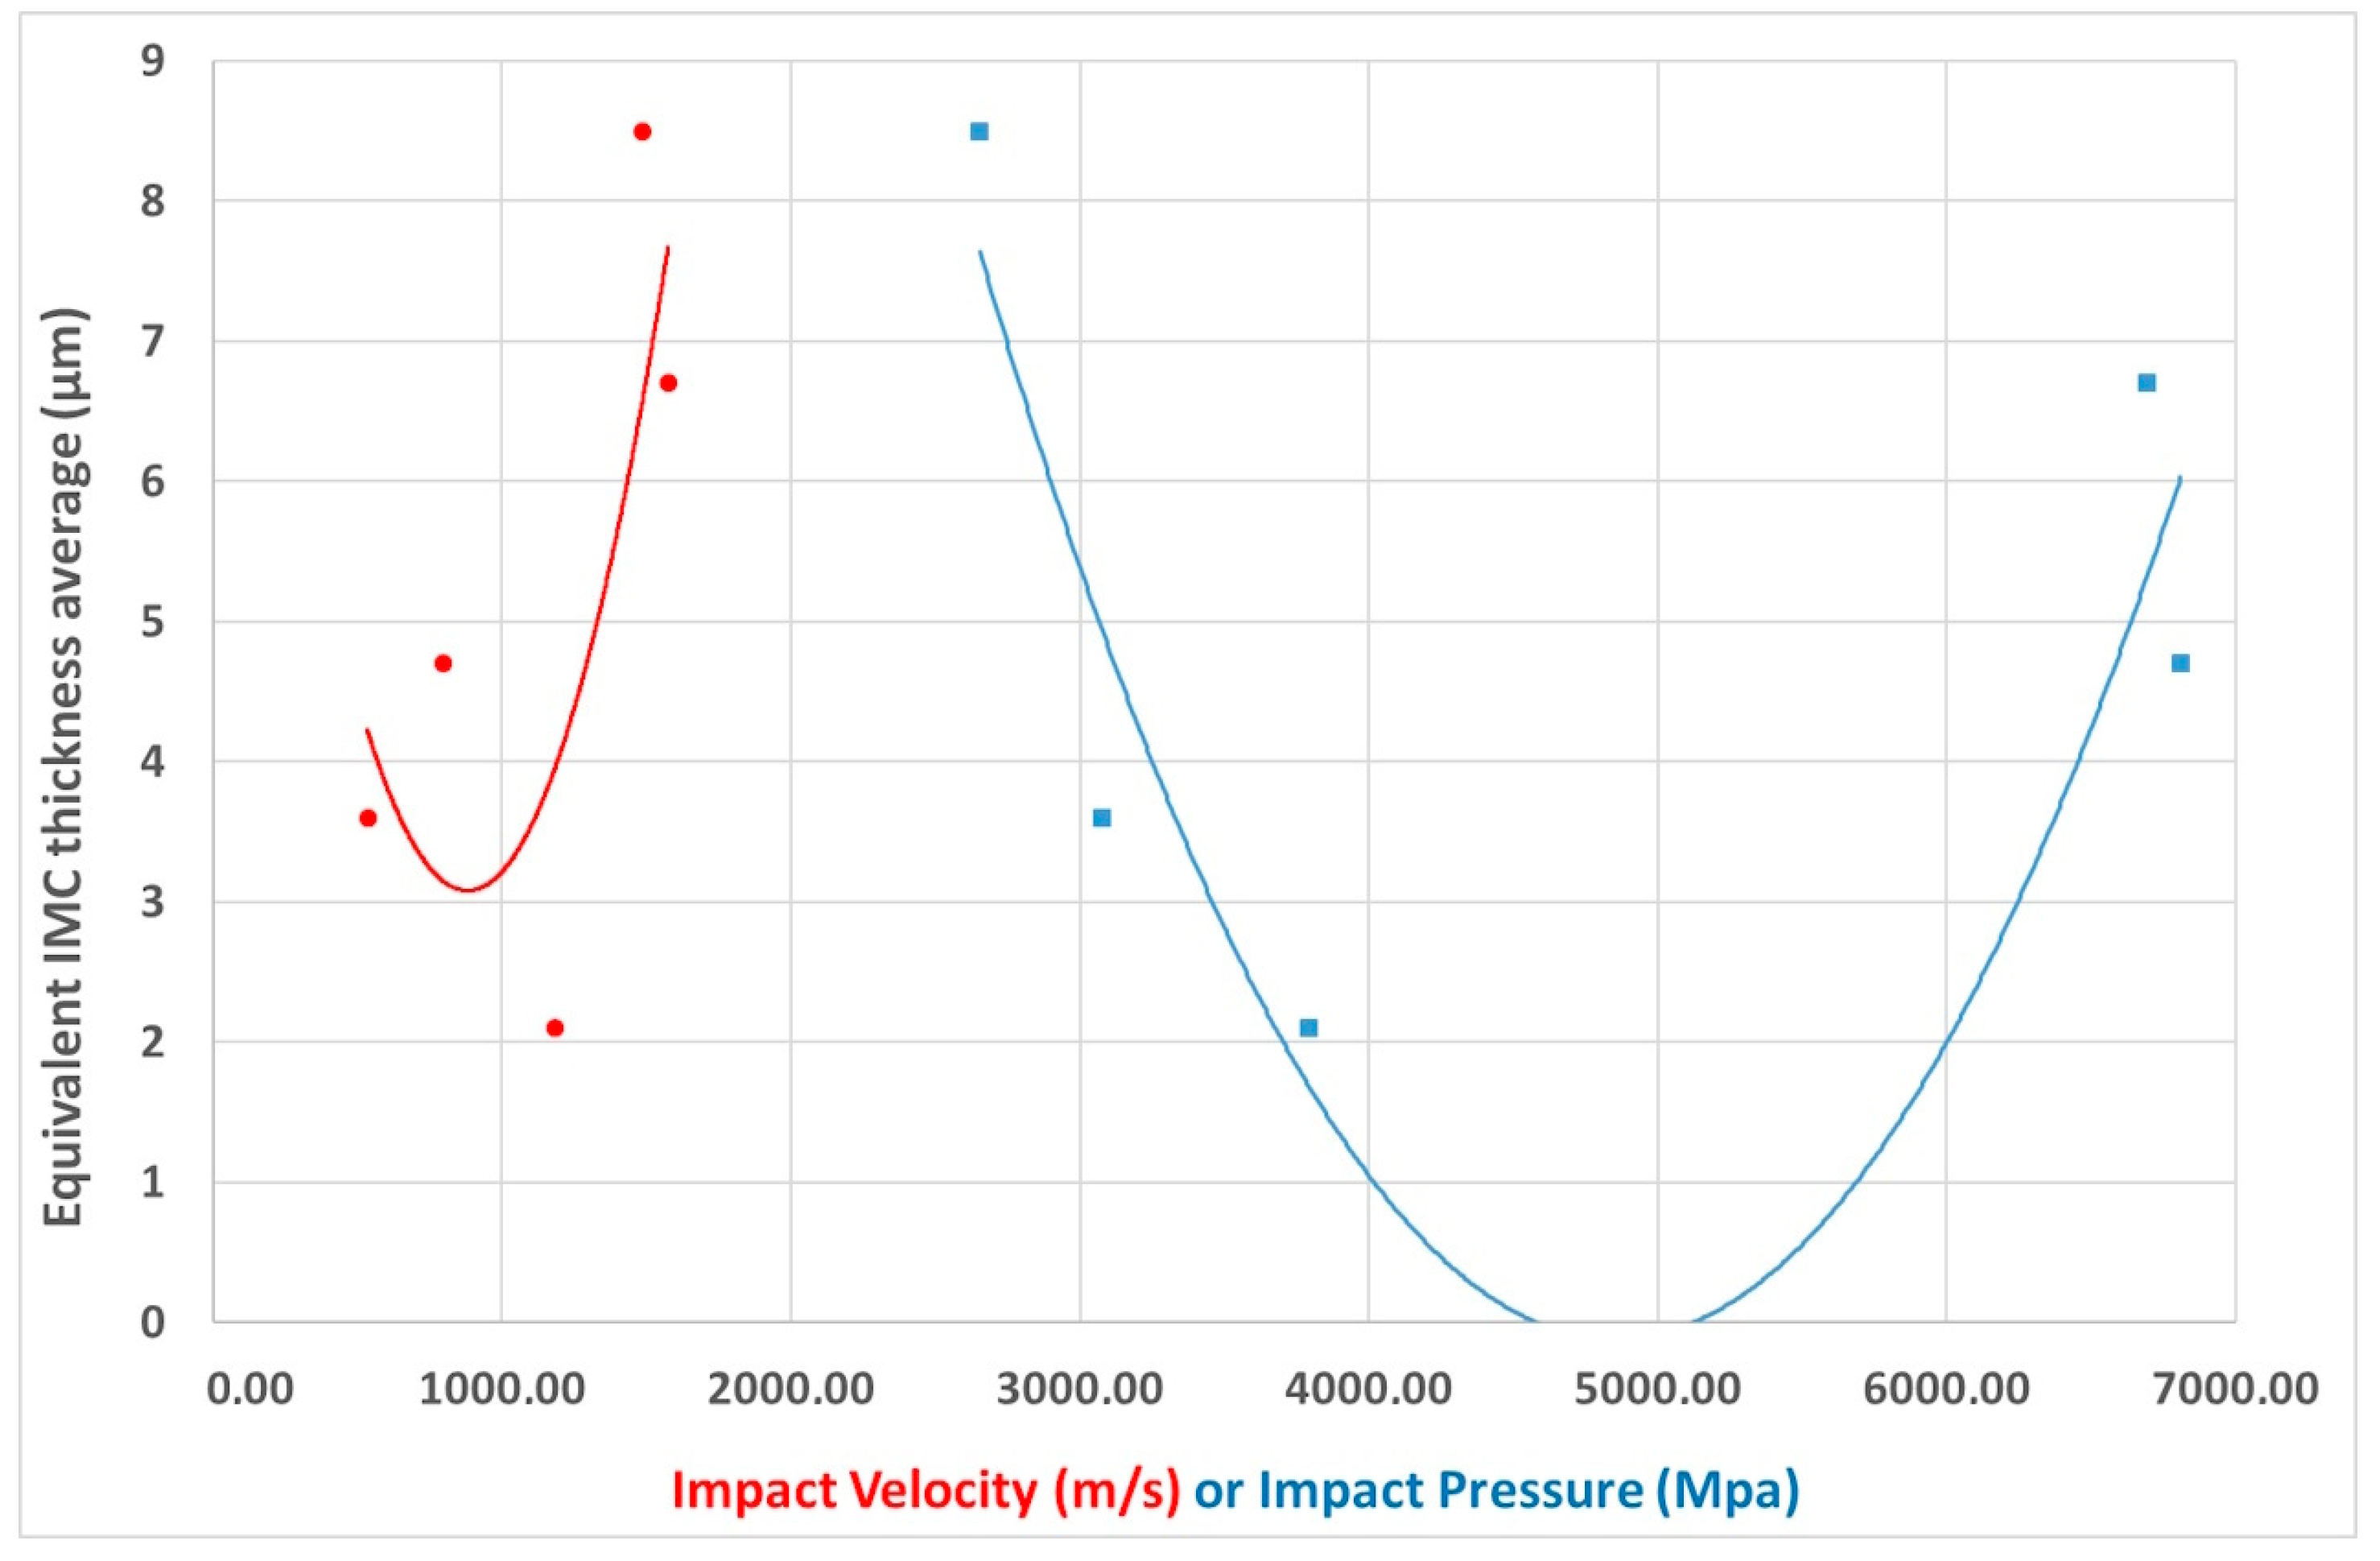
Concerning its dependence with the physical parameters of the process, it was pointed out that a minimum concentration of IMCs was obtained for an impact velocity in the range of 500 to 1200 m/s, associated to an impact pressure between 3000 and 4000 MPa (
Figure 22).
In the different micrographs of the welded zone (
Figure 18), a higher concentration of IMCs with a straight interface also appeared, as reported by Zhang et al. [
25].
The data suggest that higher impact pressures and velocities, along with optimal impact angles, result in thinner IMC layers, which are desirable for stronger welds. Higher output voltage and weld specific energy values also correlate with thinner IMC layers.


 ,
, 


