Abstract
The lattice parameters of both the product phase and the matrix phase have determined using in situ X-ray and neutron diffraction measurements during forward and reverse transformations in steels. The lattice parameters are well known to be influenced by various factors, including temperature, internal stresses induced by transformation strains, partitioning of alloying elements, crystal defects, and magnetic strains. Therefore, it is crucial to accurately disentangle the contributions of these factors to the observed changes in lattice parameters. This review examines the evaluation of internal strain (stress) associated with ferrite, pearlite, bainite, martensite, and reverse austenite transformations, with a particular emphasis on the distinction between diffusional and displacive transformations. Additionally, the effects of plastic deformation of austenite on the bainite or martensite transformation are discussed. In this context, the roles of dislocations and vacancies are highlighted as key areas for further investigation.
1. Introduction
Microstructural control is a key factor for achieving an optimal balance between strength and ductility in steel. In advanced steels, phase transformations play a critical role in tailoring the desired microstructure. Consequently, extensive research has been conducted to elucidate the mechanisms of phase transformations, including ferrite, pearlite, bainite, martensite, and reverse austenite transformation. Monitoring such transformations directly using experimental techniques such as optical microscopy (OM), scanning electron microscopy (SEM) with electron backscatter diffraction (EBSD), and X-ray diffraction (XRD) have been employed. However, these techniques primarily observe the surface or near-surface region of a steel sample, and hence, the interpretation of the results obtained is not easy. Because the sample surface is in a state of plane stress, it is important to note that the transformation behavior differs from that within the interior of the sample. In commercially available steels containing Mn and C, these alloying elements are readily depleted from the surface at elevated temperatures. Additionally, oxidation is a significant concern at high temperatures. As a result, they may not provide reliable insights into phase transformation mechanisms. For instance, the present authors investigated the change in phase volume fraction on heating up to 950 °C for a 1.5Mn-1.5Si-0.2C steel using various techniques [1]. The results demonstrated that the austenite volume fraction increased at significantly higher temperatures in SEM-EBSD and XRD analyses compared to neutron diffraction (ND) and dilatometry. Post-experimental elemental distribution analysis revealed that Mn and C concentrations were lower near the specimen surface, indicating that ND and dilatometry provided a more accurate representation of transformation behavior in a bulk specimen. The detailed descriptions are provided in Chapter 2. Neutron beams can penetrate deep into a specimen, offering bulk information that is essential for studying transformation mechanisms. With recent advancements in neutron beam intensity, even martensitic transformation in low-alloy steel during quenching can now be monitored [2]. Though synchrotron XRD offers superior time resolution, its applicability is restricted to a small specimen with fine grains, and the results obtained are sensitive to the specimen’s atmospheric conditions. As noted by Bhadeshia in 2024 [3], “It was reported in 2007 that time-resolved X-ray studies indicated that austenite develops two lattice parameters just before transforming into bainite [4], possibly due to austenite destabilization and subsequent partitioning into carbon-rich and carbon-depleted domains. Using greater resolution synchrotron X-rays, this has been shown to be untrue [5], independently verified using neutron diffraction [6]”. This underscores the importance of critically evaluating experimental results to ensure they are not influenced by artificial effects. Therefore, in situ ND measurements in diverse environments provide a more reliable approach. A similar misinterpretation has been reported regarding phase stresses (strains) induced by martensitic transformation as determined by in situ XRD, which is discussed in detail in Chapter 7. It should be noted that the lattice parameter of, for example, austenite, is affected by various influential factors, i.e., . Elastic lattice strains stem from “external stresses”, including environmental pressure and “internal stresses” caused by misfit (so-called “eigen”) strains like transformation strains. The change in during phase transformation can be monitored from the diffraction peak shift by in situ ND or XRD measurement. In this review paper, recent ND studies by the present authors are comparatively summarized, focusing on the changes in lattice parameters during various phase transformations in steels. It is emphasized that crystal defects affect the lattice parameters in martensitic (displacive) transformation. It is claimed that the deviatoric components of internal stress are more easily relaxed through dislocation motion and/or twinning, whereas the isotropic (hydrostatic) stress components are more difficult to decrease.
2. Reverse Austenite Transformation During Continuous Heating
The reverse transformation behavior of austenite in a 1.5Mn-1.5Si-0.2C (mass %) steel was in situ monitored using dilatometry (Fuji Dempa Co., Osaka, Japan), SEM-EBSD, XRD, and ND (JEOL Ltd., Tokyo, Japan) [1]. As a fundamental study for the development of TRIP-assisted multi-phase steel, this steel was prepared after discussion among researchers of NIMS and steel companies in Japan. In this experiment, two starting microstructures, ferrite-bainite-austenite (TR2) and ferrite-bainite-cementite (TR3), were prepared. Figure 1 presents examples of ND profiles obtained during heating with a heating speed of 3 °C/min up to 950 °C for these specimens, measured at Beamline 19 (Takumi, JAEA, Tokai, Japan), Life Science Experimental Facility of the Japan Proton Accelerator Research Complex (J-PARC MLF, Tokai, Japan).

Figure 1.
Examples of in situ ND obtained during heating at various temperatures for 1.5Mn-1.5Si-0.2C steel: (a) TR2 and (b) TR3. Reprinted from Ref. [1].
From these ND profiles, the austenite volume fraction was determined using the Z-Rietveld software Version 1.1.4 [7,8]. The results are presented in Figure 2, which also includes the data obtained by XRD, EBSD, and dilatometry. As seen, the austenite reversion kinetics shows excellent agreement between dilatometry and ND, whereas EBSD and XRD indicate that the austenite formation begins at a significantly higher temperature. Such discrepancy in transformation temperature was attributed to the change in chemical compositions near the surface of a specimen heated to elevated temperatures either in a vacuum (EBSD) or in a helium gas atmosphere (XRD). The chemical composition changes were measured using radiofrequency (rf) glow discharge optical emission spectroscopy (rf-GDOES: HORIBA GD-Profiler 2), Horiba, Ltd., Kyoto, Japan with serial removal of the surface layer. In Figure 3a, higher concentrations of O, C, Si, and Mn at the surface were caused by oxidation during specimen preparation and C contamination. As seen in Figure 3b, Mn and C concentrations are lowered in the region from the surface to approximately 3 μm in depth. The chemical compositions examined at the surface by EDS analysis have also revealed that C and Mn contents decreased after heating. Therefore, in addition to decarburizing, Mn atoms are likely to desorb from the surface under a high vacuum condition due to their relatively high equilibrium vapor pressure. The rf-GDOES measurement was also carried out for the XRD specimen, but the results obtained were complicated due to serious oxidation, which hindered the actual Mn and C concentrations in the steel matrix. Oxygen atoms were found to have diffused more than 10 μm into the specimen. Contrary to these measurements, ND is not influenced by such surface phenomena, even at elevated temperatures; the gauge volume of ND was adjusted to be 5 × 5 × 5 mm3 by slit and collimator where five plate-shaped specimens, each 1.2 mm thick, 4–6 mm wide and 30 mm long, were stacked together to form a cylindrical shape. In situ ND enables us to investigate the changes in lattice parameters of ferrite and austenite, indicating not only thermal expansion but also carbon concentration. It is found in Figure 4a that the austenite lattice parameter increases with increasing temperature due to thermal expansion. Around 400 °C, the deviation from the thermal expansion line is observed. It is speculated that carbon enrichment occurs with decreasing austenite volume fraction, as observed in Figure 2. The most likely mechanism of decomposition of the retained austenite predicted from the present results would be the increase in C concentration in austenite due to ferrite formation, followed by the precipitation of cementite accompanied by the decrease in both the austenite volume fraction and its C concentration. Since a slight deviation from the thermal expansion line of ferrite is observed in Figure 4b, i.e., a little bit shrinking, it is speculated that internal stress distribution develops as austenite decomposition progresses. The hydrostatic tensile stress generated in the austenite phase would enlarge its lattice parameter . The detailed decomposition mechanism on the retained austenite is still open for discussion, and the in situ ND data must be valuable to clarify the underlying mechanism. Another interesting result found in Figure 4 is related to the austenite reverse transformation behavior. The result of TR3 resembles that of TR2 at higher temperatures, although the decomposition stage was not found at lower temperatures. Hence, in both TR2 and TR3, the microstructure just before the onset of reverse transformation is believed to consist of ferrite and cementite. The nucleation of austenite grain must be at the ferrite/cementite interface, and therefore, the carbon concentration of austenite must be high with the dissolving of cementite particles. Hence, the austenite lattice parameter is found to deviate towards the higher side from the thermal expansion line, as observed in Figure 4a. With increasing the austenite volume fraction, the austenite lattice parameter approaches its thermal expansion line. On the other hand, the ferrite lattice parameter, deviates toward lower values from its thermal expansion line, suggesting the generation of hydrostatic compressive internal stress due to transformation strains. Therefore, the deviation in the austenite lattice parameters must include the influence of hydrostatic tensile stresses, which are balanced with those in the ferrite phase.
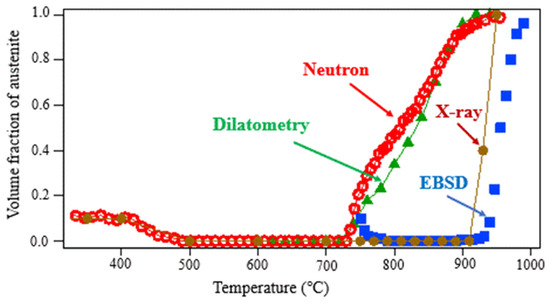
Figure 2.
Changes in the austenite volume fraction upon heating for TR2, determined by various methods (1.5Mn-1.5Si-0.2C steel). Reprinted from Ref. [1].
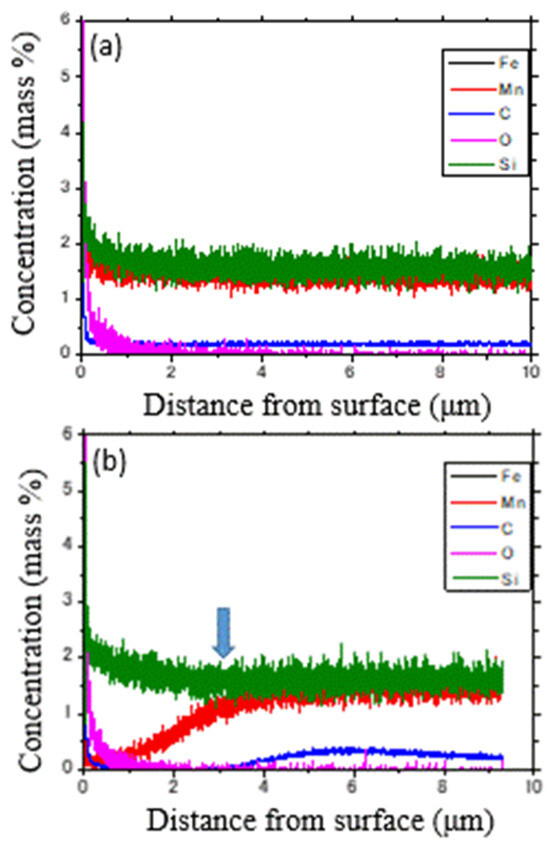
Figure 3.
Chemical compositions as a function of the depth from surface obtained by rf glow discharge optical emission spectroscopy for the EBSD specimens: (a) specimen not heated and (b) the specimen after in situ EBSD measurement (1.5Mn-1.5Si-0.2C steel). Reprinted from Ref. [1].
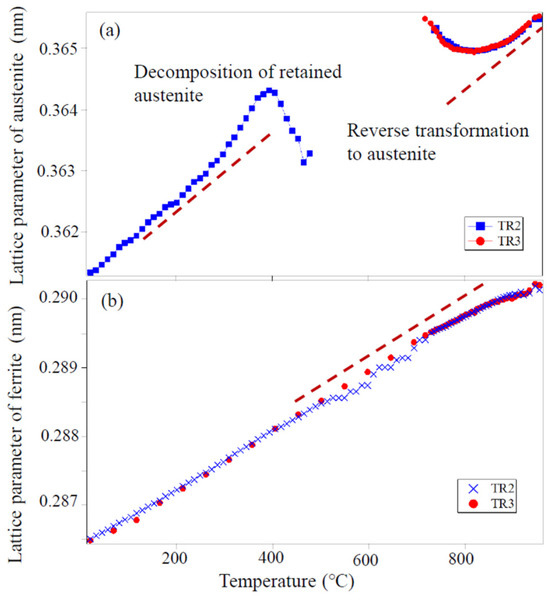
Figure 4.
Changes in the austenite and ferrite lattice parameters determined by neutron diffraction with heating for TR2 and TR3 (1.5Mn-1.5Si-0.2C steel) (a) austenite and (b) ferrite. Reproduced with permission from reference [1].
NiCrMo steel is widely used in various fields as a high-strength material for large forgings, in which grain size control has been a problematic issue [9,10]. The microstructure evolution during the reverse transformation of a CrNiMo steel consisting of tempered lath martensite and Cr carbide was also examined using in situ ND at high temperatures [9]. The microstructural change from a reversed coarse-grained austenite (so-called “austenite memory”) to a fine-grained polygonal structure by further annealing was monitored through a decrease in the diffraction intensity caused by primary extinction as well as in the full width at half maximum (FWHM). This result is different from that for bainite steel, showing good coincidence with the observations using EBSD (TSL Solutions Co., Sagamihara, Japan) [10]. In conclusion, austenite memory can be monitored through in situ ND, which provides bulk verification of the results of surface observations by SEM/EBSD.
3. Ferrite and Pearlite Transformations During Continuous Cooling
Using the same 1.5Mn-1.5Si-0.2C steel mentioned in Chapter 2, the phase transformation behavior from austenite upon cooling was in situ monitored using dilatometry and ND [11]. The specimens were cooled from 950 °C in a vacuum with a cooling rate of −0.05 °C/s. The dilatometry result is presented in Figure 5, in which the starting temperature of ferrite transformation, Ar3, was 838 °C, showing a good agreement with that determined by ND. Although in situ XRD measurement was also carried out, Ar3 was much higher because of the change in chemical composition near the surface of a specimen, as explained in Chapter 2. Figure 6 shows the change in austenite volume fraction during cooling, which was determined from ND profiles obtained every 1 min. The changes in lattice parameters of ferrite and austenite were plotted in Figure 7. As mentioned above, the austenite lattice parameter depends on temperature (T), carbon concentration (C (mass%)), and elastic internal strain (), i.e., in this case. Similarly, the ferrite lattice parameter is hereafter described as , although the carbon concentration is very small. Its thermal expansion and contraction behavior can be satisfactorily fitted by a linear function. For the austenite region between 840 and 940 °C, it was expressed by the following:
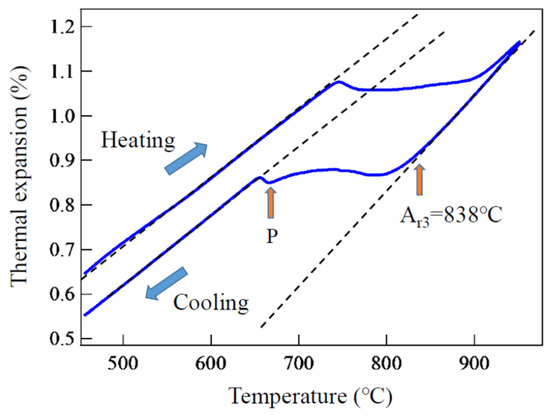
Figure 5.
Transformation behavior upon cooling observed by dilatometry for 1.5Mn-1.5Si-0.2C steel. Perlite transformation started at point P. Reprinted from Ref. [11].
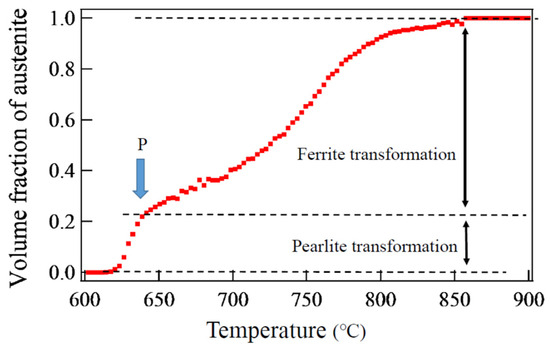
Figure 6.
Change in austenite volume fraction during cooling determined by in situ neutron diffraction measurement for a 1.5Mn-1.5Si-0.2C steel. Pearlite transformation started at point P. Reprinted from Ref. [11].
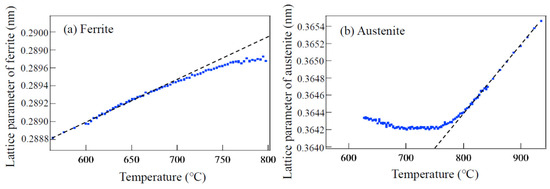
Figure 7.
Changes in lattice parameters of austenite (a) and ferrite (b) upon cooling for a 1.5Mn-1.5Si-0.2C steel determined by in situ neutron diffraction measurement. Reprinted from Ref. [11].
In the case of a ferrite region from 550 to 610 °C, it was expressed by the following:
Thermal expansion coefficient for austenite was calculated using the austenite lattice parameter of 0.3646 nm at 820 °C. For ferrite , the ferrite lattice parameter of 0.2889 nm at 575 °C was used. The obtained results were as follows:
These values show good agreement with those determined by dilatometry, as presented in Figure 5. The obtained value is also close to those reported by Onink et al. [12] and Bhadeshia et al. [13]. According to the neutron diffraction results by Onink et al. for Fe-C binary alloys, the value of decreases slightly with increasing carbon content, from 0.01 to 0.8 mass%, dropping from to . In Figure 7, the deviation from the thermal expansion line is attributed to ① elastic strains caused by transformation strains, ② those by thermal misfit strains, and ③ carbon enrichment in austenite. These influential factors were analysed in detail in [11]. The contribution of internal stresses in ferrite and austenite was predicted using the Eshelby inclusion theory [14] coupled with Mori-Tanaka’s mean-field concept [15]. The phase stress in austenite can be calculated [16] by the following:
Here, , , , , , and refer to phase stress in austenite, the volume fraction of ferrite, elastic moduli (the differences between austenite and ferrite were neglected here), the Eshelby tensor, unit tensor, and eigenstrain, respectively. Through numerical consideration (the details, see [11]), the internal stress/strain condition is hydrostatic in this case and is expressed by strain parameter . Paying attention to the austenite phase, tensile hydrostatic strain increases at the beginning of ferrite transformation caused by transformation strain and thermal misfit strain. As increases, the influence of carbon enrichment ③ is expected to become larger, superimposing the influence of ① and ②. In conclusion, the lattice parameter of austenite can be expressed by the following:
Elastic strain in ferrite can be obtained from the following stress equilibrium condition:
It is always important to check that the sum of phase stresses is balanced (to be zero).
4. Pearlite Transformation During Isothermal Holding
The change in austenite lattice parameter during isothermal holding for pearlite transformation was measured using in situ ND at ISIS and J-PARC MLF by the present authors. Because the current understanding of this issue was confusing, not only binary alloys but alloyed (engineering) steels were employed to compare their results. That is, Fe-0.80C, Fe-0.80C-1.5Mn, Fe-0.83C-0.84Mn-0.18Si, and Fe-0.79C-1.98Mn-1.51Si-1.06Al-0.98Cr-0.24Mo-1.58Co alloys were examined. The last steel is so-called nano- or super-bainitic steel. However, reliable conclusions have not been obtained yet. The lattice parameter is affected by alloying elements like Mn and C and internal stresses, where C activity must be taken into consideration for discussion. Besides, stress partitioning among austenite, ferrite, and cementite must be determined, which requires highly precise measurement. In situ EBSD observation was also challenged by some of the present authors; however, the chemical compositions of the surface layer of a sample varied upon heating. Therefore, the aimed transformation behavior could not be obtained by such a surface observation. Hence, the isothermal pearlite transformation is a challenging topic for future work.
5. Bainite Transformation During Isothermal Holding
Bainite transformation during isothermal holding at various temperatures from 500 to 350 °C in a 0.4 C-1.07Cr-0.80Mn low alloyed steel was studied via in situ ND at J-PARC MLF [17]. ND profiles obtained by a time-slicing interval of 5 s were analysed using the Z-Rietveld software [7,8] to determine the lattice parameters and volume fractions of austenite and the transformed phase, bainitic ferrite. According to diffraction profile analysis, it was found that fresh bainite possessed a body-centered tetragonal (BCT) structure, and its c/a ratio decreased rapidly to show a body-centered structure (BCC) with isothermal holding time, as shown in Figure 8. As seen in Figure 8a, the diffraction peak for bainite at 350 °C could be fitted as BCT rather than BCC. The axial ratio c/a decreased with elapsing time, as shown in Figure 8b, in which the volume fraction of bainite was inserted by volume percentage. In the case of isothermal transformation at 450 °C, the bainite structure was BCC from the beginning.
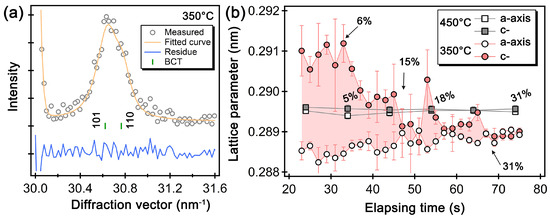
Figure 8.
Features in ferrite diffraction profile: (a) Enlarged diffraction profile obtained after Rietveld refinement assuming BCT, (b) Changes in the lattice parameters of the a- and c-axis of the bainite phase as a function of elapsing time at 450 and 350 °C. Reprinted from Ref. [11].
When the volume fraction of the transformed phase exceeds ~30%, as shown in Figure 8b, the lattice parameters c and a become nearly identical. Therefore, we employed the BCC structure to fit the lattice parameters of the bainitic ferrite. Figure 9 presents the changes in lattice parameters of austenite and bainitic ferrite. As seen, the results at 450 and 500 °C differ from those at 320, 350, and 400 °C, where the nose temperature of the Time–Temperature–Transformation (TTT) curve is located between 400 and 450 °C. This isothermal transformation behavior can be divided into two categories: above and below the nose of the TTT curve, which correspond to the upper and lower bainite, respectively. The austenite lattice parameter increases with the progress of transformation in the former, whereas it decreases in the latter.
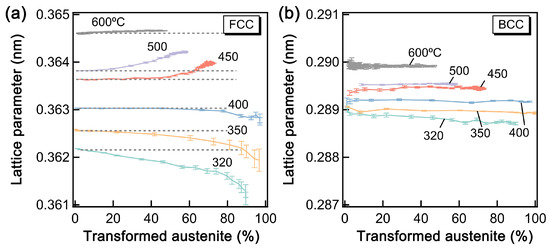
Figure 9.
Changes in the mean lattice parameters of austenite (FCC) (a) and bainitic ferrite (BCC) (b) during isothermal transformations at various temperatures. Reprinted with permission from ref. [17]. Elsevier, 2025.
These results suggest that the dominant transformation mechanism of the upper bainite is diffusional, whereas the lower bainite is displacive. The internal (phase) stresses caused by the transformation strains are relaxed by dislocation motion and vacancy formation. The yielded dislocations and vacancies affect not only the broadening of both austenite and bainitic ferrite diffraction peaks (FWHM) but also the lattice parameter. Shirai proposed that vacancies are induced with phase transformation based on their positron annihilation lifetime measurements for Al alloys [18,19]. However, this interpretation has not been widely accepted. Wang et al. performed the first-principles calculations and demonstrated that the austenite lattice parameter decreases as the vacancy density increases, which corresponds to the experimental observation in lower bainite [17]. During displacive transformation, the present authors suggest that the transformation-induced vacancy is the dominant factor that reduces the austenite lattice parameter. To relax the isotropic component of transformation-induced phase stress effectively, dislocation punching out or the emission of vacancies from the interface would be the most likely mechanism. However, this remains a topic of discussion at present.
The shear or deviatoric components of the phase stress induced by phase transformation can be relaxed by dislocation motion not only in the transformed phase but also in the matrix near the interface [20], as well as variant selection in displacive transformation. Gong et al. have demonstrated that prior martensite transformation accelerates the subsequent bainite transformation [21]. Bainitic lathes formed adjacent to a pre-existing martensite plate exhibited an almost identical orientation. Dislocations introduced in austenite due to stress relaxation of transformation strains are believed to assist bainite transformation accompanying variant selection.
6. Martensitic Transformation During Quenching
Diffraction studies in situ during martensite transformation have been made using XRD in earlier works, in which most of the measurements were limited to the transformation below RT. In many papers, the lattice parameter of austenite was reported to deviate toward the lower side from the thermal contraction line with the progress of transformation and then claimed the generation of compressive hydrostatic internal stress in the retained austenite [22]. However, dilatometry measurement revealed the expansion of a specimen with martensite transformation, clearly indicating the formation of positive transformation strain. As was discussed in Chapter 3, the phase stress in the transformed product can be estimated by employing Eshelby [14] and Mori-Tanaka [15]. Here, the eigenstrain, i.e., the transformation strain, can be found from the dilatometry result as a positive (expansive) isotropic strain, . Putting the positive into Equation (5), we obtain the tensile hydrostatic phase stress in austenite. This correct interpretation was given by Hayakawa and Oka [23]. They pointed out that the measured elastic strains by XRD consisted of macroscopic residual stress on the surface and austenite phase stress. When these two kinds of stresses were separated, the austenite phase strain (or stress) became tensile. Ullakko and Gavriljuk [24] supported Hayakawa and Oka’s conclusion in their overview, introducing the neutron diffraction results. However, after their verification, several contradicting conclusions were reported [25,26]. Nakada et al. claimed the existence of compressive phase stress in the retained austenite judging from the change in austenite lattice parameter determined by XRD [26]. Detailed in situ measurements were reported recently using synchrotron XRD by Villa et al. [27,28], and their results and interpretation were a little complicated and/or puzzling: the phase stress in austenite is tensile at the beginning of transformation and changes to compressive. Hence, Wang et al. used a high-intensity and high-resolution neutron diffractometer to investigate martensite transformation in medium carbon steel at J-PARC MLF [2]. Serial neutron diffraction profiles were sliced with a time interval of 2 s from the recorded event data. The transformation behavior could be successfully monitored during quenching to RT. First, they found that the fresh martensite exhibited BCT structure when it formed immediately below the martensite start (Ms) temperature, and its c/a ratio decreased rapidly as time elapsed. This is like the case of lower bainite transformation in Chapter 5, suggesting the common phenomenon in displacive transformation for carbon-bearing steels. The lattice parameter and the full width at half maximum (FWHM) of austenite peak significantly decrease and increase upon martensite transformation, respectively. If the lattice parameters were only affected by the internal elastic strains (hydrostatic phase stresses), it should be concluded that martensite transformation induces tensile stresses in austenite and compressive in martensite, similar to the case of ferrite transformation (Figure 7). Figure 10 shows the changes in lattice parameters of austenite and martensite. The thermal expansion line can be assumed to be indicative of lattice expansion exclusively driven by thermal stress. The observed results on lattice parameters might suggest compressive stresses in austenite and tensile in martensite, which is very questionable as to why hydrostatic tensile stress is generated in the volume-expanded region of martensite. These results must indicate that the change in lattice parameters depends not only on the hydrostatic phase stresses but also on another influential factor. Here, the separation of the influences by phase stress and crystal defects must be taken into consideration. Gong et al. [29] revealed this mysterious issue by a sophisticated experiment, which will be described in the next chapter.
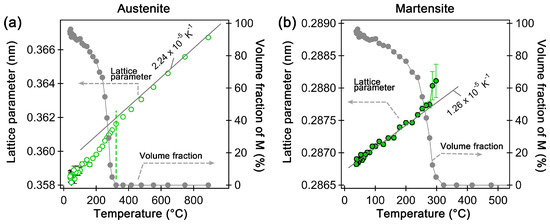
Figure 10.
Lattice parameter and martensite volume fraction as a function of temperature during quenching: (a) austenite lattice parameter and (b) martensite lattice parameter assuming BCC structure. The green dashed line shows the Ms temperature. Reprinted with permission from ref. [2]. Elsevier, 2025.
The dislocation density was estimated using the convolutional multi-whole profile (CMWP) fitting method [30,31] for the quenched sample. The dislocation densities were determined to be 6.94 × 10¹⁵ m−2 in martensite and 0.40 × 10¹⁵ m−2 in the retained austenite. It is also noteworthy that transformation-induced vacancies expand the unit volume and simultaneously decrease the lattice parameter, as demonstrated by the first-principles calculation [17].
In cases of martensite transformations occurring below RT for Fe-Ni(-C) alloys [32], the results are more complicated, and the magnetic effect needs to be taken into account to understand the change in lattice parameters. It is important to give the correct interpretation for the measured lattice parameters, which depend on multi-influential factors.
7. Tempering of a Martensitic Steel Containing Retained Austenite
To verify the martensite transformation-induced phase stresses, partial quenching followed by cyclic tempering was examined by Gong et al. [29]. As a basic study, a Fe-18Ni binary alloy was used, and neutron diffraction in situ combined with dilatometry measurement during martensitic transformation and subsequent cyclic tempering was performed at J-PARC MLF. The changes in lattice parameters of austenite and martensite measured during the first quenching are presented in Figure 11. The results in Figure 11a,b were determined by fitting many hkl peaks (ranging from 111 to 222 for austenite and from 110 to 310 for martensite) using the Z-Rietveld software. Figure 11c,d show the lattice parameters analysed from individual hkl diffraction peaks. In Figure 11a, the austenite lattice parameter becomes lower than the extrapolated thermal contraction line, such that one may think that the compressive hydrostatic phase stress was induced by transformation strain. However, in Figure 11c, the lattice parameters determined from the 200 peak are higher than those from the 111 peak. Because the Young modulus along <111> is nearly three times higher than that along <100> (93.5 GPa and 300.0 GPa, respectively, in FCC iron [33]), this hkl dependence suggests the generation of tensile hydrostatic phase stress in the austenite. Since a lower Young modulus results in a larger lattice strain, if the stress is considered compressive, i.e., as a deviation from the thermal expansion curve, the fact that the lattice parameter obtained from the (200) peak is larger than that from the (111) peak cannot be justified. Furthermore, considering the dilatation of a specimen by dilatometry measurement, the transformation strain is positive, supporting the presence of tensile hydrostatic.

Figure 11.
Changes in the average (a,b) and hkl-dependent lattice parameters (c,d) of austenite (a,c) and martensite (b,d) during continuous cooling. The dashed lines represent the thermal contraction of austenite and martensite, extrapolated from their respective single-phase regions. Reprinted with permission from ref. [29]. Elsevier, 2025.
Phase stress in the retained austenite is described by Equation (5). Reliable transformation strains can be obtained by macroscopic dilatometry measurement, and the obtained expansive strains were taken into calculation. Hence, this lower side deviation in Figure 11a is not caused by phase stress but rather by another factor, like crystal defects.
Then, to remove the influence of crystal defects, appropriate cyclic tempering shown in Figure 12a was given after partial quenching to check the stress balance law for phase stresses [29]. The removable of crystal defects by tempering was confirmed by the changes in FWHM (see Figure 12b,c) and the results of CMWP fitting. Then, the effect of transformation strains and thermal expansion/contraction is dominantly observed in Figure 12d,e. The variation in lattice parameters during martensitic transformation and the subsequent tempering is not only caused by stress but also by crystal defects, as implied by the above experimental results. To demonstrate this assertion, they first assumed “stress” as the only origin to cause the lattice parameter variation, and the phase stress balance between austenite and martensite was evaluated. The lattice strain ()—i.e., the isotropic elastic strain—of austenite () and martensite ) in the cyclic heating–cooling of the partially martensitic transformed specimen can be given by the following:
where refers to the lattice parameter of phase at temperature T, and refers to the stress- and defect-free one at the same temperature. The lattice parameters of austenite before the formation of martensite in step 1 (Figure 12d)) and its extrapolated values below the Ms temperature were used for . As mentioned earlier, the crystal defects may also change the lattice parameter. Here, the lattice parameters of the tempered single-phase martensite with a low density of crystal defects were used for . Figure 13a,b show the variations in and as functions of temperature, respectively. In Figure 13a, began to decrease as the martensitic transformation started. It then remained almost constant in step 2, despite changes in temperature, and later shifted to maintain a linear relationship with temperature in steps 3 and 4. The lattice parameter variations of austenite in steps 3 and 4 coincide with the prediction of thermal stress, but that in step 2 is not. Hence, it can be considered that another mechanism is responsible for raising the lattice parameter of austenite to counteract the thermal stress during the tempering in step 2. After the tempering, the lattice strain of austenite at 290 °C became tensile, which is composed of thermal misfit strain and transformation-induced phase strain (stress). In contrast, of the fresh martensite formed at the beginning was large, but it gradually decreased as the transformation progressed. During the subsequent cyclic heating–cooling, the lattice strain of martensite increased with temperature in steps 3 and 4, consistent with the thermal stress condition. Similar to the behavior observed in austenite, the variation in the lattice strain of martensite in step 2 cannot be explained only by the thermal misfit strain. After tempering, the lattice strain of martensite became compressive.
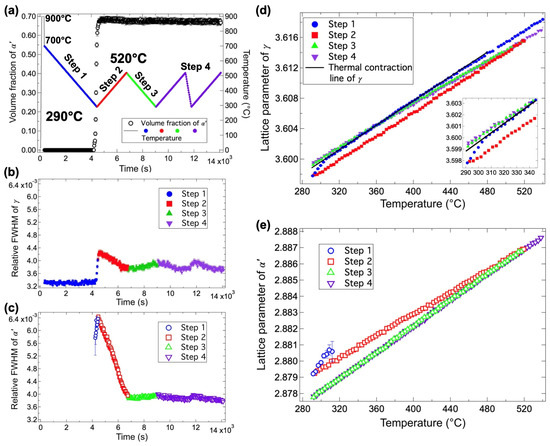
Figure 12.
Martensitic transformation and tempering behavior during the cyclic cooling–heating process: temperature history and the corresponding changes in martensite volume fraction (a); changes in the relative FWHM of austenite 111 (b) and martensite 110 (c) reflections; and changes in the lattice parameters of austenite (d) and martensite (e). Reprinted with permission from ref. [29]. Elsevier, 2025.
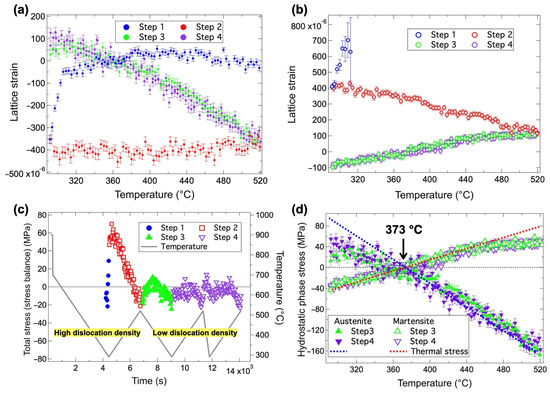
Figure 13.
Lattice strains of austenite (a) and martensite (b); total stress (c); and phase stress of austenite and martensite during partial martensitic transformation and cyclic heating–cooling processes (d). Reprinted with permission from ref. [29]. Elsevier, 2025.
Subsequently, the hydrostatic stresses () for austenite () and martensite () were calculated by the lattice strain to confirm the stress balance [34,35], as follows:
where E and υ refer to the bulk Young modulus and the bulk Poisson ratio, respectively. Generally, the Young modulus of BCC-Fe and FCC-Fe slightly increased with lowering temperature, but the variation was negligible (approximately 5%) within the temperature range of Ms to Md [36]. Therefore, they employed the constant values of 180 GPa and 172 GPa for the Young modulus of martensite and austenite phases [36], respectively. The Poisson ratio of 0.3 was used for both phases. Then, the total stress was calculated by the hydrostatic phase stresses of austenite () and martensite () using the volume fraction weighted average method as follows:
Figure 13c indicates that the total stress evolved with the onset of martensitic transformation and tempering. Although the total stress is expected to be zero (i.e., stress equilibrium condition must hold), it deviated from zero with the progress of martensitic transformation in step 1 but reverted to zero after tempering in step 2. Meanwhile, steps 3 and 4 satisfy the stress balance requirement well. As is found in Figure 13d, the effects of transformation strain and thermal misfit strain are cancelled at 373 K, at which the phase stress becomes zero (eigenstrain = 0 in Equation (5)).
Figure 14 presents a schematic illustration of the lattice strain variations in martensite (A→B→C) and austenite (D→E→F) during tempering of the partially martensitic transformed specimen (steps 2 and 3 in Figure 12a). The tensile lattice strain of fresh martensite at A changed to a compressive one at C after tempering. The tempering of the full martensite microstructure demonstrated that the annihilation of dislocations decreased the lattice parameter (the details see [29]). Here, we can attribute the variation in the lattice strain of martensite to dislocation annihilation: Δ= A − C. The lattice strain variation between B and C was caused by thermal stress, as confirmed in Figure 13d. If we draw a line AB′ parallel to CB, the deviation between AB′ and AB corresponds to Δ, which is annihilated by tempering (at various tempering temperatures). Similarly, the contribution of crystal defects to the lattice strain of austenite is equal to (D − F), which is negative, as opposed to the effect of dislocations. Vacancy is another type of crystal defect, and its formation decreases the lattice parameter while causing overall volume expansion [17]. This effect is quite effective in relaxing hydrostatic phase stress induced by transformation strain.
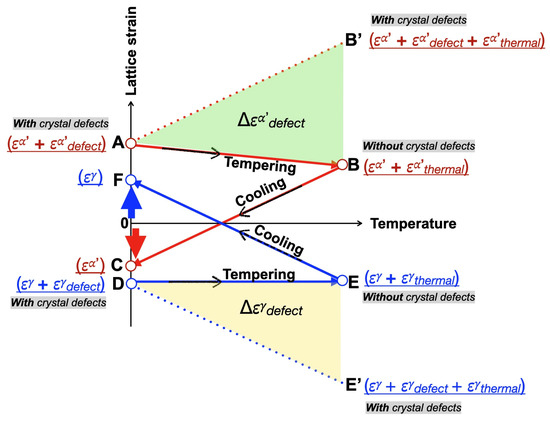
Figure 14.
Schematic illustration of the lattice strain variations in martensite (A→B→C) and austenite (D→E→F) during the tempering and cooling of the partially martensitic transformed specimen. , and refer to the phase strain introduced by the martensitic transformation, the contribution of crystal defects, and thermal misfit strain, respectively. The superscript i represents martensite () or austenite () (a small thermal misfit strain would also be included in due to temperature change). Reprinted with permission from ref. [29]. Elsevier, 2025.
The changes in dislocation density and arrangement during tempering for low alloy steel (22SiMn2TiB) with a lath martensite structure were elucidated using CMWP fitting for in situ ND data [37]. With increasing tempering temperature, the dislocation density scarcely changed in the beginning and then decreased at temperatures above 200 °C, whereas the dislocation arrangement drastically changed at temperatures above 400 °C. The strength of the tempered steel is believed to depend on both the dislocation density and their arrangement.
8. Effect of Thermo-Mechanically Controlled Processing (TMCP) on Lattice Parameters During Phase Transformations
Most advanced steels have been produced via thermo-mechanically controlled processing (TMCP). The first monitoring of TMCP with in situ ND was challenged by Xu et al. at a research reactor of the Nuclear Physics Institute (NPI) in the Czech Republic [38] and then at ENGIN-X, ISIS in the UK [39]. As time resolution improves with increasing neutron beam intensity, the construction of J-PARC has significantly advanced this research field. Figure 15 shows TMCP simulators installed at BL19(Takumi) at J-PARC MLF. Using another experimental jig, temperature control down to cryogenic levels is now possible.

Figure 15.
Schematic of the top and front views of the vertical type (a) and horizontal type (b) simulators of the inset of (b) for in situ neutron diffraction at TAKUMI, J-PARC. A snapshot of the heating furnace is shown in the inset of (b). Reprinted with permission from ref. [17]. Elsevier, 2025.
First, microstructural evolution with ferrite transformation during TMCP for low alloy steels was investigated in situ by ND at a reactor neutron source of NPI [38]. The transformation kinetics determined from the ND profiles were well consistent with those measured from the metallographic microstructures, and the carbon enrichment in austenite during the ferrite transformation was confirmed by the non-linear thermal expansion deviation of the {111} lattice plane spacing of austenite. The deformed and non-deformed austenite microstructures were found to exhibit distinct differences in the shape of their transition curves. It was demonstrated that niobium addition and austenite deformation promoted the ferrite transformation. Though only two diffraction peaks, 111 for austenite and 110 for ferrite, could be monitored via a position-sensitive detector, the results demonstrate the usefulness of in situ ND measurements. At accelerator-driven neutron sources, such as ISIS, many diffraction peaks like Figure 1 could be obtained by a pair detector bank observing two orthogonal scattering vectors (loading and transverse directions of the spacemen). The changes in phase volume fractions, phase strains (stresses), and texture evolution were measured for ferrite transformation during TMCP [39]. The volume fractions of constituent phases in textured steel can be correctly evaluated through the simultaneous determination of texture and volume fractions for time-of-flight ND data obtained by Takumi, J-PARC MLF [40].
Shi et al. examined the effect of loading during cooling for low alloy steel and found that compressive deformation promoted ferrite and pearlite transformations over bainite [41]. They also observed that the volume fraction of the retained austenite decreases with increasing deformation due to a corresponding decrease in carbon content.
Gong et al. demonstrated using in situ ND at ISIS that even a small amount of plastic deformation accelerated the nano-bainite transformation accompanied by deformation-dependent variant selection [42].
Wang et al. challenged to monitor the effect of ausforming on martensite transformation for a 0.4C steel using the equipment shown in Figure 15a [2]. After austenizing, a compressive reduction of 40% was given to a cylindrical sample at 700 °C, followed by quenching to RT. The ND data reveal that, after ausforming, the lattice parameter of austenite was larger, and that of austenite was smaller compared with the non-ausformed case, which was ascribed to the introduced dislocations introduced during ausforming. Thus, the lattice defects affect the lattice parameter during martensite transformation. Ausforming also slightly raises the Ms temperature and increases the amount of retained austenite at RT.
Dynamic ferrite transformation has been a hot topic since Yada et al. reported the results of in situ XRD during torsion deformation, suggesting possible dynamic ferrite transformation above A3 temperature [43]. Shibata et al. examined this issue by introducing the equipment shown in Figure 15a and reported that dynamic ferrite transformation occurred only below A3 temperature [44]. Li et al. prepared a binary Fe-14Ni alloy with an equilibrium duplex microstructure and isothermally compressed it in the two-phase region to achieve a quantitative analysis of microstructure evolution, stress partitioning, and thermodynamics during dynamic transformation [45]. The γ-to-α dynamic transformation during isothermal compression, as well as the α-to-γ reverse transformation during isothermal annealing under unloaded conditions after deformation, were both accompanied by Ni partitioning. The phase strains during TMCP were obtained via in situ ND measurement, based on which the stress partitioning behavior between γ and α was discussed using the generalized Hooke’s law. Within the present thermodynamic framework, the microstructure evolution during isothermal compression of Fe-14Ni alloy was well explained by considering changes in chemical free energy, plastic, and elastic energies and the mechanical work applied to the material. In addition, the stabilization of the α soft phase in Fe-14Ni alloy by deformation was rationalized since the γ-to-α transformation reduced the total Helmholtz free energy by decreasing both the elastic and dislocation energies.
Dynamic recovery and dynamic recrystallization, as well as dynamic precipitation and dynamic recrystallization [46], have also been studied using in situ ND. Recently, advanced steels have been produced through sophisticated TMCP, and in situ ND has become more valuable in understanding the underlying mechanism of microstructure control.
9. Concluding Remarks and Future Investigations Expected
The present review paper highlights that ND is a powerful method to obtain the phase lattice parameters as bulky averaged values without influencing environmental interference. It is also helpful to use other neutron measurements like small angle scattering and Bragg edge imaging [47]. There is often interest in determining the distribution of lattice parameters within individual grains as three-dimensional information. Though such trials have been challenged using neutron beams [48], its space resolution is insufficient for commercial steels with grain sizes on the order of tens of micrometers. Therefore, it is highly recommended that related studies be carried out through the complementary use of ND and high-energy synchrotron 3D XRD [49,50] to avoid artificial effects like oxidation.
Author Contributions
Conceptualization, Y.T.; writing—original draft preparation, Y.T.; Investigation, S.H., P.X., S.M., W.G. and Y.W.; Writing—review and editing, S.H., P.X., S.M., W.G. and Y.W. All authors have read and agreed to the published version of the manuscript.
Funding
This research was funded by Data Creation and Utilization Type Material Research and Development Project Grant number [JPMXP1122684766].
Acknowledgments
The authors thank their co-workers at Ibaraki University, JAEA, NIMS and students of the Ibaraki University for their experimental assistance, data analyses and discussion, and Elsevier (Acta Mater. and Mater.: License Number 6013890195465, 6013970689618, 6014020415072) and Iron and Steel Institute of Japan (ISIJ Int.) for the permission to reuse the figures.
Conflicts of Interest
The authors declare no conflicts of interest. The funders had no role in the design of the study; in the collection, analyses, or interpretation of data; in the writing of the manuscript; or in the decision to publish the results.
Abbreviations
The following abbreviations are used in this manuscript:
| ND | Neutron diffraction |
| XRD | X-ray diffraction |
| SEM | Scanning electron microscopy |
| EBSD | Electron backscatter diffraction |
| TMCP | Thermo-mechanically controlled processing |
| FWHM | Full width at a half maximum |
| CMWP | Convolutional multiple whole profile |
References
- Tomota, Y.; Sekido, N.; Harjo, S.; Kawasaki, T.; Gong, W.; Taniyama, A. In situ observation on transformation behavior upon heating in a 1.5Mn-1.5Si-0.2C steel. ISIJ Int. 2017, 57, 2237–2244. [Google Scholar] [CrossRef]
- Wang, Y.; Tomota, Y.; Ohmura, T.; Morooka, S.; Gong, W.; Harjo, S. Real time observation of martensite transformation for a 0.4C low alloyed steel by neutron diffraction. Acta Mater. 2020, 184, 30–40. [Google Scholar] [CrossRef]
- Bhadeshia, H.K.D.H. Bainite-unanswered questions and why they matter. In Proceedings of the 7th Internal Symposium on Steel Science (ISSS 2024), Kyoto, Japan, 11–14 November 2024; pp. 19–28. [Google Scholar] [CrossRef]
- Babu, S.S.; Specht, E.D.; David, S.A.; Karapetrova, E.; Zschack, P.; Peet, M.; Bhadeshia, H.K.D.H. Time-resolved X-ray diffraction investigation of austenite and transformation to bainite. In Proceedings of the 1st International Symposium on Steel Science (ISSS-2007), Kyoto, Japan, 16–19 May 2007; pp. 93–99. [Google Scholar]
- Stone, H.J.; Peet, M.J.; Bhadeshia, H.K.D.H.; Withers, P.J.; Babu, S.S.; Specht, E.D. Synchrotron X-ray studies of austenite and bainitic ferrite. Proc. R. Soc. A Math. Phys. Eng. Sci. 2008, 464, 1009–1027. [Google Scholar] [CrossRef]
- Koo, M.; Xu, P.G.; Tomota, Y.; Suzuki, H. Bainitic transformation behavior studied by simultaneous neutron diffraction and dilatometric measurement. Scr. Mater. 2009, 61, 797–800. [Google Scholar] [CrossRef]
- Oishi, R.; Yonemura, M.; Nishimaki, Y.; Torii, S.; Hoshikawa, A.; Ishigaki, T.; Morishima, T.; Mori, K.; Kamiyama, T. Rietveld analysis software for J-PARC. Nucl. Instrum. Methods Phys. Sect. A 2009, 600, 94–96. [Google Scholar] [CrossRef]
- Oishi-Tomiyasu, R.; Yonemura, M.; Morishima, T.; Hoshikawa, A.; Torii, S.; Ishigaki, T.; Kamiyama, T. Application of matrix decomposition algorithms for singular matrices to the Pawley method in Z-Rietveld. J. Appl. Crystallogr. 2012, 45, 299–308. [Google Scholar] [CrossRef]
- Tomota, Y.; Gong, W.; Harjo, S.; Shinozaki, T. Reverse austenite transformation behavior in a tempered martensite low-alloy steel studied using in situ neutron diffraction. Scr. Mater. 2017, 133, 79–82. [Google Scholar] [CrossRef]
- Shinozaki, T.; Tomota, Y.; Fukino, T.; Suzuki, T. Microstructure evoution during reverse transformation of austenite from tempered martensite in low alloy steel. ISIJ Int. 1917, 57, 533–539. [Google Scholar] [CrossRef]
- Tomota, Y.; Wang, Y.X.; Ohmura, T.; Sekido, N.; Harjo, S.; Kawasaki, T.; Gong, W.; Taniyama, A. In situ neutron diffraction study on ferrite and pearlite transformations for a 1.5Mn-1.5Si-0.2C steel. ISIJ Int. 2018, 58, 2125–2132. [Google Scholar] [CrossRef]
- Onink, M.; Brakman, C.M.; Tichelaar, F.D.; Mittemeijer, E.J.; der Zwaag, S.V.; Root, J.H.; Konyer, N.B. The lattice parameters of austenite and ferrite in Fe-C alloys as functions of carbon concentration and temperature. Scr. Metall. Materiallia 1993, 29, 1011–1016. [Google Scholar] [CrossRef]
- Bhadeshia, H.K.D.H.; David, S.A.; Vitek, J.M.; Reed, R.W.; Technol, M.S. Stress induced transformation to bainite in Fe–Cr–Mo–C pressure vessel steel. Mater. Sci. Technol. 1991, 7, 686–698. [Google Scholar] [CrossRef]
- Eshelby, J.D. The determination of the elastic field of an ellipsoidal inclusion, and related problems. Proc. Phys. Soc. A 1957, 241, 376–396. [Google Scholar]
- Mori, T.; Tanaka, K. Average stress in martix and average elastic energy of ma- terials with misfitting inclusions. Acta Metall. 1973, 21, 571–574. [Google Scholar] [CrossRef]
- Tomota, Y.; Kuroki, K.; Mori, T.; Tamura, I. Tensile Deformation of Two-Ductile-PhaseAlloys -Flow Curves of α-γ Fe-Cr-Ni Alloys. Mater. Sci. Eng. 1976, 24, 858. [Google Scholar] [CrossRef]
- Wang, Y.; Tomota, Y.; Ohmura, T.; Gong, W.; Harjo, S. Evolution of austenite lattice parameter during isothermal transformation in 0.4 C low alloyed steels. Materialia 2023, 27, 101685. [Google Scholar] [CrossRef]
- Chalermkarnnon, P.; Araki, H.; Shirai, Y. Excess vacancies induced by disorder-order phase transformation in Ni3Fe. Mater. Trans. 2002, 43, 1486–1488. [Google Scholar] [CrossRef][Green Version]
- Shirai, Y. Behavior of vacancies in aluminum watched by positrons. J. Jpn. Inst. Light Met. 2006, 56, 629–634. (In Japanese) [Google Scholar] [CrossRef]
- Miyamoto, G.; Shibata, A.; Maki, T.; Furuhara, T. Precise measurement of strain accommodation in austenite matrix surrounding martensite in ferrous alloys by electron backscatter diffraction analysis. Acta Mater. 2009, 57, 1120–1131. [Google Scholar] [CrossRef]
- Gong, W.; Tomota, Y.; Su, Y.H.; Harjo, S. Effect of Prior Martensite on Bainite Transformation in Nanobainite Steel. Acta Mater. 2015, 85, 243–249. [Google Scholar] [CrossRef]
- Tanaka, Y.; Shimizu, K. Anomalous changes in austenite and martensite lattice parameter of Fe-Mn-C alloys. Trans. JIM 1980, 21, 42–51. [Google Scholar] [CrossRef]
- Hayakawa, M.; Oka, M. On the change in the austenite lattice parameter due to the martensitic transformation in an Fe-32Ni alloy. Acta Metall. 1983, 31, 955–959. [Google Scholar] [CrossRef]
- Ullakko, K.; Gavriljuk, V.G. Effects of choerent interfaces in the freshly formed iron-nickel-carbon martensites. Acta Metall. Mater. 1992, 40, 2471–2482. [Google Scholar] [CrossRef]
- Harjo, S.; Suzuki, T.; Tomota, Y.; Kamiyama, T.; Torii, S. In situ neturon diffraction during martensitic transformation bysubzero cooling in an Fe-33Ni alloy. J. Phys. Soc. Jpn. 2001, 70, 537–539. [Google Scholar]
- Nakada, N.; Ishibashi, Y.; Tsuchiyama, T.; Takaki, S. Self-stabilization of untransformed austenite by hydrostatic pressure via martensitic transformation. Acta Mater. 2016, 110, 95102. [Google Scholar] [CrossRef]
- Villa, M.; Pantleon, K.; Somers, M.A.J. Evolution of compressive strains in retained austenite during sub-zero Celsius martensite formation and tempering. Acta Mater. 2014, 65, 383–392. [Google Scholar] [CrossRef]
- Villa, M.; Niessen, F.; Somers, M.A.J. In situ investigation of the evolution of lattice strain and stresses in austenite and martensite during quenching and tempering of steel. Metall. Mater. Trans. A 2018, 49, 28–40. [Google Scholar] [CrossRef]
- Gong, W.; Harjo, S.; Tomota, Y.; Morooka, S.; Kawasaki, T.; Shibata, A.; Tsuji, N. Lattice parameters of austenite and martensite during transformation for 18Ni alloy investigated through in-situ neutron diffraction. Acta Mater. 2023, 250, 118860. [Google Scholar] [CrossRef]
- Ungár, T.; Cubicza, J.; Ribárik, G.; Borbély, A. Crystallite size distribution and dislocation structure determined by diffraction profile analysis: Principles and practical application to cubic and hexagonal crystals. J. Appl. Cryst. 2001, 34, 298–310. [Google Scholar] [CrossRef]
- Ribárik, G.; Ungár, T. Characterization of the microstructure in random and textured polycrystals and single crystals by diffraction line profile analysis. Mater. Sci. Eng. A 2010, 528, 112–121. [Google Scholar] [CrossRef]
- Yamashita, T.; Harjo, S.; Kawasaki, T.; Morooka, S.; Gong, W.; Fujii, H.Y. Tomota: Martensitic Transformation Behavior of Fe-Ni-C Alloys monitored by In-situ Neutron Diffraction during Cryogenic Cooling. ISIJ Int. 2023, 64, 192–201. [Google Scholar] [CrossRef]
- Hutching, M.; Withers, P.J.; Holden, T.M.; Lorentzen, T. Introduction to the Characterization of Residual Stress by Neutron Diffraction; Taylor & Francis: Abingdon-on-Thames, UK, 2004; pp. 203–262. [Google Scholar]
- Tomota, Y.; Luk, P.; Neov, D.; Harjo, S.; Abe, Y.R. In situ neutron diffraction during tensile deformation of a ferrite-cementite steel. Acta Mater. 2003, 51, 805–817. [Google Scholar] [CrossRef]
- Harjo, S.; Tomota, Y.; Ono, M. Measurements of thermal residual elastic strains in ferrite–austenite Fe–Cr–Ni alloys by neutron and X-ray diffractions. Acta Mater. 1998, 47, 353–362. [Google Scholar] [CrossRef]
- Ledbetter, H.M.; Reed, R.P. Elastic properties of metals and alloys, I. Iron, nickel, and iron-nickel alloys. J. Phys. Chem. Ref. Data 1973, 2, 531–618. [Google Scholar] [CrossRef]
- Shi, Z.; Tomota, Y.; Harjo, S.; Chi, B.; Pu, J.; Jian, L. In-situ Neutron Diffraction Study on Tempering Behavior of Lath Martensite. Mater. Charact. 2015, 107, 29–32. [Google Scholar] [CrossRef]
- Xu, P.G.; Tomota, Y.; Lukas, P.; Muransky, O.; Adachi, Y. Austenite-to-Ferrite Transformation and Phase Strain Evolution in Low Alloy Steels during Thermomchanically Controlled Process Studied by In Situ Neutron Diffraction. Mater. Sci. Eng. A 2006, 434–435, 46–53. [Google Scholar] [CrossRef]
- Zhang, S.Y.; Godfrey, E.; Kockelmann, W.; Paradowska, A.; Bull, M.J.; Korsunsky, A.M.; Abbey, B.; Xu, P.; Tomota, Y.; Liljedahl, D.; et al. High-tech composites to ancient metals. Mater. Today 2009, 12, 78–84. [Google Scholar] [CrossRef]
- Xu, P.G.; Tomota, Y.; Arakaki, Y.; Harjo, S.; Sueyoshi, H. Evaluation of austenite volume fraction in TRIP steel using neutron diffraction. Mater. Charact. 2017, 127, 104–110. [Google Scholar] [CrossRef]
- Shi, Z.; Tomota, Y.; Harjo, S.; Su, Y.H.; Chi, B.; Jian, L. Effect of non-isothermal deformation of austenite on ferrite transformation behavior studied by in-situ neutron diffraction. Mater. Sci. Eng. A 2015, 631, 153–159. [Google Scholar] [CrossRef]
- Gong, W.; Tomota, Y.; Adachi, Y.; Paradowska, A.M.; Kelleher, J.F.; Zhang, S.Y. Effect of Ausforming Temperature on Bainite Transformation, Microstructure and Variant Selection in a Nano-Bainite Steel. Acta Mater. 2013, 61, 4142–4154. [Google Scholar] [CrossRef]
- Yada, H.; Li, C.M.; Yamagata, H. Dynamic γ→α transformation during hot deformation in iron-nickel-carbon alloys. ISIJ Int. 2000, 40, 200–206. [Google Scholar] [CrossRef]
- Shibata, A.; Takeda, Y.; Park, N.; Zhao, L.J.; Harjo, S.; Kawasaki, T.; Gong, W.; Tsuji, N. Nature of dynamic ferrite transformation revealed by in-situ neutron diffraction analysis during thermomechanical processing. Scr. Mater. 2019, 165, 44–49. [Google Scholar] [CrossRef]
- Li, L.; Miyamoto, G.; Zhang, Y.; Li, M.; Morooka, S.; Oikawa, K.; Tomota, Y.; Furuhara, T. Quantitative analysis of microstructure evolution, stress partitioning and thermodynamics in the dynamic transformation of Fe-14Ni alloy. J. Mater. Sci. Technol. 2023, 184, 221–234. [Google Scholar] [CrossRef]
- Xu, P.G.; Tomota, Y.; Oliver, E.C. Dynamic Recrystallization and Dynamic Precipitation Behavior of a Fe-17Ni-0.2C Martensite Steel Studied by In Situ Neutron Diffraction. ISIJ Int. 2008, 48, 1618–1625. [Google Scholar] [CrossRef]
- Tomota, Y. Crystallographic characterization of steel microstructure using neutron diffraction. Sci. Technol. Adv. Mater. 2020, 20, 1189–1206. [Google Scholar] [CrossRef]
- Larsen, C.B.; Samothrakitis, S.; Worcek, R.; Polatidis, E.; Capek, J.; Upadhyay, M.V.; Tovar, M.; Schmidt, S.; Strobl, M. Exploring grain-resolubed strain tensors and non-uniform lattice deformations with Laue 3DNDT. Acta Mater. 2025, 289, 120869. [Google Scholar] [CrossRef]
- Hayashi, Y.; Kimura, H. Scanning Three-Dimensional X-ray Diffraction Microscopy for Carbon Steels. Quantum Beam Sci. 2023, 7, 23. [Google Scholar] [CrossRef]
- Yan, J.; Dong, W.; Shi, P.; Li, T.; Liu, W.; Wang, Y.; Wand, X.; Zhu, Y.; Ren, Y. Synchrotron x-ray study on heterostructued materials. JOM 2023, 75, 1423–1434. [Google Scholar] [CrossRef]
Disclaimer/Publisher’s Note: The statements, opinions and data contained in all publications are solely those of the individual author(s) and contributor(s) and not of MDPI and/or the editor(s). MDPI and/or the editor(s) disclaim responsibility for any injury to people or property resulting from any ideas, methods, instructions or products referred to in the content. |
© 2025 by the authors. Licensee MDPI, Basel, Switzerland. This article is an open access article distributed under the terms and conditions of the Creative Commons Attribution (CC BY) license (https://creativecommons.org/licenses/by/4.0/).