Article

Effects of Warm Rolling Temperature on Microstructure and Texture Evolution in Cu–10Fe Alloy Sheets

1
State Key Laboratory of Digital Steel, Northeastern University, Shenyang 110819, China
2
School of Mechanical Engineering, Xijing University, Xi’an 710123, China
*
Author to whom correspondence should be addressed.
Metals 2025, 15(6), 606; https://doi.org/10.3390/met15060606
Submission received: 2 May 2025 / Revised: 26 May 2025 / Accepted: 27 May 2025 / Published: 28 May 2025

Abstract

This study systematically investigates the influence of rolling temperature (cold rolling to 500 °C) on the microstructure and properties of Cu–10Fe alloy. The results show that with an increasing temperature, the Fe phase morphology transitions gradually from fibrous to spherical/ellipsoidal, while the Cu grain size first decreases and then increases. At 500 °C rolling, a bimodal structure forms (fine recrystallized grains coordinate deformation, and coarse grains provide strengthening), with dynamic recovery significantly reducing dislocation density, but the recrystallization rate remains only 11.9%. Texture analysis reveals that in the cold-rolled state, Brass-R texture (2.45) dominates, resulting in low elongation (1.96%). At 400–450 °C, the synergistic effect of Goss and Copper textures (6.9–13.82) improves elongation to 7.03%. At 500 °C, Brass texture (14.58) becomes dominant, increasing elongation to 9.21%, and tensile strength rises from 443 MPa to 472 MPa. Electrical conductivity increases from 10.09% IACS (cold-rolled) to 19.43% IACS (500 °C), mainly due to dynamic recovery and Fe precipitation alleviating lattice distortion.

1. Introduction

As a metastable immiscible alloy, Cu–Fe alloy combines some advantages of Cu and Fe, endowing the alloy with excellent electrical conductivity and thermal conductivity as well as high strength, hardness, and wear resistance, along with low-cost advantages, making it widely applicable in electronics, machinery, transportation, and other industries [1,2,3,4,5]. Cu–Fe alloys can be categorized into low-Fe alloys (≤4 wt.% Fe) and high-Fe alloys (≥4 wt.% Fe) based on Fe content [6]. Currently, copper alloys with approximately 2% Fe (such as C19200 and C19400) have been widely used. Recent studies have shown that higher Fe content in Cu–Fe alloys enhances magnetic properties, enabling their use as electromagnetic shielding materials [7,8,9].
With the advent of 5G communication, the demand for high-Fe-content Cu–Fe alloy sheets and strips with electromagnetic shielding performance has grown significantly. The primary processing method for Cu–Fe alloy sheets and strips is rolling, mainly including hot rolling and cold rolling. Hot rolling is performed above the recrystallization temperature of the metal material, where high temperatures significantly improve plasticity, reduce deformation resistance, and eliminate some casting defects while refining grains. However, high temperatures also promote recrystallization and reduce work hardening [10], resulting in unstable properties as well as lower organizational uniformity and strength compared to cold-rolled materials. Thus, hot rolling is often used as an intermediate process to prepare materials for subsequent cold rolling or deep processing, such as the densification of powder metallurgy materials by Peng et al. [5]. In contrast to hot rolling, cold rolling involves plastic deformation at room temperature, producing strong grain refinement and work hardening effects. For Cu–Fe alloys, severe deformation of the Cu matrix induces partial dynamic recrystallization and partial re-dissolution of Fe atoms into the matrix [11,12], leading to high strength but low electrical conductivity. Wang et al. [13] demonstrated that a Cu–10Fe alloy after 98% cold rolling achieves a tensile strength of 543 MPa but an electrical conductivity of only 13.5% IACS. Ding et al. [14] reported that a Cu–10Fe–1.0Nb alloy subjected to 90% cold rolling exhibits a strength of 583 MPa and an electrical conductivity of 18% IACS. Post-cold-rolling aging treatment promotes Fe precipitation, improving electrical conductivity [15], and is thus typically applied after cold rolling. For instance, Yang et al. [16] observed that aging a cold-rolled Cu–2.18Fe–0.03P alloy increased electrical conductivity from 25.65% IACS to 59% IACS while reducing strength from 516 MPa to 344 MPa. These results indicate that aging improves electrical conductivity but reduces strength due to decreased dislocation density, making it challenging to achieve a good balance between strength and electrical conductivity in Cu–Fe alloys.
To address this challenge, researchers have explored multi-pass cold rolling and aging processes [4,17,18,19]. Wang et al. [17] applied a three-step cold rolling and aging process (90% CR–450 °C/5 h–50%CR–450 °C/5 h–50%CR–200 °C/330 min) to a Cu–10Fe alloy, achieving a tensile strength of 608 MPa and electrical conductivity of 58% IACS. This method generated Fe precipitates of varying sizes (20–150 nm) surrounded by high-density dislocations, enhancing both electrical conductivity (via precipitation strengthening of 70 MPa) and strength (via strain strengthening of 91 MPa and subgrain strengthening of 350 MPa). However, the multi-step process is time- and energy-intensive, increasing costs and reducing efficiency. Warm rolling [20,21,22] has been proposed as an alternative to simplify the process while maintaining a balance between strength and electrical conductivity. For example, Xu et al. [22] demonstrated that warm rolling Cu–10Fe at 400 °C yielded a tensile strength of 446 MPa and electrical conductivity of 40% IACS, approaching the strength of cold-rolled samples (471 MPa) while surpassing their electrical conductivity (28% IACS), achieving a better strength–electrical conductivity balance. Although extensive studies have focused on the interaction between Fe phases and the matrix, as well as microstructural evolution during cold deformation of Cu–Fe alloys, research on warm rolling temperatures for Cu–10Fe alloys and the correlation between microstructure and properties under warm rolling remains limited.
This study systematically investigates the influence of rolling temperature (from cold rolling to 500 °C) on the microstructure and properties of Cu–10Fe alloys. It elucidates the microstructural evolution, mechanical properties, and electrical performance under different rolling temperatures, and highlights the strong impact of Cu–10Fe alloy texture on mechanical properties and electrical conductivity. This study systematically elucidates the rolling temperature parameters, microstructural evolution mechanisms, and performance regulation principles of Cu–Fe alloys, effectively filling gaps in warm-rolling theory and providing novel perspectives for subsequent research on Cu–Fe alloys.

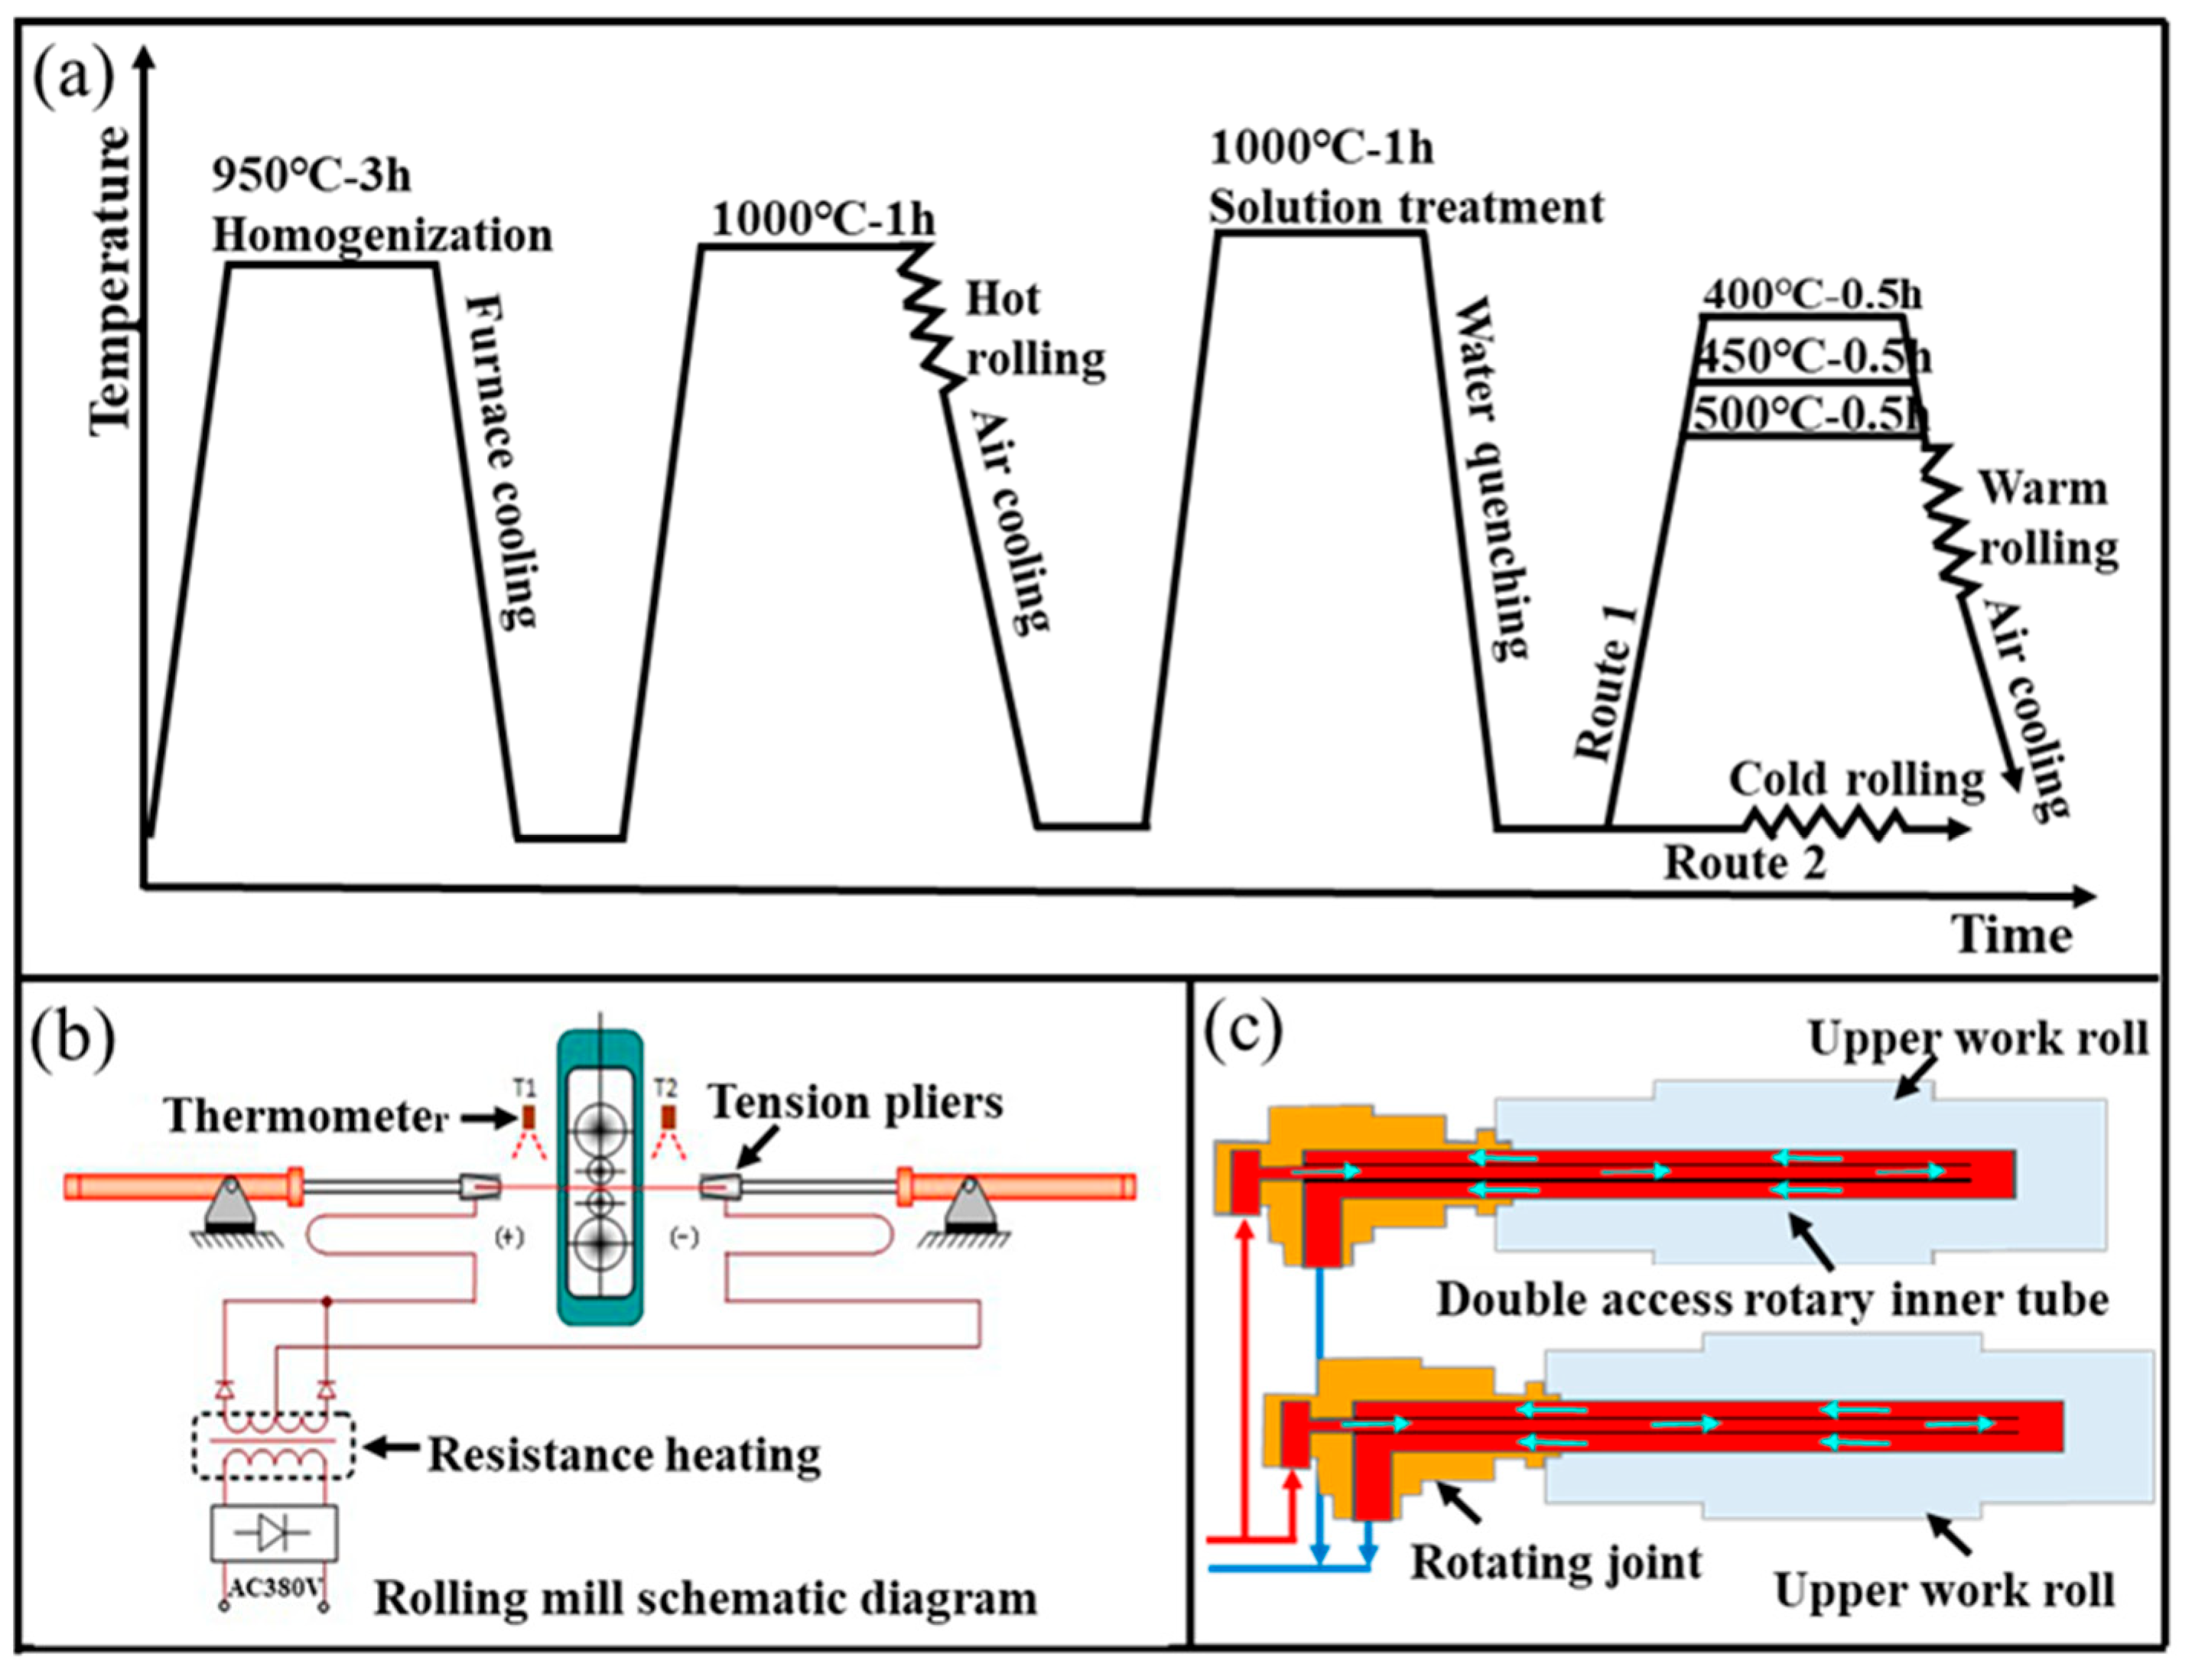
2. Experimental Process and Method

Cu–10Fe alloy ingots (diameter 90 mm, height 110 mm) were prepared by melting pure copper (99.99 wt.%) and Cu–Fe master alloy (50 wt.% Fe) in a vacuum melting furnace. The ingot was first homogenized at 950 °C for 3 h under a nitrogen atmosphere. Subsequently, it was heated to 1000 °C for hot rolling, followed by annealing at 1000 °C for 1 h. Surface treatment (the main purpose of acid washing treatment is to remove the oxide layer and avoid the embedding of oxides into the plate during subsequent hot rolling) was then performed to obtain rolled experimental samples with a thickness of 2 mm. These samples were reheated in a furnace and subjected to warm rolling at 400 °C, 450 °C, and 500 °C with a 50% reduction (final thickness: 1 mm), using cold-rolled samples as controls. The detailed process is illustrated in Figure 1a. To ensure temperature accuracy during warm rolling and minimize heat loss during contact with rolls, heated oil circulation was employed to maintain roll the surface temperature at 200 °C. The rolling mill setup and roll heating system are shown in Figure 1b,c. After mechanical polishing, microstructural characterization was conducted using an OLYMPUS optical microscope (OM, Olympus BX53M, Leica, Wetzlar, Germany) and field-emission electron probe microanalyzer (EPMA, JXA-8530F, JEOL, Tokyo, Japan), Argon ion-polished samples were analyzed via EBSD with a SYMMETRY S2 detector (EBSD, Symmetry S2, Oxford instruments, Abingdon, UK) in SEM. Electrical conductivity was measured using a ZY9987 digital micro-ohmmeter (Shanghai Zhengyang Instrument Factory, Shanghai, China), with results averaged from multiple tests (sample dimensions: 30 mm long × 10 mm wide × 1 mm thick). Tensile strength was evaluated on a CMT5105 electronic universal testing machine (SHIMADZU, Kyoto, Japan) at a strain rate of 1 × 10⁻² s−1 (specimen gauge dimensions: 15 mm long × 3.5 mm wide ×1 mm thick), with three repeated tests averaged for final results.

3. Results

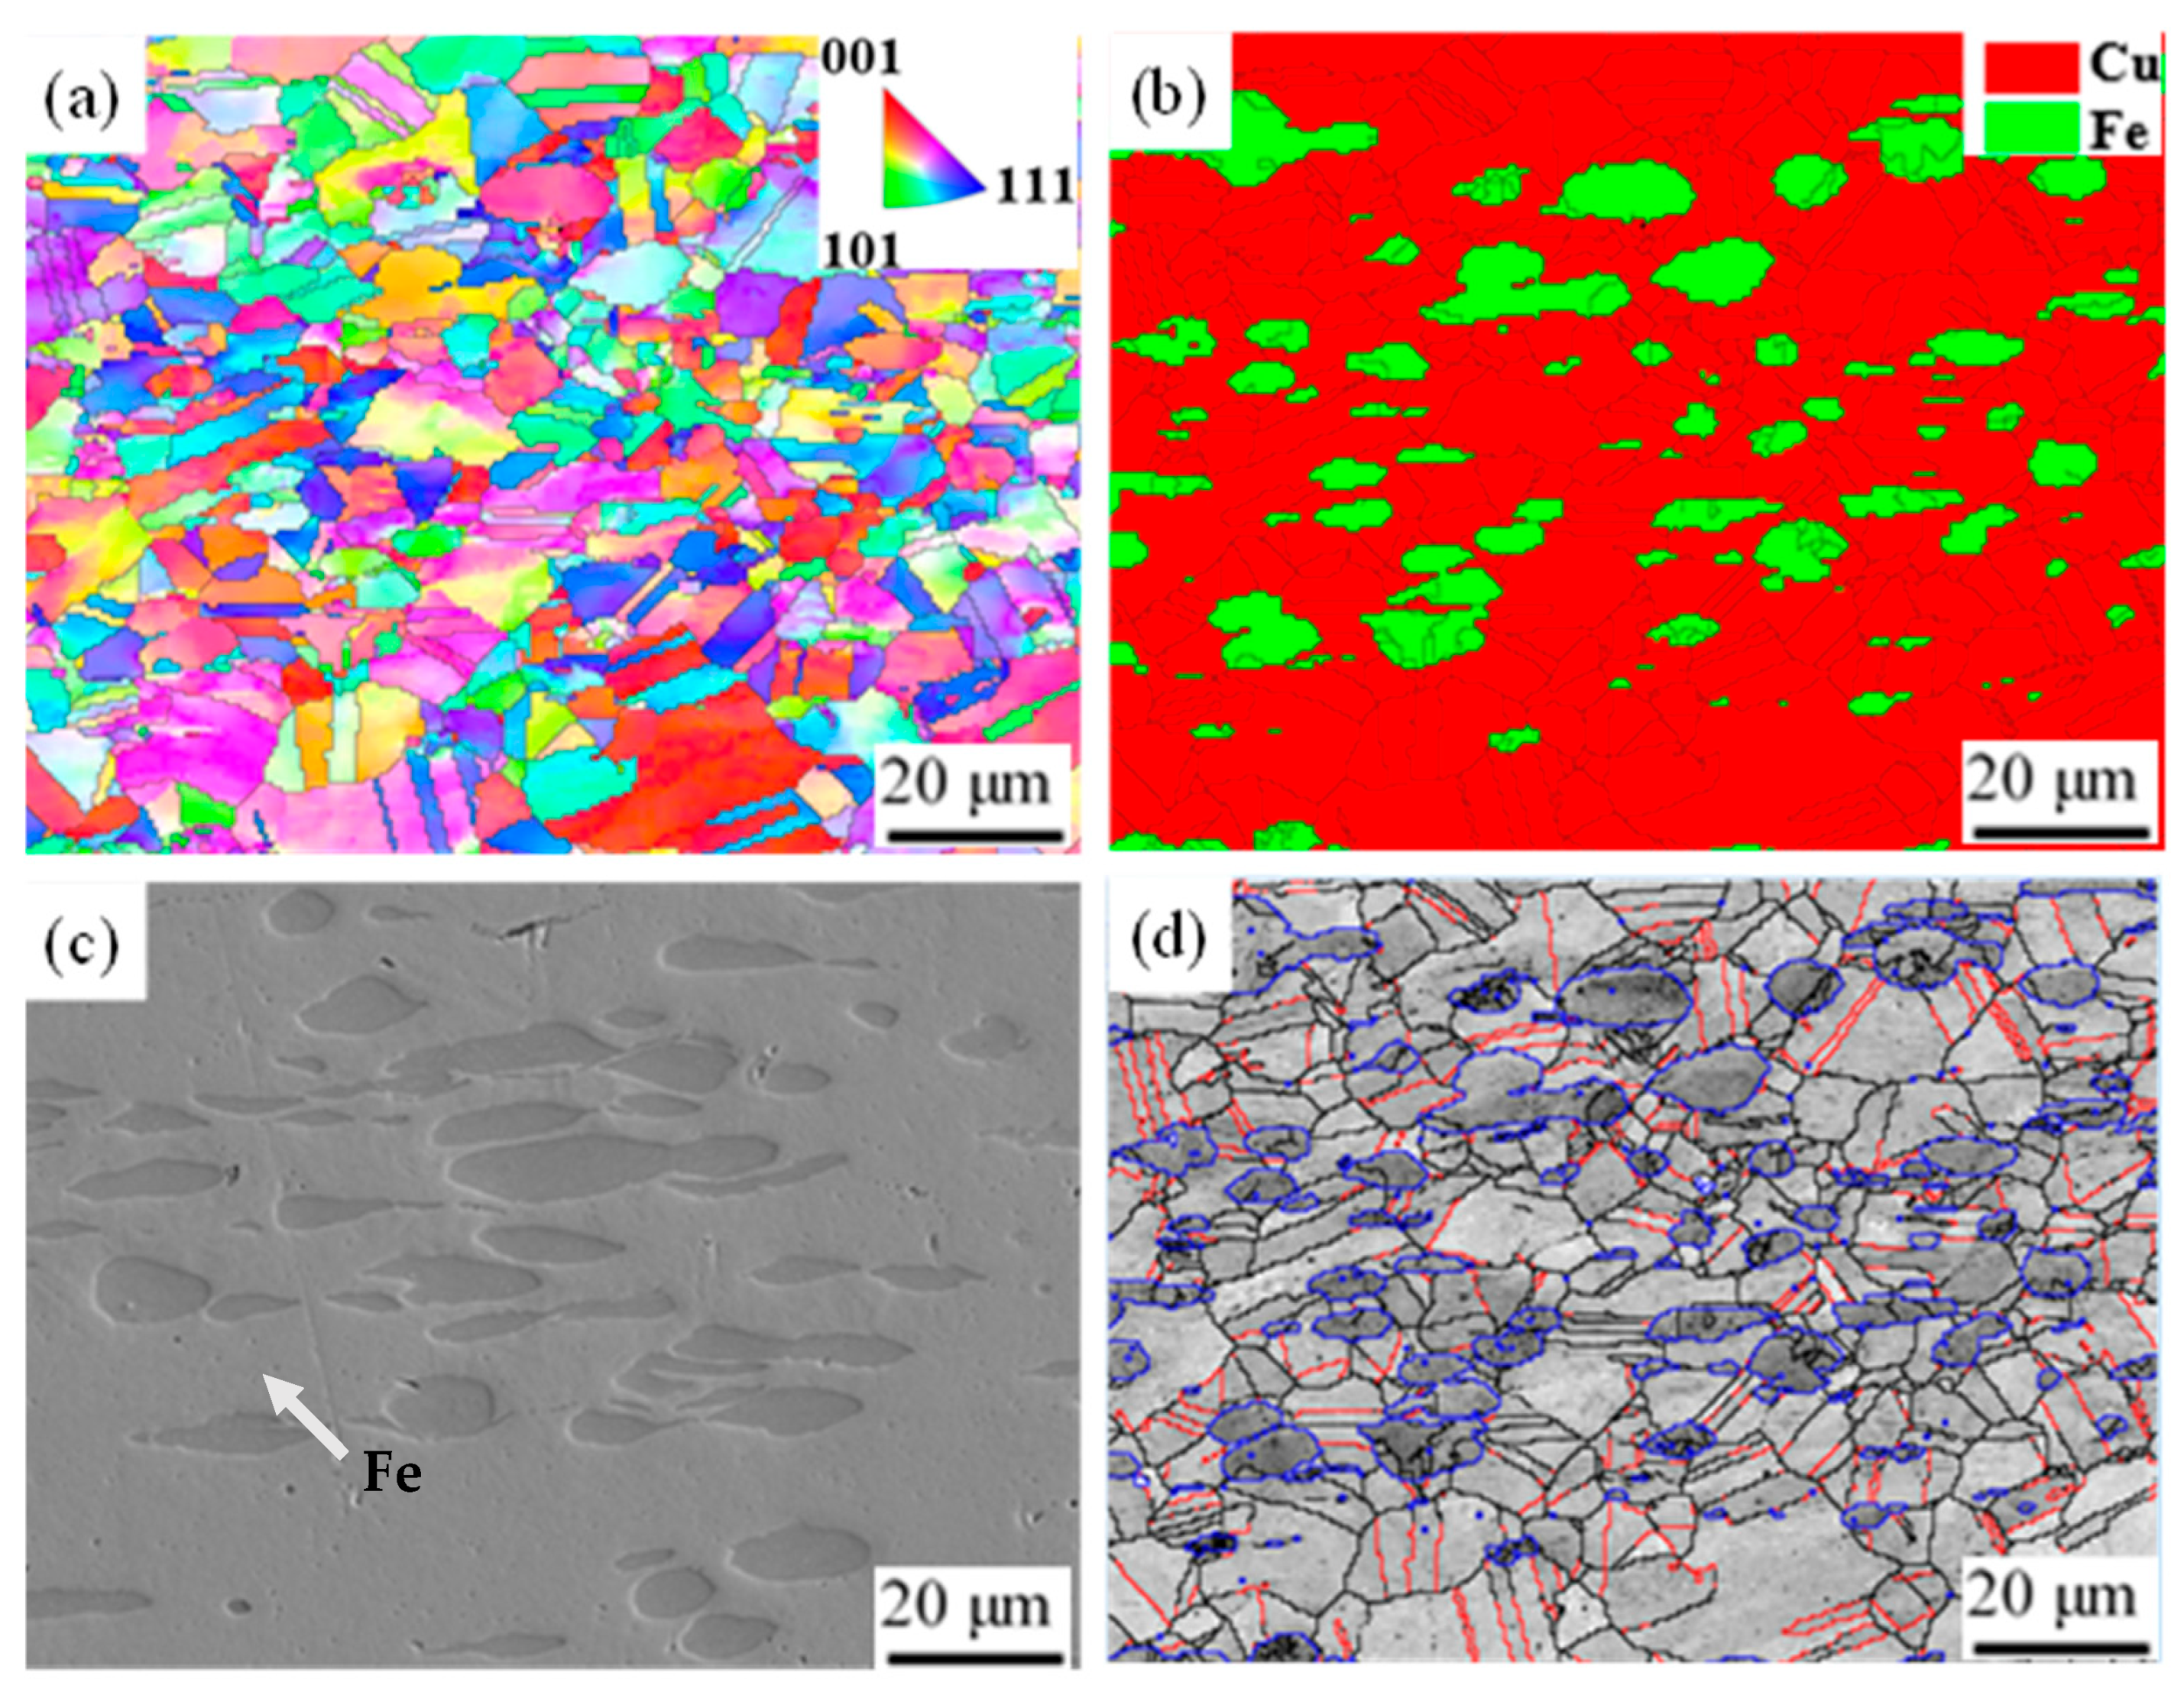
3.1. Pre-Rolling Microstructure of Cu–10Fe Alloy

Figure 2 shows the pre-rolling microstructure of the Cu–10Fe alloy. Figure 2a presents the inverse pole figure (IPF) map of the Cu–10Fe alloy. It can be observed from the figure that the grain morphology is primarily composed of equiaxed grains and annealing twins. Through phase distribution maps (EBSD maps and SEM morphology, as shown in Figure 2b,c), it is revealed that Fe-rich grains are dispersed within the Cu matrix [23]. According to EBSD grain size calculations, the average size of Fe grains is 2.13 μm, the average size of Cu grains is 2.81 μm, and the overall average grain size is 2.63 μm. In the figure, a large number of plate-like twins can be observed within the Cu grains. Analysis of the grain boundaries indicates that most twin boundaries are Σ3 boundaries, as shown in Figure 2d. These boundaries are formed by a 60° rotation around the <111> axis of the grain, exhibiting a stable structure. During the rolling process, they can be treated as grain boundaries [24]. Texture analysis of Fe and Cu elements in the sample shows that the maximum texture intensities on the (001), (101), and (111) planes are 2.05 and 2.42 (As shown in Figure 3), respectively, indicating a relatively diffuse texture distribution.

3.2. Microstructure and Properties of Rolled Cu–10Fe Alloy

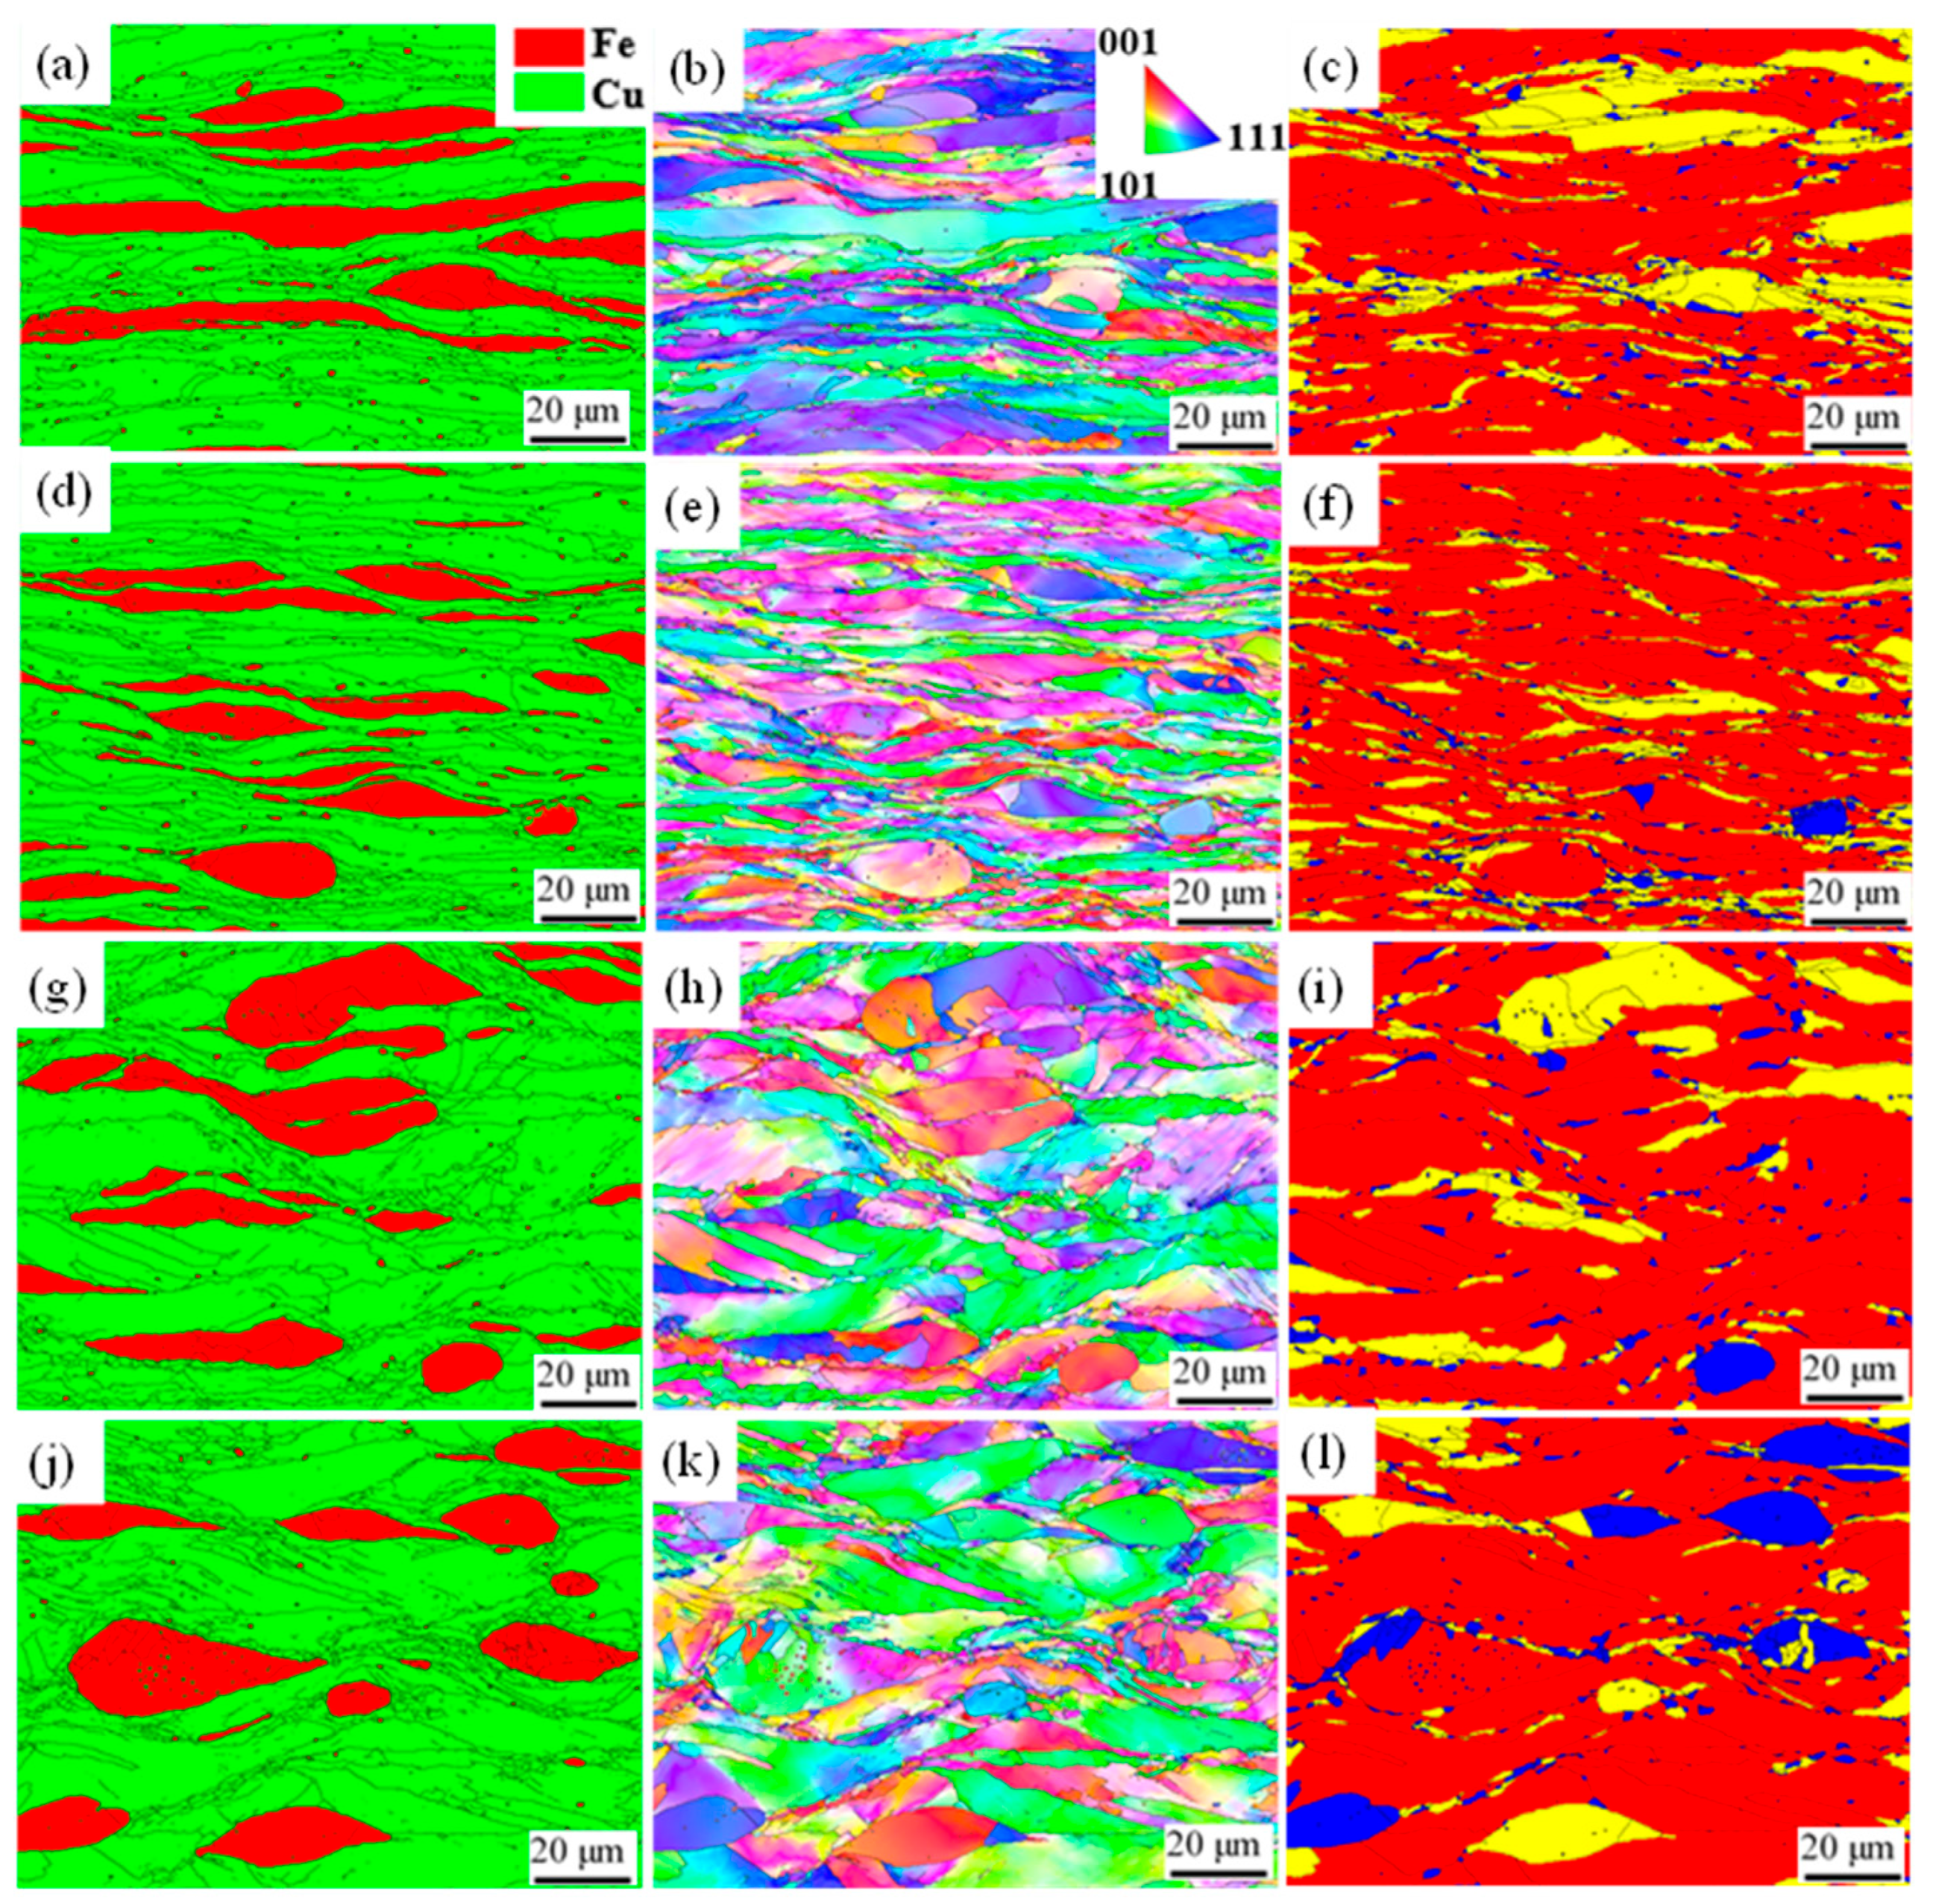
3.2.1. Microstructural Morphology of Rolled Cu–10Fe Alloy

Figure 4 shows the SEM images of Cu–10Fe alloy under cold rolling, 400 °C, 450 °C, and 500 °C rolling conditions, where the darker regions correspond to the Fe phase. When the Cu–10Fe alloy is cold-rolled, the Fe phases deform along the rolling direction, with most grains transforming into elongated fibrous structures, while a minor fraction exhibits an ellipsoidal morphology, as shown in Figure 4a. With increasing temperature (the temperature is increased by 400 °C or 450 °C from room temperature), the deformation degree of Fe grains decreases, resulting in a reduction in fibrous Fe grains and a significant increase in spherical or ellipsoidal Fe grains. When the temperature rises to 500 °C, as shown in Figure 4a, the deformation degree of Fe grains in the Cu–10Fe alloy further decreases, the number of fibrous Fe phases continues to diminish, and the Fe phase primarily exists in spherical or ellipsoidal forms.
Figure 5 presents the EBSD analysis maps of rolled Cu–10Fe alloy. As shown in Figure 5, the Fe grains in the sample gradually evolve from elongated fibrous shapes to spindle-like or spherical forms with increasing rolling temperature. The phase distribution maps indicate that the cold-rolled and low-temperature samples contain fewer Cu grains within Fe grains, while the 500 °C sample shows fine Cu grains inside Fe grains. By comparing the recrystallization results (Figure 6c,f,i,l), it is confirmed that the Cu grains within Fe are recrystallized grains. With increasing rolling temperature (as shown in Figure 6), the grain size undergoes significant changes: in the cold-rolled sample, the average grain size of Cu is 1.43 μm, Fe is 1.61 μm, and the overall average grain size is 1.46 μm. After 400 °C rolling, the Cu grain size is 1.32 μm, Fe is 1.26 μm, and the overall average grain size is 1.31 μm. As the temperature increases further, both Cu and Fe grain sizes grow, with the overall average size rising to 1.89 μm. However, at 500 °C, the Cu average grain size decreases to 1.82 μm, Fe to 1.56 μm, and the overall average grain size drops to 1.75 μm. Therefore, below the recrystallization temperature, grain refinement is predominantly governed by deformation, leading to a dislocation multiplication rate that far exceeds the dynamic recovery rate, thereby inducing microstructural refinement; above the recrystallization temperature, the alloy possesses sufficient driving force to trigger recrystallization in partially deformed grains, resulting in grain coarsening.
Analysis of grain orientation spread (GOS) values reveals that the rolled samples primarily consist of deformed grains [25]. At 400 °C, recrystallized grains are small in size. With increasing temperature, recrystallized grains gradually grow, and in the 500 °C sample, recrystallized grains (up to 5 μm) are distributed at grain boundaries and within Fe grains. Nevertheless, the majority of grains remain deformed, with a recrystallization rate of 11.9%.

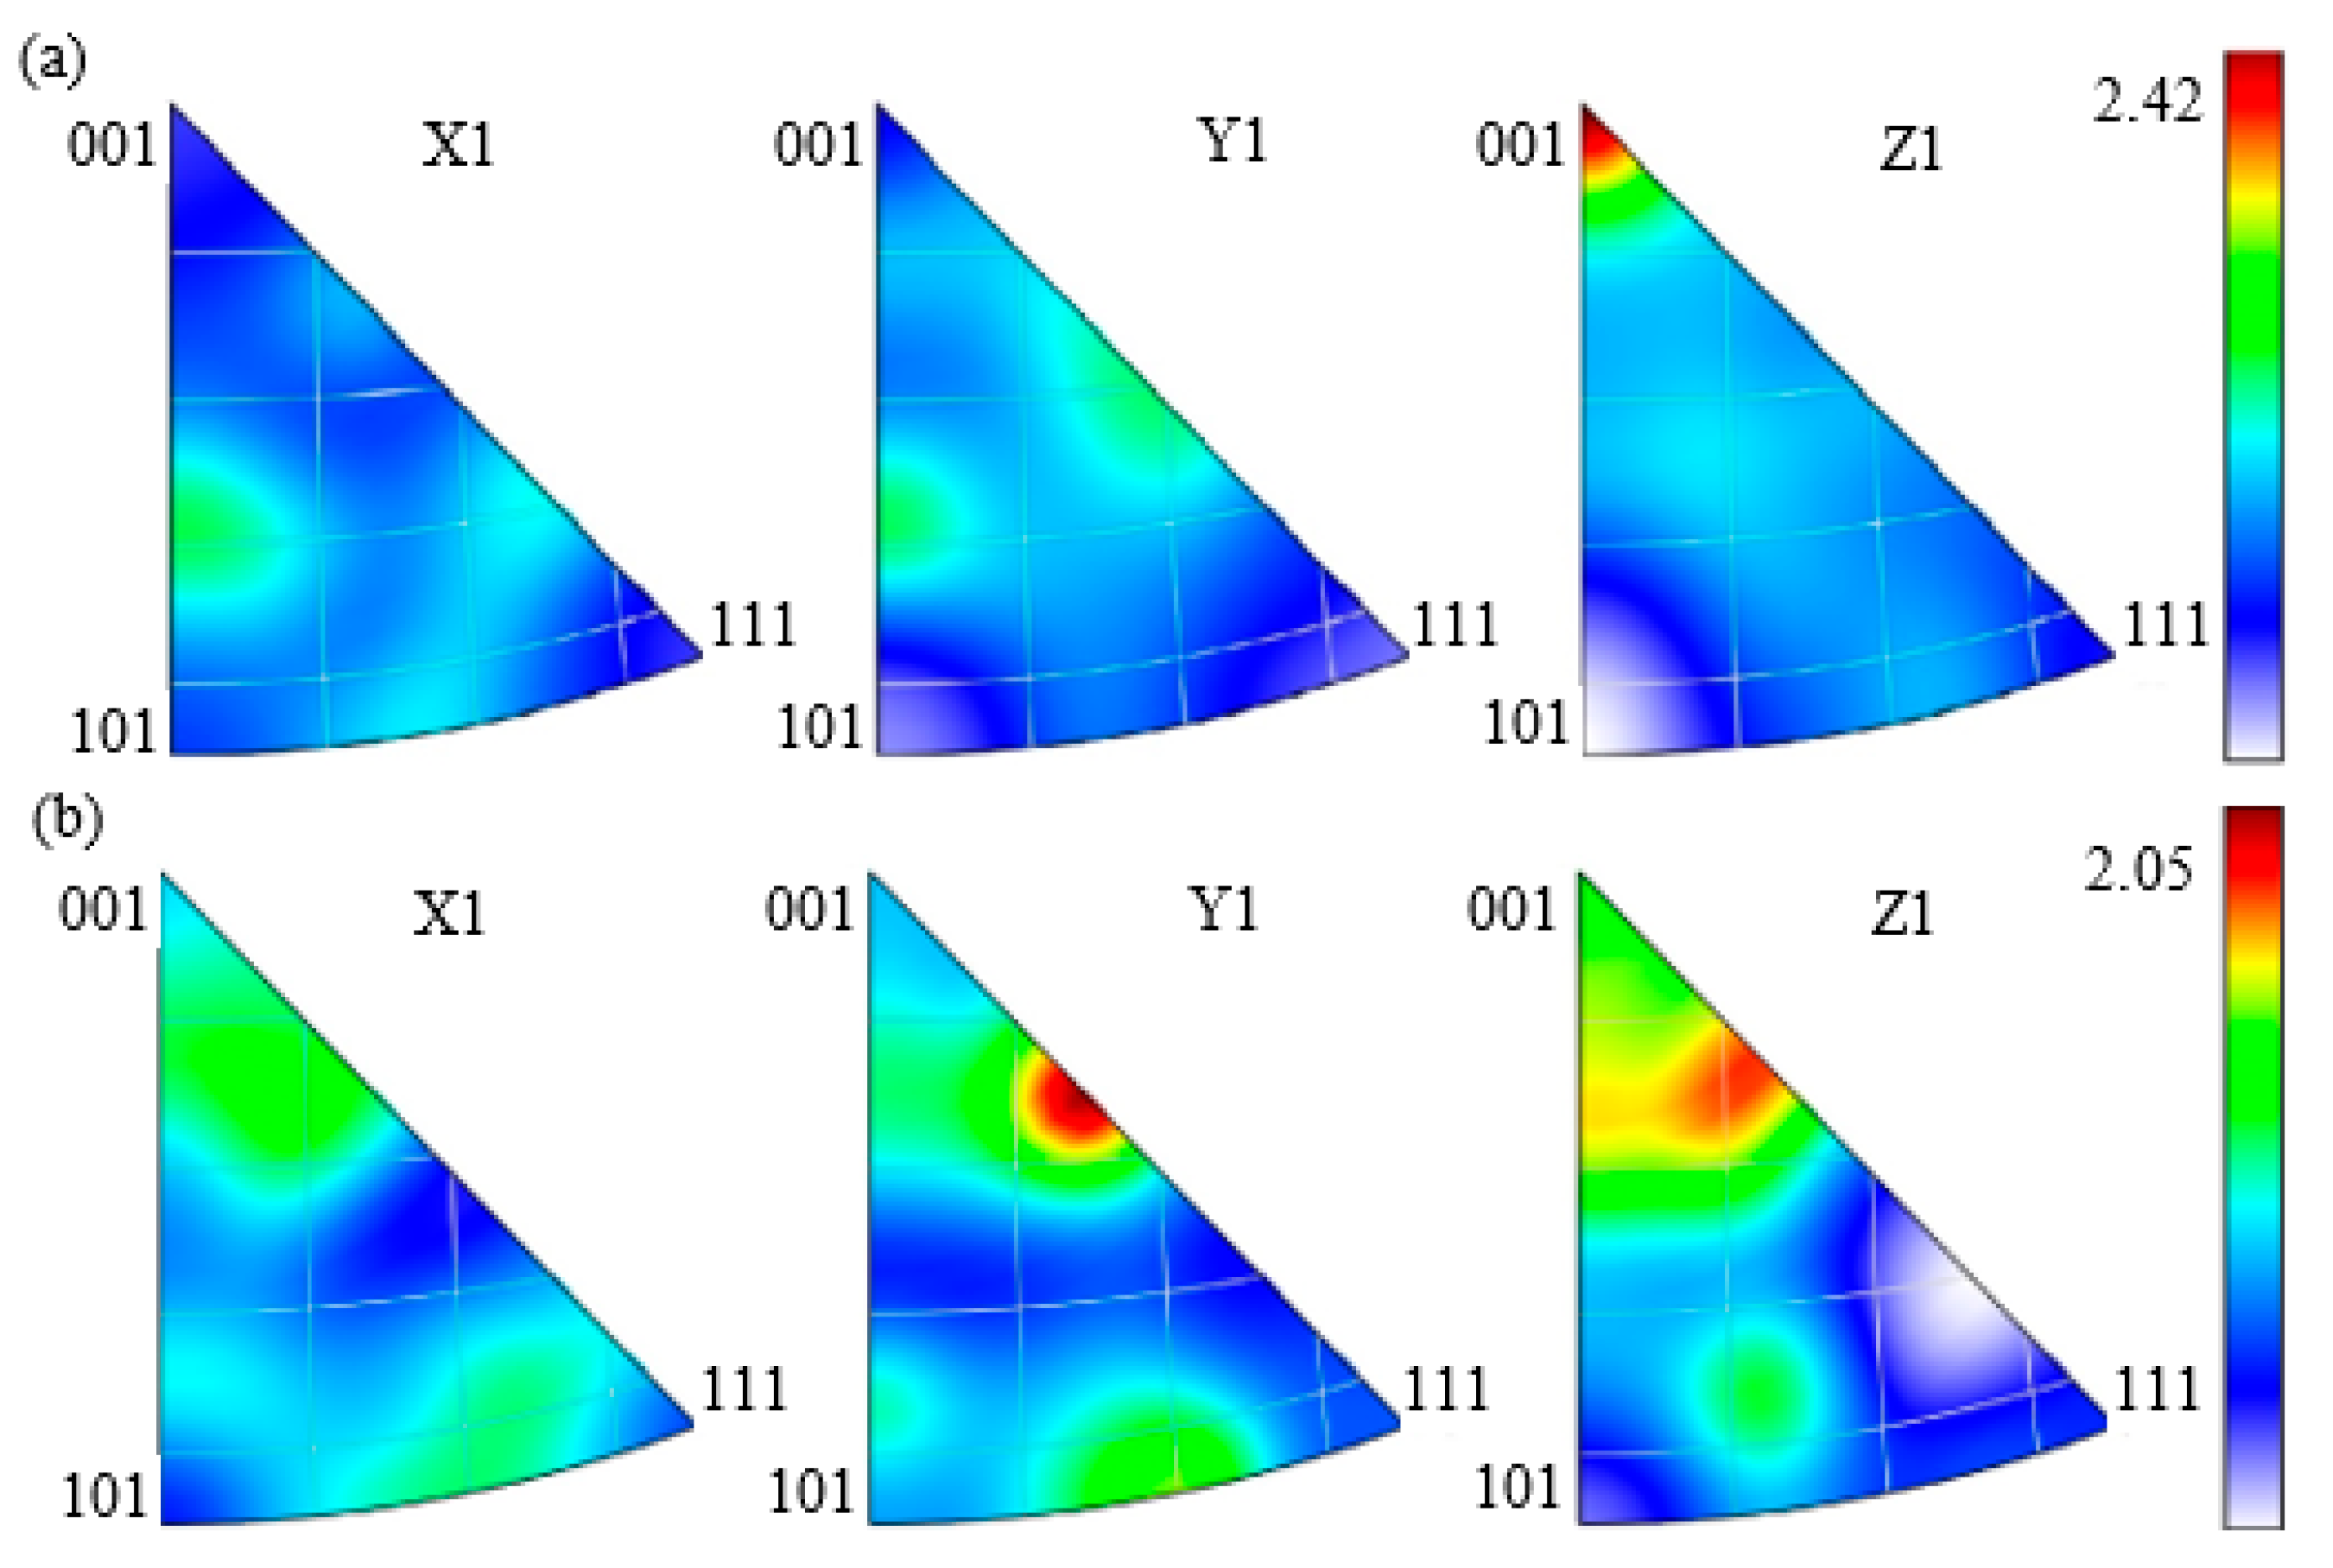
3.2.2. Texture Changes of Rolled Cu–10Fe Alloy

As shown in Figure 7, ODF analysis of the rolled Cu–10Fe samples was performed at φ2 angles of 0°, 45°, and 63°. In the cold-rolled sample, a distinct Brass-R texture {025} <100> was observed with a texture strength of 2.45. During warm rolling at 400 °C, the Brass-R texture {025} <100> deviated toward the Goss texture {011} <100>, achieving a strength of 6.9. In the φ2 = 45° ODF map, a prominent Copper texture {112} <111> was identified with a strength of 8.6, along with a significant R texture {124} <211> of the same strength (8.6). With a further temperature increase to 450 °C, the Brass-R and Goss textures disappeared, replaced by a Brass texture {011} <211> with a strength of 13.82. The Copper texture {112} <111> exhibited a deviation and increased strength to 13.18, while the R texture {124} <211> shifted toward the S texture {123} <634> with enhanced strength. At 500 °C, the Brass-R texture reappeared with reduced strength. The Brass texture {011} <211> reached its highest strength of 14.58, while the Copper texture weakened. Both R and S textures declined to strengths below 5.

3.2.3. Properties Changes of Rolled Cu–10Fe Alloy

Figure 8 displays the variations in tensile properties and electrical conductivity of Cu–10Fe alloy under cold rolling and warm rolling at 400 °C, 450 °C, and 500 °C. The tensile strength of the cold-rolled Cu–10Fe alloy is 443 MPa. As the rolling temperature increases, the tensile strength gradually rises, reaching 449 MPa at 400 °C, 456 MPa at 450 °C, and 472 MPa at 500 °C. Concurrently, the elongation significantly improves with temperature. The cold-rolled sample exhibits an elongation of only 1.96%, accompanied by brittle fracture. The 400 °C sample shows an elongation of 4.23%, still categorized as brittle fracture (less than 5%). At 450 °C and 500 °C, the elongation increases to 7.03% and 9.21%, respectively. The electrical conductivity of the cold-rolled Cu–10Fe alloy is 10.09% IACS. When warm-rolled at 400 °C, the electrical conductivity increases to 12.86% IACS. Further elevating the temperature to 500 °C results in an electrical conductivity of 19.43% IACS.

4. Discussion

4.1. Influence of Microstructure on Mechanical and Electrical Properties

As shown in Figure 4 and Figure 5, Fe and Cu grains exhibit distinct morphologies after rolling at different temperatures. In cold-rolled and 400 °C–rolled samples, Fe grains are unevenly distributed and elongated, with high stacking fault energy and relatively narrow extended dislocations, which hinder dislocation climb [26,27]. During tensile deformation, this leads to dislocation pileups, tangles, and stress concentration, initiating cracks and resulting in low elongation. As illustrated in Figure 9, the samples contain abundant dislocations (GND [28]), particularly at Fe–Cu grain boundaries. These high-density dislocations experience differing deformation resistance compared to low-density regions [29], causing localized internal deformation, crack nucleation, and further degradation of mechanical properties. At rolling temperatures of 450 °C and 500 °C, the dislocation density decreases significantly due to dynamic recovery during rolling. Lower dislocation density enhances elongation. Additionally, fine recrystallized grains are observed within Cu grains at Fe–Cu phase boundaries, forming a typical bimodal grain structure [30,31], as shown in Figure 10. During tensile deformation, fine recrystallized grains coordinate strain, while larger grains contribute to strain hardening, improving both strength and elongation.
During the rolling process, a large number of dislocations are generated within both Fe and Cu grains. In cold-rolled and 400 °C–rolled samples, the high dislocation density causes severe lattice distortion in the Cu matrix, which impedes electron migration and leads to a significant decline in electrical conductivity [32]. Additionally, Fe atoms exhibit a certain solid solubility in the matrix. The scattering and obstruction of electron migration by these solid-solution atoms further reduce electrical conductivity [33]. In the Fe phase, Fe grains possess an FCC structure with inherent magnetic properties. Under electric current, the Fe phase becomes magnetized. When migrating electrons pass through these magnetized α-Fe grains, scattering and obstruction occur [34], resulting in reduced electrical conductivity of the alloy.
In samples rolled at 450 °C and 500 °C, the increase in rolling temperature is equivalent to annealing heat treatment at these temperatures. Recovery processes occur in both the Cu matrix and Fe grains, reducing dislocation density. Due to the increased recrystallization rate, some Fe atoms and impurity atoms dissolved in the Cu matrix precipitate to grain boundaries, alleviating lattice distortion in the Cu matrix and thereby improving the alloy’s electrical conductivity.

4.2. The Influence of Texture on Mechanical and Electrical Properties

During the rolling and subsequent heat treatment of Cu–10Fe alloy, texture evolution significantly affects its mechanical properties (e.g., strength, plasticity, anisotropy). In the cold-rolled state, the sample primarily forms Brass-R texture {025} <100> with an intensity of 2.45, indicating that dislocation slip dominates the deformation process, leading to high dislocation density and work hardening effects, which significantly reduce plasticity [35]. As the rolling temperature increases to 400 °C, Brass-R texture gradually shifts toward Goss texture {011} <100> (intensity 6.9), accompanied by strong Copper texture {112} <111> (intensity 8.6) and R texture {124} <211> (intensity 8.6), similar to the texture evolution of magnesium alloys [36]. The formation of Goss texture promotes the activation of the {111} slip system, improving the alloy’s plastic deformation capability. Meanwhile, the strengthening of Copper texture suggests the onset of dynamic recovery or partial recrystallization, which coordinates deformation, reduces stress concentration, and enhances ductility while maintaining strength [37].
When the temperature further rises to 450 °C, Brass-R and Goss textures disappear, Brass texture {011} <211> strengthens significantly (intensity 13.82), Copper texture intensity increases to 13.18, and R texture transitions to S texture {123} <634> [38]. The enhanced Brass texture is typically associated with shear band formation, potentially causing localized strain concentration [39] and reducing plasticity while retaining high strength. Conversely, the further strengthening of Copper texture promotes uniform deformation. The combined effects of these textures improve elongation. At 500 °C, Brass texture continues to strengthen (intensity 14.58), but the intensities of Copper and S textures decrease, indicating increased recrystallization and grain coarsening, which may reduce texture strength while improving plasticity. Overall, the impact of texture evolution on mechanical properties is summarized as follows: (1) a cold-rolled state dominated by Brass-R texture enhances strength but reduces plasticity; (2) at 400–450 °C warm rolling, synergistic effects of Goss, Copper, and Brass textures optimize strength–ductility balance; and (3) at 500 °C, recrystallization dominates, retaining Brass texture but weakening Copper texture, improving both strength and plasticity.
Electrical conductivity is primarily influenced by electron-scattering mechanisms, and texture evolution directly affects electron transport efficiency by altering grain boundary distribution, dislocation density, and crystallographic orientation. In the cold-rolled state, the strong Brass-R texture {025} <100> leads to high dislocation density and severe lattice distortion, which intensifies electron scattering and reduces electrical conductivity. Additionally, the strong anisotropic texture formed during cold rolling [40] may cause uneven current transmission efficiency along different crystallographic directions, further degrading electrical conductivity. At a 400 °C rolling temperature, Brass-R texture transitions to Goss texture {011} <100>, while Copper texture {112} <111> and R texture {124} <211> strengthen. The formation of Goss texture is accompanied by partial recrystallization or recovery [41], reducing the dislocation density and electron scattering, thereby partially restoring electrical conductivity. However, the high intensities of Copper and R textures (8.6) maintain strong electron scattering at grain boundaries and substructures, limiting electrical conductivity improvement.
At 450 °C, Brass texture {011} <211> and Copper texture {112} <111> reach peak intensities (13.82 and 13.18), indicating that dynamic recrystallization has not fully eliminated deformation textures, and dislocation density remains high, keeping electrical conductivity at a low level. However, the transition of R texture to S texture {123} <634> suggests a shift from planar slip to multi-slip deformation mechanisms, which may homogenize the grain boundary distribution [42] and reduce localized electron scattering. At 500 °C, Brass texture intensity further increases (14.58), while Copper and S texture intensities decline, signifying near-complete recrystallization, grain coarsening, and significant dislocation density reduction, which drastically lowers electron scattering and markedly improves electrical conductivity. Nevertheless, the retained high-intensity Brass texture may still negatively affect electrical conductivity due to anisotropy. Overall, the influence of texture on electrical conductivity is summarized as follows: (1) a cold-rolled state with a high dislocation density and Brass-R texture severely reduces electrical conductivity; (2) at 400–450 °C warm rolling, partial recrystallization slightly restores electrical conductivity, but strong textures limit improvement; and (3) at 500 °C, increased recrystallized grains and reduced dislocation density significantly enhance electrical conductivity.

5. Conclusions

This study systematically investigates the influence of rolling temperature (from cold rolling to 500 °C) on the microstructure and properties of Cu–10Fe alloy. The main conclusions are as follows:
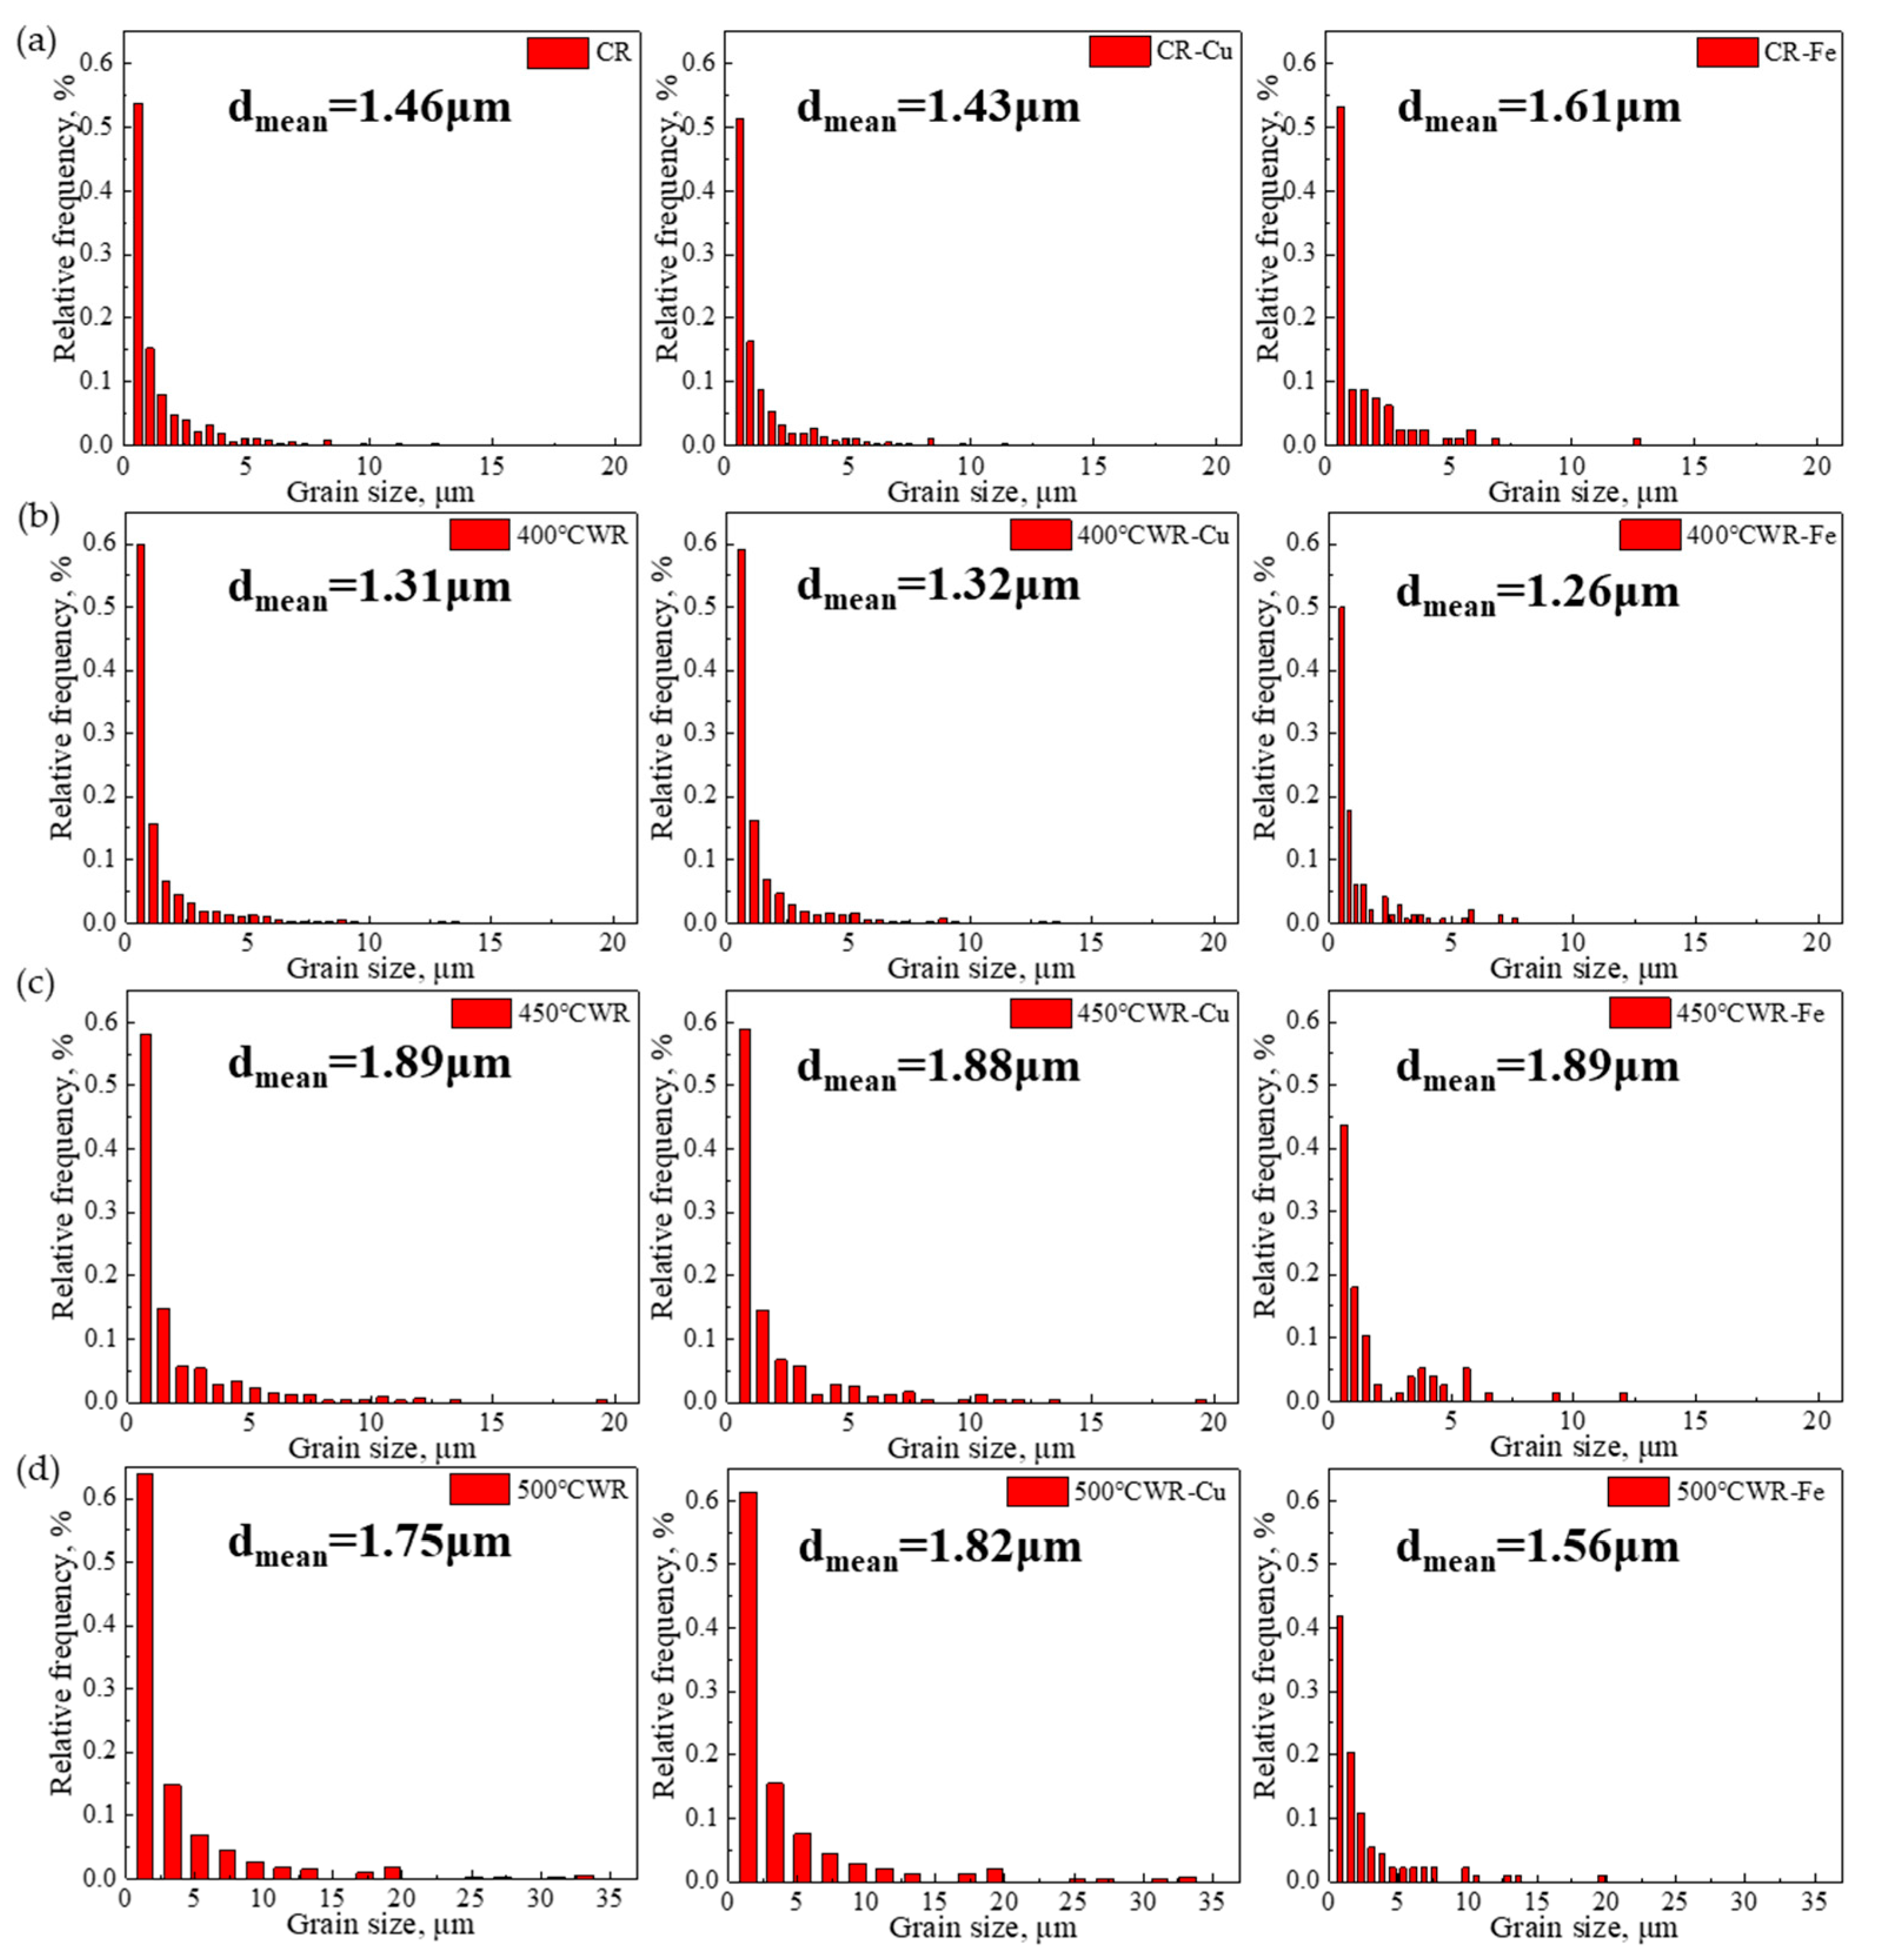
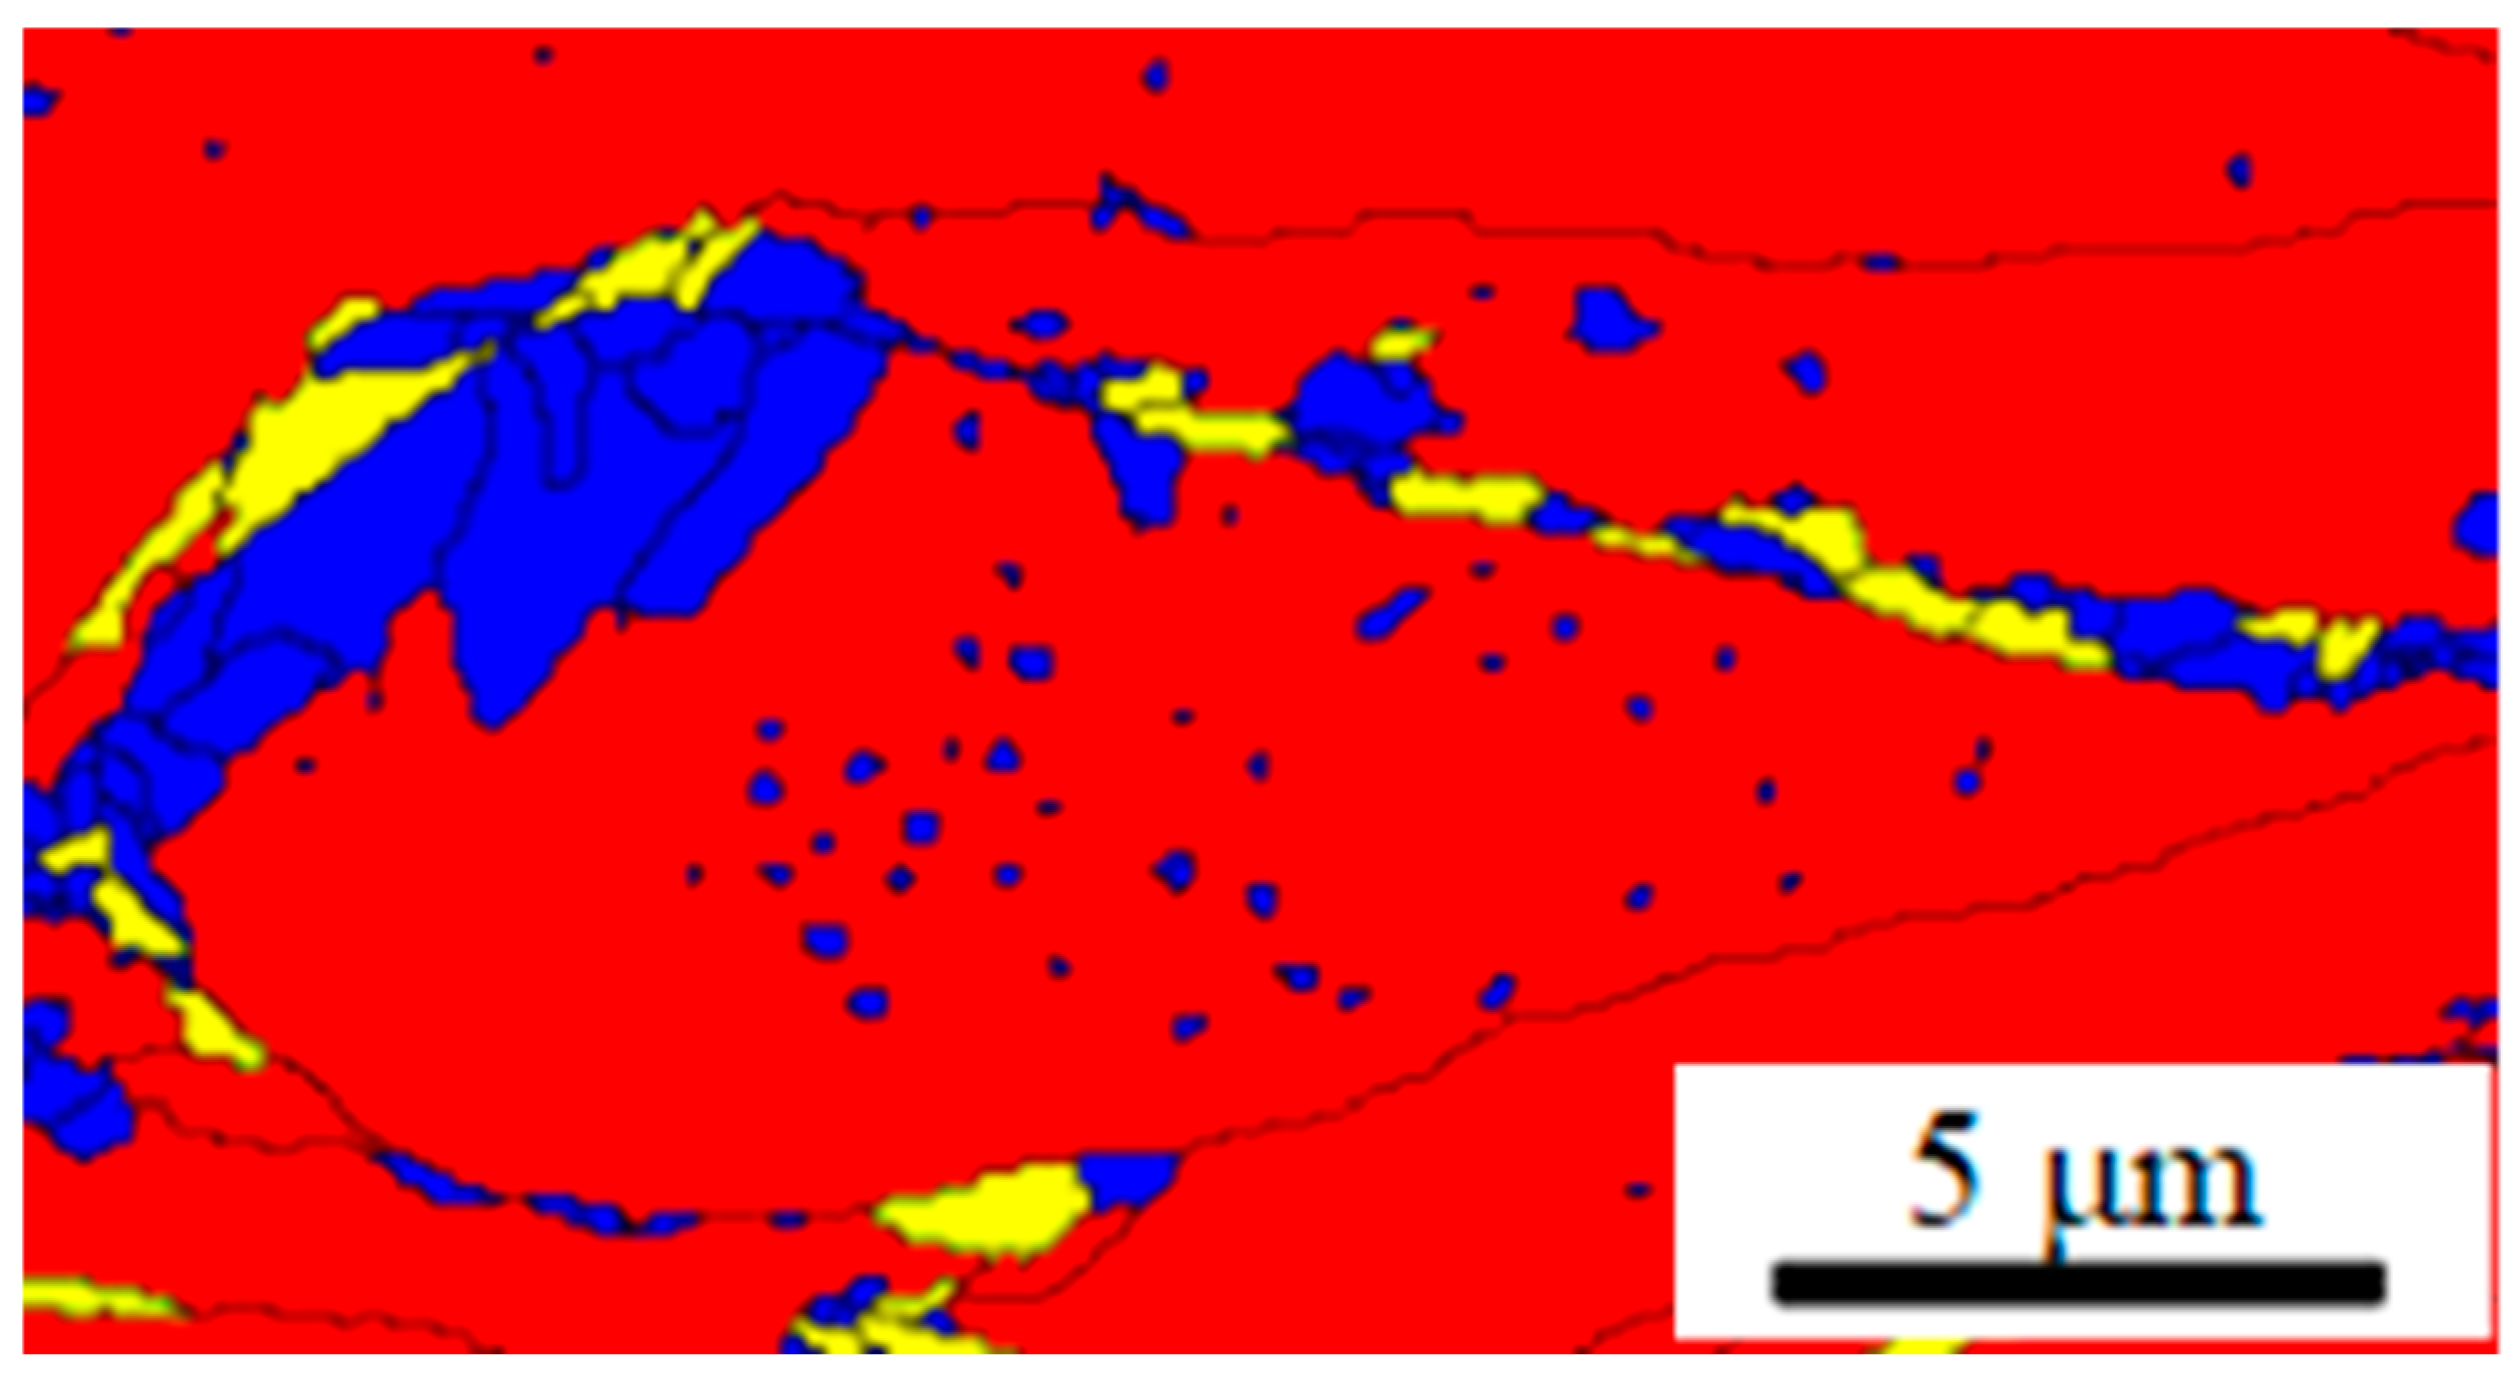
  • With increasing rolling temperature (cold rolling → 500 °C), the Fe phase transitions from a fibrous to spherical/ellipsoidal morphology, while the Cu grain size initially decreases and then increases. At 500 °C, recrystallized Cu grains appear within Fe grains, with a recrystallization rate of only 11.9%, but dynamic recovery significantly reduces the dislocation density, forming a bimodal grain structure (fine recrystallized grains coordinate deformation, while larger grains strengthen the material).
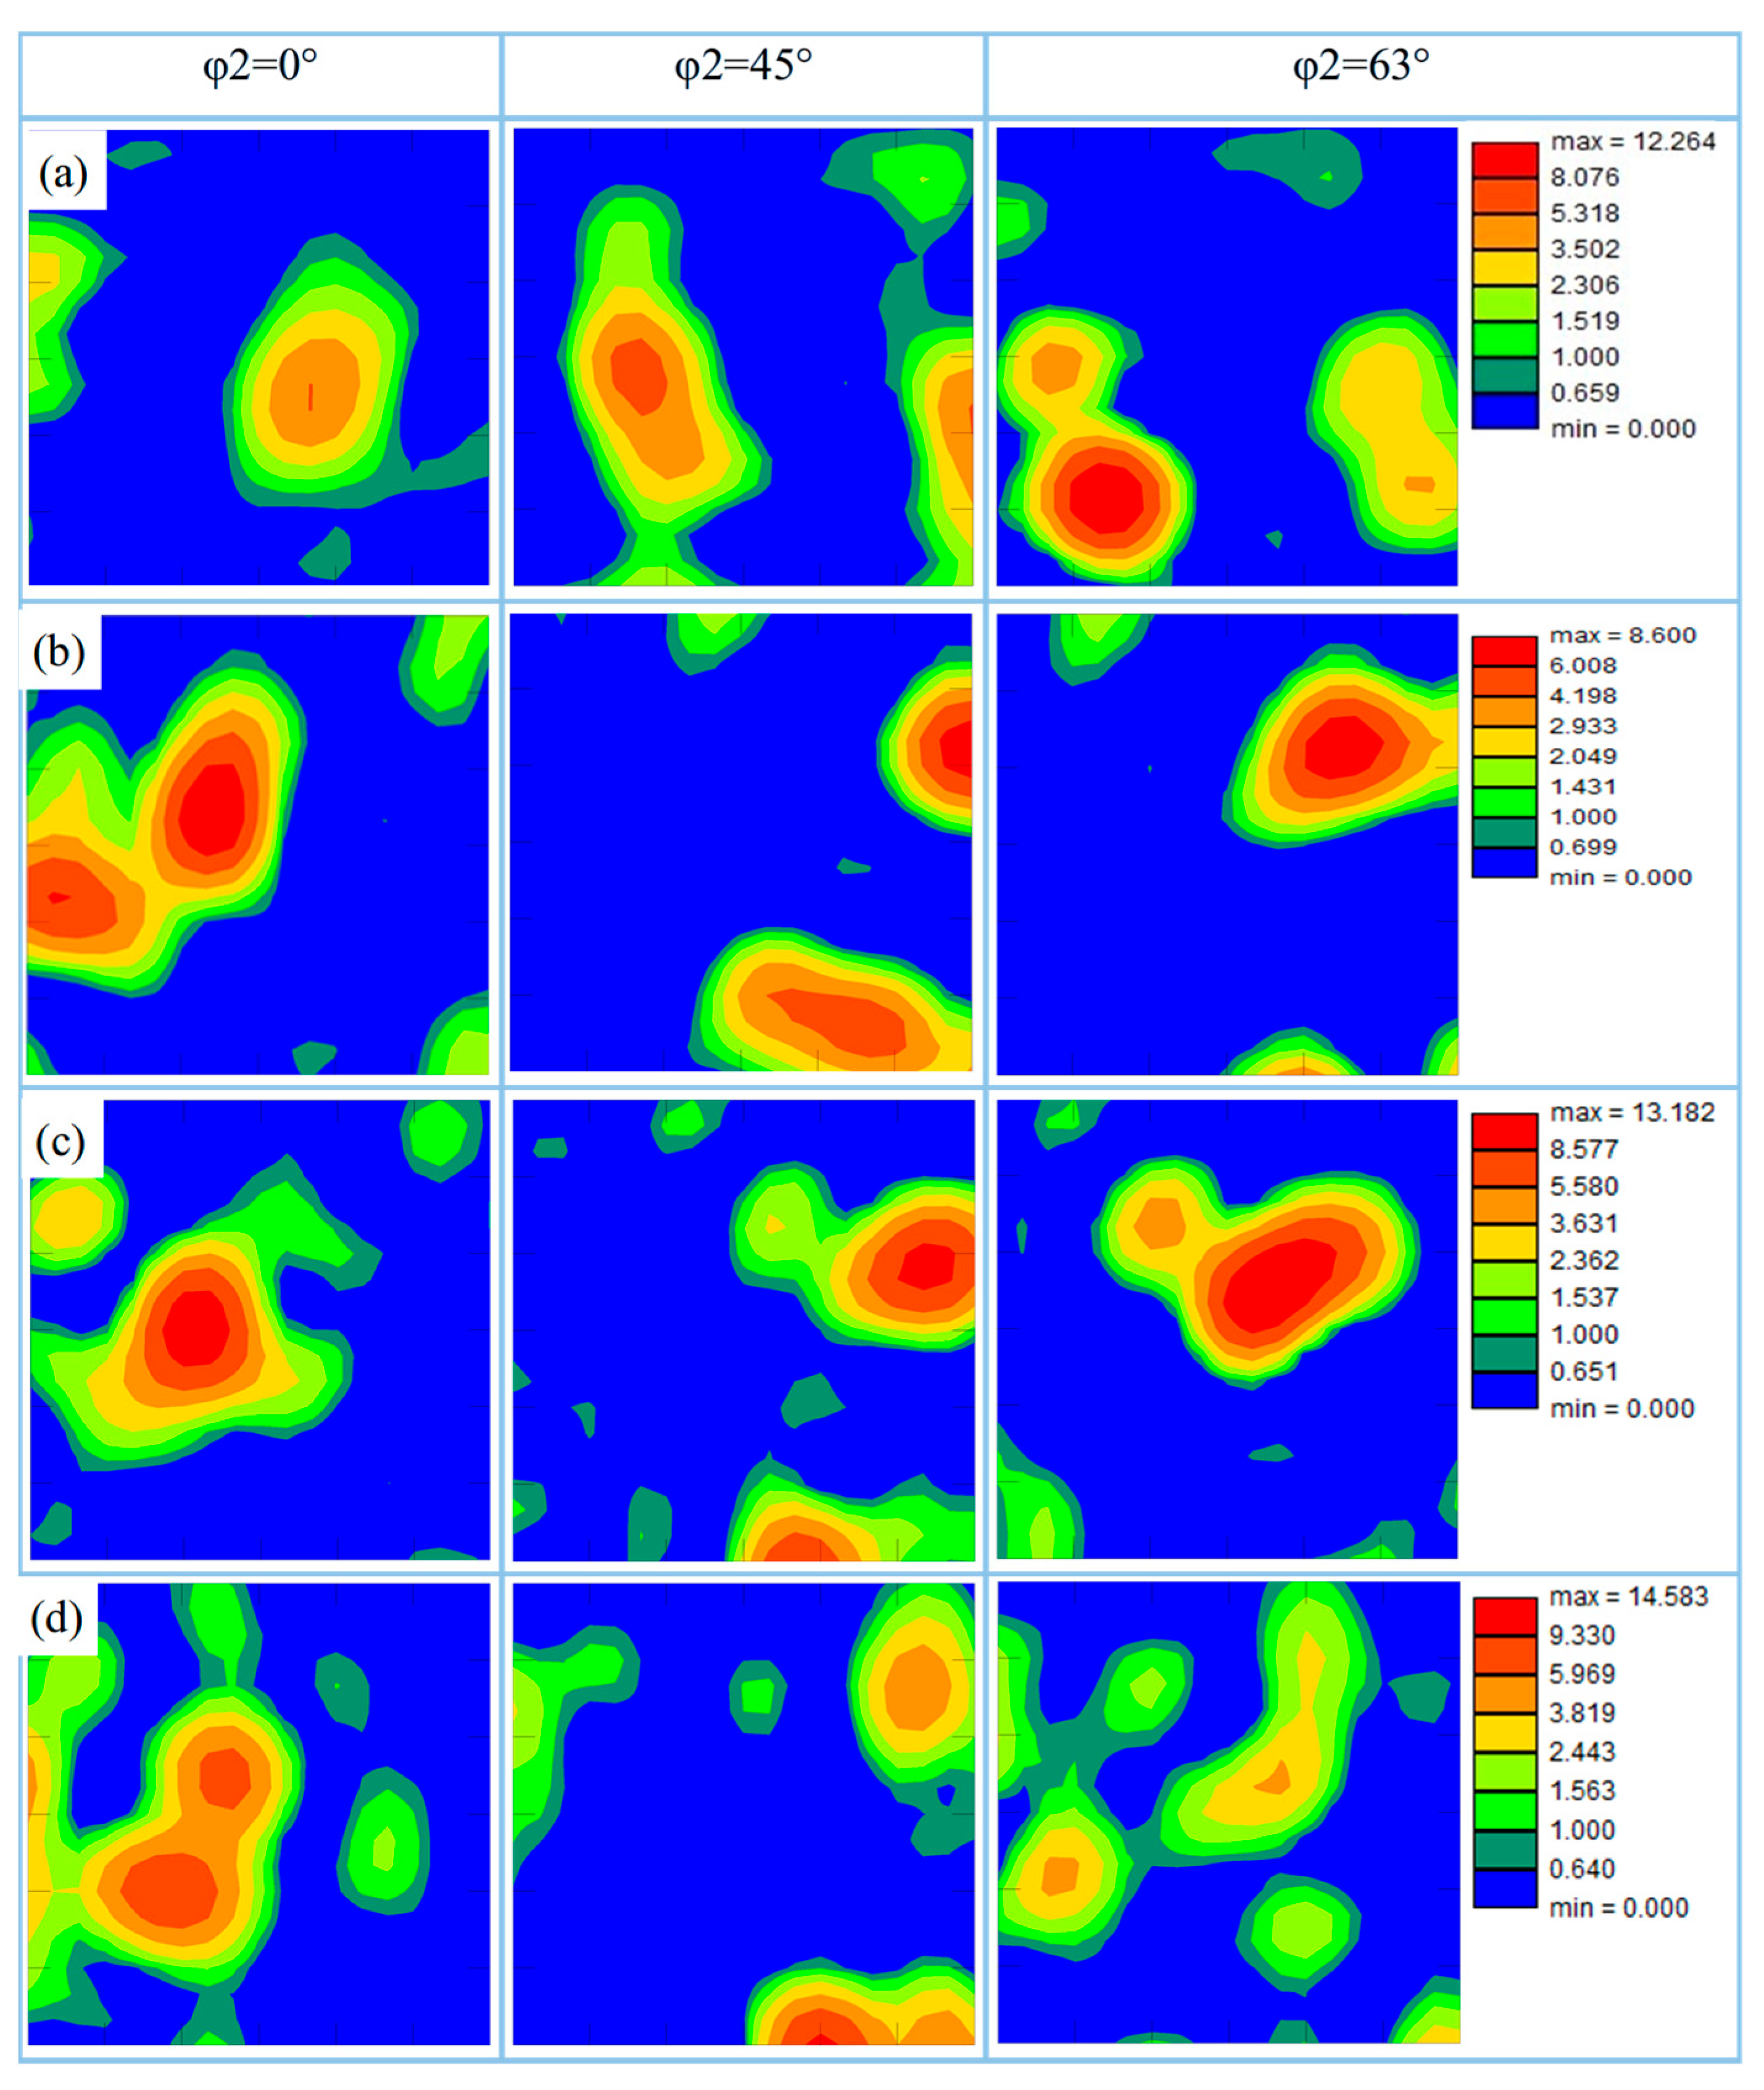
  • In the cold-rolled state, Brass-R texture (intensity 2.45) dominates, resulting in a high dislocation density and low plasticity (elongation 1.96%). At 400–450 °C, synergistic effects of Goss and Copper textures (intensity 6.9–13.82) result in elongation increasing to 7.03%. At 500 °C, Brass texture becomes dominant (intensity 14.58), and increased recrystallized grains further enhance elongation to 9.21%, while tensile strength progressively rises to 472 MPa.
  • In the cold-rolled state, the lowest electrical conductivity (10.09% IACS) is caused by high dislocation density and lattice distortion. As the temperature increases, dynamic recovery and recrystallization reduce the dislocation density, while Fe precipitation alleviates lattice distortion. At 500 °C, the electrical conductivity significantly improves to 19.43% IACS, though magnetic scattering from the Fe phase still partially suppresses electrical conductivity.

Author Contributions

B.L.: Conceptualization, Methodology, Formal Analysis, Investigation, Sample Preparation, Mechanical Testing, Writing—Original Draft; D.W.: Data Curation, Validation, Resources (e.g., equipment provision), Visualization; S.T.: Data Collection, Writing—Review and Editing; S.H.: Microstructural Characterization (SEM/TEM), Texture Analysis, Software (e.g., EBSD data processing); J.L.: Supervision, Project Administration, Funding Acquisition, Writing—Review and Editing, Final Approval. All authors have read and agreed to the published version of the manuscript.

Funding

This research was funded by the National Natural Science Foundation of China, grant number 51274063.

Data Availability Statement

The original contributions presented in this study are included in the article. Further inquiries can be directed to the corresponding author.

Conflicts of Interest

The authors declare no conflicts of interest.

References

  1. Huang, S.; Lin, B.; Niu, W.; Wang, G.; Li, J. Study on the microstructure evolution and mechanical properties of spray-forming Cu-Fe alloys with varying Fe compositions. J. Alloys Compd. 2025, 1013, 178452. [Google Scholar] [CrossRef]
  2. Zhang, C.; Chen, C.; Liu, X.; Yan, M.; Qi, M.; Li, X.; Li, Y.; Zhang, H.; Yang, F.; Wang, W.; et al. High strength and high electrical conductivity in Cu–Fe alloys with nano and micro Fe particles. Mater. Sci. Eng. A 2022, 855, 143948. [Google Scholar] [CrossRef]
  3. Zhang, C.; Chen, C.; Li, P.; Yan, M.; Qin, Q.; Yang, F.; Wang, W.; Guo, Z.; Volinsky, A.A. Microstructure and properties evolution of rolled powder metallurgy Cu-30Fe alloy. J. Alloys Compd. 2022, 909, 164761. [Google Scholar] [CrossRef]
  4. Tang, S.; Xiao, Z.; Ding, Y.; Li, Y.; Wang, R.; Jia, Y.; Gong, S.; Li, Z. Precipitation behavior and mechanical properties of a novel Cu–2Fe-0.5Ti alloy produced by thermos-mechanical treatment. Mater. Sci. Eng. A 2023, 882, 145453. [Google Scholar] [CrossRef]
  5. Peng, S.Y.; Tian, Y.Z.; Yang, Y.; Jiang, M.; Li, H.X.; Wang, J.W.; Li, S.; Qin, G. Achieving homogeneous Fe distribution and high strength in Cu-Fe composite consolidated by powder rolling. Mater. Sci. Eng. A 2023, 884, 145563. [Google Scholar] [CrossRef]
  6. Zhang, P.; Yuan, X.; Li, Y.; Zhou, Y.; Lai, R.; Li, Y.; Lei, Q.; Chiba, A. Influence of minor Ag addition on the microstructure and properties of powder metallurgy Cu-10 wt% Fe alloy. J. Alloys Compd. 2022, 904, 163983. [Google Scholar] [CrossRef]
  7. Abbas, S.F.; Park, K.-T.; Kim, T.-S. Effect of composition and powder size on magnetic properties of rapidly solidified copper-iron alloys. J. Alloys Compd. 2018, 741, 1188–1195. [Google Scholar] [CrossRef]
  8. Liu, S.; Jie, J.; Guo, Z.; Yue, S.; Li, T. A comprehensive investigation on microstructure and magnetic properties of immiscible Cu-Fe alloys with variation of Fe content. Mater. Chem. Phys. 2019, 238, 121909. [Google Scholar] [CrossRef]
  9. Liu, S.; Xu, S.; Jie, J.; Zhang, J.; Dong, Y.; Li, X.; Li, T. Microstructure evolution and magnetic properties of metastable immiscible Cu-Fe alloy with micro-alloying B element. J. Alloys Compd. 2021, 888, 161627. [Google Scholar] [CrossRef]
  10. Guo, K.; Meng, K.; Miao, D.; Wang, Q.; Zhang, C.; Wang, T. Effect of annealing on microstructure and tensile properties of skew hot rolled Ti–6Al–3Nb–2Zr–1Mo alloy tube. Mater. Sci. Eng. A 2019, 766, 138346. [Google Scholar] [CrossRef]
  11. Quelennec, X.; Menand, A.; Le Breton, J.M.; Pippan, R.; Sauvage, X. Homogeneous Cu–Fe supersaturated solid solutions prepared by severe plastic deformation. Philos. Mag. 2010, 90, 1179–1195. [Google Scholar] [CrossRef]
  12. Stepanov, N.D.; Kuznetsov, A.V.; Salishchev, G.A.; Khlebova, N.E.; Pantsyrny, V.I. Evolution of microstructure and mechanical properties in Cu–14%Fe alloy during severe cold rolling. Mater. Sci. Eng. A 2013, 564, 264–272. [Google Scholar] [CrossRef]
  13. Wang, M.; Jiang, Y.; Li, Z.; Xiao, Z.; Gong, S.; Qiu, W.; Lei, Q. Microstructure evolution and deformation behaviour of Cu-10wt%Fe alloy during cold rolling. Mater. Sci. Eng. A 2021, 801, 140379. [Google Scholar] [CrossRef]
  14. Ding, Y.; Deng, Z.; Xiao, Z.; Fang, M.; Gong, S.; Qiu, W.; Wang, X. Effect of Nb content on mechanical reinforcement of the Cu-10Fe composites. J. Alloys Compd. 2023, 966, 171540. [Google Scholar] [CrossRef]
  15. Verhoeven, J.D.; Chueh, S.C.; Gibson, E.D. Strength and conductivity ofin situ Cu-Fe alloys. J. Mater. Sci. 1989, 24, 1748–1752. [Google Scholar] [CrossRef]
  16. Yang, J.; Bu, K.; Zhou, Y.; Song, K.; Huang, T.; Peng, X.; Peng, X.; Liu, H.; Du, Y. Microstructure, residual stress, and mechanical properties evolution of a Cu–Fe–P alloy under different conditions. J. Mater. Res. Technol. 2023, 24, 7896–7909. [Google Scholar] [CrossRef]
  17. Wang, M.; Zhang, R.; Xiao, Z.; Gong, S.; Jiang, Y.; Li, Z. Microstructure and properties of Cu-10 wt%Fe alloy produced by double melt mixed casting and multi-stage thermomechanical treatment. J. Alloys Compd. 2020, 820, 153323. [Google Scholar] [CrossRef]
  18. Weng, K.; Wang, Y.; Song, Y.; Fan, Y.; Zhao, H.; Hong, Z.; Song, K.; Dong, X.; Guo, C. Optimizing strength and electrical conductivity of Cu–Fe–Ti alloy by pre-aging treatment. J. Mater. Res. Technol. 2023, 26, 2009–2016. [Google Scholar] [CrossRef]
  19. Yuan, D.; Xiao, X.; Luo, X.; Wang, H.; Han, B.; Liu, B.; Yang, B. Effect of multi-stage thermomechanical treatment on Fe phase evolution and properties of Cu-6.5Fe-0.3Mg alloy. Mater. Charact. 2022, 185, 111707. [Google Scholar] [CrossRef]
  20. Xia, Y.; Zhang, Y.; Wu, T.; Wang, N.; Ran, R.; Wang, Y.; Fang, F.; Wang, G. Deformation twinning caused by warm rolling and secondary recrystallization in twin-roll strip casting Fe81Ga19 alloy. J. Alloys Compd. 2022, 922, 166039. [Google Scholar] [CrossRef]
  21. Guo, W.; Yi, Y.; Huang, S.; Ruan, J.; Guo, Y. Effect of warm-rolling temperature on the microstructural evolution and mechanical properties of large 2219 Al-Cu alloy rings. Mater. Today Commun. 2023, 36, 106702. [Google Scholar] [CrossRef]
  22. Xu, J.; Guan, B.; Fu, R.; Wu, Y.; Hu, Q.; Zou, J.; Huang, G.; Yan, C. Tailoring the microstructure and mechanical properties of Cu–Fe alloy by varying the rolling path and rolling temperature. J. Mater. Res. Technol. 2023, 27, 182–193. [Google Scholar] [CrossRef]
  23. Shi, R.P.; Wang, C.P.; Wheeler, D.; Liu, X.J.; Wang, Y. Formation mechanisms of self-organized core/shell and core/shell/corona microstructures in liquid droplets of immiscible alloys. Acta Mater. 2013, 61, 1229–1243. [Google Scholar] [CrossRef]
  24. Lu, K. Stabilizing nanostructures in metals using grain and twin boundary architectures. Nat. Rev. Mater. 2016, 1, 16019. [Google Scholar] [CrossRef]
  25. Zhao, P.-C.; Chen, B.; Zheng, Z.-G.; Guan, B.; Zhang, X.-C.; Tu, S.-T. Microstructure and Texture Evolution in a Post-dynamic Recrystallized Titanium During Annealing, Monotonic and Cyclic Loading. Metall. Mater. Trans. A 2021, 52, 394–412. [Google Scholar] [CrossRef]
  26. Allain, S.; Chateau, J.-P.; Bouaziz, O.; Migot, S.; Guelton, N. Correlations between the calculated stacking fault energy and the plasticity mechanisms in Fe–Mn–C alloys. Mater. Sci. Eng. A 2004, 387–389, 158–162. [Google Scholar] [CrossRef]
  27. Niu, R.; An, X.; Li, L.; Zhang, Z.; Mai, Y.-W.; Liao, X. Mechanical properties and deformation behaviours of submicron-sized Cu–Al single crystals. Acta Mater. 2022, 223, 117460. [Google Scholar] [CrossRef]
  28. Yan, Z.; Wang, D.; He, X.; Wang, W.; Zhang, H.; Dong, P.; Li, C.; Li, Y.; Zhou, J.; Liu, Z.; et al. Deformation behaviors and cyclic strength assessment of AZ31B magnesium alloy based on steady ratcheting effect. Mater. Sci. Eng. A 2018, 723, 212–220. [Google Scholar] [CrossRef]
  29. Cheng, Z.; Bu, L.; Zhang, Y.; Wu, H.; Zhu, T.; Lu, L. Characterization of gradient plastic deformation in gradient nanotwinned Cu. Acta Mater. 2023, 246, 118673. [Google Scholar] [CrossRef]
  30. Zhang, Z.; Zhang, J.; Wang, W.; Liu, S.; Sun, B.; Xie, J.; Xiao, T. Unveiling the deformation mechanism of highly deformable magnesium alloy with heterogeneous grains. Scr. Mater. 2022, 221, 114963. [Google Scholar] [CrossRef]
  31. Yang, Y.; Gong, Y.; Li, X.; Liu, H.; Li, C.; Yang, J.; Pan, H.; Shu, B.; Deng, C.; Fang, J.; et al. Effect of bimodal grain size and gradient structure on heterogeneous deformation induced (HDI) stress and mechanical properties of Cu. Mater. Res. Express 2022, 9, 035004. [Google Scholar] [CrossRef]
  32. Dai, X.; Jia, S.; Zhou, Y.; Ma, Y.; Xiao, Z.; Guo, H.; Cao, X.; Fu, Y.; Song, K.; Ding, Z. Microstructural evolution and properties of the Cu-Cr-Ti alloys after cold deformation and subsequent aging treatment. Prog. Nat. Sci. Mater. Int. 2024, 34, 1258–1266. [Google Scholar] [CrossRef]
  33. Zhang, C.; Chen, C.; Huang, L.; Lu, T.; Li, P.; Wang, W.; Yang, F.; Volinsky, A.A.; Guo, Z. Microstructure and properties of Cu-Fe alloys fabricated via powder metallurgy and rolling. Powder Metall. 2021, 64, 308–320. [Google Scholar] [CrossRef]
  34. Cheng, Z.; Zhou, H.; Lu, Q.; Gao, H.; Lu, L. Extra strengthening and work hardening in gradient nanotwinned metals. Science 2018, 362, eaau1925. [Google Scholar] [CrossRef]
  35. Wu, H.; Fan, G. An overview of tailoring strain delocalization for strength-ductility synergy. Prog. Mater. Sci. 2020, 113, 100675. [Google Scholar] [CrossRef]
  36. Huang, X.; Xin, Y.; Cao, Y.; Li, W.; Huang, G.; Zhao, X.; Liu, Q.; Wu, P. Understanding the mechanisms of texture evolution in an Mg-2Zn-1Ca alloy during cold rolling and annealing. Int. J. Plast. 2022, 158, 103412. [Google Scholar] [CrossRef]
  37. Liu, Z.; Li, P.; Xiong, L.; Liu, T.; He, L. High-temperature tensile deformation behavior and microstructure evolution of Ti55 titanium alloy. Mater. Sci. Eng. A 2017, 680, 259–269. [Google Scholar] [CrossRef]
  38. Cheng, Z.; Wan, T.; Bu, L.; Lu, L. Effect of volume fractions of gradient transition layer on mechanical behaviors of nanotwinned Cu. Acta Mater. 2023, 242, 118456. [Google Scholar] [CrossRef]
  39. Baik, S.-I.; Gupta, R.K.; Kumar, K.S.; Seidman, D.N. Temperature increases and thermoplastic microstructural evolution in adiabatic shear bands in a high-strength and high-toughness 10 wt.% Ni steel. Acta Mater. 2021, 205, 116568. [Google Scholar] [CrossRef]
  40. Li, W.; Chen, Z.; Liu, J.; Wang, Q.; Sui, G. Effect of texture on anisotropy at 600 °C in a near-α titanium alloy Ti60 plate. Mater. Sci. Eng. A 2017, 688, 322–329. [Google Scholar] [CrossRef]
  41. Geng, Y.; Ban, Y.; Li, X.; Zhang, Y.; Jia, Y.; Tian, B.; Zhou, M.; Liu, Y.; Volinsky, A.A.; Song, K.; et al. Excellent mechanical properties and high electrical conductivity of Cu-Co-Si-Ti alloy due to multiple strengthening. Mater. Sci. Eng. A 2021, 821, 141639. [Google Scholar] [CrossRef]
  42. Li, C.; Jin, J.; Yan, H.; Shan, Z.; Mao, Y.; Chen, R. Investigation of hot deformation behavior of Mg-14Gd-0.5Zr (wt%) through constitutive analysis and processing maps. J. Alloys Compd. 2023, 953, 170112. [Google Scholar] [CrossRef]
Figure 1. Process flow and equipment schematic diagram: (a) working process; (b) schematic diagram of rolling mill; (c) schematic diagram of work roll heating.
Metals 15 00606 g001
Figure 2. The pre-rolling microstructure of the Cu–10Fe alloy: (a) the inverse pole figure (IPF) map; (b) the phase distribution map—the red areas show the Cu matrix, and the green regions show the Fe phase; (c) SEM morphology; (d) the grain boundaries—the black one is HAGB, the red one is the twin boundary, and the blue one is the phase boundary.
Metals 15 00606 g002
Figure 3. The pre-rolling texture of the Cu–10Fe alloy: (a) Cu matrix; (b) Fe phase.
Metals 15 00606 g003
Figure 4. SEM images of Cu–10Fe alloy under different temperatures: (a) cold rolling; (b) 400 °C; (c) 450 °C; (d) 500 °C.
Metals 15 00606 g004
Figure 5. The EBSD analysis maps of rolled Cu–10Fe alloy: (a,d,g,j) phase distribution map; (b,e,h,k) IPF map; (c,f,i,l) recrystallized grains—red regions represent deformed grains, yellow regions indicate modified subgrains, and blue regions denote recrystallized grains.
Metals 15 00606 g005
Figure 6. Grain size distribution of rolled Cu–10Fe alloy: (a) cold rolling; (b) 400 °C; (c) 450 °C; (d) 500 °C.
Metals 15 00606 g006
Figure 7. ODF analysis of the rolled Cu–10Fe samples at φ2 angles of 0°, 45°, and 63°: (a) cold rolling; (b) 400 °C; (c) 450 °C; (d) 500 °C.
Metals 15 00606 g007
Figure 8. The variations in tensile properties and electrical conductivity of Cu–10Fe.
Metals 15 00606 g008
Figure 9. GND density of Cu–10Fe alloy rolled at different temperatures. (a) cold rolling; (b) 400 °C; (c) 450 °C; (d) 500 °C.
Metals 15 00606 g009
Figure 10. Bimodal grain structure morphology.
Metals 15 00606 g010
Disclaimer/Publisher’s Note: The statements, opinions and data contained in all publications are solely those of the individual author(s) and contributor(s) and not of MDPI and/or the editor(s). MDPI and/or the editor(s) disclaim responsibility for any injury to people or property resulting from any ideas, methods, instructions or products referred to in the content.

