Article

Tunable Microwave Absorption Performance of Ni-TiN@CN Nanocomposites with Synergistic Effects from the Addition of Ni Metal Elements

1
School of Materials Science and Engineering, Shenyang University of Technology, Shenyang 110870, China
2
School of Science, Shenyang Ligong University, Shenyang 110159, China
3
School of Science, Shenyang University of Technology, Economic, Shenyang 110870, China
*
Authors to whom correspondence should be addressed.
Metals 2025, 15(6), 597; https://doi.org/10.3390/met15060597
Submission received: 27 April 2025 / Revised: 22 May 2025 / Accepted: 23 May 2025 / Published: 27 May 2025

Abstract

:
This paper presents the synthesis and characterization of Ni-TiN@CN nanocomposites fabricated via arc discharge, followed by dopamine polymerization and pyrolysis. The cubic morphology of the Ni-TiN cores and uniform CN encapsulation were confirmed by structural analyses. Electromagnetic evaluations revealed that the CN shell thickness critically influenced the dielectric dispersion, polarization relaxation and conductive loss. The optimal sample (Ni-TiN@CN-3) achieved a minimum reflection loss of −42.05 dB at 4.06 GHz. The incorporation of magnetic Ni particles introduced a magnetic loss mechanism, while the multiple intrinsic defects within the heterogeneous structure synergistically generated defect dipole polarization and conductive loss. The strategic addition of Ni facilitated the construction of heterogeneous interfaces, which achieved enhanced interface polarization effects. The effective absorption bandwidth (≤−10 dB) reached 14.9 GHz, while the effective absorption bandwidth (≤−20 dB) achieved 6.5 GHz. The optimized CN layer facilitated a synergistic interplay between the dielectric loss and magnetic loss, which ensured balanced impedance matching and attenuation, as well as enhanced electromagnetic wave dissipation. This integrated optimization ultimately endowed the material with exceptional microwave absorption performance through an effective electromagnetic energy conversion. This work highlights Ni-TiN@CN nanocomposites as promising candidates for high-performance microwave absorbers in extreme environments.

1. Introduction

With the rapid development of modern electronic technology, electromagnetic microwave-absorbing materials play a crucial role in the fields of stealth technology, electromagnetic compatibility and communications [1,2,3]. There is an increasingly urgent need for electromagnetic microwave-absorbing materials under extreme conditions, such as aerospace engine tail nozzles and hypersonic vehicle surfaces [4,5,6]. Among many potential electromagnetic microwave-absorbing candidates, titanium nitride (TiN) has attracted much attention due to its excellent mechanical properties, chemical stability and unique electromagnetic loss mechanism [7,8,9]. It has been shown that TiN can still maintain high conductivity under extreme conditions, and its dielectric loss mainly originates from the conductive loss and polarization relaxation, which makes it exhibit great potential for application in the field of electromagnetic microwave absorption [10,11]. However, TiN as a single-component microwave-absorbing material still has some limitations. Its single loss mechanism leads to impedance mismatch, thus limiting its microwave absorption performance. Furthermore, the relatively high dielectric constant of TiN makes it difficult to achieve good impedance matching with free space, resulting in the severe reflection of electromagnetic waves on the material surface and reduced absorption efficiency. To overcome these drawbacks, researchers have attempted to combined TiN with other materials to modulate their electromagnetic parameters, optimize their impedance matching and enhance their microwave absorption properties [12,13].
Among them, metal Ni is introduced into TiN matrix composites due to its excellent magnetic loss characteristics, which can effectively broaden the absorption band and enhance the absorption intensity through the synergistic effect of magnetic loss and dielectric loss [14,15]. Therefore, based on the above considerations, we propose Ni-TiN nanocomposites, which combine the dielectric loss property of TiN and the magnetic loss property of Ni. It is able to realize the synergistic effect of dielectric loss and magnetic loss, and thus, significantly improve the electromagnetic microwave absorption performance of the materials. Furthermore, carbon materials have been widely used in the modification studies of TiN-based composites due to their light weight, high electrical conductivity and tunable dielectric properties [16,17]. A multi-scale heterogeneous core–shell structure is constructed by compositing carbon with Ni-TiN to form a Ni-TiN@carbon ternary composite material, thus realizing a multiple loss mechanism for electromagnetic waves. By constructing Ni-TiN@carbon ternary composites, the synergistic effect of dielectric loss, magnetic loss and interfacial polarization loss can be realized, which can significantly enhance the electromagnetic wave absorption performance of the materials.
In this work, we synergized the dielectric loss property of TiN and the magnetic loss property of Ni to construct Ni-TiN composite structures. On this basis, we constructed Ni-TiN@CN composites to achieve the synergistic effect of dielectric loss, magnetic loss and interfacial polarization loss. The constitutive relationship and optimization mechanism of the multi-scale heterogeneous core–shell structure and the thickness of the CN cladding layer on the wave-absorbing performance were systematically investigated.

2. Experimental Section

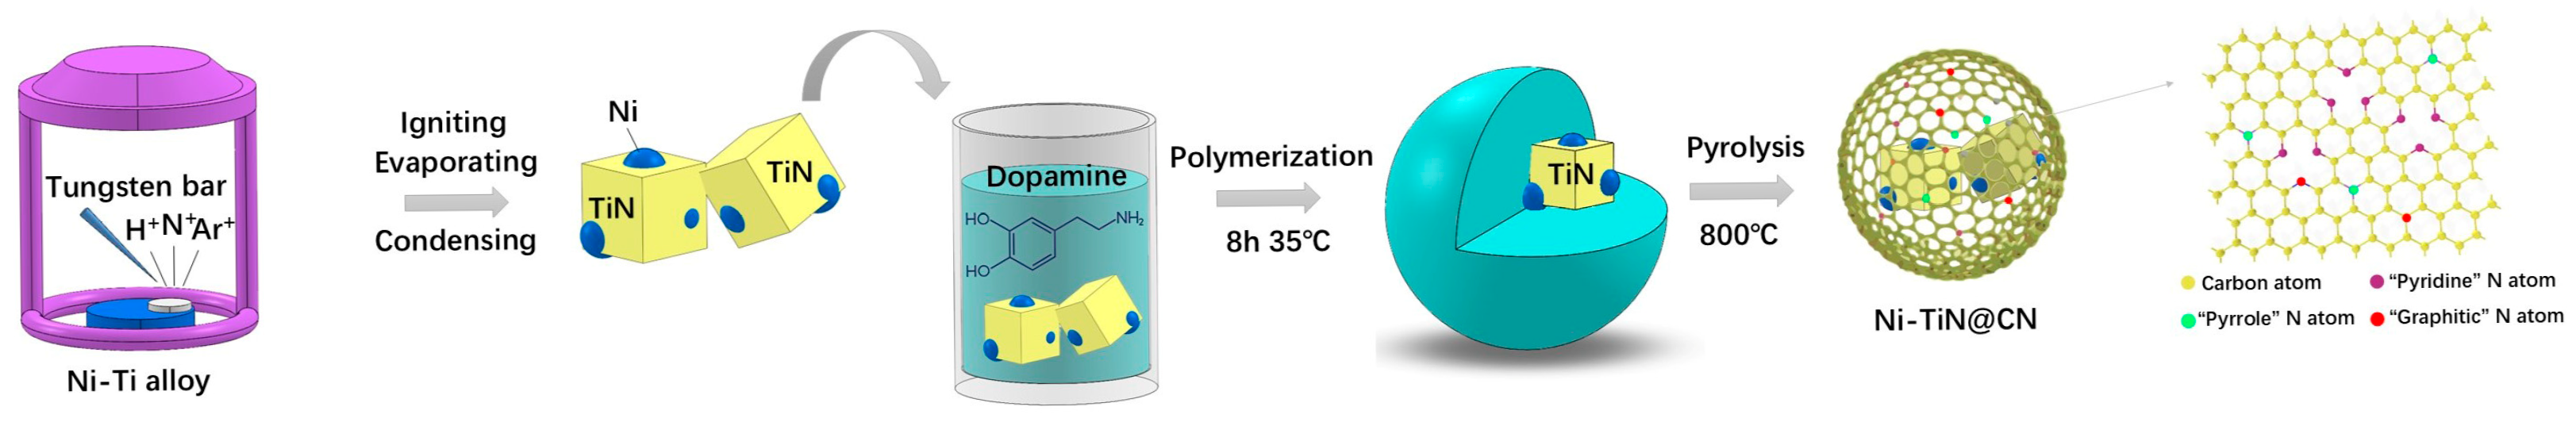
2.1. Synthesis of the Ni-TiN Nanocubes

The Ni-TiN nanocubes were synthesized via a simple arc discharge method. Initially, Ni and Ti metals were mettled at a theoretical mass ratio of 1:3 under an argon atmosphere to form a NiTi alloy [18,19]. This alloy was then positioned on a water-cooled copper stage as the anode, with a tungsten bar serving as the cathode [20]. Subsequently, the cavity was evacuated to a vacuum of 5.0 × 10⁻³ Pa, after which a gas mixture that consisted of Ar (20 kPa), N2 (15 kPa) and H2 (10 kPa) was introduced. The arc discharge process was conducted with a constant current of 90 A and a voltage of 20~25 V. Finally, Ni-TiN nanocubes were successfully prepared and obtained after 24 h of passivation treatment under an Ar condition and labeled as Ni-TiN.

2.2. Synthesis of Ni-TiN@CN Nanocomposites

The Ni-TiN@CN nanocomposites were fabricated through a dopamine-mediated self-polymerization followed by carbonization (see Figure 1). In a typical process, dopamine (DA) hydrochloride (in amounts of 160 mg, 180 mg, 200 mg and 220 mg) was dissolved in 250 mL of tris buffer (pH = 8.5), and 200 mg of prepared Ni-TiN nanocubes was added with continuous stirring. The self-polymerization reaction was then carried out at 35 °C for 8 h. The as-prepared Ni-TiN@PDA powders were collected by centrifugation, washed with distilled water and ethanol several times, and subsequently dried in a vacuum at 60 °C for 12 h. The aforesaid powders were heated to 800 °C at 2 °C/min under an argon atmosphere and held for 2 h to obtain Ni-TiN@CN nanocomposites. Herein, Ni-TiN@CN nanocomposites prepared using the masses of DA hydrochloride for 160 mg, 180 mg, 200 mg and 220 mg were tagged as Ni-TiN@CN-1, Ni-TiN@CN-2, Ni-TiN@CN-3 and Ni-TiN@CN-4, respectively.

2.3. Characterization of Ni-TiN@CN Nanocomposites

The crystalline phases of the synthesized samples were analyzed using powder X-ray diffraction (XRD, Cu Kα radiation, λ = 0.15405 nm) with a scanning range of 2θ = 10~90° at 40 kV and 10 mA. Raman spectroscopy was conducted on a Jobin Yvon LabRam HR800 (HORIBA Jobin Yvon, Paris, France) system equipped with a 632.8 nm He-Ne laser (5 mW power, 10 s integration time) to collect spectra in the 50~2000 cm1 range. The SEM used was Zeiss Ultra Plus (Zeiss, Oberkochen, Germany). High-resolution transmission electron microscopy (HRTEM, JEOL-2010) (JEOL, Tokyo, Japan) observations were performed at 200 kV after dispersing the powdered samples in aqueous/ethanol solutions via ultrasonication, followed by drop-casting the suspension onto copper grids and air-drying. The surface chemical states were further characterized by X-ray photoelectron spectroscopy (XPS, Thermo Scientific K-Alpha) (Thermo Fisher Scientific, Waltham, MA, USA) with Al Kα monochromatic X-rays (1486.6 eV), and the binding energies were calibrated against the C 1s peak (284.8 eV).
The complex permittivity (ε′, ε″) and permeability (μ′, μ″) of the samples were measured in the 2~18 GHz frequency band using an Agilent E5071C vector network analyzer (VNA) (Agilent, Santa Clara, CA, USA) via the coaxial method. To prepare the test specimens, the samples were uniformly mixed with paraffin wax at a 4:6 mass ratio, heated to 70 °C for melting and stirring, and then pressed into coaxial rings (outer diameter: 7.0 mm, inner diameter: 3.0 mm, thickness: 2.0 mm). Reflection loss (RL) values were calculated based on transmission line theory.

3. Results and Discussion

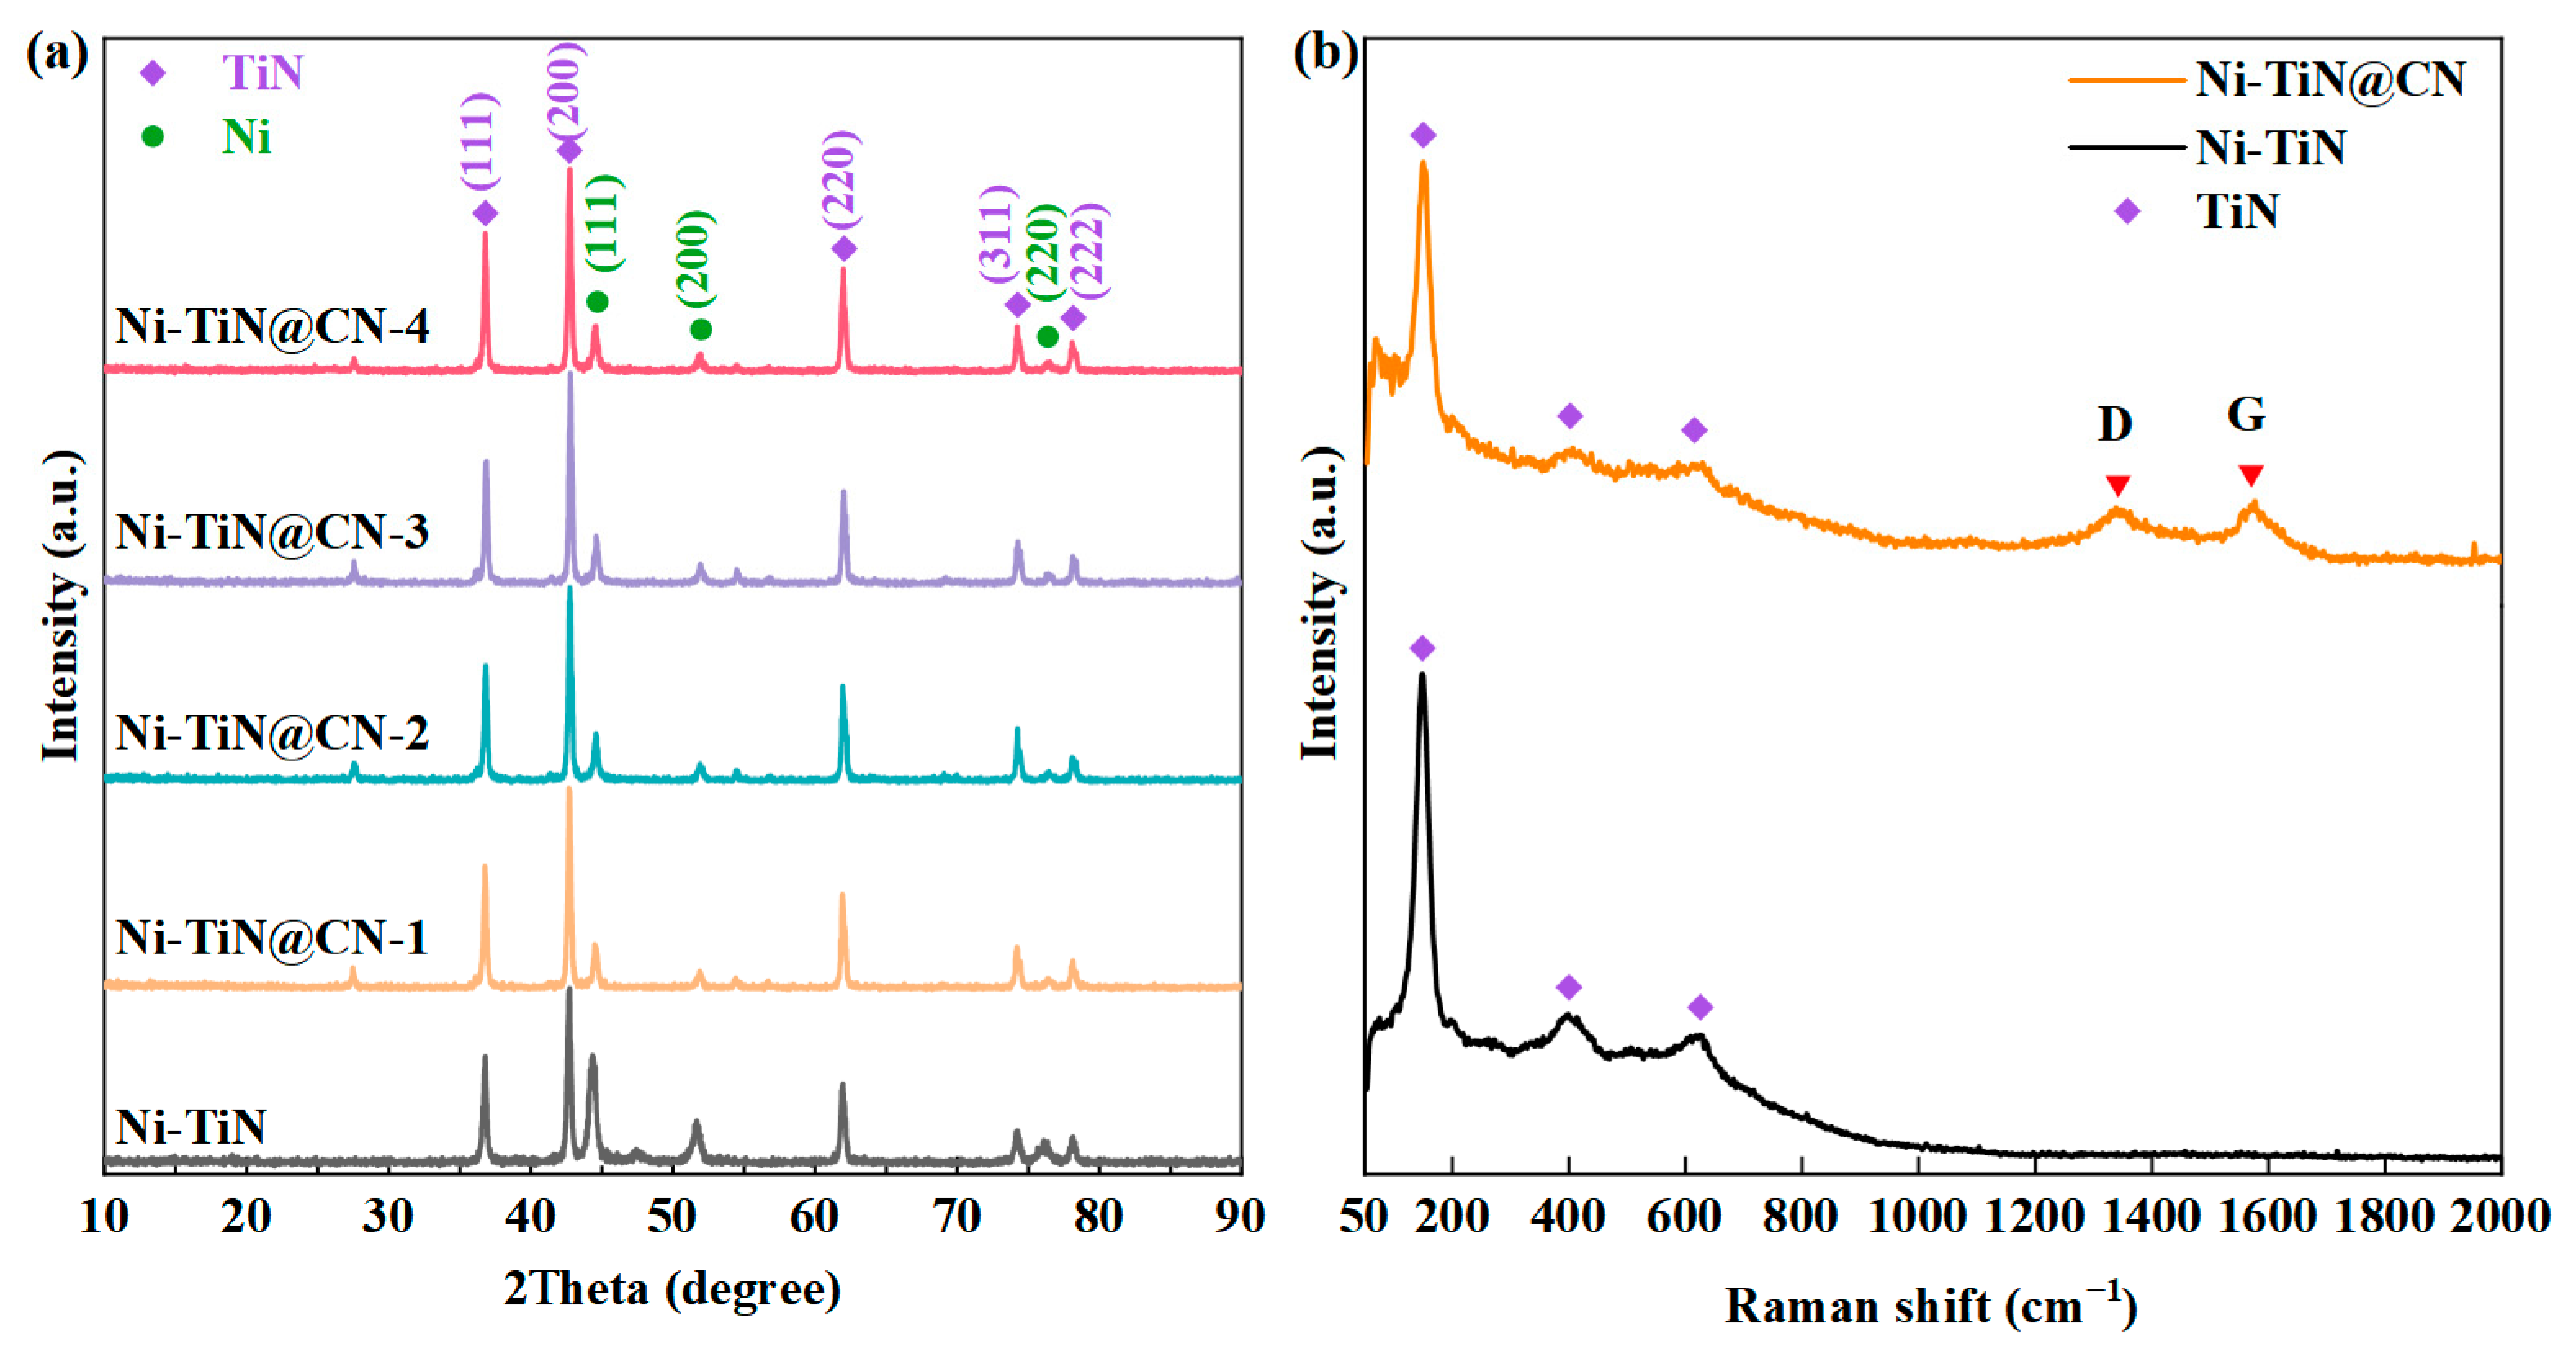
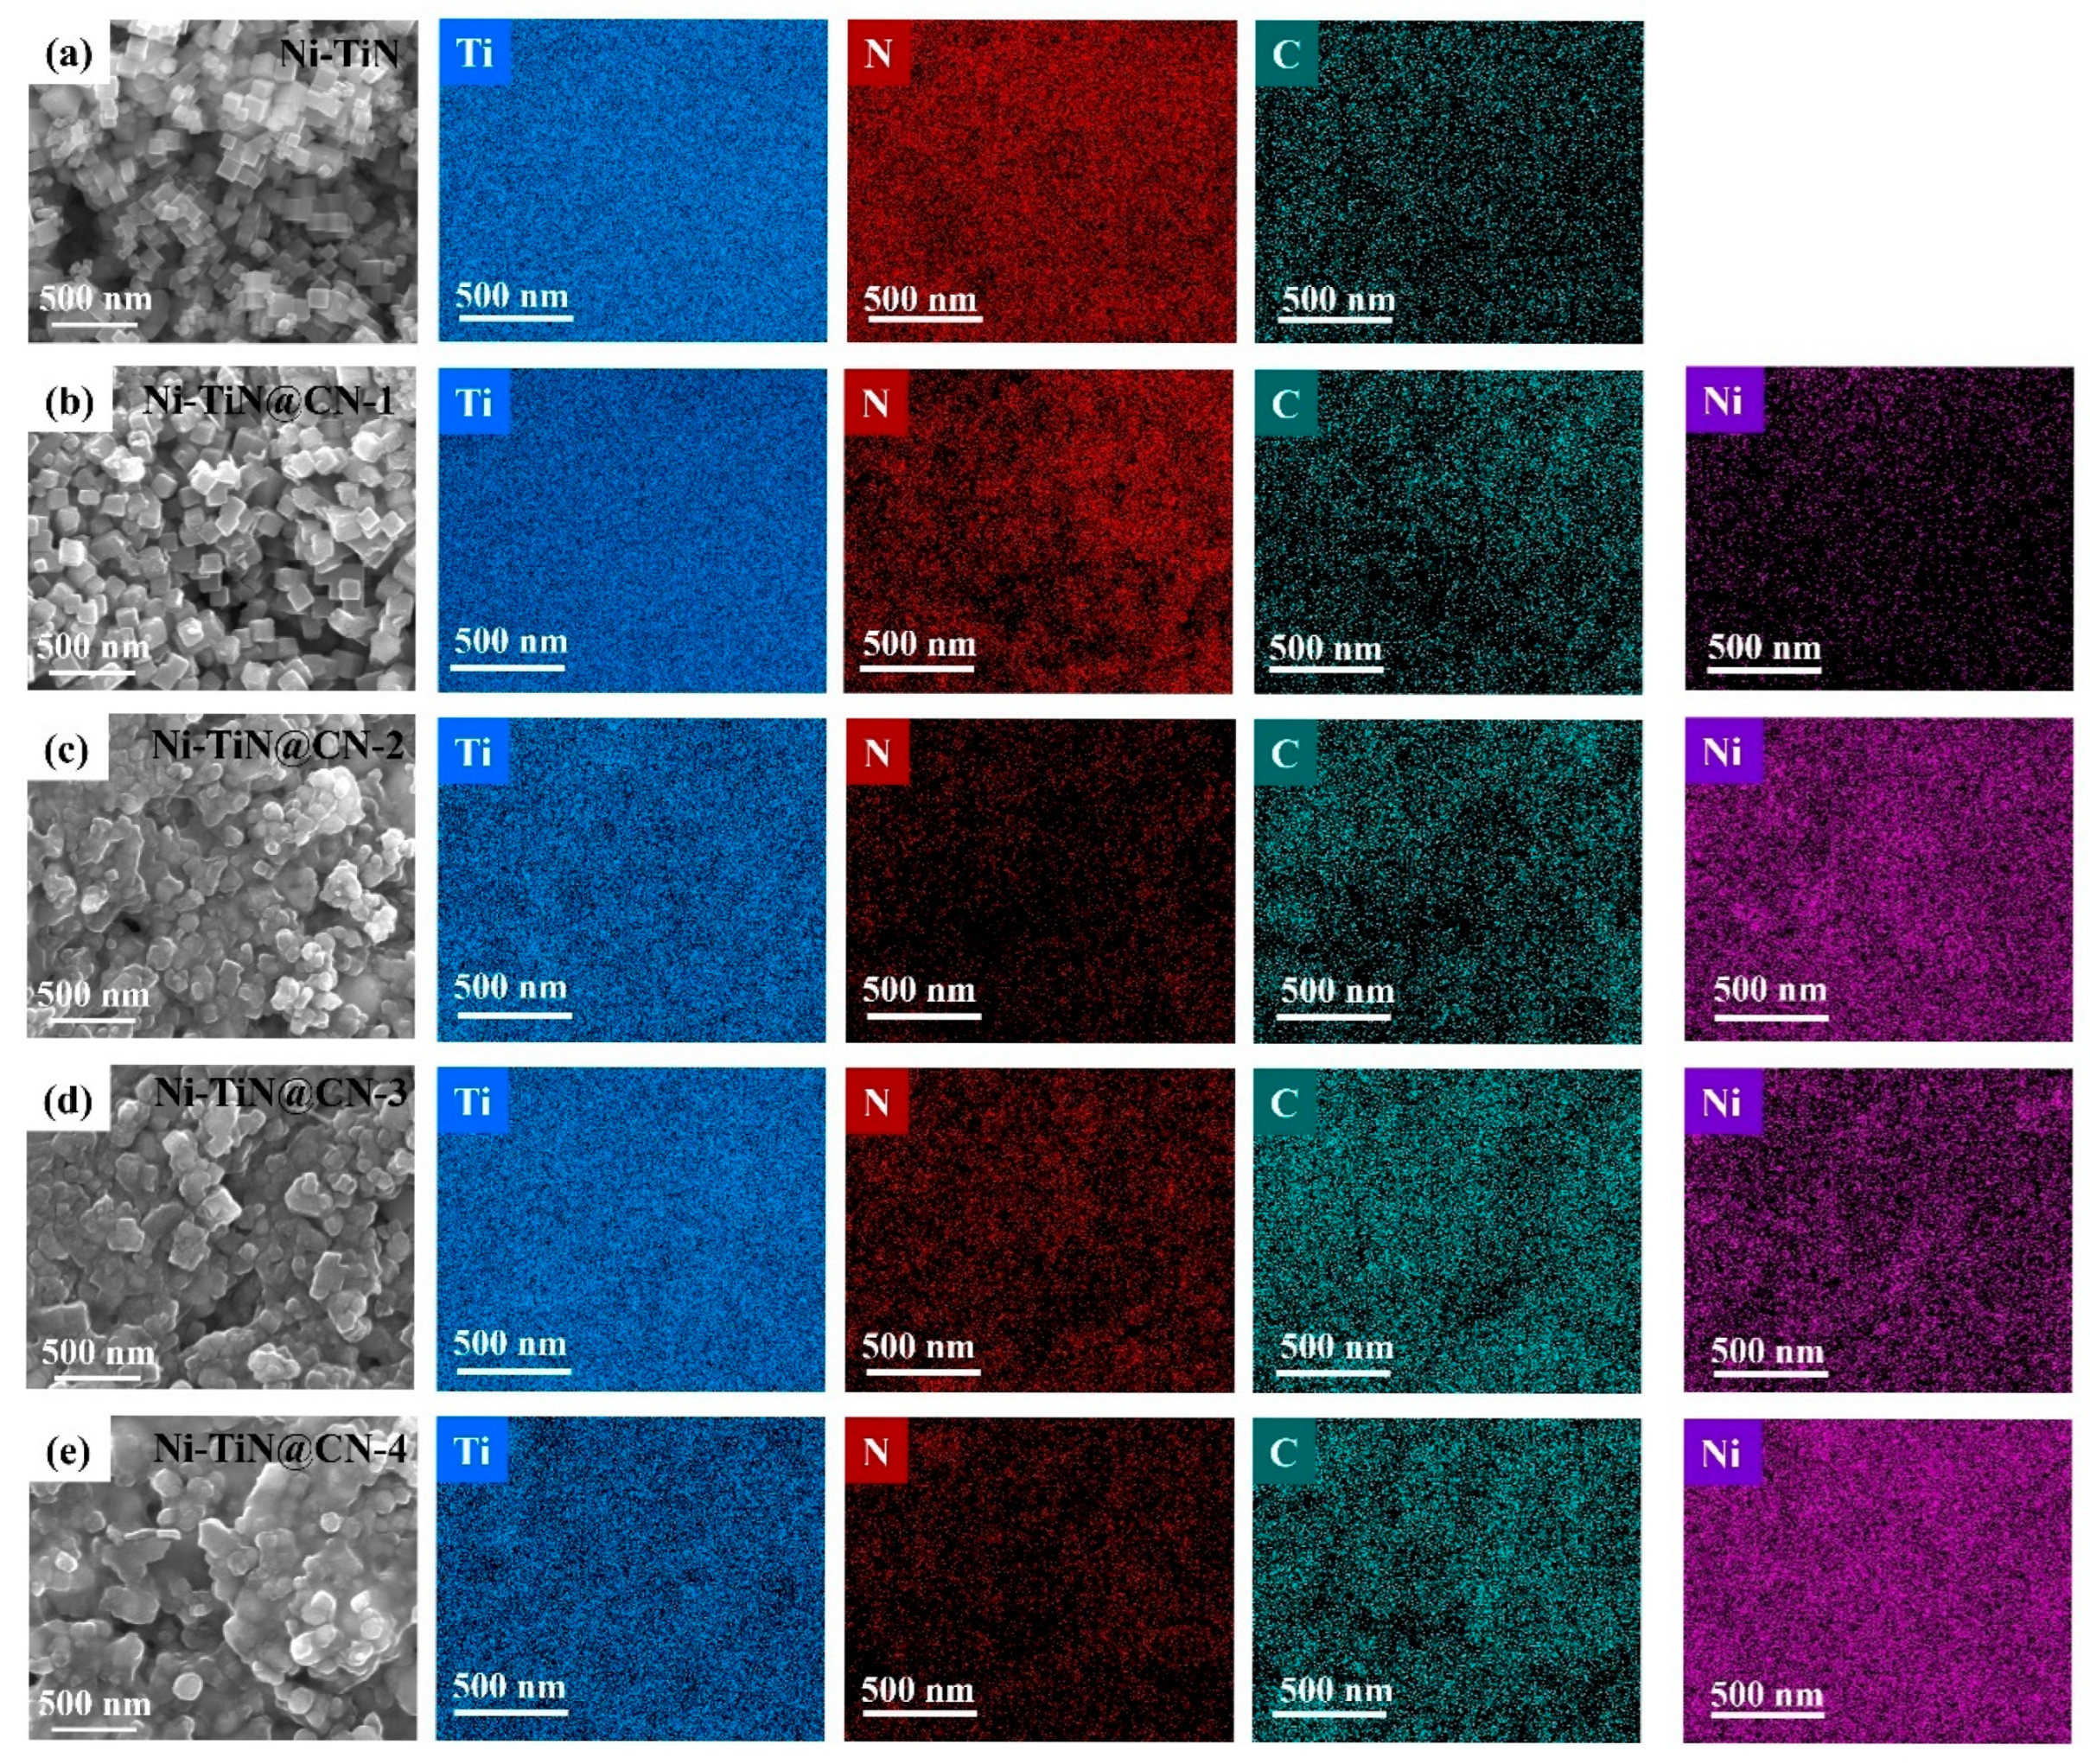
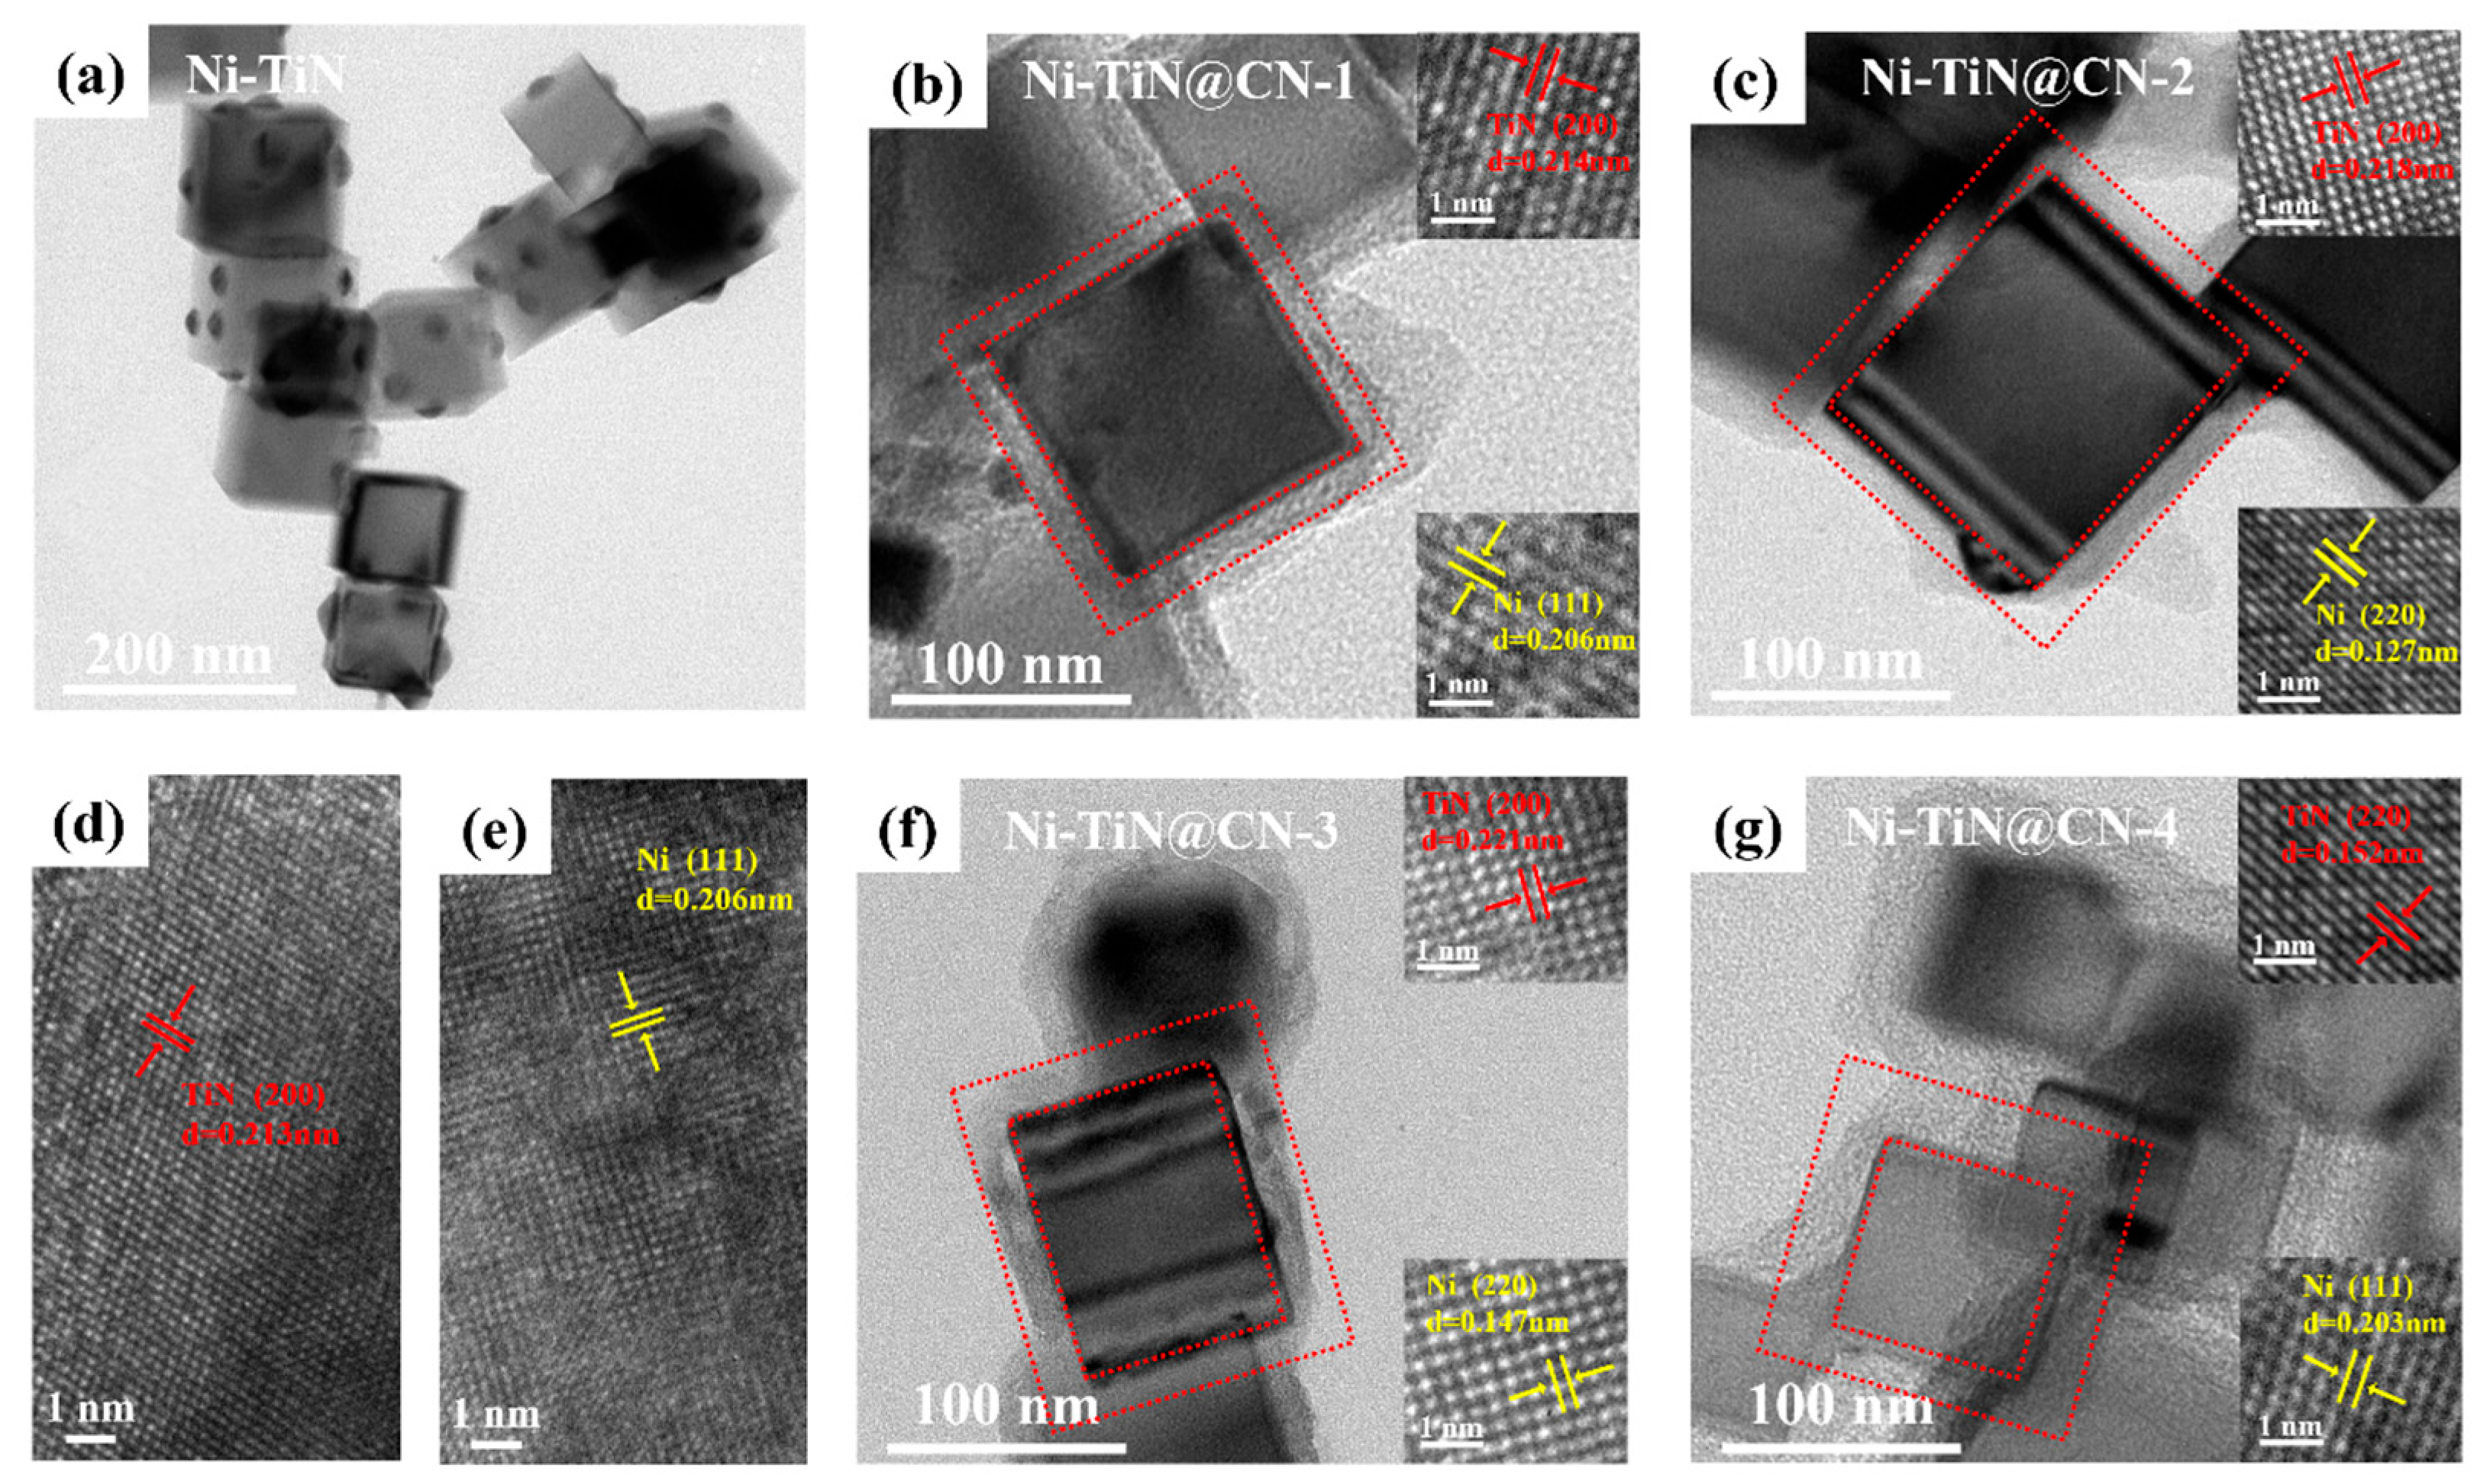
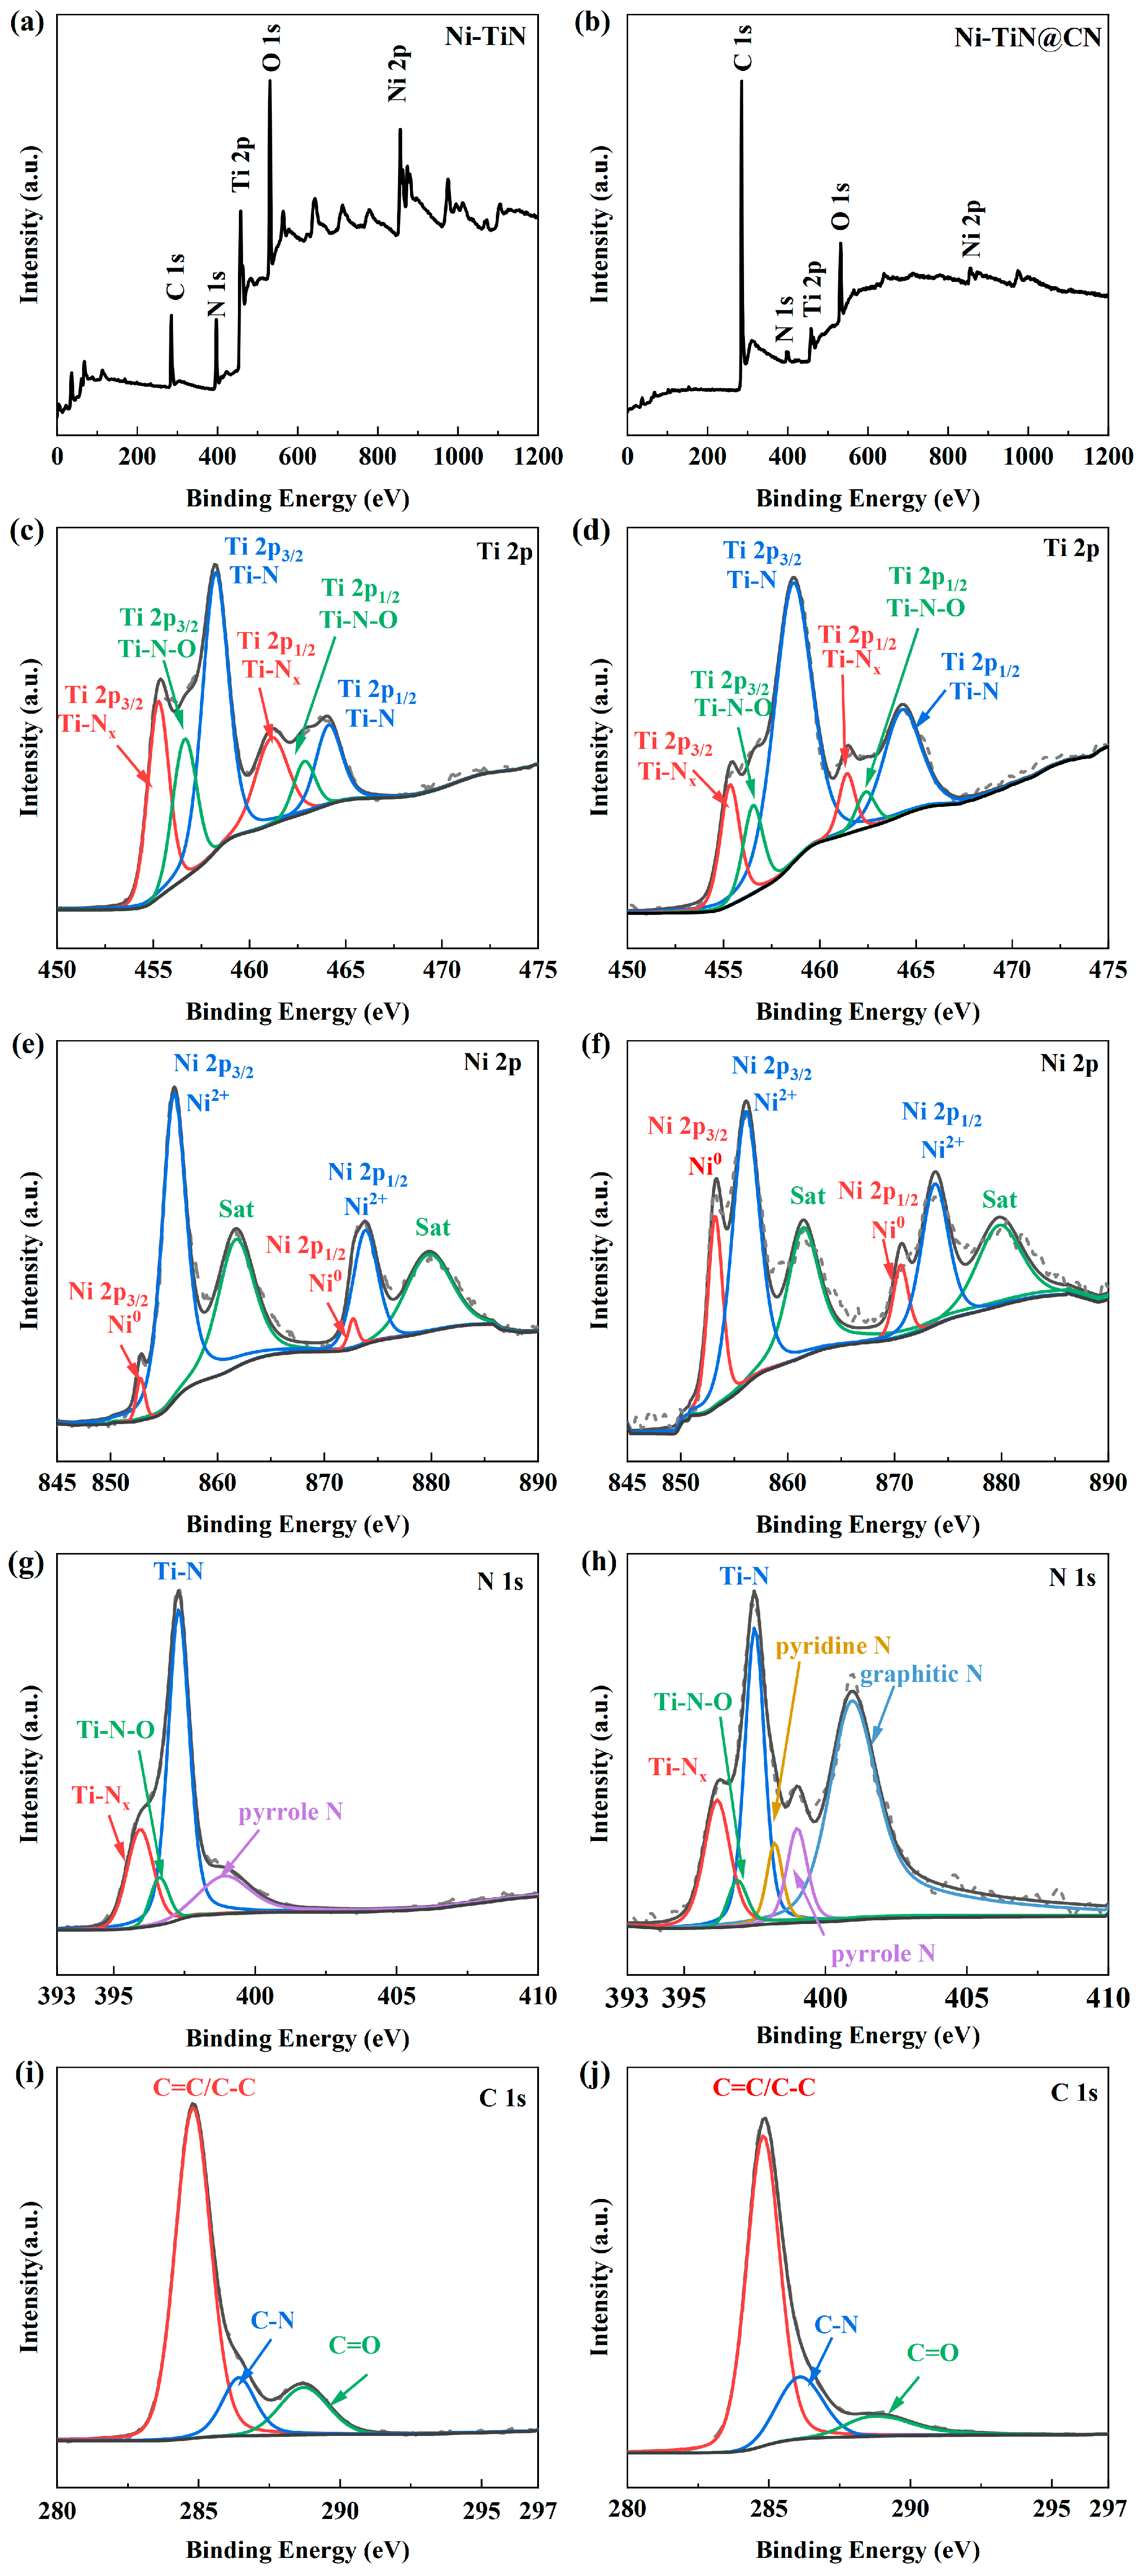
3.1. Investigation of Structure Properties

The phase compositions of the samples were investigated by XRD and the results are shown in Figure 2. Five diffraction peaks can be observed at 36.7°, 42.6°, 61.9°, 74.2° and 78.1°, which corresponded to the (111), (200), (220), (311) and (222) crystal planes of the face-centered cubic TiN, respectively [21]. There were also three diffraction peaks that appeared at 44.5°, 51.8° and 76.30°, which corresponded to the (111), (200) and (220) crystal planes of the Ni, respectively [22]. Apart from the above diffraction peaks, there were no other diffraction peaks, indicating that the prepared products were pure Ni-TiN. And in addition to the above diffraction peaks, the diffraction peak observed at 27.5° in the Ni-TiN@CN samples corresponded to the C3N4(110) crystal plane. The characteristic diffraction peaks of other carbon-containing substances were not seen, probably due to the low degree of crystallization.
The morphologies and elemental distributions of the samples were characterized by SEM and EDS, and the results are shown in Figure 3. The Ni-TiN samples exhibited a regular cubic morphology, as shown in Figure 3a, but the particle size range was wider in the tens of nanometers range. The addition of DA hydrochloride did not change the characteristic morphology of the Ni-TiN, and the product was still a cube with a capping layer, as shown in Figure 3b. With the increase in the DA hydrochloride addition, the coating layer became thicker, and the original morphology of the particles was gradually masked, as shown in Figure 3c–e. Ni-TiN@CN-1, Ni-TiN@CN-2, Ni-TiN@CN-3 and Ni-TiN@CN-4 showed a complex core–shell structure of stacked Ni-TiN particles embedded in the thick shell of CN. The results of the mapping show that the individual particles maintained their cubic morphology and exhibited homogeneous distributions of Ni, Ti, N and C elements, as shown in Figure 3c–e. The results demonstrate the uniform distribution of elements in the individual particles and the consistency of the chemical composition between the particles.
Figure 4 exhibits the morphologies and microstructures of the Ni-TiN and Ni-TiN@CN nanocubes. As shown in Figure 4a, the TiN nanocubes exhibited a cubic structure with a uniform size range of 60~80 nm. It is evident that the spherical Ni nanoparticles were embedded within the surface of the cubic TiN. Furthermore, the lattice fringes with spacings of 0.213 nm and 0.206 nm in the HRTEM images, as seen in Figure 4d,e, could be assigned to the (200) and (111) planes of the TiN and Ni, respectively. Figure 4b,c,f,g show the TEM images of the Ni-TiN@CN nanocubes, from which it can be seen that the carbon nanocages formed by the pyrolysis of polydopamine (PDA) derived at high temperature were uniformly encapsulated in the Ni/TiN nanocubes, which is consistent with the SEM results. It is noteworthy that the incorporation of CN did not change the morphologies of the Ni-TiN nanocubes. Furthermore, the carbon nanocages held a range of morphological characteristics, including disorder, curvature and a multitude of defects. These features are commonly observed in N-doped graphite layers, which often exhibit a relatively low degree of graphitization due to the presence of heteroatoms and structural imperfections.
The XPS spectrum was further used to study the surface element compositions of the valence state of the Ni-TiN@CN. As illustrated in Figure 5a,b, the full XPS spectrum revealed the presence of Ti, Ni, C, N and O elements in both the Ni/TiN nanocubes and Ni/TiN@CN nanocomposites. Figure 5c–j are the high-resolution XPS spectra of Ti, Ni, C and N. Figure 5c,d show the spectrum of Ti 2p consisting of Ti 2p1/2 and Ti 2p3/2, which can be further divided into different peaks. The peaks at 455.25 eV and 461.17 eV were assigned to the Ti-Nx bonding species that corresponded to a certain non-stoichiometric state of TiNx [23]. This result indicates that the TiN was in a non-stoichiometric state, meaning that it was not a complete crystal and had its own defects. The peaks at 458.29 eV and 464.17 eV were assigned to Ti-N bonding, which indicates that there was still face-centered TiN in the nanocomposites [24]. Herein, the Ti-N-O bonds located at 456.69 eV and 462.87 eV were attributed to the oxidation of the TiN in the air, as is common in nanoparticles [16].
And the high-resolution XPS spectrum of Ni 2p could detect two types of Ni, as shown in Figure 5e,f, which corresponded to the mixed valence of Ni0 and Ni2+. The peaks located at 852.88 eV and 872.85 eV were assigned to Ni0, and those centered at 856.01 eV and 873.98 eV were related to Ni2+ [25]. The appearance of a weak Ni2+ peak implies that the Ni embedded in the TiN nanocubes was slightly oxidized [26]. And the ratio of the Ni2+ and Ni0 peak areas decreased from 22.34 to 2.56 when comparing the Ni-TiN nanocubes with the Ni-TiN@CN nanocomposites, which indicates that CN layers were accreted on the surface of the TiN nanoparticles and effectively prevented the oxidation of the TiN nanoparticles. Furthermore, the peaks at 861.82 eV and 879.9 eV could be attributed to shake-up satellite peaks [27].
The N1s spectrum could be fitted into four peaks, as shown in Figure 5g, including the Ti-Nx bond (396.02 eV), Ti-N-O bond (396.64 eV), Ti-N bond (397.30 eV) and pyrrole N bond (398.92 eV) [9]. As shown in Figure 5h, the N1s spectrum of Ni-TiN@CN nanocomposites could be fitted into six peaks attributed to the Ti-Nx bond (396.13 eV), Ti-N-O bond (396.90 eV), Ti-N bond (397.48 eV), pyridine N bond (398.25 eV), pyrrole N bond (399.03 eV) and graphitic N (401.02 eV) [28]. The pyridine N, pyrrole N and graphitic N present in the N1 s spectra were derived from the N-doped graphitic carbon obtained from the pyrolysis of PDA. The results show that the surfaces of the Ni-TiN nanocubes were successfully coated with a graphite-carbon layer with rich surface groups. And the C 1s could be fitted into three peaks at 284.85 eV, 286.39 eV and 288.77 eV, which corresponded to C=C/C-C, C-N and C-O, respectively [26,29]. The presence of the C-N bond means that the N had entered into the graphite carbon.

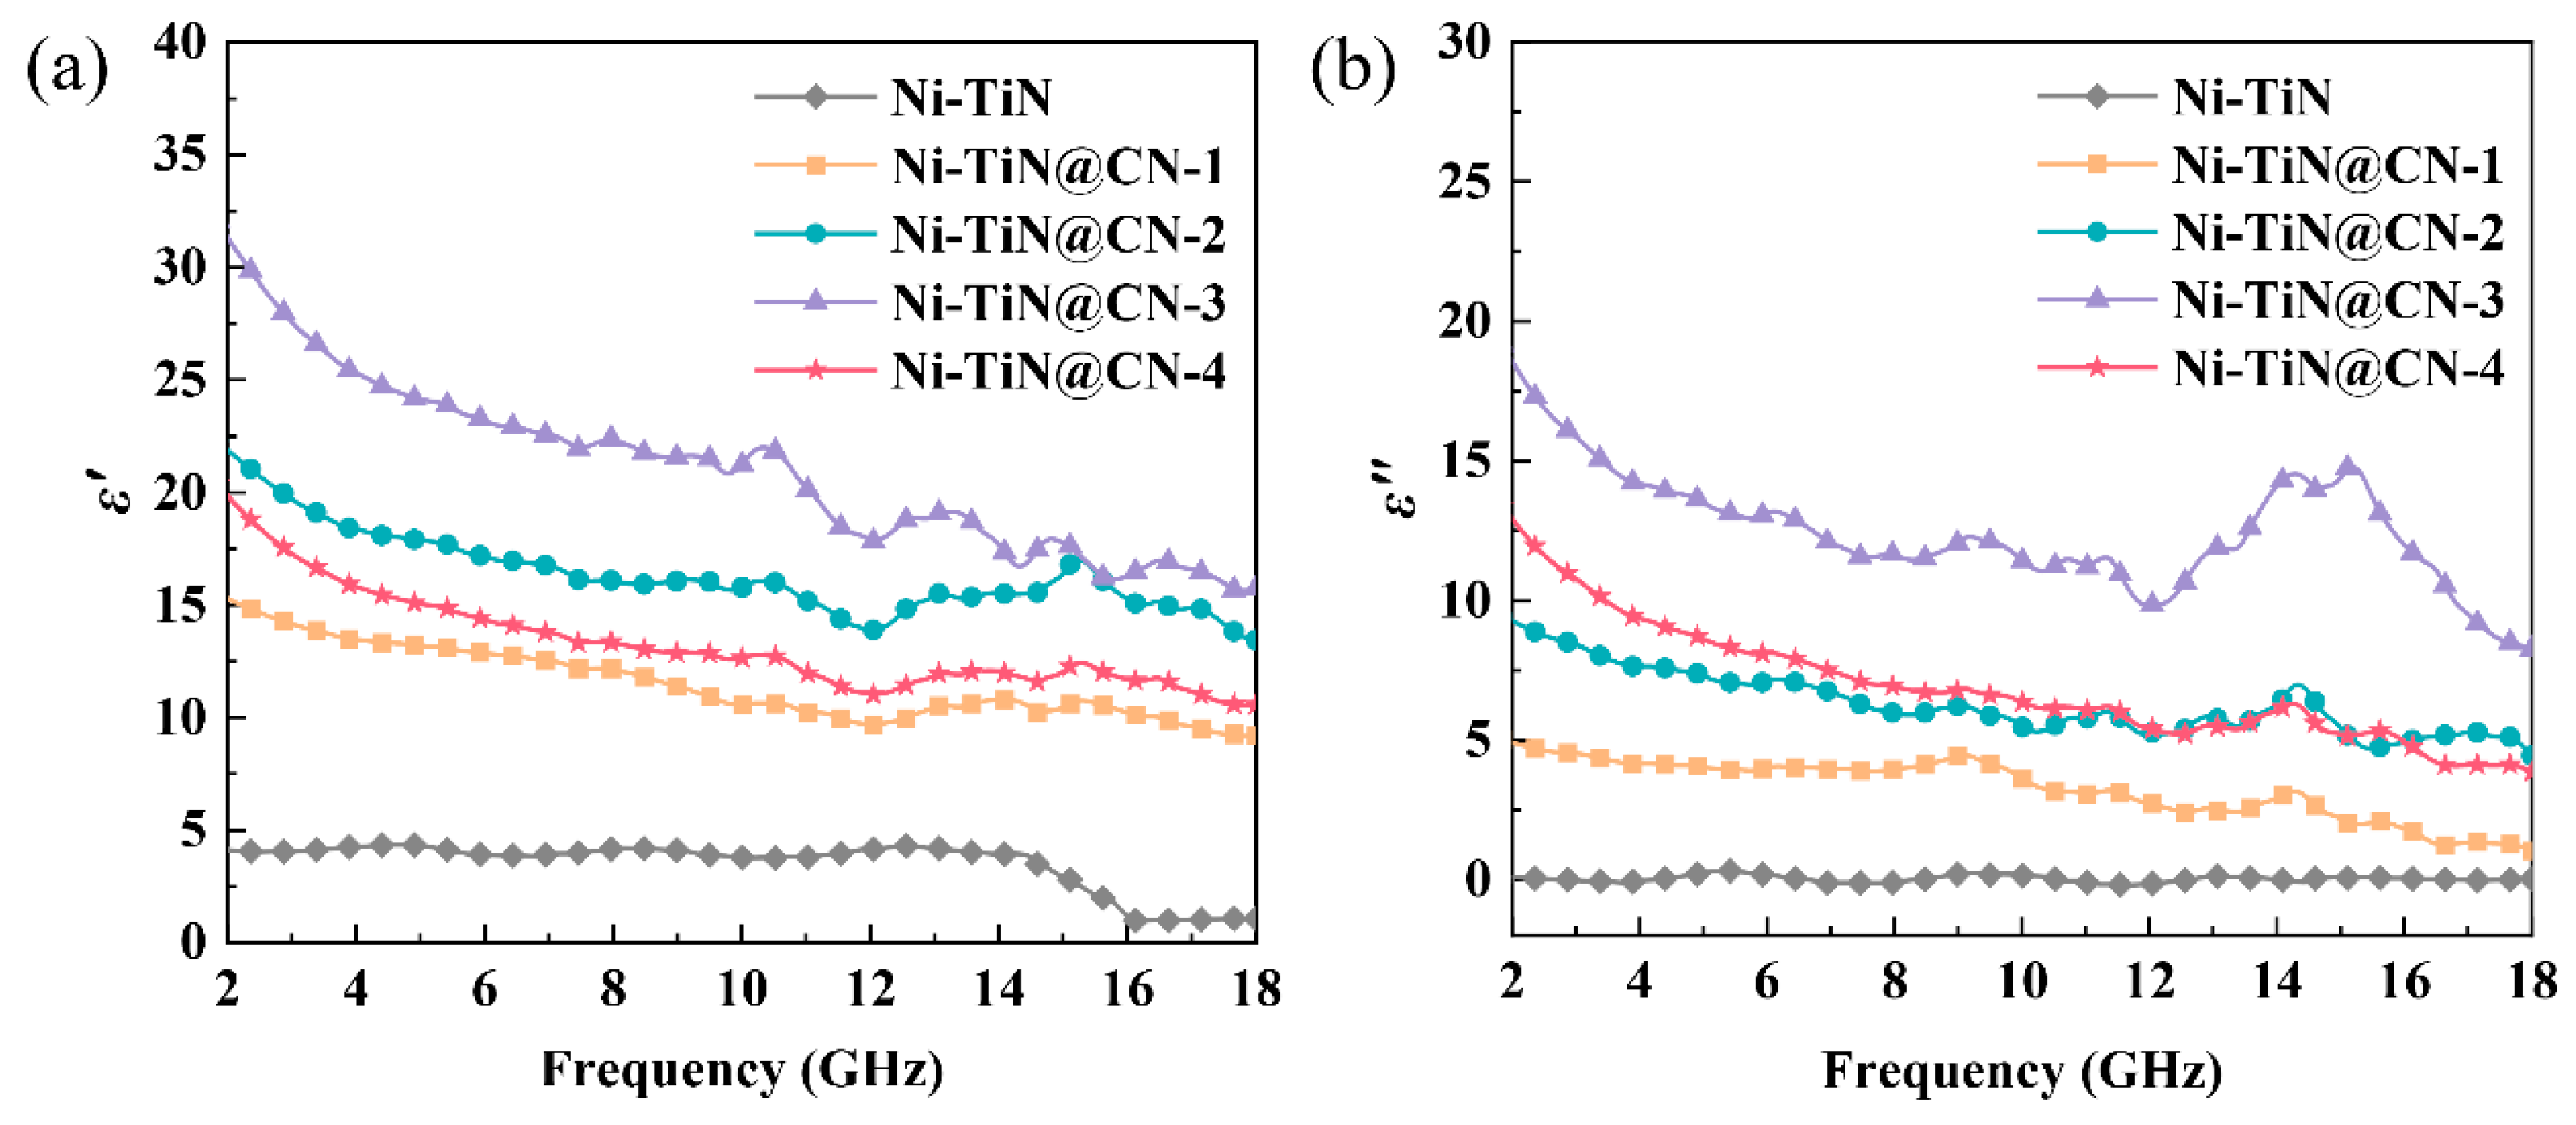
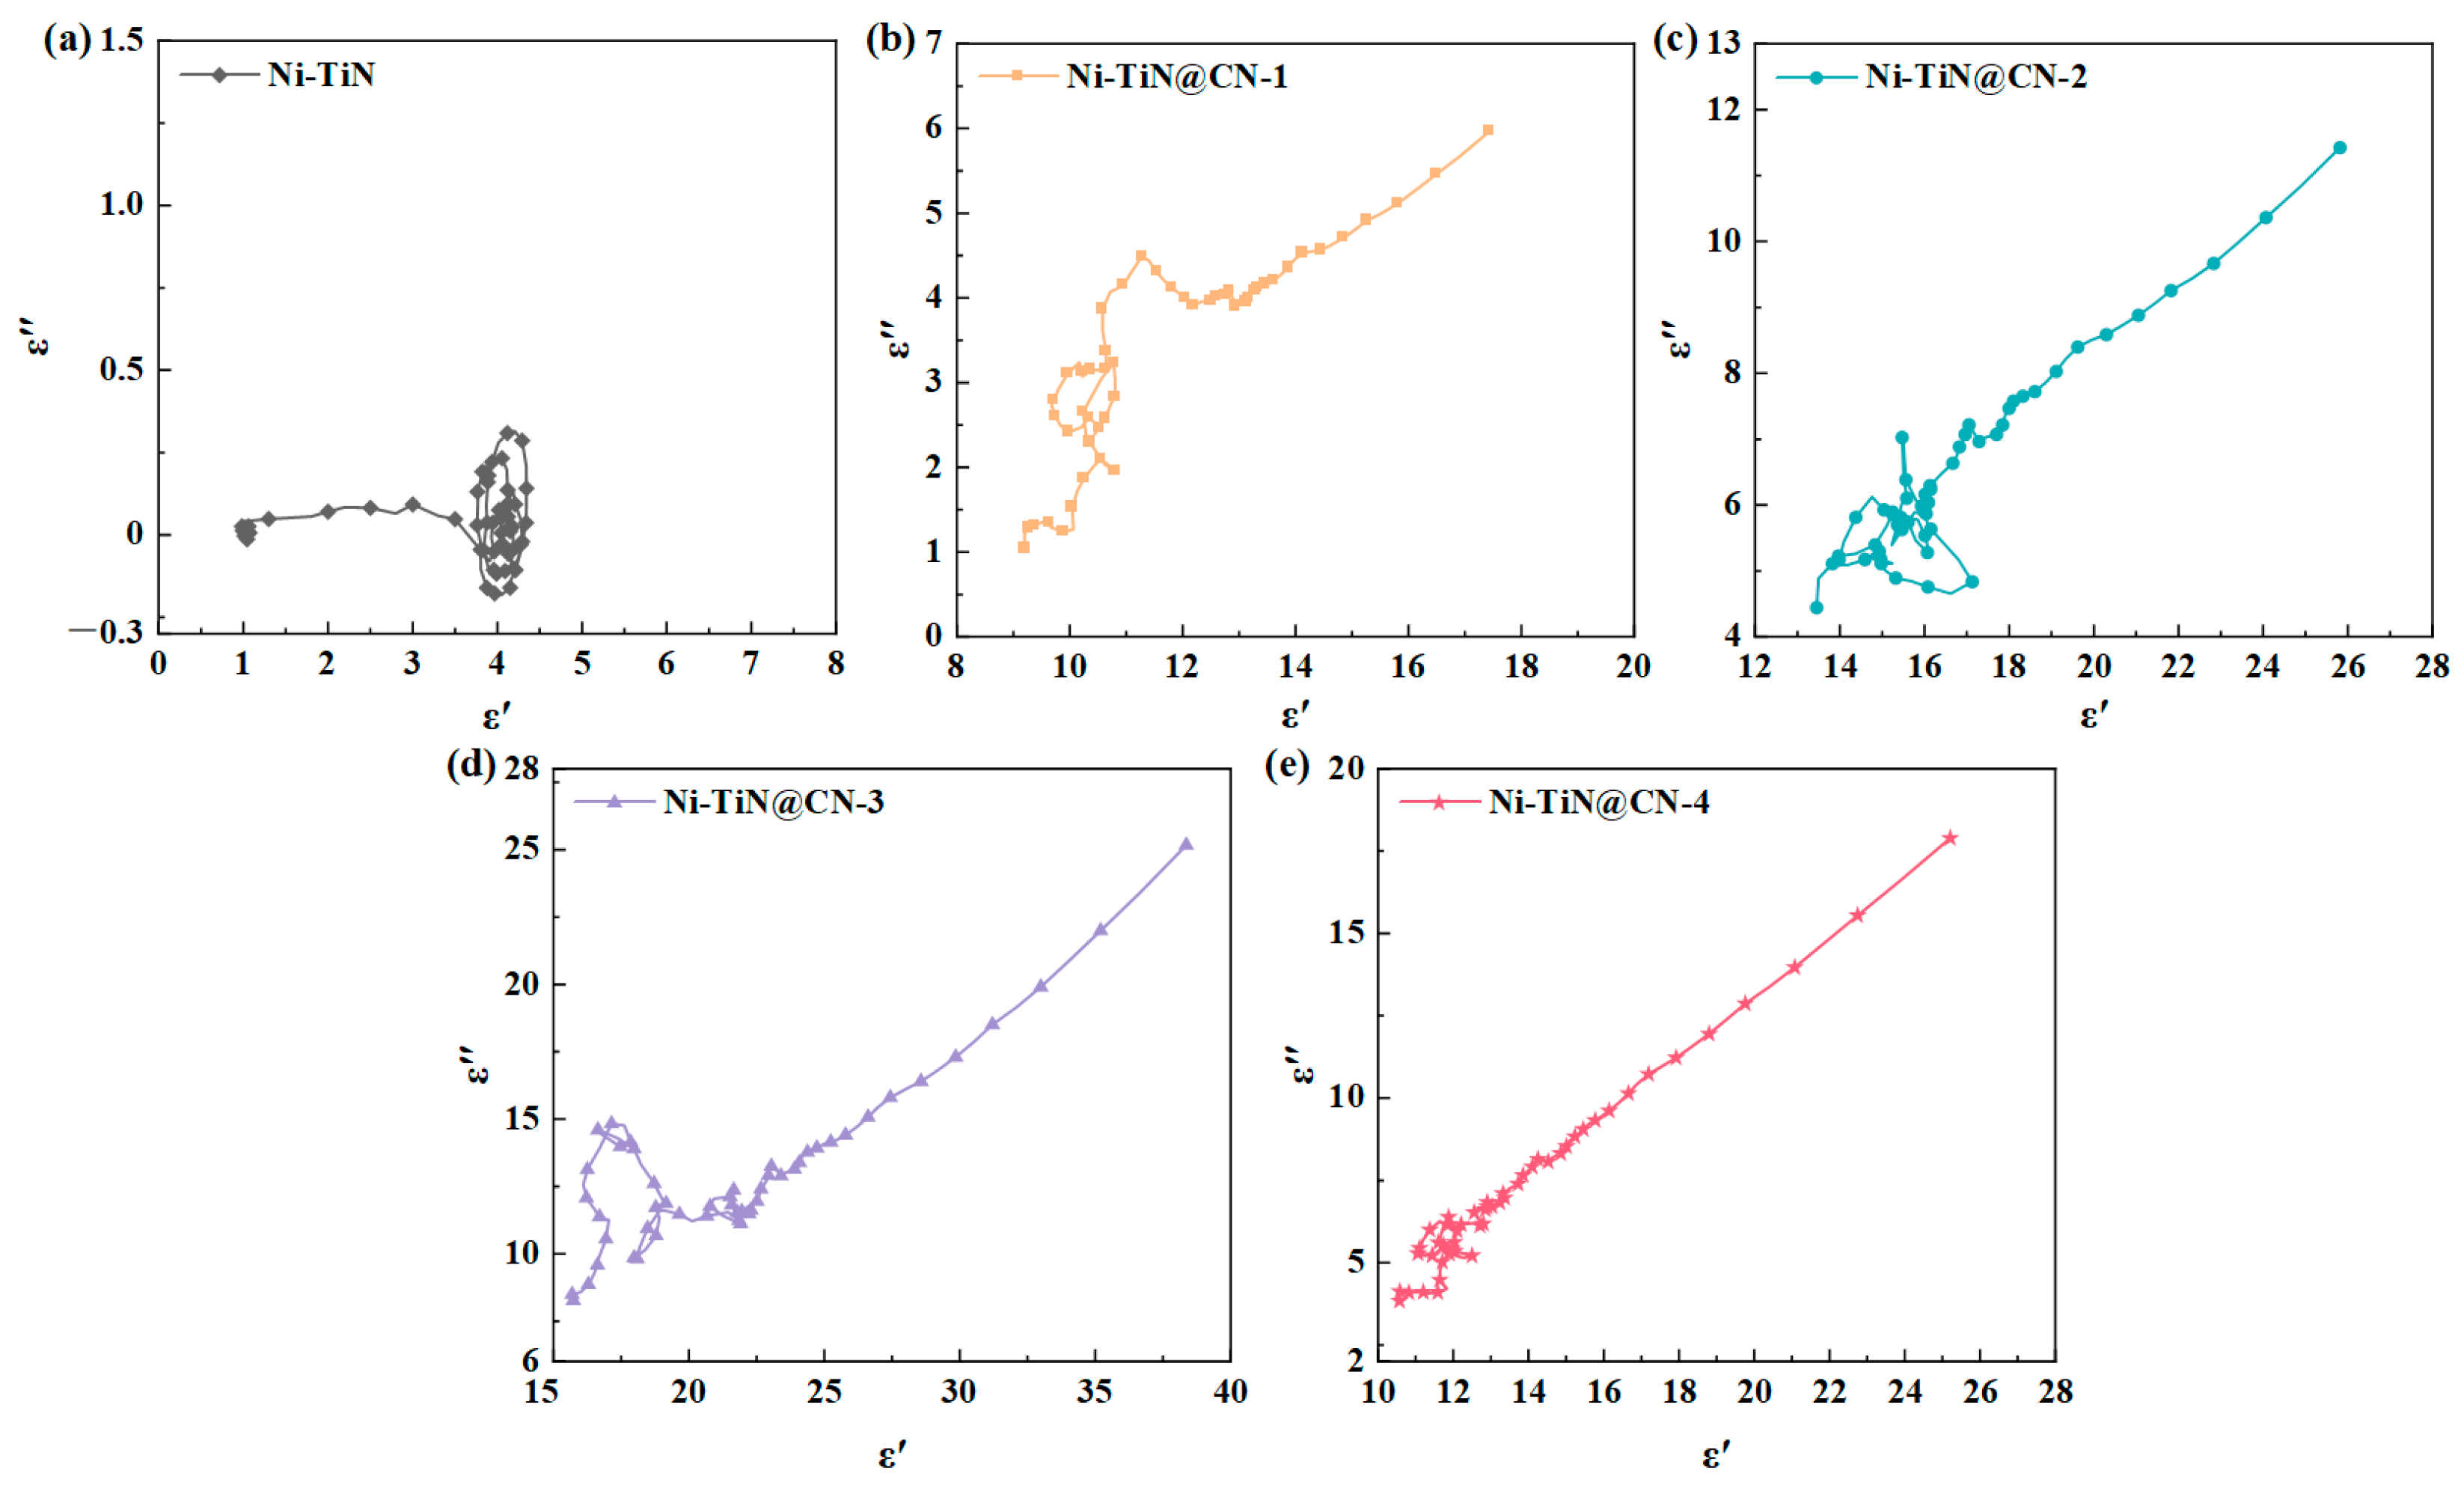
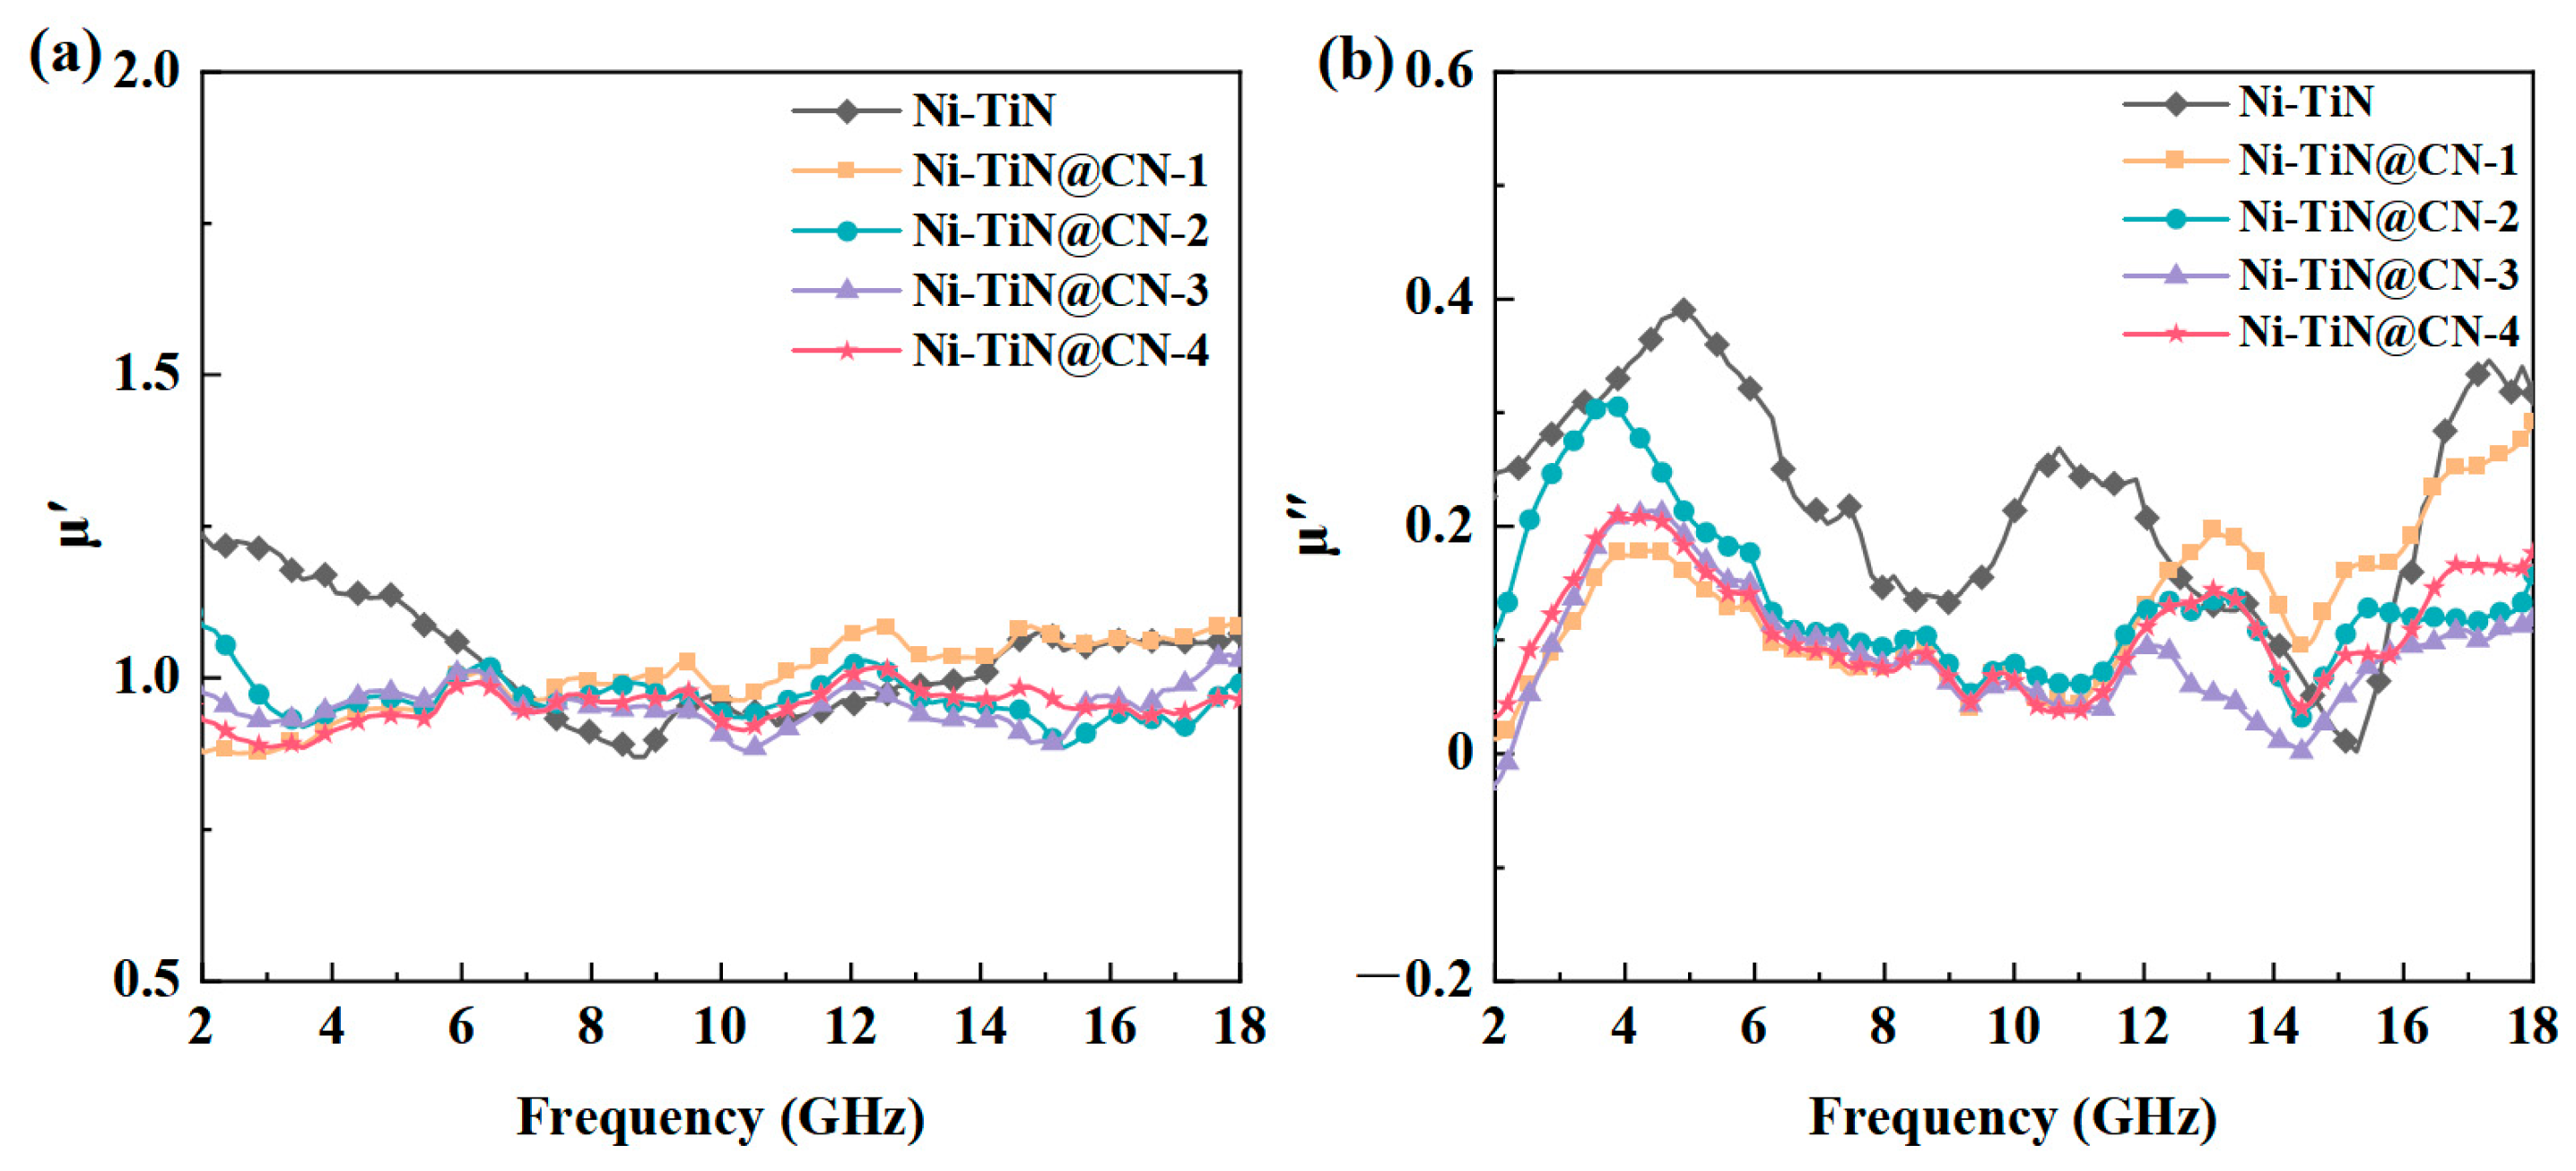
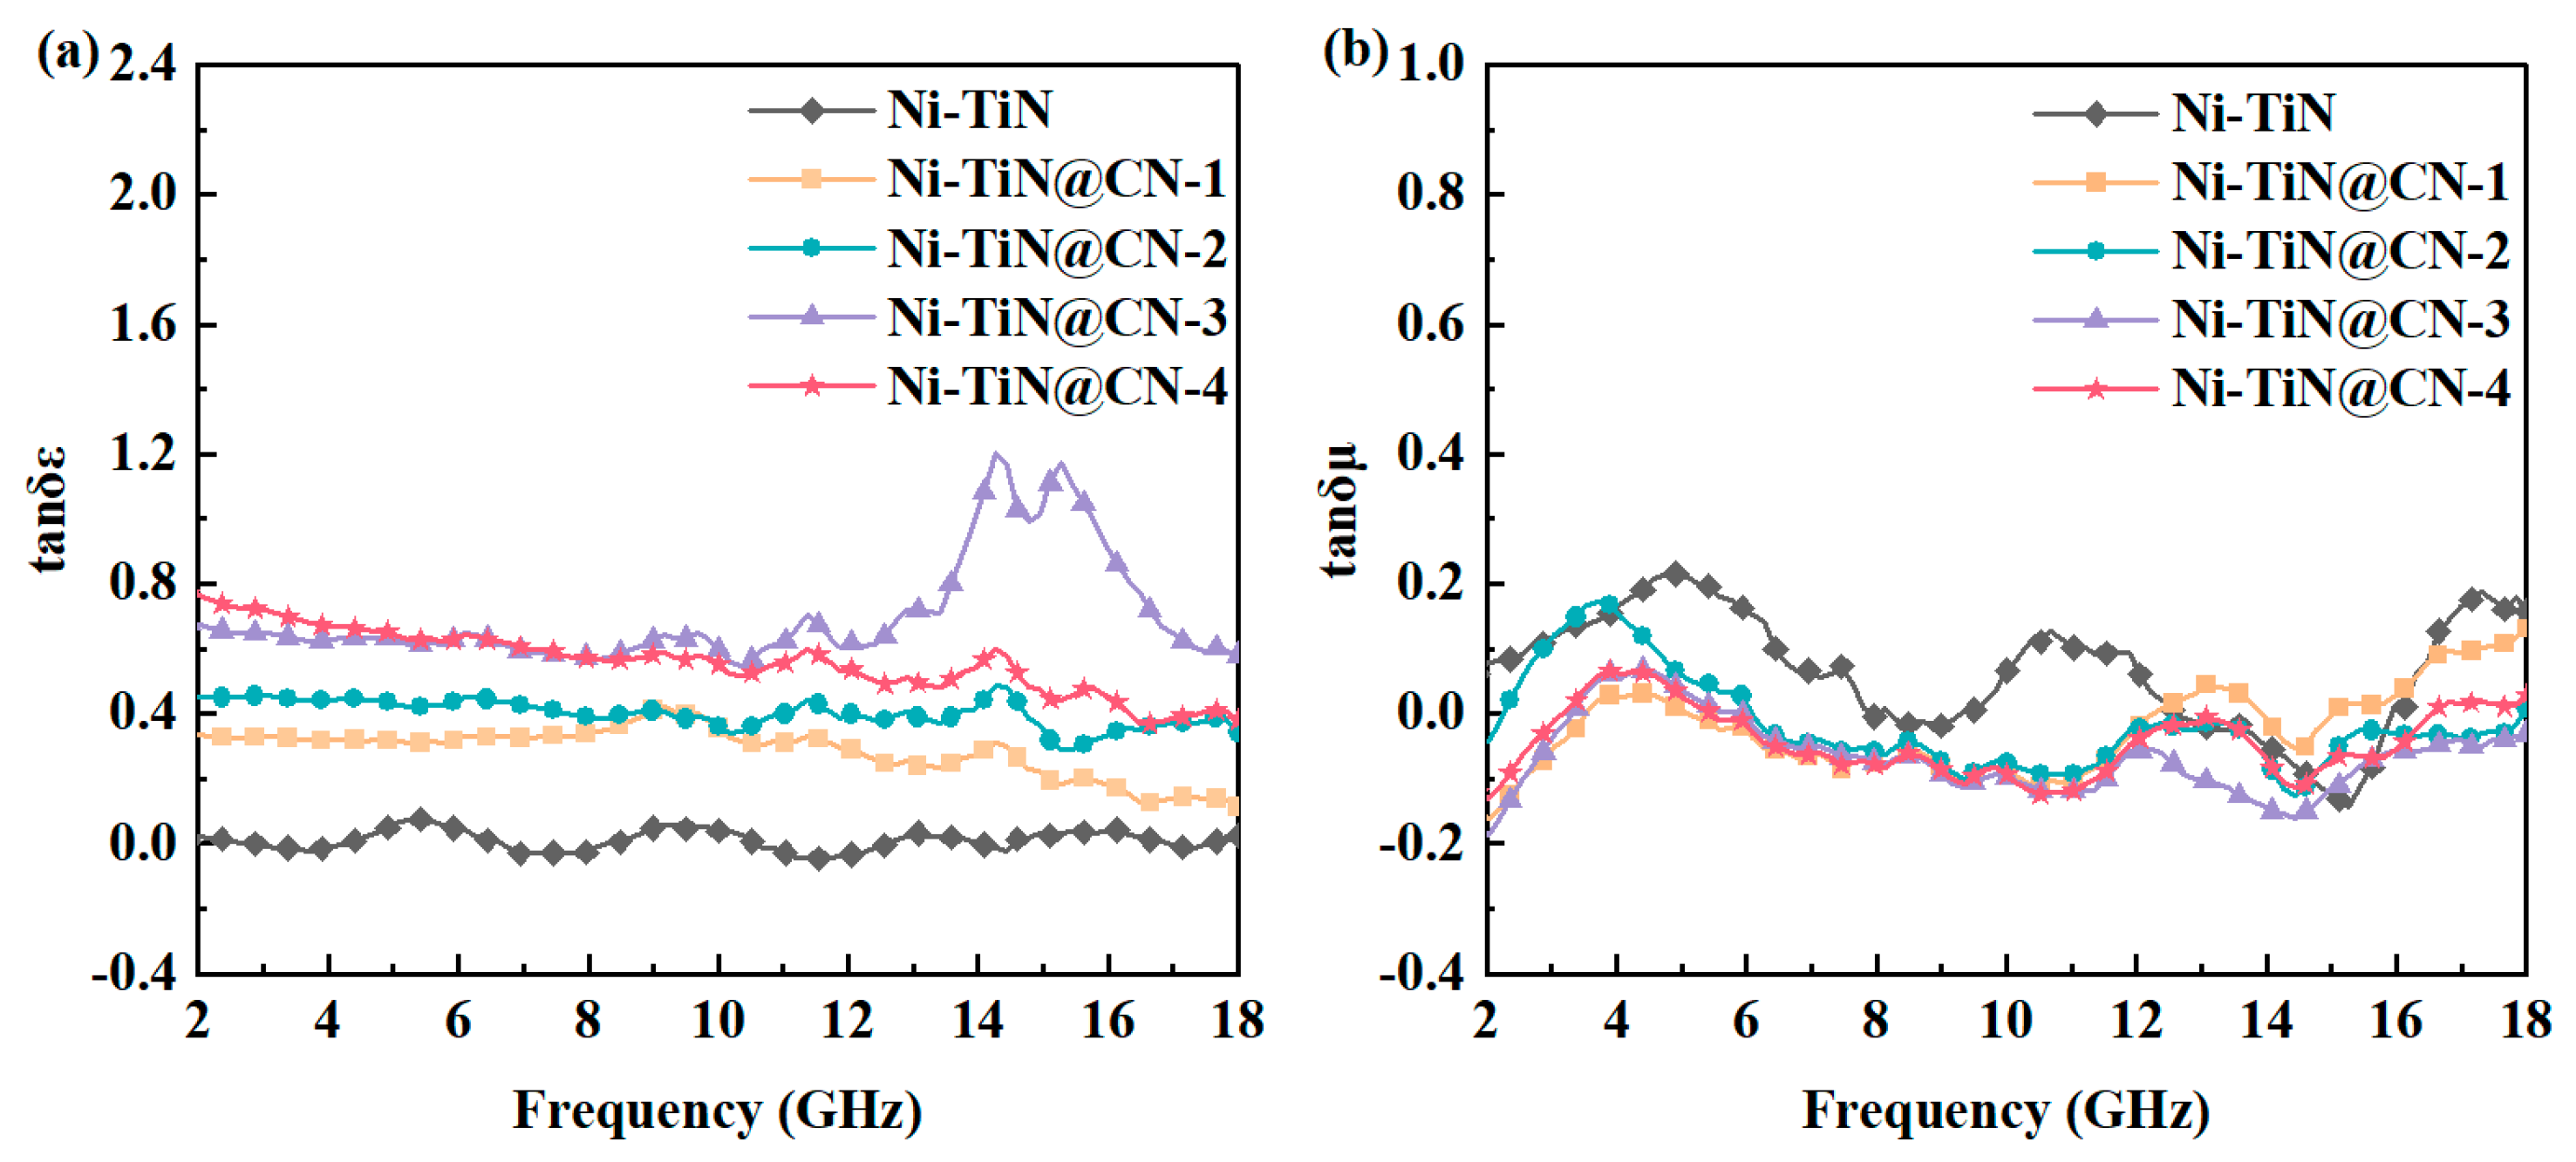
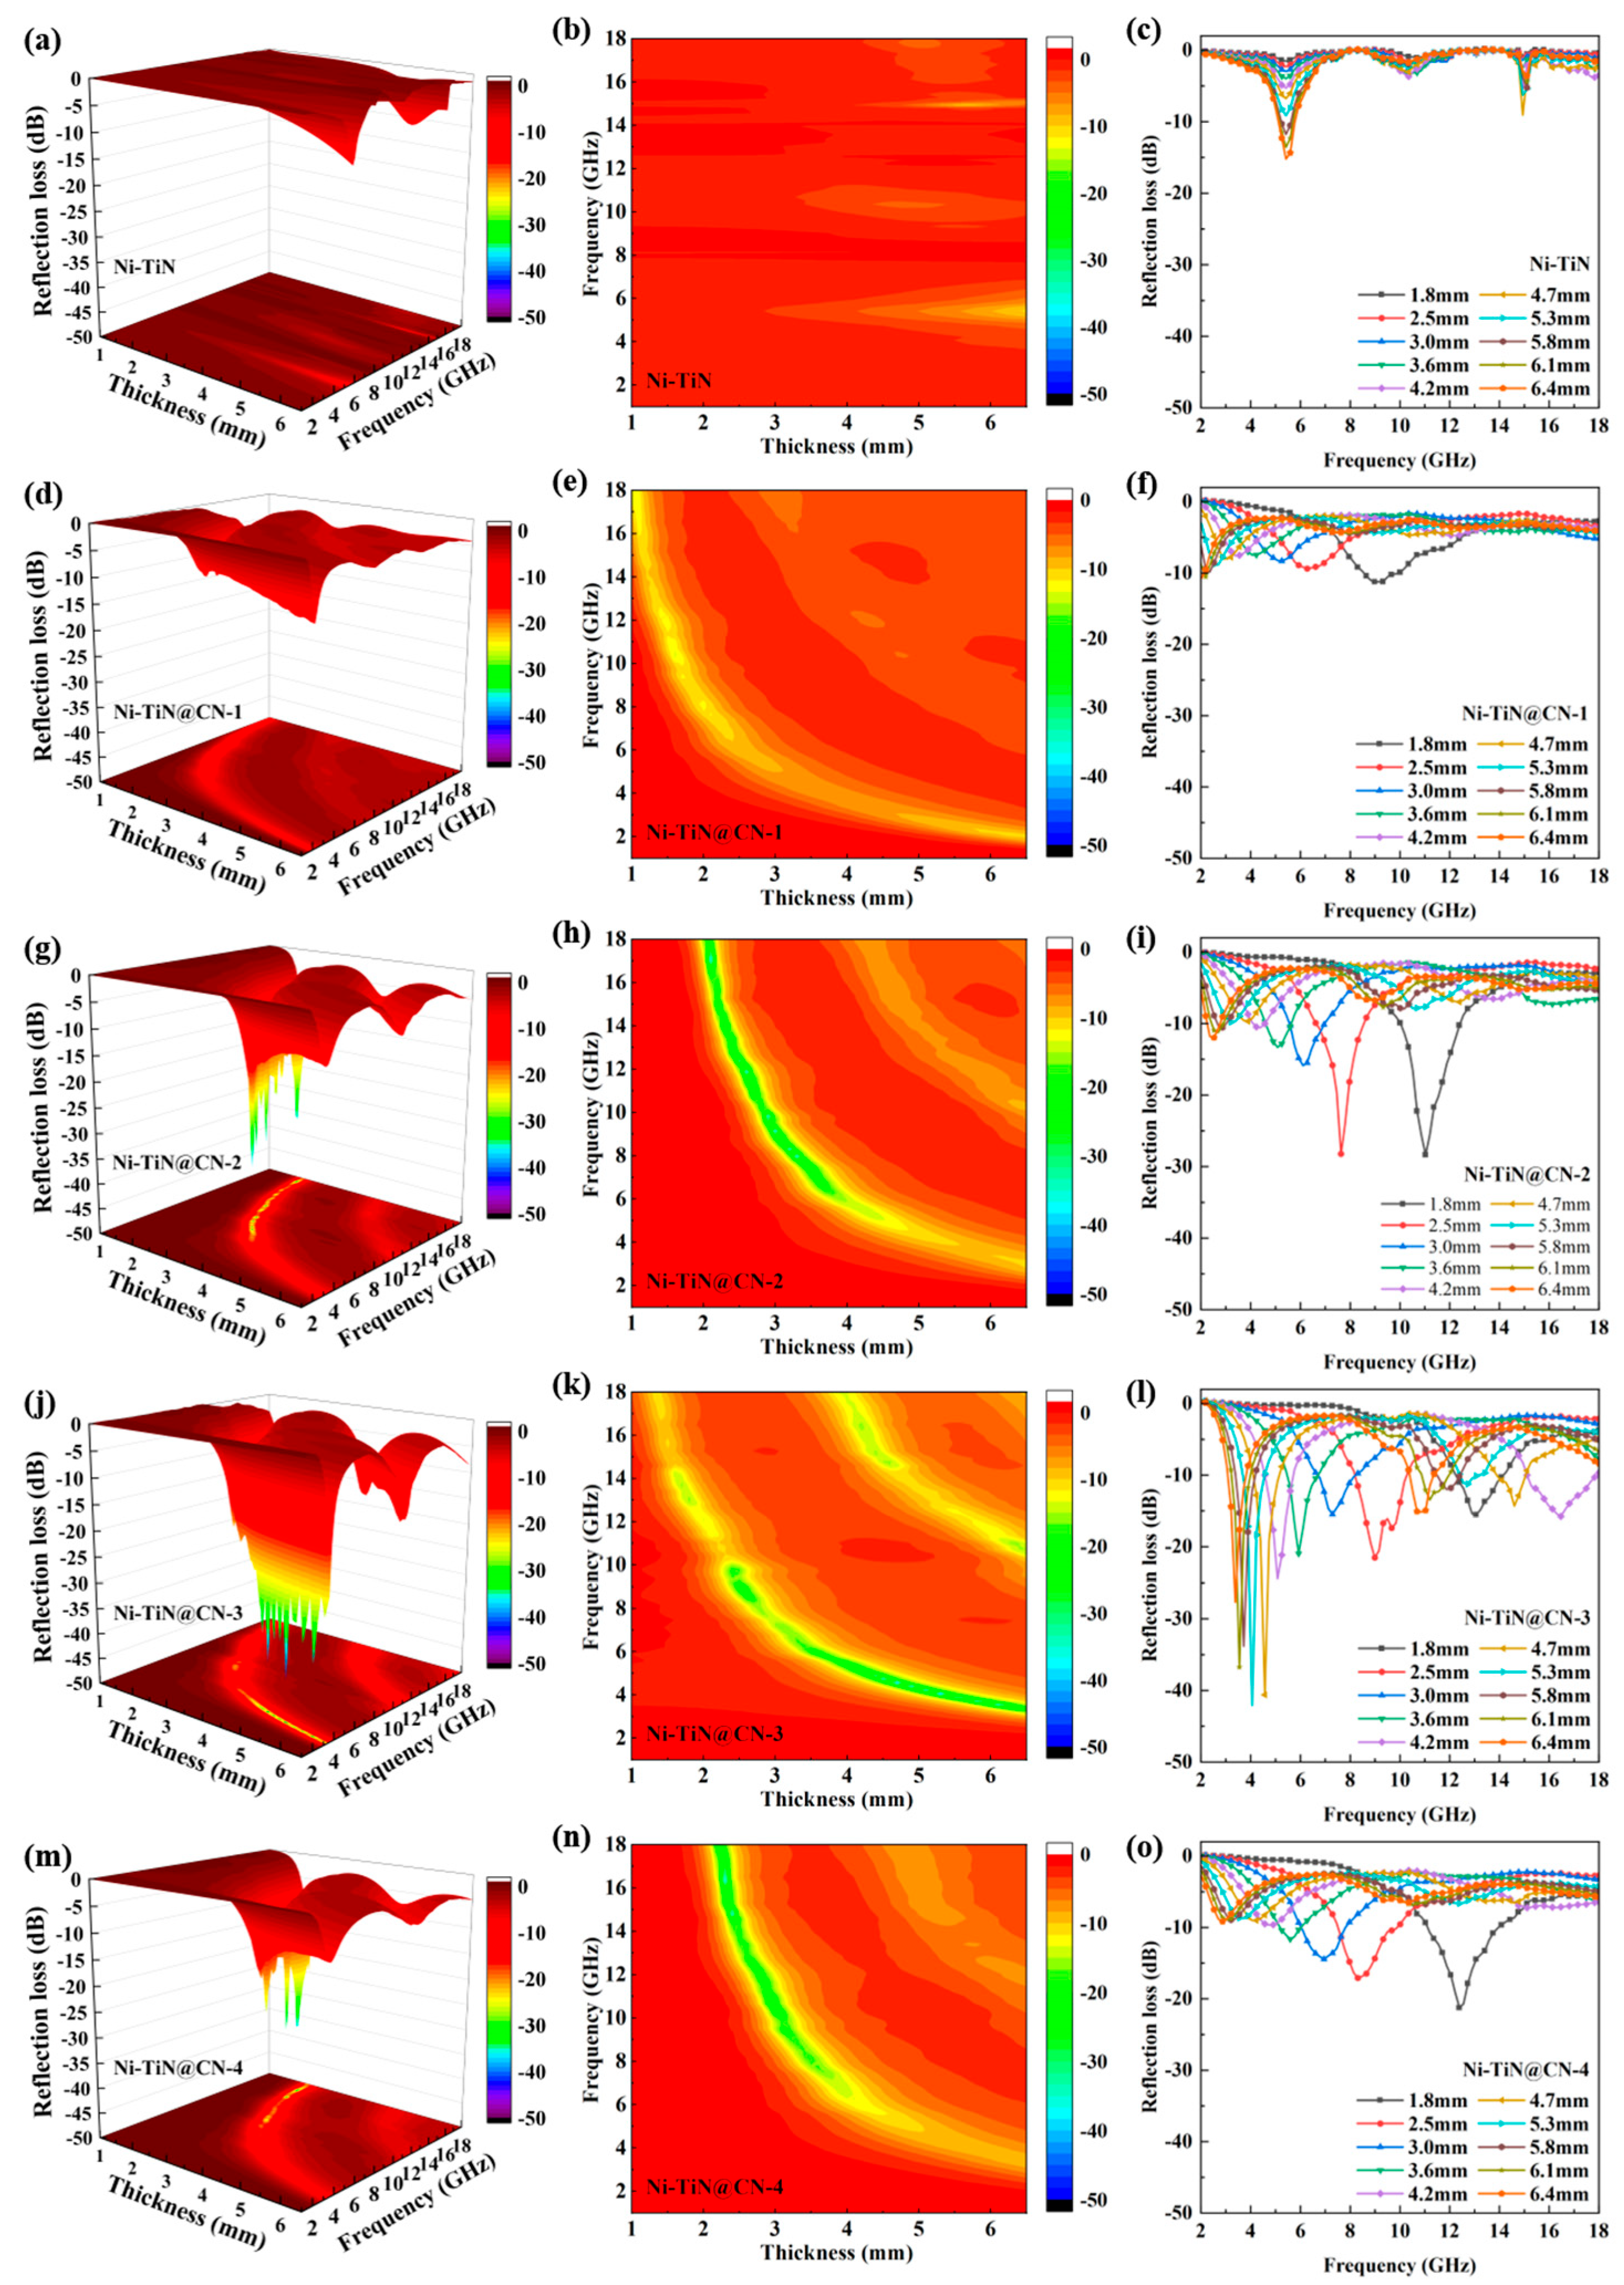
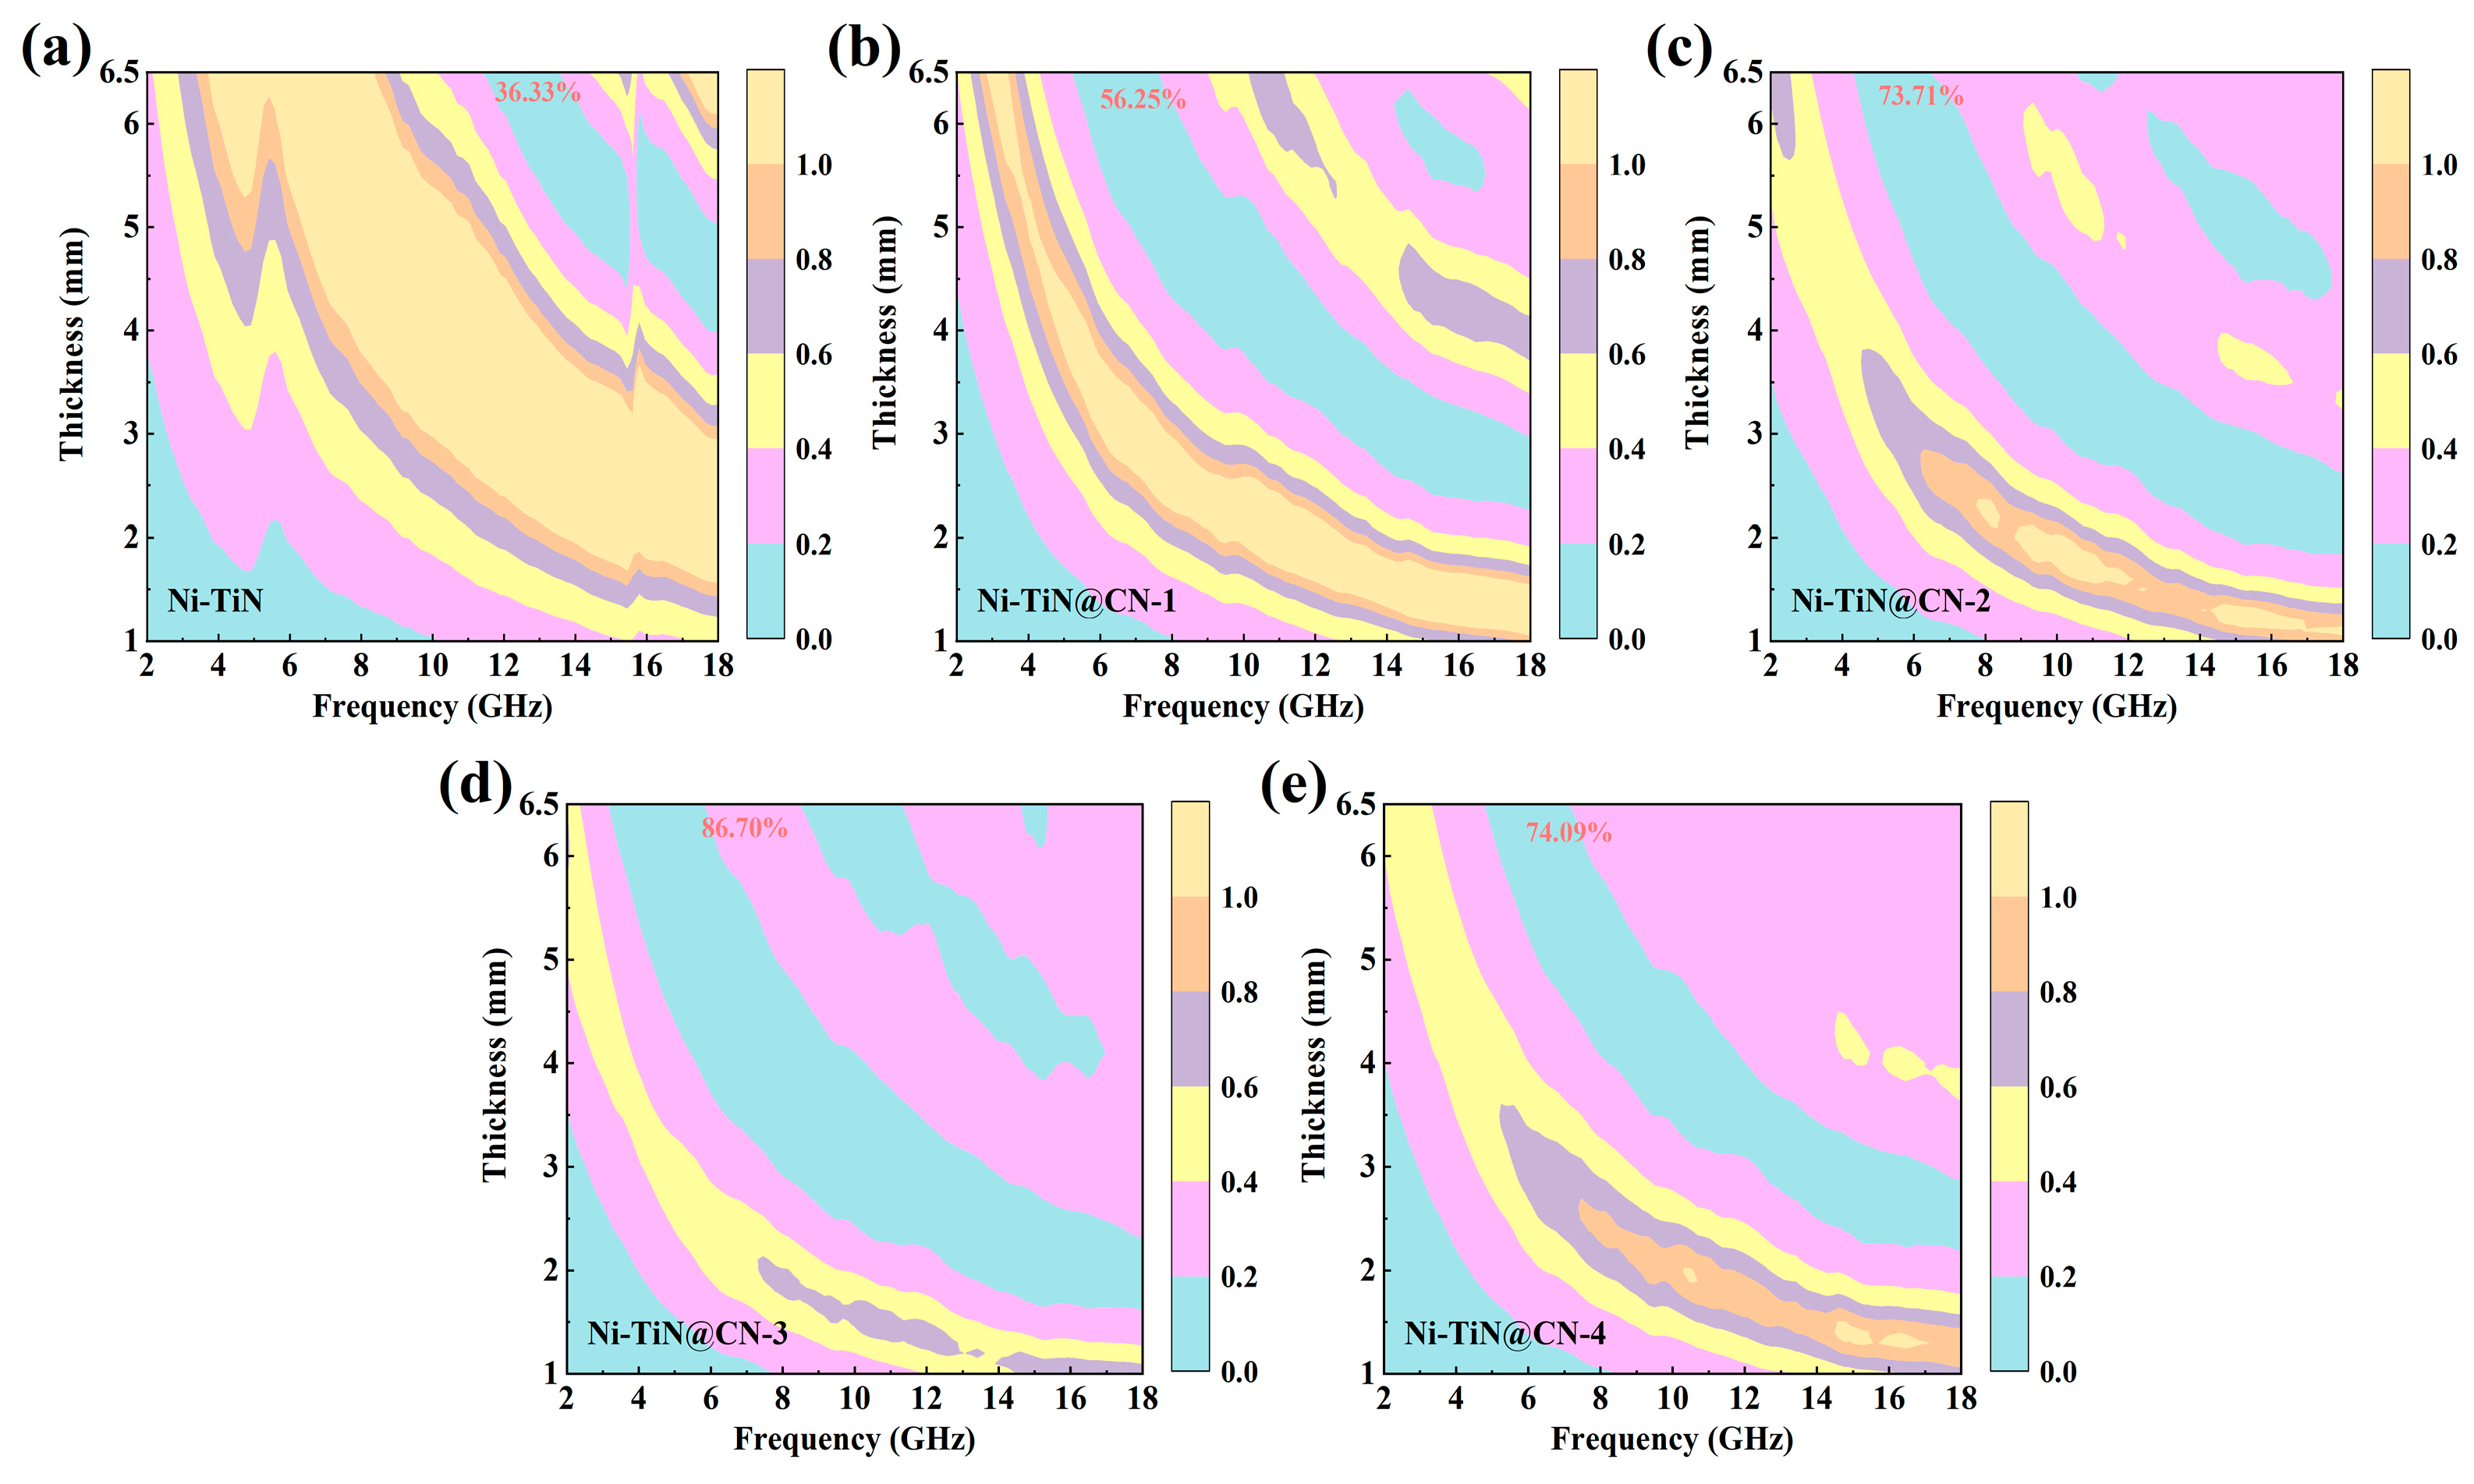
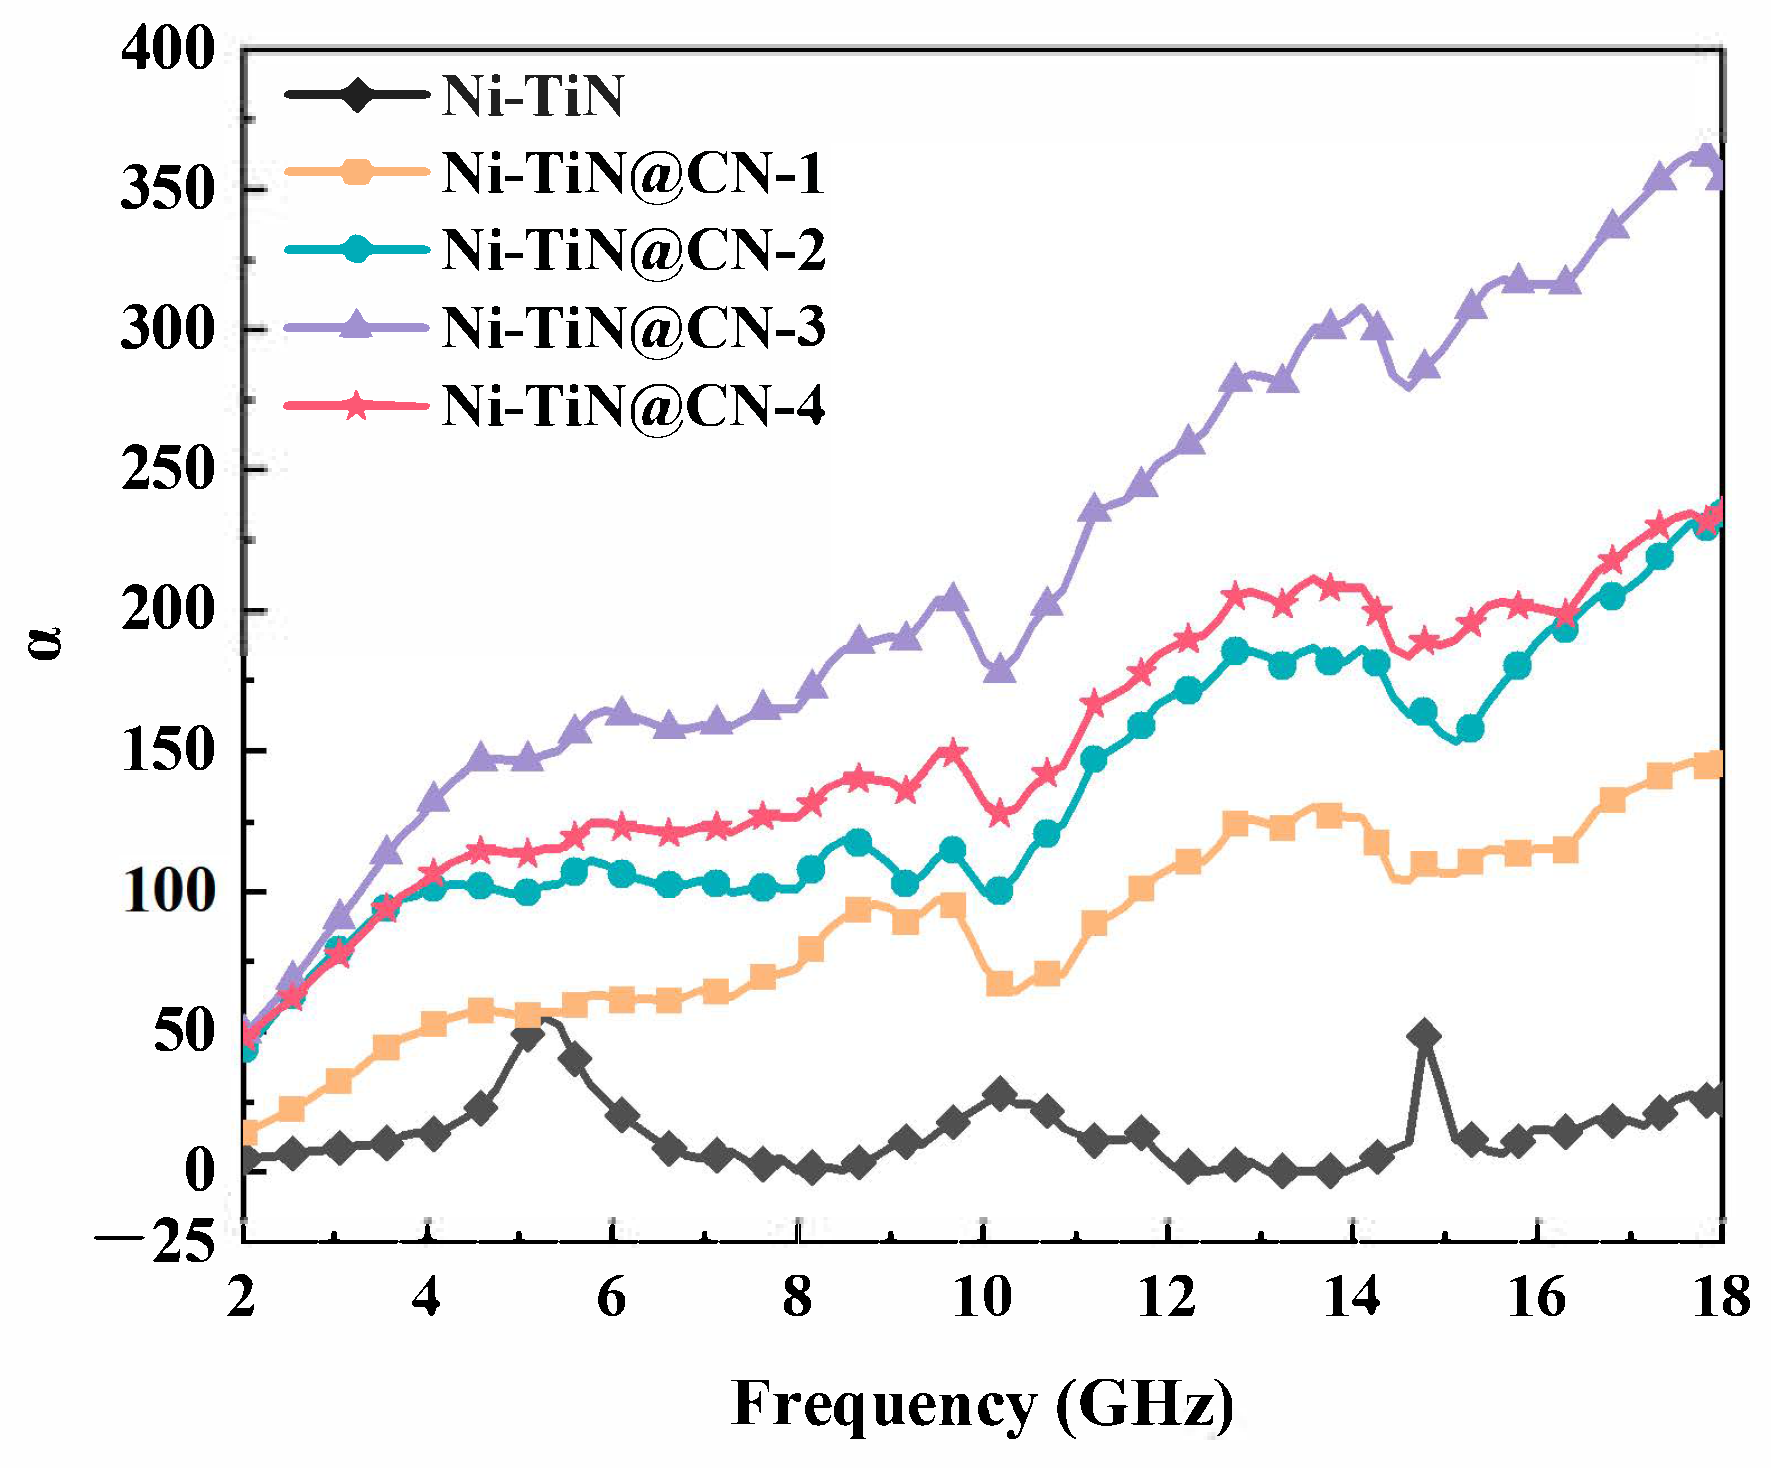
3.2. Electromagnetic Parameters and Microwave Absorption Mechanism

As is well known, the EM wave loss capability of nanocomposite materials depends heavily on their relative complex permittivity (εr = ε′ − jε″) and permeability (μr = μ ′− jμ″) [30,31]. Electromagnetic field theory suggests that the real and imaginary parts represent the storage and loss capacitances of the Ni/TiN@CN nanocomposites, respectively [32]. Therefore, in order to investigate the effect with the depth variation of the CN layer on the microwave absorption properties of the Ni-TiN@CN nanocomposites, the relationships between different DA hydrochloride contents and the electromagnetic parameters of the Ni/TiN nanocomposites–paraffin composites and Ni/TiN@CN nanocomposites–paraffin composites were thoroughly analyzed.
As shown in Figure 6a, the maximum value of ε′ of the Ni-TiN was less than 5, which proves that it had a weak storage capacity for electric charge. After the outer coating of the CN layer, the ε′ of the four samples first increased and then decreased with the thickness change, and the ε′ value of the Ni-TiN@CN-3 sample was obviously higher than the rest of the samples, which proves that it had an excellent storage capacity. Moreover, the real part of the permittivity of the samples after the covering CN layer showed a significant decrease with the increase in the electromagnetic wave frequency, which is a typical dielectric dispersion behavior. It was concluded that the dielectric response of the nanocomposites in the low-frequency region was mainly caused by the conduction of internal charges, while the response of the nanocomposites in the high-frequency region could not keep up with the frequency change and exhibited the dispersion phenomenon [33,34].
Figure 6a displays the frequency-dependent real part of the complex permittivity (ε′) for the Ni-TiN and Ni-TiN@CN composites. It is evident that the ε′ values followed the order Ni-TiN@CN-3 > Ni-TiN@CN-2 > Ni-TiN@CN-4 > Ni-TiN@CN-1 > Ni-TiN across most of the frequency range. This trend indicates that a moderate CN coating (as in CN-2 and CN-3) can significantly enhance the dielectric polarization ability of the composites, likely due to an increased interfacial area and induced dipole polarization. However, excessive coating (CN-4) may hinder the electron mobility, thus reducing the ε′.
Figure 6b shows the values of the imaginary part of the relative complex permittivity of the samples in the frequency range of 1~18 GHz. As can be seen in the figure, the imaginary part of the permittivity that belonged to the Ni-TiN samples varied in the vicinity of 0, which proves that their dielectric loss performance was weak. After the CN layer cladding, the dielectric loss capability of the samples was significantly enhanced, where the imaginary part of the permittivity increased initially and then decreased with the increase in the thickness of the cladding layer. Among them, the ε″ peak value of the Ni-TiN@CN-3 sample reached 18.5. With the increase in frequency, the imaginary part of the permittivity showed more obvious resonance relaxation peaks at the positions of 6 GHz, 9.2 GHz, 11.4 GHz and 14.2~15.2 GHz, which implies that the sample possessed excellent dielectric loss performance [35].
Ni-TiN@CN-3 showed the highest ε″ over a broad frequency range, suggesting enhanced dielectric loss due to its optimal CN shell thickness. Notably, all CN-coated samples exhibited frequency-dependent fluctuation in ε″, indicating multiple dielectric relaxation processes. These results confirm that the CN coating played a key role in modulating the dielectric behavior. As the thickness of the carbon layer increased, the electrical conductivity loss of the material also increased. The substitution of nitrogen atoms for carbon counterparts introduced structural defects within the carbon matrix by generating scattering centers that compromised the carrier mobility, thereby reducing the conductivity loss in the nanocomposites. The Ti and N atoms combined to form titanium nitride (TiN) in a non-stoichiometric ratio under conditions of non-equilibrium in the arc. The result means the presence of defects in the TiN, which could serve as polarization centers, which induced defect polarization. Furthermore, the presence of Ti vacancies resulted in an increased generation of carriers, which, in turn, enhanced the electrical conductivity and improved the conduction loss ability of the Ni-TiN@CN nanotubes. Also, in the case of the Ni-TiN@CN nanotubes, the resulting nickel nanoparticles were embedded in the cubic TiN, which was conducive to enhancing the interfacial polarization [36,37]. In summary, the synergistic interplay of multiple mechanisms endowed Ni-TiN@CN-3 with an optimal dielectric loss performance.
The observed variation in ε″ in the Ni-TiN@CN nanotubes could be attributed to the differing depth of the CN layer, which played an important role in tuning the dielectric response of the Ni-TiN@CN nanotubes and resulted in Ni-TiN@CN nanotubes with various dielectric losses. The outer coating of CN could effectively regulate the dielectric loss performance of the material, and the appropriate thickness of the CN layer could achieve the effective regulation of the dielectric properties of the material, which exhibited more significant dielectric loss performance.
To further confirm the multiple loss mechanism of Ni-TiN@CN nanotubes, the Cole–Cole semicircle is typically employed to describe the relationship between εʹ and ε″, thereby elucidating the underlying diverse polarization loss processes. According to Debye theory, the relevant equations (ε′ and ε″) are as follows [38,39]:
ε = ε + ε s ε 1 + ( 2 π f ) 2 τ 2
ε = ω τ ( ε s ε ) 1 + ( 2 π f ) 2 τ 2
In the formula above, the εs refers to the static dielectric constant, while the ε represent the optical dielectric constant. The f and τ are the matching frequency and relaxation time, respectively. Thus, based on Equations (1) and (2), the Cole–Cole equation can be derived as follows [40]:
( ε ε s ε 2 ) 2 + ( ε ) 2 = ( ε s ε 2 ) 2
Figure 7a–e present the Cole–Cole plots of all five samples. As shown in Figure 7a, the Ni-TiN sample exhibited only a few faint small semicircles, indicating relatively weak Debye dipole relaxation. With the incorporation of the CN layers, the number of semicircular arcs progressively increased, along with a notable enlargement in their radii, as shown in Figure 7b–e. It is widely recognized that an increased number of semicircles corresponds to an enhanced Debye dipole relaxation capacity. In this case, the improved polarization capability primarily originated from the strengthened interfacial and dipole polarization mechanisms in the Ni-TiN@CN nanotubes within the 2~18 GHz frequency range [41]. There were five distinct semicircles in the Cole–Cole plots that belonged to the four samples with a CN layer. Each semicircle corresponded to one dielectric polarization relaxation process [42]. The semicircle interfaced at diversified boundaries due to the multiple heterojunctions, including Ni-TiN, Ni-CN, TiN-CN, CN-CN and CN-wax, which produced a forceful interfacial polarization. The enhanced interfacial polarization arose from the Ni addition to the distinctive octahedral geometry of TiN, which created abundant heterojunction interfaces. The amplified dipole polarization was attributed to N vacancy defects in the TiN structure. Furthermore, as observed in Figure 7b–e, the elongated tails in the Cole–Cole plots of the four CN-containing samples, compared with the CN-free sample, signified greater conductivity-related losses. Notably, the conductivity loss initially increased with the CN layer thickness but subsequently diminished at higher depths. As mentioned above, both the TiN with defects and N atoms doped into the graphite lattice contributed more carriers, which could rapidly move in a three-dimensional conductive micro-network channel and resulted in significant conductivity loss. These presented a long straight tail in the Cole–Cole diagram [43].
The improved dielectric relaxation loss capability after the external cladding of the CN shell layers was attributed to the introduction of additional nitrogen-doped graphitic carbon and multiple heterogeneous interfaces involved in the Ni-TiN@CN nanotubes. The nitrogen-doped graphitic carbon produced by the in situ pyrolysis of dopamine had more defects and dangling bonds. These defects and dangling bonds acted as polarization centers that induced the production of more dipoles and triggered strong dipole polarization [44]. The addition of the shell layer also added abundant heterogeneous interfaces in the nanocapsule complexes, which triggered strong interfacial polarization.
It can be seen from the figure that Ni-TiN@CN-3 had multiple irregular Cole–Cole semicircles of significantly larger radii in the curve, showing the material had acquired a stronger polarization relaxation loss capability, in addition to exhibiting the longest long tail in the high-frequency region, which also reflects the material’s optimal conductivity loss capability [45]. Therefore, an optimal depth of the CN layer in Ni-TiN@CN nanotubes enables a balanced enhancement of polarization loss and conductive loss performance, synergistically improving electromagnetic energy dissipation capabilities, as shown in Figure 7e.
The Ni-TiN@CN nanocomposites, also due to the ferromagnetic Ni elements contained in their own cores, were able to produce certain magnetic losses due to a magnetic moment flip under the action of an alternating electromagnetic field [46]. As shown in the figure, from the imaginary part of the magnetic permeability, the magnetic storage capacity of the Ni-TiN samples appears to change significantly from low to high frequencies, and the real part of the magnetic permeability of the four Ni-TiN@CN samples with different thicknesses did not fluctuate significantly around the value 1 with the changing frequency.
The Ni-TiN@CN nanocomposites also demonstrated magnetic loss characteristics. As illustrated in Figure 8, the Ni-TiN sample presented a much higher magnetic loss ability, which was due to its own ferromagnetism. The four samples covered in a CN layer exhibited a consistent trend in the variation in the relative complex permeability, indicating a uniform magnetic response in the 2~18 GHz range. Magnetic losses are primarily governed by natural and exchange resonances. The magnetic permeability revealed that the four synthesized nanocapsules exhibited multiple magnetic resonance features. Specifically, the Ni-TiN@CN nanocapsules demonstrated three distinct resonance peaks positioned at 3.89 GHz, 11.9~13.2 GHz and after 15.28 GHz. Due to Snoek’s limit, natural resonance predominantly occurs at lower frequencies, which is fundamentally governed by the strength of the magnetic anisotropy field. Exchange resonance predominantly manifests in high-frequency regimes and is governed by the exchange energy interplay between the grain boundaries and surface anisotropy [47]. Consequently, the resonance peak at 3.89 GHz was ascribed to natural resonance, while the remaining two peaks were attributed to exchange resonance. The magnetic loss mechanism in the material was predominantly governed by three key contributions: (1) the intrinsic magnetic properties introduced by the incorporation of Ni; (2) the weak ferromagnetic behavior that arose from non-stoichiometric TiN due to nitrogen vacancies and associated spin polarization; (3) the presence of intrinsic structural defects, such as dislocations and grain boundaries, which induced localized magnetic ordering through spin canting or defect-induced magnetic moments, which collectively enhanced the overall magnetic loss performance.
The dielectric loss tangent (tanδε = ε″/ε′) and magnetic loss tangent (tanδμ = μ″/μ′) were used to measure the strengths of the dielectric loss and magnetic loss. A larger tangent value implies a stronger attenuation ability [48,49]. As shown in Figure 9a, among the dielectric loss tangent values of the five samples, the dielectric loss ability of sample 3 was the strongest, which was above 0.6 on the whole, and the maximum value reached 1.2. Analyzing the magnetic loss tangent value, the magnetic loss of the sample without the coated CN layer was the strongest, while the coated ones were weak, as shown in Figure 9b. Compared with the magnetic loss, the dielectric loss played a more significant role in the loss process of the electromagnetic energy.
To further elucidate the influence of the CN layer’s depth on the microwave absorption performance of the Ni-TiN@CN nanotubes, the reflection loss (RL) values of the Ni-TiN@CN–paraffin composites were calculated based on the experimentally determined electromagnetic parameters in accordance with the principles of transmission line theory. The corresponding equations are expressed as follows [50]:
R L ( d B ) = 20 log ( Z i n Z o ) / ( Z i n + Z o )
Z i n = Z o ( μ r / ε r ) 1 / 2 tanh [ j ( 2 π f d / c ) ( μ r ε r ) 1 / 2 ]
Here, Zin denotes the normalized input impedance of the sample; Zo represents the input impedance of free space; μr and εr refer to the complex permeability and complex permittivity, respectively; d is the thickness of the sample; f is the frequency of the incident; and c is the speed of light in a vacuum.
As illustrated in Figure 10, the reflection loss (RL) values for the five samples were individually calculated across the frequency range of 2~18 GHz, demonstrating their respective microwave absorption performance. As illustrated in Figure 10a–c, sample Ni-TiN demonstrated a minimum reflection loss (RL) of −15.21 dB at 5.42 GHz with a thickness of 6.4 mm. And the whole reflection loss curve does not show the change in reflection loss value with the electromagnetic wave frequency, which was caused by the high conductivity of the Ni-TiN powder. In contrast, the electromagnetic wave absorption performance of the samples with the CN layer was significantly improved.
The introduction of the nitride-doped carbon layer coating on the nanoparticle surfaces effectively mitigated the agglomeration issues and enhanced the microwave absorption abilities. As shown in Figure 10d–f, Ni-TiN@CN-1 exhibited a minimum reflection loss of −13.34 dB with a thickness of 1.6 mm, while the effective absorption bandwidth (EAB, RL ≤ −10 dB) was 1.41 GHz. With the increase in the depth of the CN layer, Ni-TiN@CN-2 showed a minimum reflection loss of −37.25 dB at 7.97 GHz, with a thickness of 3.3 mm, and the EAB (RL ≤ −10 dB) was 8.7 GHz. Table 1 compares the electromagnetic wave absorption performances of the five samples.
It showed a trend of increasing and then decreasing with the thickness of the CN layer, indicating that there was an optimal value for the thickness of the outer CN shell layer for the Ni-TiN@CN nanocapsules with the core–shell structure, which can make a balance with dielectric and magnetic losses for maximal wave attenuation. The optimal reflection loss of the sample with 200 mg of dopamine hydrochloride reached −42.05 dB at 4.06 GHz, and the thickness of the absorber layer was 5.3 mm. Based on the 3D and 2D plots of the absorption performance, it was also found that the sample had an excellent absorption performance in the low-frequency region, and the integrated effective absorption bandwidth of less than −20 dB could reach 6.5 GHz, as shown in Figure 10j–l. The increase in the content of nitrogen-doped graphitic carbon could increase the absorption performance to a certain extent, which could be improved. An appropriate increase in the content of nitrogen-doped graphitic carbon could improve the wave-absorbing properties of the nanocapsules to a certain extent, but an excessive amount of nitrogen-doped graphitic carbon weakened the wave-absorbing properties of the nanocapsules. Therefore, precise control over the CN shell thickness was essential for optimizing the microwave absorption performance of Ni-TiN@CN nanocapsules.
Table 2 compares the electromagnetic wave absorption performance of the present Ni-TiN@CN composites to those of other absorbers [51,52,53,54,55]. The ultrabroad absorption bandwidth combined with strong absorption caused the Ni-TiN@CN composites to be highly competitive in the microwave absorption field. Thus, we believe that the as-obtained Ni-TiN@CN composites in this study were favorable due to their significant electromagnetic absorption.
The superior microwave absorption performance of an absorbent is governed by two key factors: impedance matching and attenuation capability, in addition to the inherent dielectric and magnetic loss properties of the composite material. Specifically, optimal microwave absorption is not solely determined by enhanced dielectric and magnetic losses but is also contingent upon achieving an effective balance between impedance matching and attenuation capability. Impedance matching can be defined as the condition where the characteristic impedance of the microwave absorbent closely approximates that of free space, thereby ensuring the penetration of electromagnetic waves into the material is maximized and efficient energy dissipation through intrinsic loss mechanisms is enabled.
Improved impedance matching determined the efficient EM wave absorption property in the microwave absorption materials. We adopted a delta-function method to describe the impedance matching degree between the absorbents and free space in our work based on the following equations [56]:
Δ = sinh 2 ( K f d ) M
where K and M can be defined as the relative complex permittivity and complex permeability.
K = 4 π ε μ sin δ e + δ m 2 c cos δ e cos δ m
M = 4 μ cos δ e ε cos δ m ( μ cos δ e ε cos δ m ) 2 + [ tan ( δ m 2 δ e 2 ) ] 2 ( μ cos δ e + ε cos δ m ) 2
while the attenuation competencies of microwave absorbents can be estimated using the attenuation constant, where the relevant formula is as follows [57]:
α = 2 π f c × ( μ ε μ ε ) + ( μ ε μ ε ) 2 + ( μ ε + μ ε ) 2
Here, f is the microwave frequency, and c is the speed of light in a vacuum.
According to the idea proposed in the literature, it can be observed that a small delta value (typically |Δ| ≤ 0.4) signifies optimal impedance matching, as it indicates that the impedance of the absorbent closely aligns with that of free space under such conditions [58]. In this study, |Δ| ≤ 0.4 was used as the standard to evaluate the impedance-matching performance of the sample, and the ratio of the effective impedance-matching area (|Δ| ≤ 0.4) to the total area of the sample was defined as β. According to the calculation results, the two-dimensional distribution of the |Δ| function was plotted and the matching ratio β value of each sample was calculated separately, as shown in Figure 11. The β value of the Ni-TiN sample was 36.33%, indicating that very few electromagnetic waves entered the nanocomposites. The nanocomposites coated with the CN layer showed a significant increase in its β value. The optimal β value was 86.70%, which belonged to Ni-TiN@CN-3. In summary, the Ni-TiN@CN-3 sample had the best impedance-matching effect, which means that more electromagnetic waves penetrated into the nanocomposites and activated the intrinsic energy dissipation.
The curves of the attenuation coefficient vs. electromagnetic wave frequency for five samples were plotted as shown in Figure 12 by selecting the optimal thickness of 5.3 mm. From the attenuation coefficient plots, it can be seen that for the five samples, the Ni-TiN nanopowder attenuation performance showed three attenuation peaks in the range of 2~18 GHz, which were located at 5.25 GHz in the low-frequency region, 10.18 GHz in the mid-frequency region and 14.4 GHz in the high-frequency region, and the losses in this section were mainly considered to originate from the hysteresis loss and limited intrinsic loss mechanisms of the uncoated Ni-TiN. The attenuation coefficients of the Ni-TiN@CN nanocomposites also increased and then decreased with the increase in the CN layer thickness. Among them, Ni-TiN@CN-3 demonstrated the highest overall α values, particularly in the low-frequency range, indicating its strong capability to dissipate electromagnetic energy through synergistic dielectric and magnetic losses. However, similar to previous results, the attenuation capacity followed a non-monotonic trend with increasing CN thickness, again highlighting the critical role of the shell thickness in optimizing the EM wave absorption.
The impedance matching and attenuation coefficients also further confirmed that a properly tuned CN shell thickness, as seen in Ni-TiN@CN-3, could simultaneously achieve strong attenuation and effective impedance matching, which made the material possess excellent electromagnetic wave absorption properties.

4. Conclusions

In summary, we successfully fabricated the crystal-cluster-cube Ni-TiN@CN nanocomposites via a two-step synthesis approach, including the arc discharge method and the heat treatment process. The results demonstrate that the Ni-TiN@CN nanocomposites exhibited remarkable electromagnetic wave absorption performance due to the excellent impedance matching and a fit balance of loss and attenuation. The optimal RL value of the Ni-TiN@CN paraffin composites of −42.05 dB at 4.06 GHz was achieved with the thickness of 5.3 mm, and the absorption bandwidth corresponding to the RL value below −20 dB was 6.5 GHz. This work presents a facile method for the synthesis of Ni-TiN@CN nanocomposites, which are a promising candidate for high-broadband microwave absorption materials.

Author Contributions

Conceptualization, Q.L. and G.S.; methodology, Q.L. and G.S.; validation, Q.L. and G.S.; formal analysis, Q.L. and G.S.; investigation, Q.L. and G.S.; resources, Q.L. and G.S.; data curation, Q.L. and G.S.; writing—original draft, Q.L. and G.S.; writing—review and editing, Q.L. and G.S.; visualization, Q.L. and G.S.; supervision, Q.L. and G.S.; project administration, Q.L. and G.S.; funding acquisition, Q.L. and G.S. All authors have read and agreed to the published version of the manuscript.

Funding

This research received no external funding.

Data Availability Statement

The original contributions presented in this study are included in the article. Further inquiries can be directed to the corresponding authors.

Conflicts of Interest

The authors declare no conflicts of interest.

References

  1. Wen, X.; Qin, Y.; Hao, Y.; Chang, G.; Huang, K.; Lei, M.; Shen, X.J.; He, Y.; Pan, X.C.; Wu, Y.F. Fe-Loaded Two-Dimensional Nitrogen-Doped Carbon for Electromagnetic Wave Absorption. Chin. Phys. Lett. 2024, 41, 128401. [Google Scholar] [CrossRef]
  2. Chattopadhyay, D.; Bain, M.K. Electrically conductive nanocomposites of polyaniline with poly(vinyl alcohol) and methylcellulose. J. Appl. Polym. Sci. 2008, 110, 2849–2853. [Google Scholar] [CrossRef]
  3. Ganguly, S.; Bhawal, P.; Ravindren, R.; Das, N.C. Polymer Nanocomposites for Electromagnetic Interference Shielding: A Review. J. Nanosci. Nanotechnol. 2018, 11, 7641–7669. [Google Scholar] [CrossRef]
  4. Hong, X.Y.; Wang, Q.; Tang, Z.H.; Khan, W.Q.; Zhou, D.W.; Feng, T.F. Synthesis and Electromagnetic Absorbing Properties of Titanium Carbonitride with Quantificational Carbon Doping. J. Phys. Chem. C 2016, 120, 148–156. [Google Scholar] [CrossRef]
  5. Shafieizadegan Esfahani, A.R.; Katbab, A.A.; Dehkhoda, P.; Karami, H.R.; Barikani, M.; Sadeghi, S.H.H.; Ghorbani, A. Preparation and characterization of foamed polyurethane/silicone rubber/graphite nanocomposite as radio frequency wave absorbing material: The role of interfacial compatibilization. Environ. Sci. Technol. 2012, 72, 382–389. [Google Scholar] [CrossRef]
  6. Yang, S.; Sun, X.X.; Ning, Y.H.; Yuan, Y.; Luo, B.L.; Yin, W.L.; Li, Y.B. Effectively tuning electromagnetic absorption of carbon-based nanocomposites by phase transition. Carbon 2022, 190, 47–56. [Google Scholar] [CrossRef]
  7. Wei, Y.; Zhang, L.; Gong, C.H.; Liu, S.C.; Zhang, M.M.; Shi, Y.P.; Zhang, J.W. Fabrication of TiN/Carbon nanofibers by electrospinning and their electromagnetic wave absorption properties. J. Alloys Compd. 2018, 735, 1488–1493. [Google Scholar] [CrossRef]
  8. Chen, W.M.; Jin, H.C.; Xie, S.; Xie, H.Y.; Zhu, J.F.; Ji, H.X.; Wan, L.J. TiN nanocrystal anchored on N-doped graphene as effective sulfur hosts for high-performance lithium-sulfur batteries. J. Energy Chem. 2021, 54, 16–22. [Google Scholar] [CrossRef]
  9. Shi, H.M.; Zhang, H.; Chen, Z.; Wang, T.; Wang, L.; Zeng, W.; Zhang, G.H.; Duan, H.G. Synthesis of TiN nanostructures by Mg-assisted nitriding TiO2 in N2 for lithium ion storage. Chem. Eng. J. 2018, 336, 12–19. [Google Scholar] [CrossRef]
  10. Zhang, Y.H.; Zhang, Y.; Liu, H.M.; Li, D.; Wang, Y.B.; Xu, C.C.; Tian, Y.P.; Meng, H.J. TiN/Fe2N/C composite with stable and broadband high-temperature microwave absorption. Int. J. Miner. Metall. Mater. 2024, 31, 2508–2517. [Google Scholar] [CrossRef]
  11. Shi, Y.P.; Li, D.; Si, H.X.; Jiang, Z.Y.; Li, M.Y.; Gong, C.H. TiN/BN composite with excellent thermal stability for efficiency microwave absorption in wide temperature spectrum. J. Mater. Sci. Technol. 2022, 130, 249–255. [Google Scholar] [CrossRef]
  12. Zhang, Y.H.; Zhang, L.; Si, H.X.; Zhang, Y.; Li, C.P.; Zhang, L.; Zhang, J.W.; Gong, C.H. TiN nanofiber metacomposites for efficient electromagnetic wave absorption: Insights on multiple reflections and scattering effects. J. Mater. Sci. Technol. 2025, 233, 69–79. [Google Scholar] [CrossRef]
  13. Li, C.P.; Li, D.; Zhang, S.; Ma, L.; Zhang, L.; Zhang, J.W.; Gong, C.H. Interface Engineering of Titanium Nitride Nanotube Composites for Excellent Microwave Absorption at Elevated Temperature. Nano-Micro Lett. 2024, 16, 168. [Google Scholar] [CrossRef]
  14. Mohapatra, S.R.; Sahu, B.; Chandrasekhar, M.; Kumar, P.; Kaushik, S.D.; Rath, S.; Singh, A.K. Effect of cobalt substitution on structural, impedance, ferroelectric and magnetic properties of multiferroic Bi2Fe4O9 ceramics. Ceram. Int. 2016, 42, 12352–12360. [Google Scholar] [CrossRef]
  15. Wang, S.J.; Zhang, X.; Hao, S.Y.; Qiao, J.; Wang, Z.; Wu, L.L.; Liu, J.R.; Wang, F.L. Nitrogen-Doped Magnetic-Dielectric-Carbon Aerogel for High-Efficiency Electromagnetic Wave Absorption. Nano-Micro Lett. 2024, 16, 16. [Google Scholar] [CrossRef]
  16. Yu, D.; Shi, G.M.; Shi, F.N.; Bao, X.K.; Li, S.T.; Li, Q. N-doped carbon nanofiber embedded with TiN nanoparticles: A type of efficient microwave absorbers with lightweight and wide-bandwidth. J. Alloys Compd. 2022, 920, 165791. [Google Scholar] [CrossRef]
  17. Zhu, B.; Cui, Y.; Lv, D.F.; Xu, K.Z.; Chen, Y.J.; Wei, Y.N.; Wei, H.Y.; Bu, J.L. Synthesis of setaria viridis-like TiN fibers for efficient broadband electromagnetic wave absorption in the whole X and Ku bands. Appl. Surf. Sci. 2020, 533, 147439. [Google Scholar] [CrossRef]
  18. Hassel, A.W.; Neelakantan, L.; Zelenkevych, A.; Ruh, A.; Spiegel, M. Selective de-alloying of NiTi by oxochloridation. Corros. Sci. 2008, 50, 1368–1375. [Google Scholar] [CrossRef]
  19. Marchenko, E.S.; Shishelova, A.A.; Baigonakova, G.A.; Polyakov, N.A.; Botryakova, I.G. Mechanical properties and corrosion resistance of porous nickel titanium alloys synthesized in different reactive atmospheres. Phys. Scr. 2024, 99, 015939. [Google Scholar] [CrossRef]
  20. Shi, G.M.; Yin, J.C.; Li, Q.; Ji, L.; Li, S.T.; Shi, F.N. Facile preparation and properties of cubic TiN@CN nanocapsules as electrode materials for supercapacitors and as microwave absorbers. J. Mater. Sci.-Mater. Electron. 2020, 31, 10574–10584. [Google Scholar] [CrossRef]
  21. Xiang, M.Q.; Song, M.; Zhu, Q.S.; Yang, Y.F.; Hu, C.Q.; Liu, Z.W.; Zhao, H.D.; Ge, Y. Inducing two-dimensional single crystal TiN arrays with exposed {1 1 1} facets by a novel chemical vapor deposition with excellent electrocatalytic activity for hydrogen evolution reaction. Chem. Eng. J. 2021, 404, 126451. [Google Scholar] [CrossRef]
  22. Yan, C.; Cheng, X.Q.; Zhang, Y.; Yin, D.Z.; Gong, C.H.; Yu, L.G.; Zhang, J.W.; Zhang, Z.J. Ferromagnetism and microwave electromagnetism of iron-doped titanium nitride nanocrystals. J. Phys. Chem. Lett. 2012, 116, 26006–26012. [Google Scholar] [CrossRef]
  23. Jaeger, D.; Patscheider, J. A complete and self-consistent evaluation of XPS spectra of TiN. J. Electron. Spectrosc. Relat. Phenom. 2012, 185, 523–534. [Google Scholar] [CrossRef]
  24. Chu, Y.Q.; Huang, Z.K.; Wang, X.H.; Zhou, M.L.; Zhao, F.M. Highly dispersed silver imbedded into TiN submicrospheres for electrochemical detecting of hydrogen peroxide. Sci. Rep. 2020, 10, 22126. [Google Scholar] [CrossRef]
  25. Haunold, T.; Rupprechter, G. LiOx-modification of Ni and Co3O4 surfaces: An XPS, LEIS and LEED study. Surf. Sci. 2021, 713, 121915. [Google Scholar] [CrossRef]
  26. Xu, Y.; Tu, W.G.; Zhang, B.W.; Yin, S.M.; Huang, Y.Z.; Kraft, M.; Xu, R. Nickel nanoparticles encapsulated in few-layer nitrogen-doped graphene derived from metal-organic frameworks as efficient bifunctional electrocatalysts for overall water splitting. Adv. Mater. 2017, 29, 1605957. [Google Scholar] [CrossRef]
  27. Milošv, I.; Strehblow, H.H.; Navinšek, B.; Metikoš-Huković, M. Electrochemical and thermal oxidation of TiN coatings studied by XPS. Surf. Interface Anal. 1995, 23, 529–539. [Google Scholar] [CrossRef]
  28. Li, S.T.; Shi, G.M.; Li, Q.; Shi, F.N.; Wang, X.L.; Yang, L.M. One-step synthesis and performances of Ni@CN nanocapsules with superior dual-function as electrocatalyst and microwave absorbent. Colloids Surf. A Physicochem. Eng. Asp. 2021, 615, 126162. [Google Scholar] [CrossRef]
  29. Wei, D.C.; Liu, Y.Q.; Wang, Y.; Zhang, H.L.; Huang, L.P.; Yu, G. Synthesis of N-doped graphene by chemical vapor deposition and its electrical properties. Nano Lett. 2009, 9, 1752–1758. [Google Scholar] [CrossRef]
  30. Wu, G.L.; Cheng, Y.H.; Yang, Z.H.; Jia, Z.R.; Wu, H.J.; Yang, L.J.; Li, H.L.; Guo, P.Z.; Lv, H.L. Design of carbon sphere/magnetic quantum dots with tunable phase compositions and boost dielectric loss behavior. Chem. Eng. J. 2018, 333, 519–528. [Google Scholar] [CrossRef]
  31. Jia, Z.R.; Gao, Z.G.; Lan, D.; Lan, D.; Cheng, Y.H.; Wu, G.L.; Wu, H.J. Effects of filler loading and surface modification on electrical and thermal properties of epoxy/montmorillonite composite. Chin. Phys. B 2018, 27, 117806. [Google Scholar] [CrossRef]
  32. Cheng, Y.; Zhao, Y.; Zhao, H.Q.; Lv, H.L.; Qi, X.D.; Cao, J.M.; Ji, G.B.; Du, Y.W. Engineering morphology configurations of hierarchical flower-like MoSe2 spheres enable excellent low-frequency and selective microwave response properties. Chem. Eng. J. 2019, 372, 390–398. [Google Scholar] [CrossRef]
  33. Yang, L.J.; Huang, K.M.; Yang, X.Q. Dielectric properties of N,N-Dimethylformamide aqueous solutions in external electromagnetic fields by molecular dynamics simulation. J. Mater. Chem. A 2009, 114, 1185–1190. [Google Scholar] [CrossRef] [PubMed]
  34. Wang, K.F.; Zhang, S.Z.; Chu, W.S.; Li, H.; Chen, Y.J.; Chen, B.Q.; Chen, B.B.; Liu, H.Z. Tailoring conductive network nanostructures of ZIF-derived cobalt-decorated N-doped graphene/carbon nanotubes for microwave absorption applications. J. Colloid. Interface Sci. 2021, 591, 463–473. [Google Scholar] [CrossRef]
  35. Murugaraj, P.; Mainwaring, D.E.; Tonkin, D.C.; Kobaisi, M.A. Probing the dynamics of water in chitosan polymer films by dielectric spectroscopy. J. Appl. Polym. Sci. 2010, 120, 1307–1315. [Google Scholar] [CrossRef]
  36. Quan, B.; Liang, X.H.; Ji, G.B.; Cheng, Y.; Liu, W.; Ma, J.N.; Zhang, Y.N.; Li, D.R.; Xu, G.Y. Dielectric polarization in electromagnetic wave absorption: Review and perspective. J. Alloys Compd. 2017, 728, 1065–1075. [Google Scholar] [CrossRef]
  37. Liu, C.Y.; Xu, Q.K.; Tang, Y.; Wang, Z.R.; Ma, R.Y.; Ma, N.; Du, P.Y. Zr4+ doping-controlled permittivity and permeability of BaFe12-xZrxO19 and the extraordinary EM absorption power in the millimeter wavelength frequency range. J. Mater. Chem. C 2016, 40, 9532–9543. [Google Scholar] [CrossRef]
  38. Xu, P.; Han, X.J.; Wang, C.; Zhou, D.H.; Lv, Z.S.; Wen, A.H.; Wang, X.H.; Zhang, B. Synthesis of electromagnetic functionalized Nickel/Polypyrrole Core/Shell composites. J. Phys. Chem. B 2008, 112, 10443–10448. [Google Scholar] [CrossRef]
  39. Jiang, W.C.; Sun, M.X.; Zhang, K.; Wu, F.; Xie, A.M.; Wang, M.Y. Three-dimensional (3D) α-Fe2O3/polypyrrole (PPy) nanocomposite for effective electromagnetic absorption. Aip Adv. 2016, 6, 065021. [Google Scholar] [CrossRef]
  40. Kong, L.; Yin, X.W.; Yuan, X.Y.; Zhang, Y.J.; Liu, X.M.; Cheng, L.F.; Zhang, L.T. Electromagnetic wave absorption properties of graphene modified with carbon nanotube/poly(dimethyl siloxane) composites. Carbon 2014, 73, 185–193. [Google Scholar] [CrossRef]
  41. Li, D.R.; Liang, X.H.; Quan, B.; Cheng, Y.; Ji, G.B.; Du, Y.W. Investigating the synergistic impedance match and attenuation effect of Co@C composite through adjusting the permittivity and permeability. Mater. Res. Express 2017, 4, 035604. [Google Scholar] [CrossRef]
  42. Yan, L.L.; Zhang, M.; Zhao, S.C.; Sun, T.J.; Zhang, B.; Cao, M.S.; Qin, Y. Wire-in-tube ZnO@carbon by molecular layer deposition: Accurately tunable electromagnetic parameters and remarkable microwave absorption. Chem. Eng. J. 2020, 382, 122860. [Google Scholar] [CrossRef]
  43. Bai, Y.W.; Shi, G.M.; Gao, J.; Shi, F.N. Synthesis, crystal structure of a iron-manganese bimetal MOF and its graphene composites with enhanced microwave absorption properties. J. Phys. Chem. Solids 2021, 148, 109657. [Google Scholar] [CrossRef]
  44. Sun, M.X.; Xiong, Z.M.; Zhang, Z.W.; Chen, C.C.; Qin, L.; Wang, D.R.; Wu, F.; Liu, P.B. One-dimensional Ag@NC-Co@NC composites with multiphase core-shell hetero-interfaces for boosting microwave absorption. Compos. Sci. Technol. 2022, 228, 109663. [Google Scholar] [CrossRef]
  45. Wang, H.C.; Yan, Z.R.; An, J.; He, J.; Hou, Y.L.; Yu, H.Y.; Ma, N.; Yu, G.H.; Sun, D.B. Iron cobalt/polypyrrole nanoplates with tunable broadband electromagnetic wave absorption. RSC Adv. 2016, 6, 92152–92158. [Google Scholar] [CrossRef]
  46. Liao, X.F.; Peng, J.H.; Zhang, L.B.; Hu, T.; Li, J. Enhanced carbothermic reduction of ilmenite placer by additional ferrosilicon. J. Alloys Compd. 2017, 708, 1110–1116. [Google Scholar] [CrossRef]
  47. Wang, B.; Wu, Q.; Fu, Y.; Liu, T. A review on carbon/magnetic metal composites for microwave absorption. J. Mater. Sci. Technol. 2021, 86, 91–109. [Google Scholar] [CrossRef]
  48. Gao, S.; Yang, H.Y.; Wang, G.; Yin, P. Excellent electromagnetic wave absorbing properties of two-dimensional carbon-based nanocomposite supported by transition metal carbides Fe3C. Carbon 2020, 162, 438–444. [Google Scholar] [CrossRef]
  49. Pan, Y.; Wang, G.; Liu, L.; Guo, L.; Yu, S. Binary synergistic enhancement of dielectric and microwave absorption properties: A composite of arm symmetrical PbS dendrites and polyvinylidene fluoride. Nano Res. 2016, 10, 284–294. [Google Scholar] [CrossRef]
  50. Zhang, F.; Chen, Y.F.; Ren, Y.J.; Zheng, Q.; Wang, L.J.; Jiang, W. Anionic MOF derived Bimetallic NixCoy@Nano-porous carbon composites toward strong and efficient electromagnetic wave absorption. J. Mater. 2022, 8, 852–862. [Google Scholar] [CrossRef]
  51. Shi, G.M.; Lv, S.H.; Cheng, X.B.; Wang, X.L.; Li, S.T. Enhanced microwave absorption properties of modified Ni@C nanocapsules with accreted N doped C shell on surface. J. Mater. Sci.-Mater. Electron. 2018, 29, 17483–17492. [Google Scholar] [CrossRef]
  52. He, J.; Shan, D.Y.; Yan, S.Q.; Luo, H.; Cao, C.; Peng, Y.H. Magnetic FeCo nanoparticles-decorated Ti3C2 MXene with enhanced microwave absorption performance. J. Magn. Magn. Mater. 2019, 492, 165639. [Google Scholar] [CrossRef]
  53. Kuchi, R.; Nguyen, H.M.; Dongquoc, P.C.; Van, H.A.; Viet, D.D.; Kim, D.D.; Kim, J.J. Optimization of FeNi/SWCNT composites by a simple co-arc discharge process to improve microwave absorption performance. J. Alloys Compd. 2021, 852, 156712. [Google Scholar] [CrossRef]
  54. Zhang, Y.H.; Meng, H.J.; Shi, Y.P.; Zhang, X.F.; Liu, C.X.; Wang, Y.; Gong, C.H.; Zhang, J.W. TiN/Ni/C ternary composites with expanded heterogeneous interfaces for efficient microwave absorption. Compos. Part B 2020, 193, 108028. [Google Scholar] [CrossRef]
  55. Dong, S.X.; Li, J.; Li, N.; Zhang, S.; Li, B.; Zhang, Q.L.; Ge, L.Q. Enhanced broadband microwave absorption of Fe/C core-shell nanofibers in X and Ku bands. Ceram. Int. 2023, 49, 8181–8189. [Google Scholar] [CrossRef]
  56. Gou, G.J.; Hua, W.L.; Liu, K.Y.; Cheng, F.; Xie, X.L. Bimetallic MOF@wood-derived hierarchical porous carbon composites for efficient microwave absorption. Diam. Relat. Mater. 2024, 141, 110688. [Google Scholar] [CrossRef]
  57. Sun, G.H.; Jia, Z.R.; Xu, S.; Hu, D.Q.; Zhang, C.H.; Wu, G.L. Synergistic regulation of dielectric-magnetic dual-loss and triple heterointerface polarization via magnetic MXene for high-performance electromagnetic wave absorption. J. Mater. Sci. Technol. 2022, 113, 128–137. [Google Scholar] [CrossRef]
  58. Li, W.X.; Qi, H.X.; Guo, F.; Du, Y.; Song, N.J.; Liu, Y.Y.; Chen, Y.Q. Co nanoparticles supported on cotton-based carbon fibers: A novel broadband microwave absorbent. J. Alloys Compd. 2019, 772, 760–769. [Google Scholar] [CrossRef]
Figure 1. Flow chart of Ni/TiN@CN preparation.
Metals 15 00597 g001
Figure 2. (a) XRD patterns of the samples; (b) Raman patterns of the samples.
Metals 15 00597 g002
Figure 3. SEM of the Ni/TiN and Ni/TiN@CN nanocomposites (a) Ni-TiN; (b) Ni-TiN@CN-1; (c) Ni-TiN@CN-2; (d) Ni-TiN@CN-3; (e) Ni-TiN@CN-4.
Metals 15 00597 g003
Figure 4. TEM images and HRTEM images of samples. (a) TEM images of Ni-TiN; (d,e) HRTEM images of Ni-TiN; (b) Ni-TiN@CN-1; (c) Ni-TiN@CN-2; (f) Ni-TiN@CN-3; (g) Ni-TiN@CN-4.
Metals 15 00597 g004
Figure 5. XPS spectra of the samples. (a,b) Full XPS spectrum of the Ni-TiN and Ni-TiN@CN; (c,d) Ti 2p high-resolution XPS spectra of the Ni-TiN and Ni-TiN@CN; (e,f) Ni 2p high-resolution XPS spectra of the Ni-TiN and Ni-TiN@CN; (g,h) N 1s high-resolution XPS spectra of the Ni-TiN and Ni-TiN@CN; (i,j) C 1s high-resolution XPS spectra of the Ni-TiN and Ni-TiN@CN.
Metals 15 00597 g005
Figure 6. (a) Frequency dependences of ε′ of samples; (b) frequency dependences of ε″ of samples.
Metals 15 00597 g006
Figure 7. Cole–Cole diagram of the complex permittivity of a sample as the imaginary part changed with the real part. (a) Ni-TiN; (b) Ni-TiN@CN-1; (c) Ni-TiN@CN-2; (d) Ni-TiN@CN-3; (e) Ni-TiN@CN-4.
Metals 15 00597 g007
Figure 8. (a) Changes in the real parts of the sample permeability with frequency; (b) changes in the imaginary parts of the sample permeability with frequency.
Metals 15 00597 g008
Figure 9. (a) Dielectric loss tangent; (b) magnetic loss tangent.
Metals 15 00597 g009
Figure 10. The three-dimensional reflection loss curve of the samples and the corresponding two-dimensional reflection loss diagram and reflection loss curve were obtained. (ac) Ni-TiN; (df) Ni-TiN@CN-1; (gi) Ni-TiN@CN-2; (jl) Ni-TiN@CN-3; (mo) Ni-TiN@CN-4.
Metals 15 00597 g010
Figure 11. Impedance matching of the nanocomposites: (a) Ni-TiN; (b) Ni-TiN@CN-1; (c) Ni-TiN@CN-2; (d) Ni-TiN@CN-3; (e) Ni-TiN@CN-4.
Metals 15 00597 g011
Figure 12. Attenuation coefficients of the samples.
Metals 15 00597 g012
Table 1. Microwave absorption properties of the five samples.
SamplesMinimum RL Value (dB)Thickness (mm)Frequency (GHz)EAB ≤ −10 dB
(GHz)
EAB ≤ −20 dB
(GHz)
Ni-TiN−15.216.45.420.770
Ni-TiN@CN-1−13.341.610.351.410
Ni-TiN@CN-2−37.253.37.978.71.4
Ni-TiN@CN-3−42.055.44.0614.902.2
Ni-TiN@CN-4−35.712.416.37.610.32
Table 2. Reported microwave absorption properties of similar nanocomposites.
Samples Minimum RL Value (dB)Thickness (mm)Frequency (GHz)EAB ≤−10 dB
(GHz)
Ref.
Ni-C NCs−38.32.411.73.1[51]
FeCo/Ti3C2Tx MXene−28.721.617.28.8[52]
FeNi/SWCNT−42.52.77.44.9[53]
TiN/Ni/C−35.11.712.43.6[54]
Fe/C NFs−20.62.511.526.24[55]
Ni-TiN@CN-3−42.055.44.0614.90This work
Disclaimer/Publisher’s Note: The statements, opinions and data contained in all publications are solely those of the individual author(s) and contributor(s) and not of MDPI and/or the editor(s). MDPI and/or the editor(s) disclaim responsibility for any injury to people or property resulting from any ideas, methods, instructions or products referred to in the content.

