Abstract
In this study, Cantor alloys were prepared via powder metallurgy using spark plasma sintering (SPS) technology. The sintering parameters were systematically controlled, as follows: three temperature gradients (850 °C, 950 °C, and 1050 °C with a fixed holding time of 5 min) and three holding time gradients at 1050 °C (3, 5, and 10 min). The effects of the sintering parameters on the microstructure and mechanical properties were thoroughly analyzed. As the sintering temperature increased, the elemental particle bonding became more uniform, the internal porosity decreased, and densification improved, leading to gradual enhancements in the tensile strength and ductility. Conversely, a prolonged holding time reduced the grain boundary energy and induced grain growth, resulting in improved ductility but decreased strength. The critical shear stress (τ0) and normal fracture stress (σ0) were introduced to analyze the influence of the sintering temperature and holding time on the tensile strength and fracture modes. Wear morphology observations revealed scratches and stepped features in all of the samples, indicating that the dominant wear mechanism was adhesive wear.
1. Introduction
High-entropy alloys (HEAs) have attracted much attention in recent years due to their excellent mechanical properties such as good ductility, excellent fatigue properties, high strength, thermal stability, and wear resistance [1,2,3,4,5,6]. This name refers to the new design concept of alloying by introducing more metal elements. The most famous HEA is the equal mole ratio CoCrFeNiMn alloy, also called Cantor alloy [7,8]. Although it has a complex chemical composition, it forms a simple solid solution phase that gives it exceptional ductility and fracture toughness at high temperatures (~900 °C). However, CoCrFeNiMn has a relatively low yield and tensile strength, and this imbalance in mechanical properties limits its potential applications [9,10]. Therefore, it is crucial to improve its strength without introducing additional brittleness.
High-entropy alloys are usually prepared by melting. However, cast high-entropy alloys suffer from compositional segregation, porosity, and other casting defects [11,12]. In contrast, powder metallurgy can prepare bulk high-entropy alloys with nano-sized grains and a uniform organization and composition, which can significantly improve the mechanical properties of high-entropy alloys. Powder metallurgy can also enable near-final forming of metal parts and improve material utilization. In addition, powder metallurgy can easily lead to the addition of second-phase particles, creating metal matrix composites.
In this study, we fabricated a CoCrFeNiMn high-entropy alloy (HEA) via powder metallurgy using a spark plasma sintering (SPS) furnace. The effects of the sintering temperature and holding time on its microstructure, mechanical properties, and wear resistance were systematically investigated. By analyzing the influence patterns of temperature and time on the alloy performance, optimal processing parameters were determined to clarify the synergistic mechanisms between temperature and time. This enabled the identification of an optimized process window that balances efficiency and cost, providing a theoretical foundation for the engineering application of high-entropy alloys.
2. Materials and Methods
The experiments were carried out on high-entropy alloys with a nominal composition of Co20Cr20Fe20Ni20Mn20 (atomic percentage), in which the alloys were prepared by sintering in a discharge plasma sintering furnace (SPS-20T-10, Shanghai Chenhua Science and Technology Co., Ltd., Shanghai, China) at 850 °C, 950 °C, and 1050 °C, with a 5-min holding time for each. In addition, alloys sintered at 1050 °C were also subjected to holding times of 3 min and 10 min. Higher temperatures and longer durations can lead to the formation of liquid-phase metals during the SPS process, causing damage to the equipment. The sintered samples were subjected to density determination by the Archimedes drainage method. The original samples were cut into dog-bone tensile samples and metallographic samples using a BM400-type center-wire cutting machine (Suzhou Baoma Numerical Control Equipment Co., Ltd., Suzhou, China). The sintered and stretched samples are shown in Figure 1. The overall flow chart is shown in Figure 2.
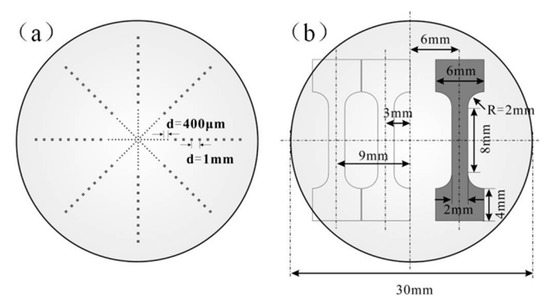
Figure 1.
(a) The sintered sample and (b) stretched sample.
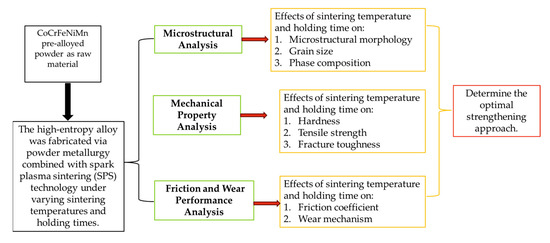
Figure 2.
Overall flow chart.
The mechanical properties of the alloy were tested using the CMT5305 universal material testing machine, and the experiment was carried out at room temperature with a tensile rate of 5 × 10⁻⁵ s−1. Under identical processing parameters, three samples from each specimen were subjected to uniaxial tensile testing to evaluate their mechanical properties. A wear tester (HT-1000) from Lanzhou Zhongke Kaihua Science and Technology Development Co., Ltd. (Lanzhou, China) was used to test the friction and wear properties at room temperature for 15 min, with CoCr15 balls of Φ 3 mm, a load of 1000 g, and a sliding speed of 300 rpm. The formula for the wear rate is K = V/P S, where K is the wear rate, V is the wear amount, P is the force loaded in the normal direction, and S is the sliding distance. The microhardness of the sintered samples at different temperatures was measured using a micro Vickers hardness tester (HVS-1000, Laizhou Huaxing Testing Instruments Co., Ltd., Laizhou, China) with a diamond positive tetragonal prism in the indenter, loaded with 9.8 N for 10 s. The microhardness of the alloys at different sintering temperatures and holding times was measured. To measure the microhardness of the alloys, 10 different positions of the samples were selected for the measurement to ensure the accuracy of the results. Then, the maximum and minimum values of the data were removed and the average value of the remaining data was taken as the microhardness of the sample. The phase composition was analyzed using an X-ray diffractometer (XRD, XRD-6000 (3KW), Shimadzu (China) Co., Ltd., Shanghai, China) with Cu target Kα radiation (tube voltage 40 kV, tube current 30 mA) and a scanning range of 30°~80° and a scanning speed of 4°/mm. The samples of metallographic samples with different sintering temperatures were corroded after grinding and polishing. An optical microscope (OM, ZEISS, Vision (China)Ltd., Guangzhou, China) and scanning electron microscope (SEM, Hitachi TM4000Plusll, Hitachi (China), Ltd., Beijing, China) were used to observe the microstructure.
3. Results and Discussion
3.1. Microstructure
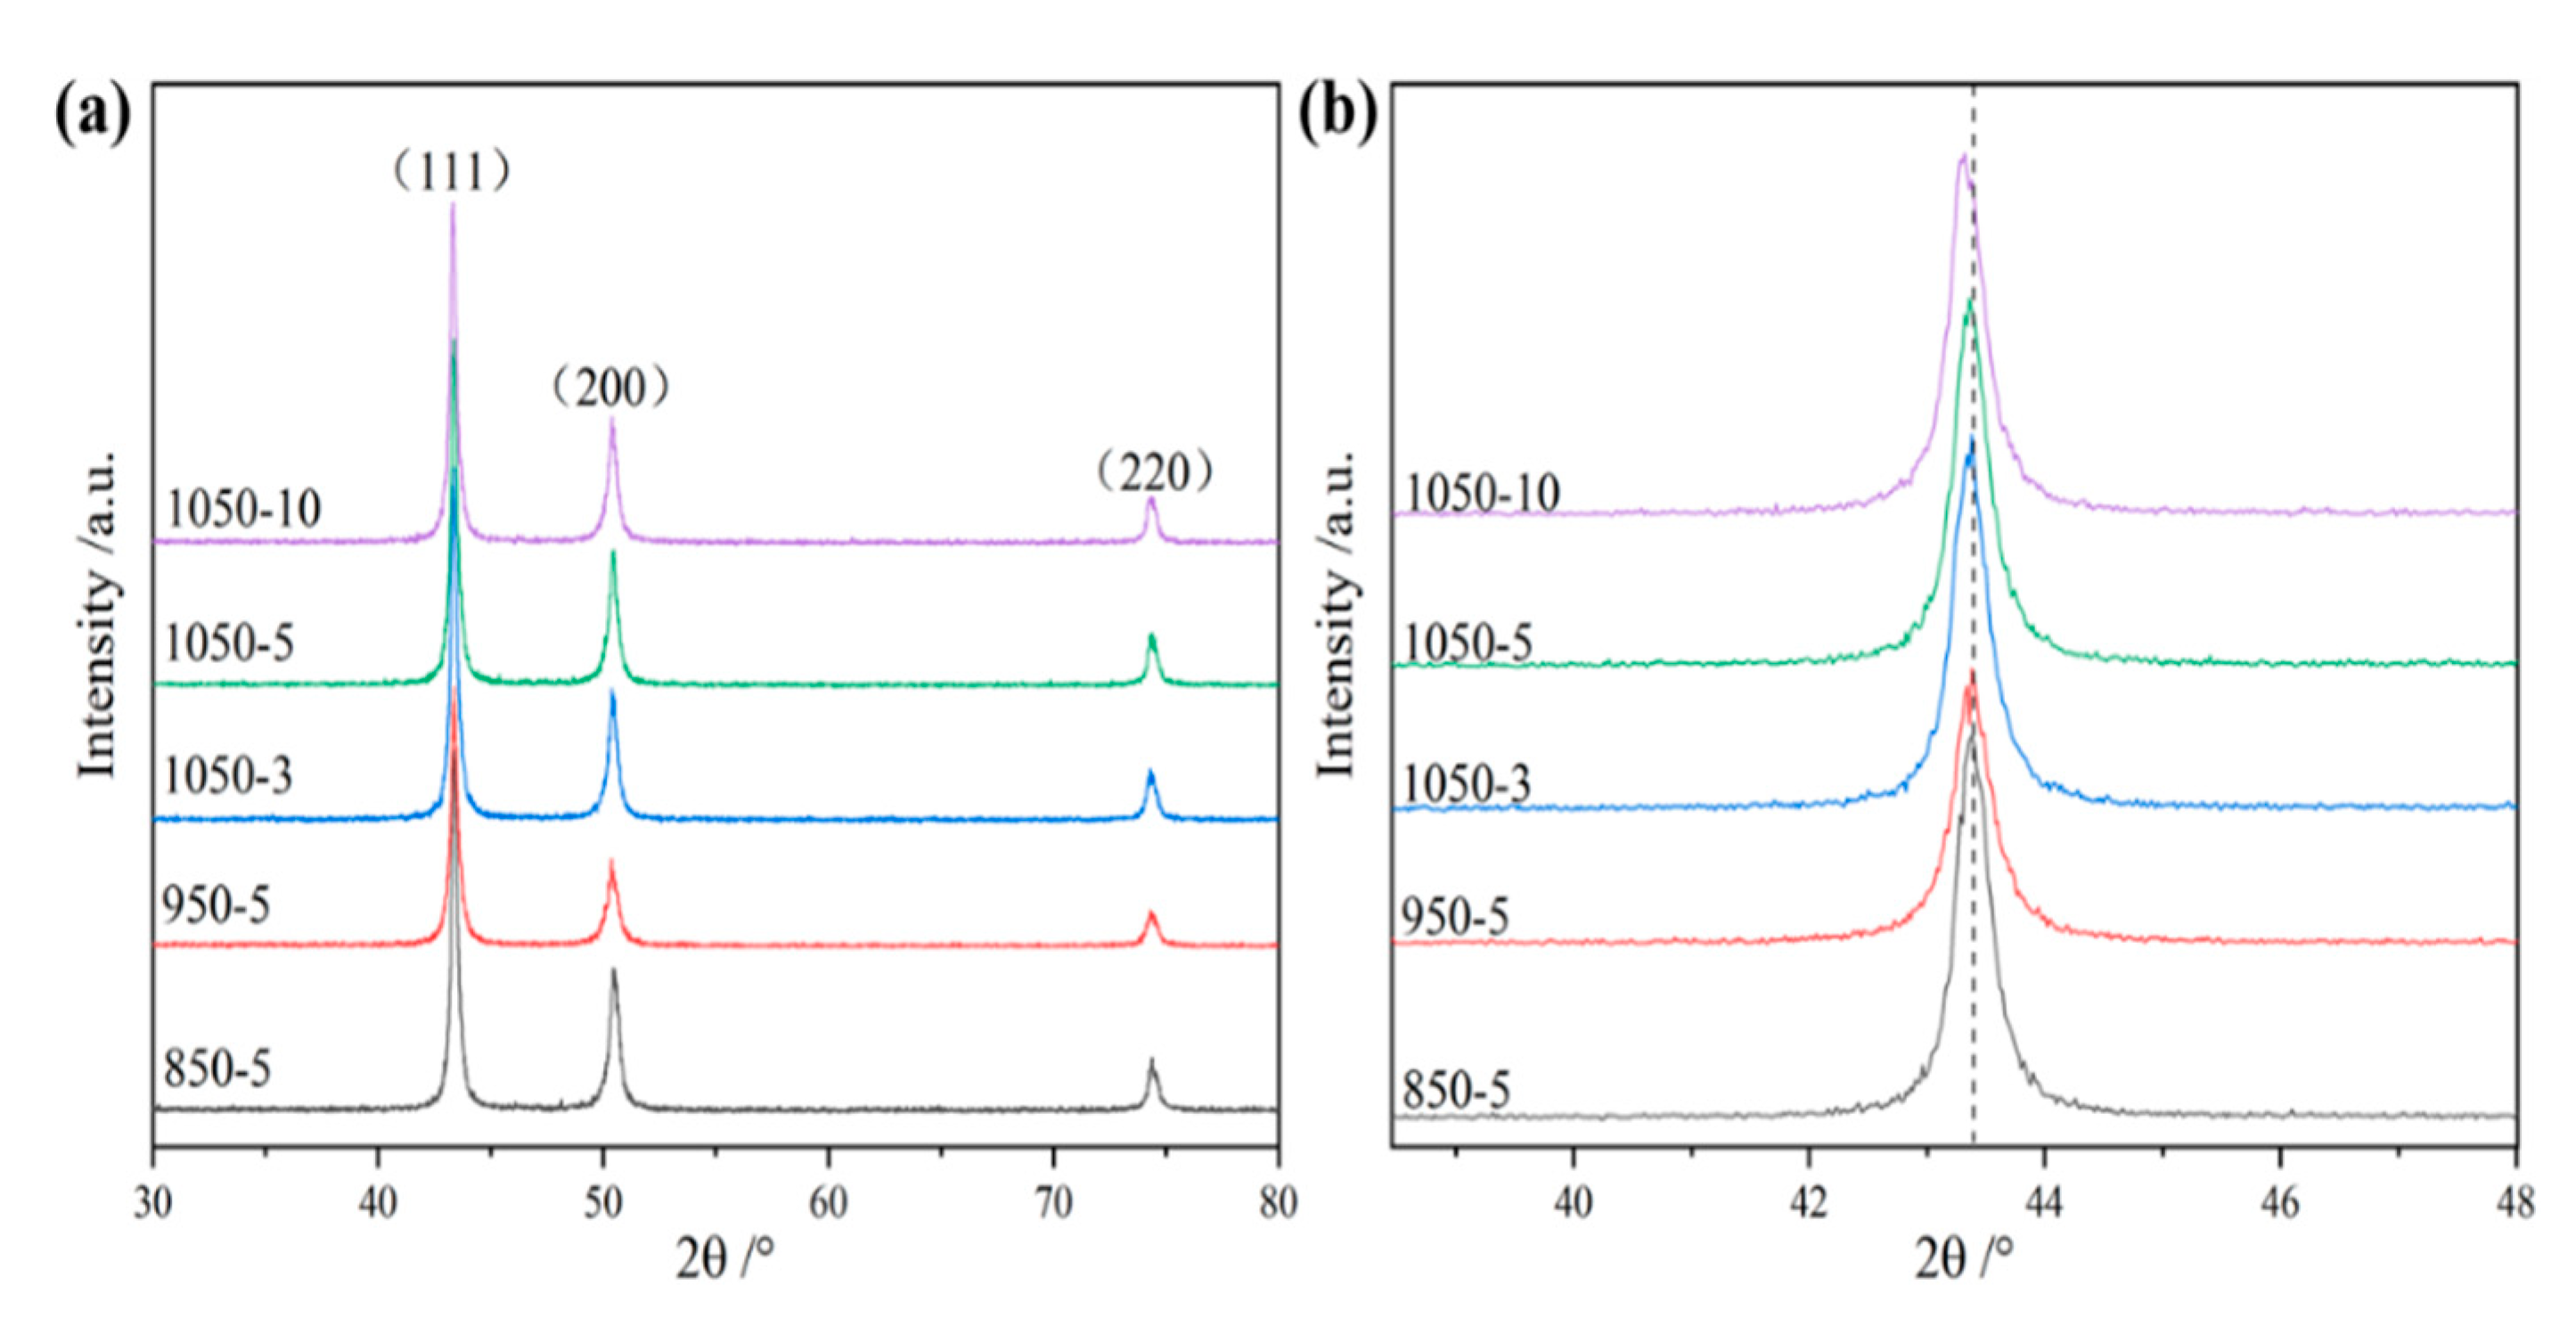
The XRD diffraction patterns of 850 (sintered at 850 °C), 950 (sintered at 950 °C), 1050-3 (sintered and held at 1050 °C for 3 min), 1050-5 (sintered and held at 1050 °C for 5 min), and 1050-10 (sintered and held at 1050 °C for 10 min) are shown in Figure 3. It can be seen from the figure that the increase in the sintering temperature and holding time did not cause a phase change of the CoCrFeNiMn high-entropy alloy, which remained a single-phase FCC structure, and did not form any precipitation phase. The lattice constant and half peak width of the strongest peak (111) of the FCC phase were calculated using Bragg’s formula, and the results are shown in Table 1.
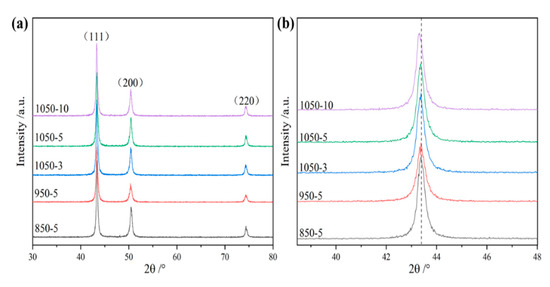
Figure 3.
X-ray diffraction pattern: (a) original drawing; (b) local enlargement.

Table 1.
Lattice constant and half peak width.
It can be observed that with the increase in the sintering temperature and extension of the holding time, the lattice constant of the alloy increases, and the interplanar spacing of the (111) plane in the FCC structure consequently expands. To satisfy Bragg’s law, the value of sinθ must decrease, leading to a reduction in the diffraction angle θ, which manifests as an overall leftward shift of the 2θ diffraction peaks for the alloy’s FCC structure. However, due to the minimal magnitude of this shift, the variation in the lattice constant appears insignificant. As the holding time is prolonged, grain growth occurs. According to Scherrer’s formula, the full width at half maximum is inversely proportional to the crystallite size, which aligns well with the experimental results.
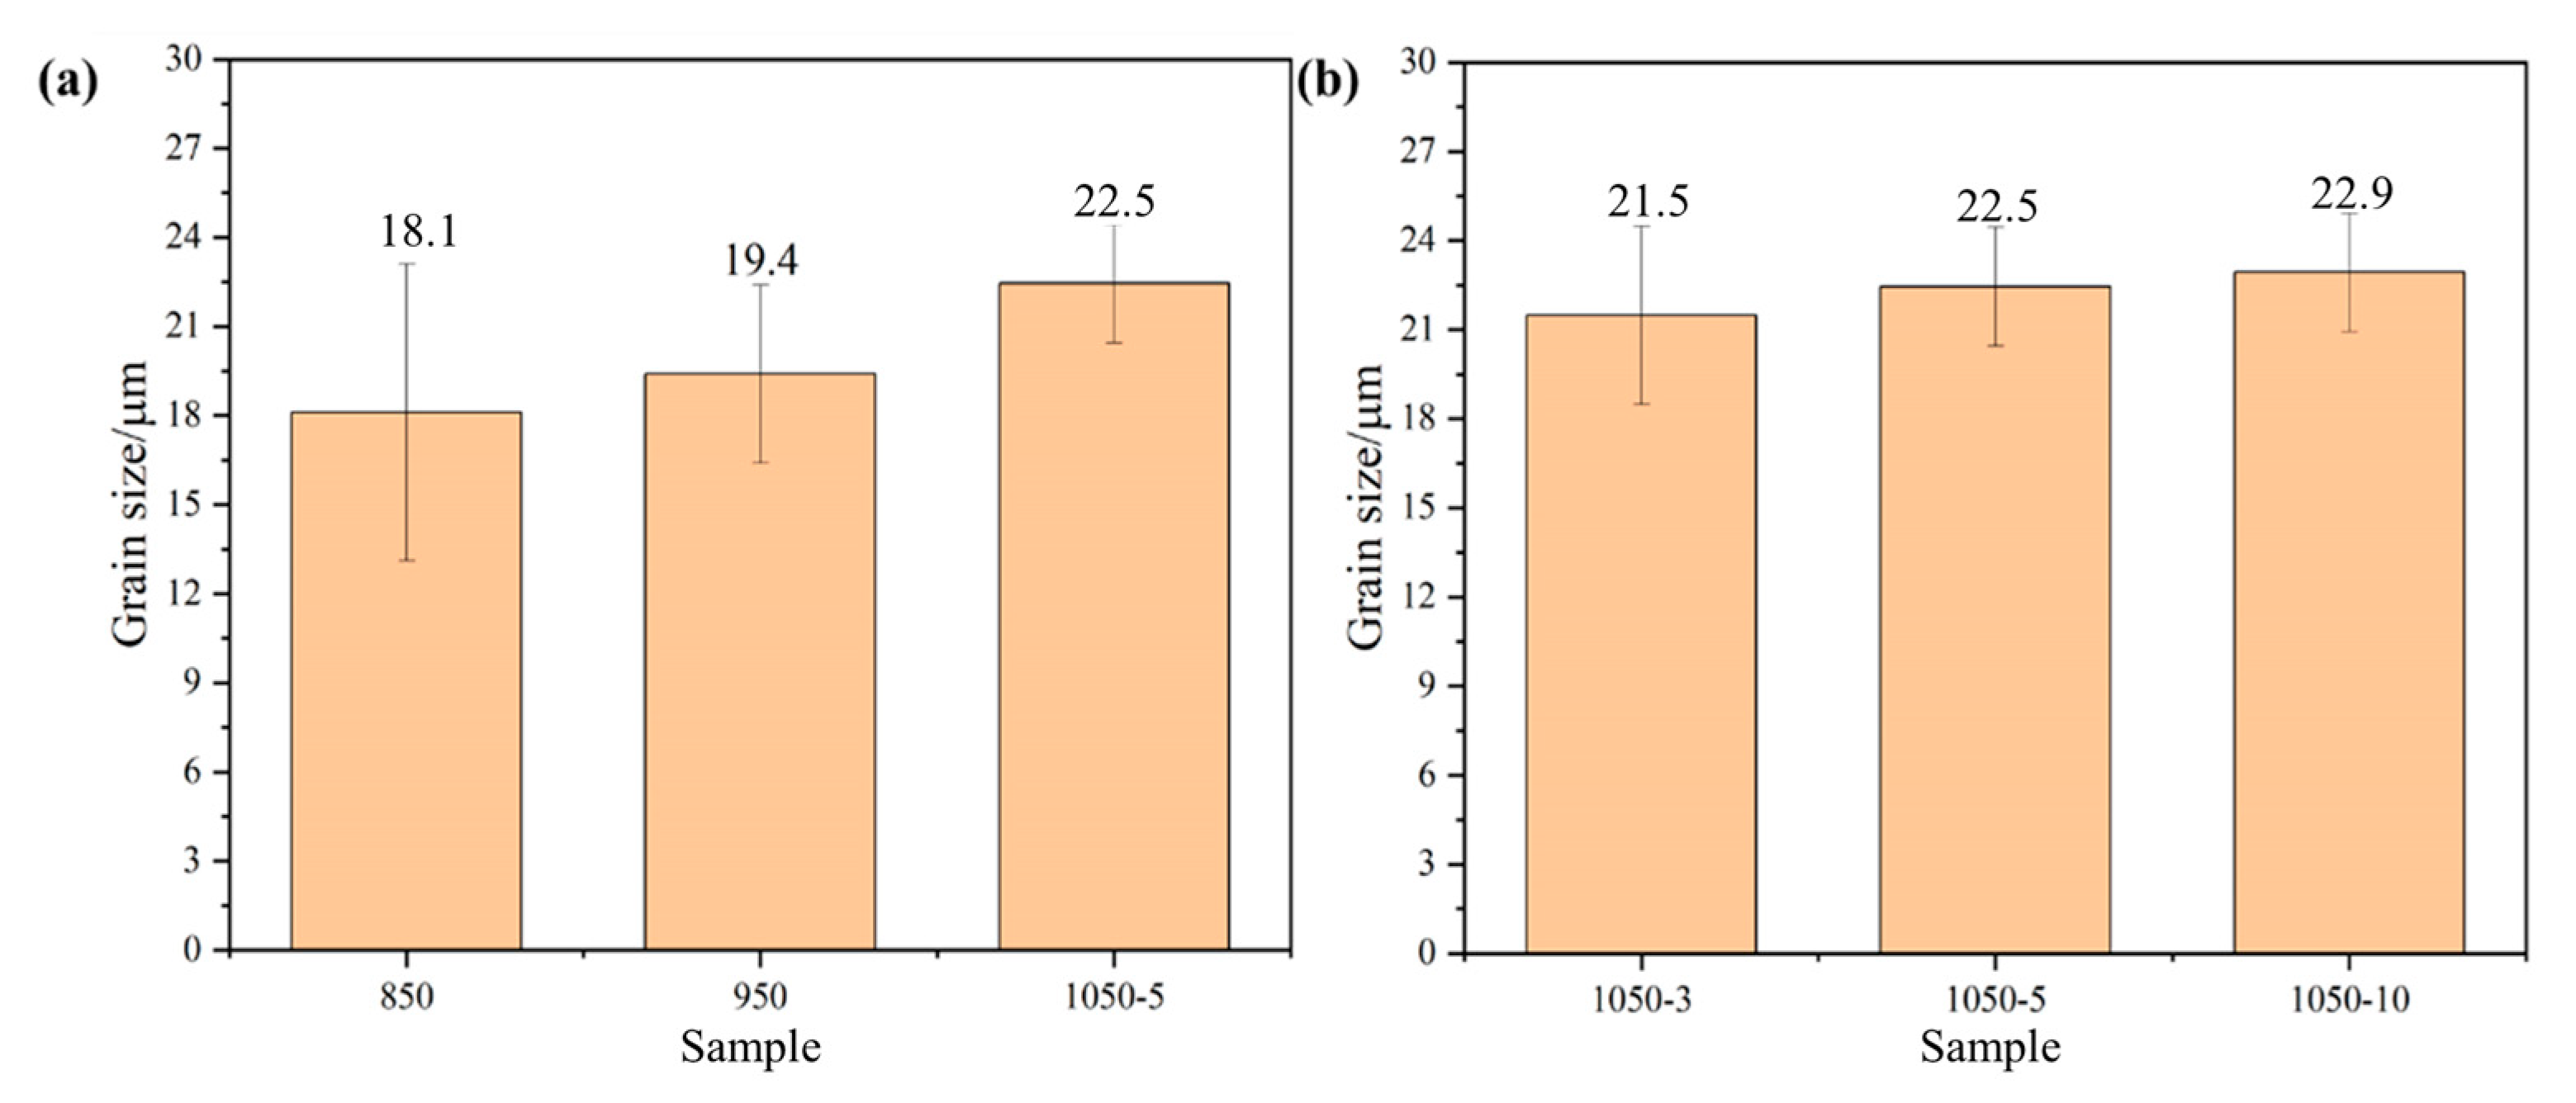
The experimental grain size was measured using Image-pro-plus software (7.0). Figure 4 shows the grain size of the alloy sintered at different temperatures. From the figure, it can be seen that when the sintering temperature is 850 °C, the alloy grain size reaches a minimum of about 18.11 μm, which is because the internal particles of the alloy heat themselves uniformly under the action of Joule heat during plasma sintering, and the atoms on the surface of the particles are in the activation state, so the process of sintered body densification avoids the uneven densification of the alloy caused by heat transfer from the outside to the inside, which leads to the refinement of the grains. With the gradual increase in the temperature and holding time, the grain size of the alloy increases gradually, which is attributed to the increased diffusion driving force at higher temperatures leading to grain growth, but the degree of grain growth is not high.
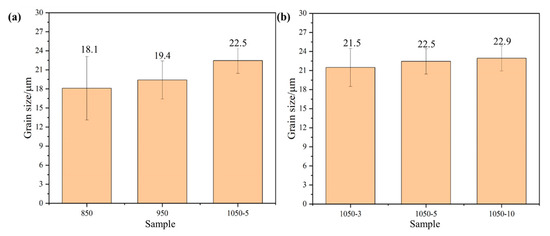
Figure 4.
Average grain size of high-entropy alloy: (a) sintered at different sintering temperatures; (b) sintered at different holding times.
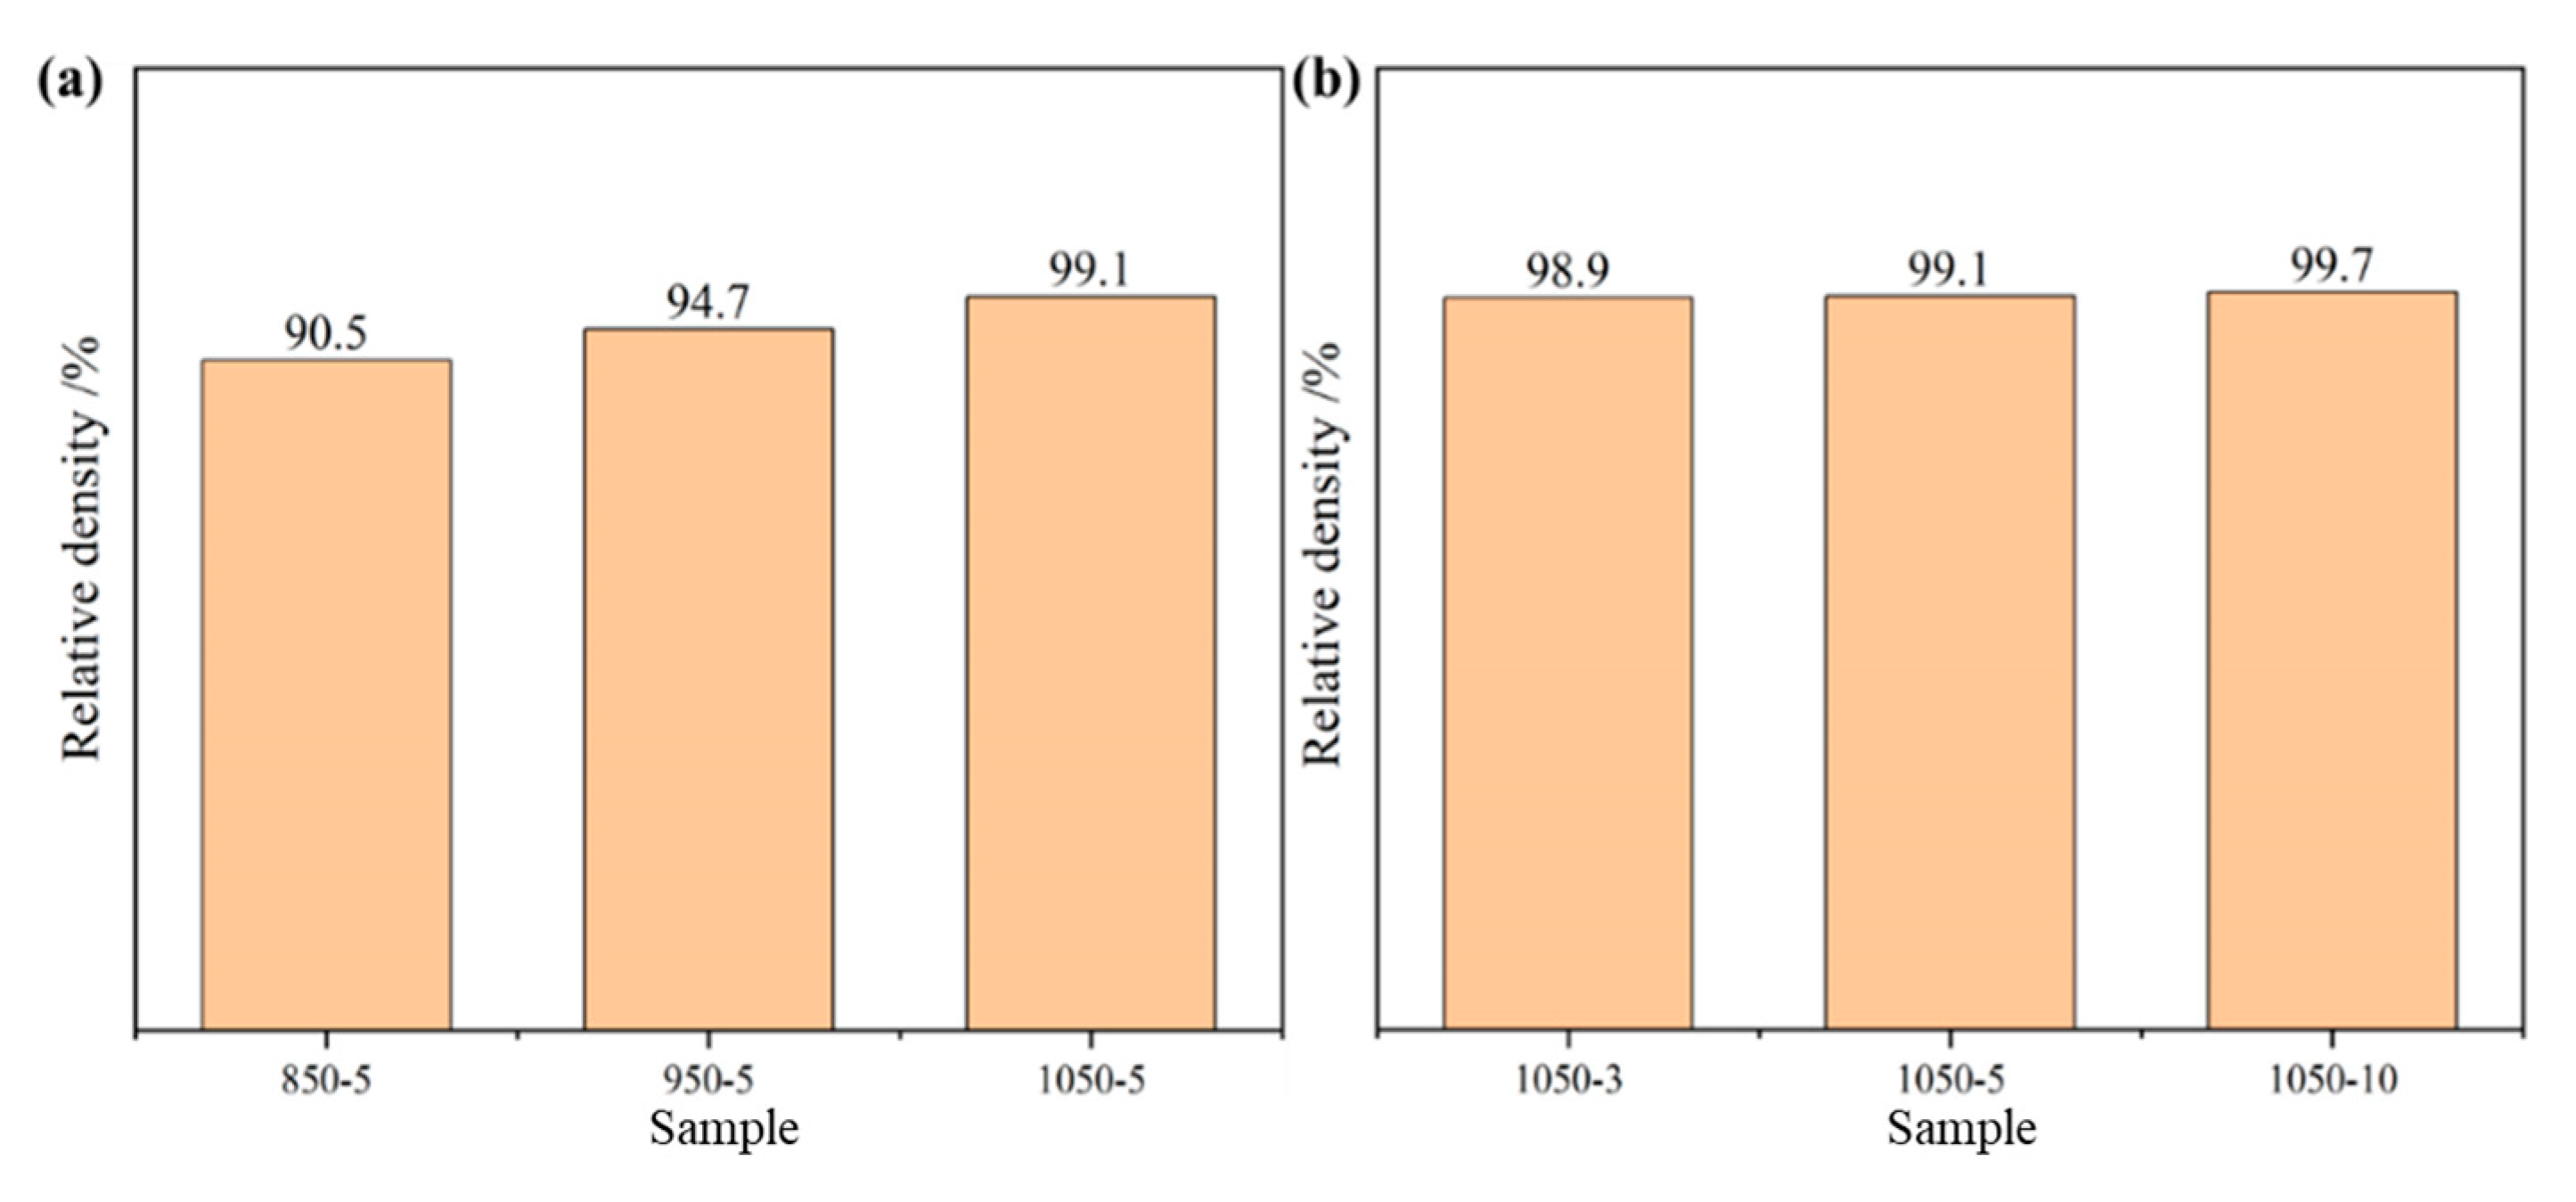
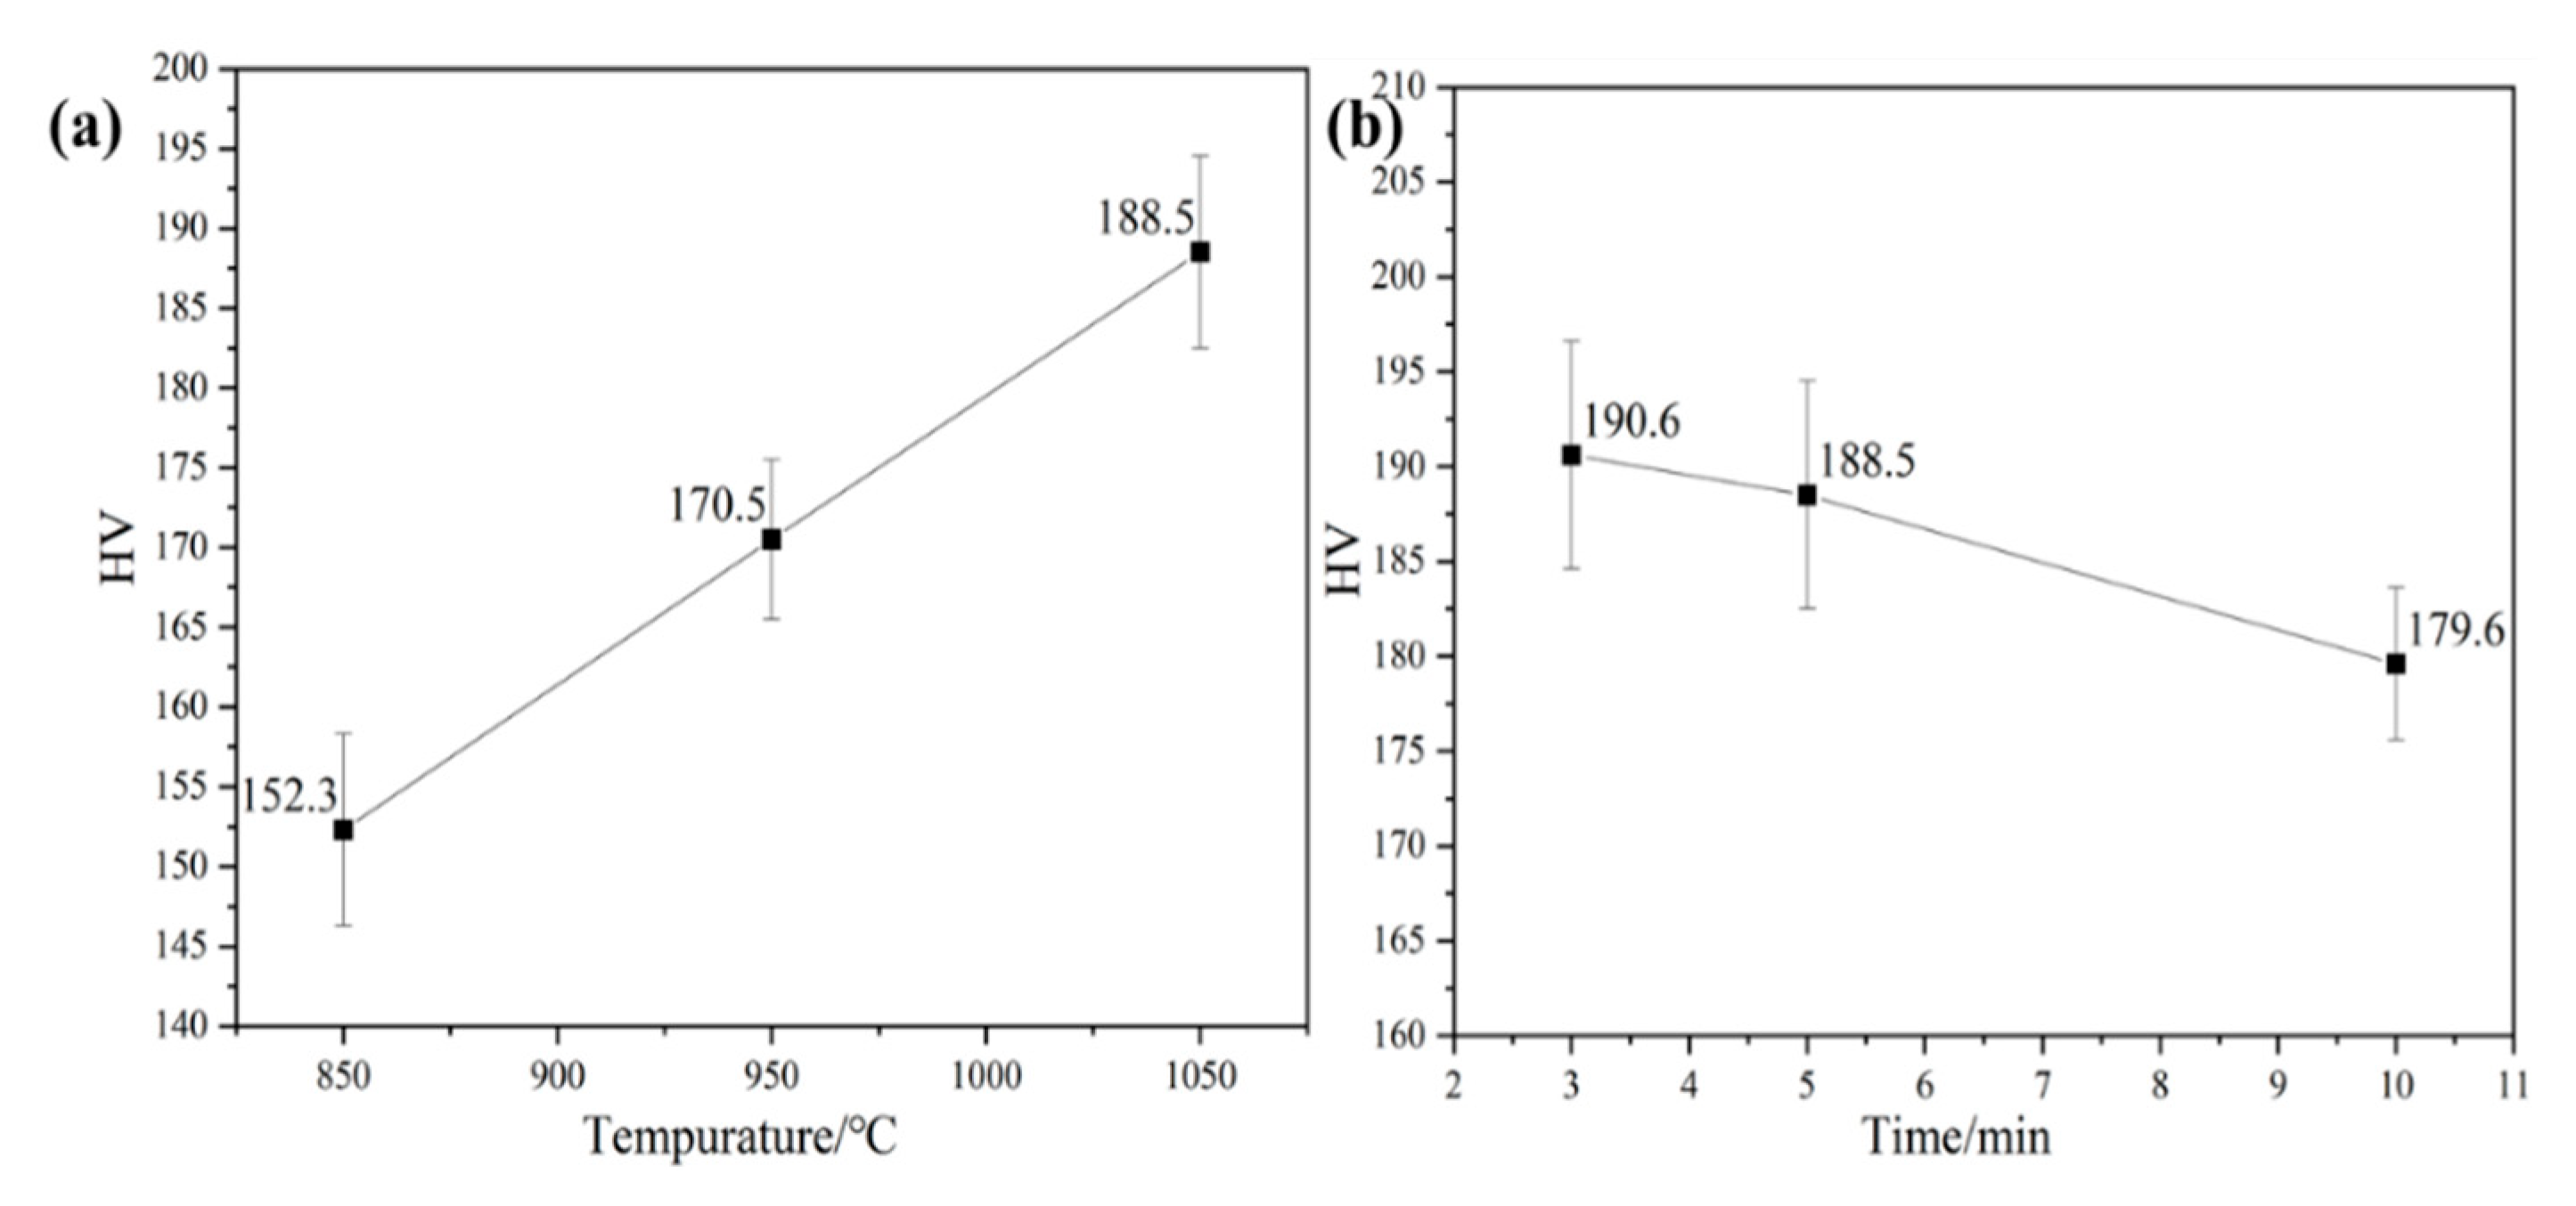
The SEM micrographs of the alloy are shown in Figure 5. The whole sample showed an equiaxial grain structure and a large number of twins existed in it. When the sintering temperature was 850 °C, the pores of the alloy were obvious, and the low sintering temperature resulted in the alloy having inconspicuous grain boundaries and a low actual density. With the increase in the sintering temperature and holding time, the pores in the alloy were gradually reduced and the density of the alloy was gradually increased. The actual density of the alloy is shown in Figure 6, and the relative density value of the alloy was the largest when the sintering temperature was 1050 °C and the holding time was 10 min. Figure 7 shows the measured values of the microhardness of the samples after different sintering temperatures and holding times. The results show that the hardness of the alloy gradually increases with the increase in the sintering temperature and decreases with the extension of the holding time, and the hardness value is the highest at 191 HV when the sintering temperature is 1050 °C and the holding time is 3 min. This phenomenon occurs because increasing the sintering temperature enhances the diffusion and fusion of alloy elements, leading to reduced internal porosity, improved densification, and, consequently, increased hardness. Conversely, a prolonged holding time induces grain coarsening in accordance with the Hall–Petch effect, where larger grain sizes diminish the material’s resistance to deformation, thereby reducing hardness.
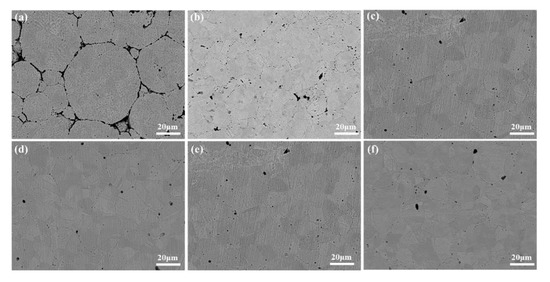
Figure 5.
SEM images of alloys at different sintering temperatures: (a) 850; (b) 950; (c) 1050-5; (d) 1050-3; (e) 1050-5; (f) 1050-10.
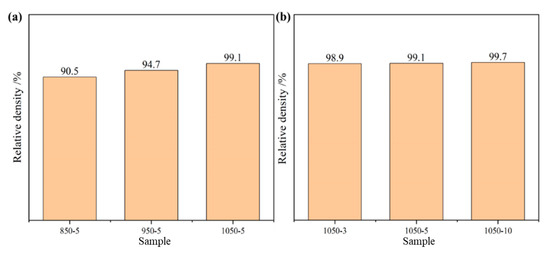
Figure 6.
High-entropy alloy relative density: (a) sintered at different sintering temperatures; (b) sintered at different holding times.

Figure 7.
Hardness: (a) sintered at different sintering temperatures; (b) sintered at different holding times.
The Hall–Petch formula is an empirical relationship describing the dependence of the yield strength on the grain size in polycrystalline materials, expressed as follows:
In this expression, represents the yield strength of the material; denotes the intragranular deformation resistance (a property intrinsic to the material, such as lattice friction stress); and is the Hall–Petch coefficient, which quantifies the obstruction of dislocation motion by grain boundaries; refers to the average grain diameter. Grain refinement enhances strength by increasing the grain boundary density, thereby amplifying the pinning effect on dislocations. Specifically, the increased number of grain boundaries impedes dislocation motion, forcing dislocations to pile up at boundaries and requiring higher external stresses to propagate plasticity.
3.2. Mechanical Properties
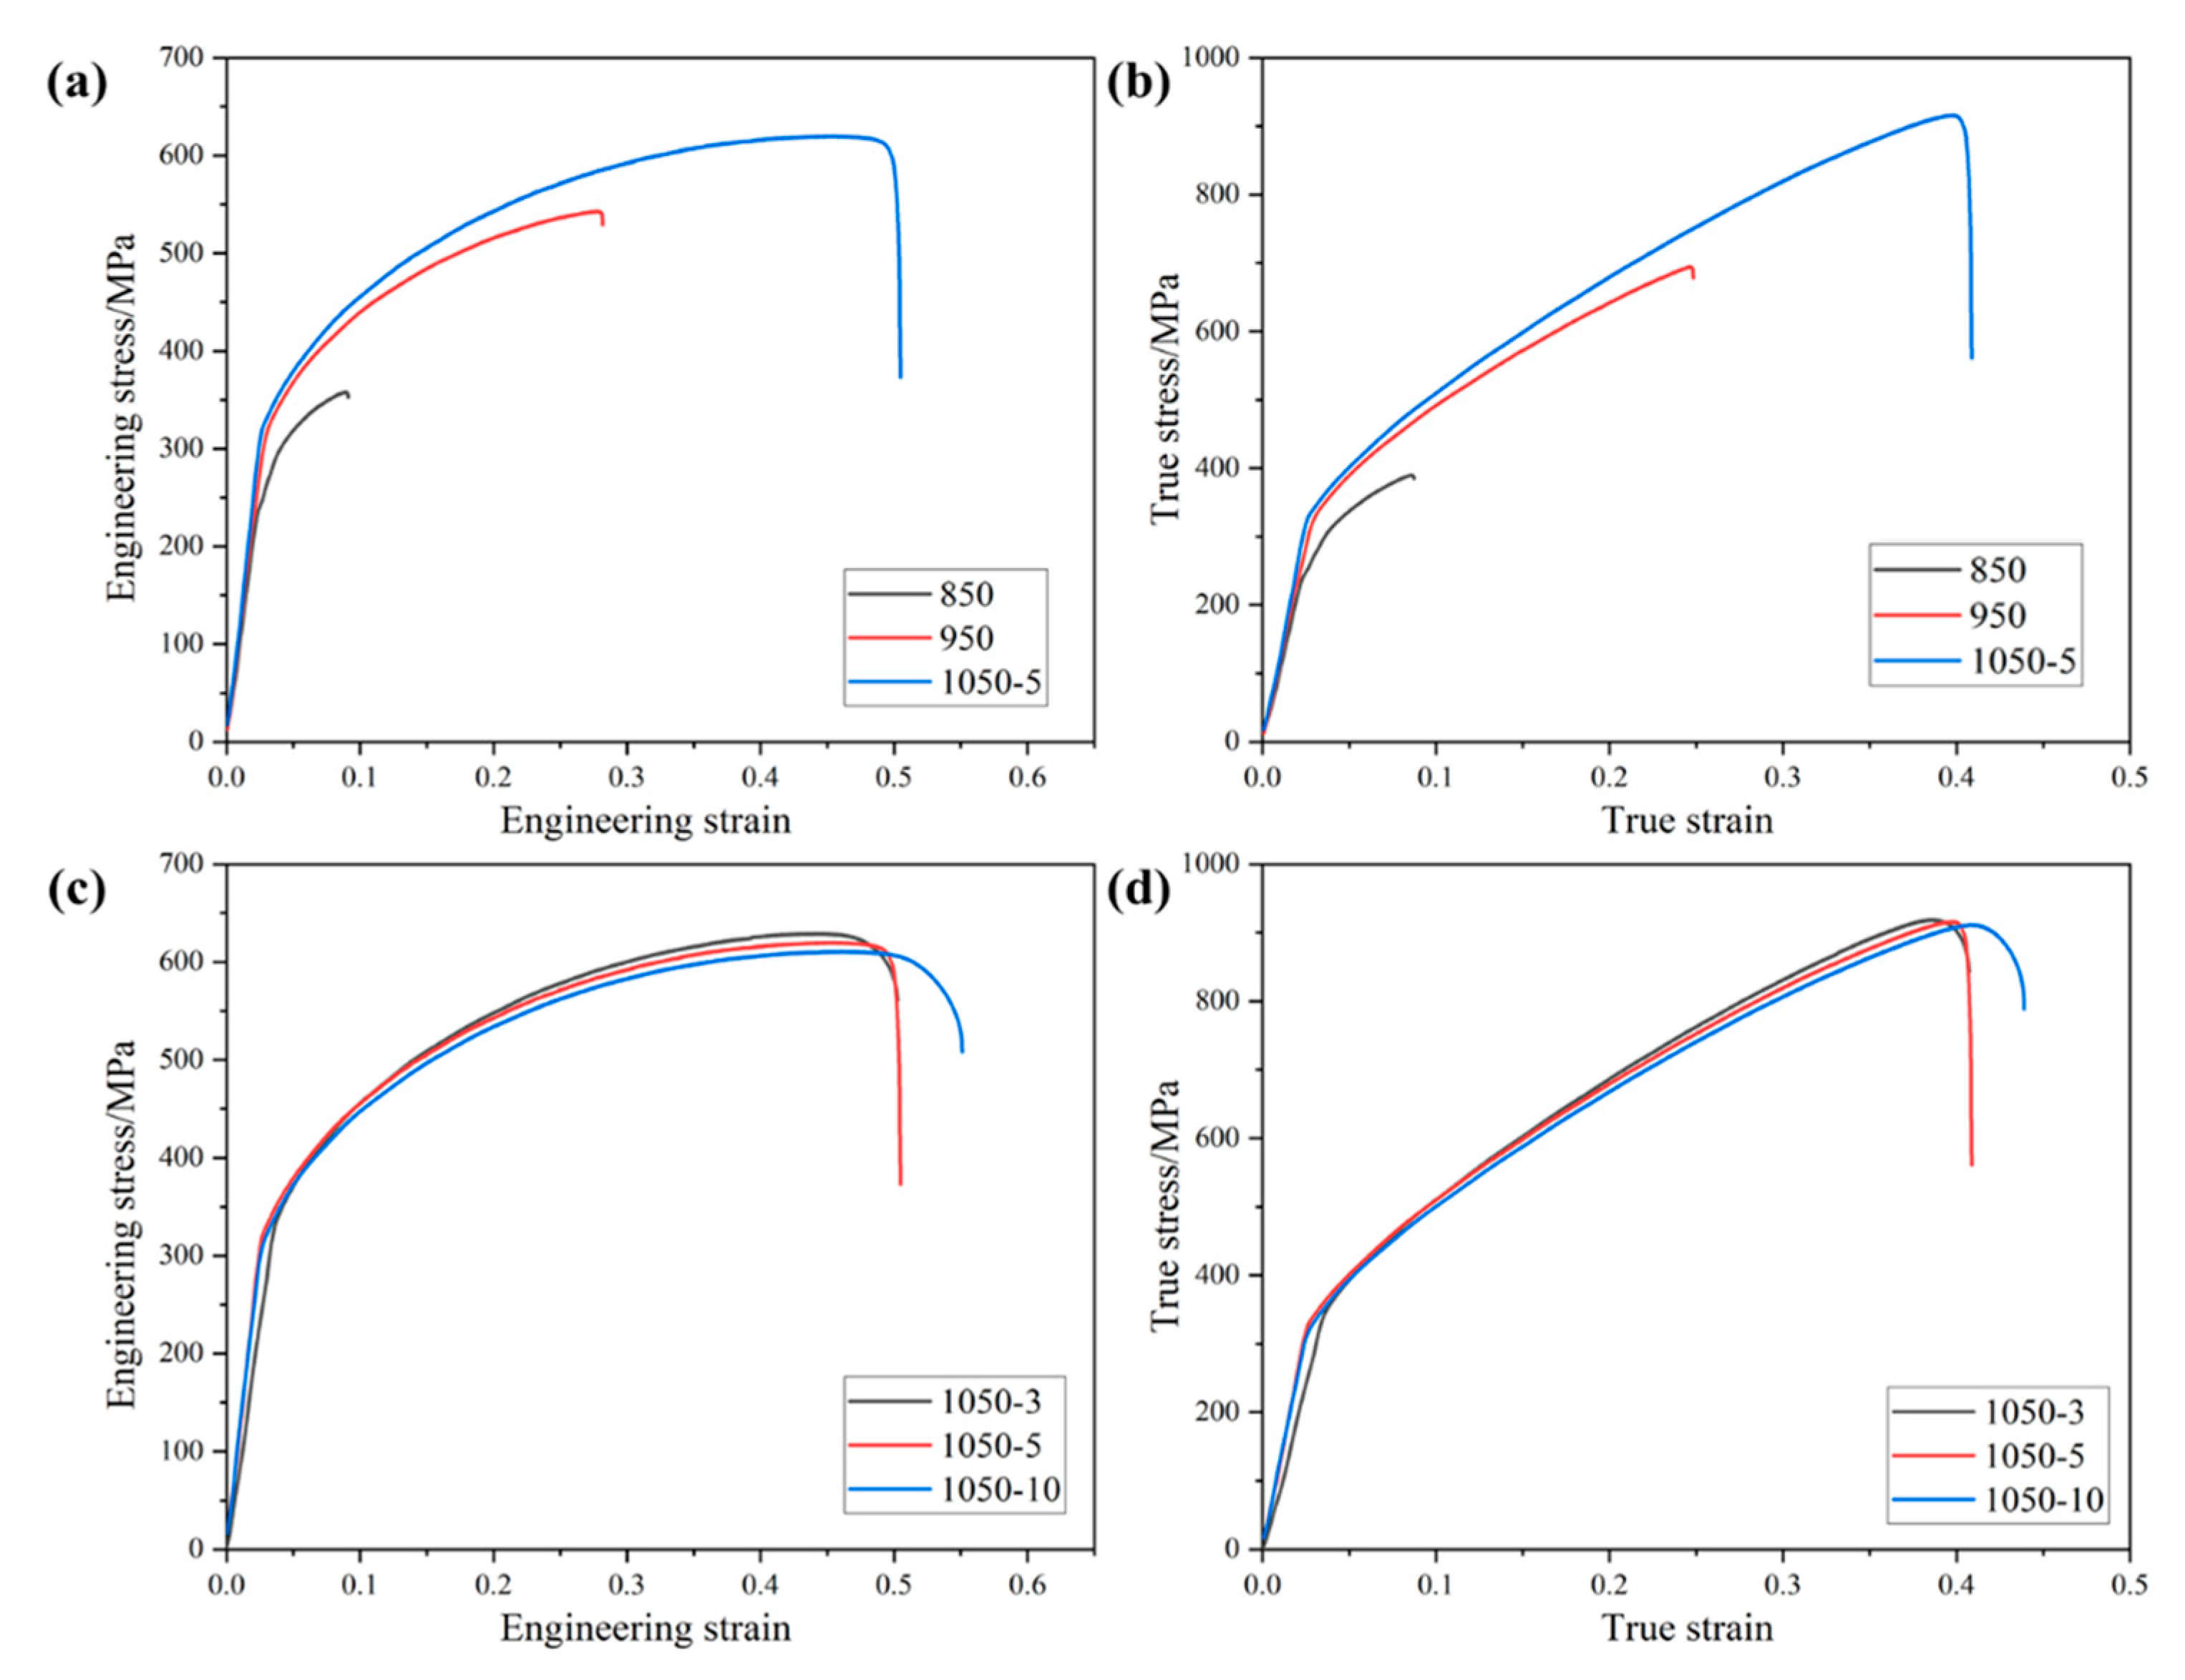
Figure 8 shows the room-temperature tensile engineering stress–strain curve and true stress–strain curve of the high-entropy alloy sintered at different sintering temperatures and holding times, from which it is learned that the strength and ductility of the alloy gradually increases with the increase in temperature, and the strength of the alloy gradually decreases and the ductility gradually increases with the increase in holding time. When the temperature was 850 °C, the tensile strength and elongation of the alloy were only 358.3 MPa and 9.1%, respectively. This is because the alloy sintered at 850 °C exhibited a lower relative density with numerous porosity defects, coupled with an insufficient sintering temperature that hindered adequate elemental diffusion. Consequently, complete metallurgical bonding between particles failed to form, thereby diminishing the material’s tensile performance [13]. The strength of the alloy reaches its maximum value of 629.0 MPa when the holding time is 3 min at a temperature of 1050 °C. The ductility of the alloy reaches its maximum value of 55.6% when the holding time is 10 min at a temperature of 1050 °C. The ductility of the alloy reaches its maximum value of 55.6% when the holding time is 10 min at a temperature of 1050 °C. This is because as the holding time increases, the grain boundary energy decreases and the grain growth leads to an increase in ductility and a decrease in strength. The tensile strength and elongation do not change much due to low grain growth.
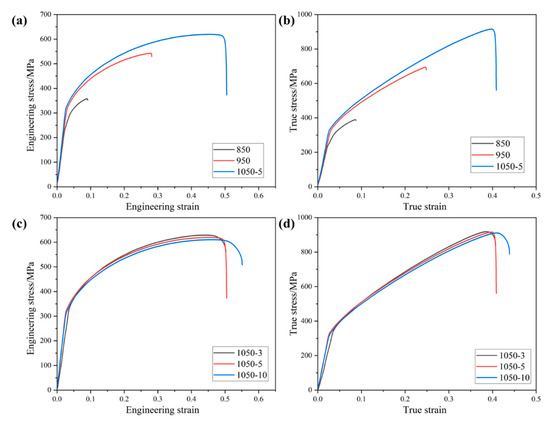
Figure 8.
Tensile (a,c) engineering stress–strain curves and (b,d) true stress–strain curves of high-entropy alloys sintered at different sintering temperatures and holding times at room temperature.
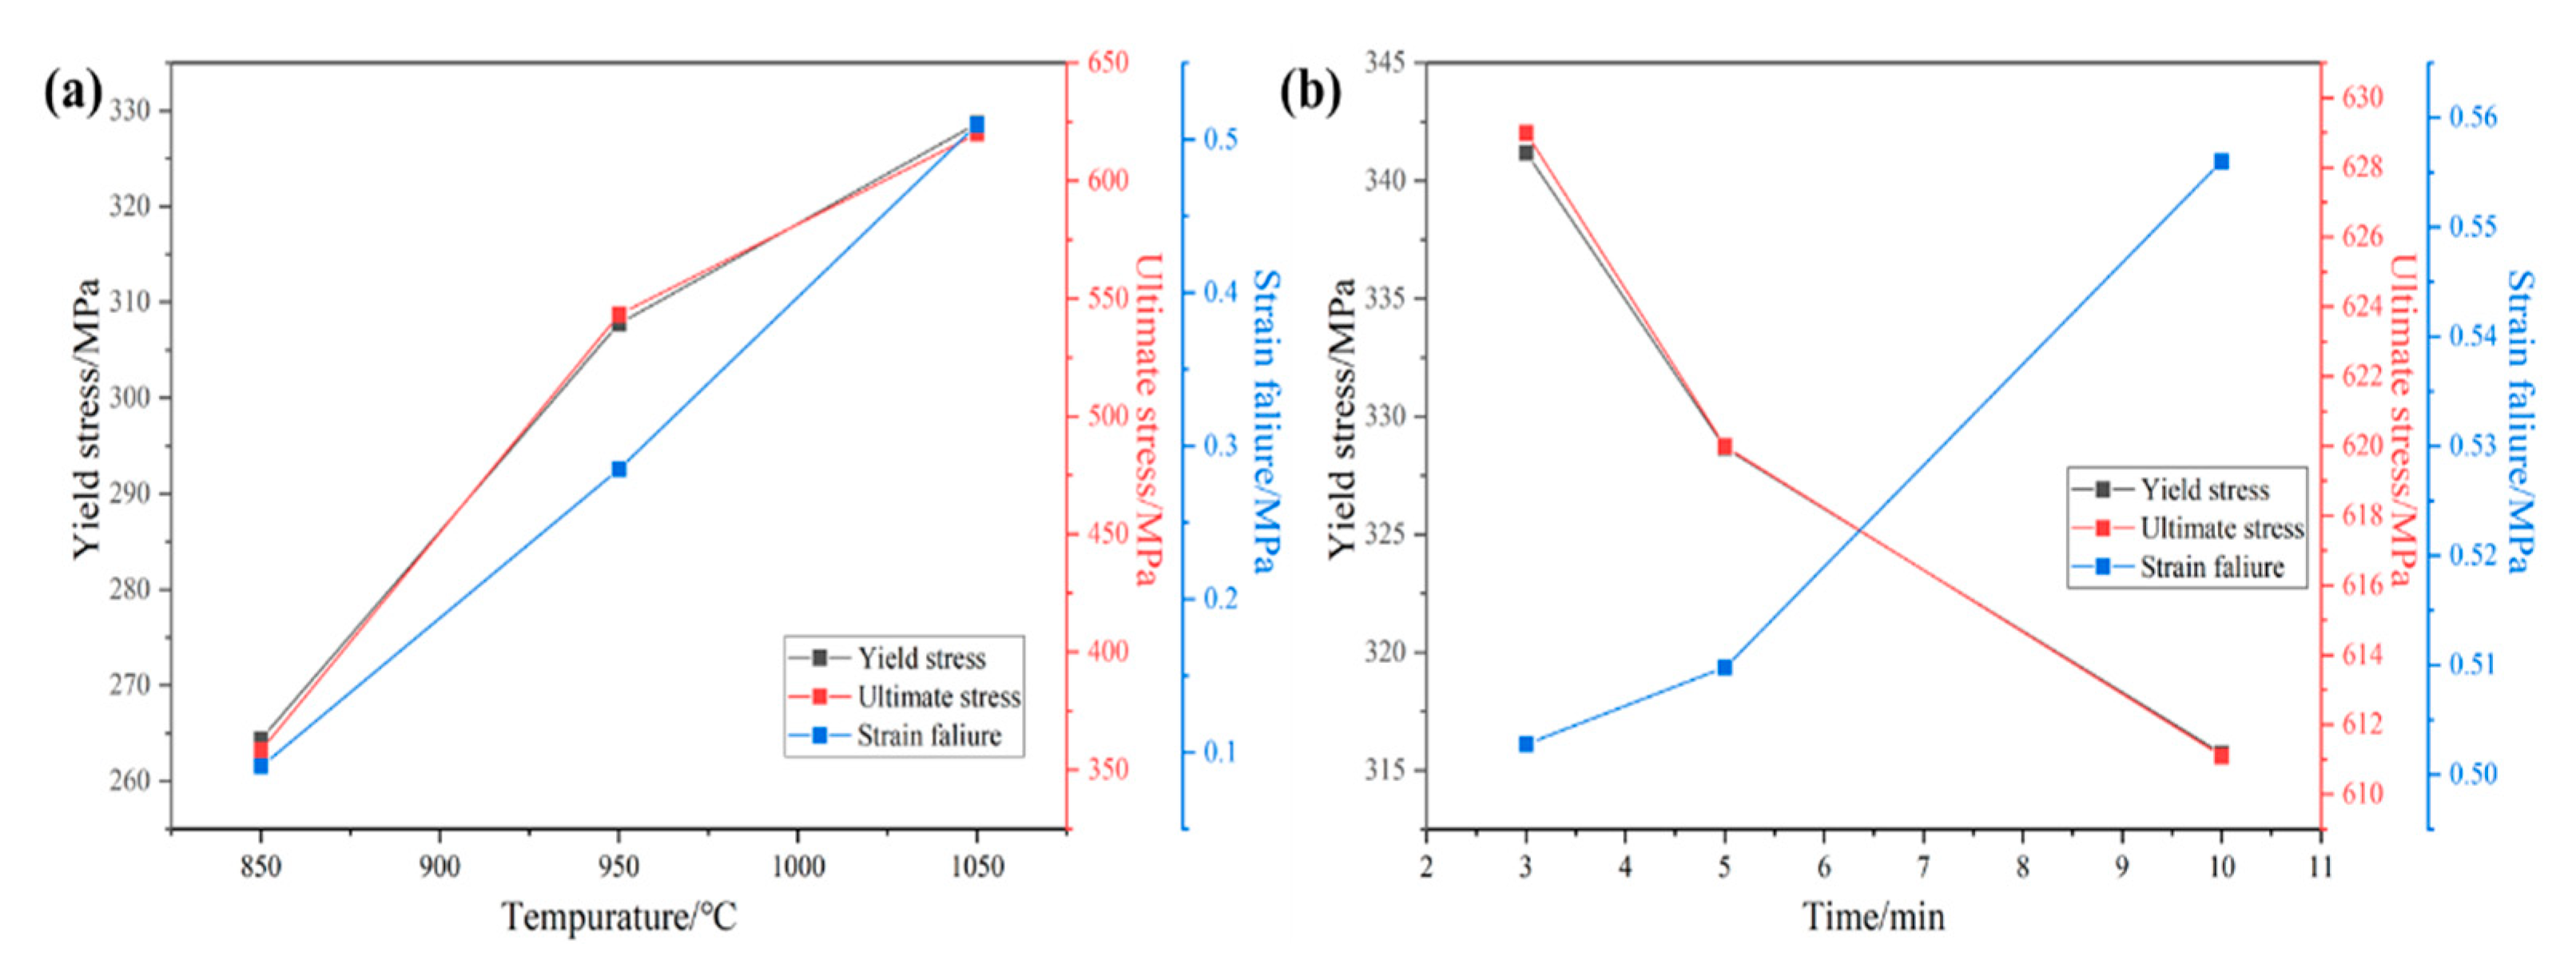
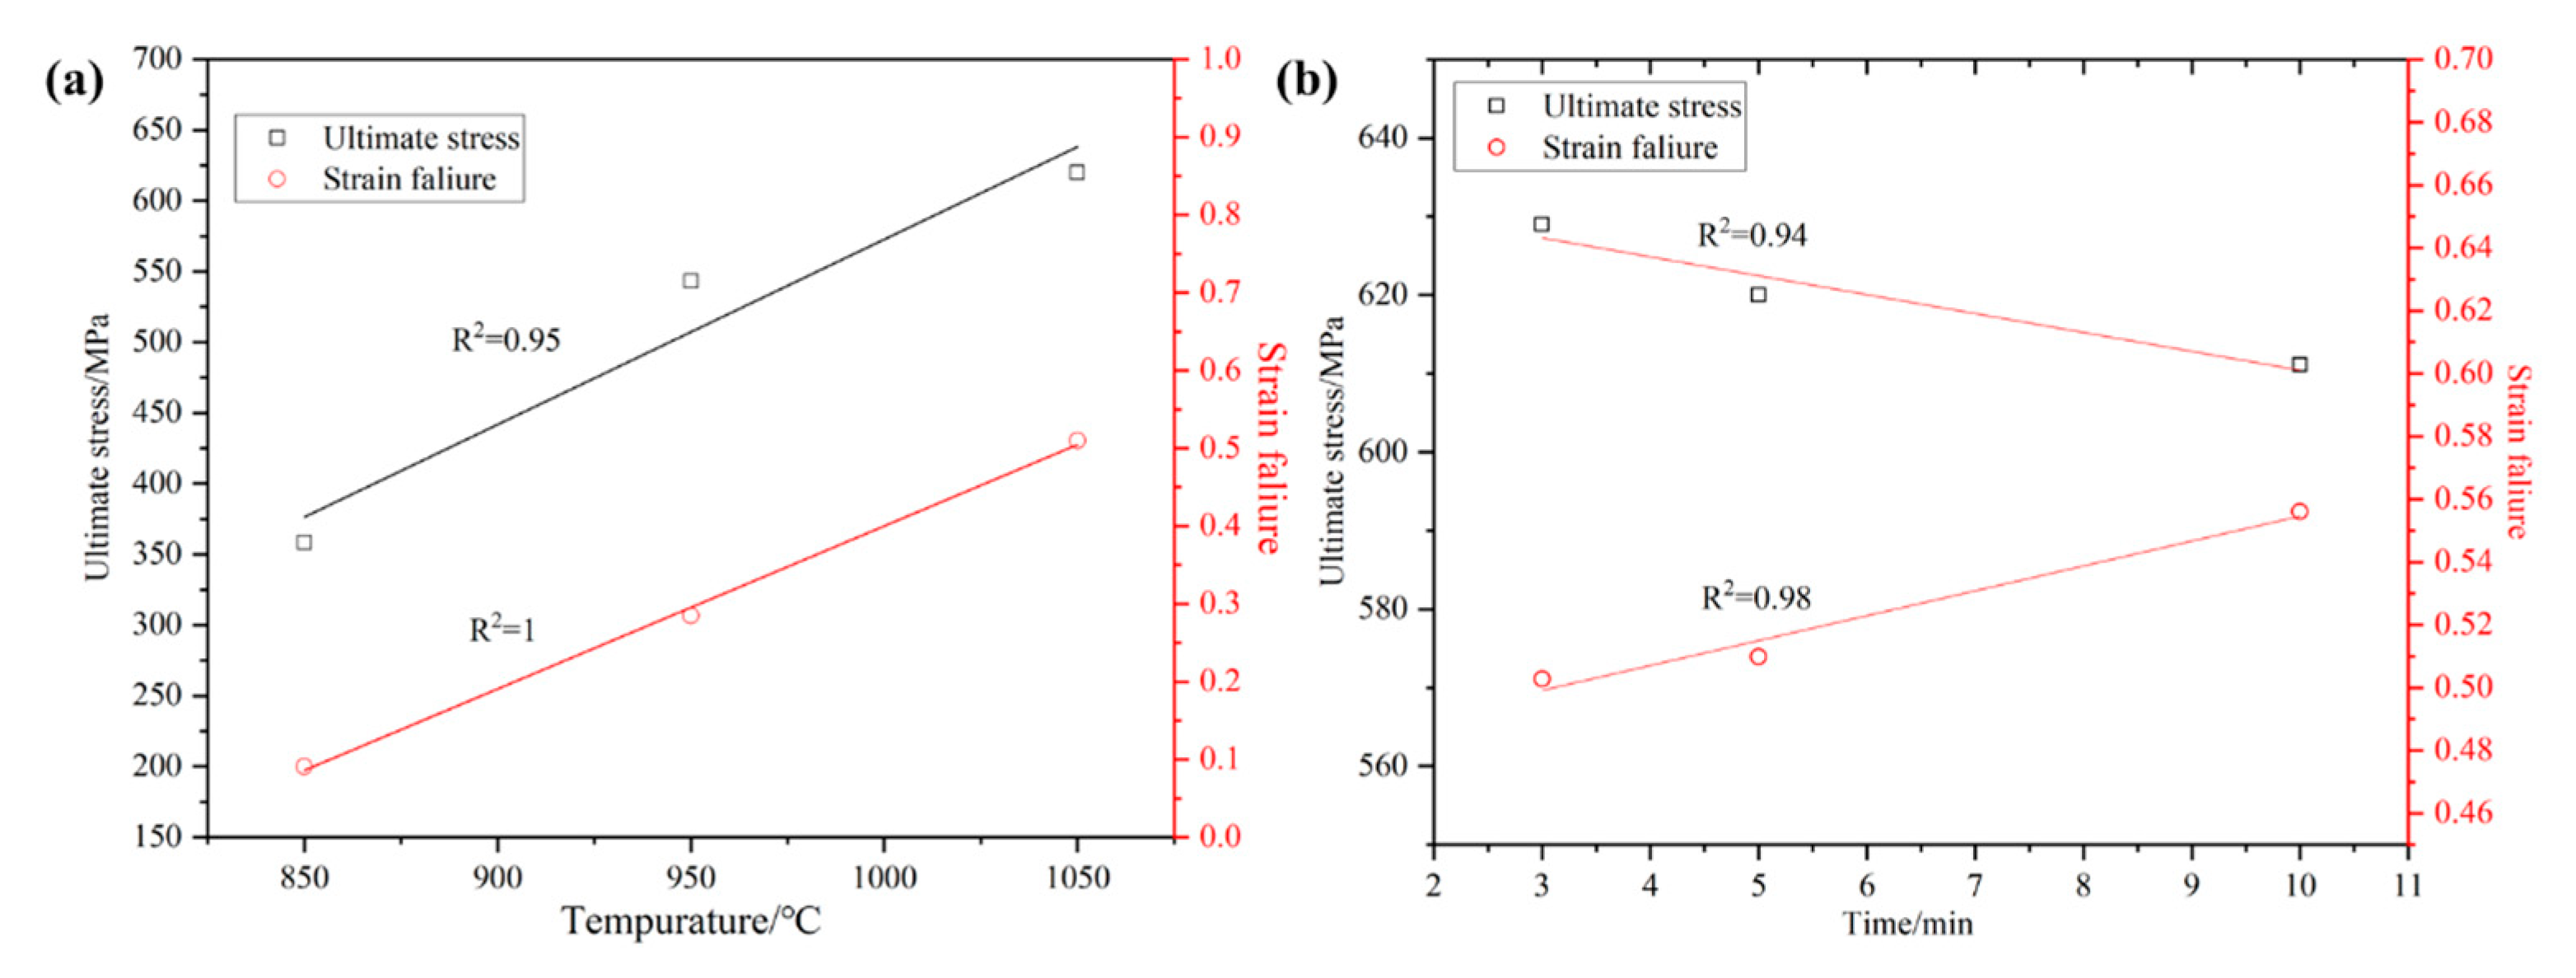
Figure 9 shows the yield strength, tensile strength, and elongation graphs, which can be more intuitively seen as the trends in the yield strength, tensile strength, and elongation of the alloy with the increase in temperature and holding time. At a certain sintering temperature and holding time, the sintered alloy’s strength and elongation shows a linear fit to the line segment shown in Figure 10. With the increase in temperature and the extension of the holding time, the tensile strength and elongation shows a certain regularity. When the sintering temperature is increased from 850 °C to 1050 °C, the tensile strength and elongation of the alloy show a linearly increasing trend. When the holding time is increased from 3 min to 10 min, the alloy tensile strength shows a linear decreasing trend and the elongation shows a linear increasing trend.
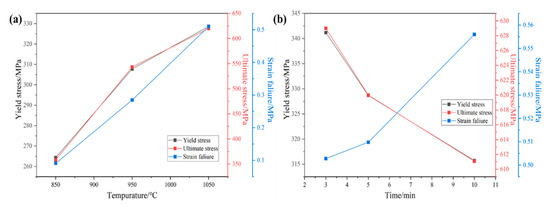
Figure 9.
Yield strength, tensile strength, and elongation: (a) sintered at different sintering temperatures; (b) sintered at different holding times.

Figure 10.
(a) Strength and elongation trends of the high-entropy alloy with different sintering temperatures and (b) different holding times.
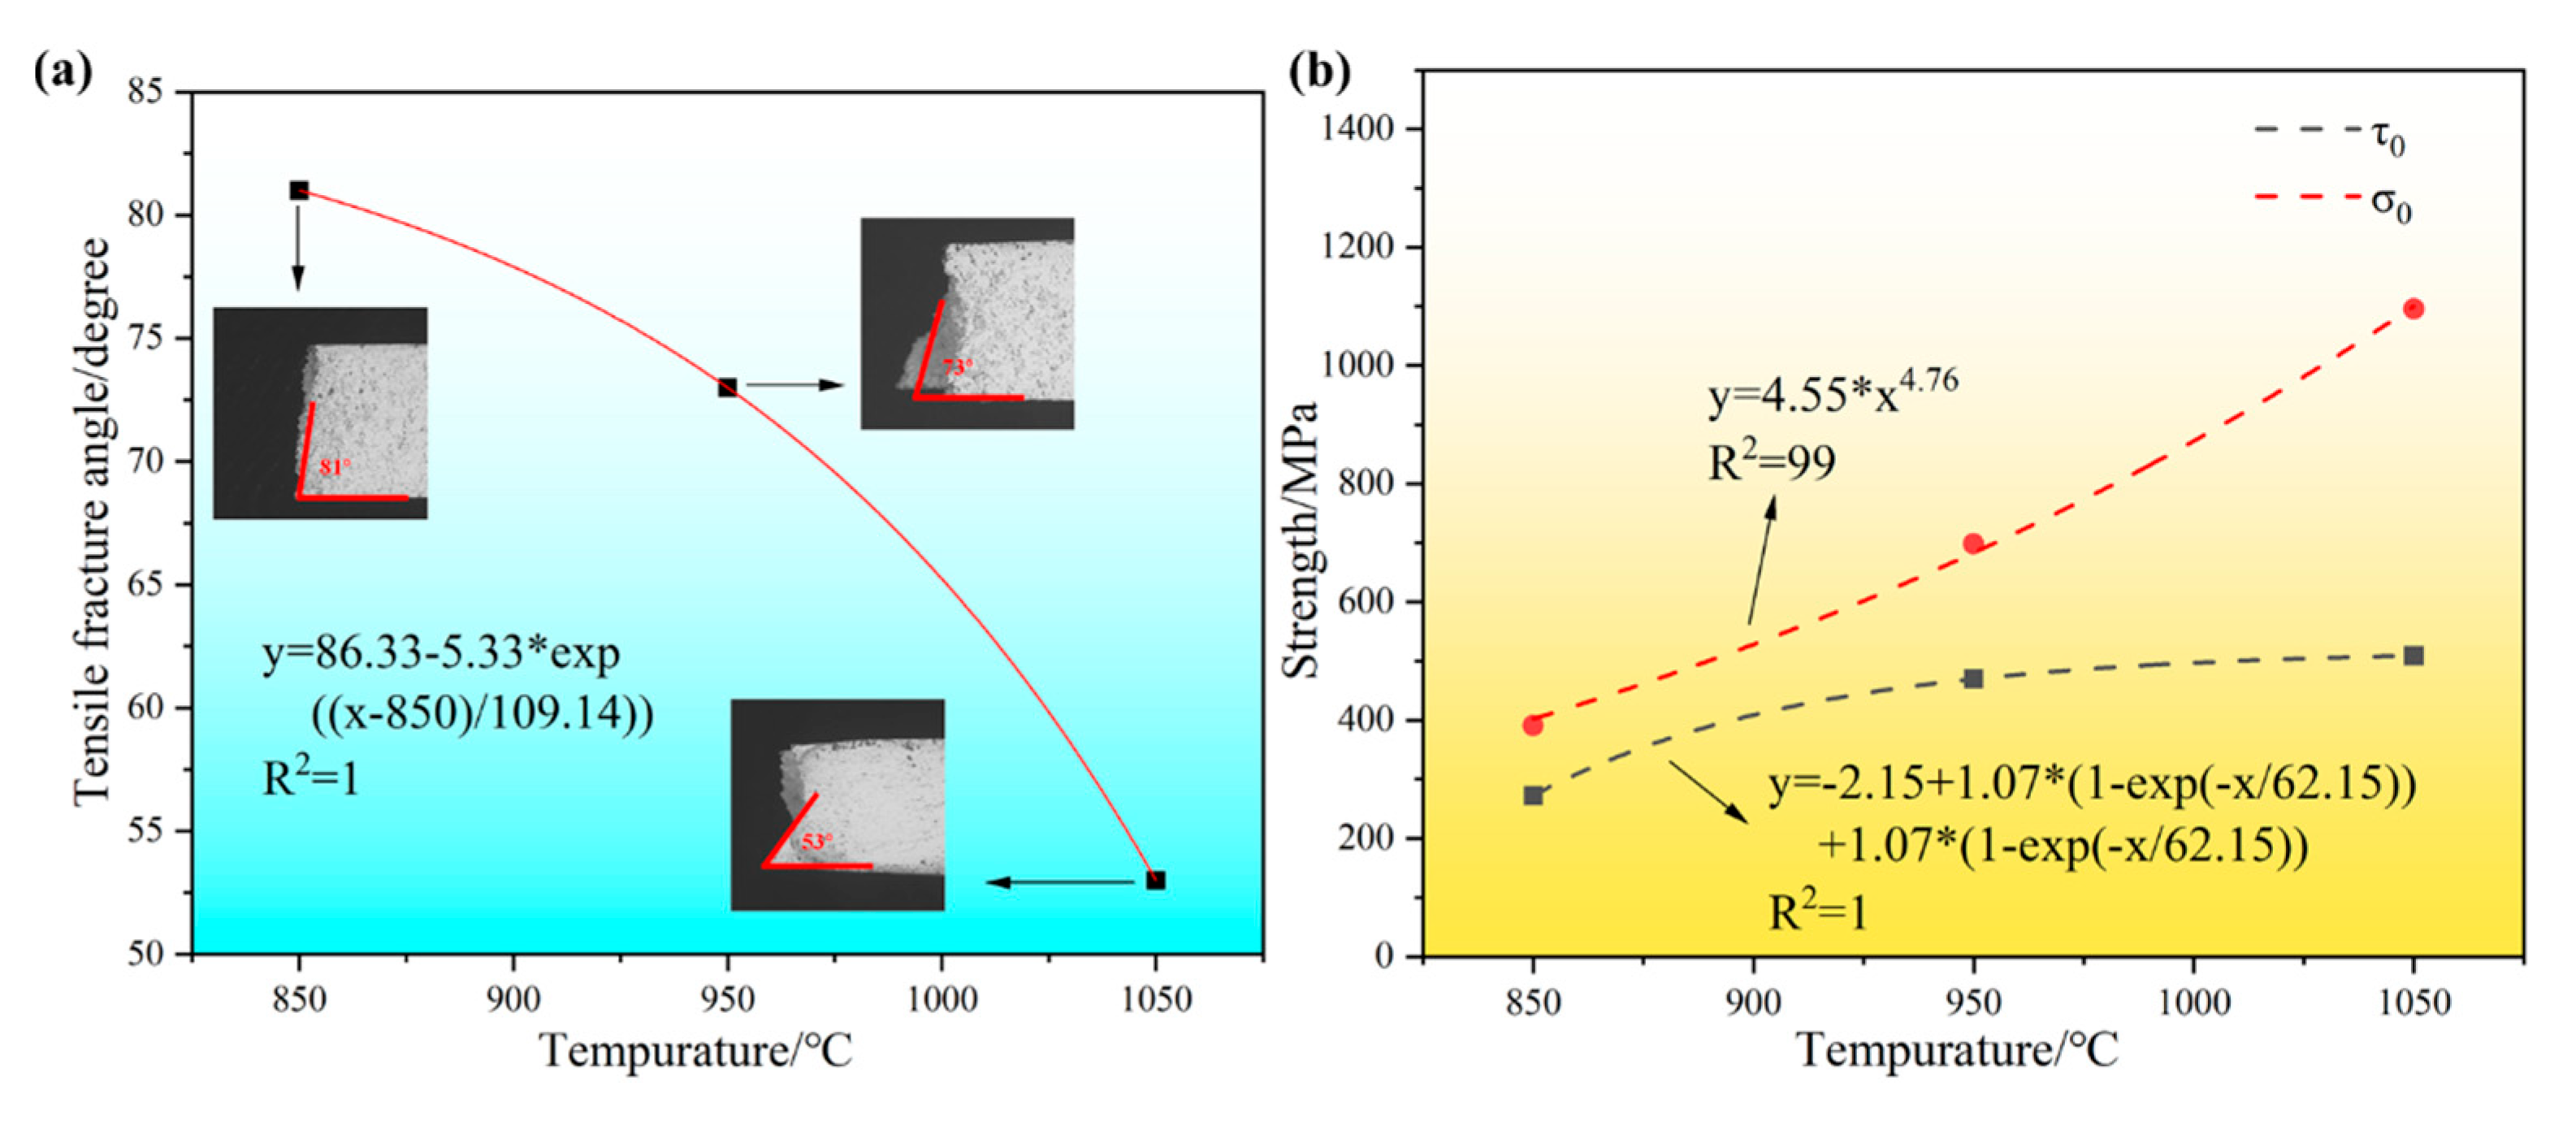
The difference in the tensile fracture angle of the prepared samples at different sintering temperatures is shown in Figure 11a. As the sintering temperature increases from 850 °C to 1050 °C, the fracture break angle of the tensile samples decreases gradually. When the sintering temperature is 850 °C, the tensile sample has the largest fracture angle of 81°. When the sintering temperature was 950 °C and 1050 °C, the fracture angles of the tensile samples were 73° and 53°, respectively. The fitting analysis was carried out by using Origin software, and the results showed that the fracture angle of the sample decreased gradually with the increase in the sintering temperature, which was fitted by using the formula y = 86.33 − 5.33 × exp((x − 850)/109.14), and the fitting R2 = 1, which indicated that the fitting effect was good. The difference in the tensile fracture angle of the samples prepared at 1050 °C after different holding times is shown in Figure 12a. As the holding time increases from 3 min to 10 min, the fracture break angle of the tensile samples decreases gradually. When the holding time is 3 min, the tensile samples have the largest fracture angle of 55°. When the holding time was 5 min and 10 min, the fracture angle of the tensile samples was 53° and 50°, respectively. Continuing to fit the value of the tensile fracture angle analysis, the results show that, with the increase in the insulation time, the sample fracture angle gradually decreases, using the formula y = 60.08x − 0.08 to fit it, and the fitting R2 = 0.99, indicating that the fitting effect is good.
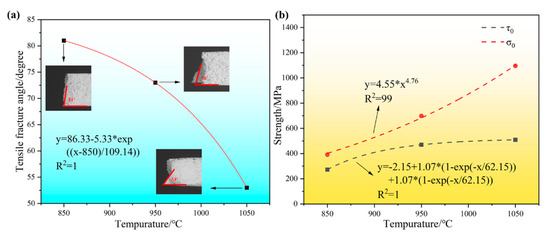
Figure 11.
Different sintering temperatures: (a) relationship of tensile shear fracture angle with the increase in the equivalent strain; (b) variations in τ0 and σ0 as a function of the imposed strain.
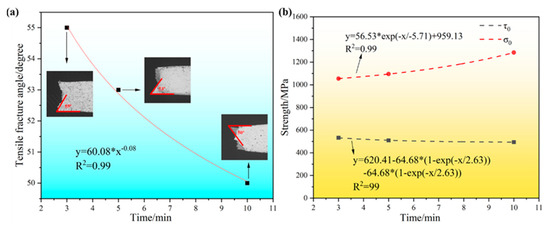
Figure 12.
Different holding times: (a) relationship of tensile shear fracture angle with the increase in the equivalent strain; (b) variations in τ0 and σ0 as a function of the imposed strain.
Zhang and Eckert [14] proposed an elliptic criterion to analyze the fracture behavior of bulk metallic glasses (BMGs), introducing parameters related to this material to explain the deformation and damage behavior of different undercuts [15], expressed as follows:
where σ and τ are the normal and shear stresses applied on the same plane, σ0 and τ0 are the critical normal and shear fracture strengths, respectively, and α = σ0/τ0 is the fracture mode factor. When the tensile stress τT is applied to the sample, the normal stress σ and shear stress τ on any shear surface can be expressed as follows:
Combining the above formulas, the fracture mode factor α can be expressed as a function of the tensile fracture angle θT, and σ0 and τ0 can be expressed as a function of the tensile fracture strength σF and α:
Without considering the effect of necking behavior, the tensile shear fracture angle is mainly determined by the parameter α. The graphs of σ0 and τ0 functions are calculated using Equations (4)–(6) [16].
The plots of the σ0 and τ0 functions for the samples prepared at the 850 °C, 950 °C, and 1050 °C sintering temperatures, respectively, are shown in Figure 11b. From the Figure 11b, it can be seen that with the increase in the sintering temperature, the critical normal fracture strength σ0 shows a gradually increasing trend, and the selection of the formula y = 4.55 x4.76 to fit it found that the fitting R2 = 0.99, and the fitting effect is good. The shear fracture strength τ0 firstly rises and then gradually tends to level off, and y = −2.15 + 1.07 × (1 − exp(−x/62.15)) + 1.07 × (1 − exp(−x/62.15)) + 1.07 × (1 − exp(−x/62.15)) is chosen to fit it, and the fitting R2 = 1, which is a good fitting effect. From the critical normal fracture strength σ0 and shear fracture strength τ0 fitting images, it can be seen that with the increase in the sintering temperature, the critical normal fracture strength σ0 shows an obvious rising trend, and when the sintering temperature reaches a certain temperature, the shear fracture strength τ0 no longer rises, resulting in a gradual decrease in the tensile fracture angle. The plots of the σ0 and τ0 functions for the samples prepared with 3 min, 5 min, and 10 min holding times, respectively, are shown in Figure 12b. From the Figure 12b, it can be seen that with the increase in the holding time, the critical normal fracture strength σ0 shows a gradual increase in the trend, the selection of the formula y = 56.53 × exp (−x/−5.71) + 959.13 to fit it showed that the fitting R2 = 0.99, so the fitting effect was good. The shear fracture strength τ0 shows a gradual decrease, and y = 620.41 − 64.68 × (1 − exp(−x/2.63)) − 64.68 × (1 − exp(−x/2.63)) is chosen to fit it, and the fitting R2 = 0.99, so the fitting effect is good. From the critical normal fracture strength σ0 and shear fracture strength τ0 fitting images, it can be seen that with the increase in the holding time, the critical normal fracture strength σ0 shows a significant rising trend, while the shear fracture strength τ0 shows a gradual decline in the trend of the rise in the critical normal fracture strength σ0 and the decline of the shear fracture strength τ0 leads to a gradual decrease in the tensile fracture angle. With the increase in the sintering temperature and holding time, the high-entropy alloy sample gradually tends to be dense; the reduction in alloy pores, the full diffusion of elements, and the full combination of particles are the main reasons for the rise in σ0, and the final sample fracture mode gradually evolves from forward fracture to shear fracture.
Figure 13 shows the true stress–strain versus strain hardening curves of the high-entropy alloy samples prepared at different sintering temperatures and holding times. From Figure 13a, it can be seen that, in the sintered samples prepared at 850 °C in the low-strain region, the strain hardening rate is very fast, and with the continuation of tensile testing, the strain rate gradually slows down and then continues to decline rapidly until the tensile samples fracture. The samples prepared by sintering at 950 °C also show three stages: firstly, a rapid decline, followed by a leveling off, and finally, a continued rapid decline. There is a slight increase in the work hardening region compared to the sintered samples prepared at 850 °C. The samples prepared by sintering at 1050 °C show three stages of rapid decline, followed by a slow increase and finally a continued rapid decline. Compared to the samples prepared by sintering at 850 °C and 950 °C, the work hardening region increases significantly, which is mainly due to the reduction in internal pores, more homogeneous bonding between elements, and the generation of twins in the high-entropy alloys as the temperature increases. From Figure 13b, it can be seen that the samples prepared under the holding time of 3 min, 5 min, and 10 min, respectively, show three stages of rapid decrease, then slow increase, and finally, rapid decrease. The intersection of the stress–strain curves and strain hardening curves of the three samples occurs at higher strains. The intersection of the true stress–strain curves of the samples prepared at a holding time of 3 min is slightly lower than that of the samples prepared at a holding time of 5 min, and both intersections are lower than that of the samples prepared at a holding time of 5 min. Due to the delay in necking, the ductility of the samples prepared with a holding time of 10 min is the highest and the ductility of the samples prepared with a holding time of 3 min is the worst.
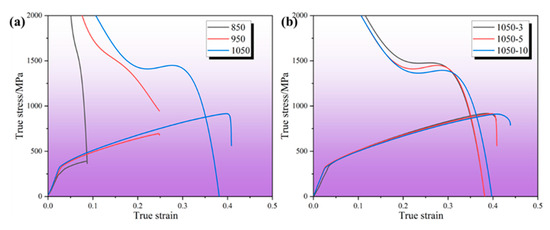
Figure 13.
Strain hardening curves of high-entropy alloy: (a) sintered at different sintering temperatures; (b) sintered at different holding times.
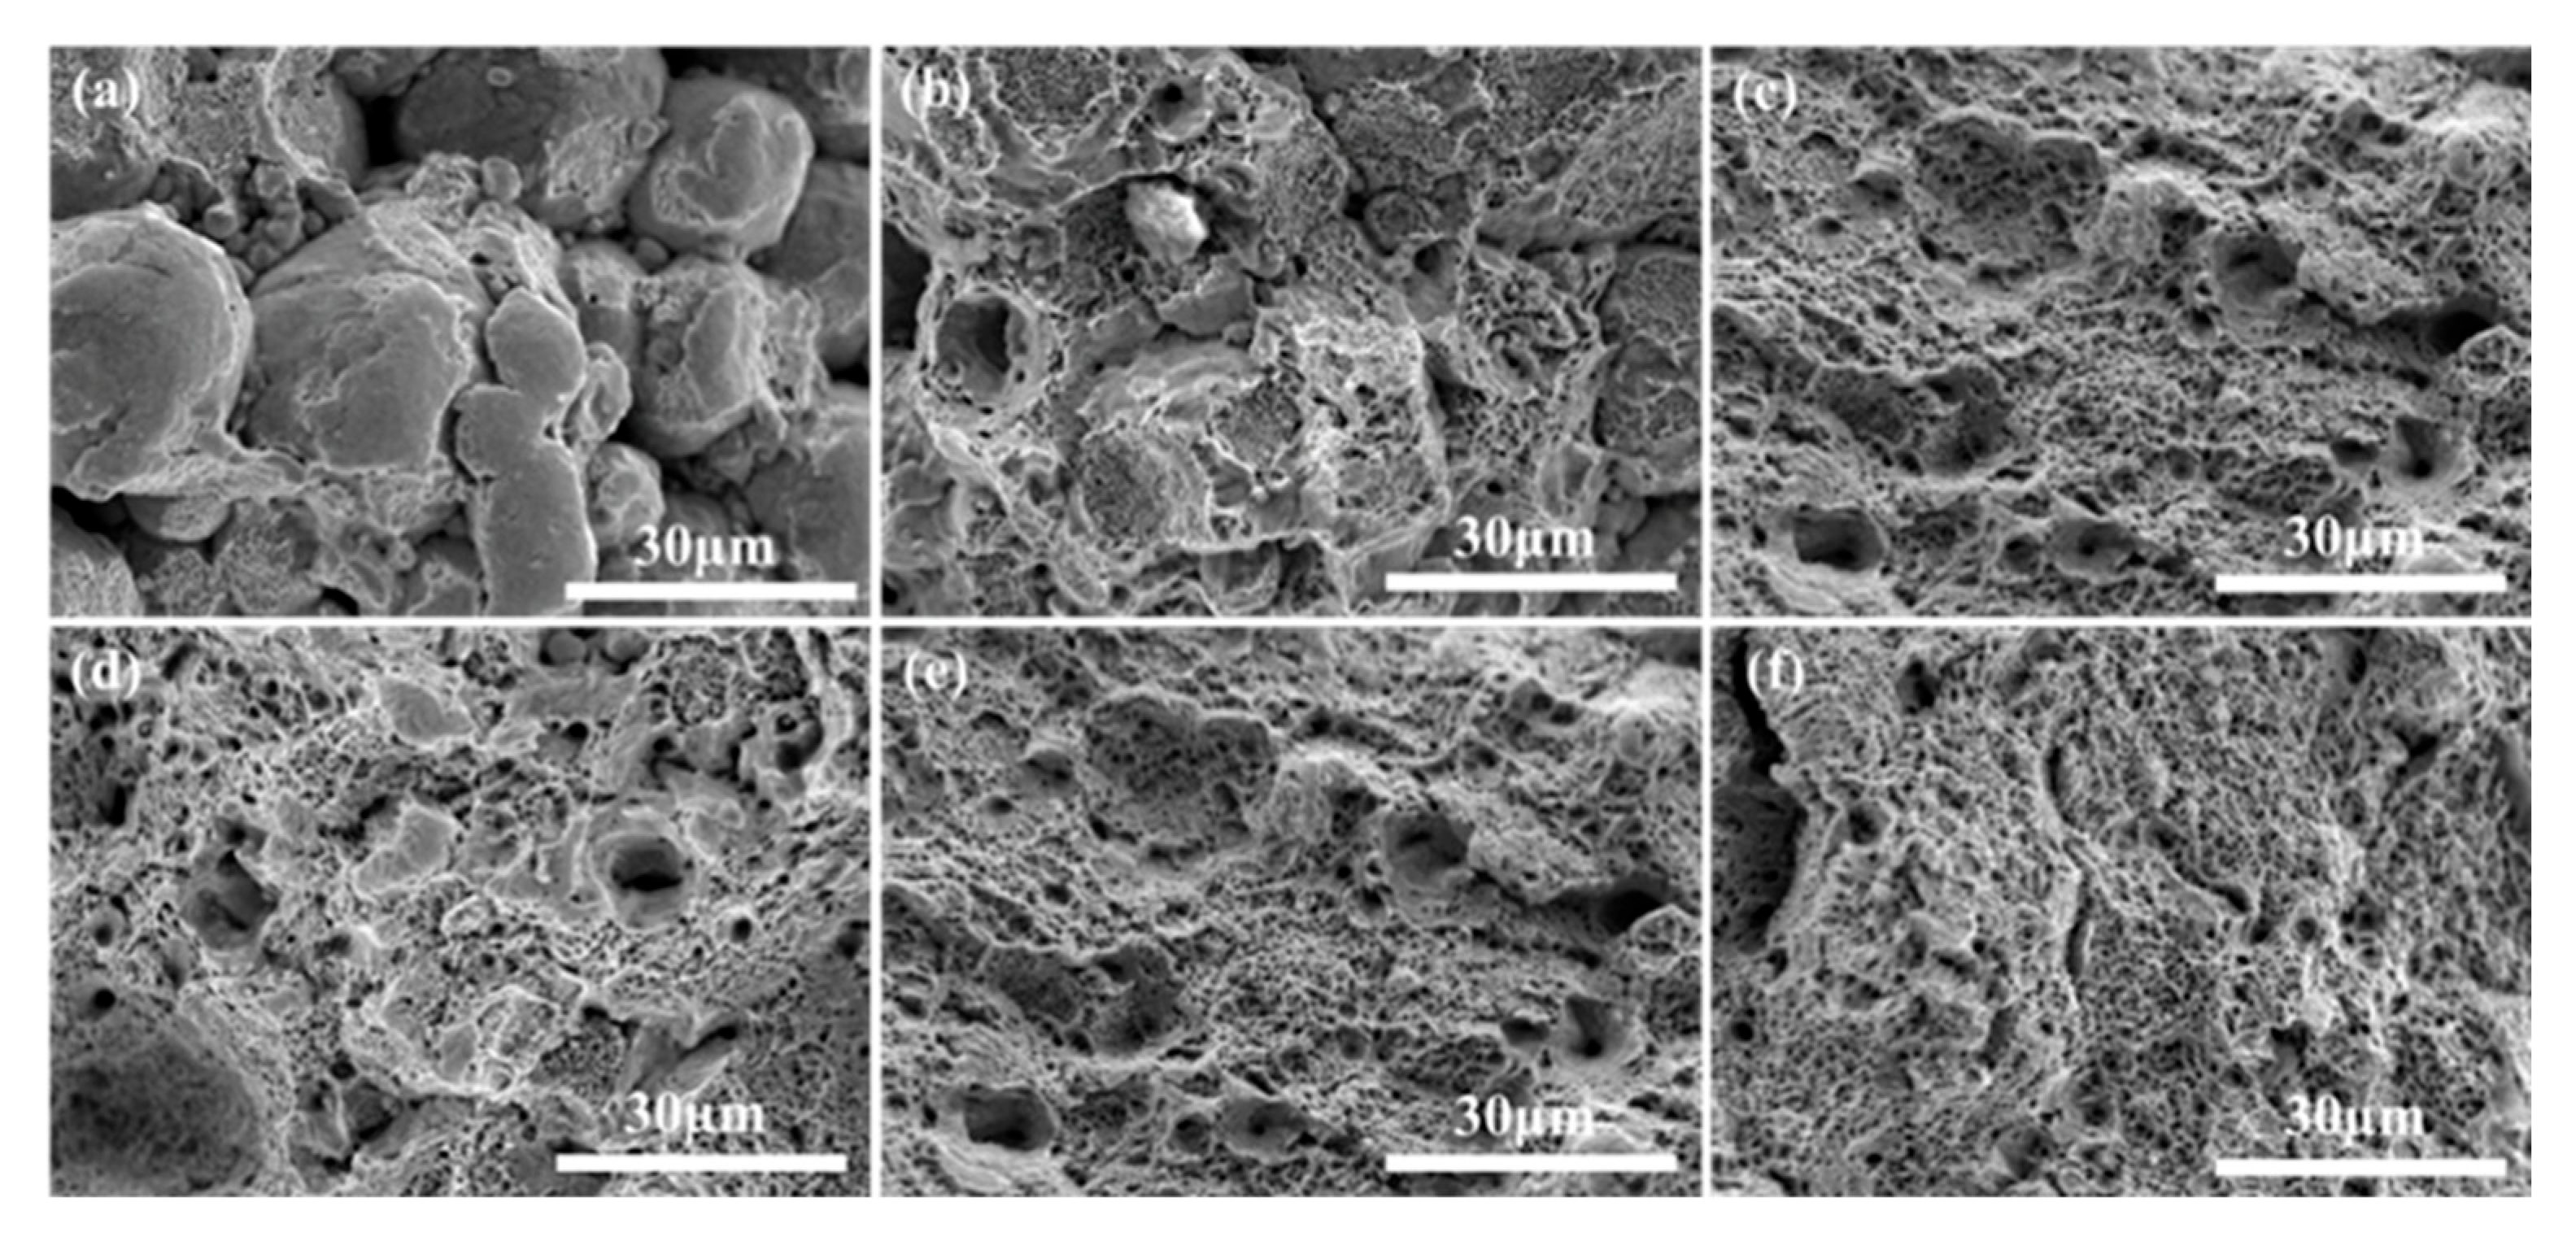
Figure 14 shows a fractured picture of the sintered alloy under different sintering temperatures and holding times. From Figure 14a, it can be seen that, when the sintering temperature is 850 °C, the elemental particles are obviously not completely fused, and the elemental diffusion is not uniform, resulting in poor performance of the tensile strength and elongation. When the sintering temperature increases to 950 °C, elemental fusion occurs more fully, and there are a small number of tough nests that appear, but a certain amount of particles and cracks are still present. When the temperature is increased to 1050 °C, the elemental fusion occurs more fully, the tough nests increase significantly, and with the prolongation of the holding time, the performance of the tough nests is more pronounced.

Figure 14.
High-entropy alloy fracture: (a) 850; (b) 950 (c); 1050-5; (d) 1050-3; (e) 1050-5; (f) 1050-10.
3.3. Wear Properties
Figure 15 shows the friction coefficient–time curves of the sintered alloys at different sintering temperatures and holding times. From the Figure 15, it can be seen that, at the beginning of the test, the interface is very rough and the contact area with the grinding ball is very small. When the grinding ball is worn, a cold welding effect occurs, which requires a large shear force to cut it, causing the friction coefficient to increase rapidly [17]. With the increase in the wear time, the contact area increases and the interface becomes a smooth friction layer, so that the friction coefficient gradually stabilizes. The friction coefficients of the samples under different conditions, shown in the Figure 16, show large fluctuations, which are mainly due to the periodic accumulation and elimination of wear debris from the wear surface [18,19]. The friction coefficient increases with the accumulation of wear debris on the wear surface. The coefficient of friction decreases when the wear debris separates from the wear surface or fills in the cracks. Among them, the porosity in alloys 850 and 950 causes localized fractures. Therefore, the localized fracture caused by porosity is the reason for the large fluctuation in the friction coefficient [17,18,19,20].
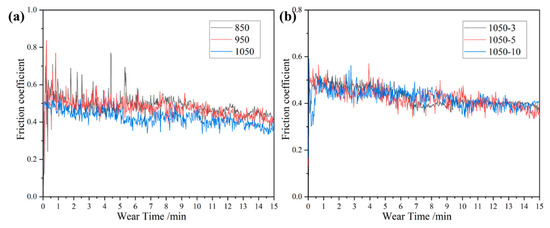
Figure 15.
Friction coefficient of high-entropy alloy: (a) sintered at different sintering temperatures; (b) sintered at different holding times.
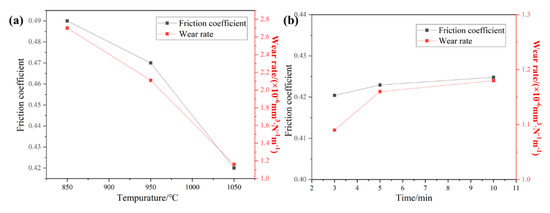
Figure 16.
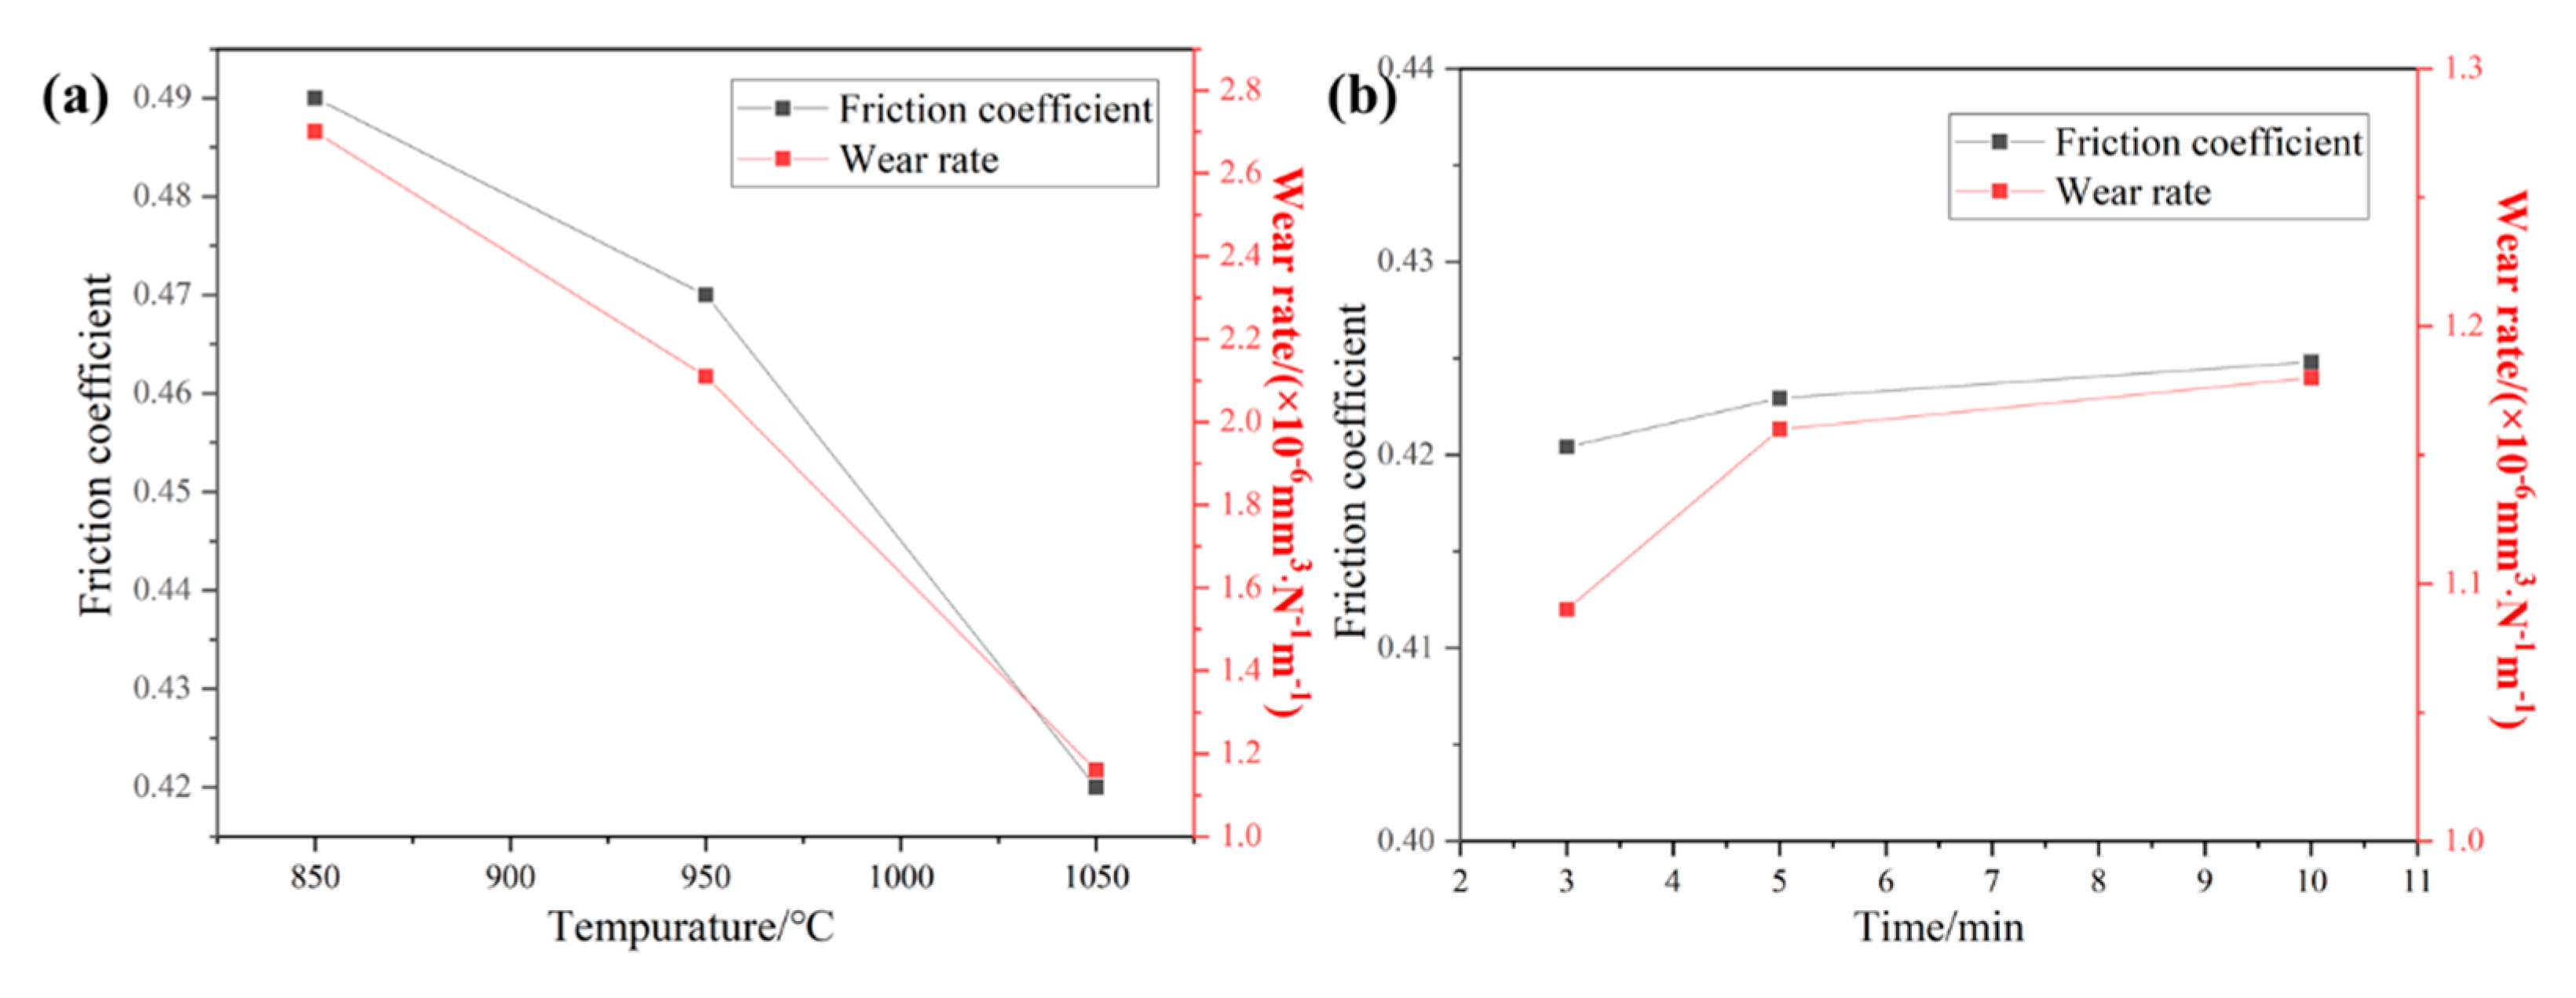
Average friction coefficient and wear rate: (a) sintered at different sintering temperatures; (b) sintered at different holding times.
Figure 16 shows the average friction coefficient and wear rate of the sintered alloy at different sintering temperatures and holding times. It can be seen from Figure 16a that the average friction coefficient and wear rate of the alloy show a downward trend with the increase in the sintering temperature. It can be seen from Figure 16b that with the increase in the holding time, the average friction coefficient and wear rate of the alloy increase slightly and remain basically unchanged. Therefore, it can be concluded that increasing the sintering temperature significantly reduces the material porosity, thereby substantially improving the wear resistance of the alloy. In contrast, while prolonging the holding time leads to grain growth, its effect on porosity reduction is limited, consequently having minimal impact on the material’s wear performance.
Figure 17 shows the wear surface of the alloy after room-temperature frictional wear. It can be seen from the Figure 17 that the samples sintered at different temperatures and holding times have a similar wear morphology, including certain scratches and steps. Some plastic deformation exists in the direction parallel to the scratches, and when the plastic deformation of the alloy exceeds a certain level, the alloy cracks and breaks into wear chips. As wear proceeds, some of the chips undergo fragmentation, accumulation, and elimination. Finally, they are compacted to form steps. Another portion of the debris peels off from the worn surface and becomes crumbs [20]. The slight oxidation of the wear surface as well as obvious grooves can be observed in the Figure 17, so the wear mechanism of this alloy is adhesive wear.
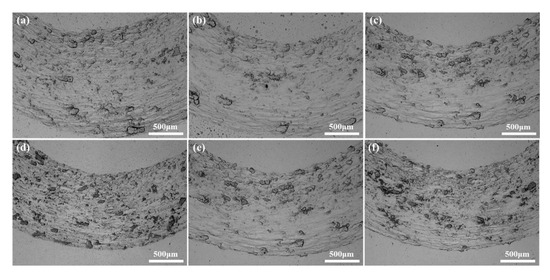
Figure 17.
Wear morphology of high-entropy alloy sintered at different sintering temperatures and holding times: (a) 850; (b) 950; (c) 1050-5; (d) 1050-3; (e) 1050-5; (f) 1050-10.
4. Conclusions
In this study, we successfully sintered CoCrFeNiMn high-entropy alloy powder with SPS. The microstructure and mechanical properties of the CoCrFeNiMn high-entropy alloy were investigated at different sintering temperatures and holding times. The following conclusions can be drawn.
- (1)
- The alloy sintered at 1050 °C and held for 3 min has the highest tensile strength of 629.0 MPa, and the alloy sintered at 1050 °C and held for 10 min has the best ductility of 55.6%. The fracture mechanism was ductile.
- (2)
- As the sintering temperature increases, the porosity of the alloy decreases and the tensile properties and ductility increase. With the increase in the holding time, the tensile strength of the alloy decreases, the grain size increases, and the ductility rises.
- (3)
- With the increase in the sintering temperature, the critical normal fracture strength σ0 shows an obvious rising trend, and when the sintering temperature reaches a certain temperature, the shear fracture strength τ0 no longer rises. With the increase in the holding time, the critical normal fracture strength σ0 shows a clear rising trend, and the shear fracture strength τ0 shows a gradual decline. The alloy fracture form is gradually changed from the normal fracture to shear fracture mode.
- (4)
- The alloy sintered at 1050 °C and held for 3 min has the highest hardness and the best wear resistance, and the wear mechanism is mainly adhesive wear and abrasive wear.
Author Contributions
Conceptualization, N.L. and F.D.; methodology, J.H. and Z.W.; software, Z.W. and M.J.; validation, M.J. and J.H.; investigation, C.W.; writing—original draft preparation, N.L. and C.W.; writing—review and editing, F.D.; supervision, F.D. All authors have read and agreed to the published version of the manuscript.
Funding
The authors are thankful for the financial support of the Ningxia Natural Science Foundation (No. 2023AAC03289), Western Young Scholars Program (XAB2021YW12), the Natural Science Foundation of China (51901002), and Project (TJGC2020142) supported by the Ningxia Youth Talents Supporting Program and Young TopNotch Talents Supporting Program.
Data Availability Statement
The original contributions presented in this study are included in the article. Further inquiries can be directed to the corresponding author.
Conflicts of Interest
The authors declare no conflicts of interest.
References
- Li, D.; Li, C.; Feng, T.; Zhang, Y.; Sha, G.; Lewandowski, J.J.; Liaw, P.K.; Zhang, Y. High-entropy Al0.3CoCrFeNi alloy fibers with high tensile strength and ductility at ambient and cryogenic temperatures. Acta Mater. 2017, 123, 285–294. [Google Scholar] [CrossRef]
- Zhou, Y.J.; Zhang, Y.; Wang, Y.L.; Chen, G.L. Solid solution alloys of AlCoCrFeNiTix with excellent room-temperature mechanical properties. Appl. Phys. Lett. 2007, 90, 181904. [Google Scholar] [CrossRef]
- Chen, J.; Zhou, X.; Wang, W.; Liu, B.; Lv, Y.; Yang, W.; Xu, D.; Liu, Y. A review on fundamental of high entropy alloys with promising high–temperature properties. J. Alloys Compd. 2018, 760, 15–30. [Google Scholar] [CrossRef]
- Whitfield, T.E.; Pickering, E.J.; Owen, L.R.; Senkov, O.N.; Miracle, D.B.; Stone, H.J.; Jones, N.G. An assessment of the thermal stability of refractory high entropy superalloys. J. Alloys Compd. 2020, 857, 157583. [Google Scholar] [CrossRef]
- Chuang, M.-H.; Tsai, M.-H.; Wang, W.-R.; Lin, S.-J.; Yeh, J.-W. Microstructure and wear behavior of AlxCo1.5CrFeNi1.5Tiy high-entropy alloys. Acta Mater. 2011, 59, 6308–6317. [Google Scholar] [CrossRef]
- Hemphill, M.; Yuan, T.; Wang, G.; Yeh, J.; Tsai, C.; Chuang, A.; Liaw, P. Fatigue behavior of Al0.5CoCrCuFeNi high entropy alloys. Acta Mater. 2012, 60, 5723–5734. [Google Scholar] [CrossRef]
- Pickering, E.; Muñoz-Moreno, R.; Stone, H.; Jones, N. Microstructural development in equiatomic multicomponent alloys. Mater. Sci. Eng. A 2004, 375–377, 213–218. [Google Scholar]
- Otto, F.; Yang, Y.; Bei, H.; George, E. Relative effects of enthalpy and entropy on the phase stability of equiatomic high-entropy alloys. Acta Mater. 2013, 61, 2628–2638. [Google Scholar] [CrossRef]
- Pickering, E.; Muñoz-Moreno, R.; Stone, H.; Jones, N. Precipitation in the equiatomic high-entropy alloy CrMnFeCoNi. Scr. Mater. 2016, 113, 106–109. [Google Scholar] [CrossRef]
- Otto, F.; Dlouhý, A.; Somsen, C.; Bei, H.; Eggeler, G.; George, E.P. The influences of temperature and microstructure on the tensile properties of a CoCrFeMnNi high-entropy alloy. Acta Mater. 2013, 61, 5743–5755. [Google Scholar] [CrossRef]
- Dong, Y.; Yao, Z.; Huang, X.; Du, F.; Li, C.; Chen, A.; Wu, F.; Cheng, Y.; Zhang, Z. Microstructure and mechanical properties of AlCoxCrFeNi3-x eutectic high-entropy-alloy system. J. Alloys Compd. 2020, 823, 153886. [Google Scholar] [CrossRef]
- Dong, Y.; Jiang, L.; Jiang, H.; Lu, Y.; Wang, T.; Li, T. Effects of annealing treatment on microstructure and hardness of bulk AlCrFeNiMo0.2 eutectic high-entropy alloy. Mater. Des. 2015, 82, 91–97. [Google Scholar] [CrossRef]
- Cheng, H.; Xie, Y.C.; Tang, Q.H.; Cong, R.A.; Dai, P.Q. Microstructure and mechanical properties of FeCoCrNiMn high-entropy alloy produced by mechanical alloying and vacuum hot pressing sintering. Trans. Nonferrous Met. Soc. China 2018, 28, 1360–1367. [Google Scholar] [CrossRef]
- Zhang, Z.F.; Eckert, J. Unified Tensile Fracture Criterion. Phys. Rev. Lett. 2005, 94, 094301. [Google Scholar] [CrossRef] [PubMed]
- Zhang, Z.; Perozziello, G.; Boccazzi, P.; Sinskey, A.J.; Geschke, O.; Jensen, K.F. Microbioreactors for Bioprocess Development. JALA J. Assoc. Lab. Autom. 2007, 12, 143–151. [Google Scholar] [CrossRef]
- Dong, F.; Zhang, P.; Pang, J.; Ren, Y.; Yang, K.; Zhang, Z. Strength, damage and fracture behaviors of high-nitrogen austenitic stainless steel processed by high-pressure torsion. Scr. Mater. 2015, 96, 5–8. [Google Scholar] [CrossRef]
- Fang, Y.; Chen, N.; Du, G.; Zhang, M.; Zhao, X.; Cheng, H.; Wu, J. High-temperature oxidation resistance, mechanical and wear resistance properties of Ti(C,N)-based cermets with Al0.3CoCrFeNi high-entropy alloy as a metal binder. J. Alloys Compd. 2019, 815, 152486. [Google Scholar] [CrossRef]
- Joseph, J.; Haghdadi, N.; Shamlaye, K.; Hodgson, P.; Barnett, M.; Fabijanic, D. The sliding wear behaviour of CoCrFeMnNi and AlxCoCrFeNi high entropy alloys at elevated temperatures. Wear 2019, 428–429, 32–44. [Google Scholar] [CrossRef]
- Chen, M.; Lan, L.; Shi, X.; Yang, H.; Zhang, M.; Qiao, J. The tribological properties of Al0.6CoCrFeNi high-entropy alloy with the sigma phase precipitation at elevated temperature. J. Alloys Compd. 2019, 777, 180–189. [Google Scholar]
- Wu, J.-M.; Lin, S.-J.; Yeh, J.-W.; Chen, S.-K.; Huang, Y.-S.; Chen, H.-C. Adhesive wear behavior of AlxCoCrCuFeNi high-entropy alloys as a function of aluminum content. Wear 2006, 261, 513–519. [Google Scholar] [CrossRef]


Disclaimer/Publisher’s Note: The statements, opinions and data contained in all publications are solely those of the individual author(s) and contributor(s) and not of MDPI and/or the editor(s). MDPI and/or the editor(s) disclaim responsibility for any injury to people or property resulting from any ideas, methods, instructions or products referred to in the content. |
© 2025 by the authors. Licensee MDPI, Basel, Switzerland. This article is an open access article distributed under the terms and conditions of the Creative Commons Attribution (CC BY) license (https://creativecommons.org/licenses/by/4.0/).