Article

Fatigue Life Analysis of Cruciform Specimens Under Biaxial Loading Using the Paris Equation

Institute of Structural Mechanics, Bauhaus-Universität Weimar, Marienstrasse 15, 99423 Weimar, Germany
*
Author to whom correspondence should be addressed.
Metals 2025, 15(6), 579; https://doi.org/10.3390/met15060579
Submission received: 25 April 2025 / Revised: 19 May 2025 / Accepted: 21 May 2025 / Published: 23 May 2025
(This article belongs to the Special Issue Fracture and Fatigue of Advanced Metallic Materials)

Abstract

The presence of mixed-mode stresses, combining both opening and shearing components, complicates fatigue life estimation when applying the Paris law. To address this, the crack path, along with Mode-I (opening) and Mode-II (shear) components, was numerically analyzed using Fracture Analysis Code (Franc2D) based on the linear elastic fracture mechanics (LEFM) approach. Accordingly, fatigue life and stress intensity factors (SIFs) under various biaxial loading ratios (λ) were calculated using the Paris law and compared with available data in the literature. The results show that crack growth is primarily driven by the Mode-I component, which exhibits the largest magnitude. Thus, the Mode-I stress intensity factor (KI) was adopted for the numerical integration of the fatigue life equation. Furthermore, the influence of normal and transverse loads (σy and σx, respectively) on the crack path plane and SIF was examined for λ. The analysis revealed that lower λ values led to faster crack propagation, while higher λ values resulted in extended fatigue life due to an increased number of cycles to failure. The comparison demonstrated good agreement with reference data, confirming the reliability of the proposed modeling approach over a wide range of biaxial loading conditions.

Graphical Abstract

1. Introduction

Biaxial stresses have a significant influence on crack propagation paths in cruciform joints and sheet materials when loads are applied simultaneously in two perpendicular directions. Under such conditions, cracks experience mixed-mode loading, combining both opening (Mode-I) and shearing (Mode-II) components. Understanding and modeling this behavior is critical for the design and safety assessment of structural components made of metals and non-metals, particularly in engineering fields such as aerospace and automotive industries.
Despite advances in fracture mechanics, the application of Linear Elastic Fracture Mechanics (LEFM) to simulate fatigue crack growth under biaxial loading remains challenging. Most experimental studies on fatigue crack growth are typically conducted under uniaxial, constant-amplitude loading due to the complexity and cost associated with biaxial testing [1]. Moreover, calculating stress intensity factors (SIFs) for cracks under biaxial loading introduces additional analytical and numerical difficulties [2]. Nevertheless, understanding fatigue crack propagation under mixed-mode loading is essential for the reliable assessment of structural integrity in critical components [3].
Various cruciform specimen designs have been developed to perform both static and cyclic biaxial loading tests [4,5,6,7]. It is well established that the direction of fatigue crack growth under mixed-mode loading can be effectively predicted using the Erdogan–Sih criterion [8,9], which assumes that crack propagation occurs under a pure Mode-I condition [3], thereby enabling the application of LEFM. Numerical fracture analysis tools, such as Franc2D [10], have been employed to calculate SIFs in welded joints subjected to uniaxial loading [11]. Accurate SIF solutions using Franc2D for uniaxial tensile loads have been reported in previous studies [11,12], where numerical integration of Paris’ law and backward analysis techniques were applied. But for biaxial loading, the use of SIFs is still unclear.
In conventional cruciform specimens, biaxial stresses are introduced by applying loads along both x- and y-directions [13,14]. The ratio of these stresses, referred to as the biaxial stress ratio, is a critical parameter in analyzing fracture behavior. Variations in this ratio influence the fracture mode and alter the stress distribution near the crack tip. The biaxial stress ratio promotes mixed-mode crack growth and affects the crack path, consequently impacting the overall structural integrity and fatigue life [15].
To the best of the author’s knowledge, it is crucial to investigate how the biaxial stress ratio affects the development of mixed-mode conditions at the crack tip and to identify the specific load ratios that result in crack propagation aligned with the opening mode. Achieving a crack path governed by pure Mode-I loading has important implications for crack growth rates, SIFs, and fatigue life [16]. However, the relationship between these parameters is complex and influenced by multiple factors, making it challenging to predict.
The present work examines the validity of considering only Mode-I loading in fatigue life predictions using Paris’ law and the stress intensity factor (SIF) determined from the LEFM-based simulator, Franc2D. This approach is supported by previous observations indicating that, after an initial stage of crack growth, Mode-II SIFs tend to diminish, and the crack continues to propagate under predominant Mode-I conditions [17,18]. Accordingly, under symmetric stress distributions, Mode-I SIFs (KI) were employed in the calculations of fatigue life and fatigue strength, as Mode-II components (KII) approached zero. The effect of increasing the biaxial ratio (∆λ) on crack behavior has been investigated, highlighting the minimal influence of Mode-II (KII). Additionally, the critical λ value at which the crack begins to deviate from its original path has been identified. The resulting impact on stress intensity factors (SIFs) and fatigue life is analyzed in detail. Furthermore, compared to previous work [17], this study provides deeper experimental validation and broader comparisons.
This study aims to characterize the fracture behavior of cruciform-type sheet specimens subjected to various biaxial loading ratios using Franc2D. Based on these analyses, the influence of the biaxial stress ratio on the crack path evolution will be systematically investigated.

2. Materials and Methods

2.1. Specimen Materials and Geometry

Cruciform specimens are widely used and considered standard in biaxial testing and simulation. Moreover, this configuration is commonly associated with aluminum alloys, given their relevance in applications that require both biaxial loading conditions and lightweight metallic materials.
A flat cruciform joint with an un-notched, smooth central area was simulated. The material is a 2.3 mm thick flat finite plate of aluminum alloy, see Refs. [19,20]. The Young modulus, yield strength, and ultimate tensile strength are equal to 69 GPa, 165 MPa, and 205 MPa, respectively.
One central crack is assumed to be propagated due to the two axes of loads (see Figure 1a). The crack length in a specimen is 38 mm (i.e, ai = 19 mm in one half in a symmetrical specimen).
Franc2D, version 4, 2015 [10] is a finite element-based simulator designed for curvilinear crack propagation in planar structures. The preprocessor code, CASCA, serves as a geometry and mesh generator, and it produces the input file required for the postprocessor code, Franc2D. Franc2D [10] was used in SIF calculations in cases of uniaxial loading [11,12] where an opening SIF (KI) is used to calculate fatigue life, as it is based on a linear fracture mechanics approach. However, its application in biaxial fracturing has not yet been explored in previous works.
Figure 1b illustrates an example of the mesh pattern and boundary conditions used in the current FEM-Franc2D analyses. The FE mesh consists of eight-noded plane strain elements, with the boundary conditions used in this work applied as shown.
The symmetrical cruciform specimen was modeled under a wide range of cyclic tensile loading conditions along the x- and y-axes, expressed in terms of the biaxial stress ratio (λ) with the fixity in the y and x directions, respectively, on the opposite sides (Figure 1b). In-phase loading has been applied in this model, where the loads on both sides are applied simultaneously. Hence, there is no phase difference between the two axial loads. The deformation in this case is more predictable and can be accurately simulated using the current models, as it is less complex. In this condition, the opening mode stress intensity factor (SIF) is the dominant factor influencing crack growth [9,21].
Given the complex nature of the specimen and the applied loads, several iterations were conducted to determine and define an appropriate mesh size and density.

2.2. Crack Simulation and Modeling

A crack was inserted into the model, and the surrounding area was remeshed. A crack tip rosette was defined on both sides with a specified number of elements, as shown in Figure 2. Franc2D provides such facilities; however, precise selection is necessary to prevent potential errors. The crack path simulation, choice of increment size (∆a), and number of propagation steps are provided. Several iterations and precautions were necessary to prevent the software from shutting down unexpectedly.
Crack tip remeshing was performed during the propagation of the crack, which is a characteristic feature of this fracture analysis code. This approach enables the automatic determination of the crack path, distinguishing it from other commercial software and codes. However, expertise and effort are required to carefully select the mesh, crack increment (∆a), and the number of steps. The latter parameter must be chosen carefully to prevent program errors and potential interruptions during the analysis.
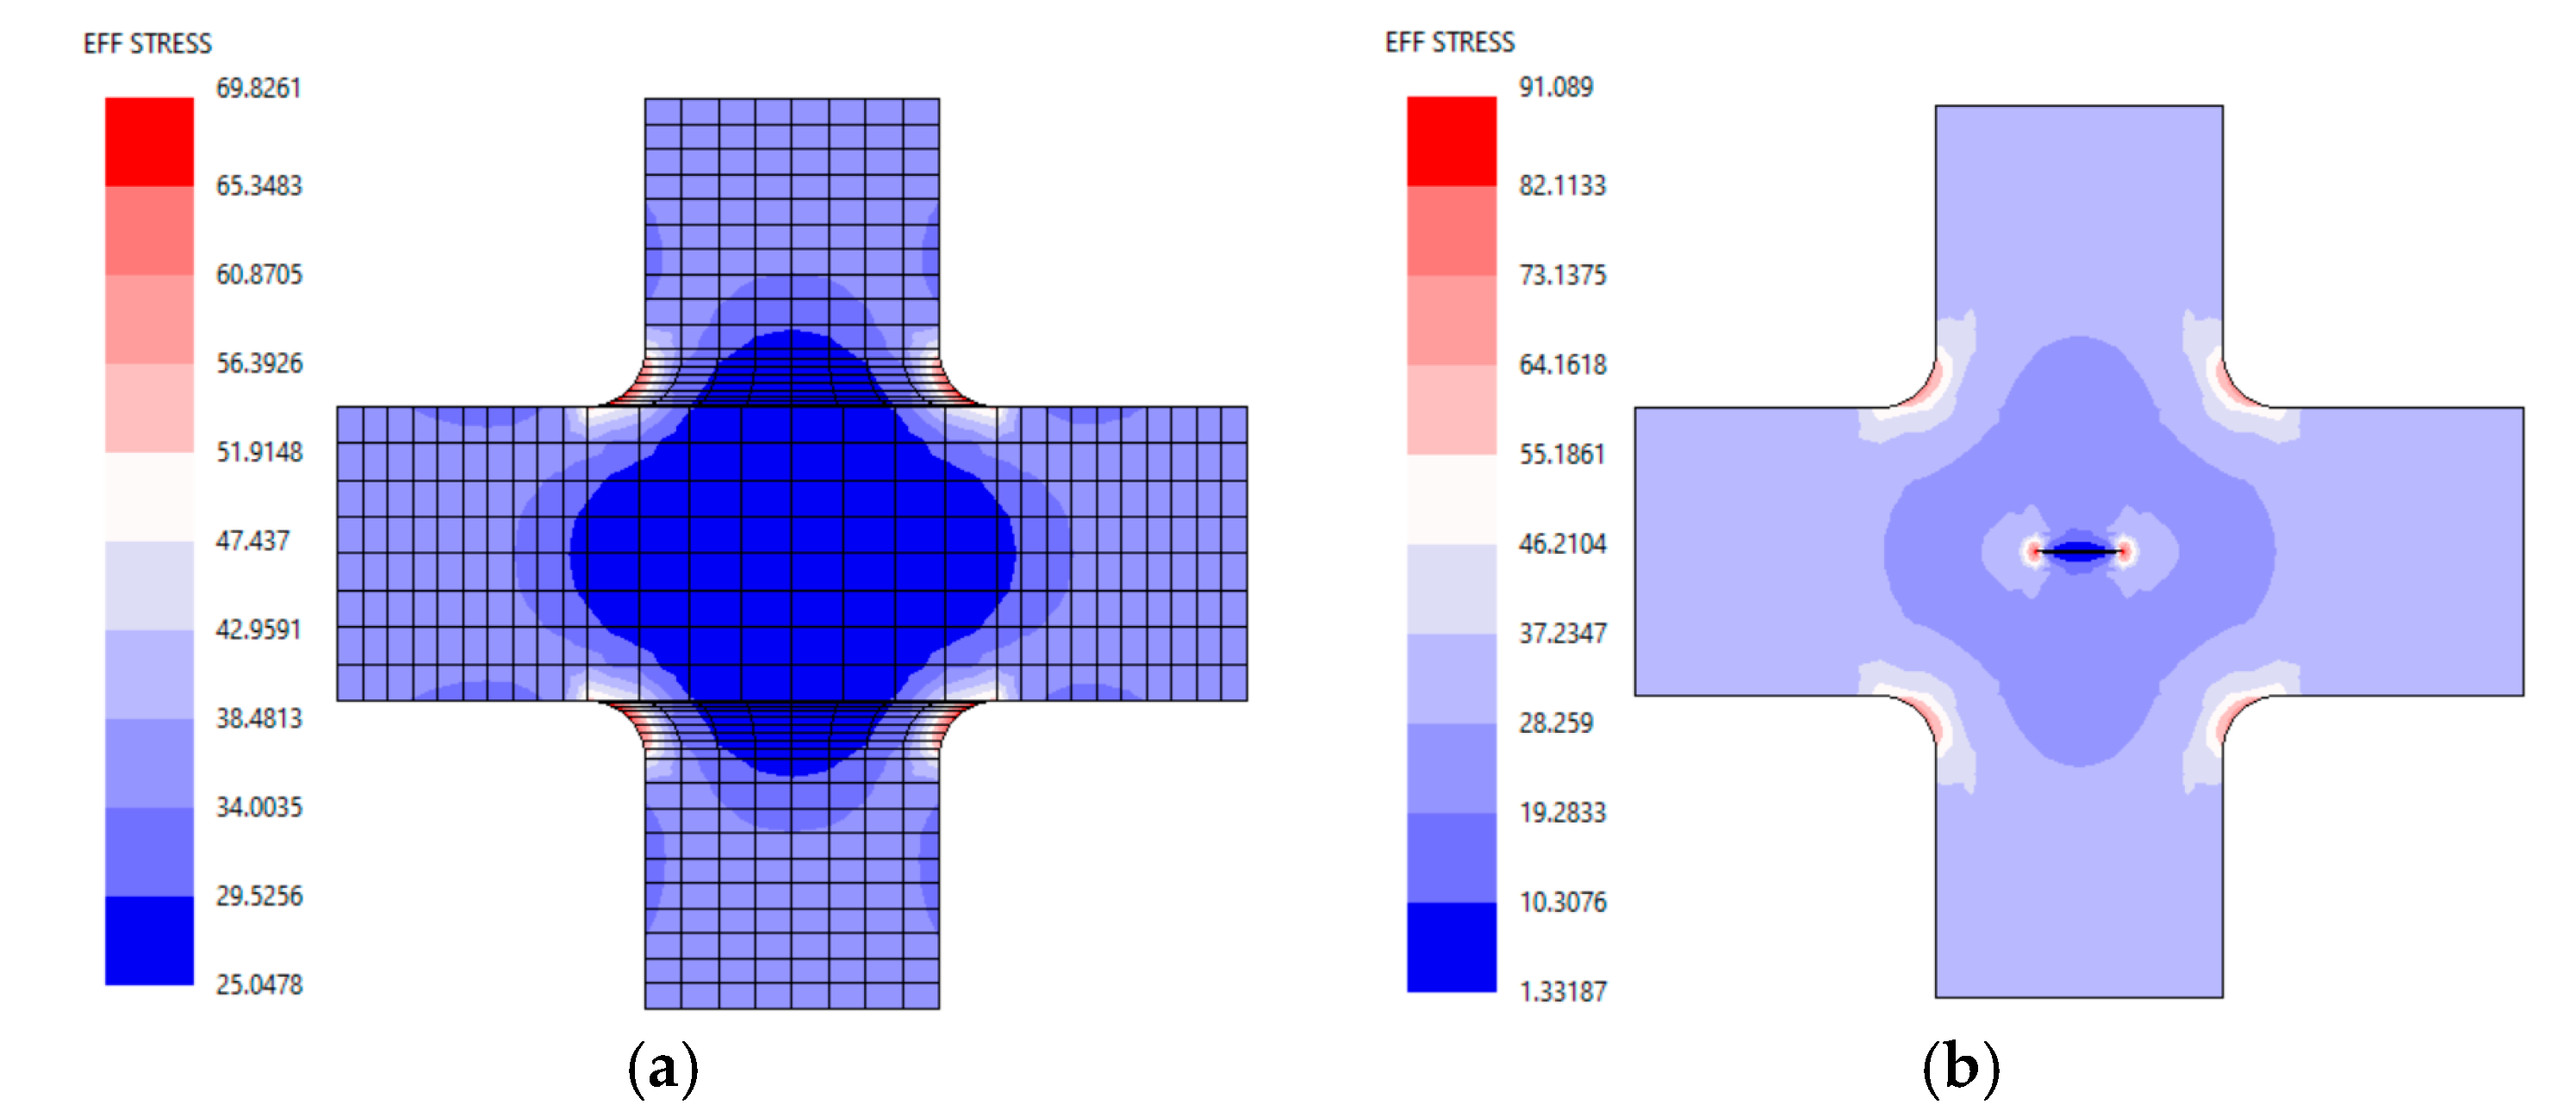
The actual stress distribution around the arms and radius explained the effect of joint geometry on the crack growth. Moreover, the growth of the single crack under mixed-mode loading is simulated. Under biaxial loading, the stresses around the crack tip become asymmetric and heterogeneous. This means that the crack propagates uniaxially, in a direction parallel to the crack plane, with Mode-I being the dominant fracture mode [22,23]. Figure 3 illustrates the symmetrical stress distributions and the effect of the notch radius in un-cracked and cracked specimens (see Figure 3). As the biaxial stress ratio (λ) changes, the stress distribution around the crack tip also evolves. This variation necessitates consideration of the influence of λ on both Mode-I and Mode-II fracture behaviors. Notably, a balance between these two modes occurs at a stress ratio of 1. Furthermore, the principal stress highlights the regions of potential cracking and areas of elevated stress concentration. Since this study focuses on crack propagation paths, the effective and maximum shear stress distributions provide critical insights into the crack opening trajectory (see Figure 3). The effective stress, taken directly from the Franc software, represents the combined x and y directional stresses near the crack tip, providing a realistic view of the stress distribution under varying crack orientations and biaxial loading. Therefore, effective stress in Franc2D is usually derived from von Mises stress or maximum principal stress.

3. Numerical Calculations

3.1. Biaxial Ratios and Mixed-Mode Stresses

The biaxial ratio plays a critical role in influencing the mixed-mode behavior at the crack tip. Therefore, the impact of the biaxial ratio on Mode-I and Mode-II fracture mechanics has been investigated using the current FE software. Table 1 shows the parameters that have been used.
The results will also investigate the variation in tensile and shear SIFs for different biaxial ratios as the crack length increases. There exists a specific stress ratio that transitions the state of the crack tip into a mixed-mode condition, effectively converting the uniaxial opening mode into a mixed-mode scenario.

3.2. Paris’ Fatigue Life Calculation and LEFM Method

This study employs a linear elastic fracture mechanics (LEFM) framework to evaluate fatigue crack growth in cruciform specimens under biaxial loading, hence determining fracture toughness [24]. Franc2D simulations are used to introduce and track an initial crack, assuming it remains open throughout each loading cycle according to LEFM [25]. This condition supports the dominance of Mode-I (opening mode) behavior. In addition, a quasi-static loading condition was assumed for all simulations.
Unlike uniaxial loading, the biaxial setup involves two perpendicular stress components. In this work, as σx increases and σy remains constant, the crack tends to propagate normally in the direction of higher stress. Therefore, two different modes are developed: opening and shearing mode. In this case, verification for using only opening Mode-I to calculate fatigue life under a biaxial ratio needs further support. In this work, the Mode-I stress intensity factor (SIF) is calculated and applied in Paris’ law to estimate fatigue life. The study compares these results with the literature and benchmark cases to validate the approach using Mode-I data alone.
The coefficients of Paris’ law, C and m, are considered materials constants. These values are determined for the aluminum alloy used in this work, equal to 1.35e−11 and 3, respectively [26]. Traditionally, the uniaxial crack growth direction is predicted using the Erdogan–Sih criterion, as it accounts for the symmetrical crack propagation and stress distribution around the crack tip. In the current biaxial model, which is based on LEFM, an in-phase biaxial stress condition is applied, resulting in a uniform, stable crack path. Under these conditions, the crack growth rate and fatigue life can be estimated using the standard Paris’ law (Equation (1)), considering the SIF (KI-opening mode) as the primary driving force [11].
The number of cycles (N) required for failure is determined by numerically integrating the crack growth relation, starting from the initial crack length (ai) and continuing until the final crack length at breakthrough (af). This calculation is based on the stress intensity factor KI, which is computed using the Franc2D software, as detailed in [11,27]:
d a d N = C Δ K I m
d N = d a C ( Δ K I ) m 0 N d N = a i a f d a C ( Δ K I ) m
The SIF-KI range inside is [11,27]:
Δ K I = Y Δ σ π a
where Δσ is the applied stress range, a is the crack length, and Y is the correction factor as a function of f(a/t). Consequently;
0 N d N = 1 C a i a f d a Y Δ σ ( π a ) 1 2 m
Thus, the number of cycles for one increment is determined as follows:
N = 1 C Y m ( Δ σ ) m π m 2 a i + 1 ( 1 m 2 ) a i ( 1 m 2 ) 1 m 2
The crack length vector and calculated SIF are transferred to Excel and integrated numerically using Equation (6) [11]. Then, the total life N can be calculated for each increment as follows:
N = j = 1 n N j = j = 1 n Δ a C Δ K I j m
where j is the step number. Hence, a-N curves have been presented for each biaxial ratio. These curves show the relationship between crack length and the number of cycles up to final failure at af.

4. Results and Discussion

4.1. Effect of Biaxial Loading on Stress Distributions

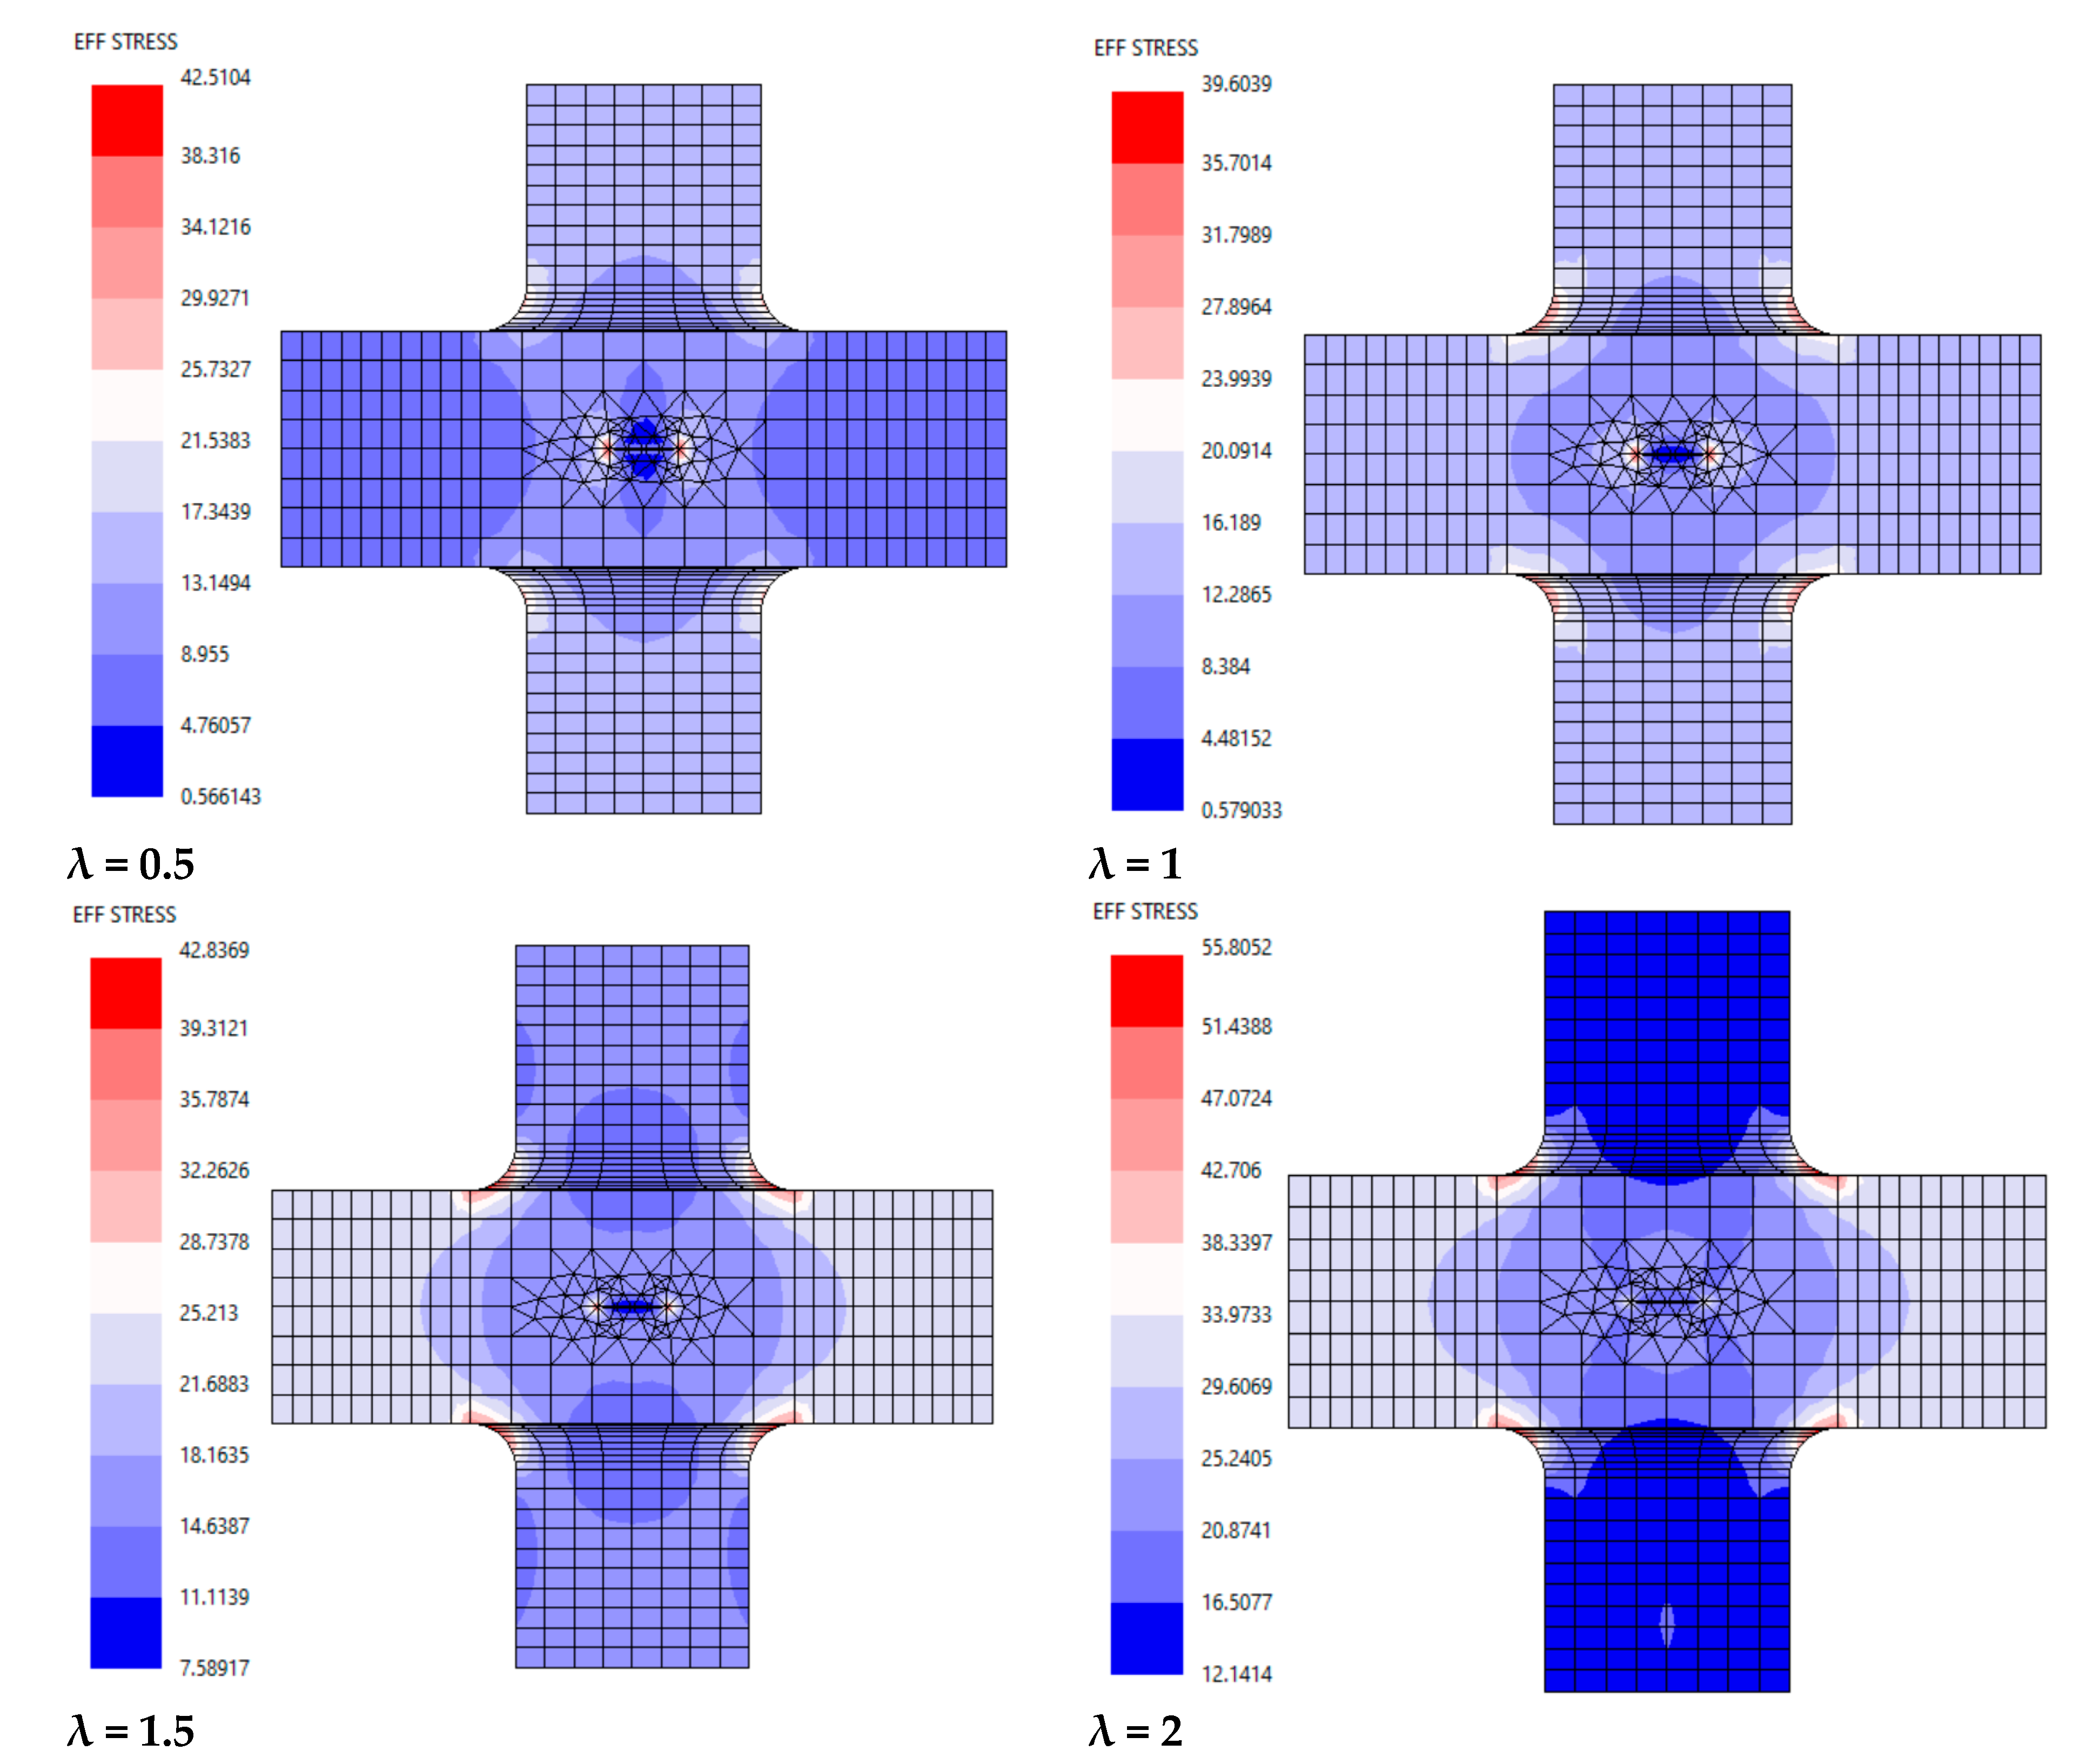
The biaxial stress ratio (λ) plays a crucial role in transforming the distributed stresses around the crack tip into a mixed-mode condition, resulting in the presence of both Mode-I and Mode-II SIFs. Under symmetrical stress conditions around the crack tip, Mode I typically dominates, making linear elastic fracture mechanics (LEFM) applicable even in mixed-mode cases [28]. As a result, the Mode I stress intensity factor, KI, plays a significant role. To ensure consistency and enable reliable comparison, the same crack growth increment (∆a = 5 mm) and propagation steps were applied throughout the analysis. For each value of λ, the stresses at the crack tip were calculated. It was observed that increasing the biaxiality ratio (λ), i.e., increasing the transverse load σx, significantly influences the crack trajectory, the stress distribution near the crack tip, and the overall stress contours in the specimen, as illustrated in Figure 4. The figure specifically highlights how varying the stress ratio affects the initial crack tip stress field and stress concentration. These factors are expected to play a more prominent role as the crack propagates, indicating that the initial loading conditions have a lasting impact on the subsequent crack growth behavior.

4.2. Effect of Biaxial Loading on Crack Path and Propagation

The crack tip position was recorded at each propagation step. In this model, two crack tips exist, one on the left and one on the right side of the crack (with a total crack length of 2a = 38 mm). The crack coordinates on both sides are nearly identical, with only minor differences caused by slight variations in the crack kink angle between the left and right tips. To present a consistent and positive crack path, the crack tip located on the right side was selected for analysis and illustration. That is, the positive coordinate crack tip on the right side will be used because the tip coordinates will be presented in an x–y plot.
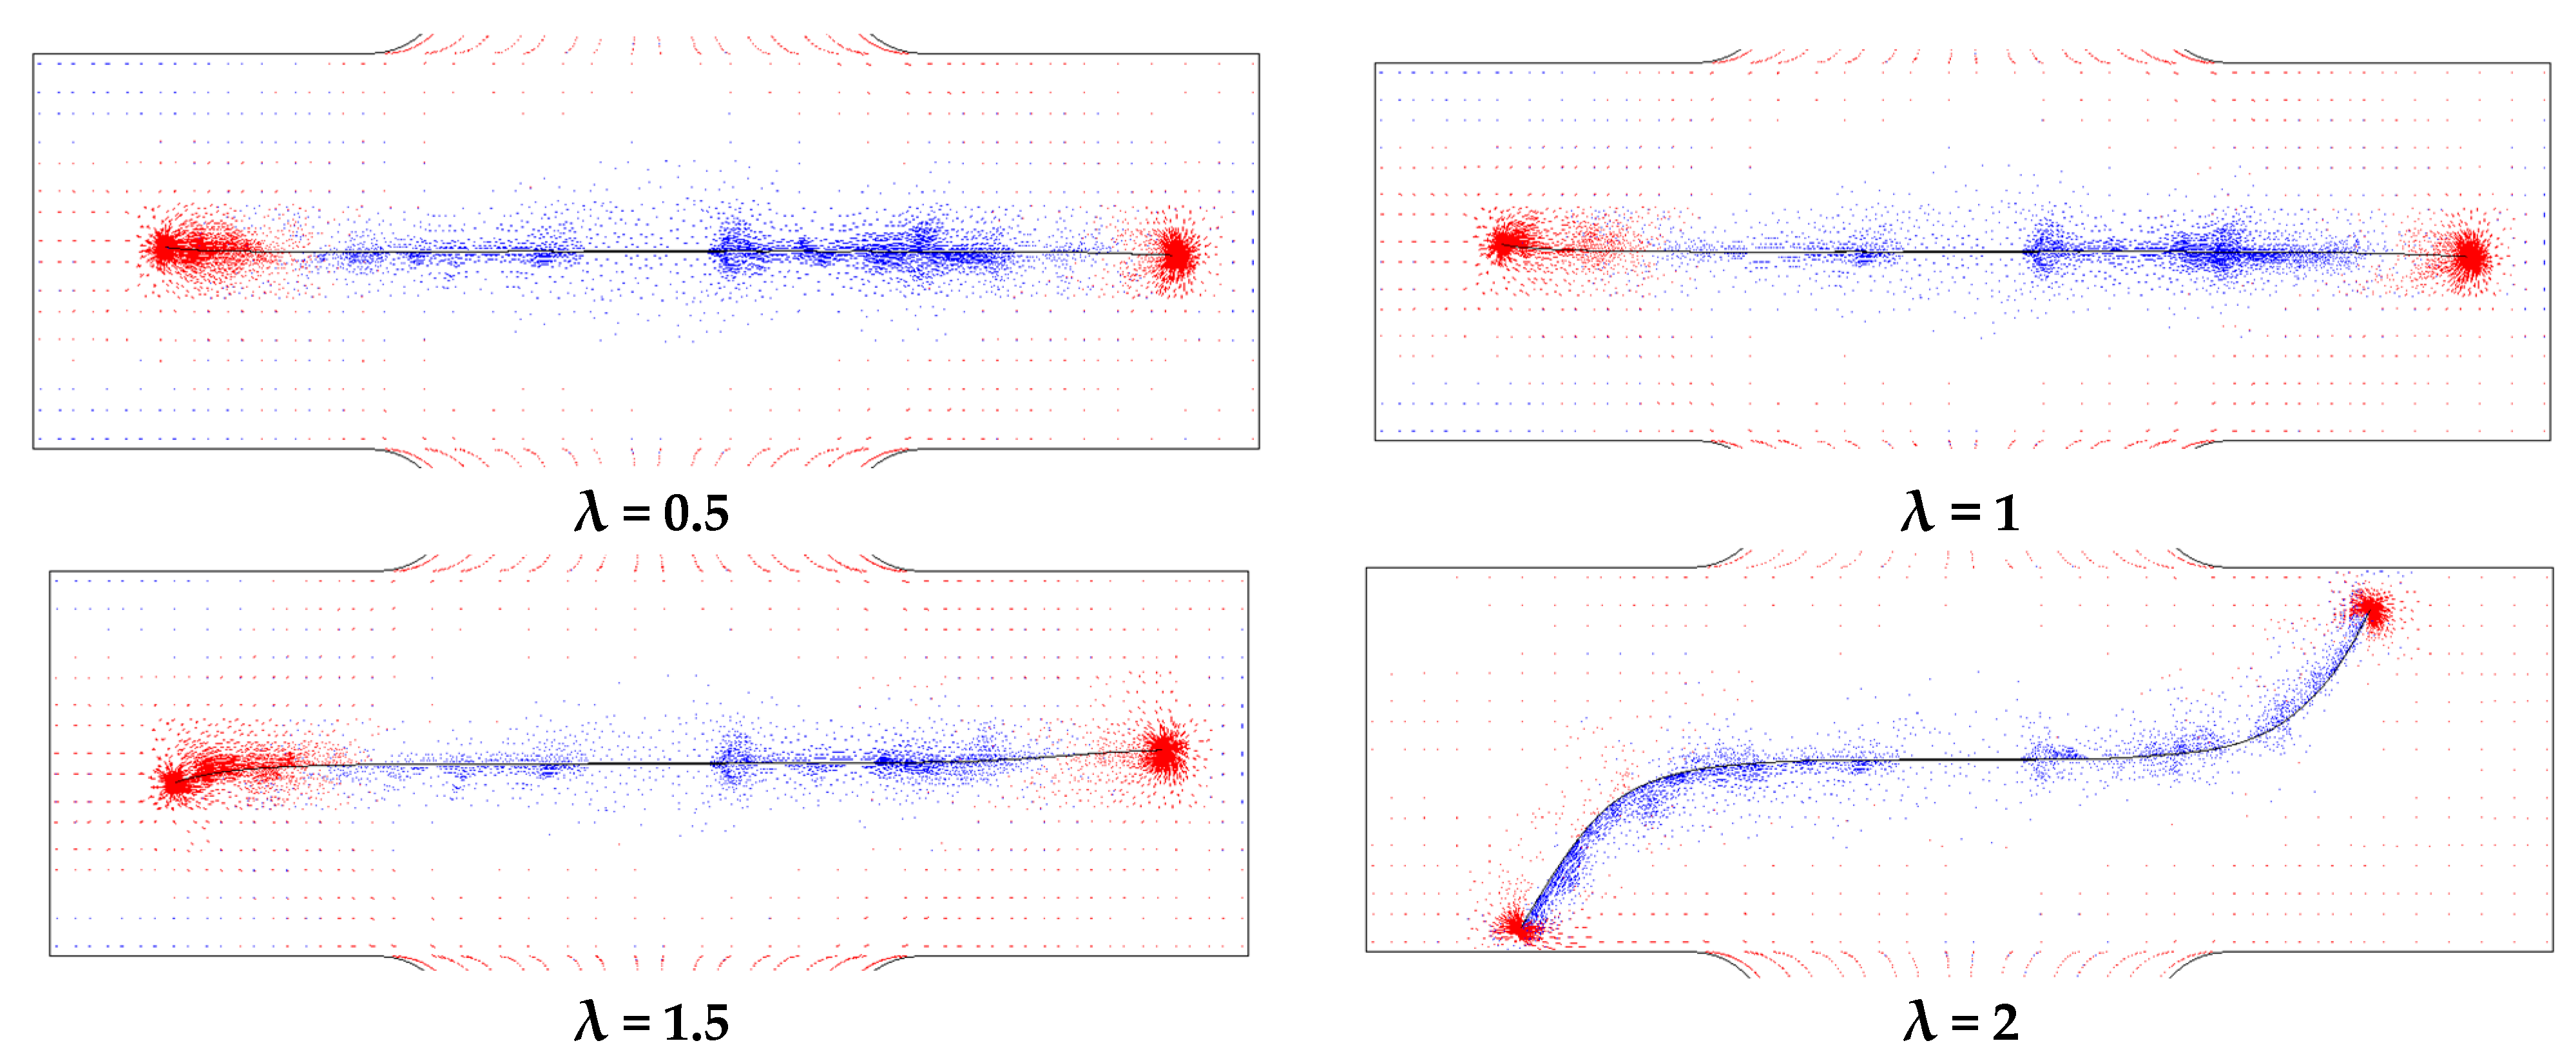
An increasing biaxial ratio is used, λ = σxy (see Figure 1b). Consequently, the crack plane changes accordingly to be perpendicular to the transverse load σx. Figure 5 shows the crack propagation path and highlights the influence of the biaxial ratio (λ = σxy) on the crack trajectory. It demonstrates how variations in the load ratio cause a transition from a straight to a curved crack path. The crack path plane changes direction to become perpendicular to the transverse stress, σx. By increasing λ and, consequently, σx, the crack changes direction to be normal to σx.

4.3. Effect of Biaxial Loading on Stress Intensity Factors Mode I-II

The effects of sliding mode (KII) and tensile opening mode (KI) during crack propagation can be observed for each λ using FE-Franc2D code.
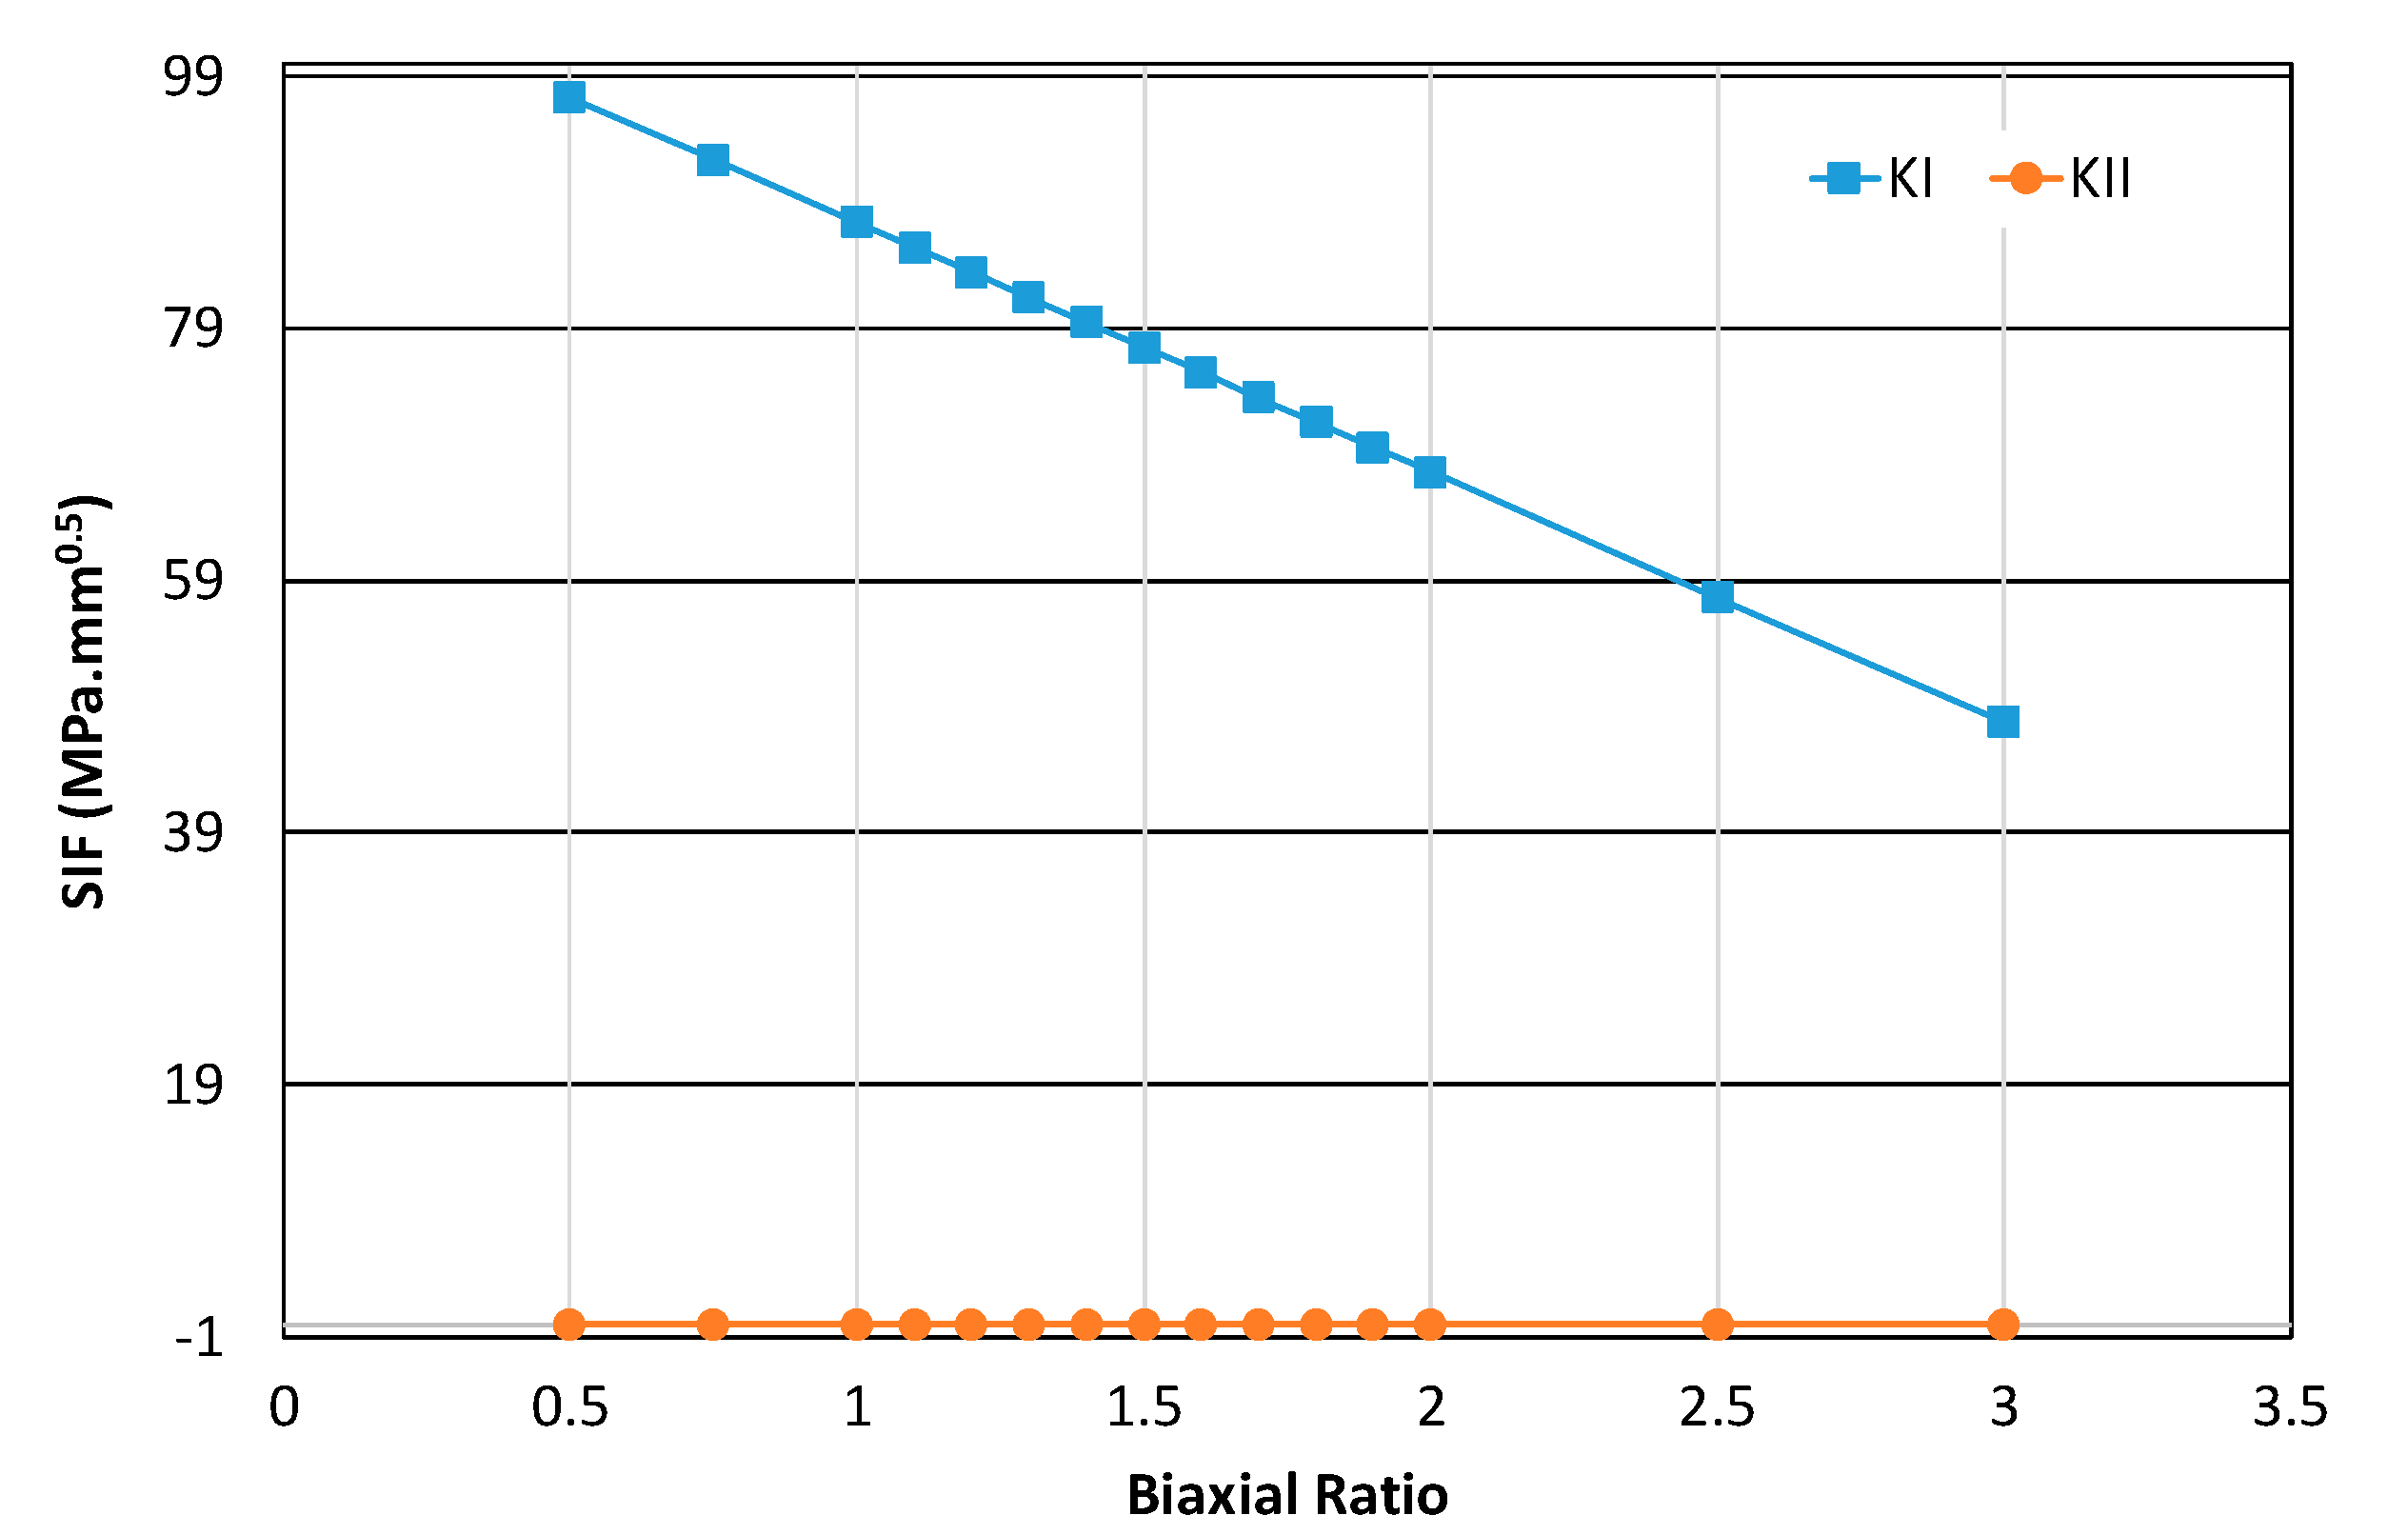
Figure 6 shows KI, and KII at the initial crack length (no growth) as λ varies. It can be observed that Mode I decreases at the crack tip as the stress ratio increases. In contrast, KII shows only a minimal increase and remains nearly zero (see Figure 6). These variations are not clearly distinguishable due to the relatively small magnitude of KII compared to KI. Hence, Mode-II remains negligible. It can be concluded that, even at the initial stage of crack initiation, the opening Mode-I is higher than the shearing Mode-II, even when the transverse loading (σx), which is parallel to the initial crack plane (refer to Figure 1b), increases with λ.
When the crack is allowed to propagate and the biaxial ratio increases, the crack deviates from its initial straight path due to changes in the crack growth direction. As the crack begins to grow, pure Mode-I cracking becomes predominant. This is because the crack propagates in response to the higher applied stress perpendicular to the crack plane, following the maximum tangential stress criterion.
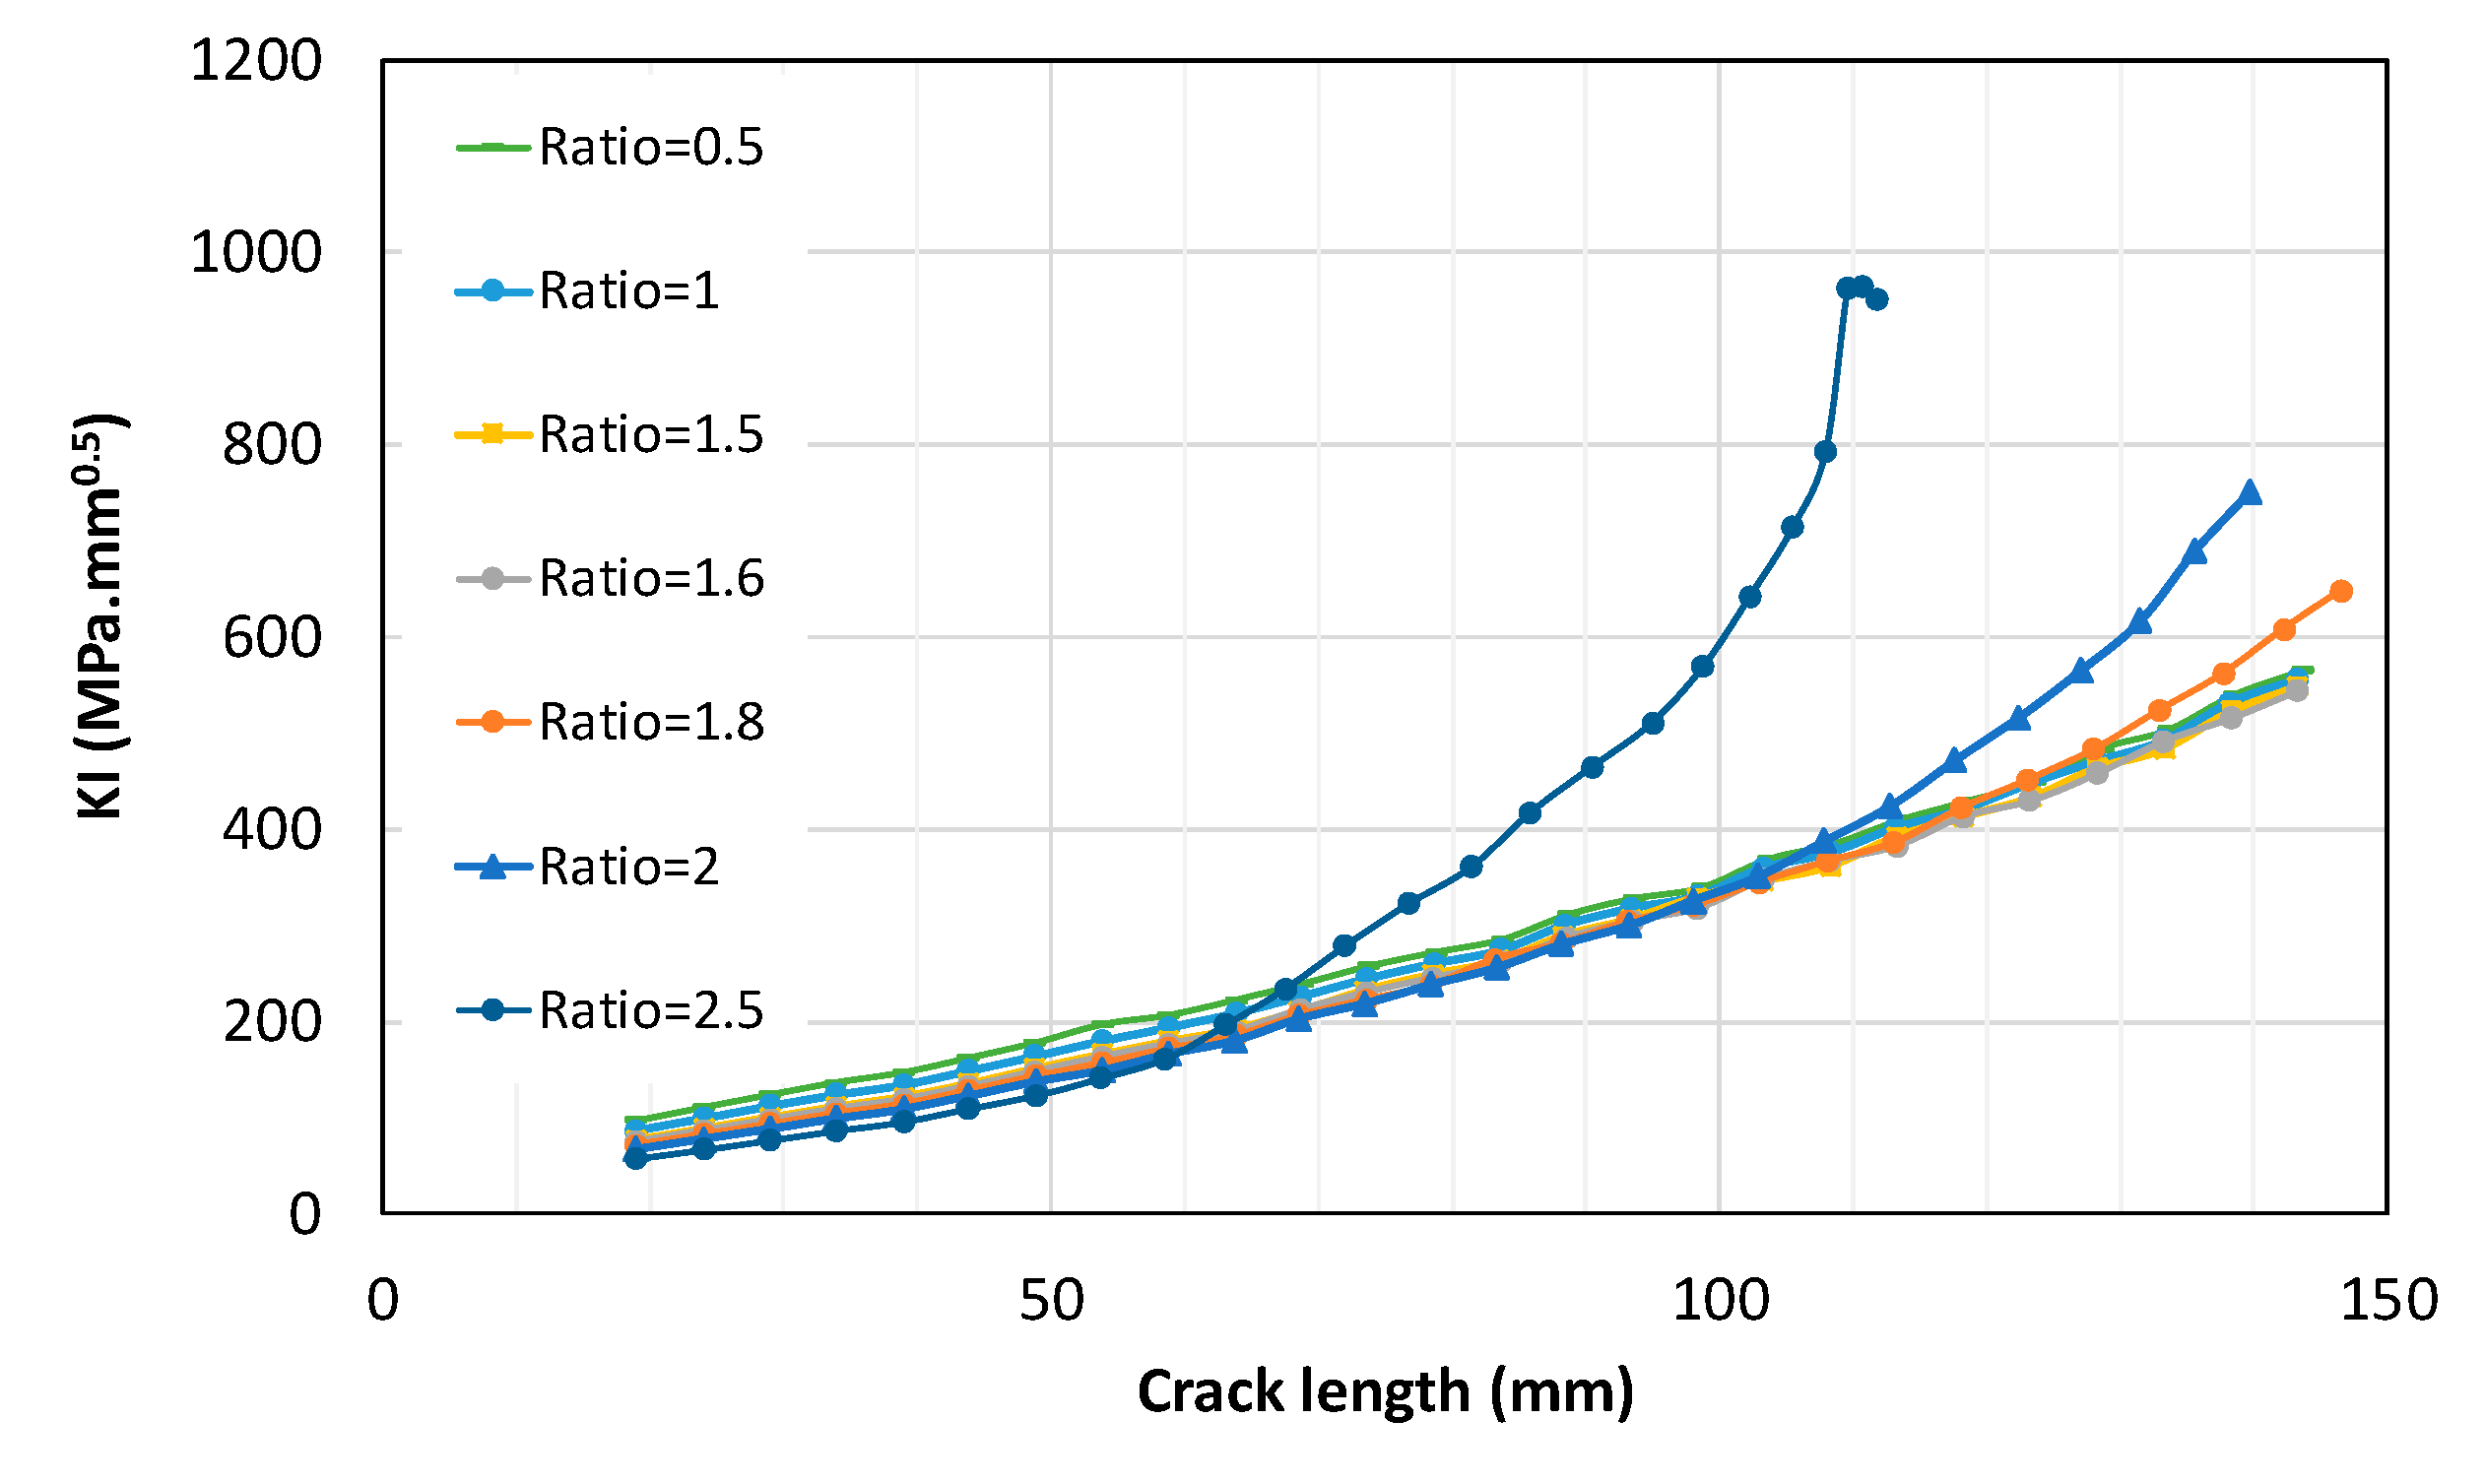
The stress intensity factor (SIF) was calculated considering the effect of the biaxial ratio (λ), accounting for both shear and tensile stresses. The Mode-I SIF (KI) at each crack tip was used to characterize the driving force for crack growth. The results indicate that for λ values up to 1.5, the crack propagates along a straight path parallel to its initial plane. However, when λ exceeds 1.5, the crack begins to curve, and the stress intensity factor (K1) increases significantly with crack extension, as shown in Figure 5. While K1 initially decreases with the increasing biaxial ratio (λ), as seen in Figure 6, a noticeable change in its behavior occurs once λ exceeds 1.5, particularly for longer cracks (Figure 7). Up to λ = 1.5, the crack generally propagates within its original plane. Beyond this point, the nonlinear relationship between the biaxial ratio and the stress at the crack tip, influenced by both crack length and propagation path (Figure 8), leads to a change in behavior. Initially, the crack tip stresses decrease as λ increases, reaching a minimum near λ = 1.5. As λ continues to increase, the crack begins to deviate from its original direction at shorter lengths, curving toward the direction perpendicular to the x-axis loading. This change in crack path results in an increase in stress intensity at the crack tip, causing a sudden rise in K1, particularly evident at λ = 2.5 (see Figure 7).
The stress intensity factor reflects the material’s resistance to fatigue crack growth. As shown in Figure 7, increasing the biaxial ratio leads to a reduction in the stress intensity factor at the crack tip, indicating improved overall fatigue strength. The above discussion is also connected to crack path behavior. The crack path tends to remain straight and aligned parallel to σx, without significant deviation at lower biaxial ratios (i.e., σy > σx), as shown in Figure 9. By increasing λ (i.e., σx ≥ σy), the crack path plane will change; hence, the SIF and fatigue life will change accordingly.
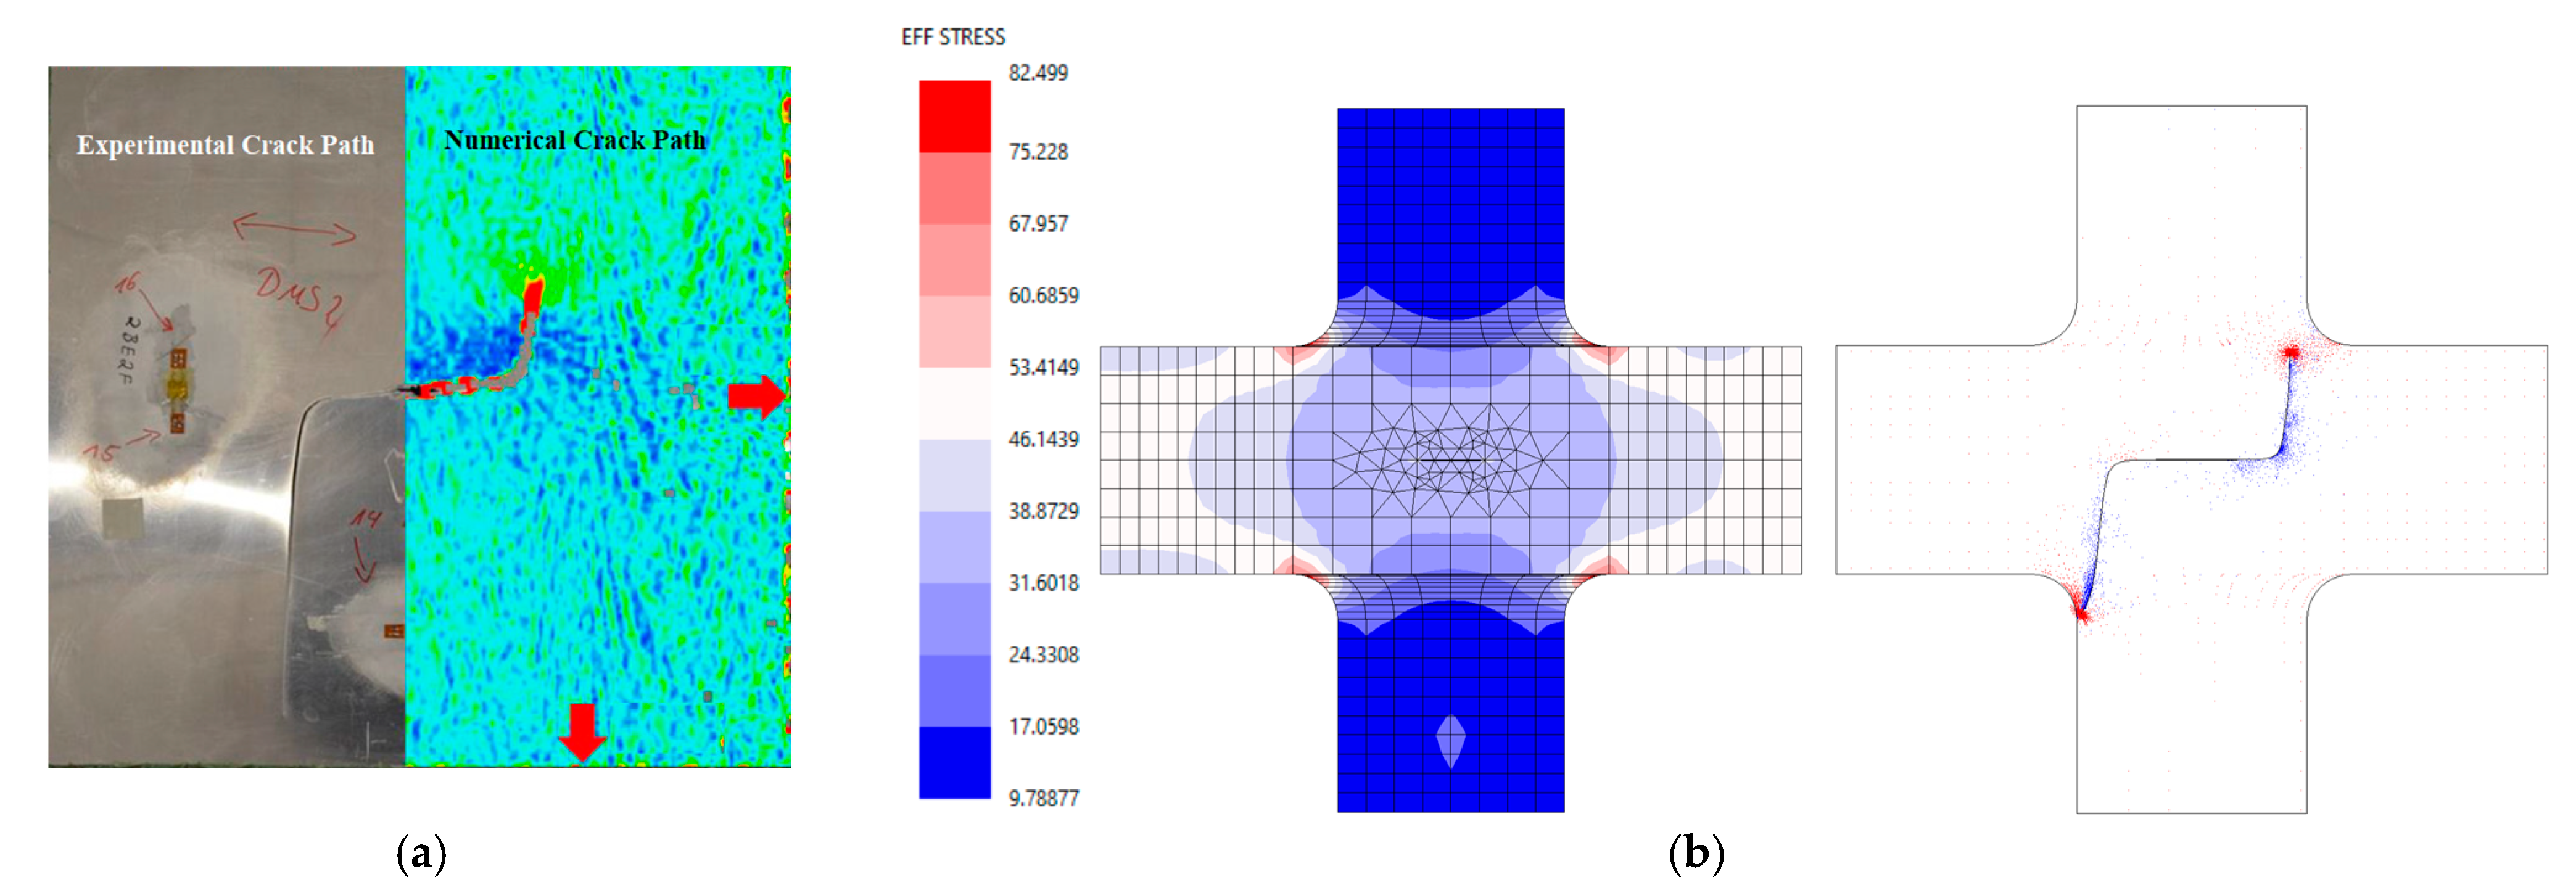
Breitbarth [29] conducted both FE-ANSYS simulations and experimental tests on aluminum alloy AA5028 to predict crack paths under biaxial loading. To validate the current findings, the proposed models and approach were compared with the experimental and numerical results from Ref. [29], where a biaxial ratio of λ = 3 was investigated (Figure 10a). Therefore, the current models were subjected to the same loading conditions and material properties to achieve a qualitative comparison of the crack path and validate the boundary conditions and input parameters of the present model. An accurate crack path leads to an accurate SIF solution; therefore, it is important to verify the crack path.
The present numerical model demonstrates strong agreement with the finite element (FE) simulations performed using ANSYS, as well as with the experimental data reported in the literature (Figure 10b). Furthermore, the crack path predicted by the current models aligns well with the reference data, confirming that the models have been successfully benchmarked.
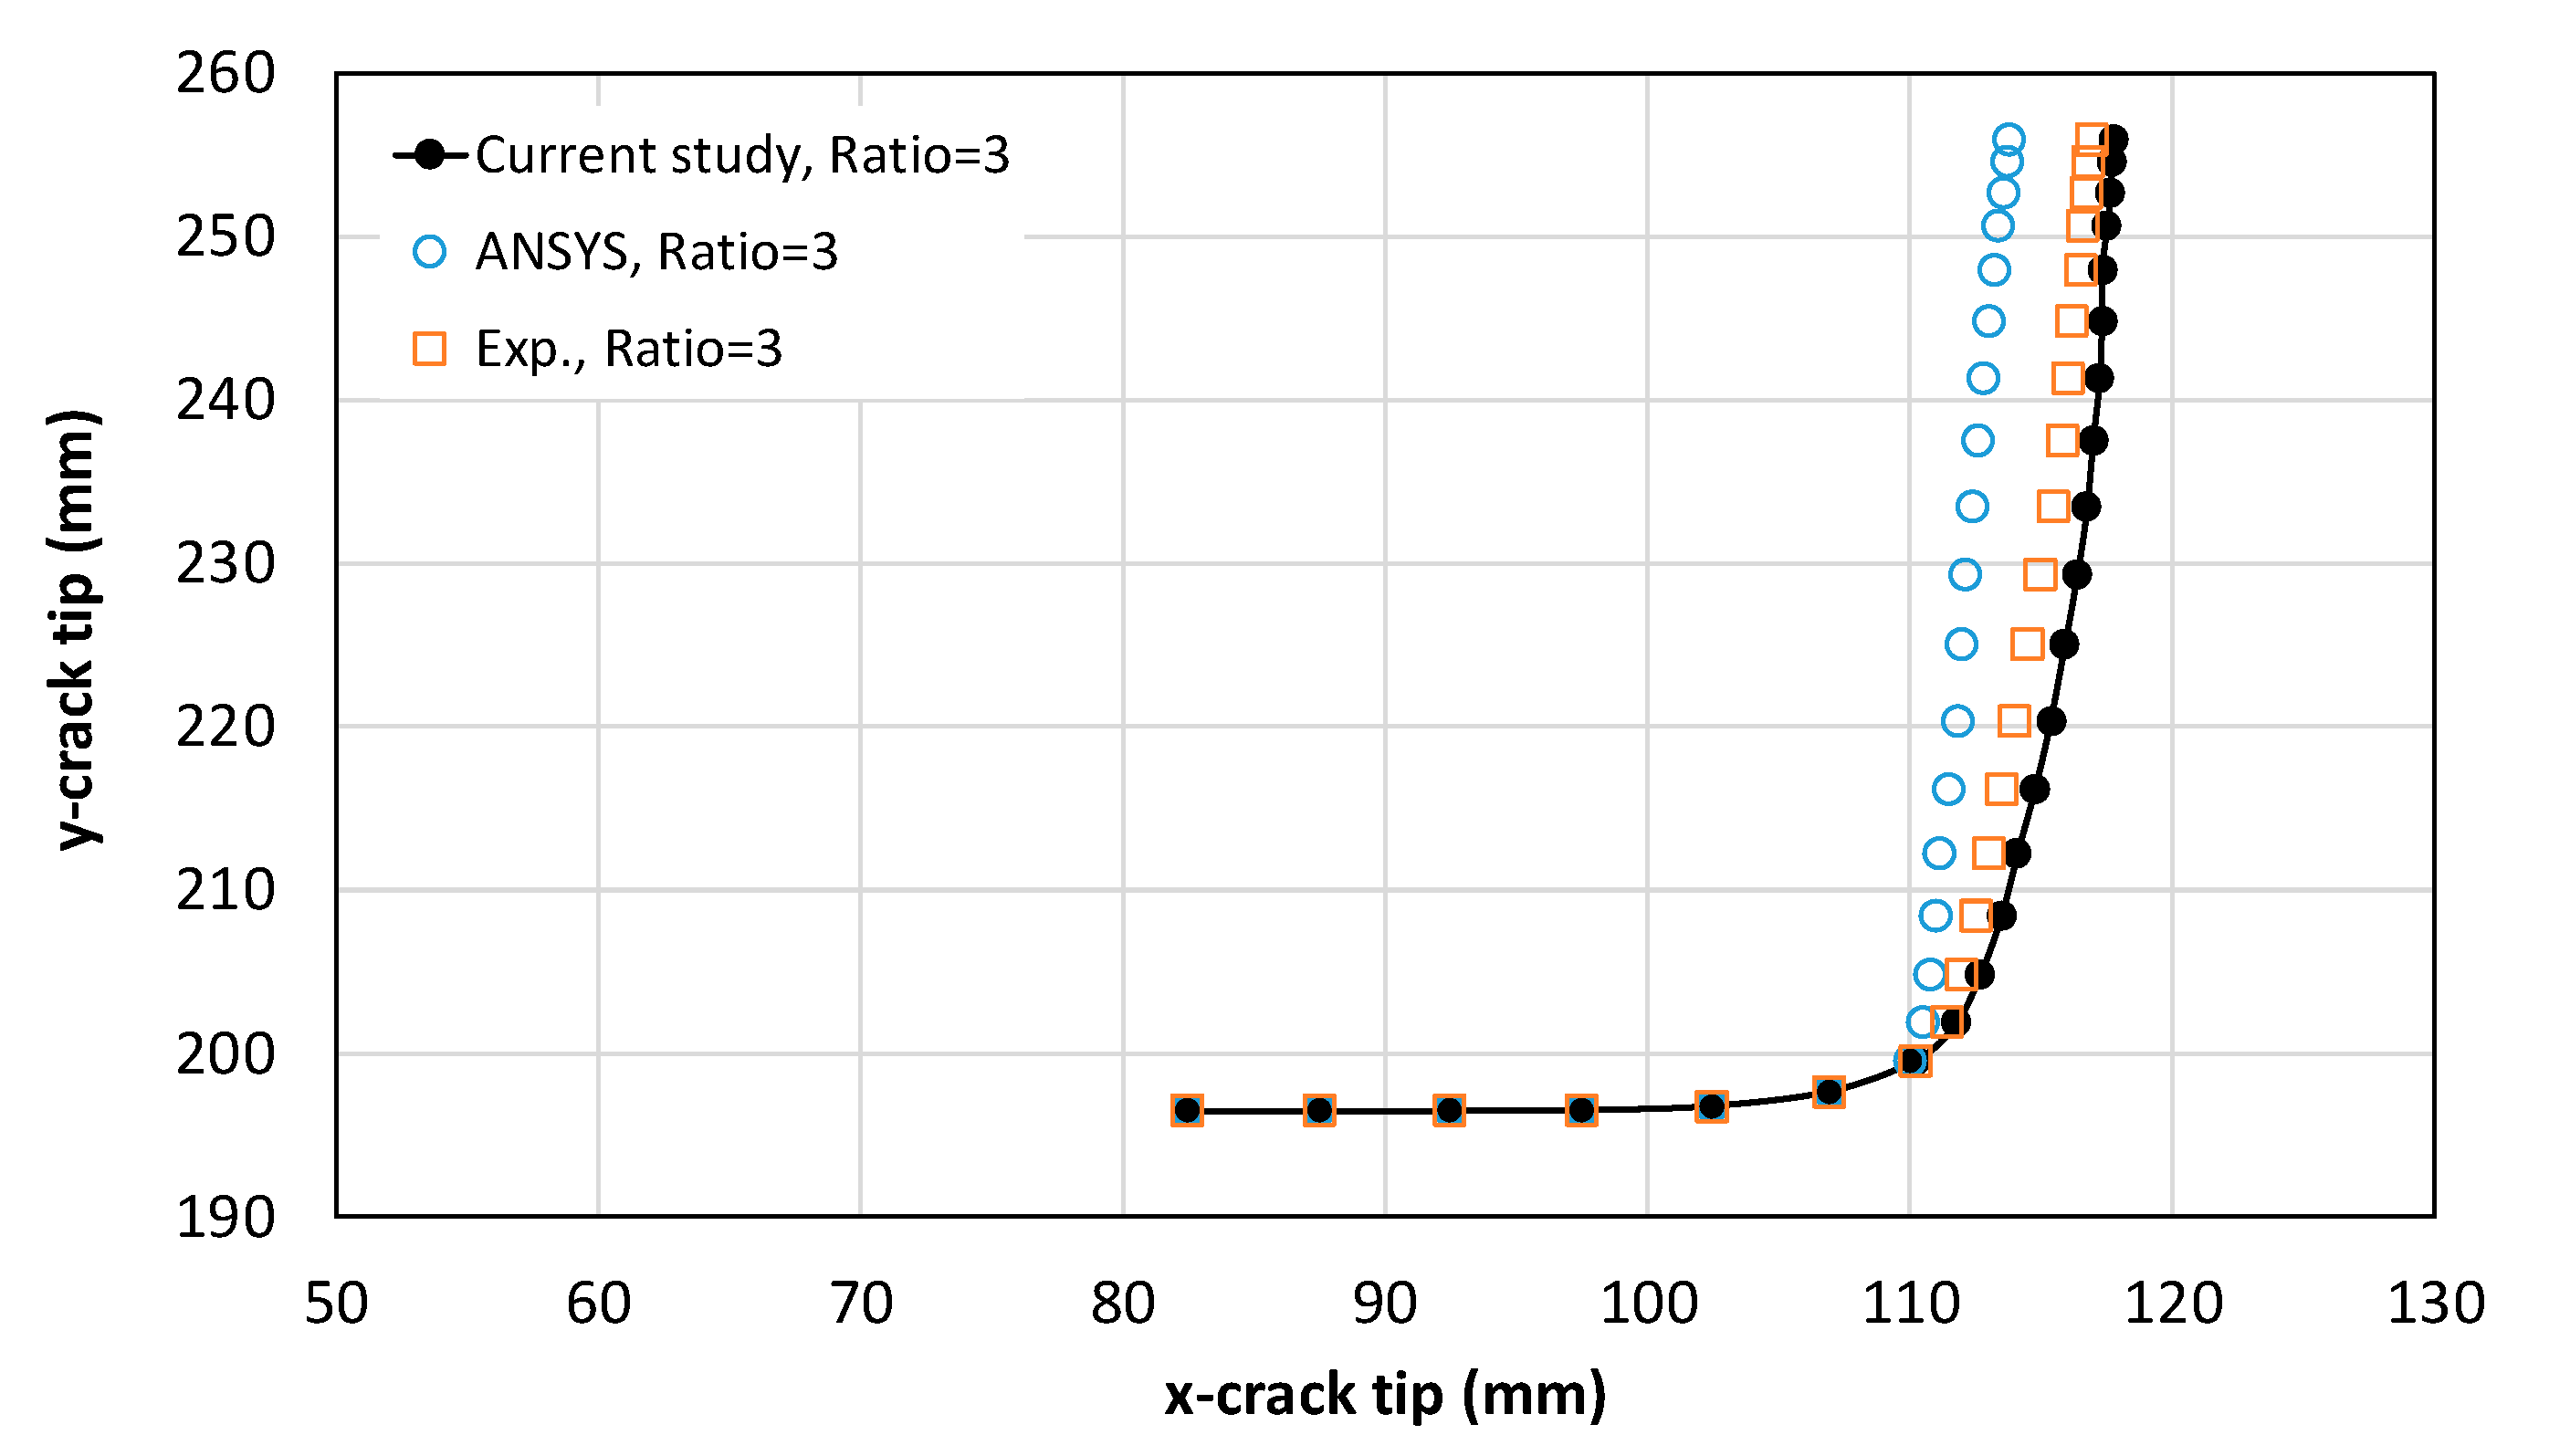
The schematic points representing the crack path coordinates (x, y) obtained from the current results have been compared with the experimental and ANSYS simulation results (λ = 3.0) for the AA2024-T351 specimen reported in [15]. The comparison shows that the current results are generally in good agreement with the numerical and experimental data, as illustrated in Figure 11.
In addition, Ref. [30] presented the crack path for a biaxial ratio of λ = 2 (Figure 12a). The crack path predicted by the current model aligns well with the literature results, as shown in Figure 12b.

4.4. Fatigue Crack Growth: A Comparative Study

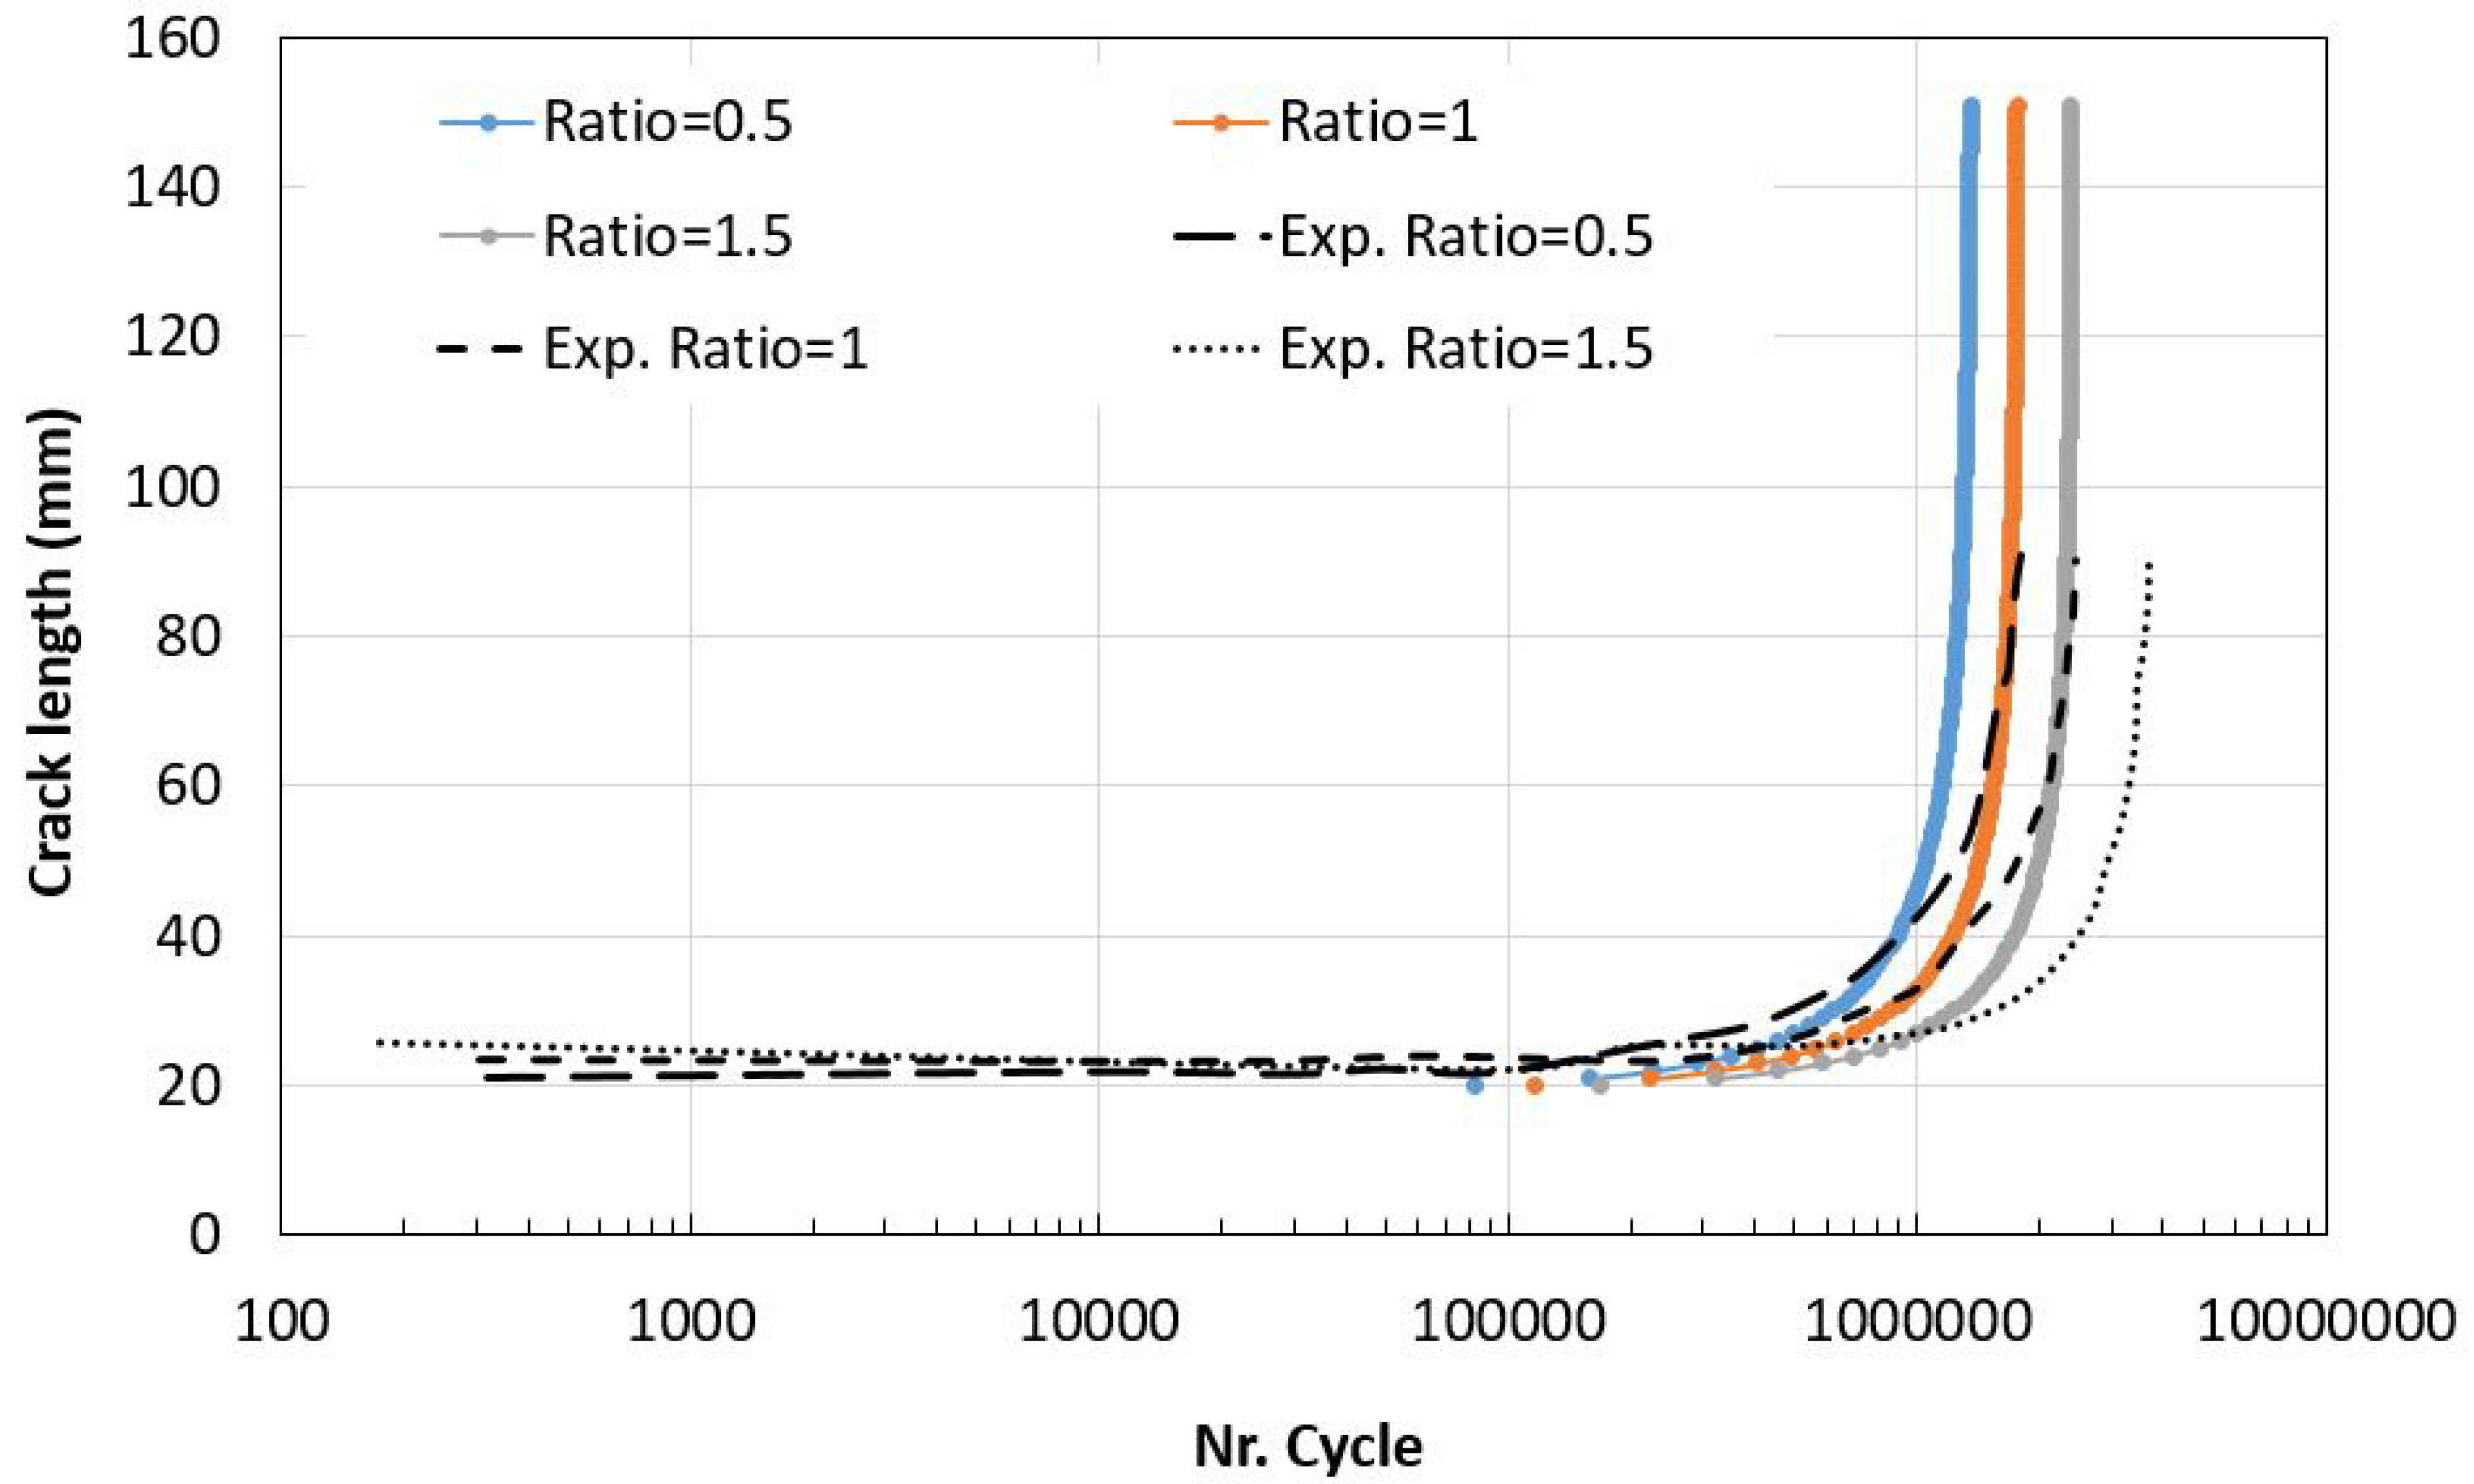
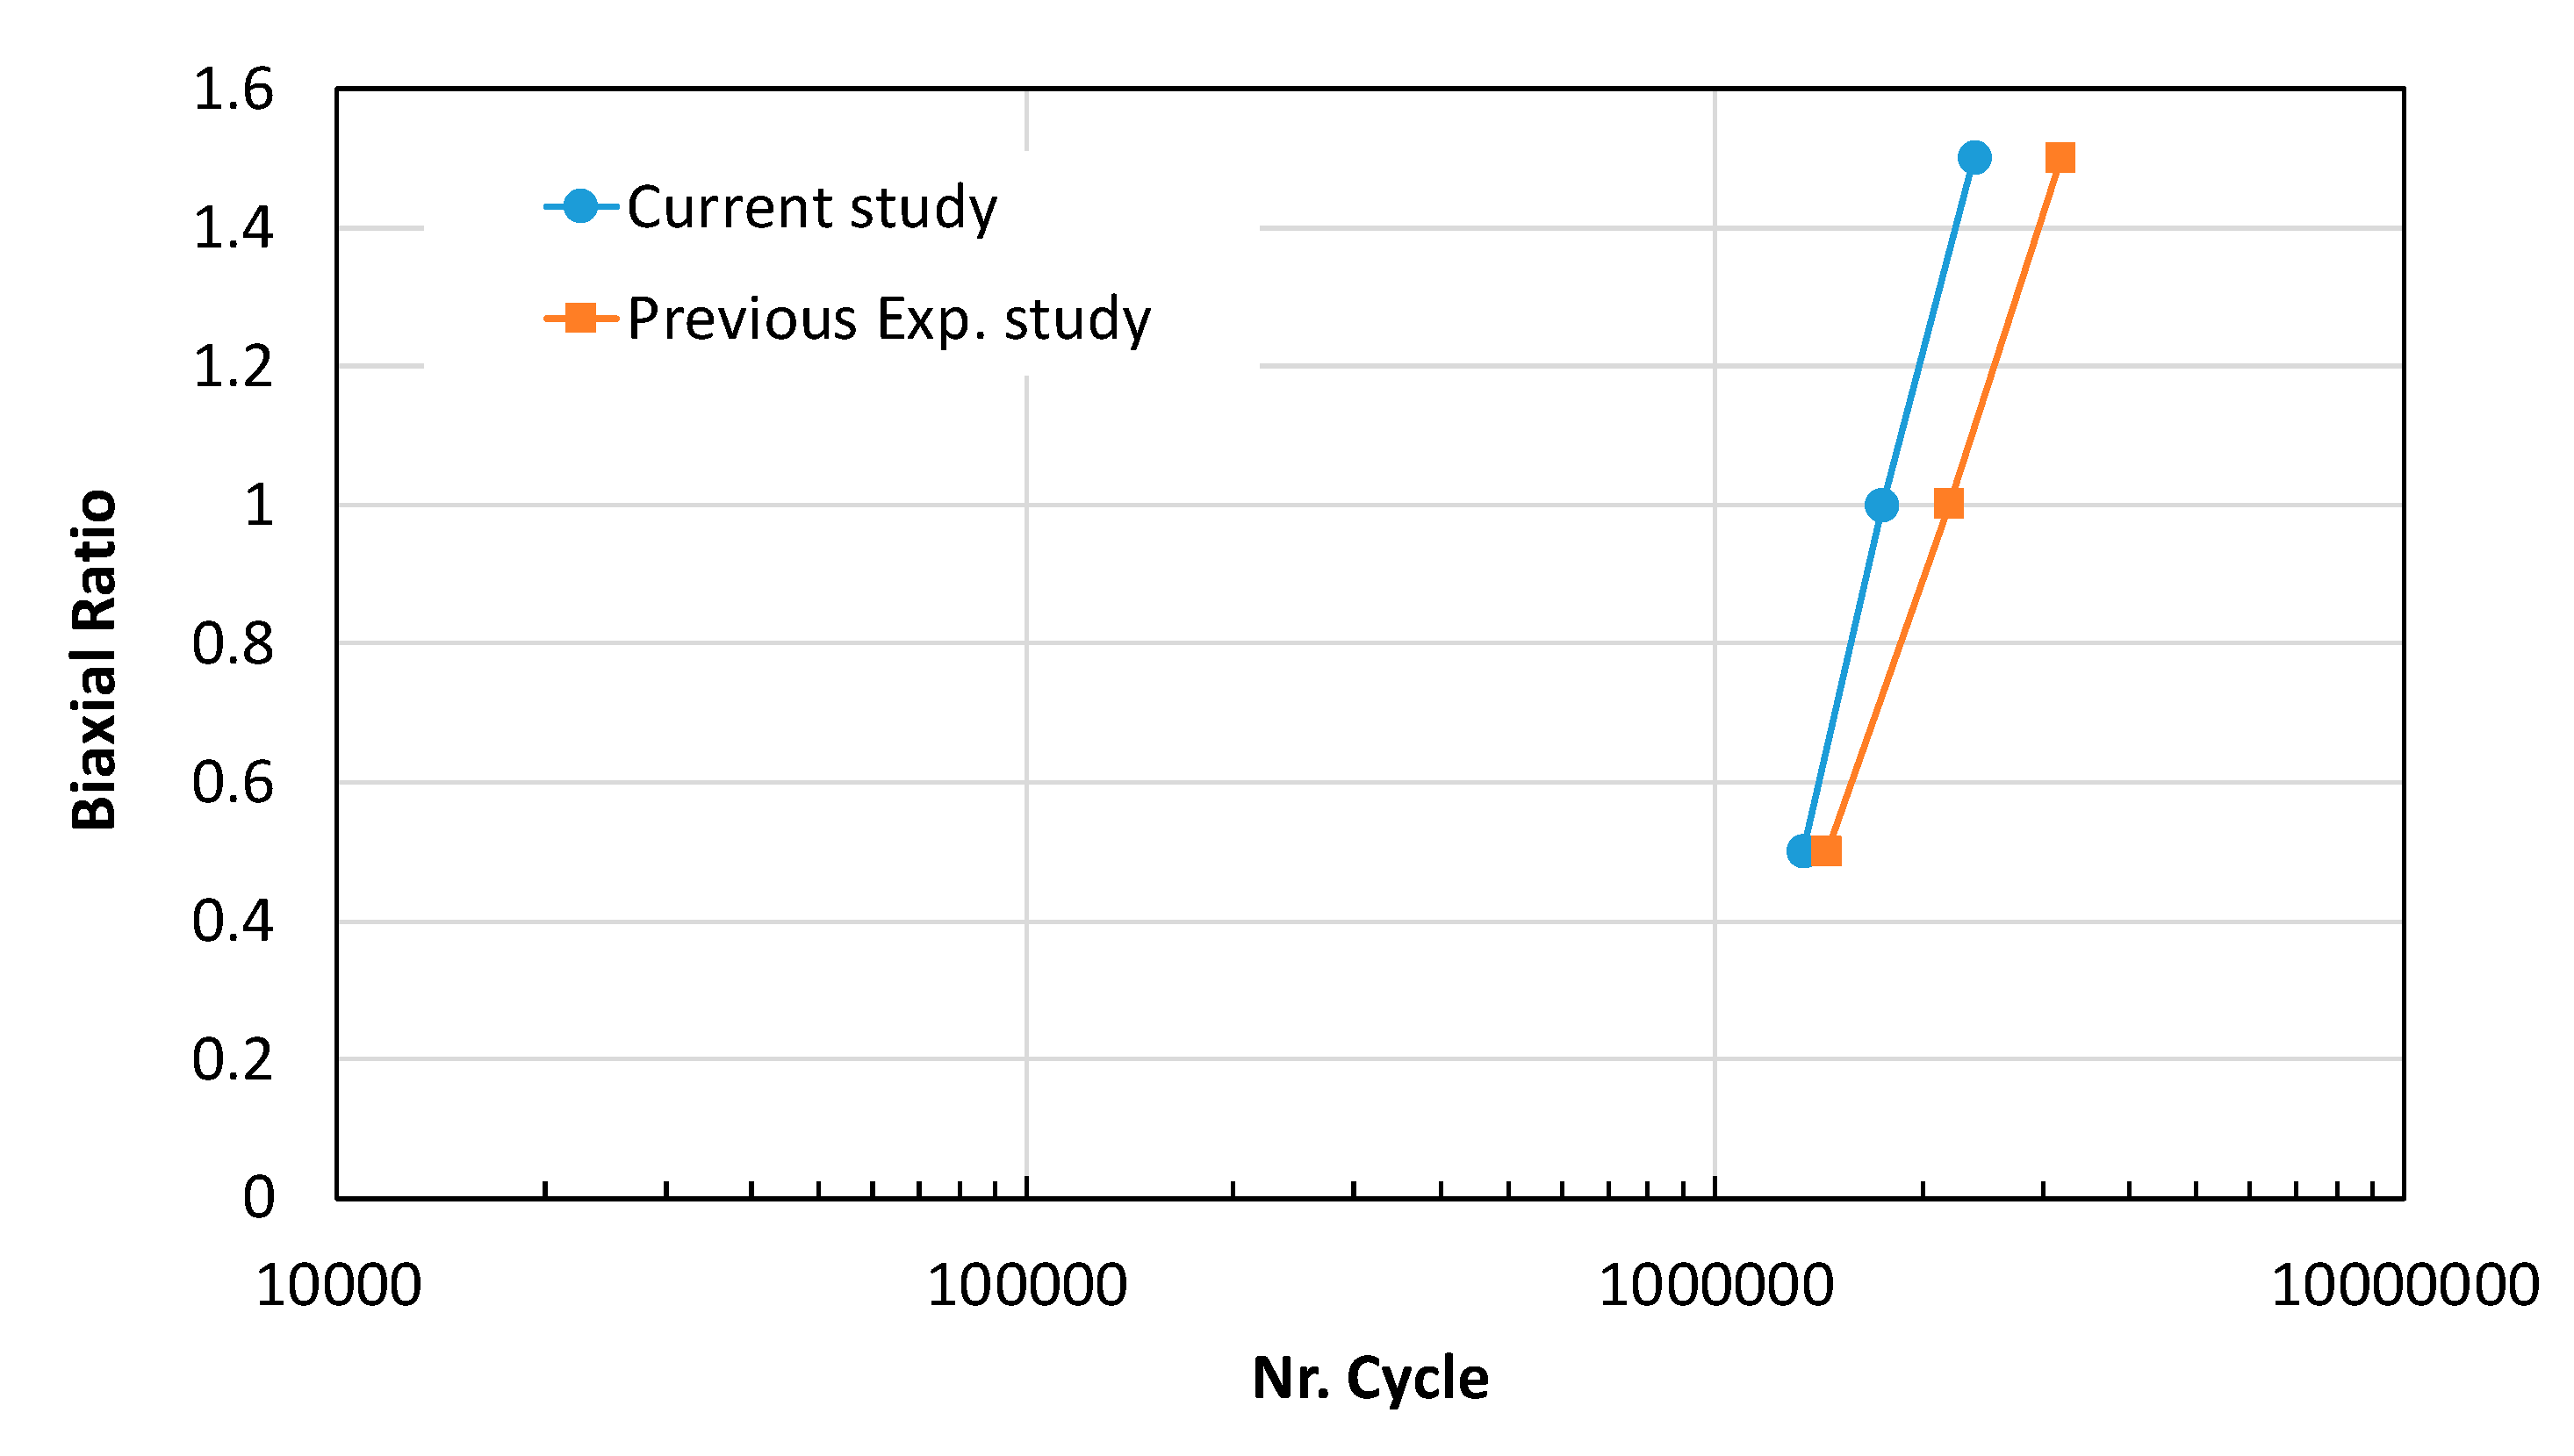
The crack growth paths obtained from the current simulations agree well with the experimental results reported in Ref. [20], confirming the validity of the proposed model and approach for fatigue life prediction. Using this validated model, fatigue life can be reliably calculated. From a fracture mechanics perspective, increasing the biaxial ratio λ (i.e., higher transverse stress σx) leads to an increase in the number of cycles to failure, as shown in Figure 13. This is because crack propagation is primarily driven by opening Mode-I [31], while the contribution of sliding Mode-II, which arises due to increasing σx, has only a minor effect on crack growth. In the current results, KI, calculated using the Franc2D code and the numerical integration of Paris’ law, shows good agreement with the experimental observations reported in Refs. [19,20], as illustrated in Figure 13. Overall, increasing the biaxial ratio leads to an extended fatigue life. At the crack length of 140 mm, the specimen will be defined as failed by fatigue [20].
By using the simplest form of Paris’ equation, crack growth curves are shown for λ = 0.5–1.5, as used in Ref. [20] (see Figure 14). Reliable results have been obtained using the current approach based on KI. The fatigue crack growth was faster, resulting in a shorter fatigue life (lower number of cycles) for a smaller λ due to the opening stress effect (see Figure 14). This result agrees well with Eun et al. [20]. In contrast, an increase in λ will extend the fatigue life, leading to a higher number of cycles. A comparison between these results and a case of in-phase loading is shown in Figure 14 [20]. It must be noted that the current numerical approach does not include chemical composition, microstructural aspects, or defects considered in experiments, which could not be fully addressed in the numerical model of Franc2D. Therefore, differences may arise due to these limitations.

4.5. Fatigue Life and SIF Under High Biaxial Ratios

As mentioned earlier, the crack path and fatigue life were compared and validated, confirming that the current model and simulation approach are properly benchmarked. Building on this validation, the present study extended the analysis to higher biaxial ratios, specifically λ = 2.5 and λ = 3. These higher ratios exhibit nonlinear and inconsistent behavior in terms of crack path (see Figure 9) and SIF evolution (Figure 15a), where the SIF increases sharply after a certain crack length, deviating from the general trend observed for lower biaxial ratios.
At higher biaxial ratios, the crack tends to curve significantly and eventually becomes nearly perpendicular to σx, aligning itself with the direction of the applied transverse stress. Nevertheless, although the final stage of crack growth is fully governed by the opening mode (perpendicular to the σx direction), the same trend of increasing fatigue life with an increasing stress ratio is observed, as shown in Figure 15b.

5. Conclusions

While many studies have focused on crack growth under uniaxial stress, simulating crack propagation under biaxial stresses remains a challenge in fracture prediction for engineering applications. This study demonstrated the ability of Franc2D to simulate biaxial crack growth and account for biaxial loading effects, an area relatively underexplored in the literature. A comparison with commercial software, 3D models, and experimental data was also presented. Thus, the use of KI in Paris’ law is validated. Using LEFM, stress intensity factors (SIFs) were calculated to analyze fatigue crack growth in biaxially stressed specimens, particularly for cruciform samples made of structural aluminum alloys. The effects of biaxial ratios on the SIF and fatigue life were evaluated, with results indicating that as the biaxial ratio increases, the SIF at the crack tip decreases, leading to longer fatigue life. However, when λ exceeds 1.5, the crack path curves and aligns more perpendicularly to the transverse load, causing an increase in the SIF at higher ratios (λ = 2–3). Despite this increase, the overall trend of longer fatigue life with higher biaxial ratios remains consistent. A validated simulation approach was developed, providing insights into the impact of biaxial loading on the crack path, SIF, and fatigue life. Limitations of the model, such as the omission of microstructure and chemical composition effects, resulted in small discrepancies with experimental data. Future work could explore varying crack locations, loading ratios, and orientations.

Author Contributions

Conceptualization, A.A.-M. and C.K.; methodology, A.A.-M. and C.K.; software, A.A.-M.; validation, A.A.-M. and C.K.; formal analysis, A.A.-M. and C.K.; investigation, A.A.-M.; resources, A.A.-M.; data curation, A.A.-M.; writing—original draft, A.A.-M. and C.K.; writing—review and editing, A.A.-M.; visualization, A.A.-M. and C.K.; supervision, C.K.; project administration, A.A.-M. and C.K.; funding acquisition, C.K. All authors have read and agreed to the published version of the manuscript.

Funding

This research received no external funding.

Data Availability Statement

The original contributions presented in the study are included in the article. Further inquiries can be directed at the corresponding author.

Acknowledgments

The first author acknowledges the support from Bauhaus-Universität Weimar.

Conflicts of Interest

The authors declare no conflicts of interest.

References

  1. Horta Muñoz, S.; Serna Moreno, M.D.C. Advances in Cruciform Biaxial Testing of Fibre-Reinforced Polymers. Polymers 2022, 14, 686. [Google Scholar] [CrossRef] [PubMed]
  2. Hammouda, M.M.I. Mixed-mode I/II stress intensity factors of a biaxially loaded plate with a central slant frictional crack: An analytical comprehensive solution. Fatigue Fract. Eng. Mater. Struct. 2023, 46, 3501–3513. [Google Scholar] [CrossRef]
  3. Kikuchi, M.; Sato, T. Fatigue Crack Growth Simulation Under Mode I+II Mixed Mode Condition; The University of Tokyo: Tokyo, Japan, 2004; Volume 47, pp. 403–409. [Google Scholar]
  4. Lebedev, A.A.; Muzyka, N.R. Design of cruciform specimens for fracture toughness tests in biaxial tension (Review). Strength Mater. 1998, 30, 243–254. [Google Scholar] [CrossRef]
  5. Radon, J.C.; Leevers, P.S.; Culver, L.E. A simple testing technique for fracture under biaxial stresses: A mechanical-hydraulic machine for biaxial fatigue and ramp loading of precracked plate specimens is described. Preliminary results show that crack behavior in PMMA is independent of the stress acting parallel to the crack plane. Exp. Mech. 1977, 17, 228–232. [Google Scholar] [CrossRef]
  6. Wu, X.-D.; Wan, M.; Zhou, X.-B. Biaxial tensile testing of cruciform specimen under complex loading. J. Mater. Process. Technol. 2005, 168, 181–183. [Google Scholar] [CrossRef]
  7. Makinde, A.; Thibodeau, L.; Neale, K.W. Development of an apparatus for biaxial testing using cruciform specimens. Exp. Mech. 1992, 32, 138–144. [Google Scholar] [CrossRef]
  8. Erdogan, F.; Sih, G.C. On the crack extension in plates under plane loading and transverse shear. J. Basic Eng. 1963, 85, 519–525. [Google Scholar] [CrossRef]
  9. Liu, J.-Y.; Bao, W.-J.; Zhao, J.-Y.; Zhou, C.-Y. Fatigue Crack Growth Behavior of CP-Ti Cruciform Specimens with Mixed Mode I-II Crack under Biaxial Loading. Materials 2022, 15, 1926. [Google Scholar] [CrossRef]
  10. Cornell Fracture Group. FRANC2D. English. Cornell University. 2015. Available online: https://cfg.cornell.edu/software/ (accessed on 20 May 2025).
  11. Al-Mukhtar, A.M.; Biermann, H.; Hübner, P.; Henkel, S. Determination of Some Parameters for Fatigue Life in Welded Joints Using Fracture Mechanics Method. J. Mater. Eng. Perform. 2010, 19, 1225–1234. [Google Scholar] [CrossRef]
  12. Al-Mukhtar, A.; Biermann, H.; Henkel, S.; Hübner, P. Comparison of the Stress Intensity Factor of Load-Carrying Cruciform Welded Joints with Different Geometries. J. Mater. Eng. Perform. 2010, 19, 802–809. [Google Scholar] [CrossRef]
  13. Men, M.; Meng, B.; Wan, M. Investigation on the biaxial tensile testing method for metal foil using cruciform specimen. Theor. Appl. Fract. Mech. 2024, 133, 104577. [Google Scholar] [CrossRef]
  14. Serna Moreno, M.C.; Muñoz, S.H. Experimental evaluation of the use of cruciform specimens for biaxial stability analysis. Compos. Part B Eng. 2024, 286, 111764. [Google Scholar] [CrossRef]
  15. Baptista, R.; Infante, V.; Madeira, J.F.A. Optimization of a cruciform specimen for fatigue crack growth under in and out-of-phase in-plane biaxial loading conditions. Mech. Adv. Mater. Struct. 2023, 30, 1649–1666. [Google Scholar] [CrossRef]
  16. Jin, P.; Liu, Z.; Chen, H.; Liu, M.; Wang, X.; Chen, X. Mixed-mode I&II fatigue crack growth behaviors of 16MND5 steel: The role of crack driving forces and crack closure. Int. J. Fatigue 2024, 183, 108228. [Google Scholar] [CrossRef]
  17. Al-Mukhtar, A.M. Mixed-Mode Crack Propagation in Cruciform Joint using Franc2D. J. Fail. Anal. Prev. 2016, 16, 326–332. [Google Scholar] [CrossRef]
  18. Shlyannikov, V.N.; Tumanov, A.V.; Zakharov, A.P. The mixed mode crack growth rate in cruciform specimens subject to biaxial loading. Theor. Appl. Fract. Mech. 2014, 73, 68–81. [Google Scholar] [CrossRef]
  19. Lee, E.U.; Taylor, R.E. Fatigue behavior of aluminum alloys under biaxial loading. Eng. Fract. Mech. 2011, 78, 1555–1564. [Google Scholar] [CrossRef]
  20. Lee, E.U.; Taylor, R. Biaxial Fatigue of Aluminum Alloy 1100. In Proceedings of the Multiaxial Fatigue, 9th International Conference on Multiaxial Fatigue and Fracture (ICMFF9), Parma, Italy, 7–9 June 2010; pp. 63–82. [Google Scholar]
  21. Bao, W.-J.; Liu, J.-Y.; Tao, Z.-L.; Zhao, G.-Z.; Zhou, C.-Y. Investigation of Fatigue Crack Growth in TA2 Cruciform Specimen with an Inclined Crack, Considering Stress Ratio and Biaxial Load Ratio. Crystals 2022, 12, 1530. [Google Scholar] [CrossRef]
  22. Fahem, A.; Kidane, A.; Sutton, M. Loading Rate Effects for Flaws Undergoing Mixed-Mode I/III Fracture. Exp. Mech. 2021, 61, 1291–1307. [Google Scholar] [CrossRef]
  23. Jahanshahi, S.; Chakherlou, T.N.; Rostampoureh, A.; Aalami, M.R. Evaluating the validity of the cohesive zone model in mixed mode I + III fracture of Al-alloy 2024-T3 adhesive joints using DBM-DCB tests. Int. J. Fract. 2023, 240, 143–165. [Google Scholar] [CrossRef]
  24. Marsavina, L. Linear Elastic Fracture Mechanics. Compr. Mech. Mater. 2024, 1, 172–191. [Google Scholar] [CrossRef]
  25. Gao, T.; Yuanzhou, Z.; Ji, B.; Xie, Z. Vision-based fatigue crack automatic perception and geometric updating of finite element model for welded joint in steel structures. Comput.-Aided Civ. Infrastruct. Eng. 2024, 39, 1659–1675. [Google Scholar] [CrossRef]
  26. Ribeiro, A.S.; de Jesus, A.M.P. Fatigue Behaviour of Welded Joints Made of 6061-T651 Aluminium Alloy. In Aluminium Alloys, Theory and Applications; IntechOpen: London, UK, 2011. [Google Scholar] [CrossRef]
  27. Meguid, S.A. Linear Elastic Fracture Mechanics. In Atomistic and Continuum Fracture Mechanics of Solids; Springer Nature: Cham, Switzerland, 2024; pp. 185–225. [Google Scholar] [CrossRef]
  28. Hua, W.; Li, J.; Zhu, Z.; Li, A.; Huang, J.; Gan, Z.; Dong, S. A review of mixed mode I-II fracture criteria and their applications in brittle or quasi-brittle fracture analysis. Theor. Appl. Fract. Mech. 2023, 124, 103741. [Google Scholar] [CrossRef]
  29. Breitbarth, E.; Besel, M. Fatigue crack deflection in cruciform specimens subjected to biaxial loading conditions. Int. J. Fatigue 2018, 113, 345–350. [Google Scholar] [CrossRef]
  30. Pook, L.P. Five decades of crack path research. Eng. Fract. Mech. 2010, 77, 1619–1630. [Google Scholar] [CrossRef]
  31. Zhang, Z.; Yang, B.; Wang, S.; Huang, M.; Zheng, H.; Xiao, S. Mixed mode (I/II) fatigue crack growth in butt-welded joints using actual stress intensity factors. Theor. Appl. Fract. Mech. 2025, 138, 104894. [Google Scholar] [CrossRef]
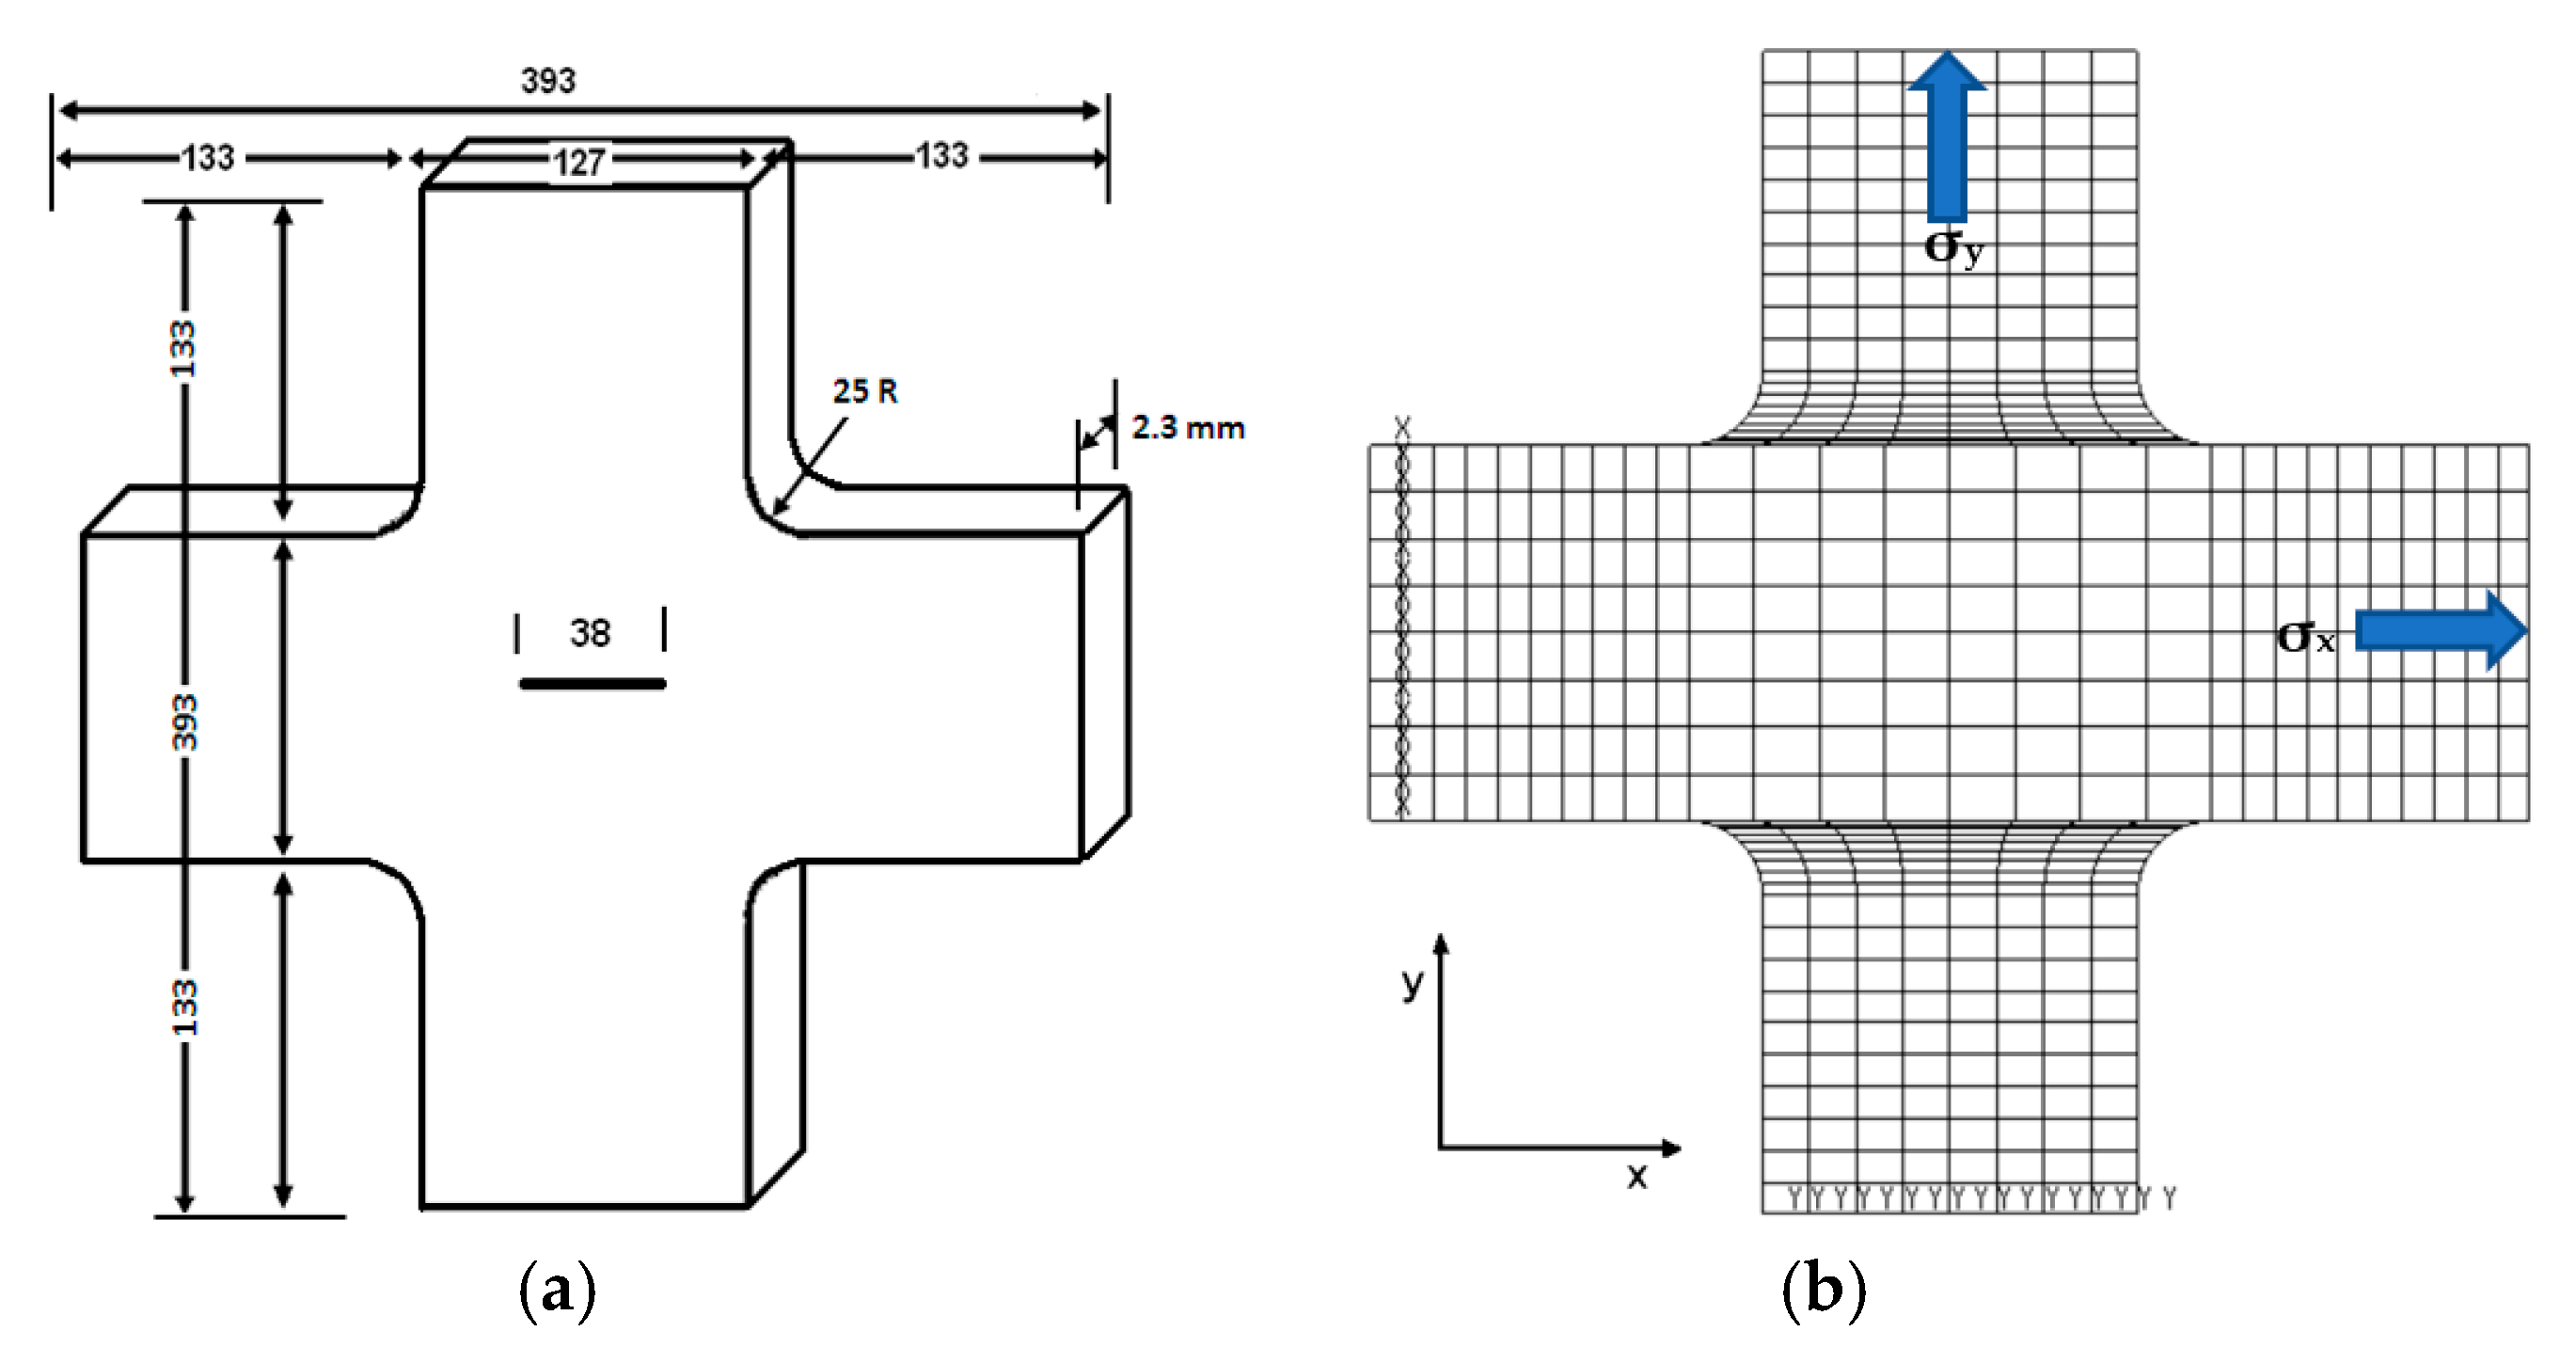
Figure 1. (a) Aluminum cruciform specimen, dimensions in mm. Reprinted with permission from Ref. [17]. Copyright 2025 Springer Nature; (b) mesh pattern and boundary conditions, including loads and fixities (Franc2D).
Metals 15 00579 g001
Figure 2. Remeshing and crack creation with a 38 mm inserted crack and material properties integration.
Metals 15 00579 g002
Figure 3. Symmetrical stress distributions, σy = 35.7 MPa, where λ = σxy = 1: (a) without crack (b) and with crack.
Metals 15 00579 g003
Figure 4. Effect of the stress ratio on stress distribution and concentration in the specimen. Increasing biaxiality (i.e., increasing σx) leads to higher crack tip stresses due to the combined effect of stress components in both the x- and y-directions. This interaction results in elevated effective stresses around the crack tip.
Metals 15 00579 g004
Figure 5. The crack path and stress bar for different stress ratios, showing how biaxial stress can develop a mixed-mode crack path (CP) by changing the stress tensor of tension (red) and compression (blue) along the crack, with ∆a = 5 mm and specimen thickness = 2.3 mm.
Metals 15 00579 g005
Figure 6. Variation in SIF with respect to biaxial ratio. SIF Mode-I remains predominant while Mode-II approaches zero at initial crack length (2a = 38 mm and specimen thickness = 2.3 mm).
Metals 15 00579 g006
Figure 7. Variation in SIF with crack length for biaxial ratios λ = 0.5–2.5; specimen thickness = 2.3 mm.
Metals 15 00579 g007
Figure 8. The changing in crack tip stress according to the biaxial ratio λ = 0.5–2.5 at an initial crack length of 2a = 38 mm and a specimen thickness = 2.3 mm.
Metals 15 00579 g008
Figure 9. Crack paths for different biaxial stress ratios at the crack tip on the right side; specimen thickness = 2.3 mm.
Metals 15 00579 g009
Figure 10. The numerical comparison and verification at λ = 3 (a) The experimental and FE model results. Reprinted with permission from Ref. [29]. Copyright 2025 Elsevier; (b) Current model using Franc2D.
Metals 15 00579 g010
Figure 11. Validation of current approach at λ = 3 as compared with previous numerical and experiment crack path. Adapted with permission from Ref. [29]. Copyright 2025 Elsevier.
Metals 15 00579 g011
Figure 12. Validation of crack growth at λ = 2: (a) experimental crack path, reprinted with permission from Ref. [30], copyright 2025 Elsevier and (b) The current FE model shows tensile stress in red at the crack tip and compressive stress along the crack faces.
Metals 15 00579 g012
Figure 13. Comparison of the fatigue crack growth between the current model and the experiment, adapted with permission from Ref. [19], copyright 2025 Elsevier for biaxial ratios λ = 0.5, 1, and 1.5.
Metals 15 00579 g013
Figure 14. A comparison of fatigue life between the current model and the experiment. Adapted with permission from Ref. [19]. Copyright 2025 Elsevier.
Metals 15 00579 g014
Figure 15. (a) SIF and (b) fatigue life for biaxial ratios λ ranging from 0.5 to 3. Increasing the biaxial ratio leads to a higher number of cycles to failure.
Metals 15 00579 g015
Table 1. Biaxial stress ratio λ = σxy, 2a = 38 mm, and specimen thickness = 2.3 mm.
λσyσx
135.735.7
1.135.739.27
1.235.742.84
1.335.746.41
1.435.749.98
1.535.753.55
1.635.757.12
1.735.760.69
1.835.764.26
1.935.7 67.83
235.771.4
2.535.789.25
Disclaimer/Publisher’s Note: The statements, opinions and data contained in all publications are solely those of the individual author(s) and contributor(s) and not of MDPI and/or the editor(s). MDPI and/or the editor(s) disclaim responsibility for any injury to people or property resulting from any ideas, methods, instructions or products referred to in the content.