Article

CALPHAD-Assisted Analysis of Fe-Rich Intermetallics and Their Effect on the Mechanical Properties of Al-Fe-Si Sheets via Continuous Casting and Direct Rolling

1
School of Materials Science and Engineering & Henan Province Key Laboratory of Advanced Light Alloys, Zhengzhou University, Zhengzhou 450001, China
2
Zhengzhou Non-Ferrous Metals Research Institute Co, Ltd. of CHINALCO, Zhengzhou 450041, China
3
Inner Mongolia Liansheng New Energy Materials Co., Ltd., Tongliao 029299, China
*
Author to whom correspondence should be addressed.
Metals 2025, 15(6), 578; https://doi.org/10.3390/met15060578
Submission received: 11 April 2025 / Revised: 18 May 2025 / Accepted: 20 May 2025 / Published: 23 May 2025
(This article belongs to the Special Issue Thermodynamics and Kinetics Analysis of Metallic Material)

Abstract

As an eco-efficient short-process manufacturing technique for aluminum alloys, twin-belt continuous casting and direct rolling (TBCCR) demonstrates significant production advantages. In this study, an Al-Fe-Si alloy system with different Fe-rich intermetallics (α-AlFe(Mn)Si and β-AlFe(Mn)Si) via TBCCR was developed for new energy vehicle batteries, utilizing the Computer Coupling of Phase Diagrams and Thermochemistry (CALPHAD) technique. Comprehensive microstructure and surface segregation analyses of continuous casted ingots and direct-rolled sheets revealed that the Al-Fe-Si alloy with a combined Fe + Si content of 0.7% and an optimal Fe/Si atomic ratio of 3:1 (FS31) presents optimized mechanical properties: ultimate tensile strength of 145.8 MPa, elongation to failure of 5.7%, accompanied by a cupping value of 6.64 mm. Notably, Mn addition further refined the grain structure of casting ingots and enhanced the strength of both ingots and rolled sheets. Among the experimental alloys, FS14 (optimal Fe/Si atomic ratio of 1:4) sheets displayed the least surface segregation upon Mn incorporation. Through systematic optimization, an Al-Fe-Si-Mn alloy composition (Fe + Si = 0.7%, Fe/Si = 1:4 atomic ratio, 0.8 wt.% Mn) was engineered for TBCCR processing, achieving enhanced comprehensive performance: ultimate tensile strength of 189.4 MPa, elongation to failure of 7.32%, and cupping value of 7.71 mm. This composition achieves an optimal balance between grain refinement, mechanical properties (strength–plasticity synergy), formability (cupping value), and corrosion resistance (corrosion current density). The performance optimization strategy integrates synergistic improvements in strength, ductility, and corrosion resistance, providing valuable guidance for developing high-performance aluminum alloys suitable for the TBCCR process.

1. Introduction

Growing environmental and energy crises have driven the need not only for large-scale recycling of aluminum scrap but also for developing energy-efficient short-process manufacturing technologies such as continuous casting and direct rolling [1,2] and twin-roll casting [3,4]. Nevertheless, aluminum alloy recycling inevitably introduces Fe impurities that form detrimental intermetallic phases (FIMCs), which increase material hardness while compromising deformability, thereby restricting manufacturing process design [5,6,7]. Furthermore, short-process manufacturing technologies are prone to severe Fe/Si macro-segregation [8,9] attributed to wide crystallization temperature ranges [10], adversely affecting the surface quality of aluminum sheets/foils. As primary alloys for foil production, commercial Al-Fe-Si alloys (1xxx/8xxx series) face critical challenges in controlling Fe content and FIMCs’ formation during recycling or short-process manufacturing.
Current mitigation strategies focus on three approaches: removement of the Fe element [11,12], FIMCs’ refinement, and FIMCs’ modification [13]. However, Fe impurity is difficult to remove by any economical technologies [14,15], prompting extensive research towards FIMCs’ refinement/modification [16,17,18]. The formation of two characteristic ternary phases α-AlFeSi and β-AlFeSi [19] is governed by the Fe/Si ratio [16]. In contrast to skeletal or granular α-AlFeSi, the needle-like β-AlFeSi phase not only splits the Al-matrix but also facilitates the development of casting defects [20]. The published first-principles calculated results [21] indicated that the crystal structure of β-AlFeSi phase is monoclinic and the α-AlFeSi presents a cubic structure. To address this, microalloying with Mn [22,23], Cr [24,25], Ni [26], or Sc [27] has been implemented to transform detrimental β-AlFeSi into the less harmful α-AlFeSi phase.
The rapid development of new energy batteries and the continuous enhancement of environmental awareness has accelerated short-process manufacturing technologies’ adoption in Al-Fe-Si foil production. While twin-roll casting has been extensively studied for Al-Fe-Si alloys [9,28,29,30], limited attention has been given to optimizing process parameters [31] for twin-belt continuous casting and direct rolling (TBCCR) systems. In the preliminary work, the influence of partially replacing Sc with Er on the microstructure, mechanical properties, and corrosion resistance of a short-process (including a simulated twin-belt continuous casting, subsequent direct rolling, intermediate annealing, cold rolling, and stress-relief annealing) Al-4.7Mg-0.6Mn-0.3Zr-0.3Sc sheet was systematically studied [32]. TBCCR-optimized Al-Fe-Si alloys for high-volume production (>200,000 tons/year) was developed in this study. This investigation systematically examines FIMCs’ evolution and its impact on mechanical properties through an integrated approach combining Computer Coupling of Phase Diagrams and Thermochemistry (CALPHAD) simulations via PANDAT 2020 software with experimental validation. PANDAT is a software package for multicomponent phase diagram calculation. PANDAT automatically calculates the stable phase diagram, without the need for prior knowledge of the diagram or special user skills, when a set of thermodynamic parameters and a set of user constraints for all phases in the system are given [33].

2. Materials and Methods

2.1. CALPHAD Calculations

Based on the AA1235 alloy, CALPHAD calculations were performed using PANDAT software. This analysis explored the Al-Fe-Si alloy system with varying Fe and Si contents to develop alloys with different Fe-rich phases, such as α-AlFeSi and β- AlFeSi. The formation of these phases depends on the Fe and Si levels as well as their ratio. To determine the preliminary composition of Al-Fe-Si alloys containing α-AlFeSi and/or β-AlFeSi phases, the isothermal section and overlapped map of these alloys (in atomic percent) were calculated using Pandat software [34].

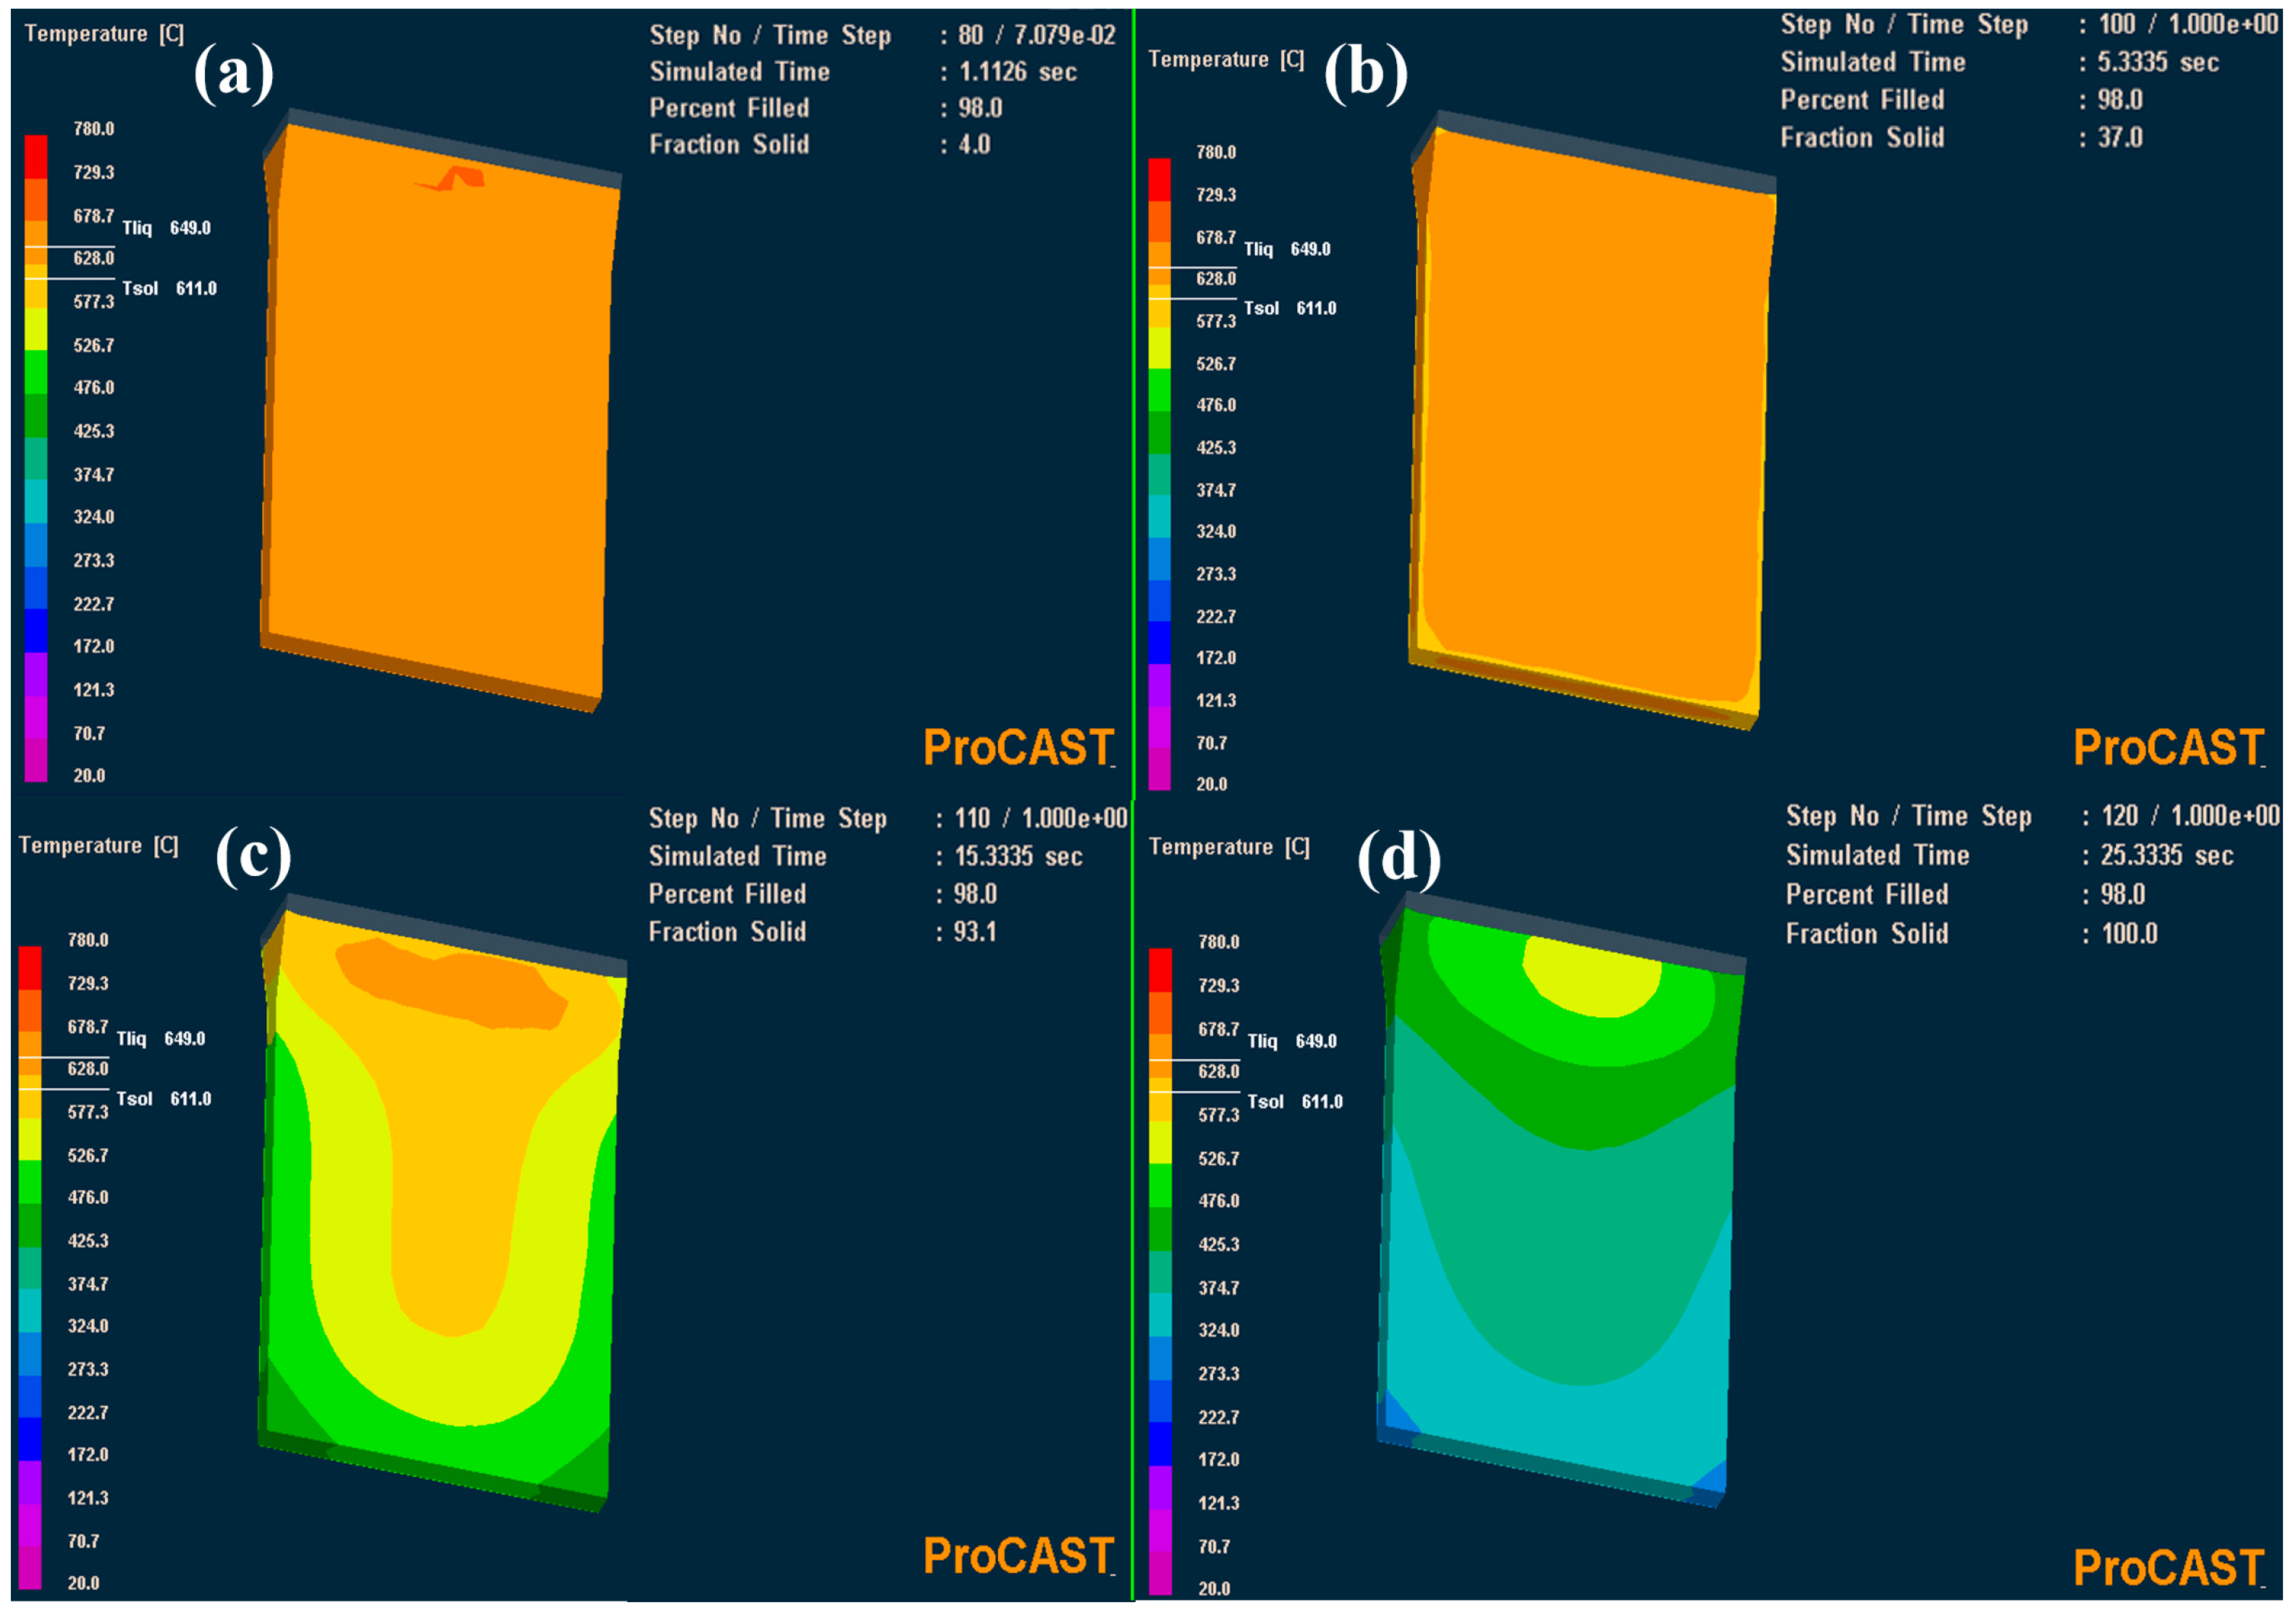
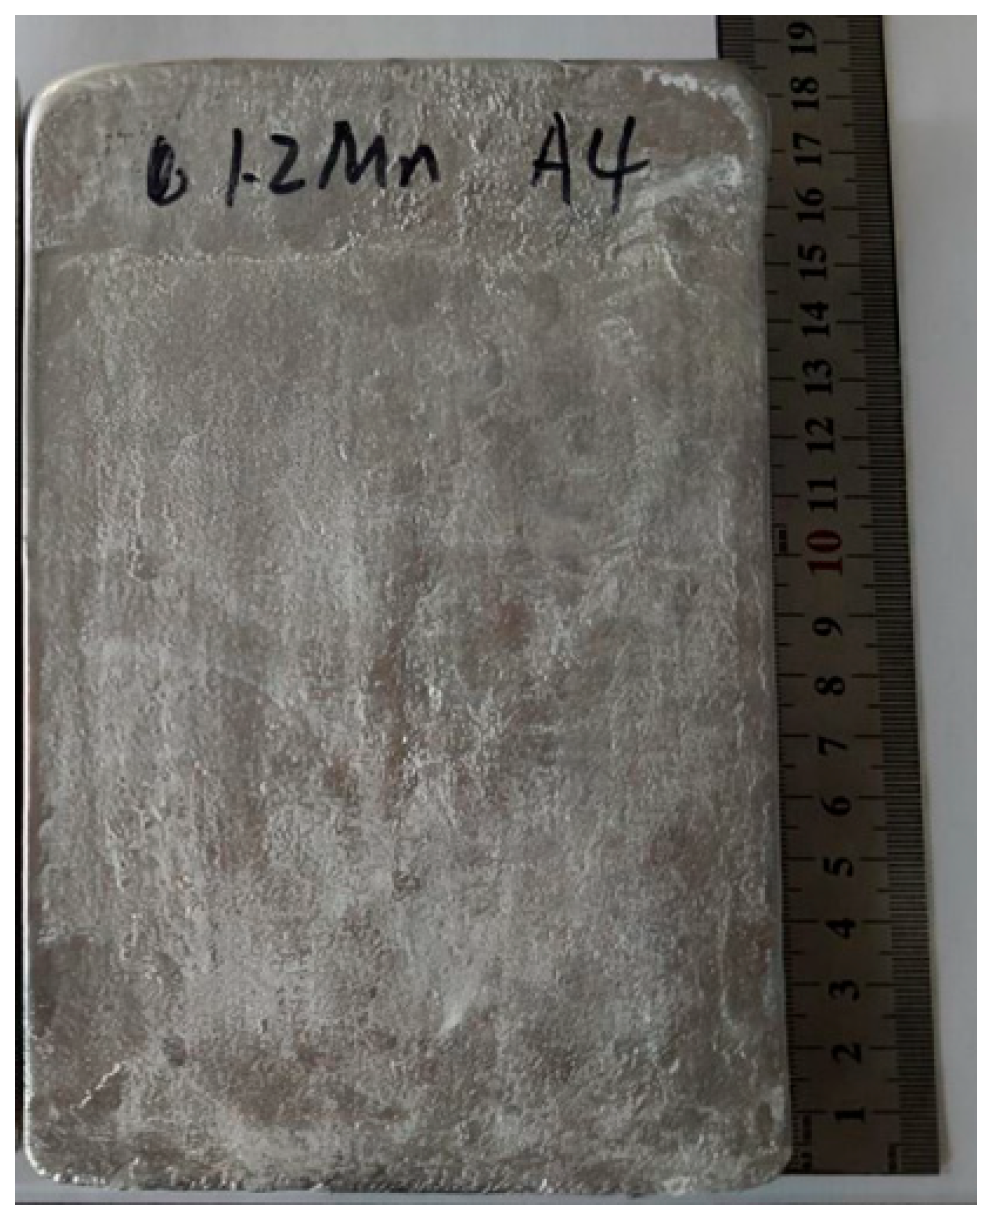
2.2. Casting and Direct Rolling Processing

A series of experimental Al-Fe-Si alloys were prepared by melting commercial pure Al, Al–10Fe, Al–10Mn, and Al–20Si master alloys based on thermodynamic simulations. The experiment used a well-type resistor furnace (SG2-7.5-12) for alloy melting. The well-type resistor furnace is suitable for melting alloys such as aluminum and magnesium, with a rated power of 7.5 KW, a rated temperature of 1200 °C, and a furnace wall size of Ø 250 × 300 mm. First, the commercial pure Al was melted in a clay–graphite crucible using an electric resistance furnace. Then, the preheated Al–10Fe, Al–10Mn, Al–20Si, and Al–Ti–B master alloys were sequentially added to the melt at 760 °C; temperature measurement is carried out using a K-type thermocouple. The melt was degassed using pure Ar and fluxes, performed by a commercial degasser at 0.5 L/min for 20 min. Finally, surface impurities were removed, and the melt was poured into a preheated steel mold with a wedge riser and a rectangular cavity whose internal dimensions were 150 × 50 × 10 mm after skimming. The mold was preheated to 120 °C ± 10 °C before the casting.
To ensure that the solidification rate of the continuous casted ingots in the simulated TBCCR process closely matches actual production conditions, a comprehensive simulation of the continuous casting process was conducted before casting using ProCAST 2014 software. The simulation results shown in Figure 1 indicate that the temperature distribution on both sides of the samples was uniform during solidification, and the cooling rate throughout the solidification process was similar to that of continuous casting (50~60 °C/s). As depicted in Figure 2, the continuous casting billet will be directly rolled without any milling treatment. The rolling of alloys was carried out on a double-high rolling mill JD1A-90 with a rolling speed of 250 r/min, and the reduction per pass was maintained at 10–20%. The samples were placed in a muffle furnace preheated to 390 °C for rapid annealing for 60 min when rolled to 3.5 mm, then removed and air-cooled to room temperature and the rolling resumed. The final deformation of the sample was 90%, with a final sheet thickness of 1 mm.

2.3. Microstructural Observation

The samples of the continuous casted ingots and rolled sheets (longitudinal section) for microstructural observation were mechanically ground and polished using standard methods. Microstructural characterization and phase identification were performed using an optical microscope (OM) and an FEI Quanta-200 scanning electron microscope (SEM), Thermo Fisher Scientific, Waltham, MA, USA equipped with energy dispersive X-ray spectroscopy (EDS). The solidification and melting processes of the alloys were analyzed using a NETZSCH DSC 404 C-type differential thermal analyzer, NETZSCH, Selb, Germany.

2.4. Hardness, Tensile, and Electrochemical Tests

Vickers hardness was tested using an HXD-1000TMC LCD, Shanghai Optical, Shanghai, China with a load of 1 kN and a dwell time of 15 s. At least 20 measurements were taken at random locations. The tensile properties were tested using an AG-IC50kN loading frame at a crosshead speed of 0.2 mm/min. The forming performance of alloy sheets was analyzed using the CBZ-60D fully automatic cupping testing system, Jinan Huaxing Testing Machine Co., Ltd. Jinan, China. The dynamic polarization curves of alloy sheets in a 3.5 wt% NaCl solution were tested using an RST 5200 electrochemical workstation, Zhengzhou Shiruisi Instrument Technology Co., Ltd. Zhengzhou, China.

3. Results and Discussion

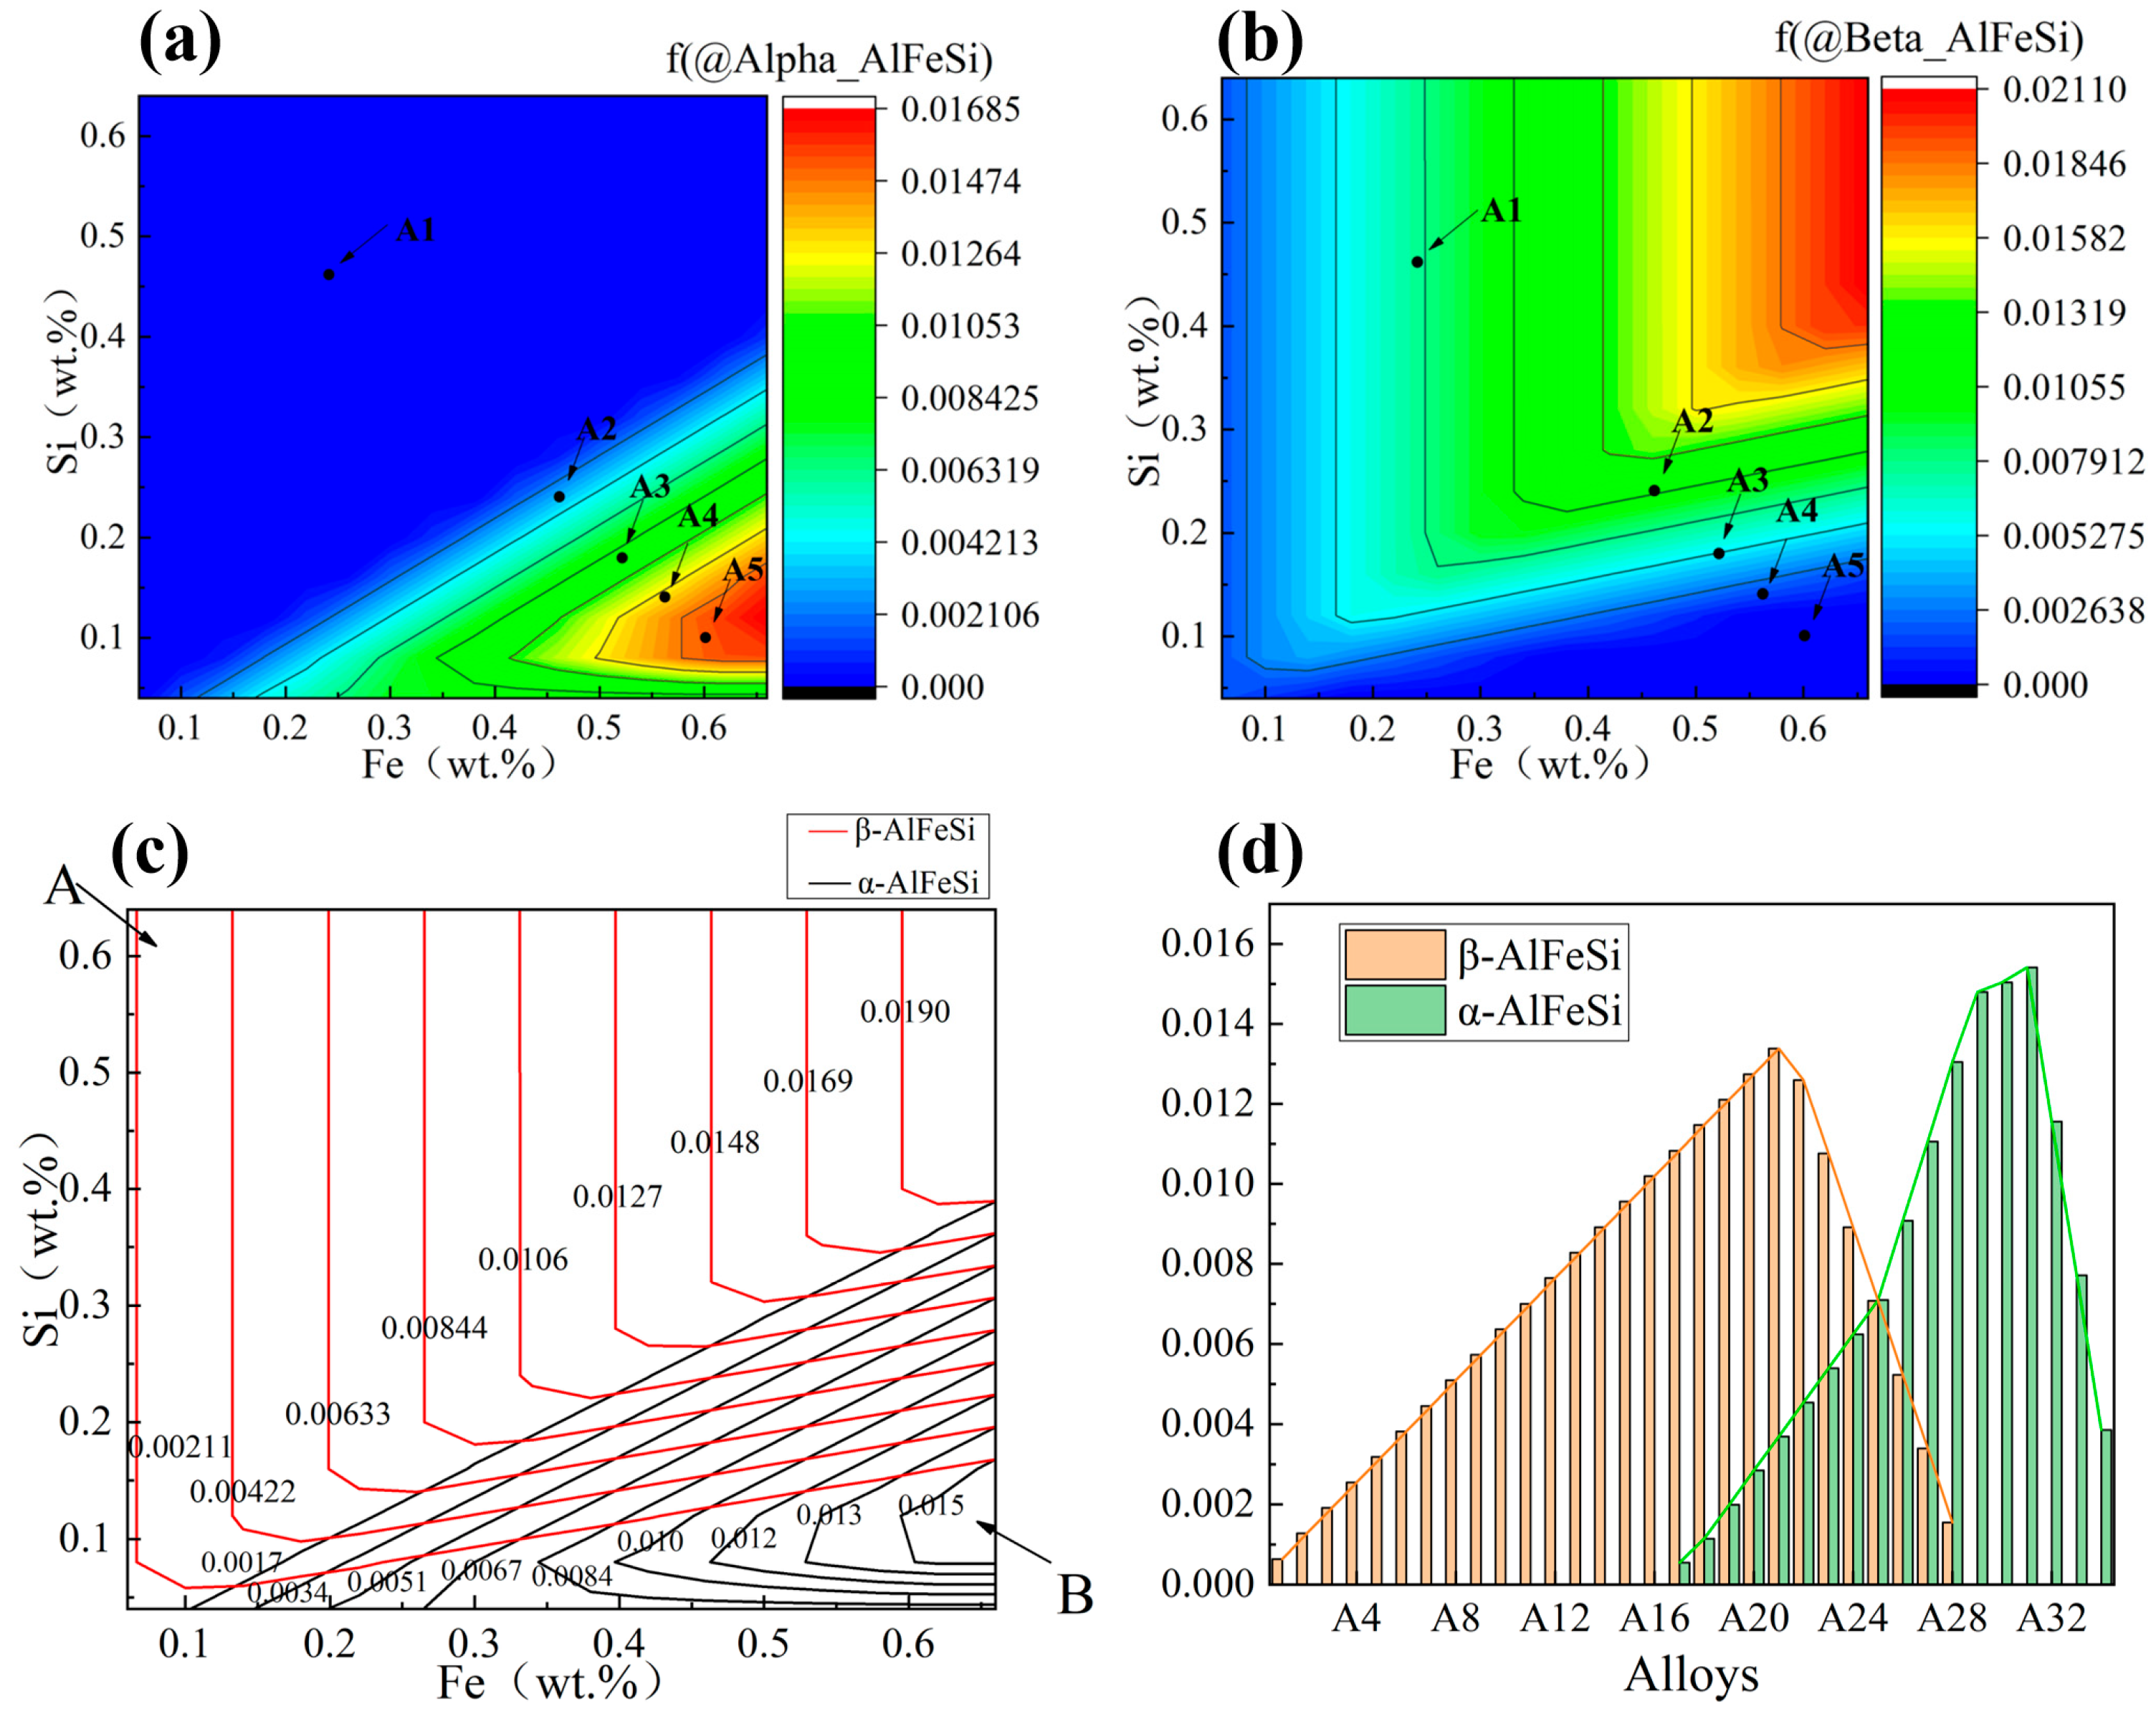
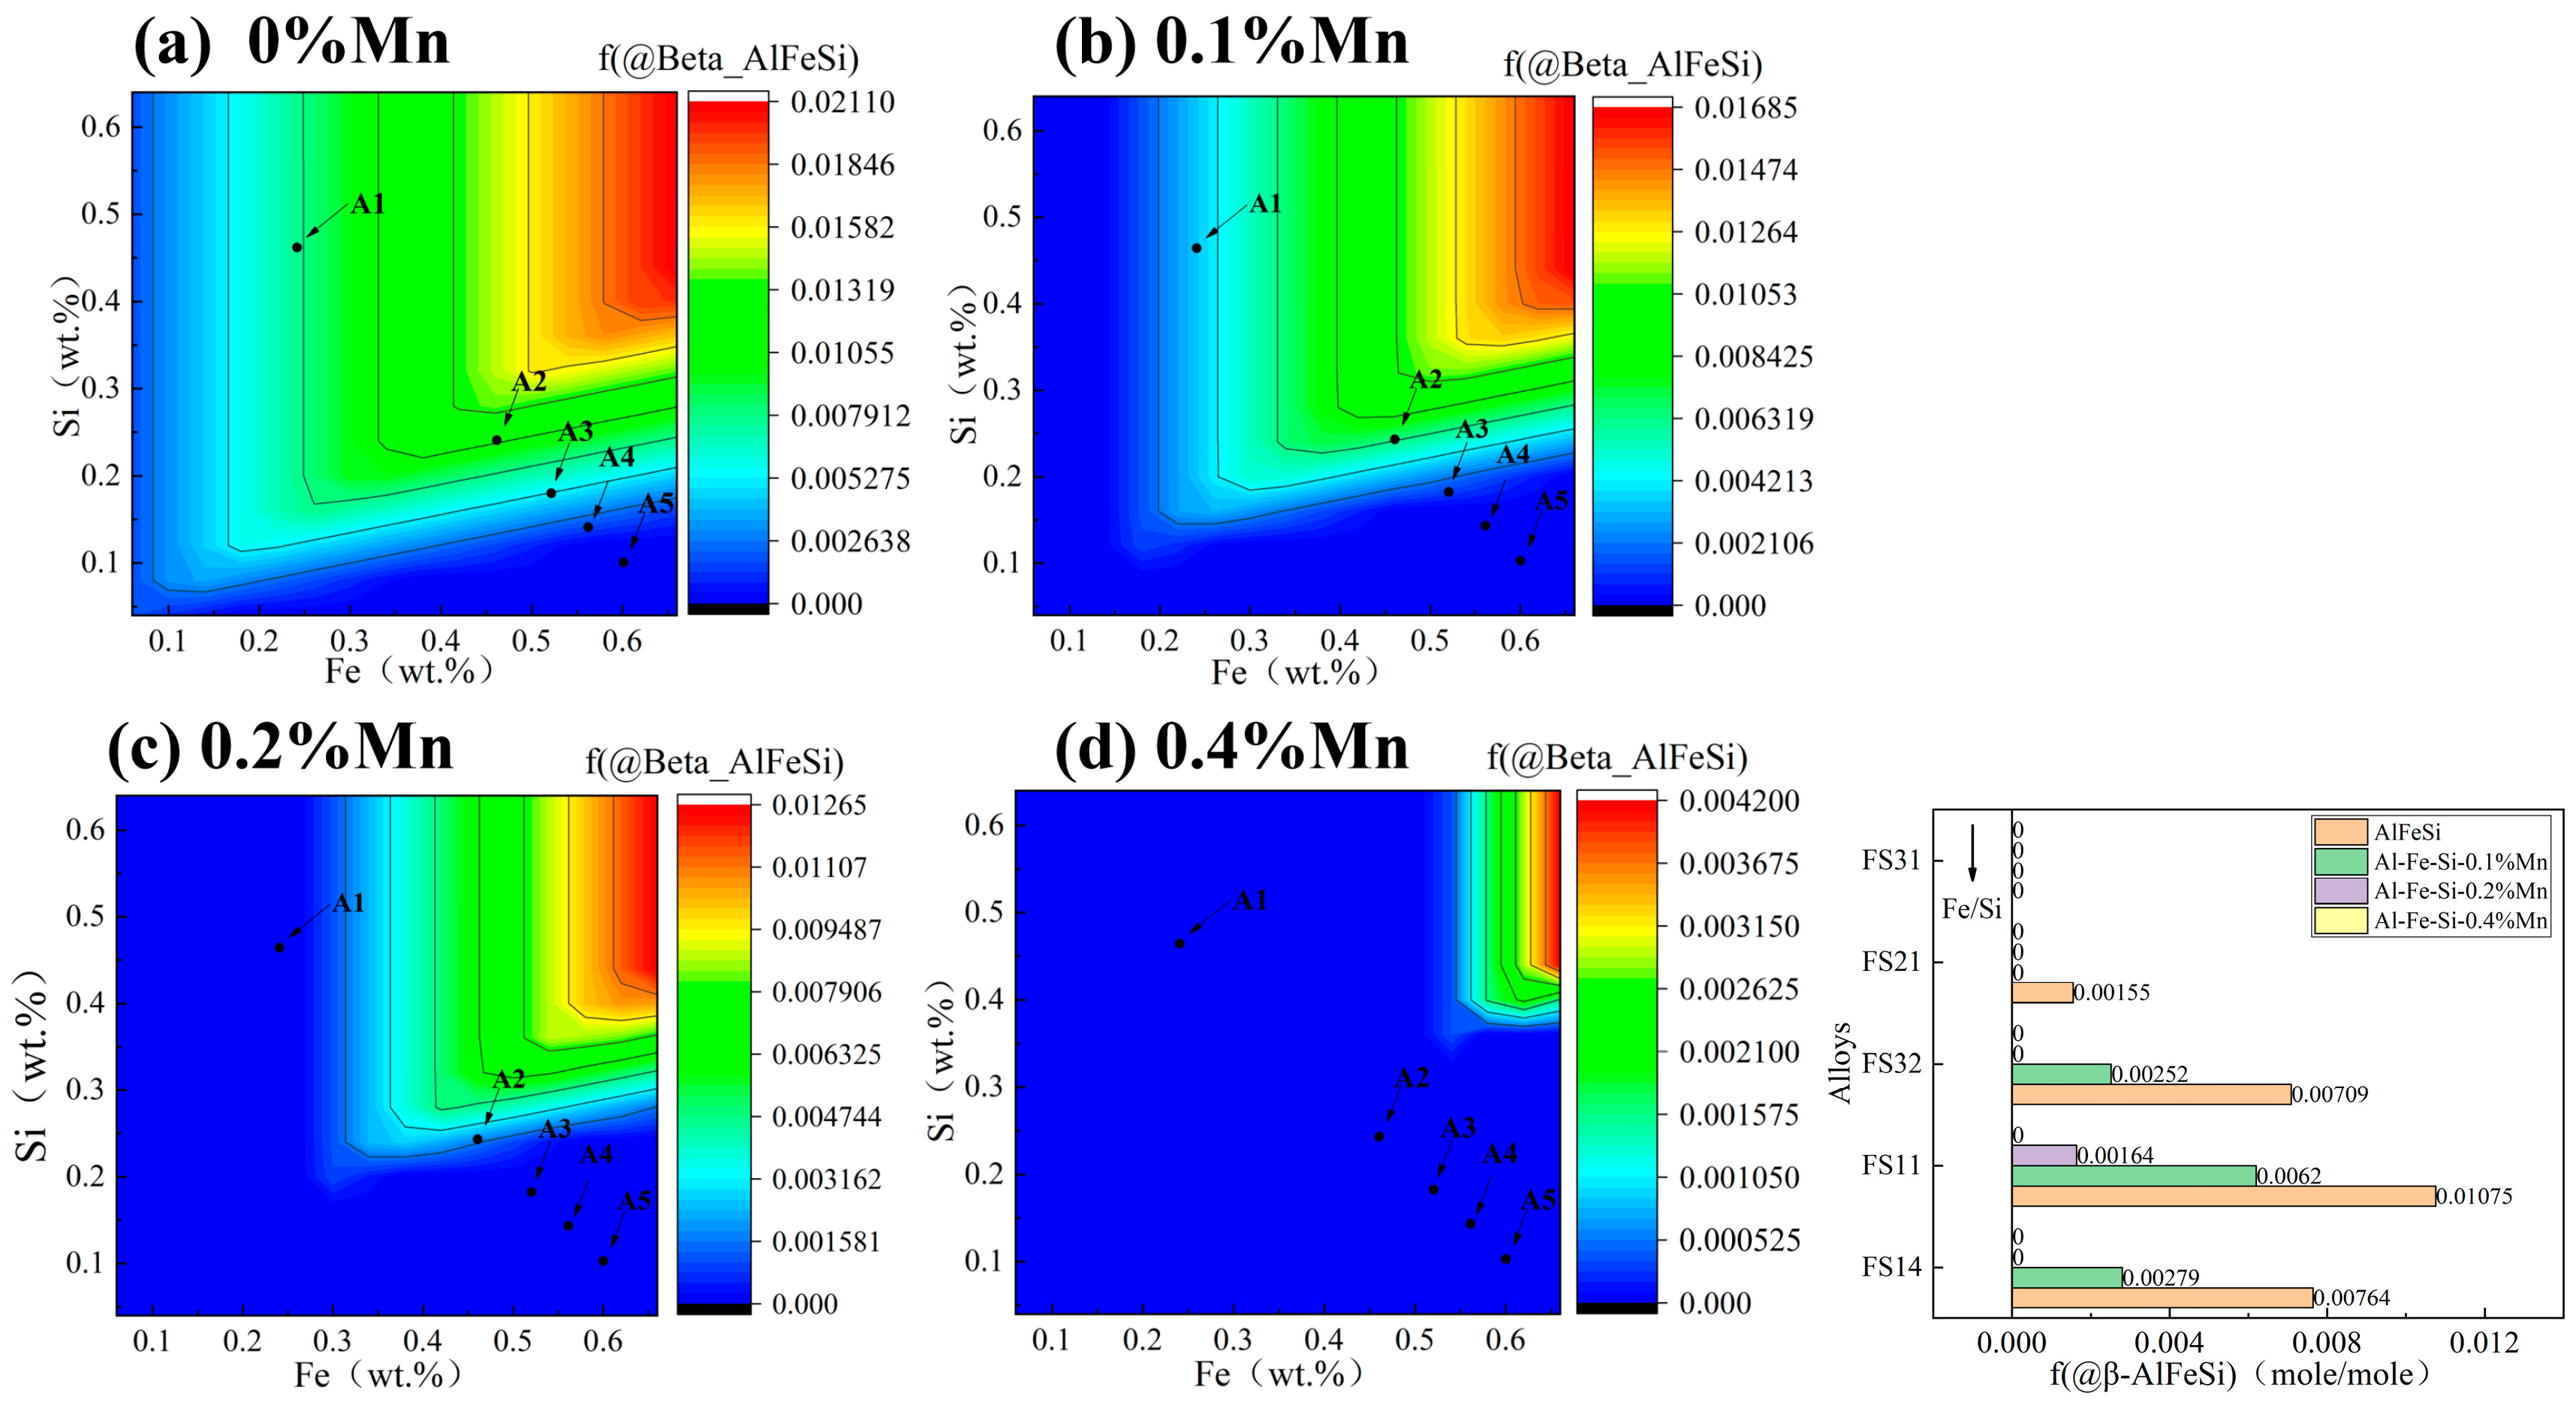
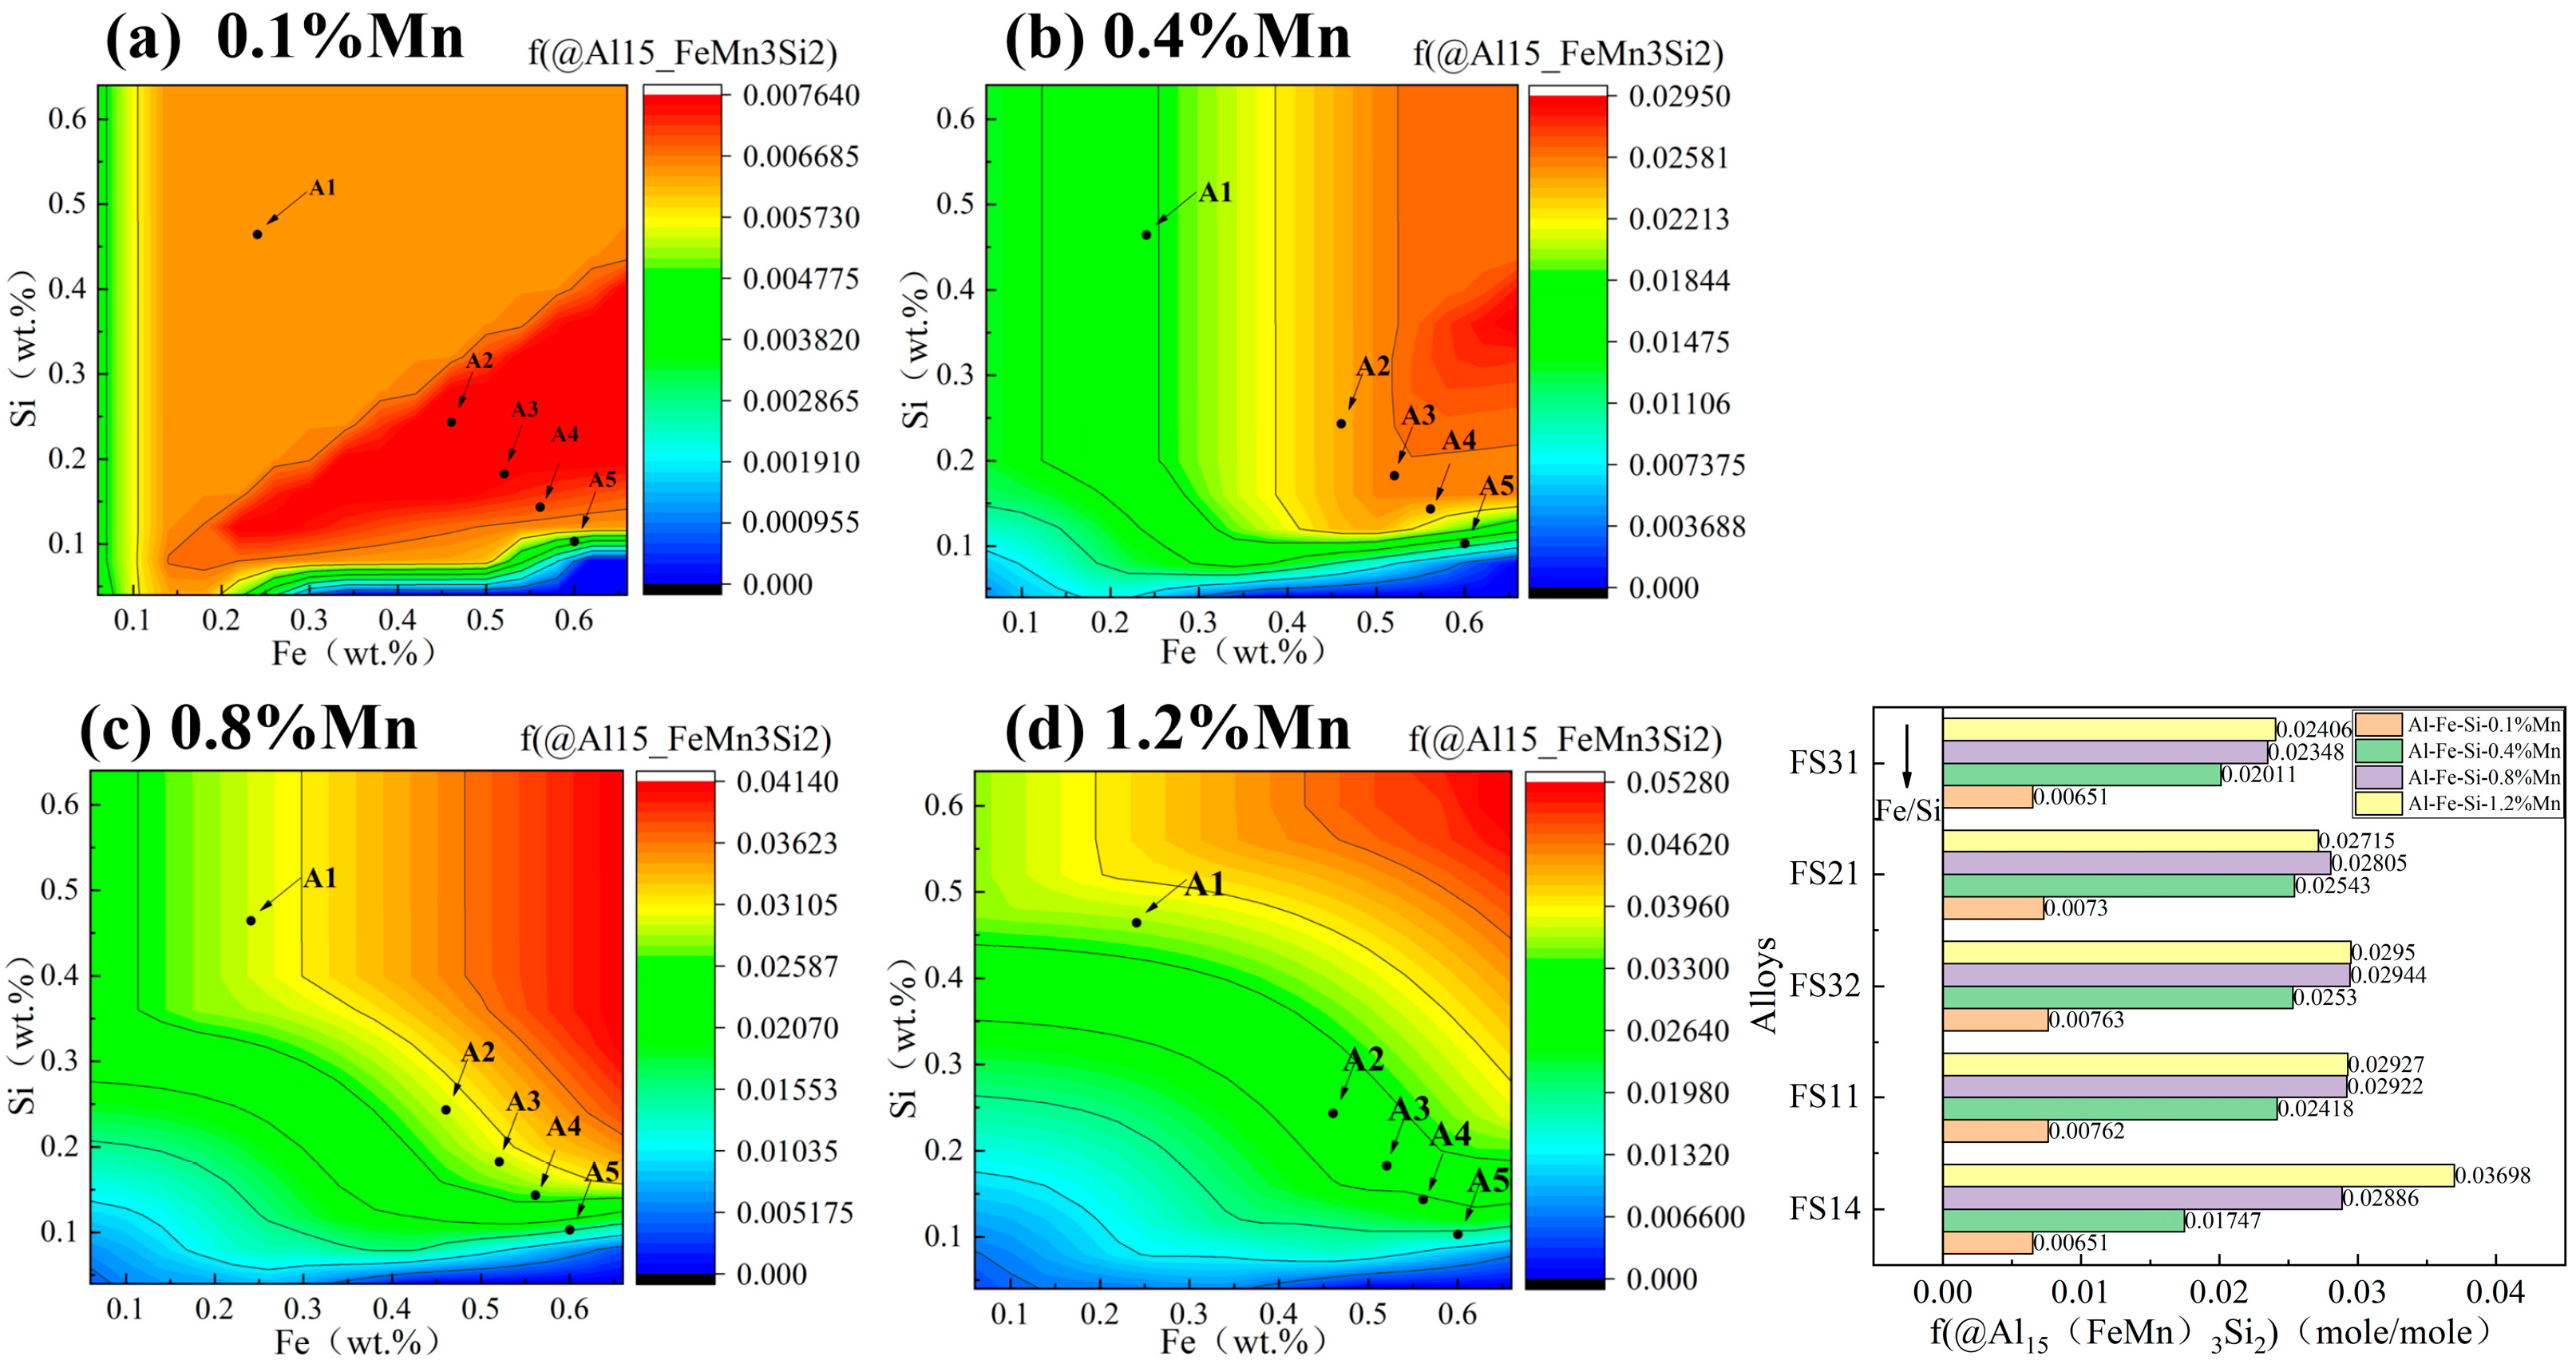
3.1. Contour Maps of Fe and Si Levels in Al-Fe-Si Alloys

A reasonable design of alloy composition to balance various microstructures and ensure that product performance meets standards is key to regulating the main composition of Al-Fe-Si alloys. In this work, the effect of Fe and Si levels on the formation of different Fe-rich phases in Al-Fe-Si alloys was systematically evaluated based on the CALPHAD calculations shown in Figure 3. Points A1, A2, A3, A4, and A5 represent the five different Fe/Si atomic ratios selected in this study. From Figure 3a,b, the α-AlFeSi phase mainly forms when the Fe content is higher than the Si content, while the β-AlFeSi phase can form when both Fe and Si elements are present; the values in the red squares indicate the precipitation of only the α-AlFeSi phase (Figure 3a) and the β-AlFeSi phase (Figure 3b) in Al-Fe-Si alloys during equilibrium solidification. In addition, as shown in Figure 3b, variations in Si content have little effect on the fraction of the β-AlFeSi phase when the Fe content remains constant. However, when the Si content remains constant, the fraction of the β-AlFeSi phase gradually increases with the rise in Fe content. This indicates that the primary alloying element influencing the formation of α-AlFeSi and β-AlFeSi phases is Fe rather than Si. To facilitate analysis of the influence of alloy composition on microstructure during phase equilibrium, the contour maps of the formation of the α-AlFeSi phase and β-AlFeSi phase are overlapped in Figure 3c, only α-AlFeSi and β-AlFeSi phases exist within the A and B regions, respectively. Figure 3d shows the trend of changes in α-AlFeSi and β-AlFeSi phases in alloys with different Fe and Si contents along a diagonal range of Fe + Si = 0.7% (wt.%) from region A to region B in Figure 3c. The Fe content (wt.%) increases from 0.02%, and the Si content (wt.%) decreases from 0.68%, with a point interval of 0.02%, resulting in a total of 34 alloy groups. Al-Fe-Si alloys with different Fe-rich phases can be developed by selecting the appropriate compositions of Fe and Si elements. Hence, five alloys in Figure 3 were chosen based on the contour maps of Fe and Si levels generated by Pandat software. The nominal Fe/Si atomic ratios, actual compositions, and Fe-rich phases present in the five alloys are shown in Table 1. FS14 (the atomic ratio of Fe to Si is 1:4) and FS31 alloy only contain the β-AlFeSi phase and the α-AlFeSi phase, respectively. The fraction of the β-AlFeSi phase in FS11 alloy is higher than that of the α-AlFeSi phase; the fractions of the two phases in FS32 alloy are equal and the fraction of the α-AlFeSi phase in FS21 alloy is higher than that of the β-AlFeSi phase.

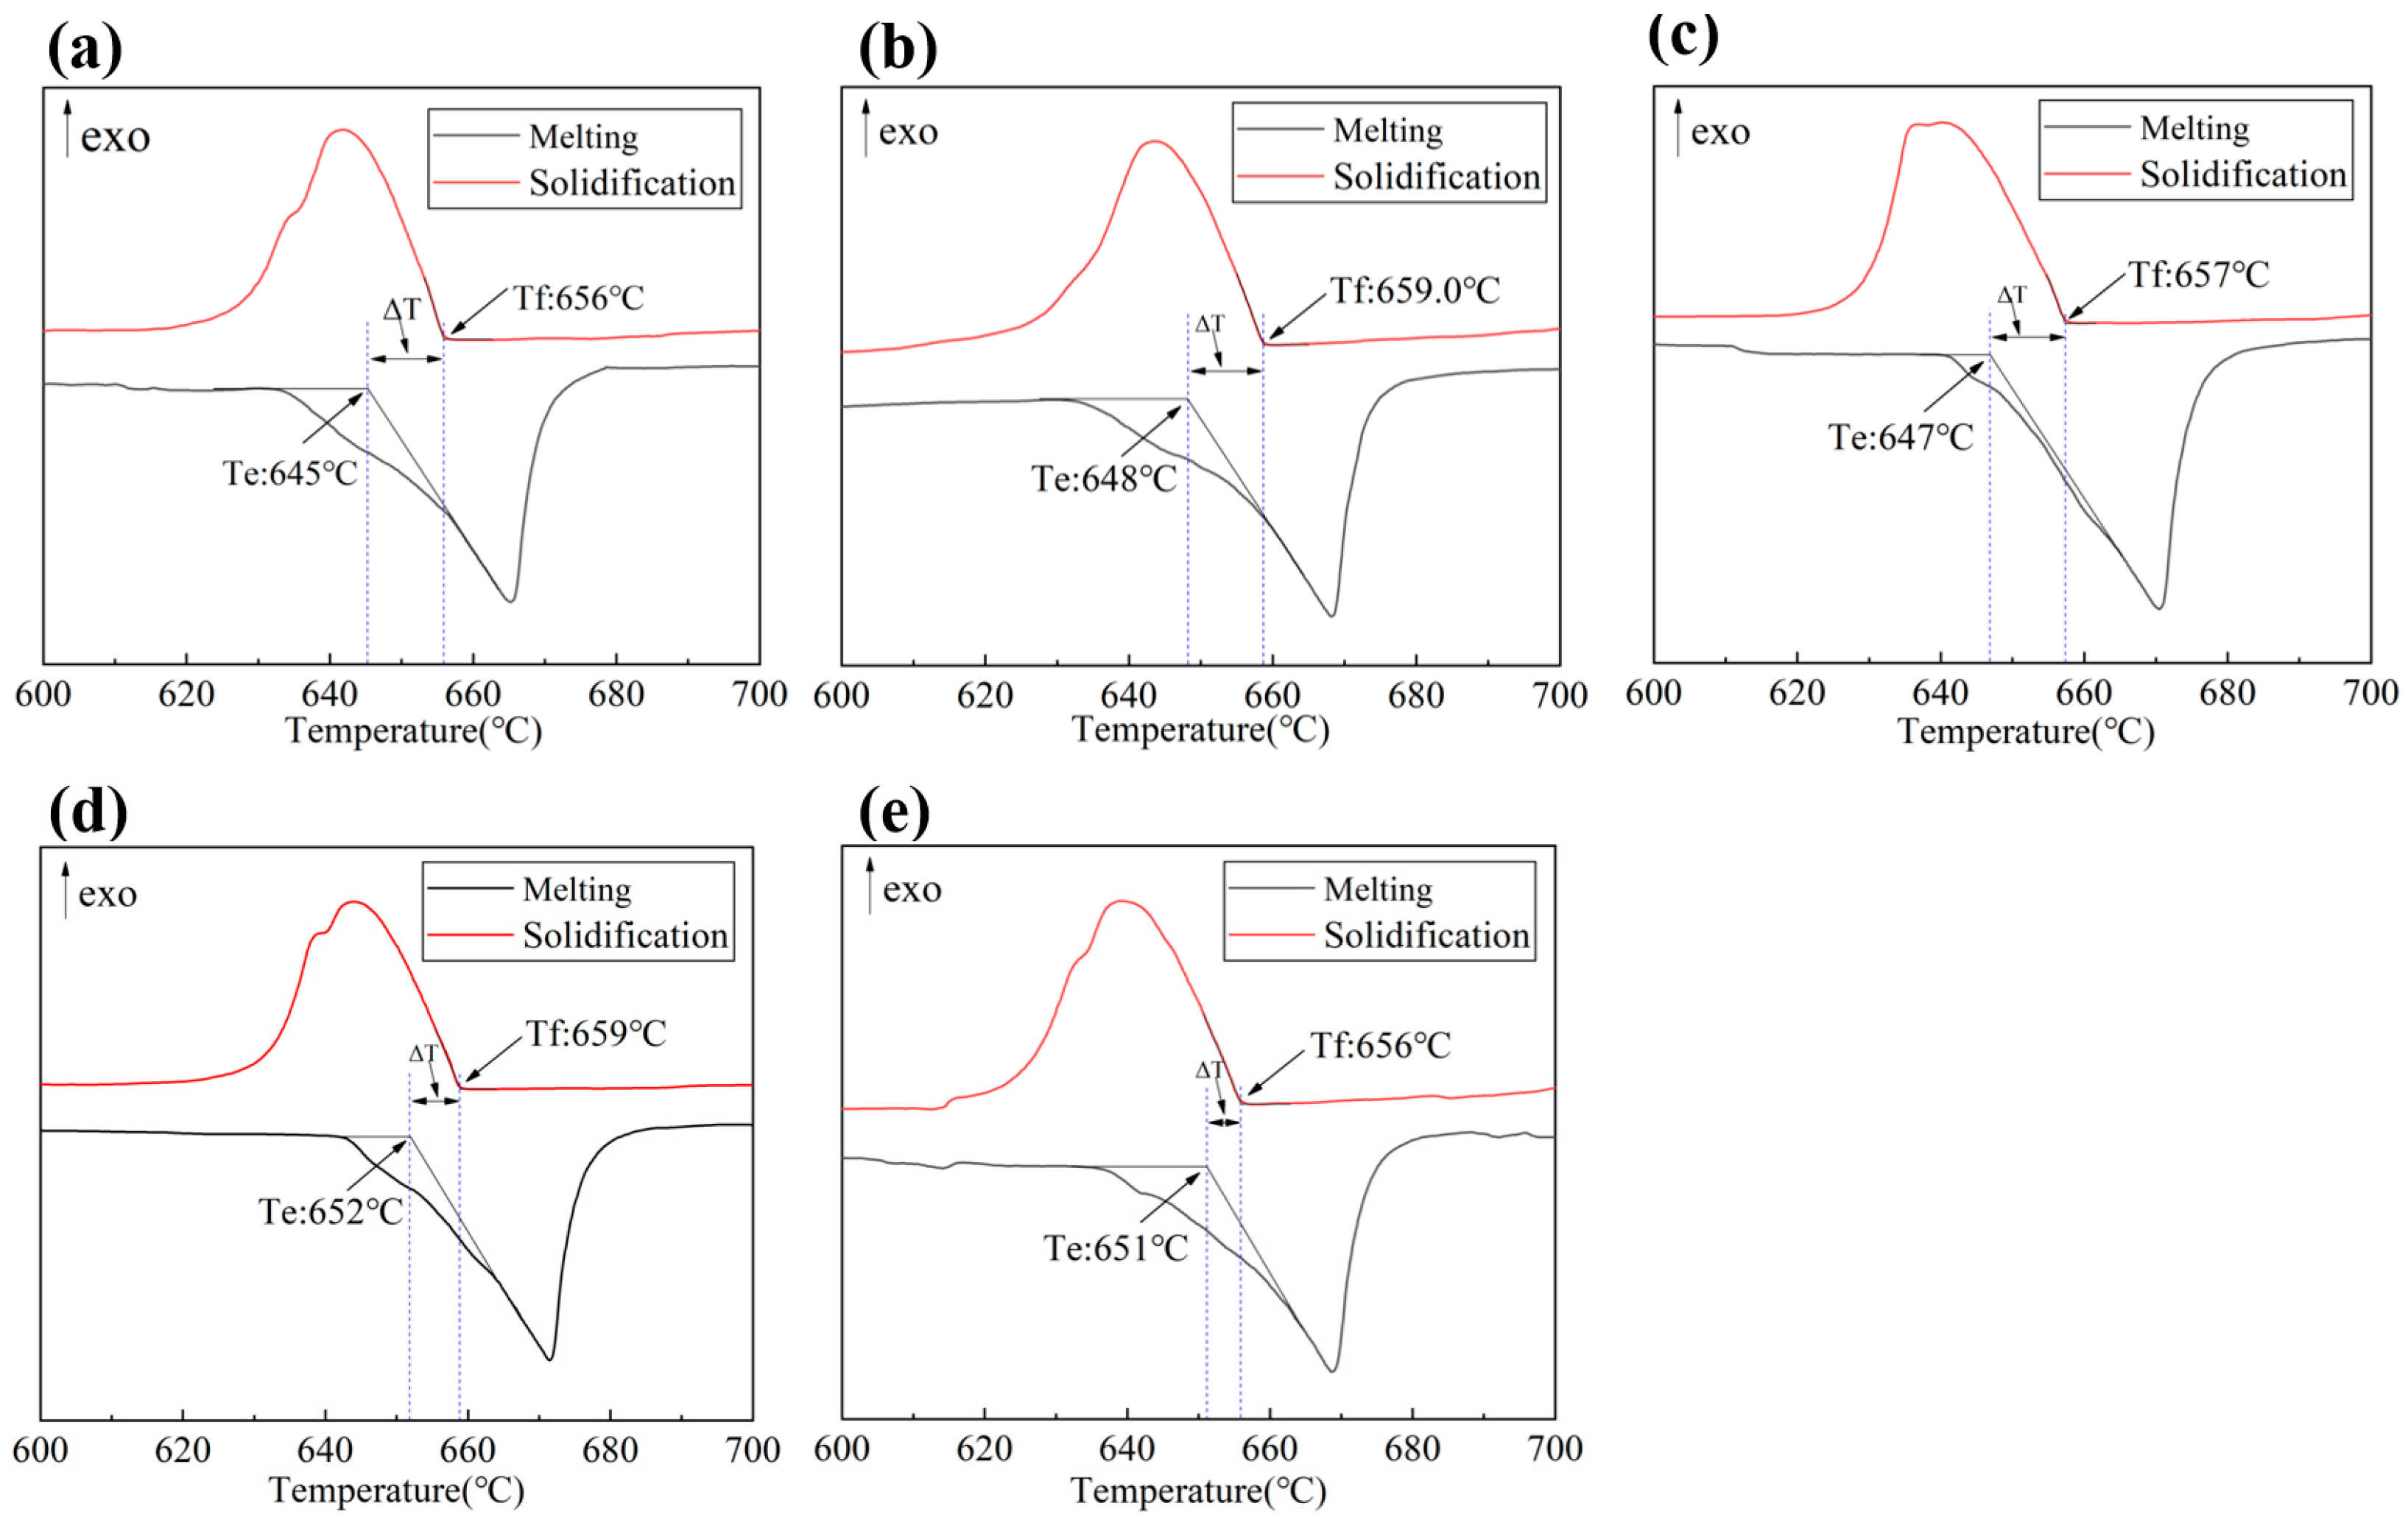
3.2. The DSC Curves of the Five Experimental Alloys

Thermodynamic properties’ changes take place during the solidification. Therefore, thermal analysis can be used to assist in analyzing the phase transformation process of alloys’ solidification. This section uses DSC (Differential Scanning Calorimetry) to analyze the CTR (crystallization temperature range) of the alloys. The CTR value of the alloys influence the solidified microstructure and surface segregation. Figure 4a–e present DSC curves of five Al-Fe-Si alloys. The CTR values were determined from the difference between the exothermic peak starting point and the tangent intersection of the starting point of the endothermic peak. The DSC curves show that the FS14 alloy exhibits an endothermic peak related to phase transition at 656 °C and an exothermic peak at 645 °C. Correspondingly, the FS11, FS32, FS21, and FS31 alloys exhibit four endothermic peaks related to phase transitions at 659.0 °C, 657 °C, 659 °C, and 656 °C, and four exothermic peaks at 648 °C, 647 °C, 652 °C, and 651 °C, respectively. The CTRs of Al-Fe-Si alloys with different Fe/Si atomic ratios are 11 °C, 11 °C, 10 °C, 7.0 °C, and 5 °C respectively. The CTR values of the designed alloys show a decreasing trend after the Fe/Si atomic ratio reaches 1:1. Based on the Al-Si and Al-Fe phase diagrams, when the ratio of Fe element to Si element is relatively small (wtFe + wtSi = 0.7%), the change in CTR caused by the increase in Si element content is greater, compared with the change in CTR caused by the same amount increase in Fe element [35]. Hence, the Si element tends to increase the CTR of Al-Fe-Si alloys, while the Fe element tends to reduce the CTR of Al-Fe-Si alloys.

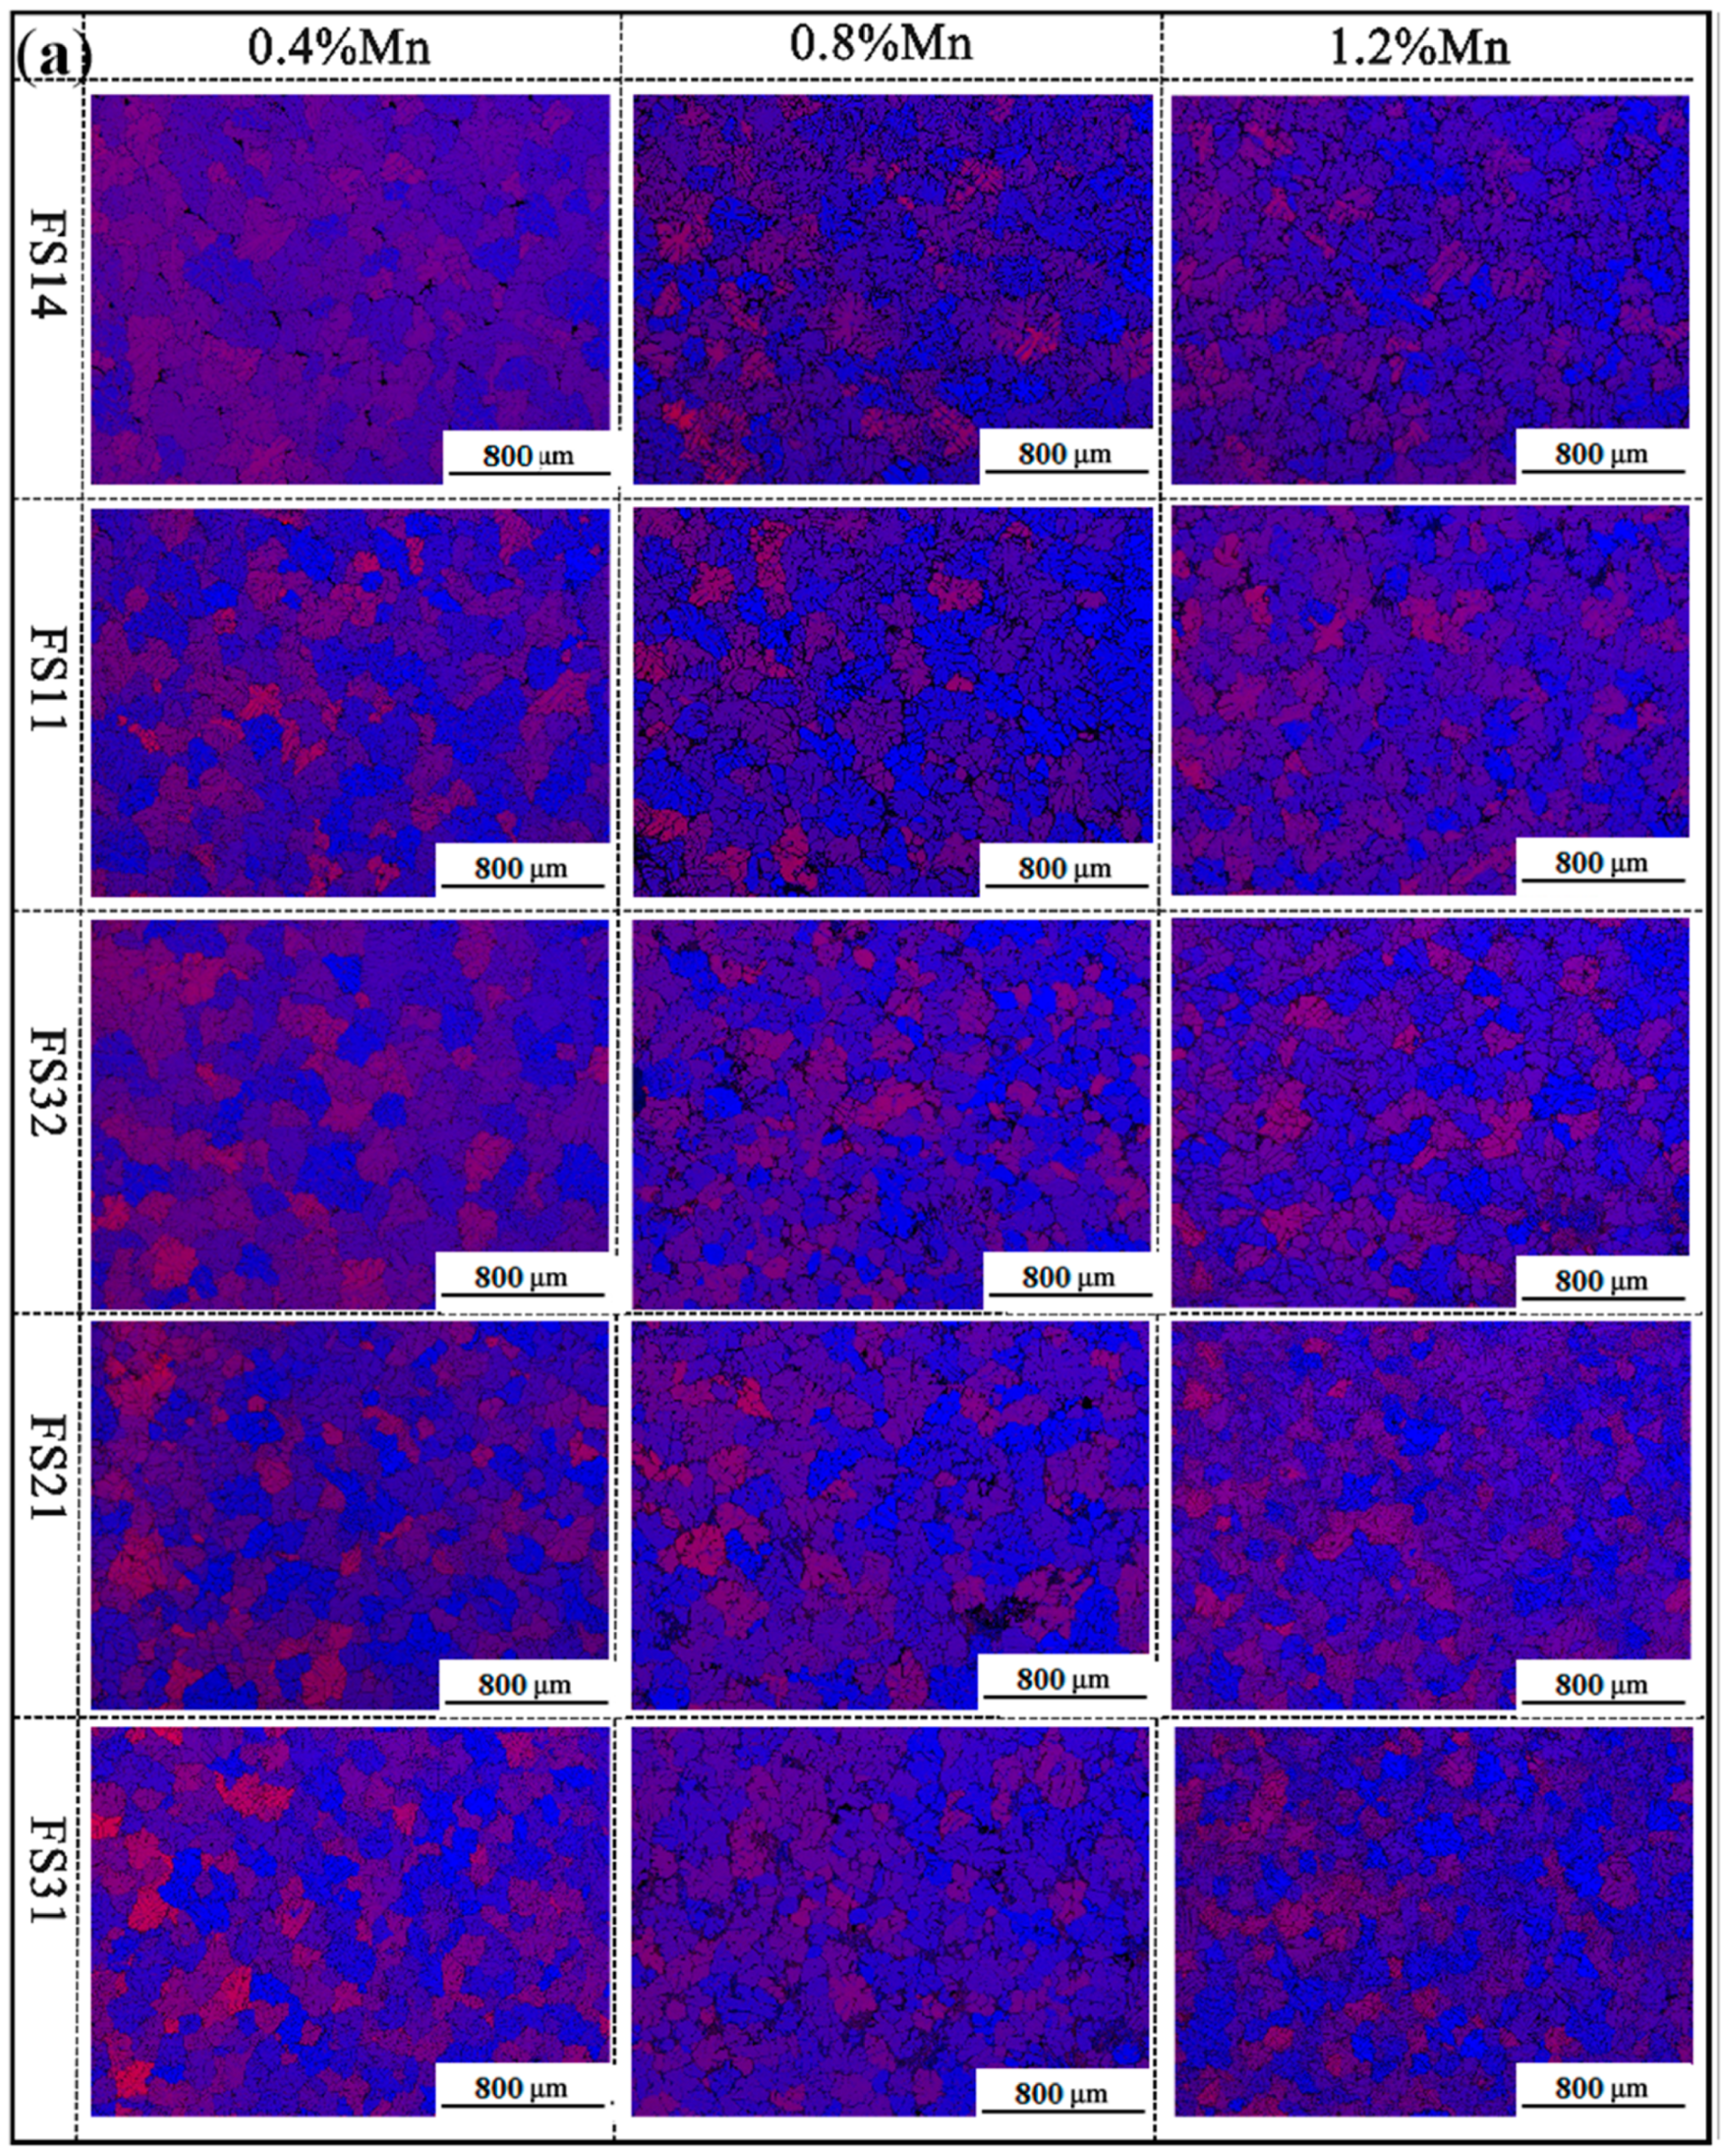
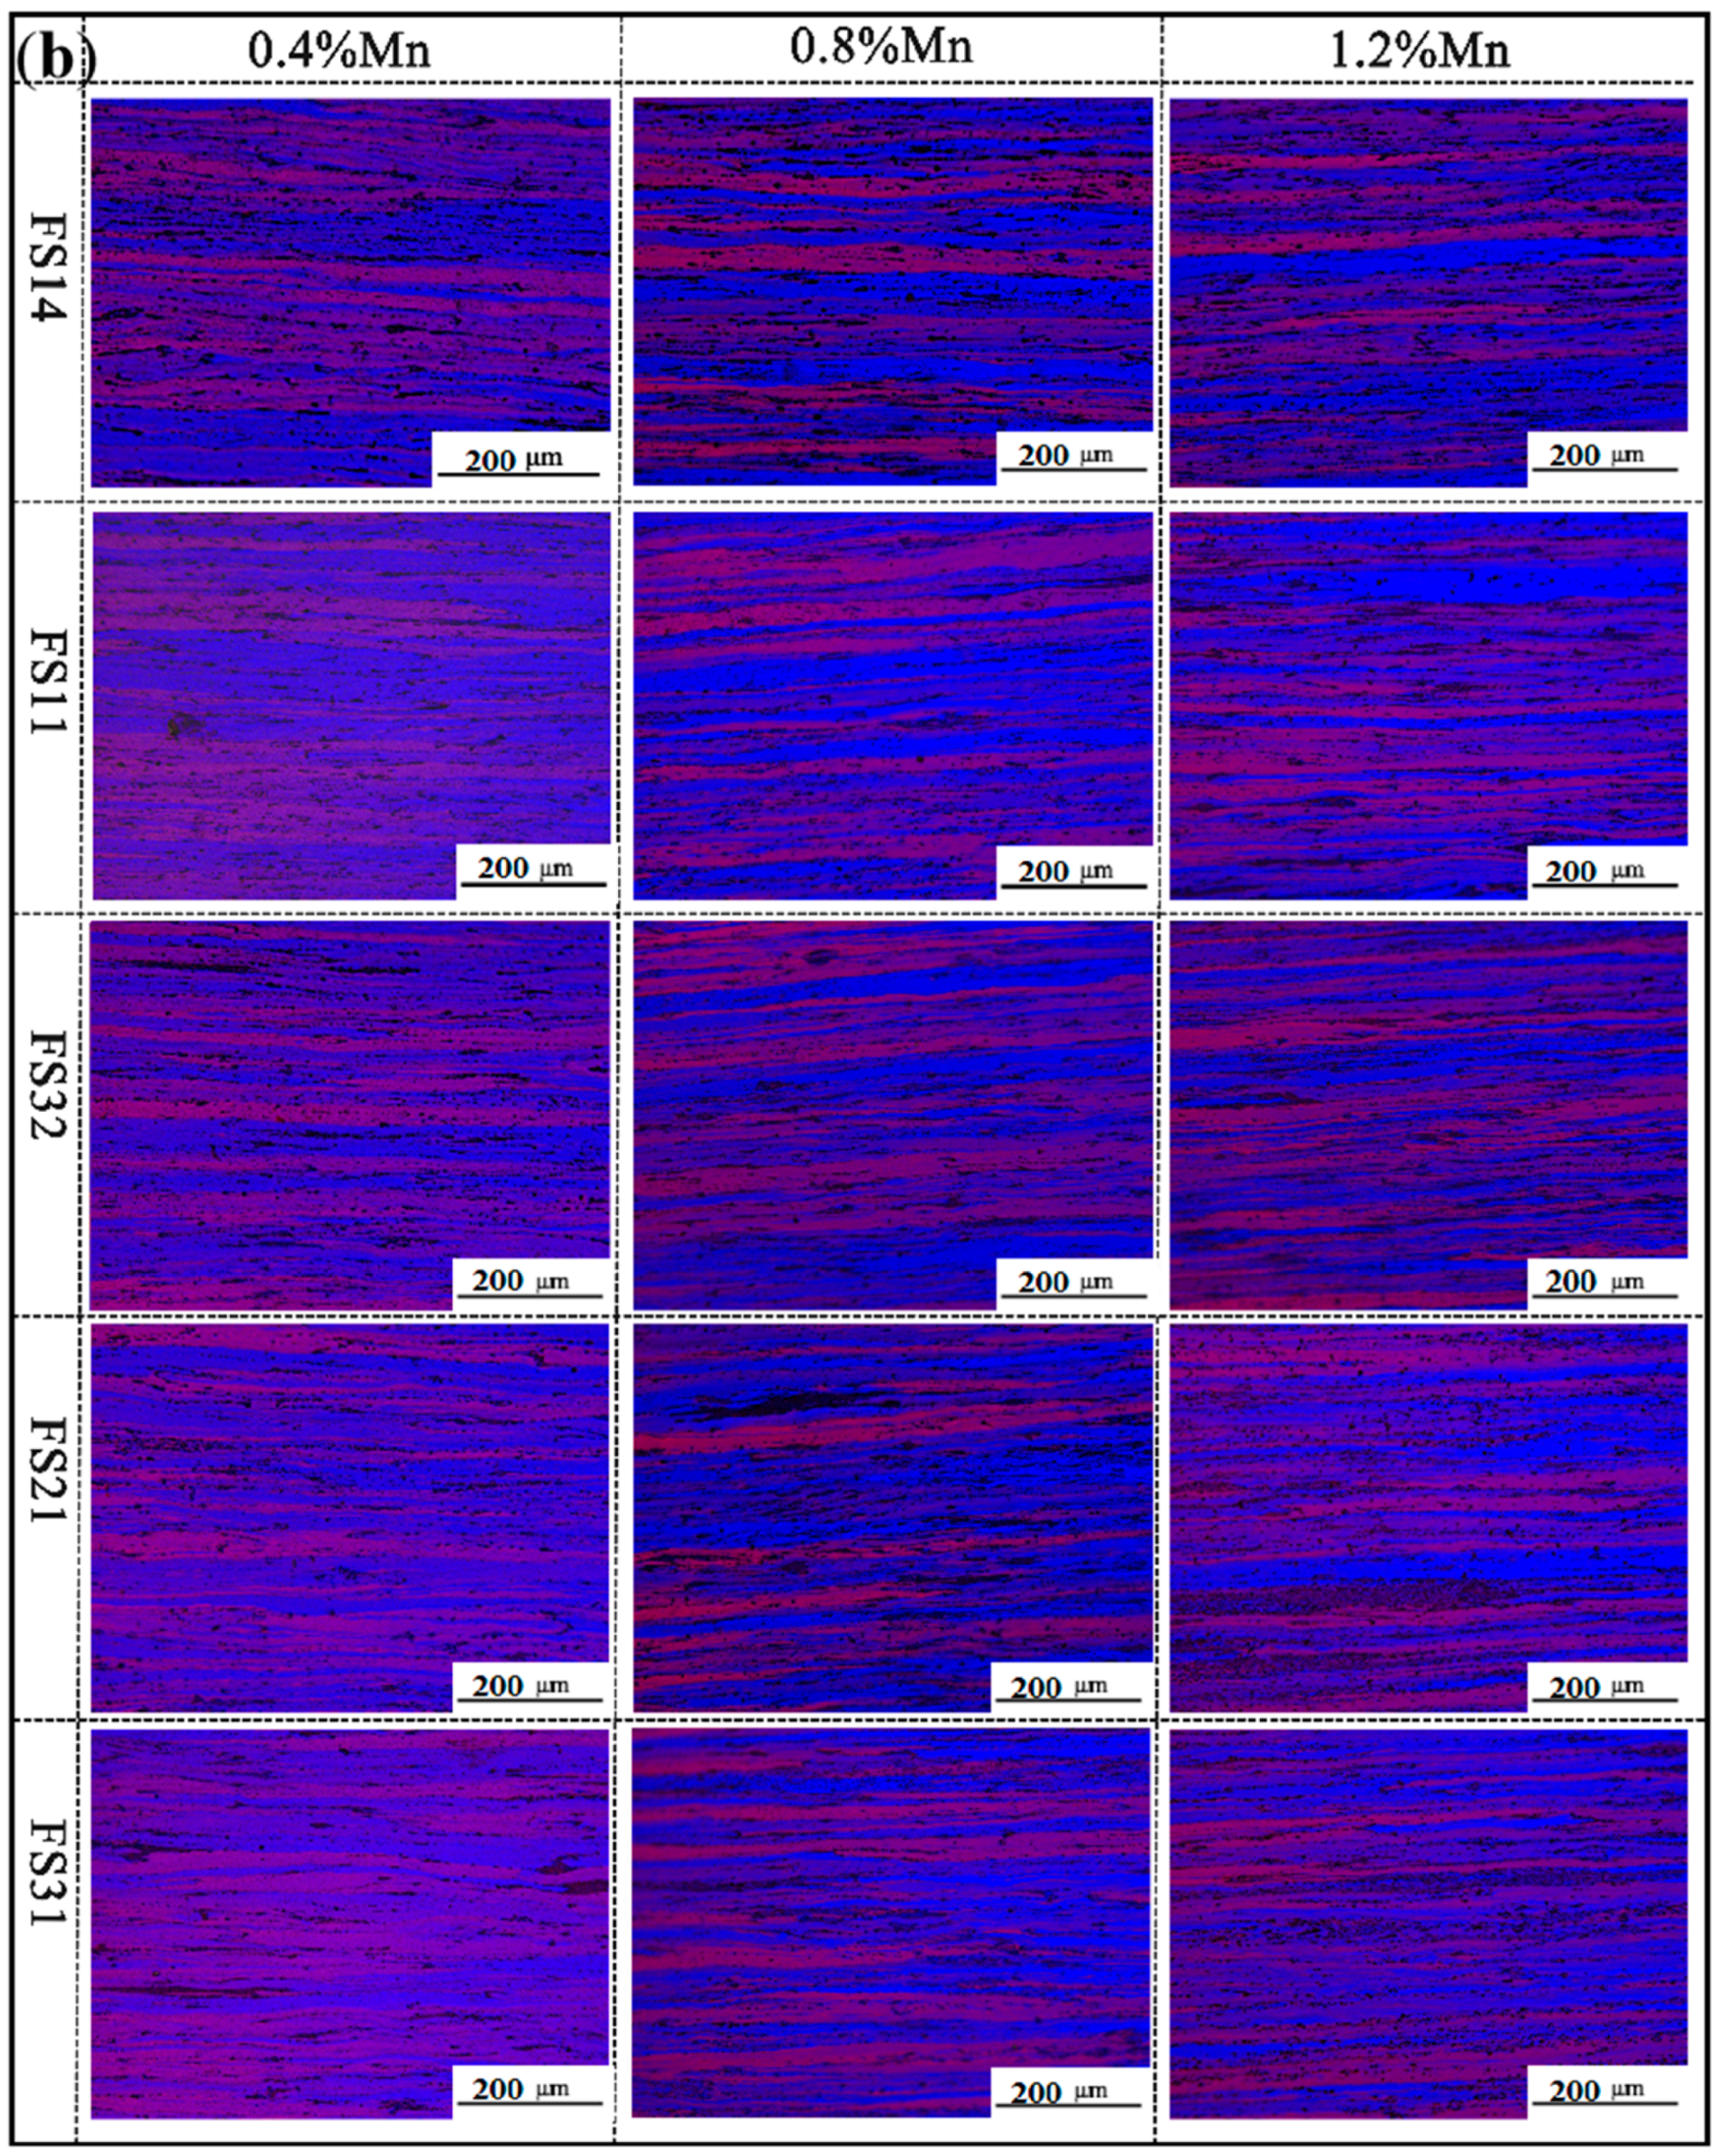
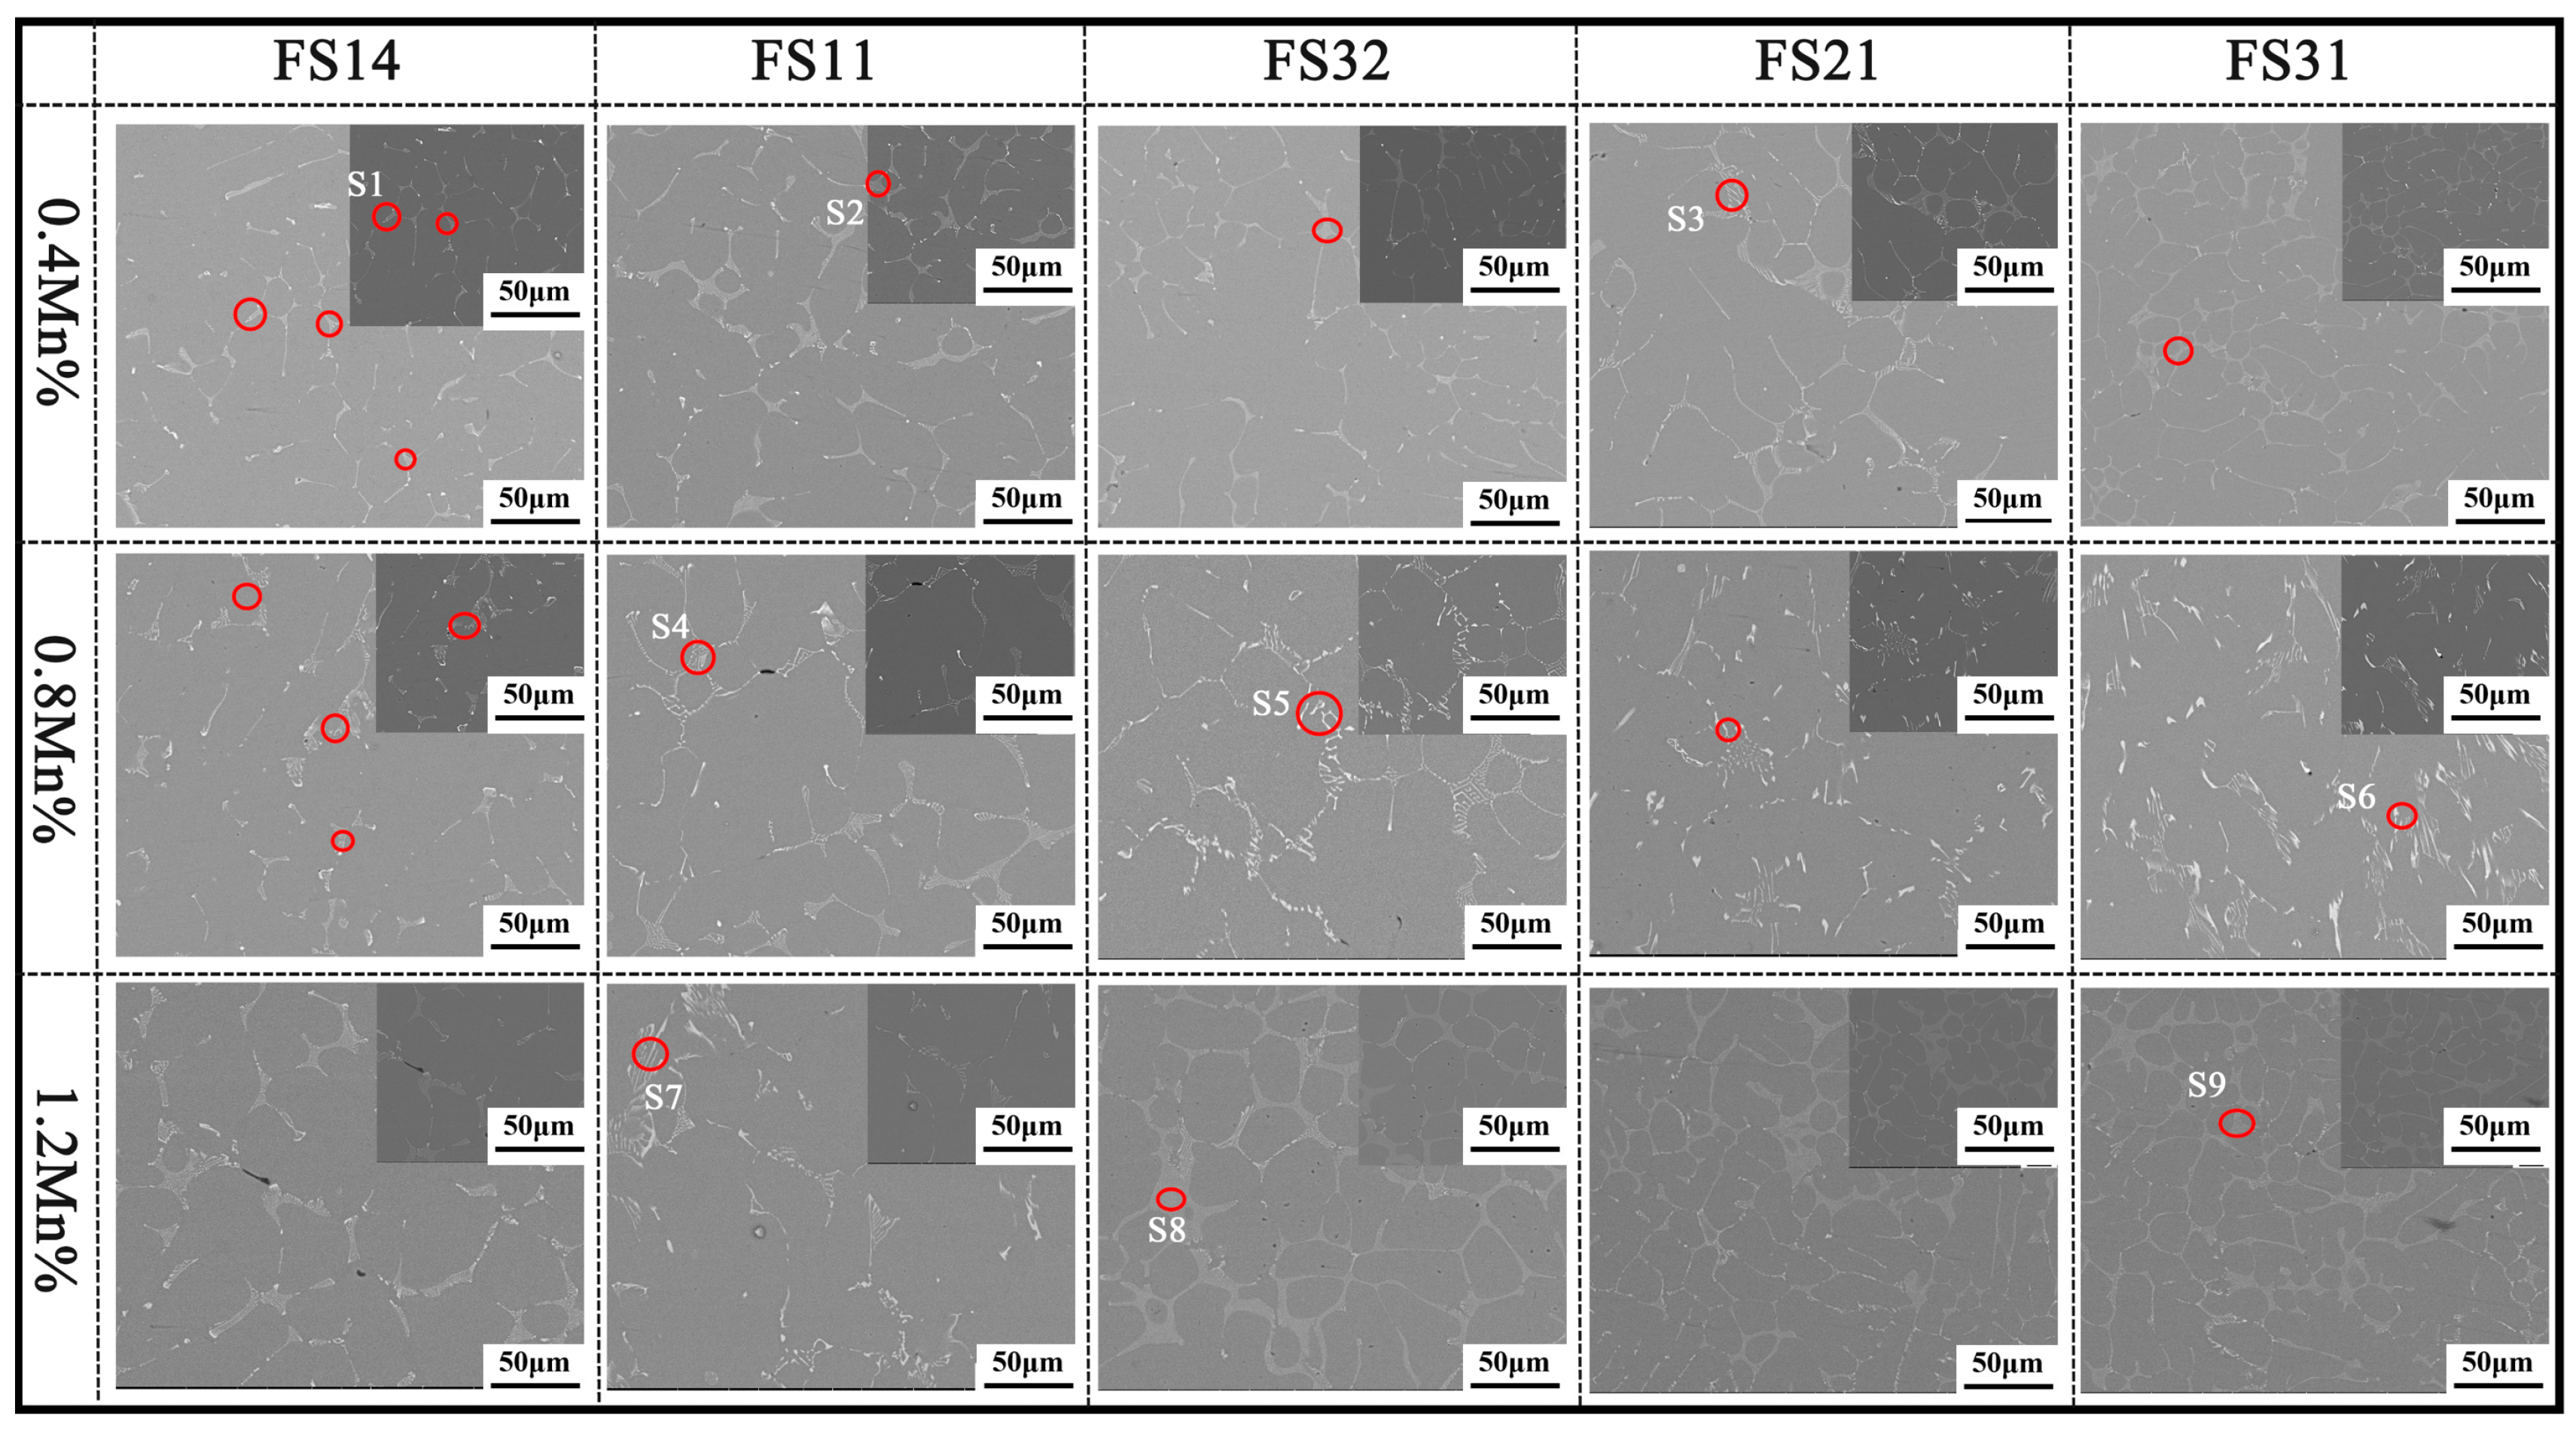
3.3. The Microstructure

Figure 5 depicts polarized-light optical micrographs of the designed Al-Fe-Si continuous casted ingots with different Fe/Si atomic ratios. The experimental casted ingots exhibit bulk grains with a dendritic structure. There is evident dendritic segregation within the grains, and the grain size is uneven. As the Fe content increases and the Si content decreases, there is a trend of reduced dendrite segregation in the alloy continuous casted ingots, indicating that Si is the main cause of dendrite segregation in Al-Fe-Si alloys. Therefore, reducing the Si content and increasing the Fe content can mitigate dendrite segregation, according to the SDAS coarsening model [36]. Combined with DSC curves of the five experimental alloys, it reveals that segregation reduces as the CTR value decreases. The structures of these casted ingots do not show significant changes with the adjustment of the Fe/Si ratio, and their grain size did not change significantly, as shown in Figure 5f. This reveals that the grains of Al-Fe-Si continuous casted ingots are less affected by variations in Fe and Si levels. That is, the type and content of the second phase in Al-Fe-Si alloys do not affect the grain size of the alloy continuous casted ingots. Figure 6 shows that the second phase structure in Al-Fe-Si alloy continuous casted ingots presents in three forms: fine fibrous, skeletal, and punctate. In Figure 6a, the Fe/Si atomic ratio is relatively small; the fine fibrous second phase is analyzed to be the β-AlFeSi phase based on the Pandat calculation results in this work. In Figure 6b–e, there are two-dimensional geometric features of the skeletal α-AlFeSi phase, with a significant increase in the Fe/Si atomic ratio. The skeletal second phase is analyzed to be the α-AlFeSi phase based on the Pandat calculation results. Using the same method, the point or spherical shapes of the second phase in Figure 6d,e are also determined to be the α-AlFeSi phase.
Figure 7 shows the SEM images and surface segregation layer thickness of Al-Fe-Si alloy continuous casted ingots with different Fe/Si atomic ratios. The second phase of the surface segregation of the continuous casted ingots in Figure 7a is a fine fibrous phase, being the same as the internal second phase, which is the β-AlFeSi phase. In Figure 7b,c, there are two types of phases present on the surface of the continuous casted ingots: a fine fibrous and a skeletal phase, with the skeletal second phase being the dominant one. In Figure 7d,e, the second phase of the surface segregation on the continuous casted ingots is a coarse skeletal phase, identified as the α-AlFeSi phase. The thickness of the segregation layer on the continuous casted ingots’ surface increases with the rising Fe content. This is due to the increase in the fraction of Fe-rich phases, leading to a gradual rise in the number and density of the second phase structures on the surface. In aluminum alloys, the β-AlFeSi phase can split the matrix, leading to defects such as pinholes during multiple rolling passes of the continuous casted ingots. Therefore, the presence of a large amount of β phase on the surface and inside the sample should be avoided to prevent negative impacts on the surface quality and mechanical properties of the continuous casted ingots.

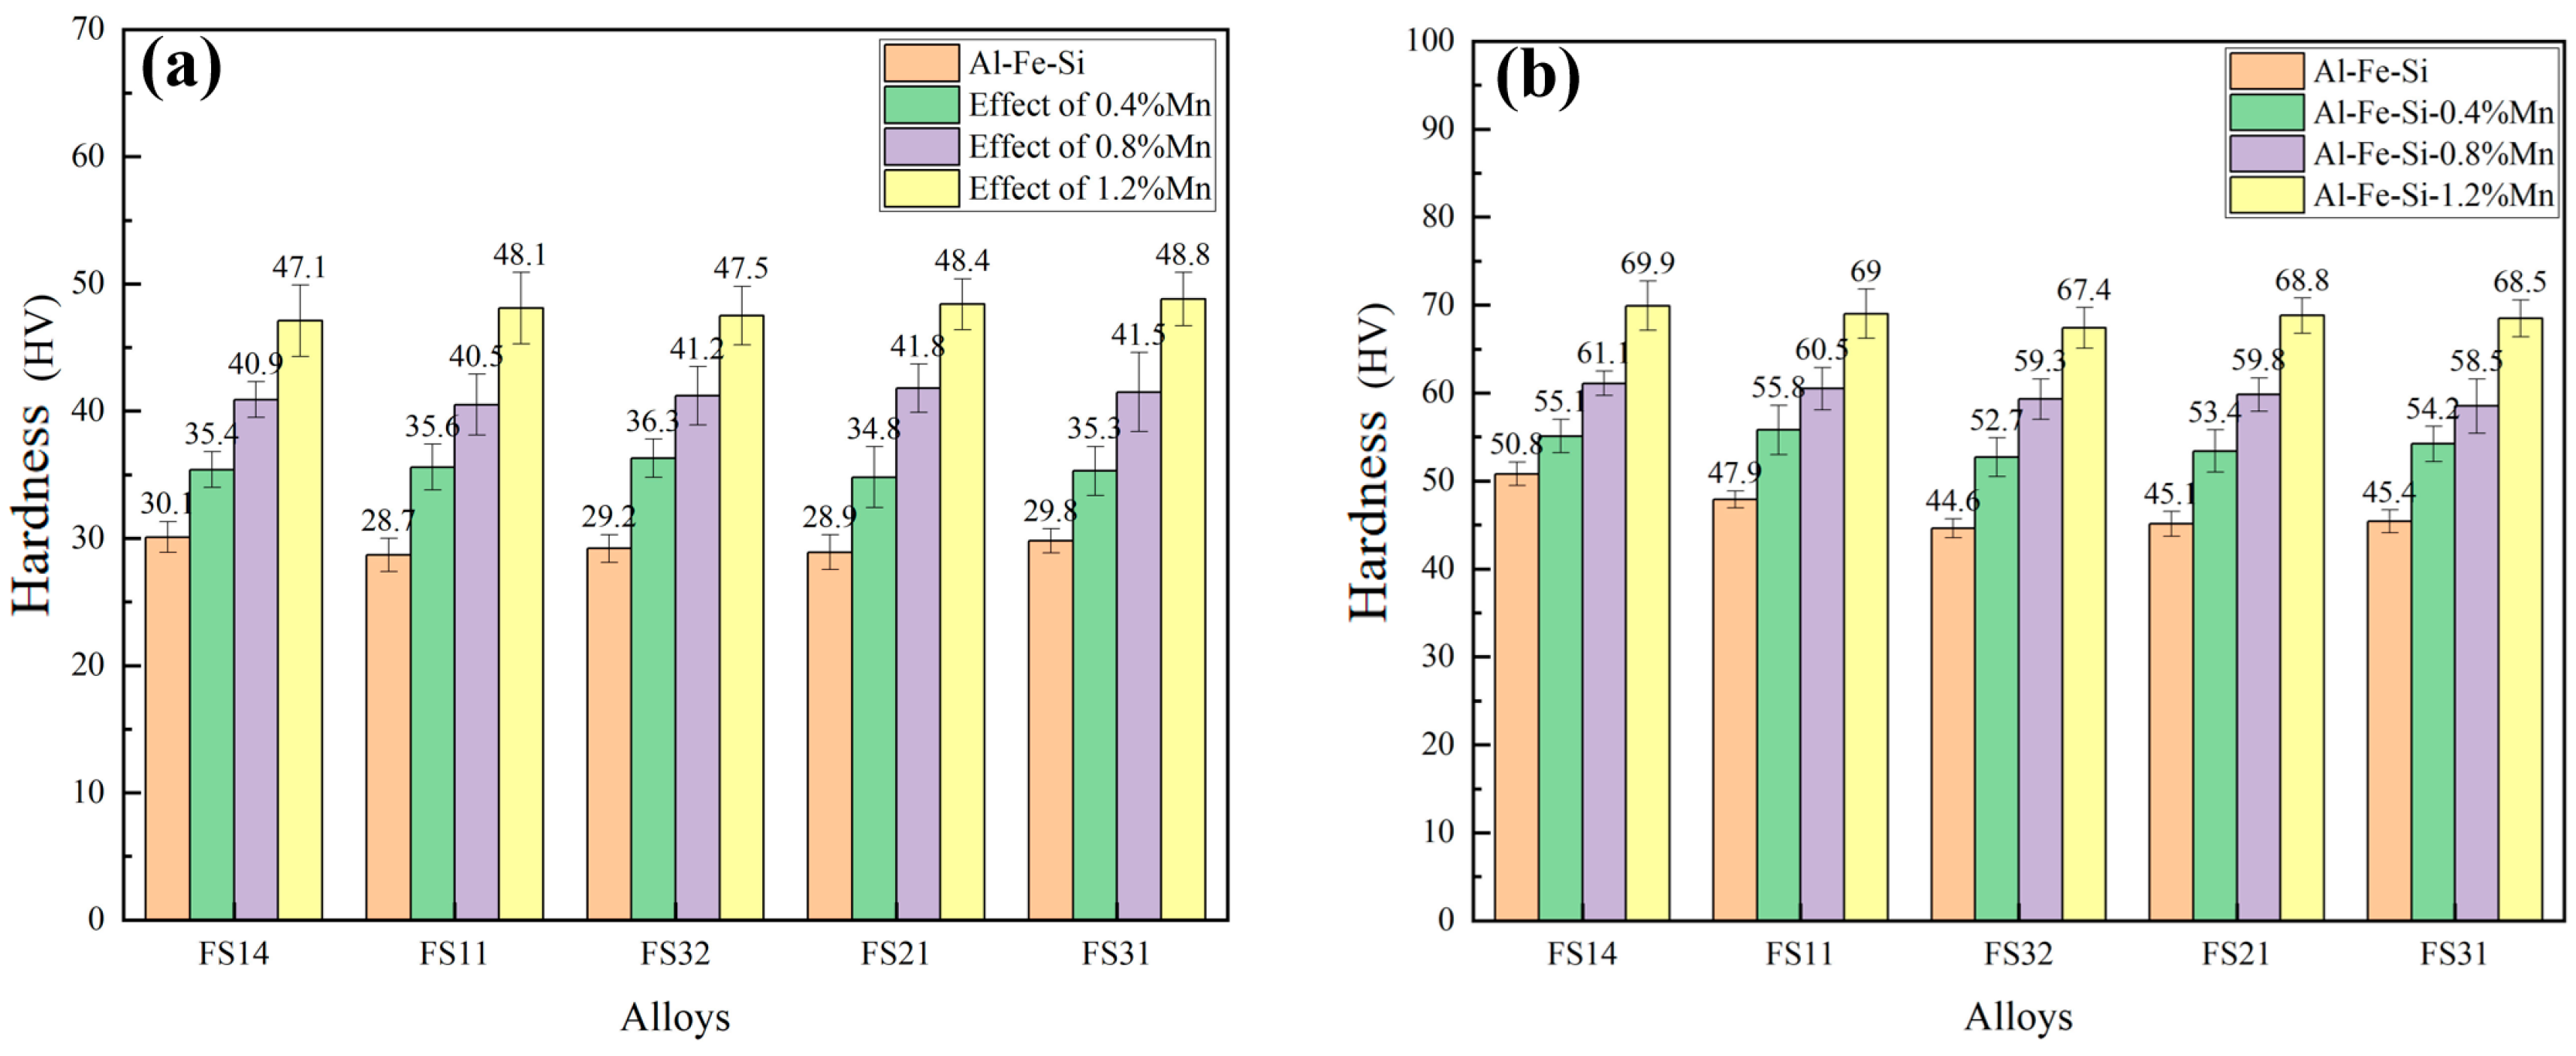
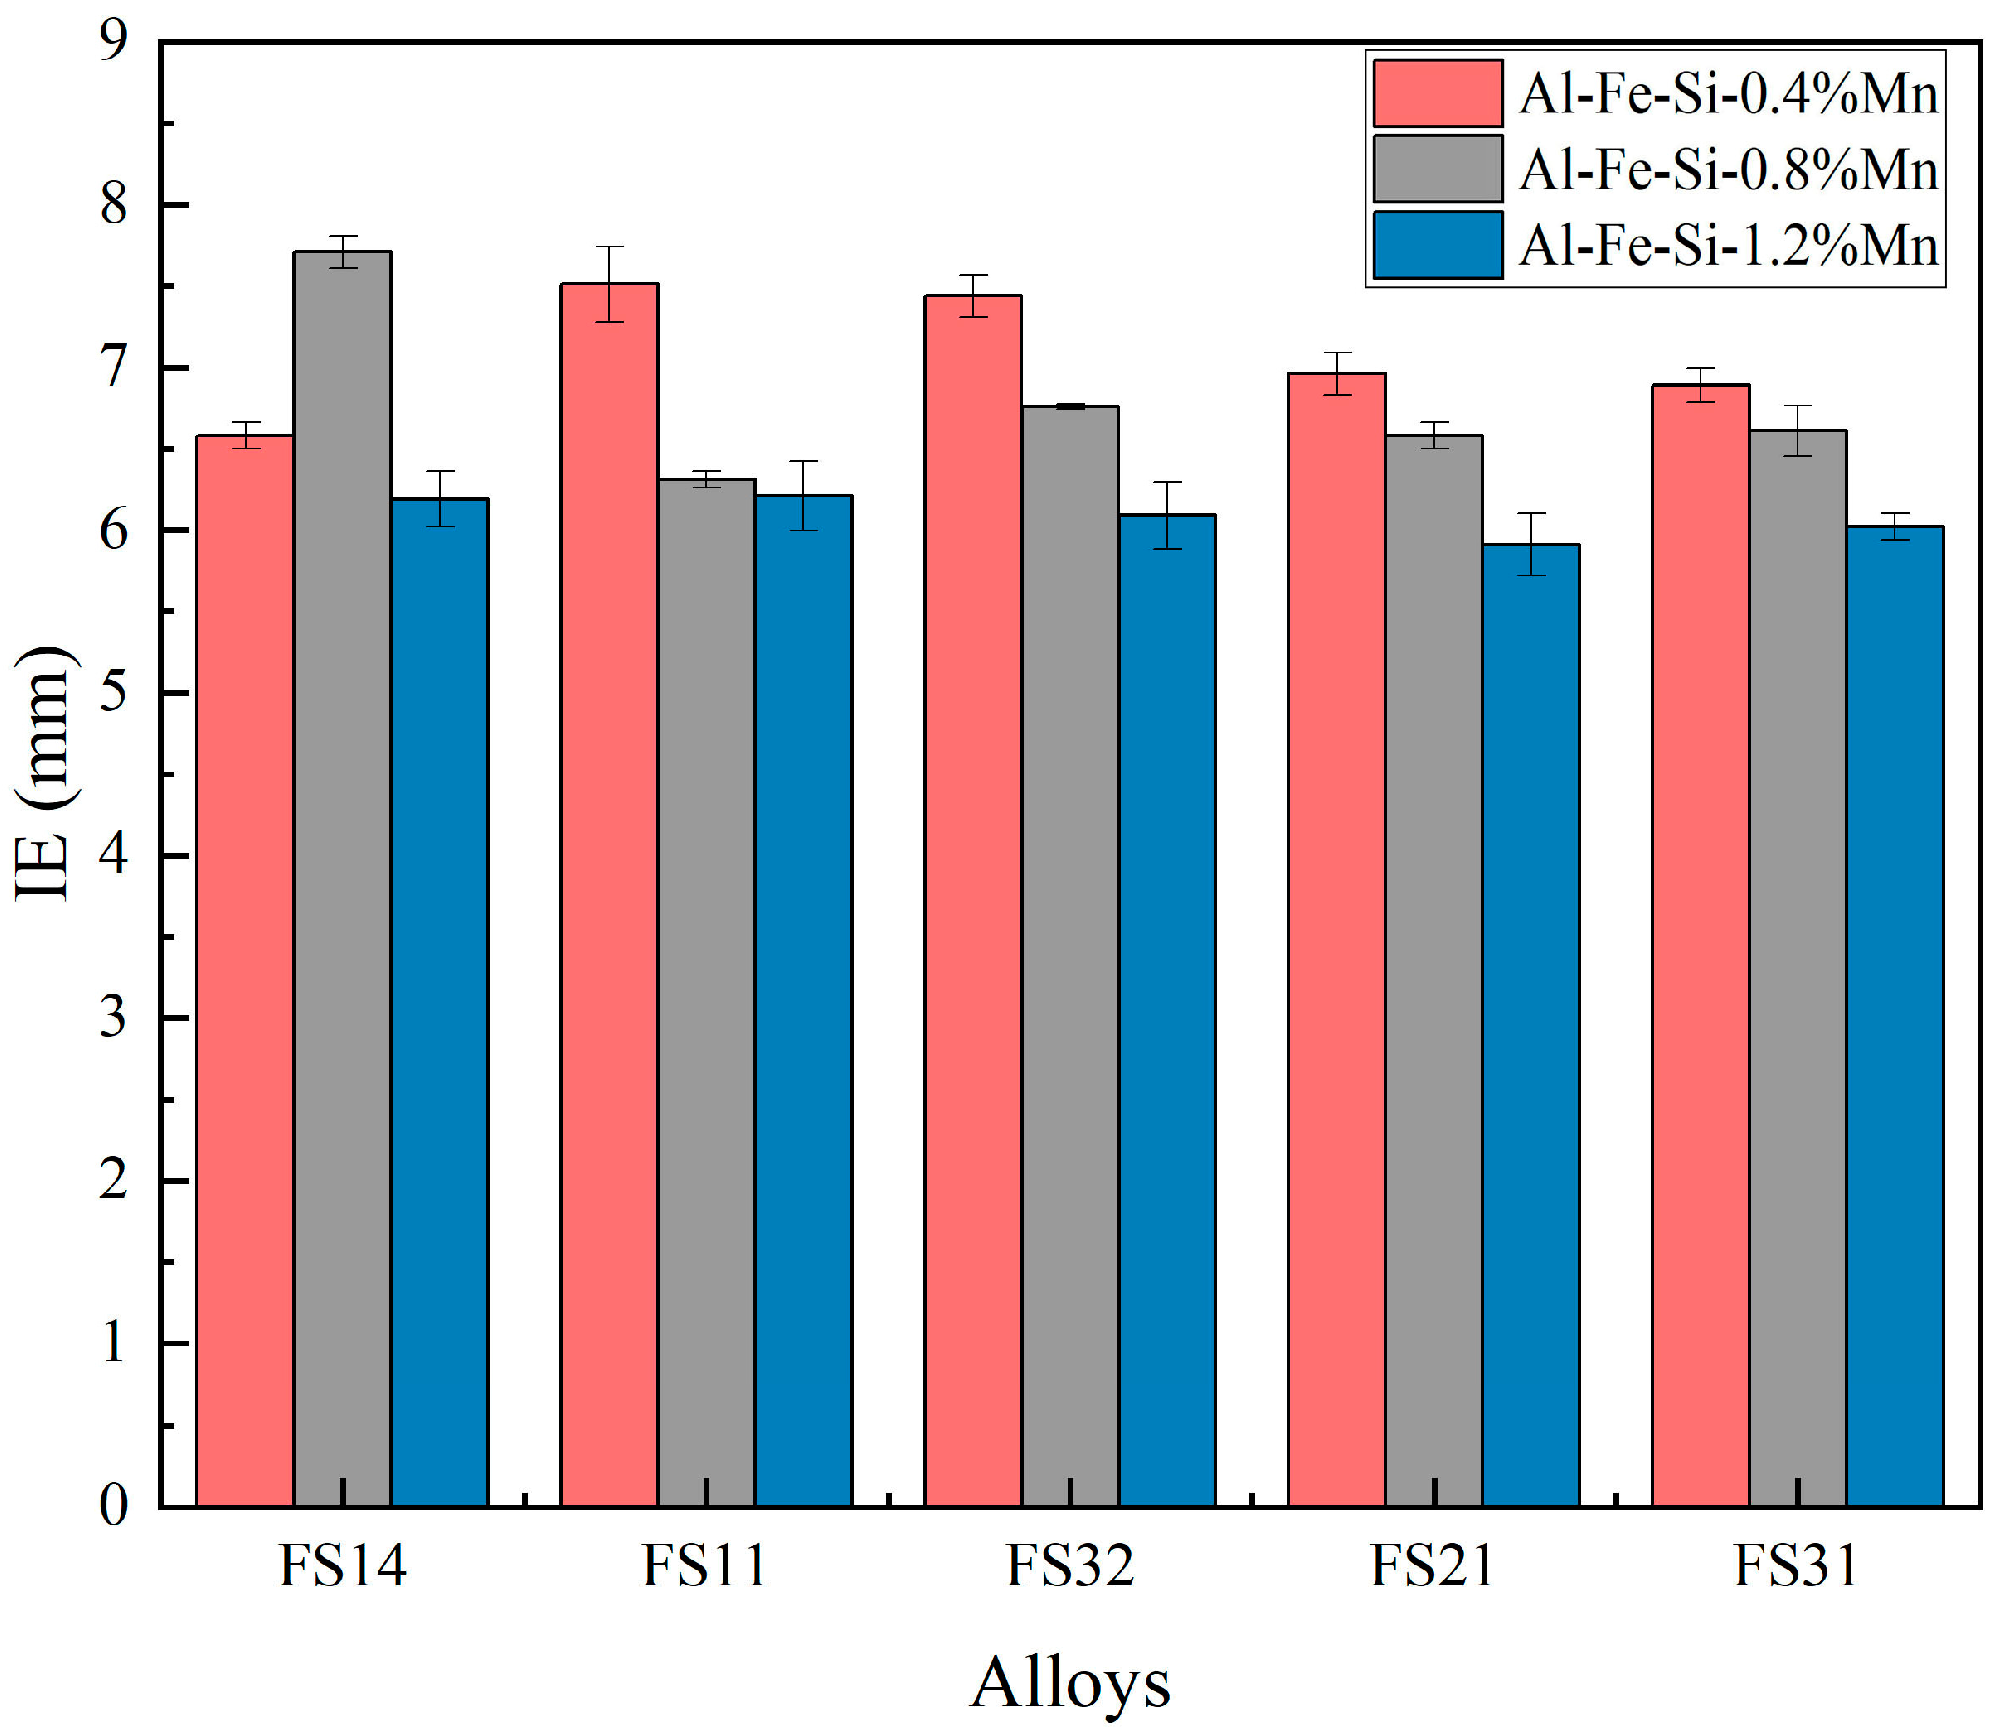
3.4. Evolution of Microstructure and Mechanical Properties of Al-Fe-Si Alloy Sheets

Figure 8 and Figure 9 show the OM images and SEM images of Al-Fe-Si alloy sheets with different Fe/Si atomic ratios. The grains are elongated along the rolling direction, presenting a typical fibrous shape. The Al-Fe-Si alloy continuous casted ingots with different Fe/Si atomic ratios exhibit a certain degree of structural inheritance in the grain structure of the Al-Fe-Si alloy sheets. The grain widths of the five alloy sheets are of the same order of magnitude, and the second phase is not affected during the rolling process. The second phase structure of the cast alloy is fractured and fragmented along the rolling direction due to the rolling force, resulting in a fine and dispersed distribution. Figure 10 shows the mechanical properties of Al-Fe-Si alloy sheets. The hardness of Al-Fe-Si alloy continuous casted ingots with different Fe/Si atomic ratios does not differ significantly, but the strength of the sheets is significantly increased. In Figure 10b, the elongation gradually increases because the microstructure of the alloy sheets after rolling still contains the β phase. The β-AlFeSi phase is a hard and brittle phase, which, although it can enhance the strength of the alloy, reduces the alloy’s plasticity and toughness due to its matrix-splitting effect. This results in a lower elongation in the plasticity indicators. For example, the microstructure of the FS14 alloy is mainly composed of the β-AlFeSi phase based on Table 1; this alloy has high ultimate tensile strength but also has the lowest elongation among the five alloy sheets. The microstructure of the FS31 alloy is mainly composed of the α-AlFeSi phase. This alloy not only ensures higher ultimate tensile strength compared to FS32 alloy sheets but also exhibits the highest elongation among the five alloy sheets. Figure 11 shows the comprehensive performance indicators of Al-Fe-Si alloys with different Fe/Si atomic ratios. To facilitate a more intuitive comparison of the overall performance based on the total area size, the reciprocal of the surface segregation thickness data was plotted in the graph. It was found that the FS31 alloy has the best performance combination, with the largest proportion of various indicator areas in the comprehensive performance graph. Therefore, the optimal comprehensive performance is achieved when the total Fe + Si content is 0.7% (wt.%) and the Fe to Si atomic ratio is 3:1 for Al-Fe-Si alloys.

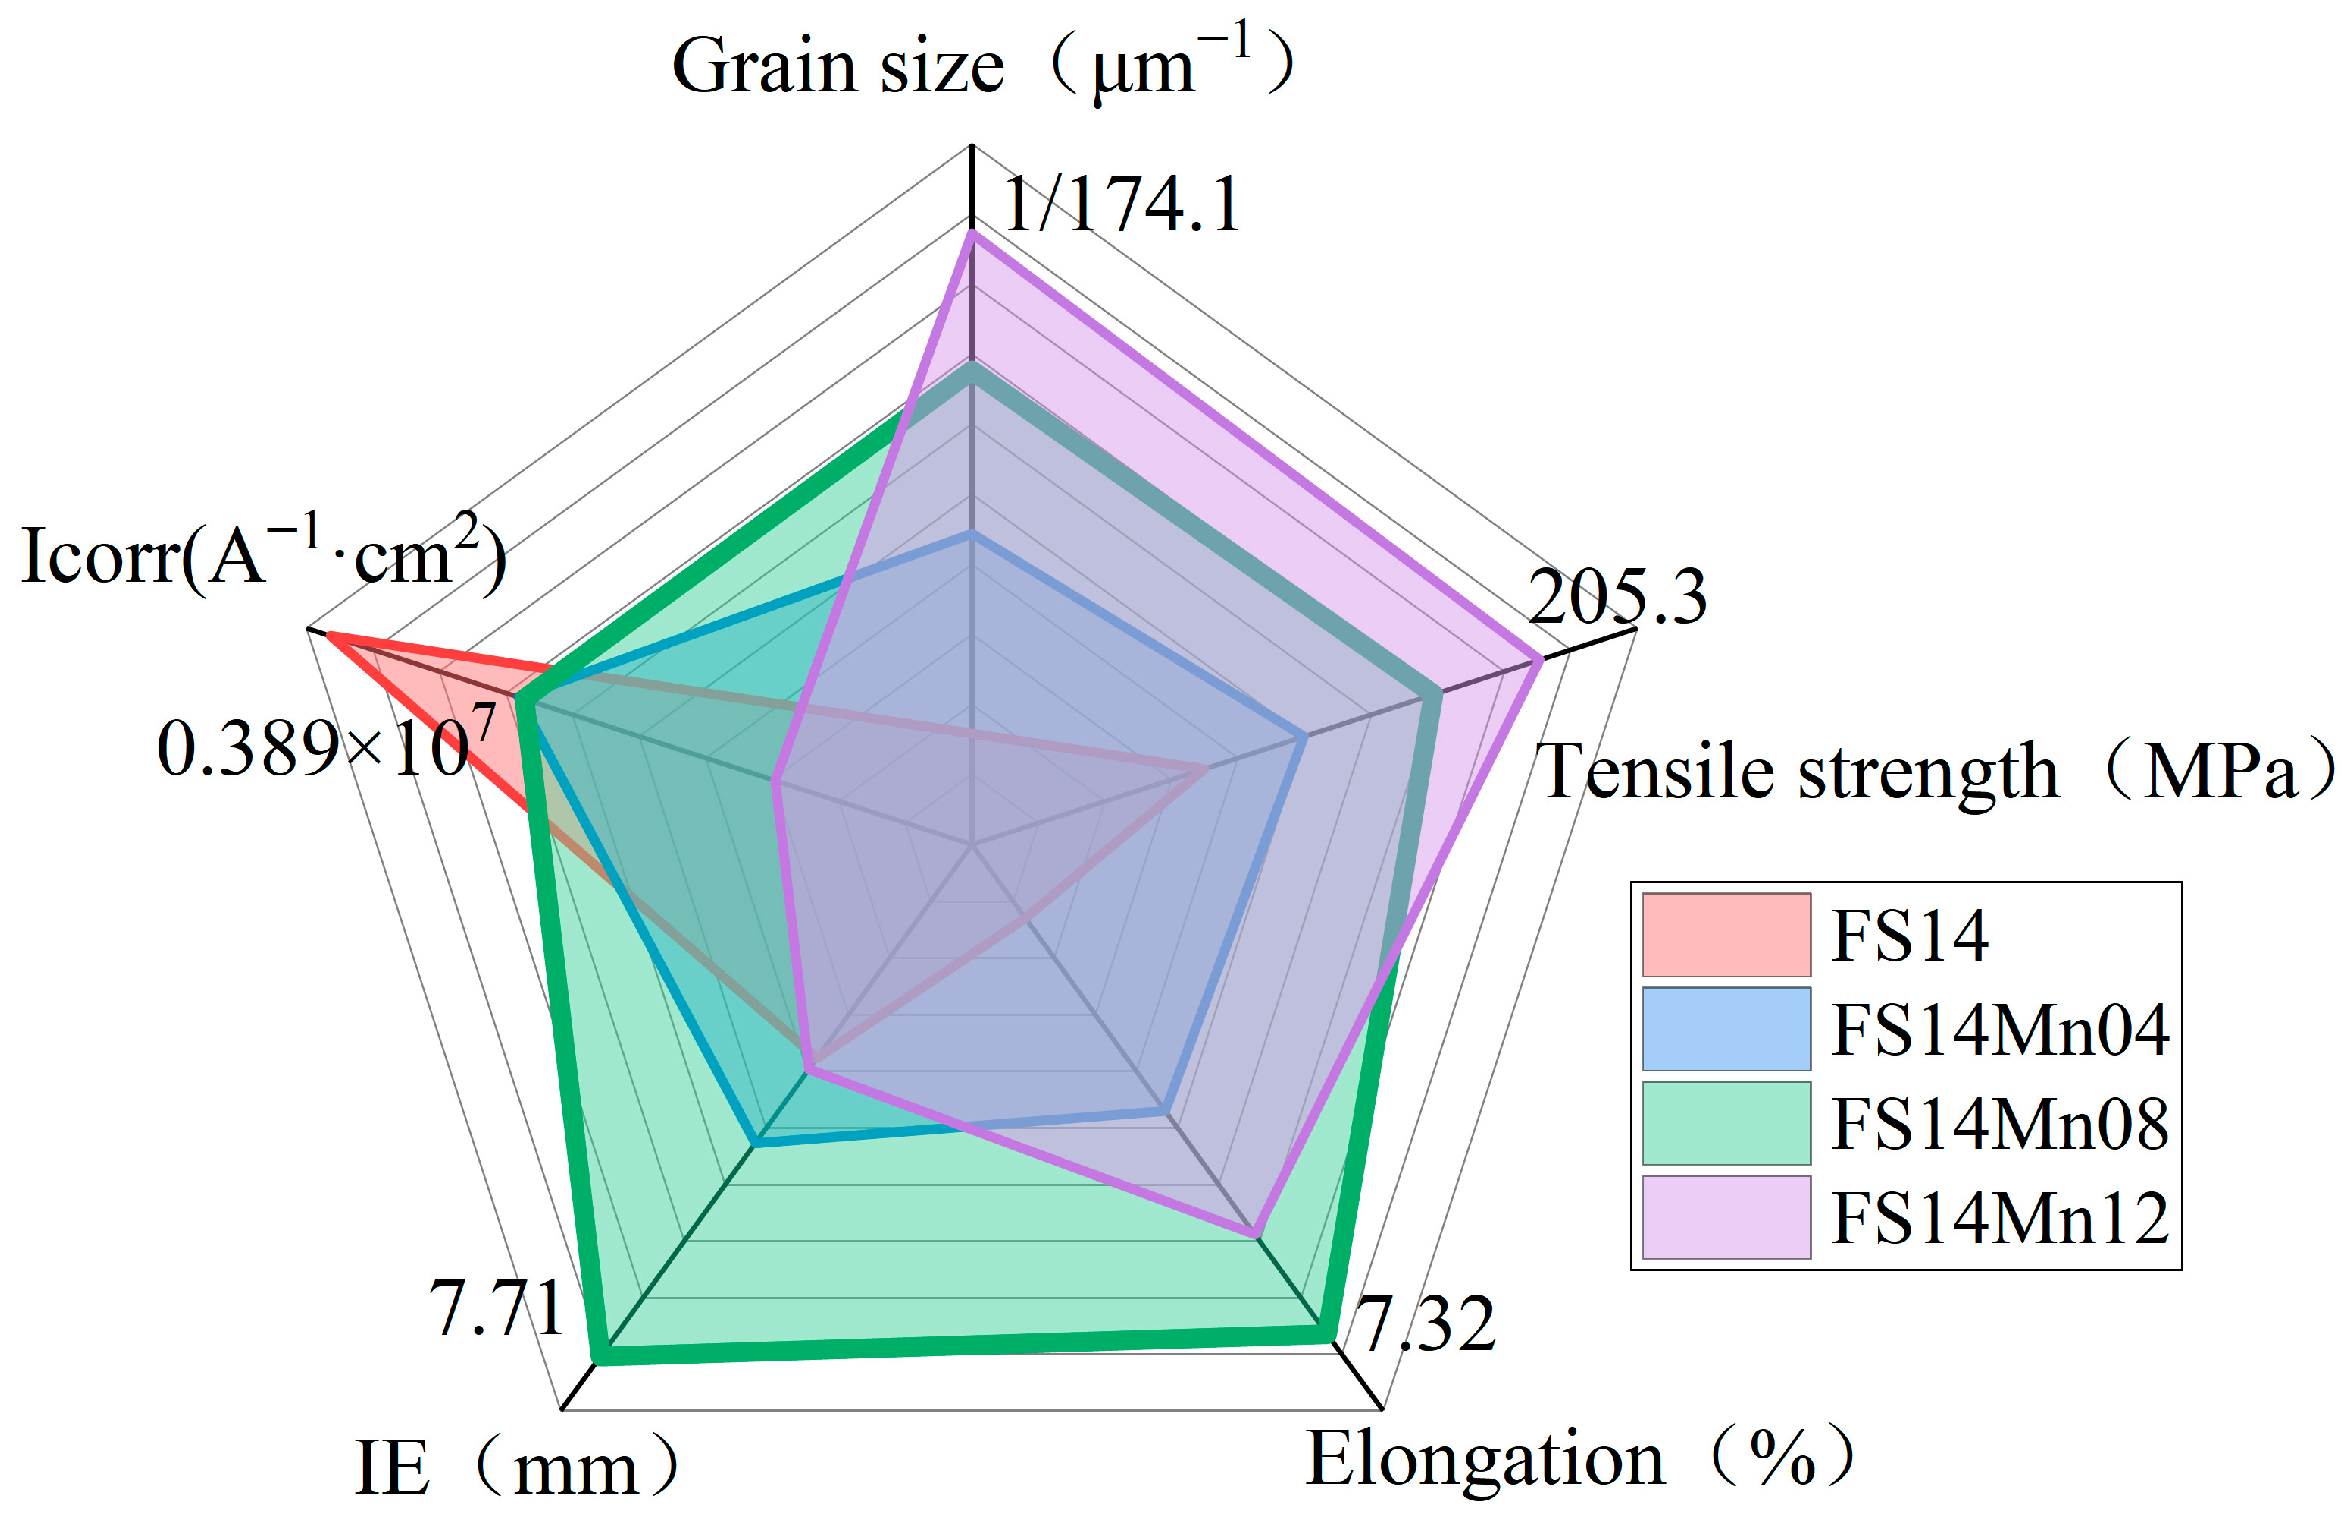
3.5. The Effect of Mn Content on the Comprehensive Properties of Al-Fe-Si Alloys for TBCCR

The composition of Al-Fe-Si alloys still needs optimization to meet the increasingly demanding performance standards for aluminum sheets used in batteries. The addition of Mn can enhance the strength of aluminum alloys and improve their plasticity and toughness. Alloying Al-Fe-Si alloys with Mn is an effective method to improve their performance. Figure 12, Figure 13 and Figure 14 illustrate the contour maps depicting the effects of varying Mn compositions on the secondary phase in Al-Fe-Si alloys and provide statistics on phase fractions; points A1, A2, A3, A4, and A5 represent the five different Fe/Si atomic ratios selected in this study. The addition of Mn to Al-Fe-Si alloys primarily impacts the β-AlFeSi phase, with Fe remaining the principal element influencing its formation. As Mn is introduced, the formation region of the β-AlFeSi phase shifts towards alloys with higher Fe and Si content. For instance, at points A1 and A3 in Figure 12, the β-AlFeSi phase has been eliminated with the addition of 0.1% and 0.2% Mn, respectively. To further investigate the detrimental effects of the β-AlFeSi phase, an initial Mn addition of 0.4% was chosen to eliminate this harmful phase. Figure 13 shows that the content of the α-AlFeSi phase decreases progressively with increasing Mn content. This decrease is likely due to the reaction between Mn and Fe in the aluminum liquid, which consumes some Fe and causes Mn to replace part of the Fe, thereby reducing the α-AlFeSi phase content [22]. This study explored that the second phase of surface segregation in Al-Fe-Si alloy continuous casted ingots with different Fe/Si atomic ratios is primarily the α-AlFeSi phase. Therefore, it is speculated that the addition of Mn may reduce surface segregation in the alloy by affecting the α-AlFeSi phase. Additionally, a quaternary phase is formed with the stoichiometric formula Al15(FeMn)3Si2 after adding Mn to the Al-Fe-Si alloys, which is a type of α phase. The fraction of the Al15(FeMn)3Si2 phase at points A1, A2, A3, A4, and A5 increases with the increase in Mn content, and it is present in all regions. No linear correlation is observed between the content of the Al15(FeMn)3Si2 phase and the α-AlFeSi phase. The Al15(FeMn)3Si2 phase content is relatively high at points A2 and A3, which may be related to the Mn/Fe ratio at these points.
Figure 15 shows the grain structure diagrams of Al-Fe-Si-Mn alloys with varying Fe/Si atomic ratios and Mn content. Table 2 provides statistical data on the grain size of these alloys. It can be observed that dendrite segregation becomes more severe as the Fe content increases in Al-Fe-Si-Mn alloy continuous casted ingots. This is contrary to the typical trend in Al-Fe-Si alloys, where an increase in Fe content reduces dendrite segregation. The reason is that the phases formed by the combination of Fe and Mn are located in the solid–liquid two-phase region, which hinders the flow of molten metal between the dendrites, resulting in more pronounced dendrite segregation [37]. In addition, the Fe/Si atomic ratio has little effect on the grain size of the Al-Fe-Si-Mn continuous casted ingots under the same Mn content. The grain size of the Al-Fe-Si-Mn alloy continuous casted ingots is refined to varying degrees after the addition of different amounts of Mn. The grain size of the sheets is significantly reduced compared to the continuous casted ingots after rolling deformation. It can be seen that the grain width of the Al matrix is influenced not only by the grain size of the casting billet but also by the degree of deformation and the thickness of the sheets. This indicates that Al-Fe-Si-Mn alloys undergo uniform plastic deformation during the rolling process.
Figure 16 and Figure 17 show the SEM images of Al-Fe-Si-Mn alloy continuous casted ingots with different Fe/Si atomic ratios and Mn contents. It can be seen that the needle-like phase present in the Al-Fe-Si alloy disappears, with the skeletal second phase, which is continuously distributed along the grain boundaries, becoming dominant. Additionally, the second-phase structure inside the continuous casted ingots becomes denser as the Fe/Si atomic ratio increases, and the area fraction of the second phase gradually increases. As the Mn content increases, the alloy structure gradually coarsens, and the area fraction of the second phase also increases. It can be inferred that Fe and Mn are the primary factors influencing the microstructure morphology in Al-Fe-Si-Mn alloys. Table 3 lists the EDS analysis performed on the second phase in the continuous casted ingots. Based on the ratio of (Fe + Mn) to Si content, the skeletal second phase is identified as the quaternary Al15(FeMn)3Si2 phase. The second phase at point S6 is lamellar or strip-like and contains only Al, Fe, and Mn, suggesting that it is the Al6FeMn phase. The morphology of the second-phase segregation on the surface layer of Al-Fe-Si-Mn alloy continuous casted ingots with varying Mn contents tends to be consistent. Combined with the microstructural analysis inside the Al-Fe-Si-Mn alloy continuous casted ingots, it is inferred that the second-phase segregation on the surface layer is the Al15(FeMn)3Si2 phase. When the Mn content remains constant, the surface segregation of the Al-Fe-Si-Mn alloy continuous casted ingots gradually increases with the increase in Fe/Si atomic ratio. The most severe segregation occurs at Fe/Si atomic ratios of 2:1 and 3:1, which attributes the Al15(FeMn)3Si2 phase as also being an Fe-rich α-phase, and the increase in Fe content facilitates its formation, leading to surface segregation. Furthermore, when the Fe/Si atomic ratio is fixed, the surface layer microstructure of the continuous casted ingots gradually coarsens with the increase in Mn content. This is because the higher Mn content leads to an increase in the content of the quaternary phase in the continuous casted ingots, thereby increasing the density of the second phase. Among Al-Fe-Si alloy continuous casted ingots and Al-Fe-Si-Mn alloy continuous casted ingots, the alloy with the lightest degree of surface segregation has an Fe/Si atomic ratio of 1:4, indicating that reducing the Fe content can mitigate surface segregation in Al-Fe-Si-Mn series alloys.
Figure 18 shows the hardness of Al-Fe-Si alloy continuous casted ingots and sheets with varying Mn content. A significant increase in the hardness of the sheets can be observed compared to the continuous casted ingots. The hardness of the FS14 alloy increases notably after adding 1.2% Mn, due to the formation of a coarse second phase by Fe and Mn elements. The continuous accumulation of dislocations creates dislocation barriers, increases deformation resistance, and leads to an increase in strength. Figure 19 presents the typical engineering stress–strain curves of Al-Fe-Si alloy sheets with different Mn contents, with the tensile test results shown in Table 4. While the improvement in alloy strength usually reduces plasticity, the elongation of FS21 and FS31 alloy sheets gradually decreases as Mn content increases. This is mainly due to the formation of a hard phase after the addition of Mn. However, the strength and ductility of FS14, FS11, and FS32 alloy sheets are enhanced, and elongation is improved after adding 0.4% Mn. This is attributed to the transformation of the α-AlFeSi phase in these initial alloy continuous casted ingots into the β-AlFeSi phase upon Mn addition. Unlike the poor plasticity of the FS14 Al-Fe-Si alloy, FS14 alloy sheets exhibit the optimal combination of mechanical properties and elongation when Mn is added in three different amounts.
Furthermore, the corrosion resistance of the FS14 alloy sheet whose microstructure and mechanical properties meet expectations was further analyzed. Figure 20 shows the polarization curves of Al-Fe-Si alloy sheets with varying Mn content, with statistical corrosion resistance data listed in Table 5. The initial state of the Al-Fe-Si alloy exhibits the lower Ecorr and Icorr, which indicated that Al-Fe-Si (F14) alloy exhibits the best corrosion resistance. The curves and the statistical data show that Mn addition causes the increase in the Ecorr and Icorr, and increasing the Mn concentration from 0.4 to 1.2% leads to a slight further increase in the Ecorr and Icorr, which reveals a slight decrease in the corrosion resistance of the Al-Fe-Si-Mn alloy. This is because the number of second phases gradually rises with Mn content increasing, enhancing the potential difference between the matrix and the second phase. Figure 21 and Figure 22 present the cupping values and comprehensive performance indicators of Al-Fe-Si alloys with different Mn contents. It is evident that the FS14Mn08 alloy exhibits the best performance combination, having the largest proportion of various indicator areas in the comprehensive performance graph. Consequently, the optimal chemical composition of the Al-Fe-Si-Mn alloy, with Fe + Si = 0.7%, an Fe/Si atomic ratio of 1:4, and an Mn content of 0.8 wt.%, was designed to achieve the best overall performance. This composition balances grain size, mechanical properties (tensile strength, elongation, and other strength and plasticity indicators), formability (cupping value), and corrosion resistance (corrosion current density). Therefore, the optimum alloy’s composition can be obtained by combining changes in strength and ductility and corrosion resistance.

4. Conclusions

This study prepared five Al-Fe-Si alloys with different Fe-rich phases based on CALPHAD simulations using Pandat software. Combining practical production requirements, casting ingots and rolled sheets were produced through casting and direct rolling processing. Comprehensive characterizations were conducted including determination of crystallization temperature intervals, microstructural observation, surface segregation analysis, and evaluations of mechanical properties and corrosion resistance. Furthermore, the influence of the Mn element on the microstructure and performance of Al-Fe-Si alloys was systematically investigated to achieve performance enhancement. The research findings provide theoretical support and process guidance for the customized design and preparation of Al-Fe-Si alloys suitable for short-process manufacturing. The specific conclusions are as follows:
(1)
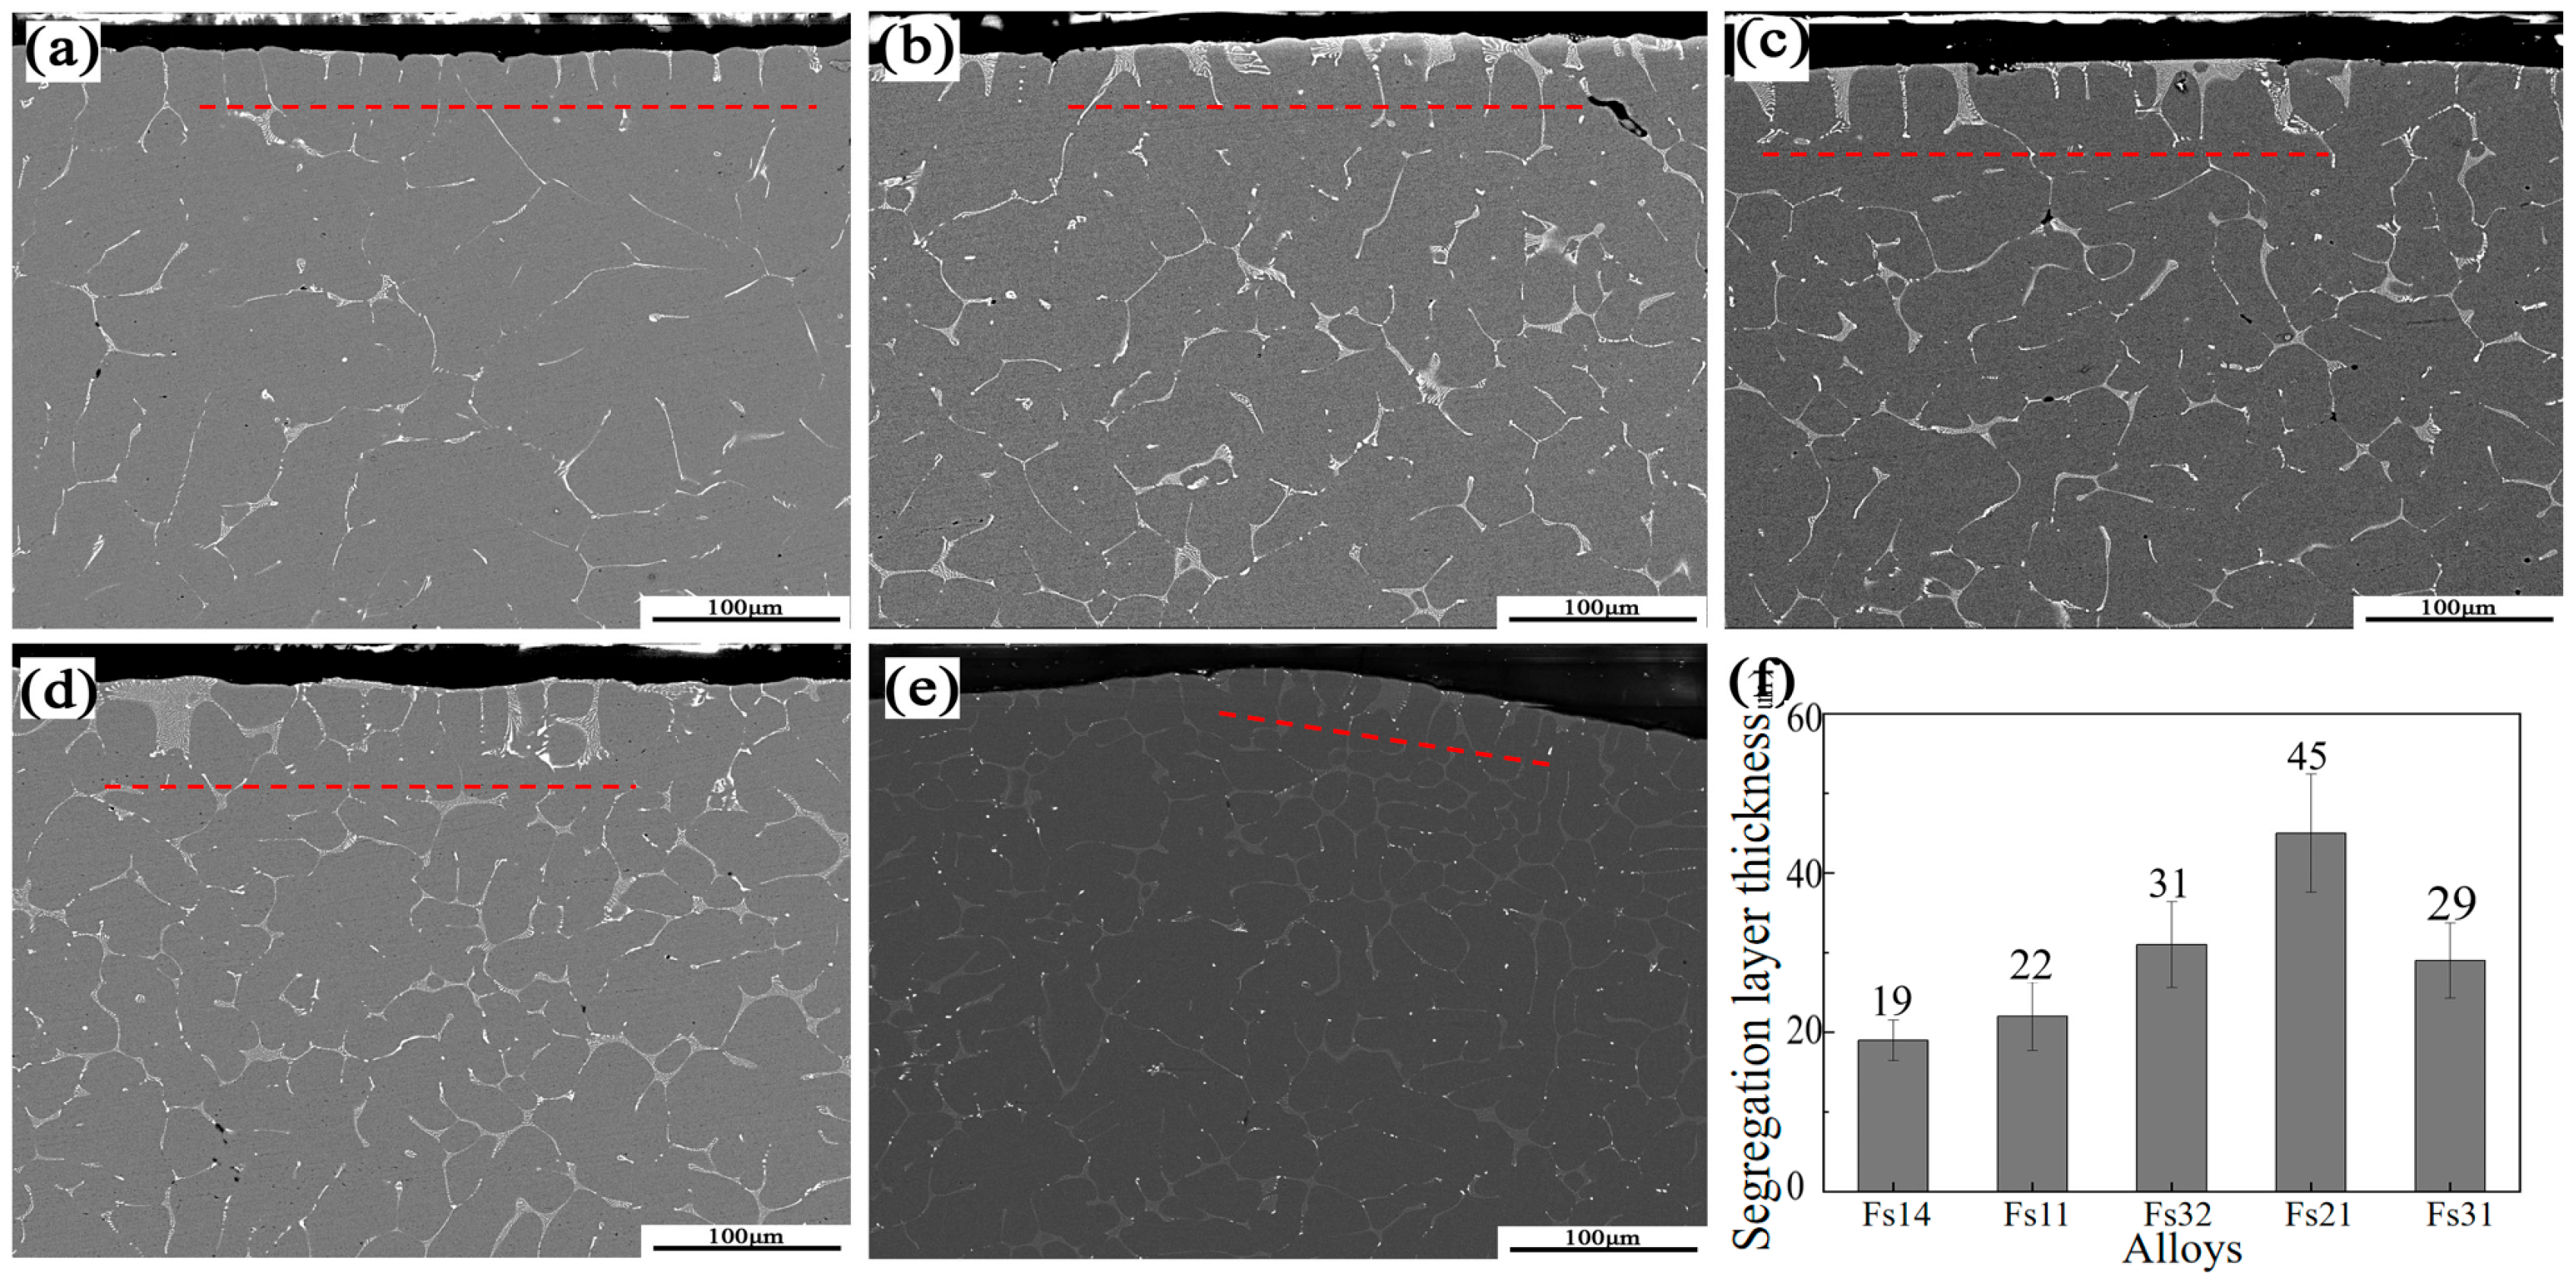
Phase evolution in Al-Fe-Si alloys was first analyzed via CALPHAD to establish composition–microstructure relationships. Five representative alloys with Fe/Si atomic ratios spanning from 1:4 to 3:1 were selected for experimental validation (designated FS14-FS31). Among the alloys with different Fe/Si ratios, the FS31 alloy demonstrated the narrowest solidification interval of 5.5 °C. In the casting ingots, the α-phase exhibited surface segregation tendencies, while the β-phase showed no such inclination, a phenomenon linked to the chemical potential and activity of elements during solidification.
(2)
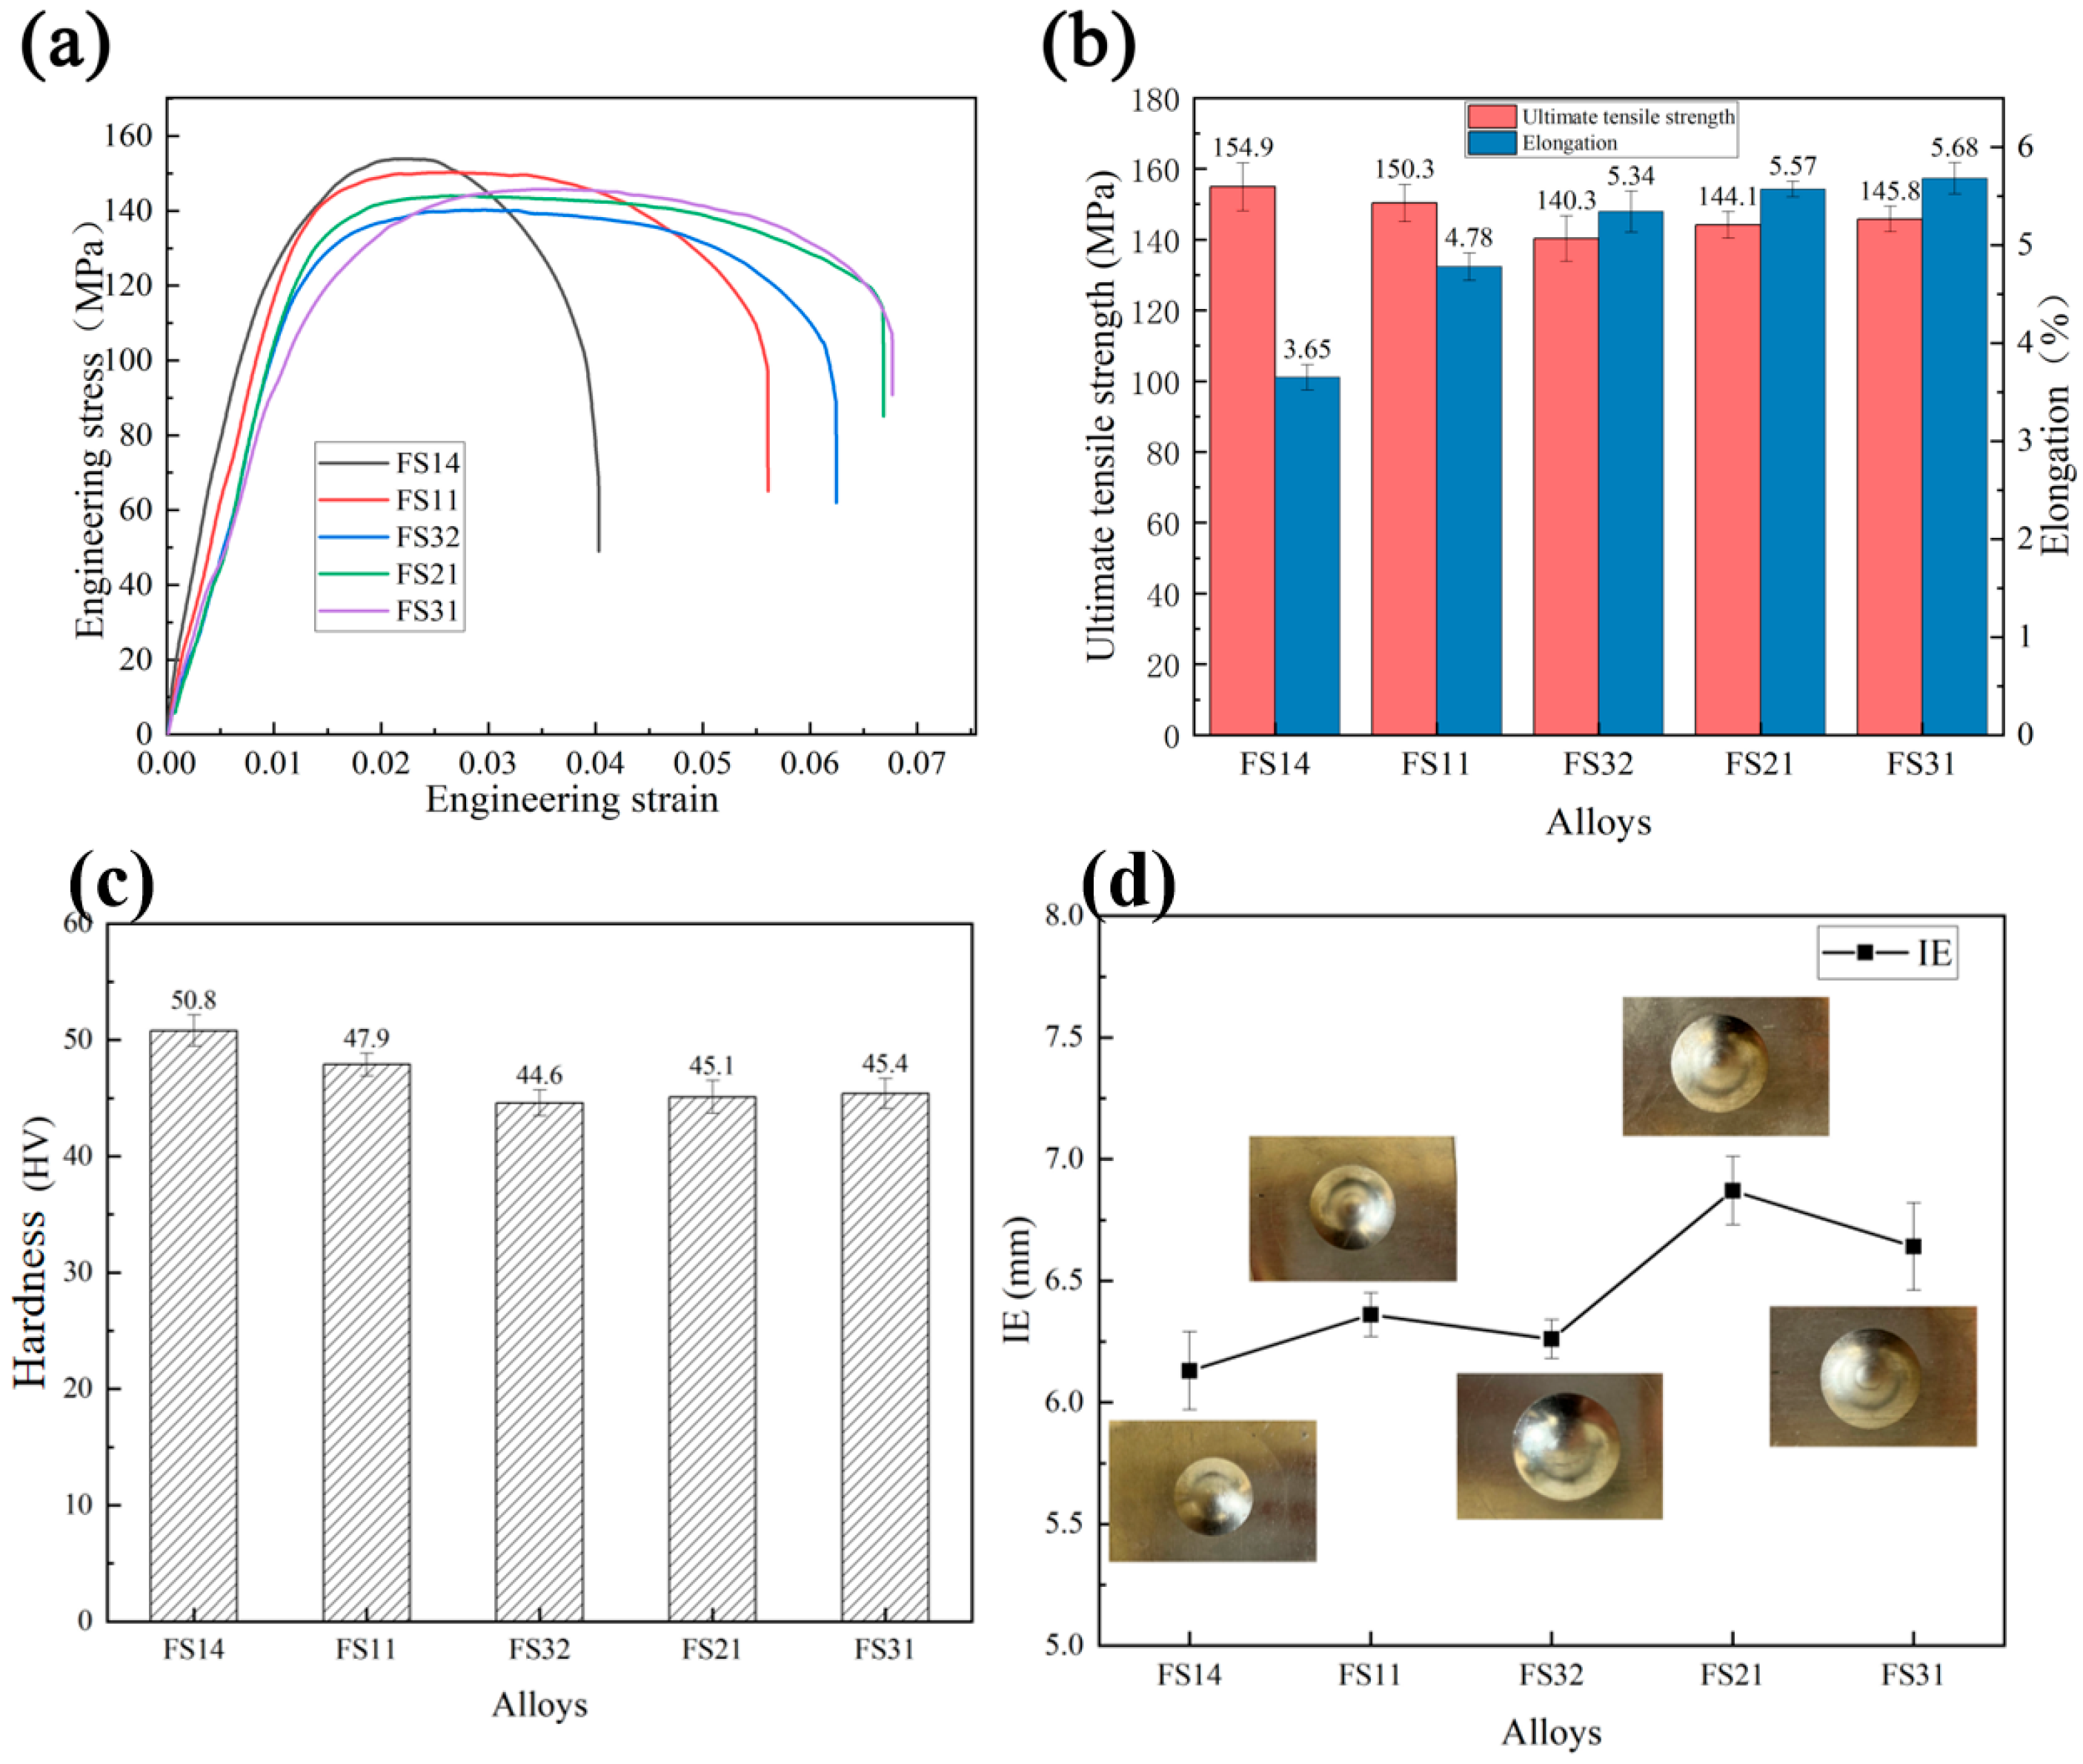
Microstructural and surface segregation analyses revealed that the FS31 alloy (Fe/Si = 3:1, Fe + Si = 0.7%) achieved optimal mechanical performance: ultimate tensile strength of 145.8 MPa, elongation to failure of 5.7%, accompanied by a cupping value of 6.64 mm. This composition demonstrates the critical role of maintaining 0.7% total Fe + Si content with a 3:1 atomic ratio for balanced castability and product performance.
(3)
Based on the findings of Al-Fe-Si alloys, the Mn-modified microstructure was quantitatively assessed through CALPHAD-guided composition design (0.4–1.2 wt % Mn). The addition of Mn was found to refine the grain structure and enhance the strength. The FS14 alloy displayed minimal surface segregation after Mn addition. Ductility remained stable at ≤0.8 wt.% Mn but degraded at 1.2 wt.% Mn, indicating a threshold for Mn content optimization.
(4)
The TBCCR-optimized Al-Fe-Si-Mn alloy (Fe + Si = 0.7%, Fe/Si = 1:4, 0.8 wt.% Mn) demonstrated superior comprehensive properties: enhanced ultimate tensile strength = 189.4 MPa, improved elongation to failure = 7.32%, and elevated cupping value = 7.71 mm. This composition achieves an optimal balance between grain refinement, mechanical performance (strength–ductility synergy), formability, and corrosion resistance. Property optimization originates from the coordinated control of phase formation through Mn microalloying, providing a compositional design framework for high-performance TBCCR alloys.

Author Contributions

Conceptualization, L.L., C.X., G.L., and S.G.; methodology, L.L., X.L., L.S., S.H., C.X., G.L., and S.G.; software, X.L; validation, X.L., L.S., S.H., C.X., and G.L.; formal analysis, S.H., C.X., and G.L.; investigation, L.L., X.L., and L.S.; data curation, L.L. and C.X.; writing—original draft, L.L. and X.L.; writing—review and editing, C.X.; visualization, L.S. and S.H.; resources, S.H.; project administration, S.G.; funding acquisition, L.L., G.L., and S.G. All authors have read and agreed to the published version of the manuscript.

Funding

The authors are grateful to the financial support given by the Major Science and Technology Project of Henan Province (Grant number 221100240300), Natural Science Foundation of Henan Province (Grant number 222300420540), and Key Technology Research and Development Program of Henan Province (Grant number 242102240098, Grant number 232102231022).

Data Availability Statement

Data will be made available on request.

Conflicts of Interest

Author Lei Shi was employed by the company Zhengzhou Non-Ferrous Metals Research Institute Co, Ltd. and Shouzhi Huang was employed by the company Inner Mongolia Liansheng New Energy Materials Co., Ltd. The remaining authors declare that the research was conducted in the absence of any commercial or financial relationships that could be construed as a potential conflict of interest.

References

  1. Jiang, R.; Zhao, W.; Zhang, L.; Li, X.; Guan, S. Microstructure and corrosion resistance of commercial purity aluminum sheet manufactured by continuous casting direct rolling after ultrasonic melt pre-treatment. J. Mater. Res. Technol. 2023, 22, 1522–1532. [Google Scholar] [CrossRef]
  2. Zhao, J.R.; Hung, F.Y.; Chen, B.J. Effects of heat treatment on a novel continuous casting direct rolling 6056 aluminum alloy: Cold rolling characteristics and tensile fracture properties. J. Mater. Res. Technol. 2021, 11, 535–547. [Google Scholar] [CrossRef]
  3. Haga, T.; Tkahashi, K.; Ikawaand, M.; Watari, H. Twin roll casting of aluminum alloy strips. J. Mater. Process. Technol. 2004, 153–154, 42–47. [Google Scholar] [CrossRef]
  4. Gras, C.; Meredith, M.; Hunt, J.D. Microdefects formation during the twin-roll casting of Al–Mg–Mn aluminium alloys. J. Mater. Process. Technol. 2005, 167, 62–72. [Google Scholar] [CrossRef]
  5. Slagsvold, M. Effect of Fe and Si Content in Aluminium Alloys as a Result of Increased Recycling: Testing of High Purity Aluminium Alloys in Uniaxial Tension. Master’s Thesis, Norwegian University of Science and Technology, Trondheim, Norway, 2011. [Google Scholar]
  6. Lan, X.; Li, K.; Wang, J.; Yang, M.; Lu, Q.; Du, Y. Developing Al–Fe–Si alloys with high thermal stability through tuning Fe, Si contents and cooling rates. Intermetallics 2022, 144, 107505. [Google Scholar] [CrossRef]
  7. Li, Z.; Qin, L.; Guo, B.; Yuan, J.; Zhang, Z.; Li, W.; Mi, J. Characterization of the Convoluted 3D Intermetallic Phases in a Recycled Al Alloy by Synchrotron X-ray Tomography and Machine Learning. Acta Metall. Sin. (Engl. Lett.) 2022, 35, 115–123. [Google Scholar] [CrossRef]
  8. Karlík, M.; Mánik, T.; Lauschmann, H. Influence of Si and Fe on the distribution of intermetallic compounds in twin-roll cast Al–Mn–Zr alloys. J. Alloys Compd. 2012, 515, 108–113. [Google Scholar] [CrossRef]
  9. Birol, Y. Thermomechanical processing of a twin-roll cast Al–1Fe–0.2Si alloy. J. Mater. Process. Technol. 2008, 202, 564–568. [Google Scholar] [CrossRef]
  10. Barekar, N.S.; Dhindaw, B.K. Twin-Roll Casting of Aluminum Alloys—An Overview. Mater. Manuf. Process. 2014, 29, 651–661. [Google Scholar] [CrossRef]
  11. Zhang, L.; Gao, J.; Damoah, L.N.W.; Robertson, D.G. Removal of Iron from Aluminum: A Review. Miner. Process. Extr. Metall. Rev. 2012, 33, 99–157. [Google Scholar] [CrossRef]
  12. Luo, K.; Wang, Z.; Meng, L.; Guo, Z. Removal of iron for aluminum recovery from scrap aluminum alloy by supergravity separation with manganese addition. Chem. Eng. Process.-Process Intensif. 2022, 173, 108841. [Google Scholar] [CrossRef]
  13. Song, X.; Gao, M.; Yang, B.; Guan, R. Modification and refinement of Fe-containing phases, mechanical properties and strengthening mechanisms in Al–Fe alloys via Cr alloying and continuous rheo-extrusion. Mater. Sci. Eng. A 2022, 850, 143557. [Google Scholar] [CrossRef]
  14. Bo, L.; Xiangxiang, H.; Rui, X.; Yuliang, Z.; Yemao, L.; Huaqiang, X. Evolution of iron-rich intermetallics and its effect on the mechanical properties of Al–Cu–Mn–Fe–Si alloys after thermal exposure and high-temperature tensile testing. J. Mater. Res. Technol. 2023, 23, 2527–2541. [Google Scholar] [CrossRef]
  15. Green, J.A.S. Aluminum Recycling and Processing for Energy Conservation and Sustainability; ASM International: Almere, The Netherlands, 2007. [Google Scholar]
  16. Zhang, Y.; Liu, Y.; Han, Y.; Wei, C.; Gao, Z. The role of cooling rate in the microstructure of Al–Fe–Si alloy with high Fe and Si contents. J. Alloys Compd. 2009, 473, 442–445. [Google Scholar] [CrossRef]
  17. Sun, J.; Takahashi, A.; Higashi, K.; Yamamoto, T.; Komarov, S. Fabrication of CrSi2-Containing Master Alloys for Modification of Fe-Containing Intermetallic Compounds in Aluminum Alloys. Materials 2022, 15, 7836. [Google Scholar] [CrossRef]
  18. Que, Z.; Zhou, Y.; Wang, Y.; Mendis, C.L.; Fan, Z. Effects of Mg addition on the Al6(Fe,Mn) intermetallic compounds and the grain refinement of α-Al in Al-Fe-Mn alloys. Mater. Charact. 2021, 171, 110758. [Google Scholar] [CrossRef]
  19. Ren, J.; Fang, X.; Chen, D.; Cao, C.; He, Y.; Liu, J. The Effect of Heat Treatments on the Microstructural Evolution of Twin-Roll-Cast Al-Fe-Si Alloys. J. Mater. Eng. Perform. 2021, 30, 4401–4410. [Google Scholar] [CrossRef]
  20. Bacaicoa, I.; Luetje, M.; Zeismann, F.; Geisert, A.; Fehlbier, M.; Brueckner-Foit, A. On the role of Fe-content on the damage behavior of an Al-Si-Cu alloy. Procedia Struct. Integr. 2019, 23, 33–38. [Google Scholar] [CrossRef]
  21. Zhang, X.; Wang, D.; Zhou, Y.; Chong, X.; Li, X.; Zhang, H.; Nagaumi, H. Exploring crystal structures, stability and mechanical properties of Fe, Mn-containing intermetallics in Al-Si Alloy by experiments and first-principles calculations. J. Alloys Compd. 2021, 876, 160022. [Google Scholar] [CrossRef]
  22. Liu, C.L.; Du, Q.; Parson, N.C.; Poole, W.J. The interaction between Mn and Fe on the precipitation of Mn/Fe dispersoids in Al-Mg-Si-Mn-Fe alloys. Scr. Mater. 2018, 152, 59–63. [Google Scholar] [CrossRef]
  23. Kuijpers, N.C.W.; Vermolen, F.J.; Vuik, C.; Koenis, P.T.G.; Nilsen, K.E.; Zwaag, S.V.D. The dependence of the β-AlFeSi to α-Al(FeMn)Si transformation kinetics in Al–Mg–Si alloys on the alloying elements. Mater. Sci. Eng. A 2005, 394, 9–19. [Google Scholar] [CrossRef]
  24. Liu, F.; Zhu, X.; Qin, J.; Zhou, W.; Ling, J.; Dong, Q.; Yu, J.; Nagaumi, H.; Zhang, B. Effect of Mn/Cr ratio on precipitation behaviors of α-Al(FeMnCr)Si dispersoids and mechanical properties of Al–Mg–Si–Cu alloys. Mater. Sci. Eng. A 2022, 860, 144269. [Google Scholar] [CrossRef]
  25. Wang, Y.; Zang, A.; Wells, M.; Poole, W.; Li, M.; Parson, N. Strain localization at longitudinal weld seams during plastic deformation of Al–Mg–Si–Mn–Cr extrusions: The role of microstructure. Mater. Sci. Eng. A 2022, 849, 143454. [Google Scholar] [CrossRef]
  26. Basak, C.B.; Meduri, A.; Babu, N.H. Influence of Ni in high Fe containing recyclable Al-Si cast alloys. Mater. Des. 2019, 182, 108017. [Google Scholar] [CrossRef]
  27. Xu, C.; Xiao, W.; Hanada, S.; Yamagata, H.; Ma, C. The effect of scandium addition on microstructure and mechanical properties of Al–Si–Mg alloy: A multi-refinement modifier. Mater. Charact. 2015, 110, 160–169. [Google Scholar] [CrossRef]
  28. Liu, X.; Jia, H.-L.; Wang, C.; Wu, X.; Zha, M.; Wang, H.-Y. Enhancing mechanical properties of twin-roll cast Al–Mg–Si–Fe alloys by regulating Fe-bearing phases and macro-segregation. Mater. Sci. Eng. A 2022, 831, 142256. [Google Scholar] [CrossRef]
  29. Birol, Y. Interannealing twin-roll cast Al–Fe–Si strips without homogenization. Scr. Mater. 2009, 61, 185–188. [Google Scholar] [CrossRef]
  30. Birol, Y. Response to annealing treatments of twin-roll cast thin Al–Fe–Si strips. J. Alloys Compd. 2008, 458, 265–270. [Google Scholar] [CrossRef]
  31. Penumakala, P.K.; Nallathambi, A.K.; Specht, E.; Urlau, U.; Hamilton, D.; Dykes, C. Influence of process parameters on solidification length of twin-belt continuous casting. Appl. Therm. Eng. 2018, 134, 275–286. [Google Scholar] [CrossRef]
  32. Lu, G.; Liang, Y.; Xu, C.; Rao, W.; Xue, Y.; Li, L.; Zhang, L.; Guan, S. Influence of Partial Er Substitution for Sc on the Microstructure, Mechanical Properties and Corrosion Resistance of Short-Processed Al-4.7Mg-0.6Mn-0.3Zr-0.3Sc Sheets. Metals 2024, 14, 1013. [Google Scholar] [CrossRef]
  33. Chen, S.L.; Daniel, S.; Zhang, F. The PANDAT software package and its applications. Calphad 2002, 26, 175–188. [Google Scholar] [CrossRef]
  34. Zhang, Z.; Zhang, J.; Zhao, X.; Liu, X.; Cheng, X.; Jiang, S.; Zhang, Q. Effect of Al/Mg Ratio on the Microstructure and Phase Distribution of Zn-Al-Mg Coatings. Metals 2023, 13, 1963. [Google Scholar] [CrossRef]
  35. Anyalebechi, P. Effects of alloying elements and solidification conditions on secondary dendrite arm spacing in aluminum alloys. TMS Annu. Meet. 2004, 2004, 217–233. [Google Scholar]
  36. Easton, M.; Davidson, C.; John, D.S. Effect of Alloy Composition on the Dendrite Arm Spacing of Multicomponent Aluminum Alloys. Metall. Mater. Trans. A 2010, 41, 1528–1538. [Google Scholar] [CrossRef]
  37. Khan, M.H.; Das, A.; Li, Z.; Kotadia, H.R. Effects of Fe, Mn, chemical grain refinement and cooling rate on the evolution of Fe intermetallics in a model 6082 Al-alloy. Intermetallics 2021, 132, 107132. [Google Scholar] [CrossRef]
Figure 1. Simulation results of the temperature distribution during the continuous casting. Solidification time (a) 1.1 s; (b) 5.3 s; (c) 15.3 s; (d) 25.3 s.
Metals 15 00578 g001
Figure 2. Continuous casting sample.
Metals 15 00578 g002
Figure 3. Contour maps of Fe/Si levels and phase composition in Al-Fe-Si alloys. (a) Isogradient map of the α-AlFeSi phase; (b) isogradient map of the β-AlFeSi phase; (c) the overlapped map of the α-AlFeSi phase and β-AlFeSi; (d) the trend of phase transitions with Fe + Si = 0.7%.
Metals 15 00578 g003
Figure 4. DSC curves of the experimental Al-Fe-Si continuous casted ingots. (a) FS14; (b) FS11; (c) FS32; (d) FS21; and (e) FS31.
Metals 15 00578 g004
Figure 5. The polarized-light optical micrographs of the experimental Al-Fe-Si continuous casted ingots. (a) FS14; (b) FS11; (c) FS32; (d) FS21; (e) FS31; and (f) their measured grain size.
Metals 15 00578 g005
Figure 6. SEM images and EDS analysis of the experimental Al-Fe-Si continuous casted ingots. (a) FS14; (b) FS11; (c) FS32; (d) FS21; and (e) FS31.
Metals 15 00578 g006
Figure 7. SEM images and segregation layer thickness of Al-Fe-Si alloy billets with different Fe/Si atomic ratios. (a) FS14; (b) FS11; (c) FS32; (d) FS21; (e) FS31; (f) segregation layer thickness.
Metals 15 00578 g007
Figure 8. OM diagram and grain size statistics of Al-Fe-Si alloy sheets with different Fe/Si atomic ratios. (a) FS14; (b) FS11; (c) FS32; (d) FS21; (e) FS31; (f) grain size statistics.
Metals 15 00578 g008
Figure 9. SEM images of Al-Fe-Si alloy sheets with different Fe/Si atomic ratios. (a) FS14; (b) FS11; (c) FS32; (d) FS21; (e) FS31.
Metals 15 00578 g009
Figure 10. Mechanical properties of Al-Fe-Si alloy sheets: (a) tensile curves; (b) tensile test results; (c) hardness; (d) forming performance.
Metals 15 00578 g010
Figure 11. Comprehensive properties of Al-Fe-Si alloys with different Fe/Si atomic ratios.
Metals 15 00578 g011
Figure 12. Contour maps of the effect of different Mn compositions on the β-AlFeSi phase in Al-Fe-Si alloys and phase fraction statistics.
Metals 15 00578 g012
Figure 13. Contour maps of the effect of different Mn compositions on the α-AlFeSi phase in Al-Fe-Si alloys and phase fraction statistics.
Metals 15 00578 g013
Figure 14. Contour maps of the effect of different Mn compositions on the AlFeSiMn phase in Al-Fe-Si alloys and phase fraction statistics.
Metals 15 00578 g014
Figure 15. Grain structure of Al-Fe-Si-Mn alloys with varying Fe/Si atomic ratios and Mn content. (a) Continuous casted ingots; (b) sheets.
Metals 15 00578 g015aMetals 15 00578 g015b
Figure 16. SEM images of Al-Fe-Si-Mn alloy billets with different Fe/Si atomic ratios and different Mn contents.
Metals 15 00578 g016
Figure 17. SEM images of the surface layer of Al-Fe-Si continuous casted ingots with different Mn contents and Fe/Si atomic ratios.
Metals 15 00578 g017
Figure 18. Hardness of Al-Fe-Si alloys with different Mn contents: (a) ingots; (b) sheets.
Metals 15 00578 g018
Figure 19. Tensile curves of Al-Fe-Si alloy sheets with different Mn contents: (a) Al-Fe-Si-0.4%Mn; (b) Al-Fe-Si-0.8%Mn; (c) Al-Fe-Si-1.2%Mn.
Metals 15 00578 g019
Figure 20. Polarization curves of Al-Fe-Si alloy sheets with different Mn contents.
Metals 15 00578 g020
Figure 21. Cupping value of Al-Fe-Si alloys with different Mn contents.
Metals 15 00578 g021
Figure 22. Comprehensive properties of Al-Fe-Si alloys with different Mn contents.
Metals 15 00578 g022
Table 1. Composition of Al-Fe-Si alloys selected according to contour maps.
AlloysFe/Si
(Atom Ratio)
Nominal Composition (wt.%)Actual Composition (wt.%)Al
(wt.%)
Intermetallics
FeSiFeSi
FS14(A1)1:40.240.460.230.48Bal.β-AlFeSi
FS11(A2)1:10.460.240.480.25Bal.β-AlFeSi (Main) and α-AlFeSi
FS32(A3)3:20.520.180.500.17Bal.β-AlFeSi and α-AlFeSi
FS21(A4)2:10.560.140.590.15Bal.β-AlFeSi and α-AlFeSi (Main)
FS31(A5)3:10.600.100.560.09Bal.α-AlFeSi
Table 2. Grain sizes (μm) of Al-Fe-Si billets/sheets with different Mn contents.
AlloyFS14FS11FS32FS21FS31
Al-Fe-Si211.8/15.5208.7/15.9213.1/17.4207.4/16.8203.2/16.3
Al-Fe-Si-0.4Mn204.6/17.1196.7/16.6203.9/15.8193.3/14.9195.6/16.7
Al-Fe-Si-0.8Mn186.8/16.1183.1/15.8176.6/13.8193.1/14.4174.2/16.2
Al-Fe-Si-1.2Mn174.1/15.9179.5/16.4174.1/15.5169.6/16.2172.5/15.8
Table 3. EDS analysis of the second phase in continuous casted ingots.
Element/LocationS1S2S3S4S5S6S7S8S9
Fe6.519.5610.115.967.3815.186.176.7610.72
Si2.286.081.803.124.640.584.473.462.91
Mn1.231.011.952.663.886.504.123.339.94
Al89.9883.3586.1488.2684.1077.7485.2486.4576.43
Table 4. Tensile strength (MPa) and elongation (%) of Al-Fe-Si alloy sheets.
FS14FS11FS32FS21FS31
0.4 Mn169.9
5.35%
169.2
8.08%
156.4
7.02%
159.2
5.34%
154.5
5.92%
0.8 Mn189.4
7.32%
182.6
3.52%
172.6
4.34%
182.1
4.61%
183.3
5.28%
1.2 Mn205.3
6.44%
209.7
5.52%
202.9
3.18%
200.1
3.37%
210.9
4.43%
Table 5. Corrosion resistance of Al-Fe-Si sheets with different Mn contents.
AlloysCorrosion Potential
Ecorr(V)
Corrosion Current Density
Icorr(A·cm−2)
FS14−0.992.576 × 10−7
FS14Mn04−0.973.283 × 10−7
FS14Mn08−0.893.314 × 10−7
FS14Mn12−0.835.299 × 10−7
Disclaimer/Publisher’s Note: The statements, opinions and data contained in all publications are solely those of the individual author(s) and contributor(s) and not of MDPI and/or the editor(s). MDPI and/or the editor(s) disclaim responsibility for any injury to people or property resulting from any ideas, methods, instructions or products referred to in the content.

