Article

Effect of Elastic Strain Energy on Dynamic Recrystallization During Friction Stir Welding of Dissimilar Al/Mg Alloys

Institute of Materials Joining, Shandong University, Jinan 250061, China
*
Author to whom correspondence should be addressed.
Metals 2025, 15(6), 577; https://doi.org/10.3390/met15060577
Submission received: 7 April 2025 / Revised: 19 May 2025 / Accepted: 21 May 2025 / Published: 23 May 2025
(This article belongs to the Special Issue Friction Stir Welding and Processing of Dissimilar Materials)

Abstract

Dynamic recrystallization (DRX) is a critical microstructural evolution mechanism in friction stir welding (FSW) of metallic materials, directly determining the mechanical properties and corrosion resistance of weld joints. In the field of DRX simulation, conventional models primarily consider intragranular dislocation strain energy as the driving force for recrystallization, while neglecting the elastic strain energy generated by coordinated deformation in polycrystalline materials. This study presents an improved DRX modeling framework that incorporates the multiphase-field method to systematically investigate the role of elastic strain energy in microstructural evolution during FSW of Al/Mg dissimilar materials. The results demonstrate that elastic strain energy can modulate nucleation and the growth of recrystallized grains during microstructural evolution, resulting in post-weld average grain size increases of 0.8% on the Al side and 2.1% on the Mg side in the FSW nugget zone. This research provides new insights into multi-energy coupling mechanisms in DRX simulation and offers theoretical guidance for process optimization in dissimilar material welding.

Graphical Abstract

1. Introduction

The structures or components made by dissimilar alloys of aluminum/magnesium (Al/Mg) are more widely used for achieving structural lightweighting, yet the joining of Al to Mg poses significant technical challenges [1,2]. Friction stir welding (FSW), a solid-state joining process, can effectively avoid common defects (e.g., solidification cracks, porosity) in fusion welding of Al and Mg alloys, thereby producing defect-free dissimilar joints [3,4]. During FSW, the weld nugget zone (WNZ) undergoes pronounced dynamic recrystallization (DRX) driven by intense thermo-mechanical actions [5,6]. DRX reconstructs microstructural distributions through grain refinement and texture reorganization, ultimately determining the joint’s mechanical properties and service performance [7]. The systematic investigation of microstructural evolution is critical for the process optimization of FSW. Although experimental methods can characterize post-weld microstructures, real-time observation of high-temperature DRX remains challenging, and destructive sampling after welding cannot fully capture the dynamic evolution behaviors of microstructures that occurred in WNZ [5]. In contrast, numerical modeling enables the prediction of DRX nucleation/growth behaviors and visual tracking of microstructural evolution [8]. Among existing DRX simulation approaches, the phase-field method has been widely adopted in welding simulations due to its diffuse-interface treatment and inherent capability for multi-physics coupling [9].
In phase-field modeling of grain structures, grain boundary migration is driven by thermodynamic potential gradients, with free energy functionals describing energy minimization [10,11]. During FSW, severe plastic deformation induces heterogeneous energy accumulation (stored energy) within grains. External loading triggers dislocation multiplication/slip, generating dislocation strain energy (quantified by dislocation density). Concurrently, anisotropic deformation causes lattice mismatch at grain boundaries, producing orientation-dependent elastic strain energy. These combined effects constitute the stored energy that drives DRX. The elastic strain energy holds substantial physical significance, yet its role has been systematically overlooked in prior studies [12]. Previous investigations [12] have quantified stored energy through dislocation density, focusing on dislocation strain energy contributions while neglecting systematic quantification of elastic strain energy effects.
This work presents a multiphase-field approach incorporating coupled elastic strain energy to investigate microstructural evolution in Al/Mg dissimilar FSW. Using this novel simulation scheme, the mechanistic role of elastic strain energy in DRX is investigated. Through numerical simulations, the DRX processes in FSW of Al/Mg alloys are comparatively analyzed under conditions with/without the elastic strain energy coupling, and the contribution of elastic strain energy is quantitatively evaluated. Furthermore, spatiotemporal microstructural evolution patterns are examined to elucidate elastic strain energy’s effects on grain boundary migration kinetics and nucleation behavior in WNZ.

2. Model Formulation

Microstructural evolution during FSW is fundamentally controlled by macroscopic thermomechanical variables (temperature, strain rate, and stress). These variables were obtained by the thermomechanical model in FSW and then taken as the inputs for the phase-field simulations of DRX. The present model is developed based on the conventional model [12]. To maintain conciseness, this paper focuses primarily on novel developments beyond the conventional framework, while comprehensive details and complete parameter sets can be found in Reference [12].

2.1. Thermo-Mechanical Model

In this study, 6061-T6 Al alloy and AZ31B-H24 Mg alloy were selected as the base materials, with the detailed chemical compositions listed in Table 1. The plate dimensions were standardized at 200 mm (L) × 70 mm (W) × 3 mm (T). The FSW tool was made of H13 steel. The shoulder diameter was 12 mm, while a right-hand threaded tapered pin had a major diameter of 4.2 mm at the root and 3.2 mm at the tip, with a length of 2.75 mm (as shown in Figure 1). The Mg alloy plate was placed on the advancing side (AS), while the Al alloy plate was positioned on the retreating side (RS). During the experimental process, clamping plates were employed to rigidly constrain the side edges of the specimen to ensure stability. Correspondingly, in the numerical simulation, fully fixed boundary conditions were applied to the left and right edges, while a Z-direction displacement constraint was imposed on the bottom surface. The stirring tool and workpiece remained in continuous contact, with their interaction characterized by a shear friction model, where the friction coefficient was set to 0.46. Regarding thermal boundary conditions, a higher heat transfer coefficient of 5 N/(s·mm·°C) was assigned to the left- and right-side surfaces in contact with the fixture, the bottom surface, and the stirring tool–workpiece interface to accurately simulate the actual heat transfer process. The remaining surfaces were assigned a lower heat transfer coefficient of 0.02 N/(s·mm·°C) to reflect natural heat dissipation conditions. Meanwhile, the tool was offset 0.3 mm toward the Mg alloy side and tilted 2.5° in the opposite direction of welding, with the shoulder plunge depth set at 0.15 mm. During welding, the rotational speed of the tool was maintained constant at 800 rpm, the welding speed was 50 mm/min, and the welding length was set to 50 mm.
The Deform-3D simulation platform was employed to conduct a numerical simulation of the FSW process. The plastic deformation behavior of the workpieces was characterized using the modified S-T constitutive model (Equation (1)) [13].
σ am = ξ am α ln ε ˙ ¯ exp Q a R T A 1 / n s + 1 + ε ˙ ¯ exp Q a R T A 2 / n s 1 / 2
where σam represents the modified flow stress, ξam denotes the modification coefficient, α and A are material-dependent constants, ε ˙ ¯ stands for the equivalent strain rate, Qa signifies the deformation activation energy, R is the gas constant, T indicates temperature, and ns represents the stress coefficient. All constitutive parameters were strictly configured according to reference [12].
The phase-field simulation domain, limited to 50 μm × 50 μm, was treated as a single material point within the macroscopic FEM framework. This assumption implies spatially uniform temperature and strain rate fields within the phase-field calculation region. Accordingly, checking points were established in the WNZ of the macroscopic model to extract the thermomechanical parameters experienced by the microscopic region. Specifically, during the initial welding stage, two checking points were established on a transverse cross-section 25 mm from the starting point along the welding direction (WD). These included paired points spaced at 0.2 mm intervals on both sides of the Al/Mg interface (Al side and Mg side, respectively), positioned at a depth of 1.5 mm (ND), as depicted in Figure 2. This separation between checking points exceeds the characteristic length scale of intermetallic compound (IMC) formation. Consequently, the effects of IMCs were not incorporated into the current study. The temporal reference (t = 0 s) was defined as the instant of complete tool plunge and initiation of quasi-steady state welding, serving as the data for subsequent thermomechanical data acquisition and analysis.

2.2. DRX Model

As shown in Figure 3, a crystallographic orientation mismatch between adjacent grains induces elastic distortion under external stress during polycrystalline coordinated deformation. This grain-to-grain elastic distortion (generating elastic strain energy) combines with intragranular lattice distortion caused by dislocation accumulation (producing dislocation strain energy) to collectively elevate the system’s stored energy, thereby creating a metastable state. Elevated temperatures facilitate lattice migration, enabling stored energy-driven reconstruction of crystalline structures through grain refinement and orientation modification. These coordinated phenomena collectively constitute the DRX process. Conventional phase-field models [12] exclusively considered dislocation strain energy during FSW, overlooking elastic strain energy contributions. This study extends this dislocation-dominated framework by incorporating elastic strain energy, thereby establishing a coupled elastic-dislocation energy DRX model while maintaining implementation via the multi-phase field (MPF) approach.
In the MPF model, each grain is considered as an individual phase, represented by the phase field parameter φi denoting the volume fraction of the i-th grain. Within grain i, φi = 1; outside grain i, φi = 0; and at the boundary of grain i, 0 < φi < 1. The phase field parameters must satisfy i = 1 N φ i = 1 , where N is the total number of grains, which gradually increases during the DRX process. For computational efficiency, only n phase fields need to be stored since most phase field values are zero in each micro-region, where n represents the number of non-zero phase field variables in the micro-region and its four surrounding neighborhoods.
The grain growth process is described by the following MPF model [9]:
φ i t = 2 M n × j = 1 n W φ i φ j + a 2 2 2 φ i 2 φ j 8 π φ i φ j Δ G i j dis + Δ G i j el
M = π 2 M 0 8 δ T exp Q b R T
W = 4 γ δ
a = 2 π 2 δ γ
where t is time, M is phase field mobility, W is the energy barrier coefficient, and a is the gradient coefficient. Here, 8 / π φ i φ j is a normalization factor obtained from interface smoothing interpolation functions, ensuring numerical stability of the driving force term at interfaces and maintaining consistency with analytical approximations of interface energy [14]. Δ G i j dis represents the dislocation strain energy difference between grains, expressed as Δ G i j dis = 1 / 2 μ b 2 ( ρ i ρ j ) , where μ is the shear modulus, b is the Burgers vector, and ρi is the dislocation density of grain i. Δ G i j el denotes the elastic strain energy difference between grains. M0 is the mobility coefficient, δ represents grain boundary thickness, γ is the boundary energy, and Qb is the activation energy for self-diffusion.
To calculate dislocation strain energy, appropriate dislocation density values must be obtained. For this purpose, the Laasraoui–Jonas (L-J) dislocation density model [15] is employed:
d ρ i d ε = h r ρ i
h = h 0 ε ˙ m exp m Q b / R T
r = r 0 ε ˙ m exp m Q b / R T
where d ε = ε ˙ d t , ε ˙ represents the strain rate, h denotes the hardening term, r represents the softening term, h0 and r0 are their respective coefficients, and m is the strain rate sensitivity coefficient.
Boundary points with dislocation densities exceeding the critical value are considered lattice sites that satisfy nucleation conditions. The nucleation quantity is determined by the nucleation rate, with the number of nucleations per time step dn and the nucleation rate n ˙ given by:
d n = n ˙ Δ t n g Δ x Δ y / δ
n ˙ = c ε ˙ d exp Q a / R T
where ng represents the number of lattice points satisfying nucleation conditions, and c and d are fitting coefficients. Nucleation positions are randomly selected among eligible sites, with nucleation radii specified as rAl = 0.8 μm and rMg = 0.8 μm [12]. In FSW processes, materials simultaneously undergo both continuous (CDRX) and discontinuous (DDRX) dynamic recrystallization [5]. The numerical model employs a circular selection method to simulate these two recrystallization mechanisms: For the characteristic grain boundary protrusion nucleation in DDRX and the typical orientation reorganization feature in CDRX, the model establishes new grains by modifying only the crystallographic orientation of the overlapping portions between designated circular regions near grain boundaries and the parent grains, rather than conventionally treating the entire selected regions as new grains.

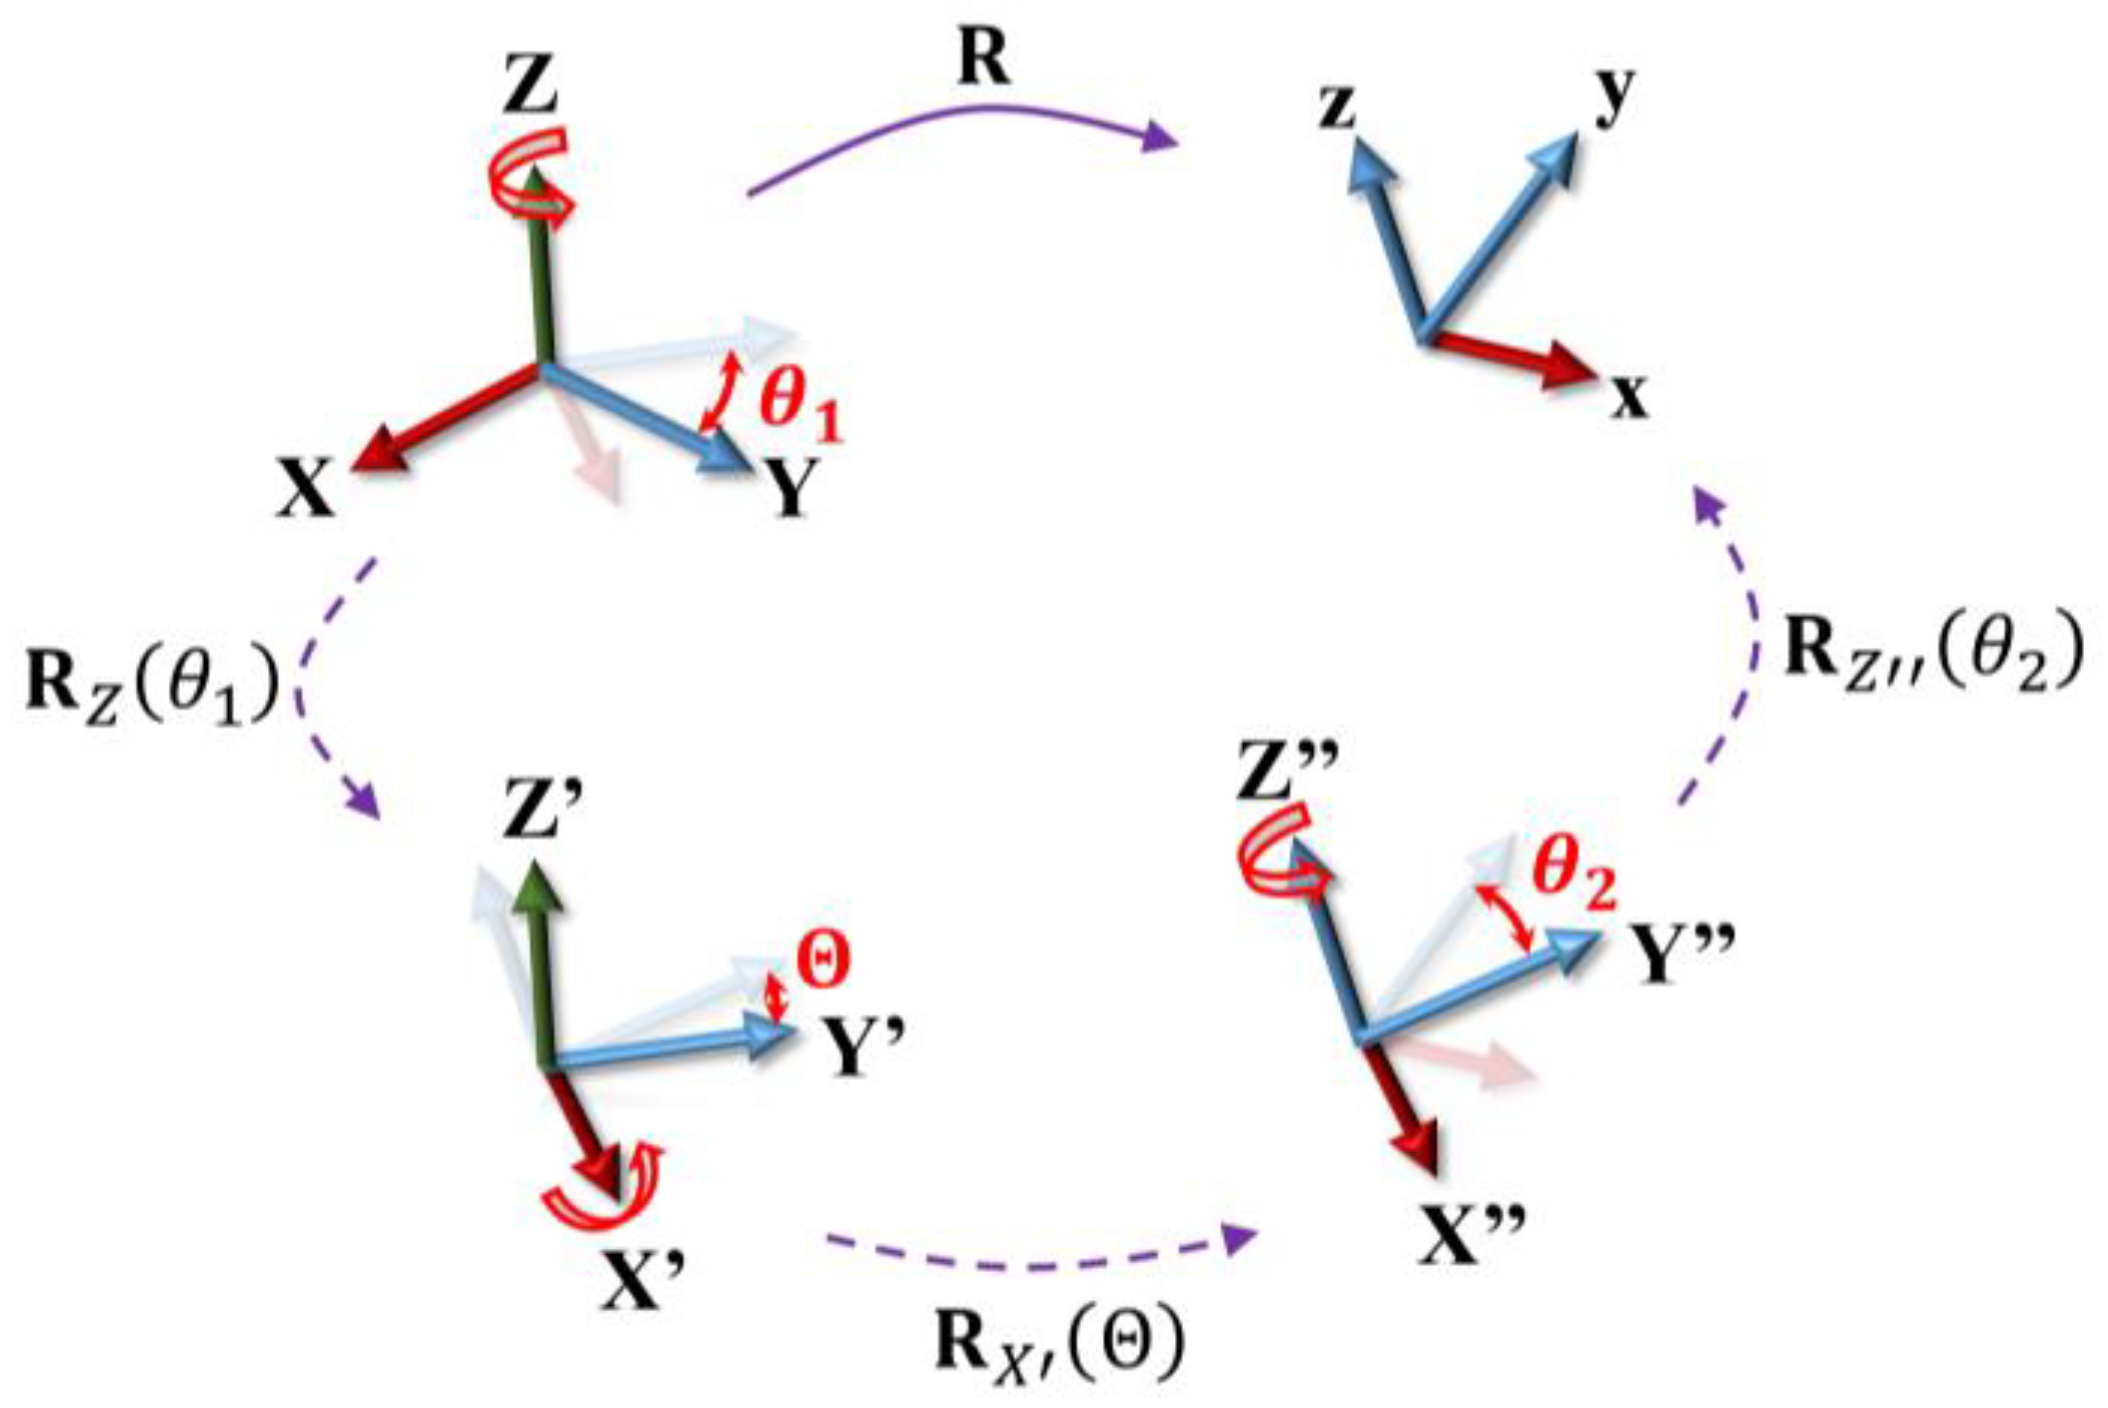
2.3. Elastic Strain Energy

In the MPF framework, the characteristic of the diffuse interface permits the coexistence of multiple material phases within interfacial regions, requiring appropriate homogenization techniques to define interfacial elastic strain, stress, and stiffness tensors. Current homogenization approaches mainly include Khachaturyan (KHS) [16], Steinbach–Apel (SAS) [17], Voigt–Taylor (VTS) [18], and partial rank one [19]. Considering the relatively small eigenstrain during DRX, the KHS homogenization method was selected for this investigation. The KHS approach fundamentally computes the homogenized elastic stiffness tensor through interpolation functions (Equation (11)), thereby providing mechanically consistent descriptions of interfacial behavior.
= i = 1 N φ i i
The elastic strain energy density ψ el in this system is expressed as follows:
ψ el = 1 2 ε el : : ε el
where εel is the elastic strain.
The eigenstrain difference between grains of the same type is assumed to be zero, thus temporarily neglecting the calculation of eigenstrain in this study. Consequently, the elastic strain energy density difference Δ G i j el can be derived as:
Δ G i j el = ψ el φ i ψ el φ j = ε el : i j : ε el
The elastic matrix of individual grains in the global coordinate system (global-g) can be determined from their crystallographic orientations, enabling the calculation of phase-specific elastic energies. Crystal orientation is mathematically described using Euler angles that specify the rotational transformation from the sample coordinate system to the crystal coordinate system (local-l). Following Bunge’s convention, this orientation relationship is established through three sequential angular transformations: (1) a rotation by θ1 about the original Z-axis, (2) a rotation by Θ about the transformed X-axis (X′), and (3) a rotation by θ2 about the resultant Z-axis (Z″), as illustrated in Figure 4. This coordinate transformation is implemented through rotation matrix R, which can be expressed as the product of three elementary rotation matrices (Equation (14)), thus providing a complete mathematical description of crystallographic orientation in three-dimensional space.
R = R Z θ 1 R X Θ R Z θ 2
where RZ(θ1) is the rotation matrix about the initial Z-axis, RX(θ1) is the rotation matrix about the intermediate X’-axis, and RZ″(θ1) is the rotation matrix about the final Z″-axis.
Through the relationship between the stress tensor σ l = R T σ g R and the strain tensor ε l = R T ε g R in the crystal coordinate system and the global coordinate system, the matrix relationship in Voigt notation [20] can be derived as σ l v = M σ g v , ε l v = M ε g v , where M is called the Bond matrix. Further derivation yields σ g v = M 1 l M ε g v , meaning the relationship between the elastic matrix g in the global coordinate system and the elastic matrix l in the crystal coordinate system is:
g = M 1 l M
In the elastic constitutive relationship between the single-crystal Mg alloy and the HCP structure, according to crystal symmetry, its elastic constant matrix in Voigt notation has a simplified form containing only 5 independent elastic constants:
l hcp = C 11 C 12 C 13 0 0 0 C 12 C 11 C 13 0 0 0 C 13 C 13 C 33 0 0 0 0 0 0 C 44 0 0 0 0 0 0 C 44 0 0 0 0 0 0 C 11 C 12 / 2
where C11 and C33 describe the linear elastic response along the a-axis (in-plane) and c-axis (vertical direction), respectively, C12 describes the coupling effect along the a-axis direction, C13 describes the coupling effect between the a-axis and c-axis directions, and C44 describes the shear modulus. According to reference [21], the five elastic constants for Mg single crystal are: C11 = 59.7 GPa, C33 = 60.0 GPa, C44 = 14.6 GPa, C12 = 26.2 GPa, C13 = 21.7 GPa.
For the single-crystal Al alloys with an FCC structure, due to their high symmetry, the elastic matrix can be expressed as:
l fcc = C 11 C 12 C 12 0 0 0 C 12 C 11 C 12 0 0 0 C 12 C 12 C 11 0 0 0 0 0 0 C 44 0 0 0 0 0 0 C 44 0 0 0 0 0 0 C 44
This has 3 independent elastic constants: C11, C12, and C44. Here, C11 is the stiffness constant along crystal principal axes, describing the elastic behavior in vertical directions; C12 describes the interaction between principal axis and shear directions; and C44 is the shear modulus describing crystal response under shear stress. According to reference [22], the three elastic constants for Al single crystals are C11 = 107.3 GPa, C12 = 60.8 GPa, and C44 = 28.3 GPa.

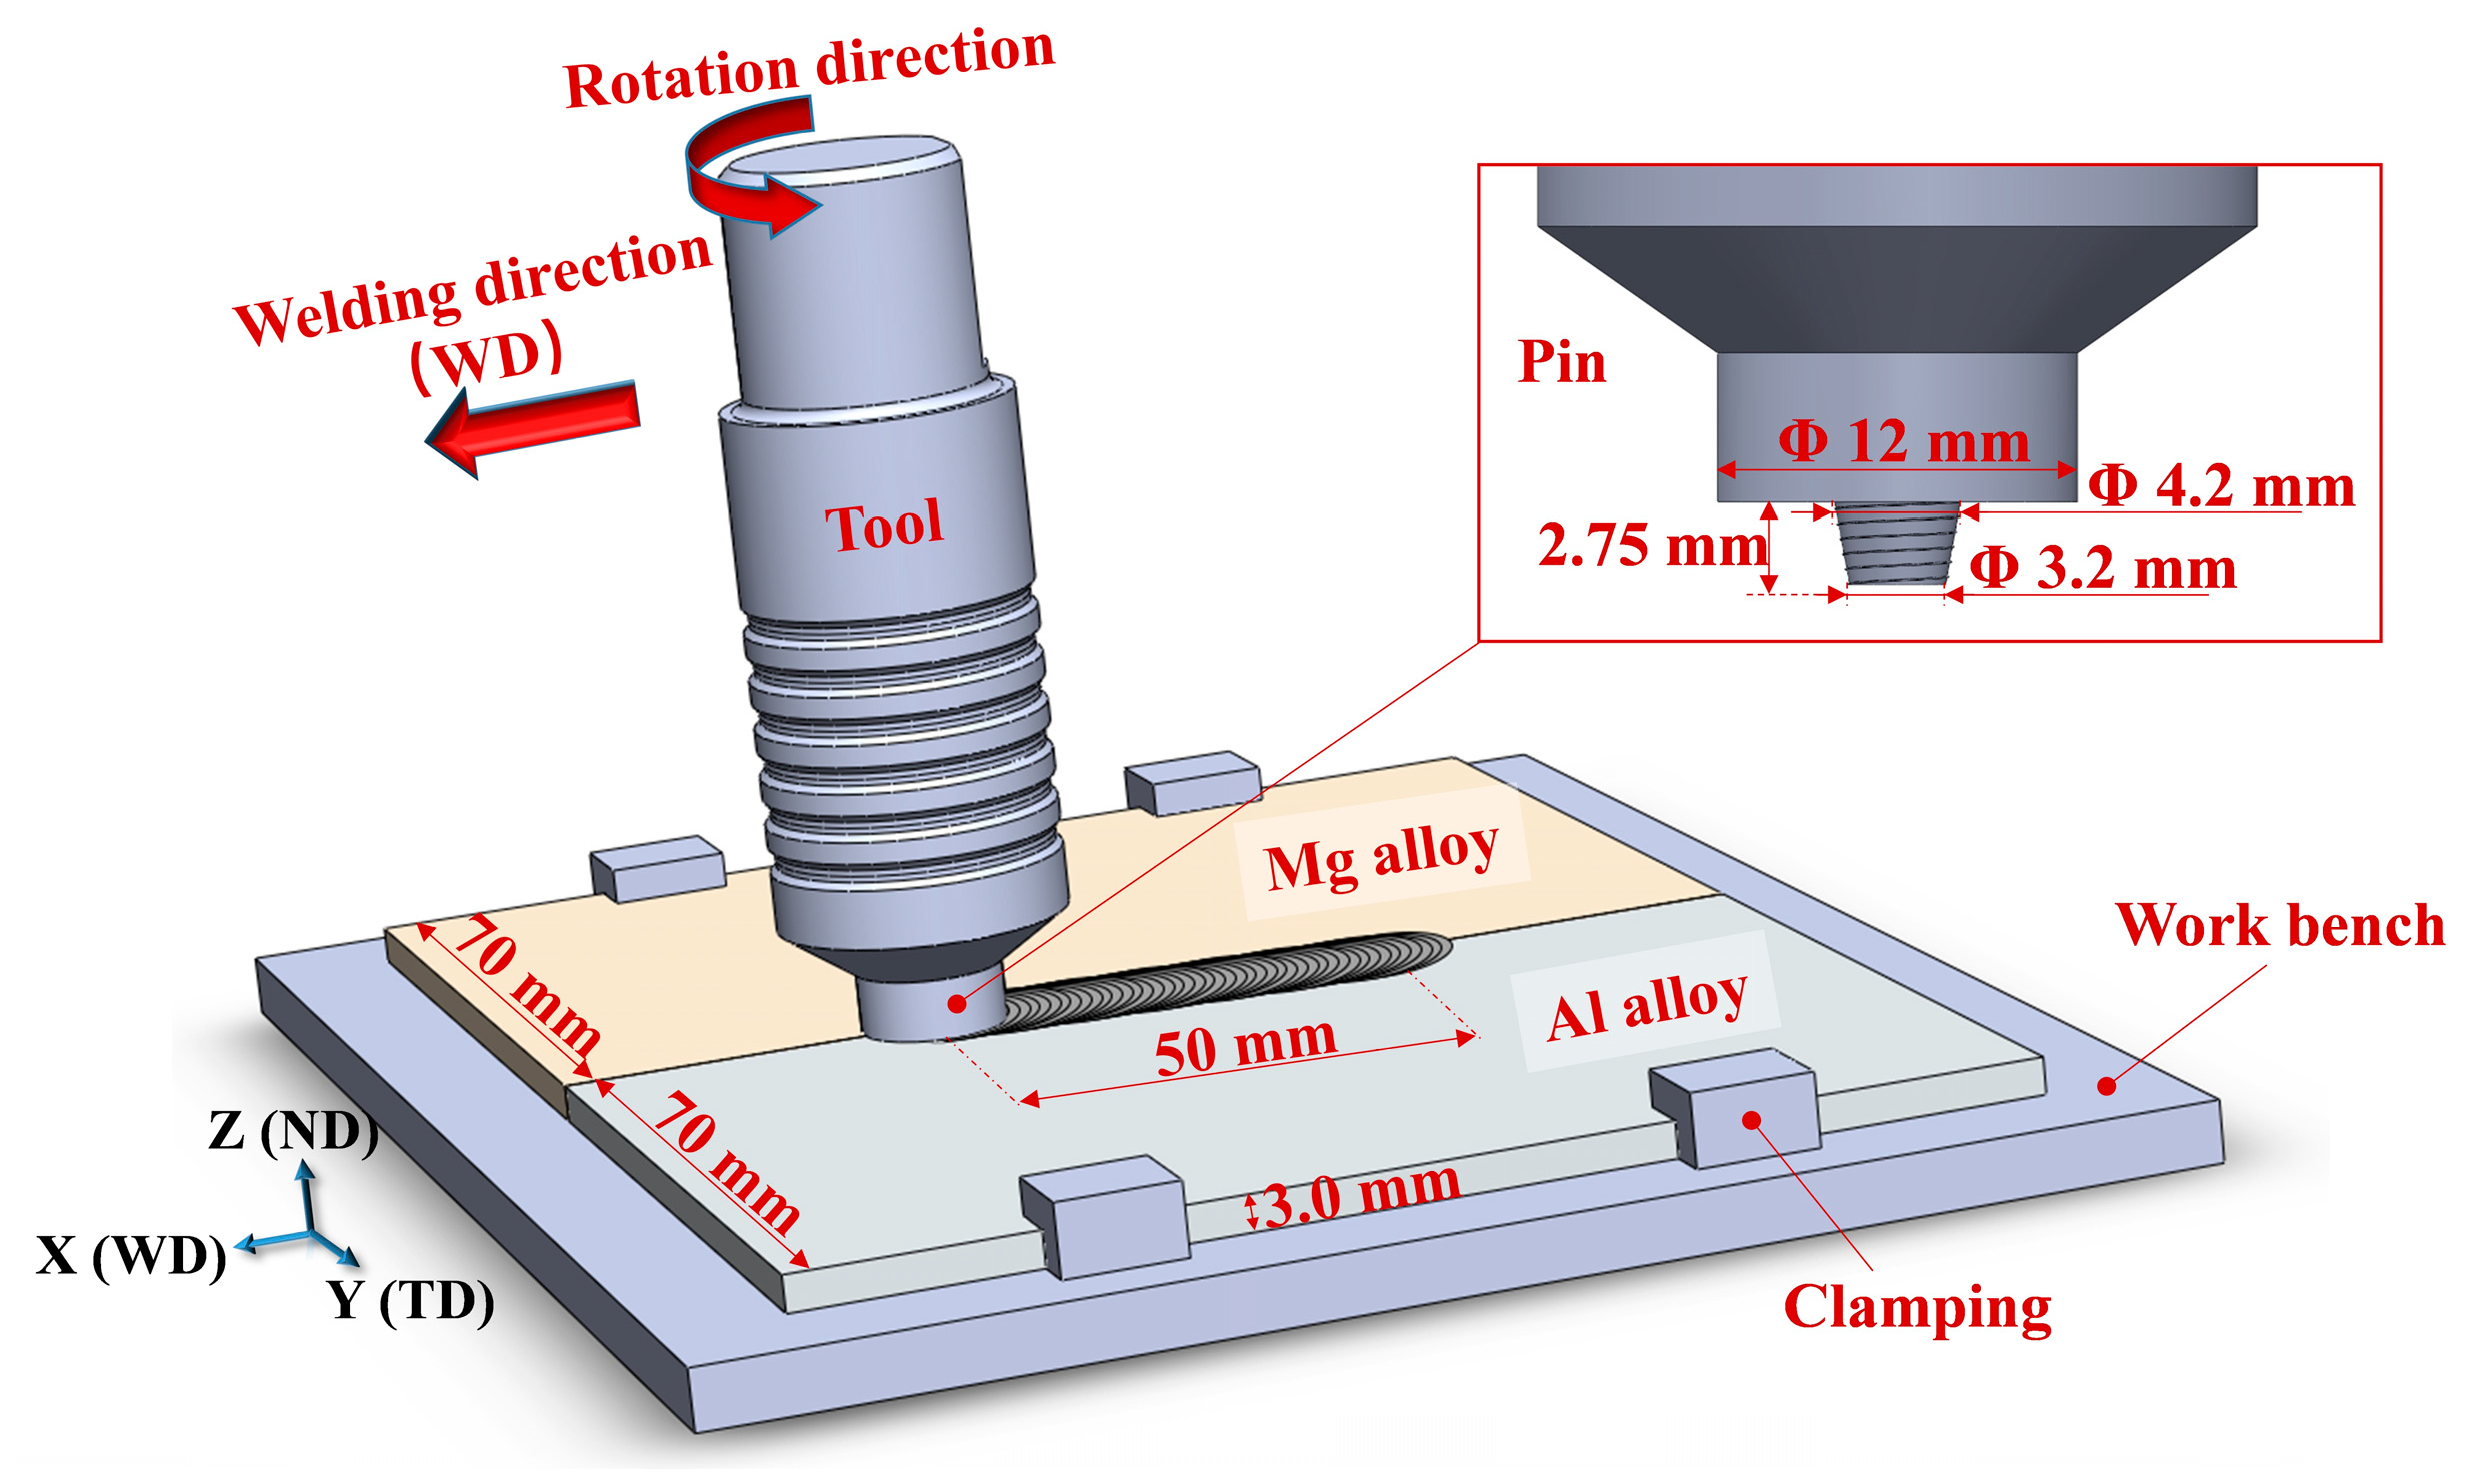
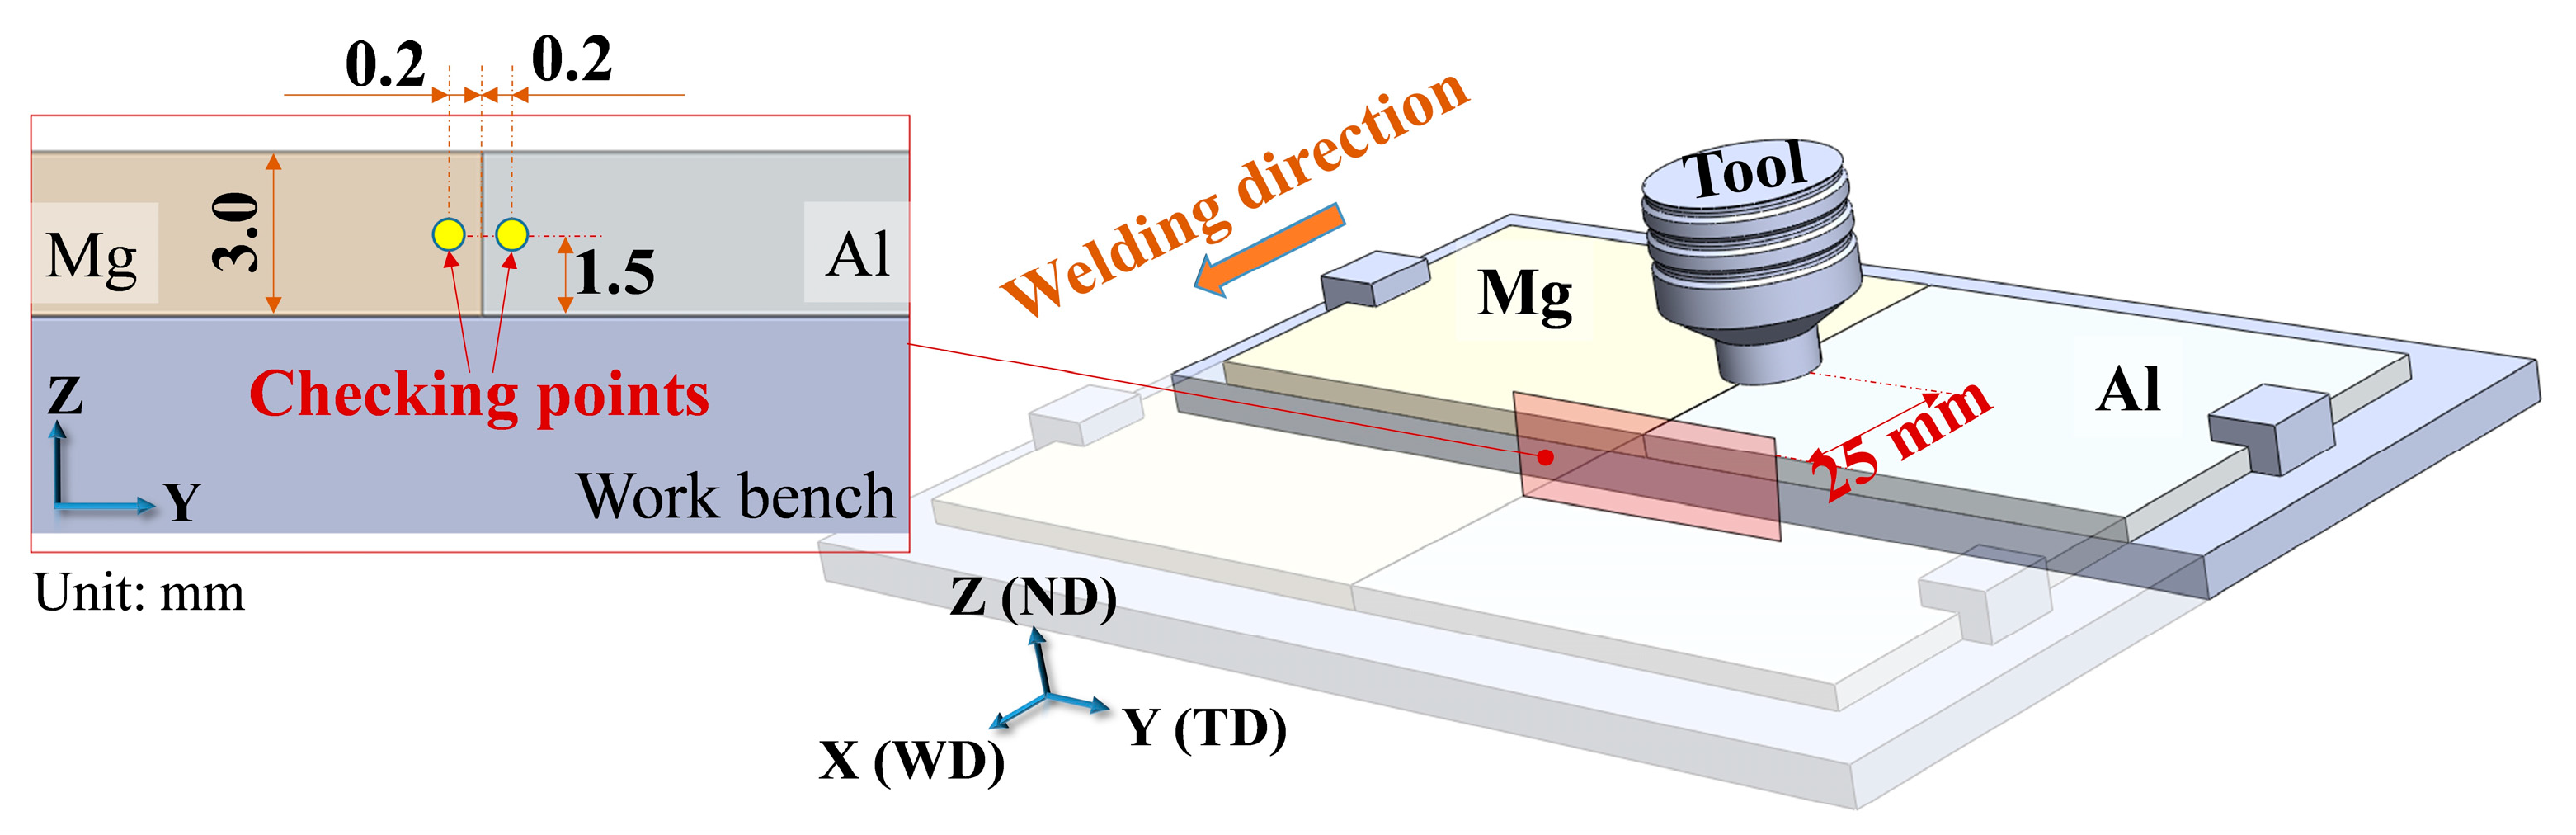
2.4. Model Initialization

The phase-field governing equations were numerically solved using the finite difference method (FDM) with symmetric boundary conditions applied at all domain boundaries. Spatial discretization employed a 300 × 300 uniform grid, with grid spacings of Δx = Δy = 0.15 μm for Al alloy and Δx = Δy = 0.10 μm for Mg alloy regions, as illustrated in Figure 5. Elastic strain energy computations utilized the finite element method (FEM), implementing both displacement and force boundary conditions on the base metal domain. The displacement boundary conditions constrained all four corner nodes, while force boundary conditions were derived from macroscopic stress data obtained at checking points. For computational efficiency, the elastic problem was formulated as a plane stress approximation.
Consistent with the conventional model [12], temperature and strain rate profiles at checking points were maintained unchanged. Stress field analysis demonstrated negligible variation between the two checking points, justifying the use of interpolated stress values from their geometric midpoint as boundary traction inputs for the microscopic finite element model (Figure 6). The applied boundary tractions were incrementally updated based on stress differentials between successive time steps.
Stress state data were extracted at 1.0 s intervals, with Figure 6 illustrating the temporal evolution of multiaxial stresses during FSW. Overall, stress values were relatively low in the initial welding stage, exhibited significant fluctuations between 10 and 35 s, and eventually stabilized. Notably, the normal stress components in the x- and y-directions demonstrated synchronous variation behavior, distinct from the shear stress evolution pattern. Furthermore, the normal stress amplitudes substantially exceeded that of shear stress, confirming their dominant role in the FSW stress field.
For precise micro-scale stress distribution calculations, experimentally obtained Euler angles from EBSD measurements of the base metals were employed to define initial grain orientations. Figure 7 presents the {100}, {110}, and {111} pole figures for Al (FCC) and the {0001}, {10–10}, and {11–20} pole figures for Mg (HCP), comparing experimental results (top) and simulations (bottom). On the Al side, the experimental data reveal a weak but noticeable {111} fiber texture parallel to the normal direction (ND), suggesting a residual rolling-induced texture. The simulated pole figures reproduce this trend qualitatively, albeit with lower intensity due to a limited number of input grains in the model. On the Mg side, the base metal exhibits a strong basal texture with {0001} poles sharply aligned along ND, characteristic of rolled HCP structures. This pronounced basal texture is well captured by the simulation, confirming the validity of the initial grain orientation assignment and the model’s ability to reproduce pre-weld texture states.

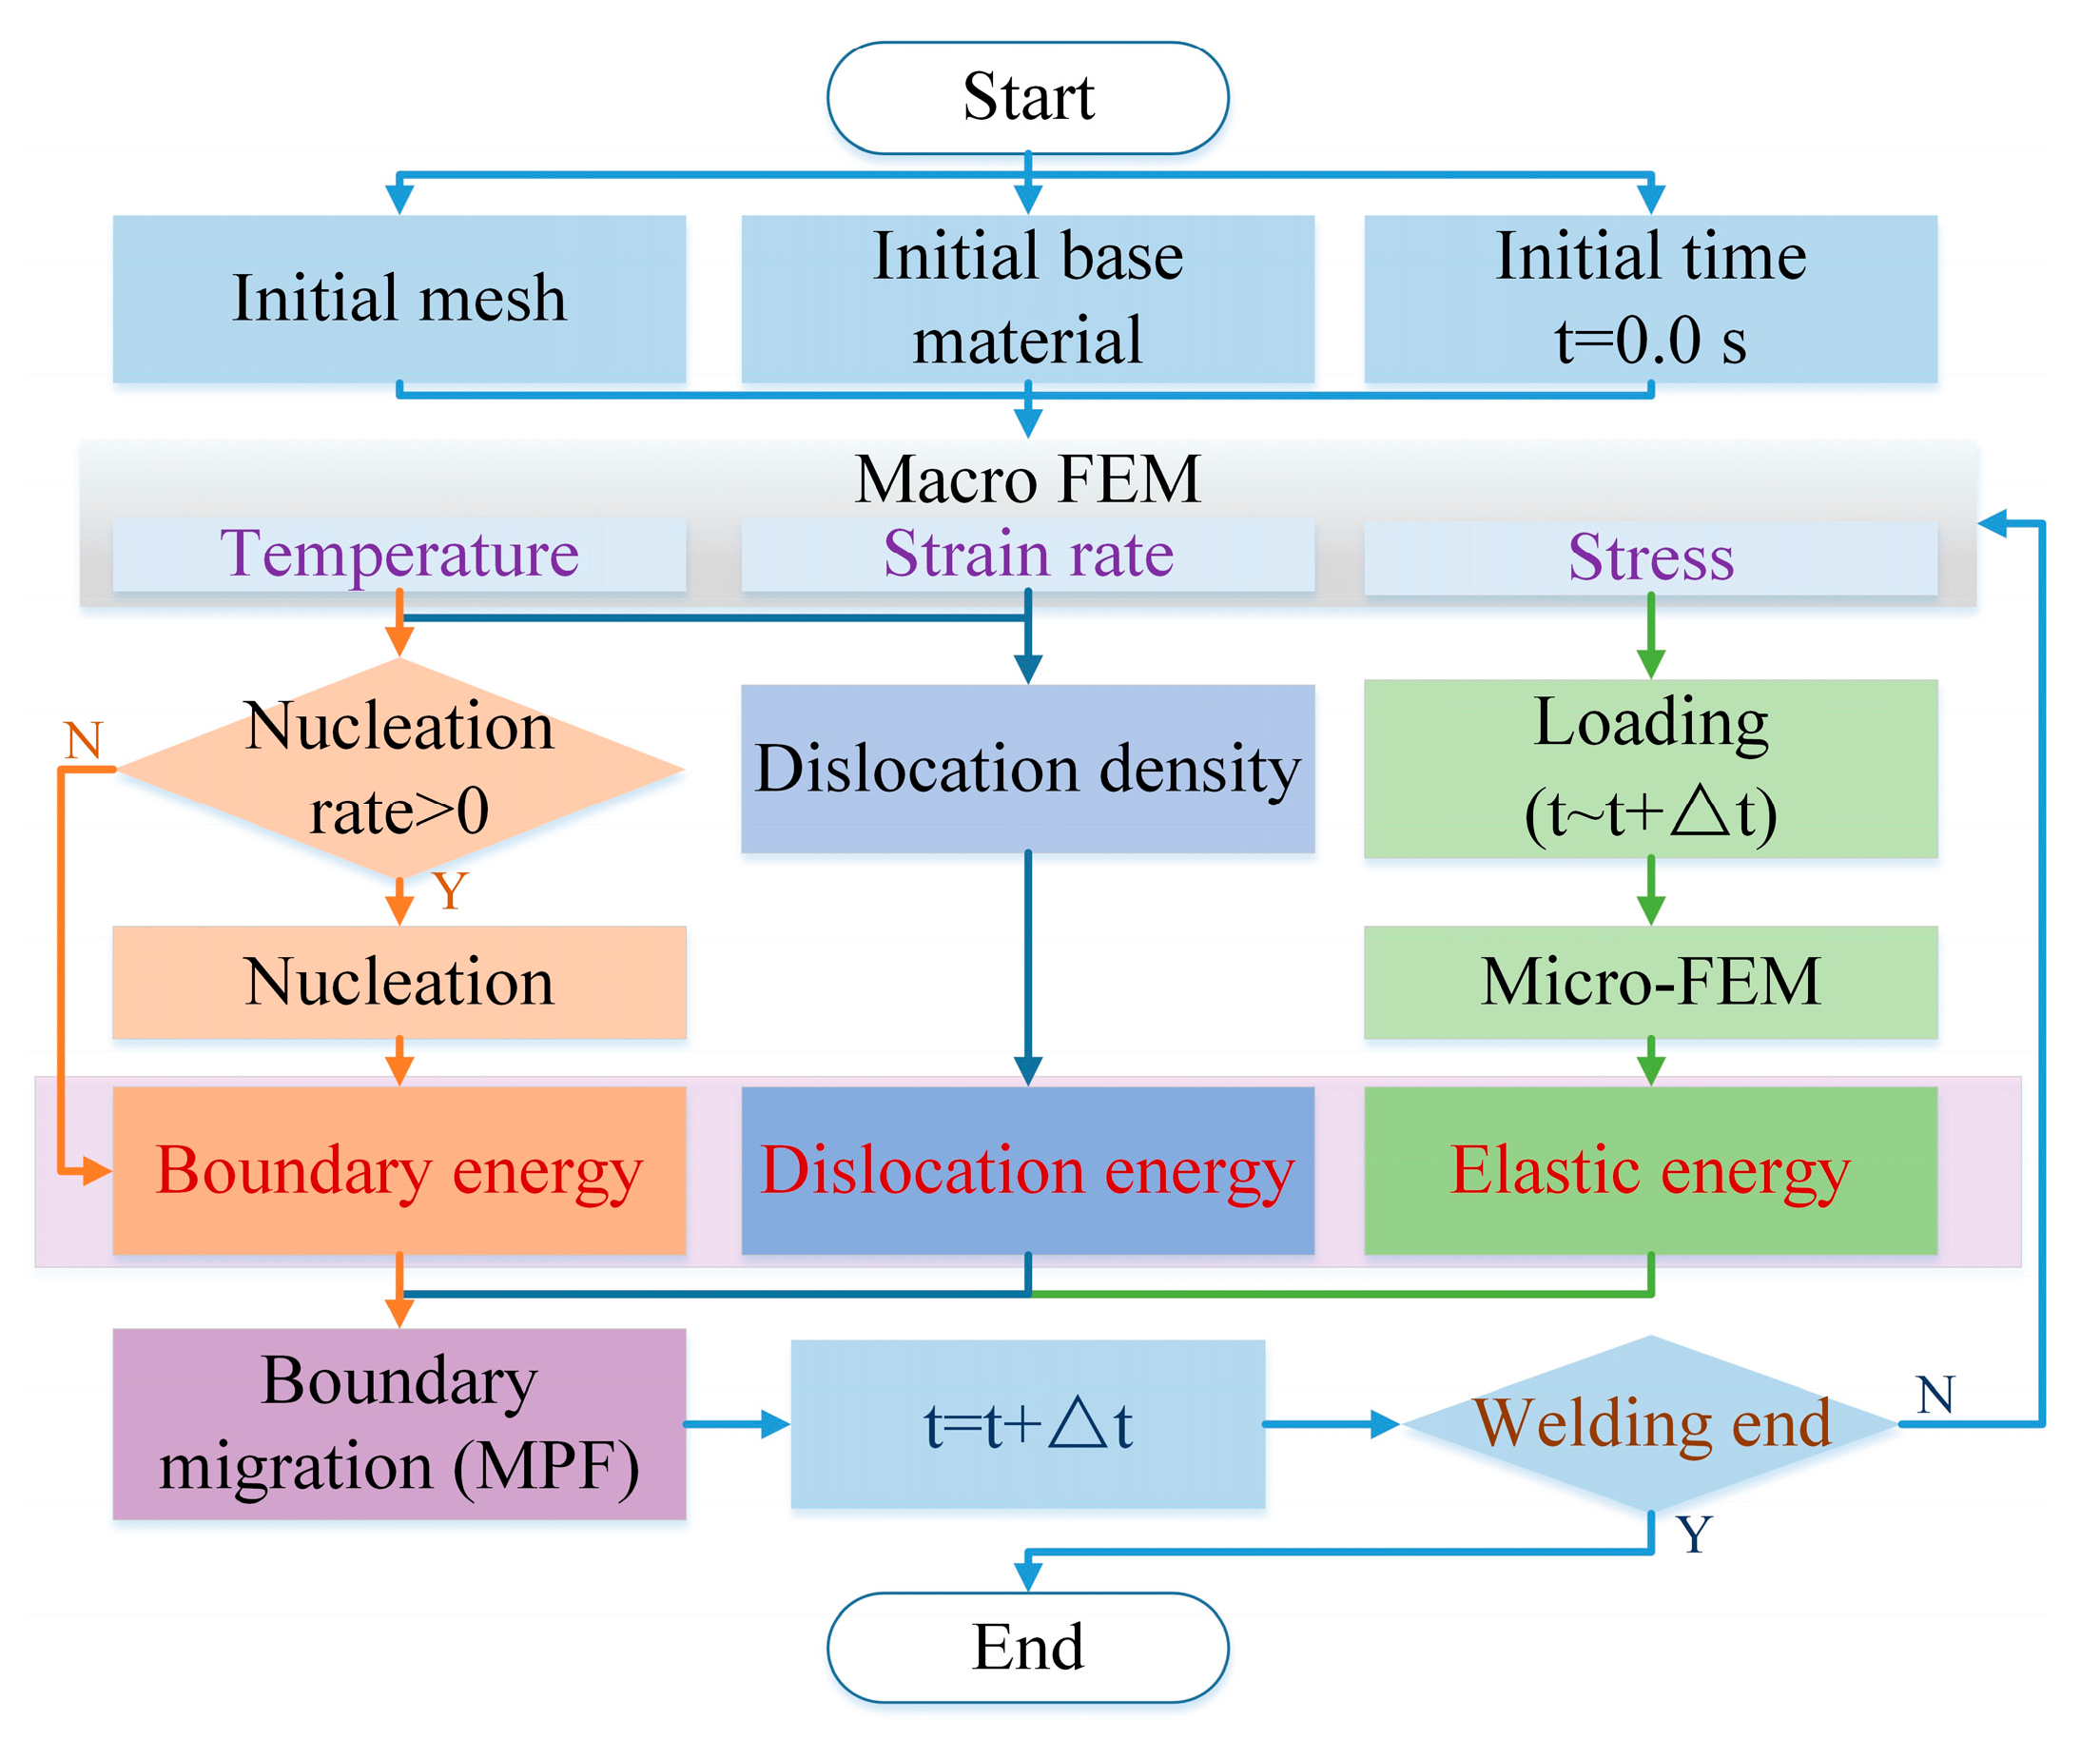
2.5. Simulation Process

This study employs a finite element–finite difference coupling algorithm (FEM-FDM) to construct the DRX numerical model, with the computational workflow shown in Figure 8. The bidirectional coupling between finite element meshes and finite difference grids was established through a hybrid mesh architecture. Macroscopic FEM computations provide the temporal evolution of temperature, strain rate, and stress within micro-regions, where load increments are determined by stress variations during micro-scale time stepping. To ensure solution convergence, an adaptive substep division strategy is adopted, and the Newton–Raphson iteration method is applied to solve the stiffness equation, thereby obtaining displacement increments, stress increments, and elastic energy density.
Dislocation density evolution is computed via the L-J dislocation model to obtain dislocation strain energy. Nucleation events are evaluated at each time step based on nucleation rate criteria. When nucleation conditions are met, grain information updates occur with new orientation assignments. Given the high-strain plastic deformation characteristics of FSW, the model disregards minor orientation deviations from dislocation slip, focusing exclusively on orientation mutations during recrystallization nucleation.
A grain orientation parameter determination method based on post-weld experimental characterization replaces traditional Slip Systems Theory analysis [23], avoiding convergence difficulties associated with complex grain orientation evolution. This approach substantially reduces nonlinear iteration challenges while preserving the physical authenticity of orientation evolution by utilizing experimental data as orientation benchmarks, compared to the computationally intensive task of modeling dynamic orientation evolution from slip system principles. Micro-region phase-field evolution employs a local neighborhood optimization algorithm [24] that computes interactions exclusively among nearest-neighbor lattice points, dramatically lowering computational complexity. This computational framework successfully captures multi-energy-driven recrystallization behavior in micro-regions, establishing a reliable numerical tool for investigating FSW microstructural evolution.
After obtaining the calculation results, it is necessary to verify the results. The welding parameters match those in reference [5], allowing the direct use of reported data (e.g., grain sizes). Unavailable data (e.g., grain orientations) were obtained via EBSD experimental characterization. This combined literature–experimental approach ensures scientific validity while meeting study objectives. FSW experiments were conducted using the same materials and process parameters as those in the simulation scheme. Weld specimens were extracted from the same location, and the TD–ND plane of the weld was subjected to mechanical polishing followed by ion polishing. Electron backscatter diffraction (EBSD) was employed to scan the same sampling points on the weld, obtaining microstructural data including grain size and crystallographic orientation distribution. These experimental results were then compared with the simulation data for validation.

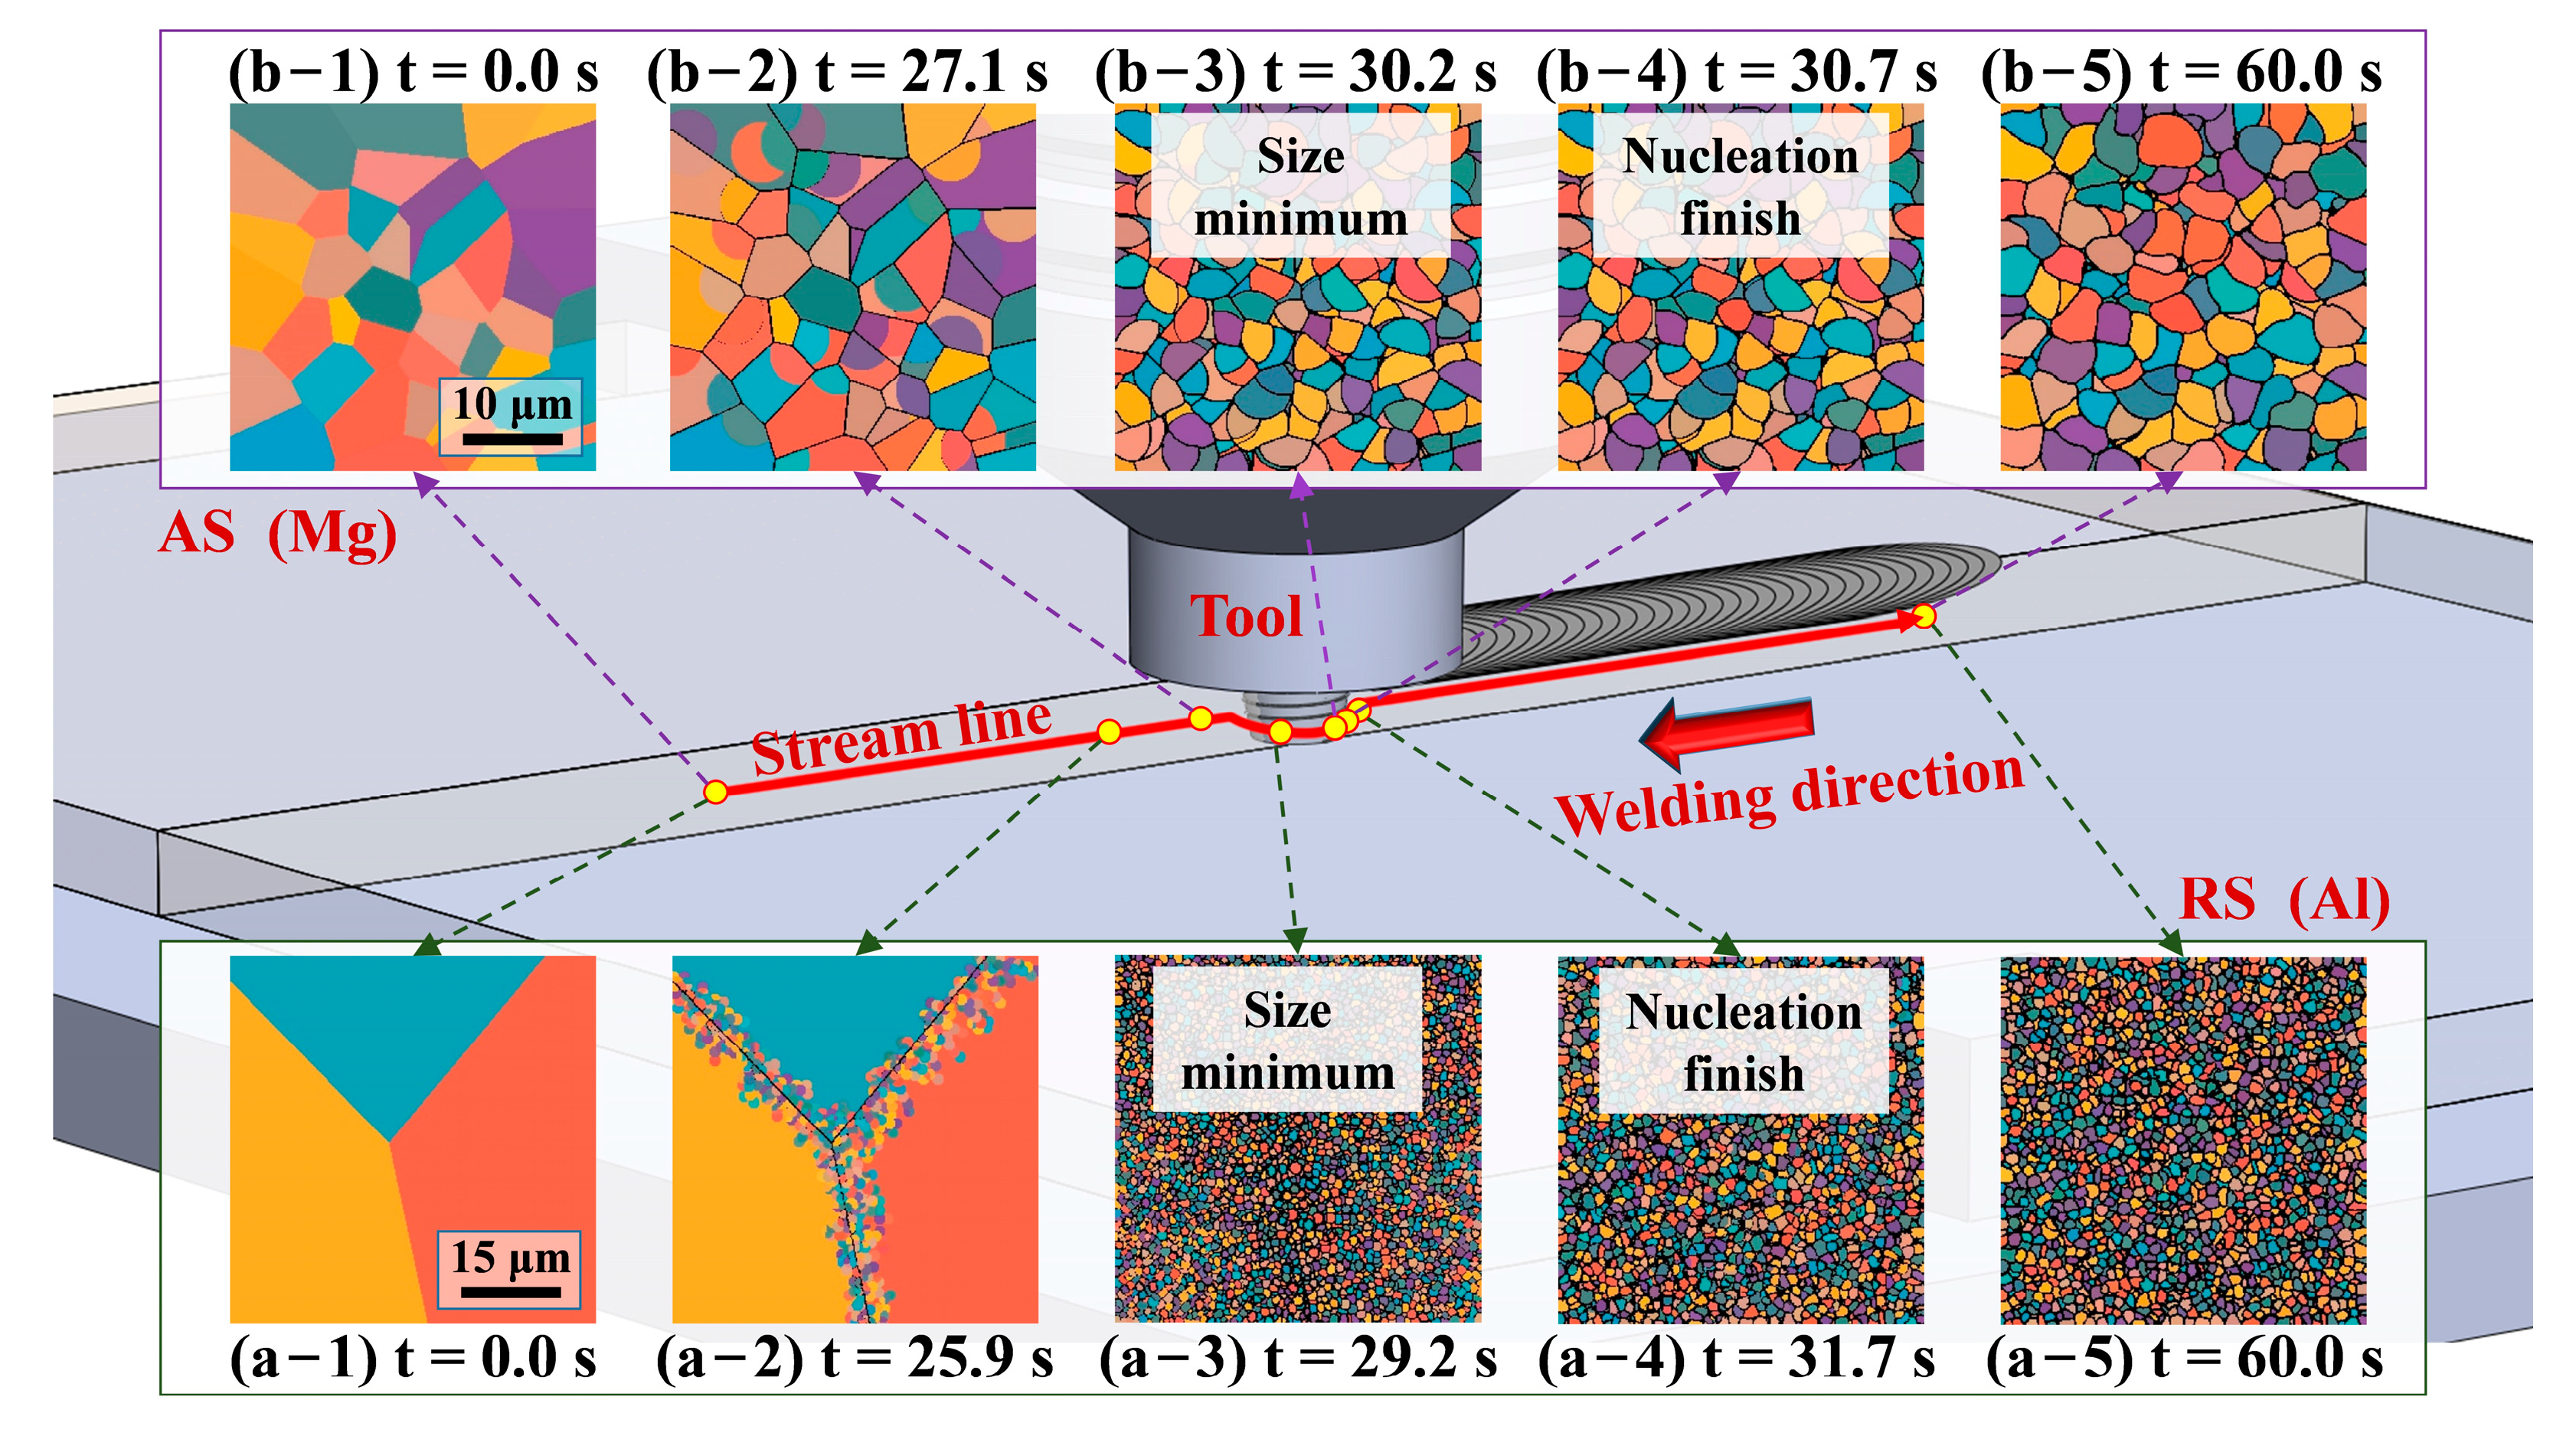
3. Results and Discussion

The aforementioned model was applied to simulate the spatiotemporal evolution of grain structures on both the Al and Mg sides of the FSW nugget zone, as shown in Figure 9. The initial microstructures (t = 0.0 s) maintain their coarse-grained characteristics on both sides. Progressive refinement commences with welding progression, where the Mg side exhibits substantial grain refinement onset at t = 27.1 s, reaching the minimum grain size by t = 30.2 s and completing nucleation at t = 30.7 s. In the initial nucleation stage, the Al side develops characteristic necklace-like recrystallized grains along the grain boundaries. This phenomenon shows good agreement with observations in TMAZ, with partial recrystallization reported in Reference [6]. The formation of this microstructure can be attributed to the combined effects of fine recrystallized grains and the preferential grain boundary nucleation behavior inherent to Al alloys. Then, the grain size on the Al side attains the minimum size at t = 29.2 s, concludes nucleation at t = 31.7 s, and achieves microstructural stability by t = 60.0 s. Although both sides follow similar evolutionary trajectories, inherent material property differences account for observed temporal and dimensional variations. The higher stacking fault energy of Al compared to Mg, along with its more active slip systems and other distinct material properties, results in finer recrystallized grain sizes in Al alloys than in Mg alloys. This phenomenon can be observed on both sides of the weld in reference [5]. As evident from Figure 9, the simulation results exhibit exclusively equiaxed grain structures, which aligns perfectly with previous experimental observations [5,12]. This consistency enables comprehensive model validation through both grain size analysis and crystallographic orientation characterization. For complete experimental protocols and detailed results, readers may refer to References [5,12].
To validate the proposed model, the post-weld grain size data from the experimental study [6] were first extracted for comparison with our simulation results. To quantitatively assess the influence of elastic strain energy, comparative analyses were performed between the current model (Model 2) and conventional models neglecting elastic strain energy effects (Model 1). The comparative analysis of Model 1 and Model 2 results in Figure 10 reveals distinct predictive capabilities regarding grain refinement. On the Al side, Model 2 predicted an average grain size of 1.25 μm, representing a 0.8% increase over the Model 1 prediction result of 1.24 μm. Both models maintain reasonable agreement with experimental measurements (1.18 μm), demonstrating absolute error below 0.07 μm. For the Mg side, Model 2 achieved superior accuracy with a predicted mean grain size of 2.46 μm, exhibiting only 4.3% relative error compared to the experimental benchmark (2.57 μm). This represents a clear improvement over Model 1’s 6.2% error (2.41 μm prediction), corresponding to a 2.1% grain size increase in Model 2. The systematic grain size enhancement observed in Model 2 originates from incorporating elastic strain energy contributions, which compensates for the grain boundary migration rate underestimation inherent in the dislocation-energy-dominated model.
Figure 11 presents a comparative analysis of average grain size evolution between Model 1 and Model 2. The Al alloy region demonstrates nucleation initiation at 25.1 s in both models, with Model 1 predicting a minimum grain size of 0.88 μm compared to Model 2’s slightly refined 0.87 μm. The Mg alloy region exhibits earlier nucleation onset at 23.9 s, followed by a low-rate nucleation period until 27.6 s before rapid acceleration. Model 1 yields a minimum Mg grain size of 2.14 μm, while Model 2 achieves further refinement to 2.08 μm through elastic strain energy incorporation. This minimum size reduction results from elastic strain energy’s indirect influence on nucleation density via modified boundary migration kinetics.
Figure 11 clearly demonstrates that both Model 1 and Model 2 display two distinct grain size evolution stages: an initial rapid grain refinement stage caused by intensive deformation-induced nucleation, followed by a subsequent gradual grain growth stage resulting from prolonged exposure to residual high temperatures. Grain growth kinetic analysis reveals that elastic strain energy exerts limited regulatory effects on growth behavior, with both models successfully capturing the characteristic refinement-growth sequence of FSW dynamic recrystallization. Post-minimum size analysis reveals growth extent increases from 40.9% (Model 1) to 43.7% (Model 2) on the Al side, compared to 12.6% to 18.3% on the Mg side. During the grain growth stage of identical materials, Model 2 demonstrates distinct grain growth kinetics compared to conventional Model 1, principally attributable to the incorporation of elastic strain energy considerations. Notably, the magnitude of this inter-model discrepancy exhibits material-specific variations between the aluminum and magnesium sides, fundamentally reflecting intrinsic material properties. This phenomenon originates from elastic strain energy’s regulatory effects on interface-driving forces governing grain growth patterns.
Figure 12 and Figure 13 compare post-weld orientation pole figures obtained from experiments and simulations on the Al and Mg sides, respectively. On the Al side (Figure 12), the {111} pole figures show slight intensity development along the transverse direction (TD), indicating a weak {111}〈112〉 shear texture component arising from deformation during welding. The simulated results qualitatively agree with experimental trends, although the peak intensities are lower due to the under-sampling of initial orientations. In contrast, the Mg side (Figure 13) displays significant texture evolution. Pre-weld, the {0001} poles are concentrated along ND, characteristic of a strong basal texture from rolling. Post-weld, a prominent shift of {0001} poles toward the welding direction (WD) is observed in both experiment and simulation, reflecting the development of a {0001}〈11–20〉 shear texture. This reorientation establishes a distinct [0001]//WD shear texture on the Mg side after welding, evidencing significant grain rotation induced by shear deformation during FSW processing. Such orientation evolution is closely associated with the crystallographic characteristics of HCP Mg, where c-axis rotation and basal plane realignment occur under high strain. In particular, the activation of basal 〈a〉 slip and pyramidal 〈c + a〉 slip systems during severe plastic deformation facilitates the observed dynamic recrystallization (DRX) and texture transformation.
Through the comparative analysis of the temporal evolution of average grain orientations in Figure 14 and Figure 15, this study reveals the dynamic regulation mechanism of tool motion on grain orientation evolution. On the Al side, the average grain orientation exhibits a clockwise rotation around the WD axis under the influence of the tool pin: the initially random orientations progressively evolve into a dominant orientation with [001] approximately parallel to WD. In this model, the rotational kinetics can be divided into two stages—a rapid rotation phase during the pre-nucleation period and a steady-state orientation phase during the post-nucleation stage. Notably, during the critical nucleation period (around 27.5 s), the grain orientation change rate reaches its peak, which is closely related to the higher temperature and lower interfacial energy barrier at this stage. Similarly, the average grain orientation of the Mg side material also demonstrates a clockwise rotation trend around the WD axis, but its evolutionary pathway exhibits material-specific characteristics: the original [0001]//ND orientation gradually rotates toward a [0001]//WD orientation.
In summary, the multi-phase field model incorporating elastic strain energy has been successfully established, elucidating the role of elastic strain energy in the microstructural evolution of Al/Mg dissimilar friction stir welds. Furthermore, the results have been validated through both grain size and crystallographic orientation analysis. Beyond the scope of this study, this modeling framework also demonstrates significant potential for broader applications in solid-state welding processes, particularly for friction welding/friction stir spot welding (FSSW) of lightweight alloys and ultrasonic welding (USW) of dissimilar materials. The methodology exhibits extensibility to material systems governed by strain energy gradients, especially Al-Li and Mg-Zn alloys. However, three key limitations should be noted. First, the strain energy terms were specifically calibrated for Al/Mg systems, necessitating parameter recalibration when applied to other material combinations. Second, upscaled simulations require explicit consideration of heterogeneous temperature field effects—a factor currently not accounted for in the present small-region computational approach. Third, recent studies have highlighted the crucial role of dispersoids in pinning dislocations and subgrain boundaries to influence DRX behavior [25,26], though this mechanism has not yet been incorporated into our current phase-field model. All of these will serve as potential directions for future model extensions or improvements.

4. Conclusions

This study employs a multiphase-field model incorporating elastic strain energy to investigate microstructural evolution in Al/Mg dissimilar FSW. The critical role of elastic strain energy in microstructural evolution under these processing conditions has been systematically examined, yielding the following key findings:
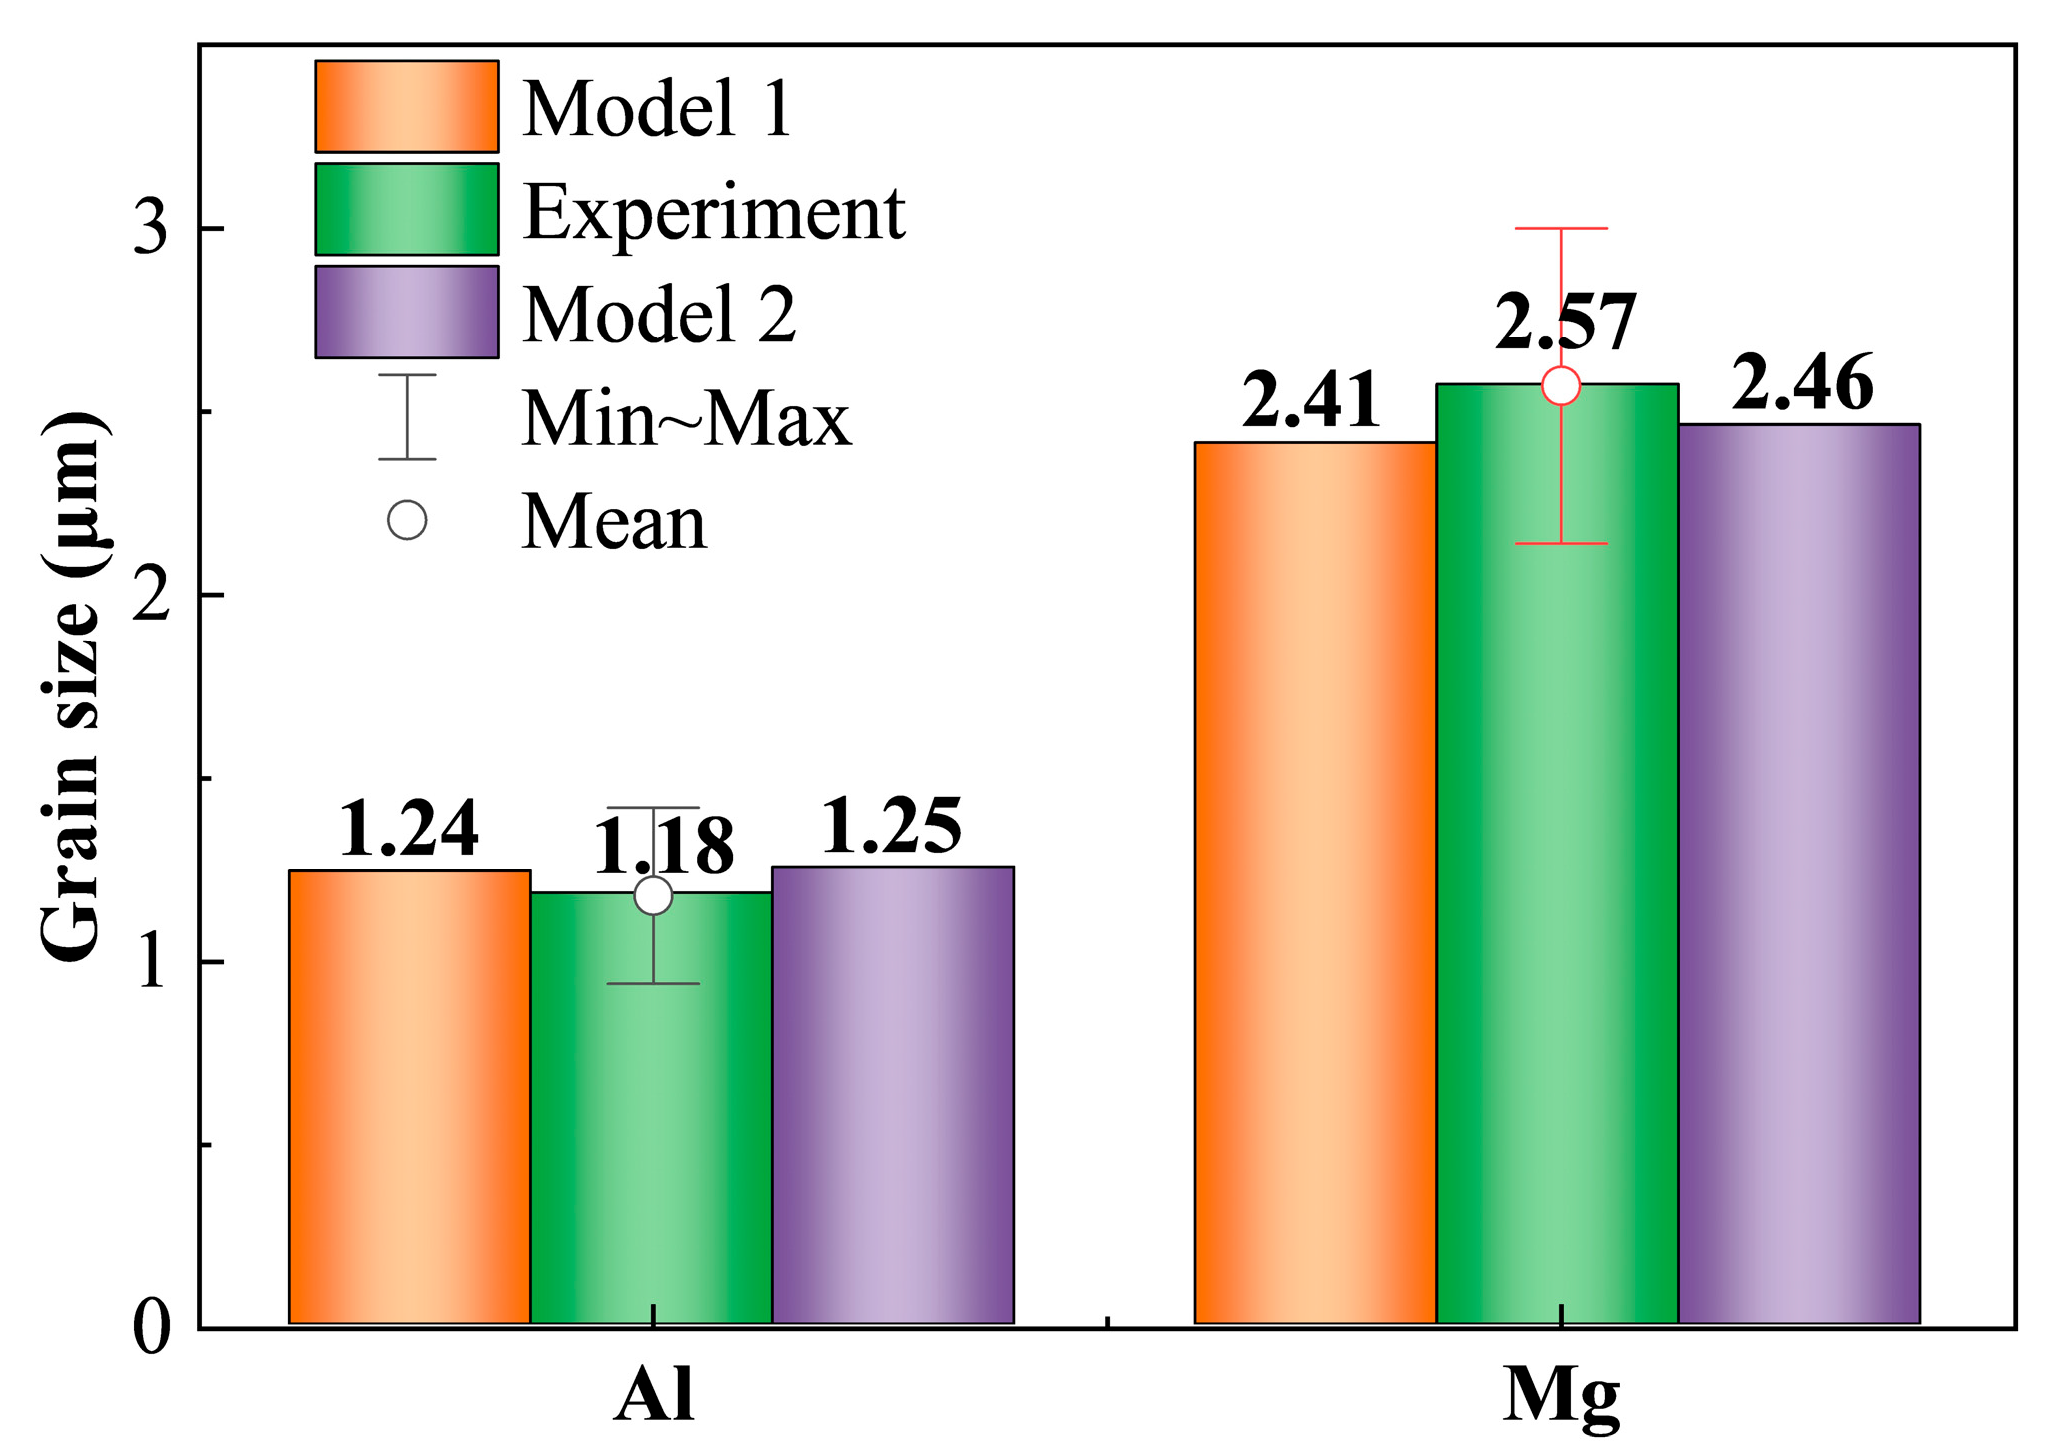
  • The inclusion of elastic strain energy enhances boundary migration driving forces, producing marginally larger final grain dimensions relative to the conventional model—specifically 0.8% and 2.1% increases for the Al and Mg sides, respectively.
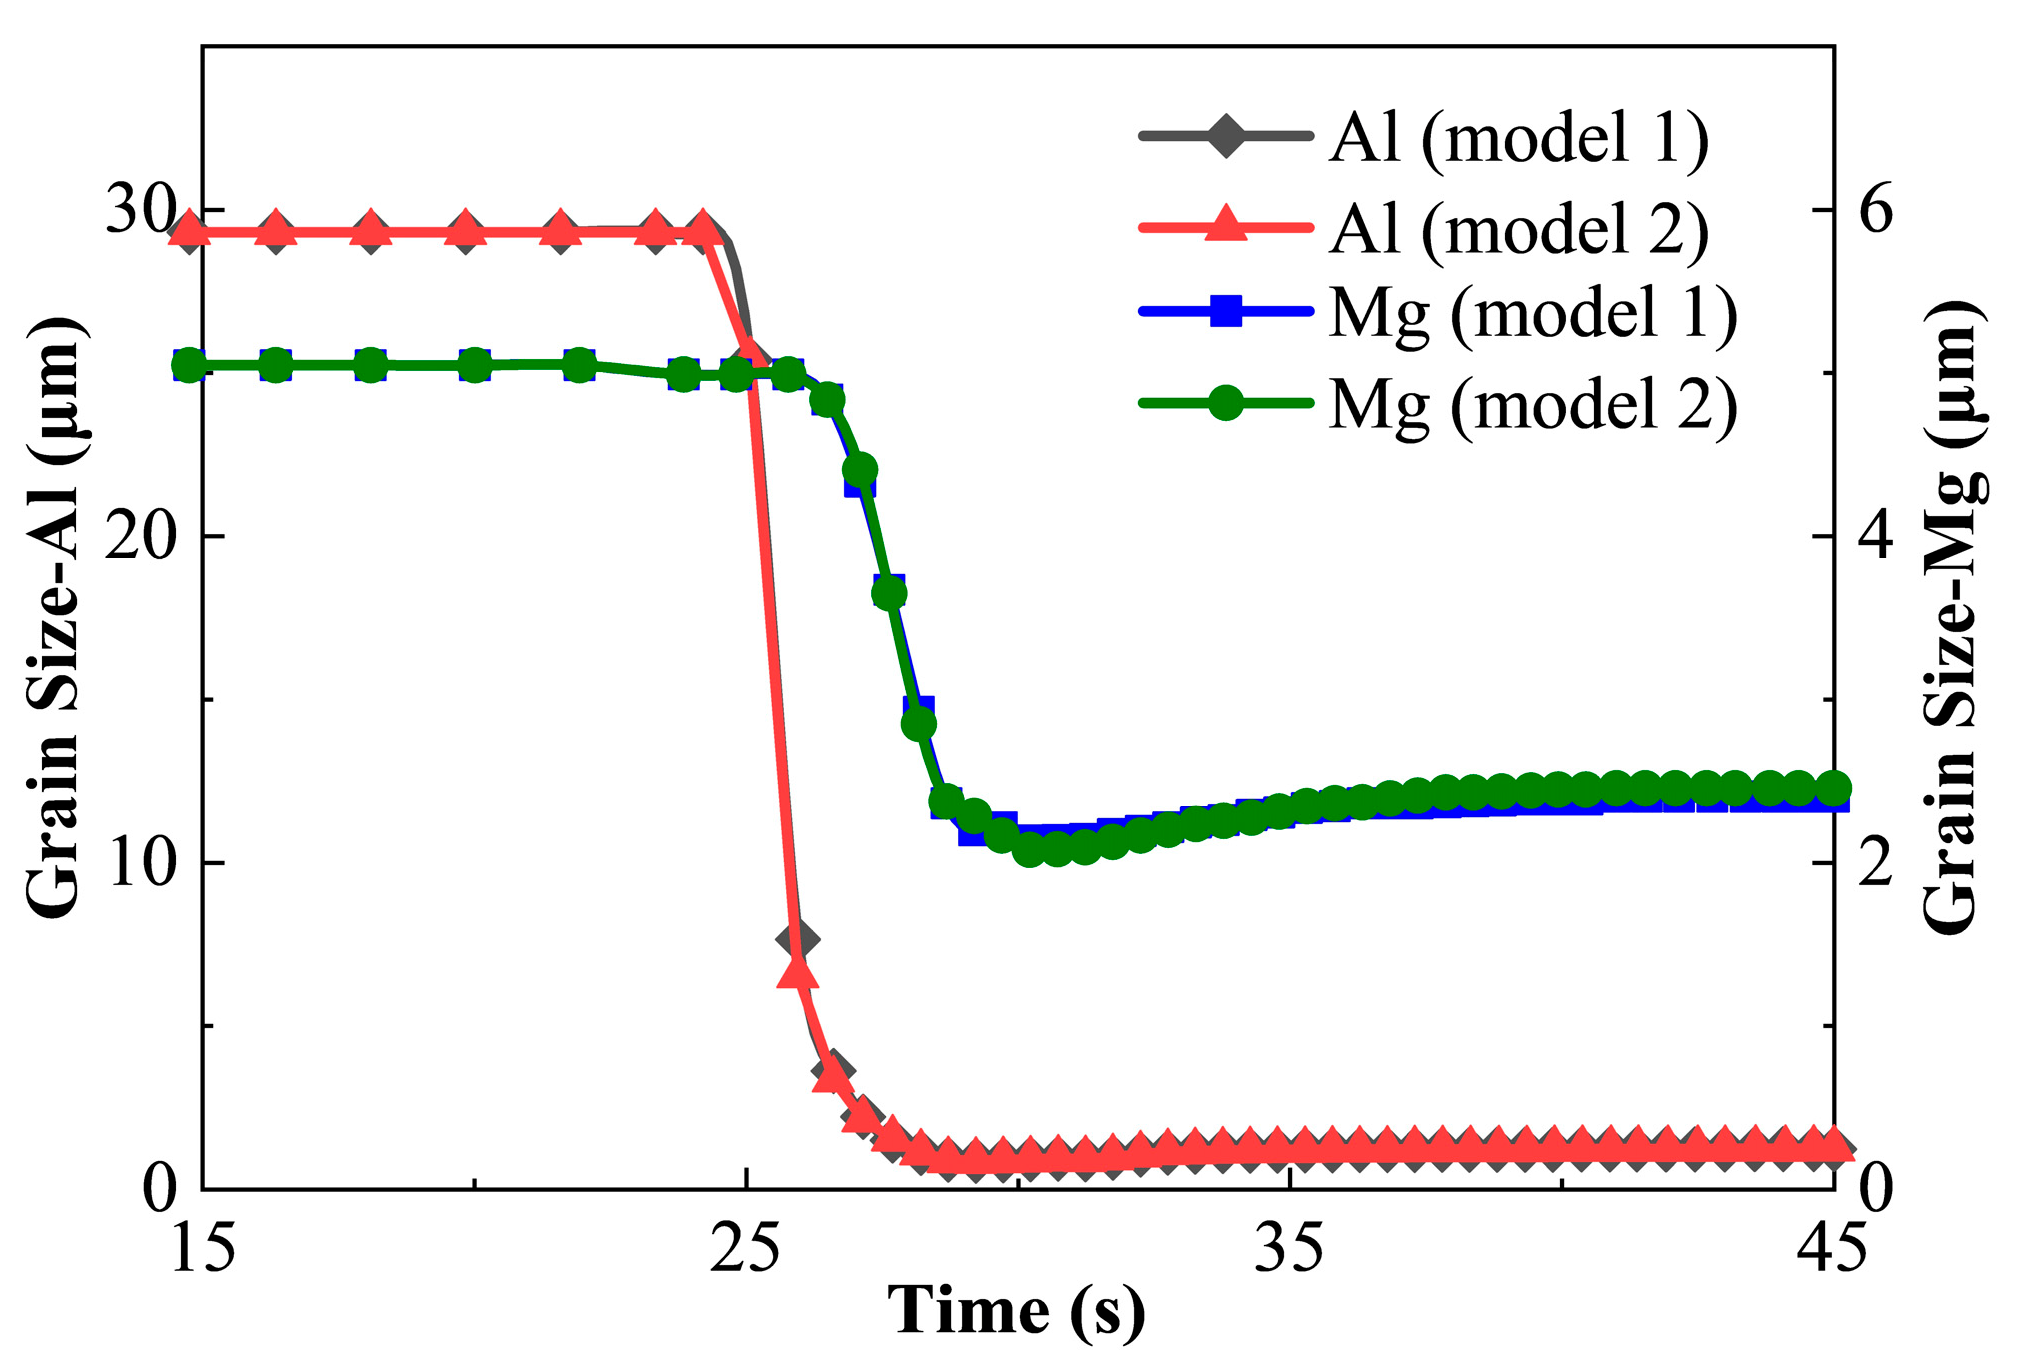
  • The elastic strain energy exerts measurable though moderate effects on both nucleation and grain growth phenomena during FSW recrystallization. Quantitative evaluation demonstrates that the incorporated elastic strain energy decreases minimum grain size by 1.1% and 2.8% for the Al and Mg sides correspondingly. Concurrently, it augments grain growth by 2.8% and 5.7% during the coarsening stage for each material.
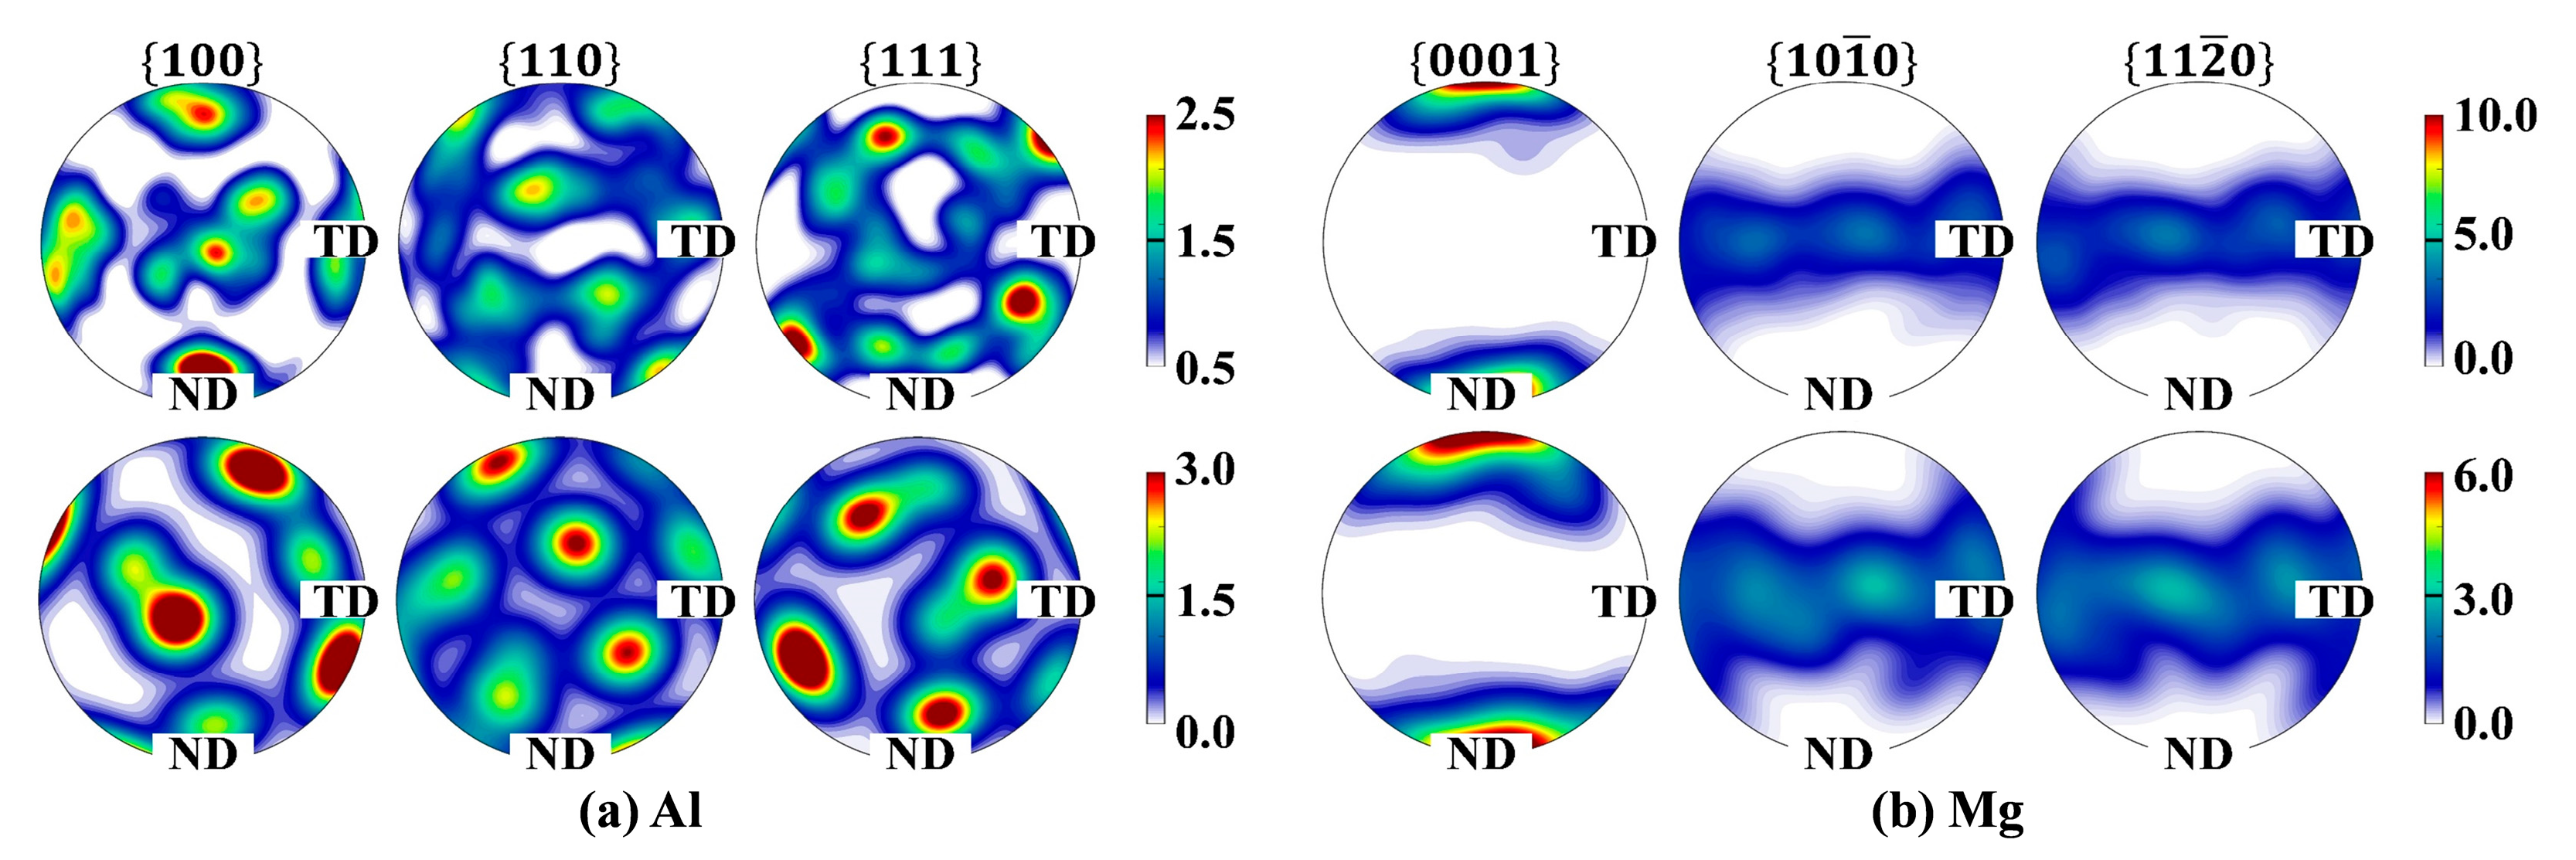
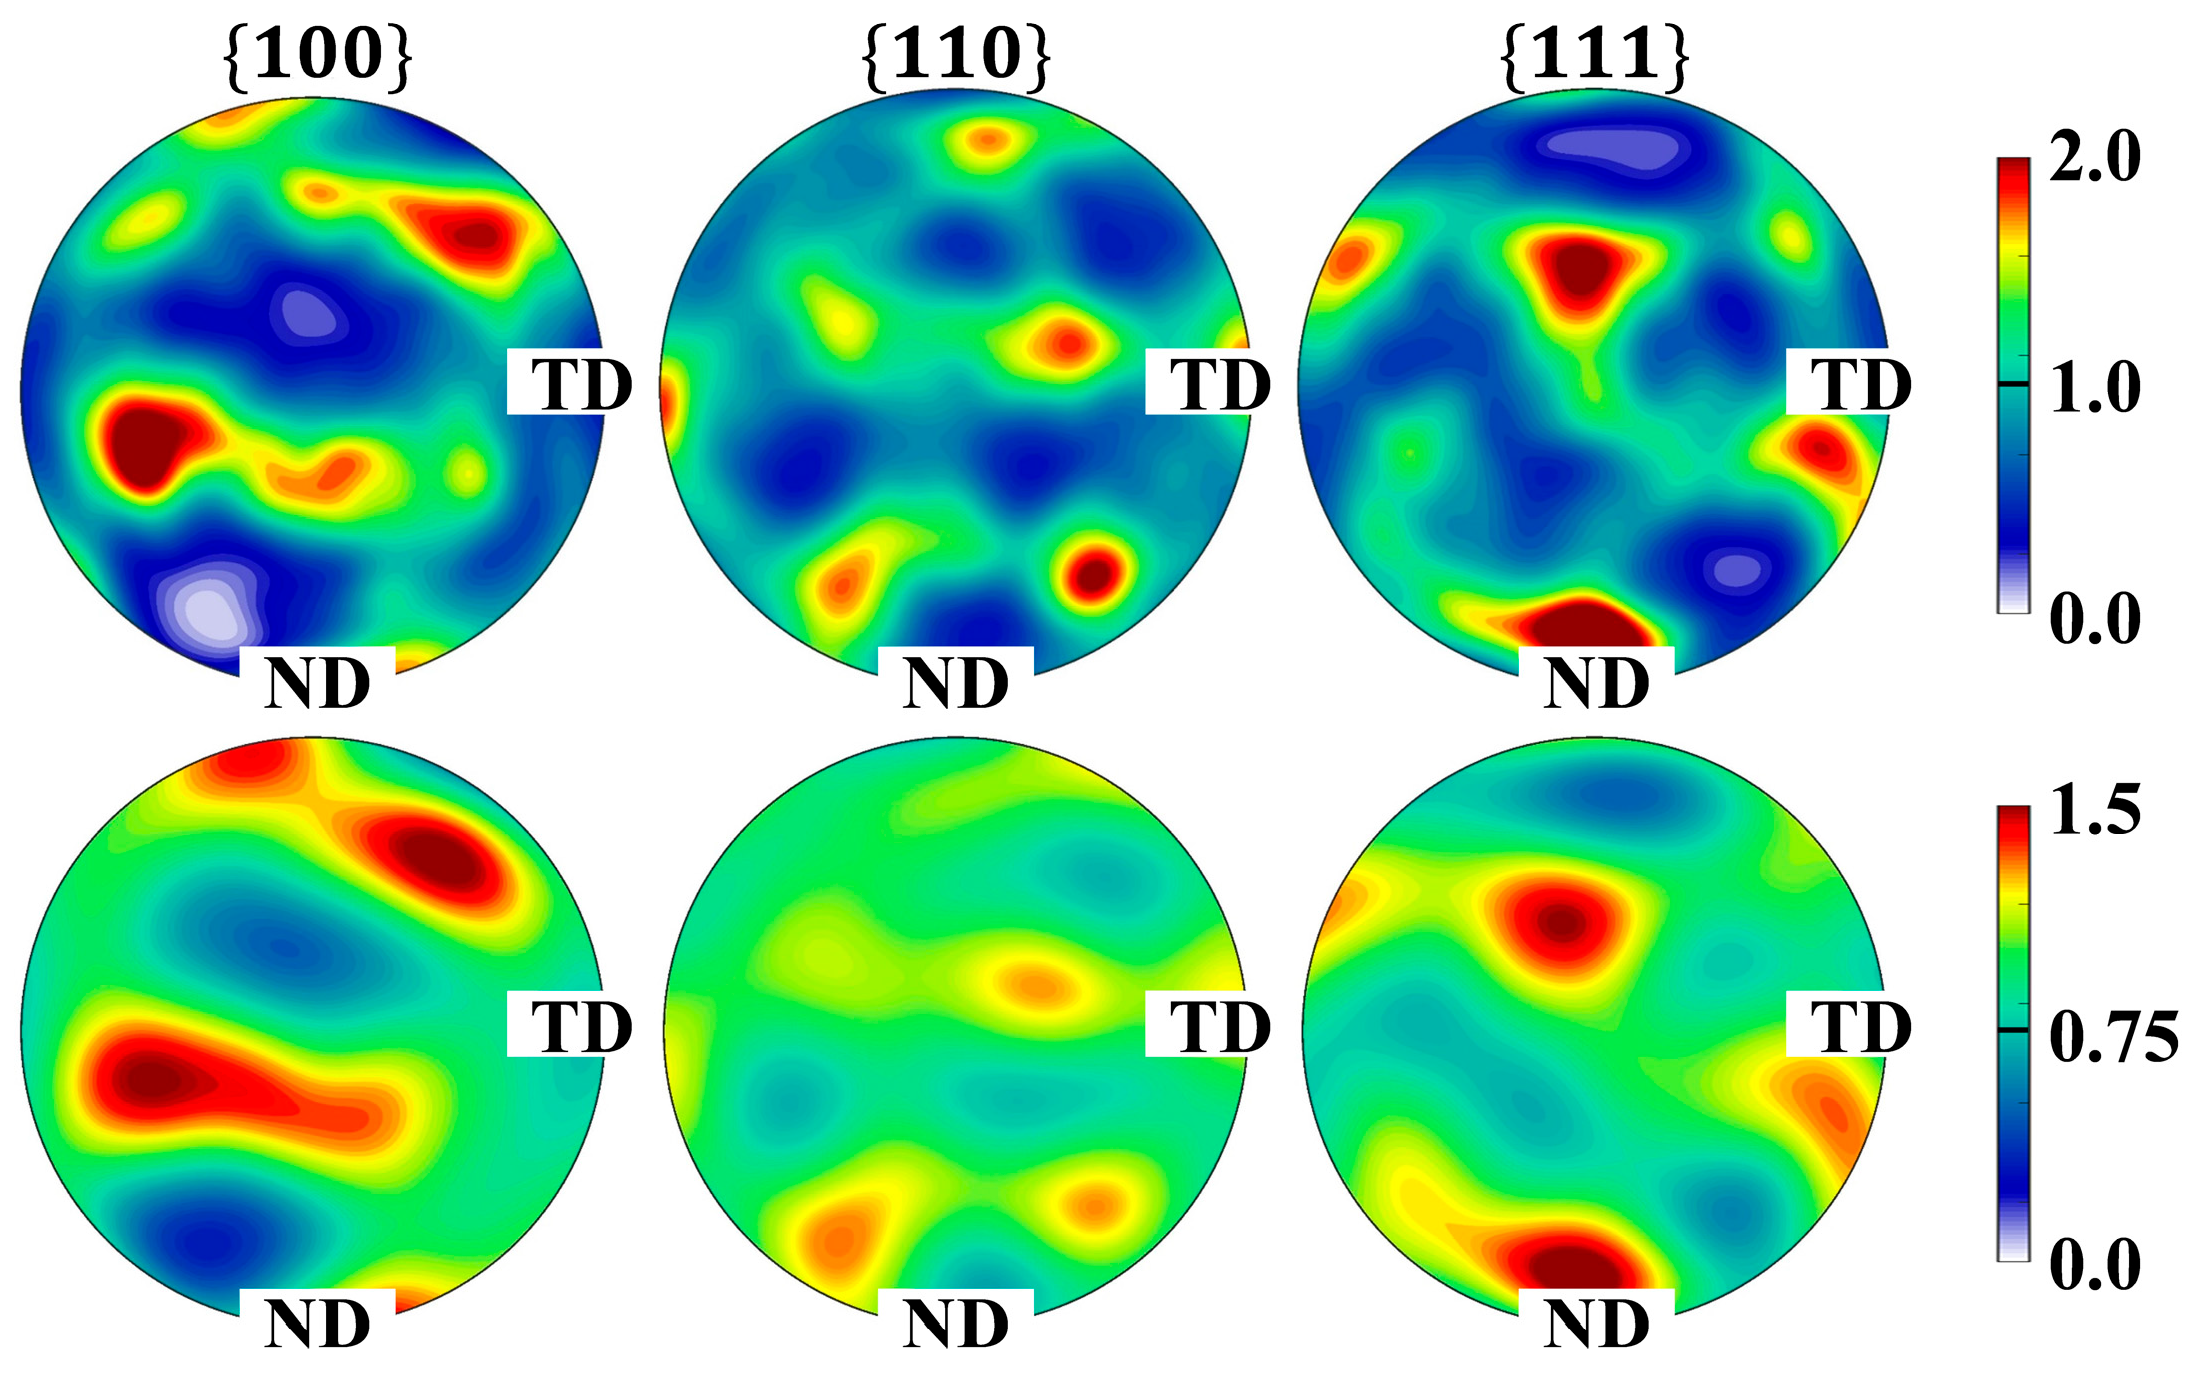
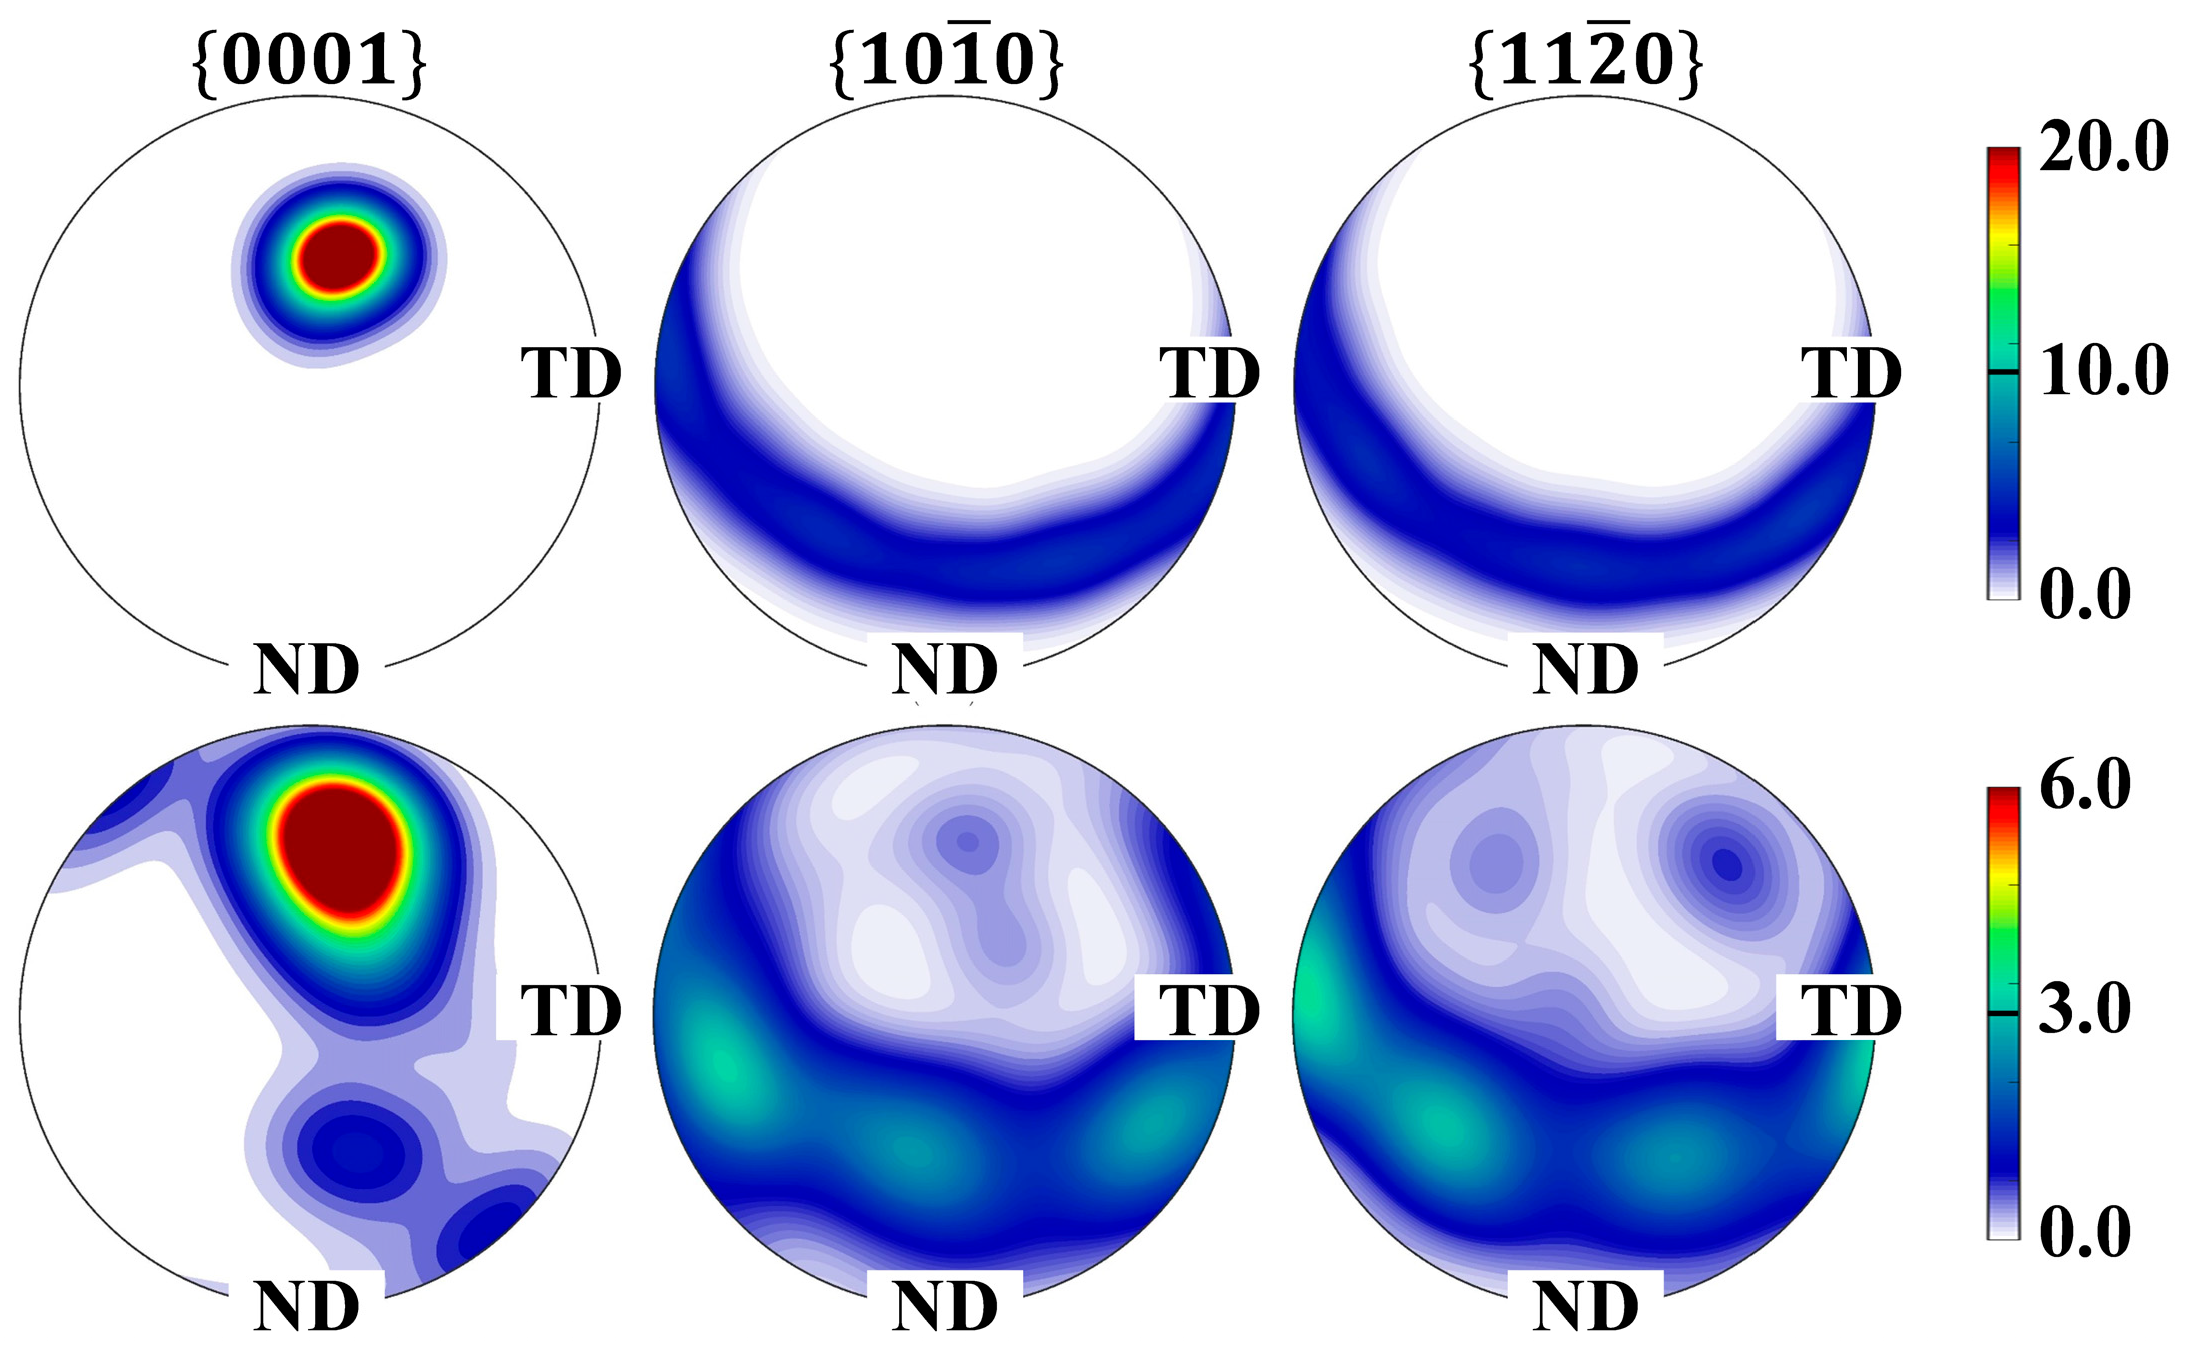
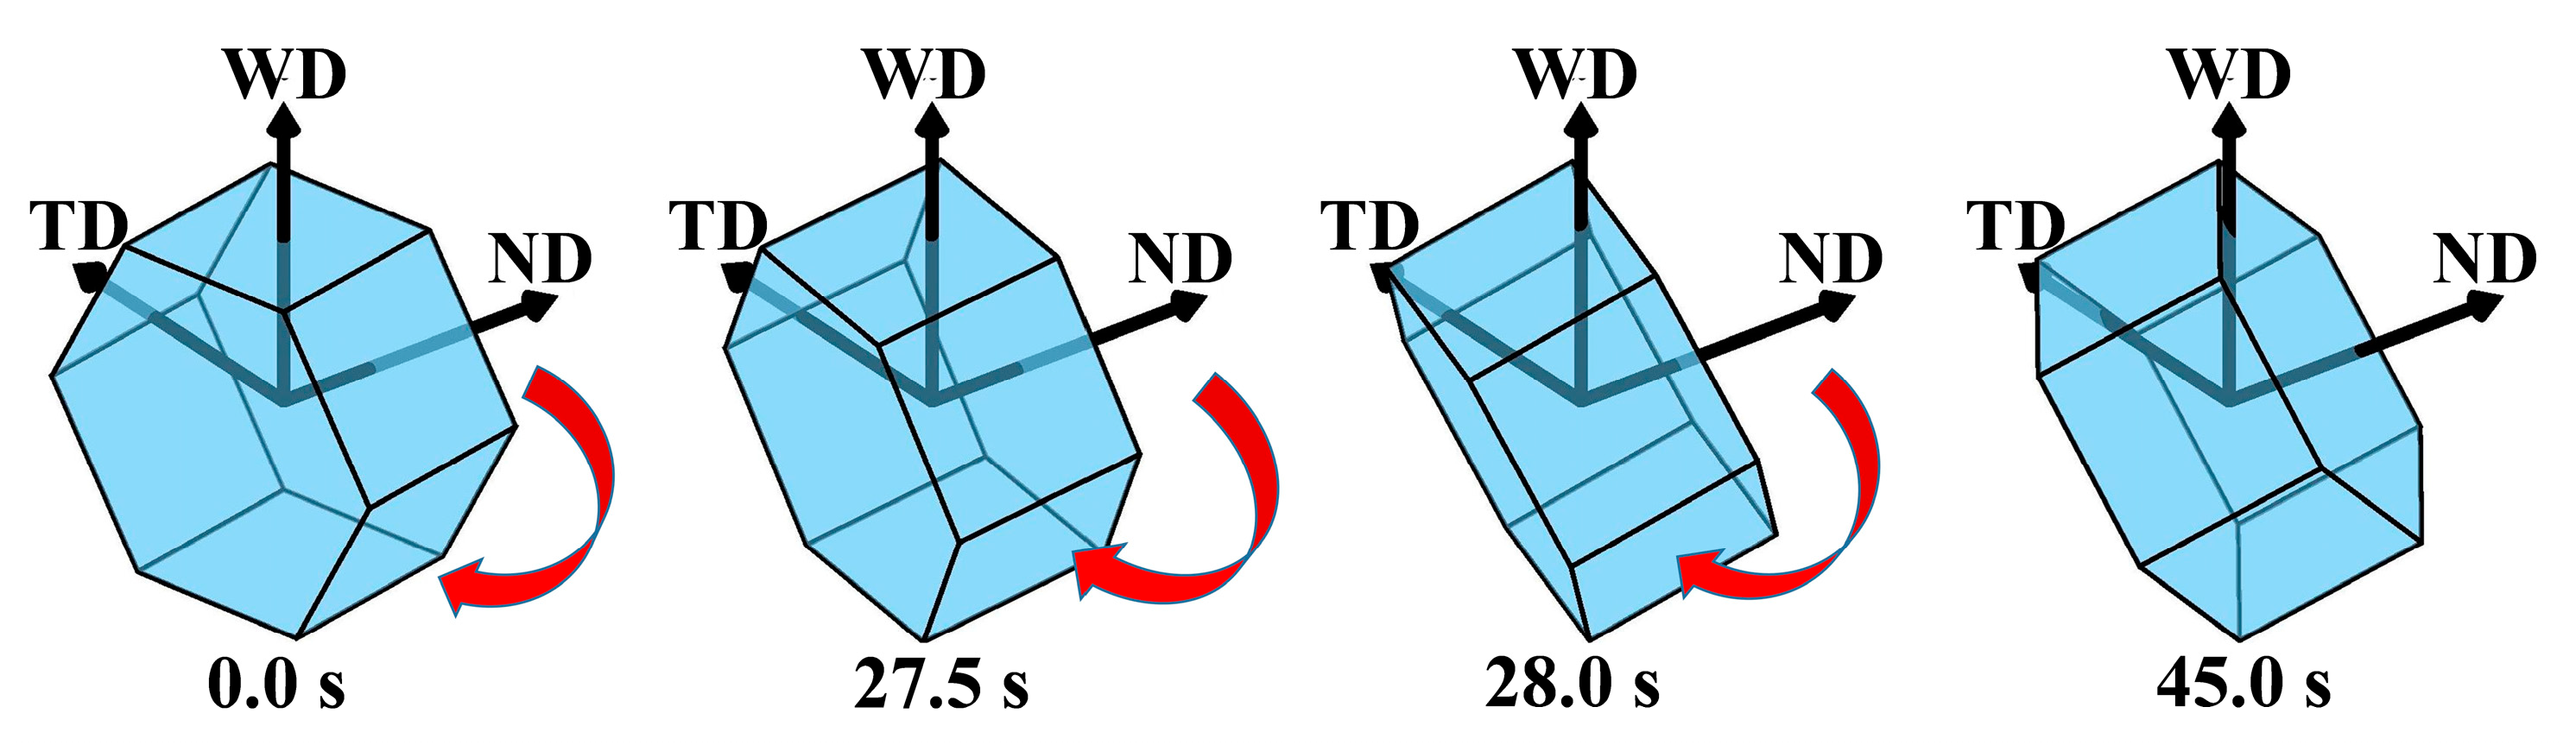
  • The FSW process induces the systematic clockwise rotation of average grain orientations about the WD axis for both materials. Regarding the average orientation evolution, the Al side transitions from initial random orientations to a near-[001]//WD texture, whereas the Mg side reorients from its original [0001]//ND configuration to a characteristic [0001]//WD orientation.

Author Contributions

Conceptualization, L.S. and C.W.; methodology, F.H.; software, F.H.; validation, F.H., L.S. and C.W.; formal analysis, L.S.; investigation, F.H.; resources, C.W.; data curation, F.H.; writing—original draft preparation, F.H.; writing—review and editing, L.S. and C.W.; visualization, F.H.; supervision, C.W.; project administration, L.S. and C.W.; funding acquisition, C.W. All authors have read and agreed to the published version of the manuscript.

Funding

This research received no external funding.

Data Availability Statement

The raw data supporting the conclusions of this article will be made available by the authors on request.

Conflicts of Interest

The authors declare no conflicts of interest.

References

  1. Gaurav, S.; Mishra, R.S.; Zunaid, M. A critical review on mechanical and microstructural properties of issimilar aluminum (Al)-magnesium (Mg) alloys. J. Adhes. Sci. Technol. 2023, 37, 1117–1149. [Google Scholar] [CrossRef]
  2. Nagaraja, S.; Anand, P.B.; Mariswamy, M.; Alkahtani, M.Q.; Islam, S.; Khan, M.A.; Khan, W.A.; Bhutto, J.K. Friction stir welding of dissimilar Al–Mg alloys for aerospace applications: Prospects and future potential. Rev. Adv. Mater. Sci. 2024, 63, 20240033. [Google Scholar] [CrossRef]
  3. Mohammadi, J.; Behnamian, Y.; Mostafaei, A.; Izadi, H.; Saeid, T.; Kokabi, A.H.; Gerlich, A.P. Friction stir welding joint of dissimilar materials between AZ31B magnesium and 6061 aluminum alloys: Microstructure studies and mechanical characterizations. Mater. Charact. 2015, 101, 189–207. [Google Scholar] [CrossRef]
  4. Shah, L.H.; Othman, N.H.; Gerlich, A. Review of research progress on aluminium–magnesium dissimilar friction stir welding. Sci. Technol. Weld. Join. 2018, 23, 256–270. [Google Scholar] [CrossRef]
  5. Zhao, J.J.; Wu, C.S.; Shi, L. Effect of ultrasonic field on microstructure evolution in friction stir welding of dissimilar Al/Mg alloys. J. Mater. Res. Technol. 2022, 17, 1–21. [Google Scholar] [CrossRef]
  6. Jata, K.V.; Semiatin, S.L. Continuous dynamic recrystallization during friction stir welding of high strength aluminum alloys. Scripta Mater. 2000, 43, 743–749. [Google Scholar] [CrossRef]
  7. Zeng, X.H.; Xue, P.; Wu, L.H.; Ni, D.R.; Xiao, B.L.; Wang, K.S.; Ma, Z.Y. Microstructural evolution of aluminum alloy during friction stir welding under different tool rotation rates and cooling conditions. J. Mater. Sci. Technol. 2019, 35, 972–981. [Google Scholar] [CrossRef]
  8. Abbasi, M.; Bagheri, B.; Sharifi, F. Simulation and experimental study of dynamic recrystallization process during friction stir vibration welding of magnesium alloys. Trans. Nonferrous Met. Soc. China 2021, 31, 2626–2650. [Google Scholar] [CrossRef]
  9. Zhao, F.Y.; Shi, L.; Gao, J.Q.; Wu, C.S. Multiphase-field analysis of the intermetallic compounds formation & evolution in friction stir welding of dissimilar Al/Mg alloys. J. Mater. Res. Technol. 2024, 32, 1206–1222. [Google Scholar] [CrossRef]
  10. Steinbach, I.; Pezzolla, F.; Nestler, B.; Seeßelberg, M.; Prieler, R.; Schmitz, G.J.; Rezende, J.L.L. A phase field concept for multiphase systems. Physica D 1996, 94, 135–147. [Google Scholar] [CrossRef]
  11. Steinbach, I.; Pezzolla, F. A generalized field method for multiphase transformations using interface fields. Physica D 1999, 134, 385–393. [Google Scholar] [CrossRef]
  12. He, F.L.; Wu, C.S.; Shi, L. Phase-field simulation of dynamic recrystallization in friction stir weld nugget zone of dissimilar Al/Mg alloys. J. Mater. Res. Technol. 2023, 27, 2670–2683. [Google Scholar] [CrossRef]
  13. Yang, C.L.; Wu, C.S.; Lv, X.Q. Numerical analysis of mass transfer and material mixing in friction stir welding of aluminum/magnesium alloys. J. Manuf. Process. 2018, 32, 380–394. [Google Scholar] [CrossRef]
  14. Takaki, T.; Hisakuni, Y.; Hirouchi, T.; Yamanaka, A.; Tomita, Y. Multi-phase-field simulations for dynamic recrystallization. Comp. Mater. Sci. 2009, 45, 881–888. [Google Scholar] [CrossRef]
  15. Laasraoui, A.; Jonas, J.J. Prediction of steel flow stresses at high temperatures and strain rates. Metall. Mater. Trans. A 1991, 22, 1545–1558. [Google Scholar] [CrossRef]
  16. Simon, P.C.A.; Aagesen, L.K.; Motta, A.T.; Tonks, M.R. The effects of introducing elasticity using different interpolation schemes to the grand potential phase field model. Comp. Mater. Sci. 2020, 183, 109790. [Google Scholar] [CrossRef]
  17. Steinbach, I.; Apel, M. Multi phase field model for solid state transformation with elastic strain. Physica D 2006, 217, 153–160. [Google Scholar] [CrossRef]
  18. Durga, A.; Wollants, P.; Moelans, N. Evaluation of interfacial excess contributions in different phase-field models for elastically inhomogeneous systems. Model. Simul. Mater. Sci. Eng. 2013, 21, 055018. [Google Scholar] [CrossRef]
  19. Schneider, D.; Tschukin, O.; Choudhury, A.; Selzer, M.; Böhlke, T.; Nestler, B. Phase-field elasticity model based on mechanical jump conditions. Comput. Mech. 2015, 55, 887–901. [Google Scholar] [CrossRef]
  20. Voigt, W. Lehrbuch der Kristallphysik: (mit Ausschluss der Kristalloptik); BG Teubner: Berlin, Germany, 1910; Volume 34. [Google Scholar]
  21. Long, T.R.; Smith, C.S. Single-crystal elastic constants of magnesium and magnesium alloys. Acta Metall. 1957, 5, 200–207. [Google Scholar] [CrossRef]
  22. Vallin, J.; Mongy, M.; Salama, K.; Beckman, O. Elastic constants of aluminum. J. Appl. Phys. 1964, 35, 1825–1826. [Google Scholar] [CrossRef]
  23. Sun, G.Q.; Chen, Y.J.; Wei, X.H.; Shang, D.G.; Chen, S.J. Crystal plastic modeling on fatigue properties for aluminum alloy friction stir welded joint. Mat. Sci. Eng. A-Struct. 2018, 728, 165–174. [Google Scholar] [CrossRef]
  24. Kim, S.G.; Kim, D.I.; Kim, W.T.; Park, Y.B. Computer simulations of two-dimensional and three-dimensional ideal grain growth. Phys. Rev. E 2006, 74, 061605. [Google Scholar] [CrossRef]
  25. Ghosh, A.; Elasheri, A.; Parson, N.; Chen, X.G. Microstructure and texture evolution during high-temperature compression of Al-Mg-Si-Zr-Mn alloy. Mater. Charact. 2023, 205, 113312. [Google Scholar] [CrossRef]
  26. Ghosh, A.; Elasheri, A.; Parson, N.; Chen, X.G. Hot deformation behavior and processing maps for an Al-Mg-Si-Zr-Mn alloy. J. Alloy. Metall. Syst. 2024, 6, 100077. [Google Scholar] [CrossRef]
Figure 1. Schematic diagram of FSW.
Metals 15 00577 g001
Figure 2. Schematic diagram of checking points.
Metals 15 00577 g002
Figure 3. Schematic of dislocation-induced elastic fields and external stress-induced elastic fields in polycrystalline systems.
Metals 15 00577 g003
Figure 4. Schematic diagram of coordinate system rotation.
Metals 15 00577 g004
Figure 5. Initial grain distribution and force boundary conditions.
Metals 15 00577 g005
Figure 6. Stress variation at FSW checking point.
Metals 15 00577 g006
Figure 7. Base metal grain orientation pole figures: (top) experimental, (bottom) simulation.
Metals 15 00577 g007
Figure 8. Computational flow chart.
Metals 15 00577 g008
Figure 9. Grain structure evolution during Al/Mg dissimilar FSW.
Metals 15 00577 g009
Figure 10. Post-weld grain sizes from different models and experiments.
Metals 15 00577 g010
Figure 11. Evolution curves of average grain size.
Metals 15 00577 g011
Figure 12. Comparison of post-weld orientation pole figures—Al side: (top) experimental, (bottom) simulation.
Metals 15 00577 g012
Figure 13. Comparison of post-weld orientation pole figures—Mg side: (top) experimental, (bottom) simulation.
Metals 15 00577 g013
Figure 14. Evolution of average grain orientation—Al side.
Metals 15 00577 g014
Figure 15. Evolution of average grain orientation—Mg side.
Metals 15 00577 g015
Table 1. Chemical composition (wt.%) of base material.
AlloySiFeCuMnMgCrTiZnAl
6061-T60.510.200.300.0091.090.13-0.05Bal.
AZ31B-H240.0160.0010.0030.44Bal.--1.103.05
Disclaimer/Publisher’s Note: The statements, opinions and data contained in all publications are solely those of the individual author(s) and contributor(s) and not of MDPI and/or the editor(s). MDPI and/or the editor(s) disclaim responsibility for any injury to people or property resulting from any ideas, methods, instructions or products referred to in the content.

