Article

Rate Equation Analysis of the Effect of Damage Distribution on Defect Evolution in Self-Ion Irradiated Fe

by
Toshimasa Yoshiie
Department of Quantum Beam Science, Osaka Metropolitan University, Osaka 599-8531, Japan
Metals 2025, 15(5), 555; https://doi.org/10.3390/met15050555
Submission received: 31 March 2025 / Revised: 12 May 2025 / Accepted: 16 May 2025 / Published: 17 May 2025

Abstract

Ion irradiations have a damage peak near the beam incident surface. A simulation model with reaction kinetic analysis using rate equations was employed to study the defect evolution caused by localized damage distribution in self-ion irradiated iron. Comparisons were made between the localized damage irradiation by ions (the damage peak near the specimen surface) and homogeneous damage irradiation (the flat damage rate across the specimen) such as those caused by neutron irradiation. The irradiation conditions were as follows: the accelerating voltage was 2 MeV and 100 MeV, the irradiation temperatures was 273 K and 573 K, the damage rate was 1 × 10⁻⁵ dpa/s, and the total damage was 1 dpa. The distribution of residual point defects in clusters is complex due to the influence of the surface and the sharp distribution of the damage peak. The effects of the damage distributions on defect production were obtained, revealing a dependence on irradiation temperatures. At 573 K irradiation, localized damage irradiation produced higher residual interstitials than homogeneous damage irradiation when using the peak damage rate. The 100 MeV irradiation was more prominent than 2 MeV irradiation. However, the remaining vacancies were almost identical. At 273 K irradiation, the residual point defects, interstitials, and vacancies, were nearly identical in both the localized and homogeneous damage irradiations, even if the accelerating voltage was different.

Graphical Abstract

1. Introduction

For the development of nuclear materials, it is essential to irradiate them in real systems, such as nuclear reactors and fusion reactors, where they are used. However, there are many instances of where it is not feasible to use real systems, for example, as in the design phase of fusion power reactors and next generation nuclear power reactors. Charged particle irradiations, such as ions and electrons, are often employed to advance nuclear materials. These are more straightforward compared with neutron irradiation in nuclear reactors and make irradiation conditions easier to set because no radioisotopes are produced in most cases and enable high dose rates [1,2,3]. For the damage evolution, some differences between ions and neutrons have been considered such as damage energy spectra [4], damage rate [5,6], and the time structure of incident beams [7]. However, one of the important points, the effect of the damage profile, has not been considered.
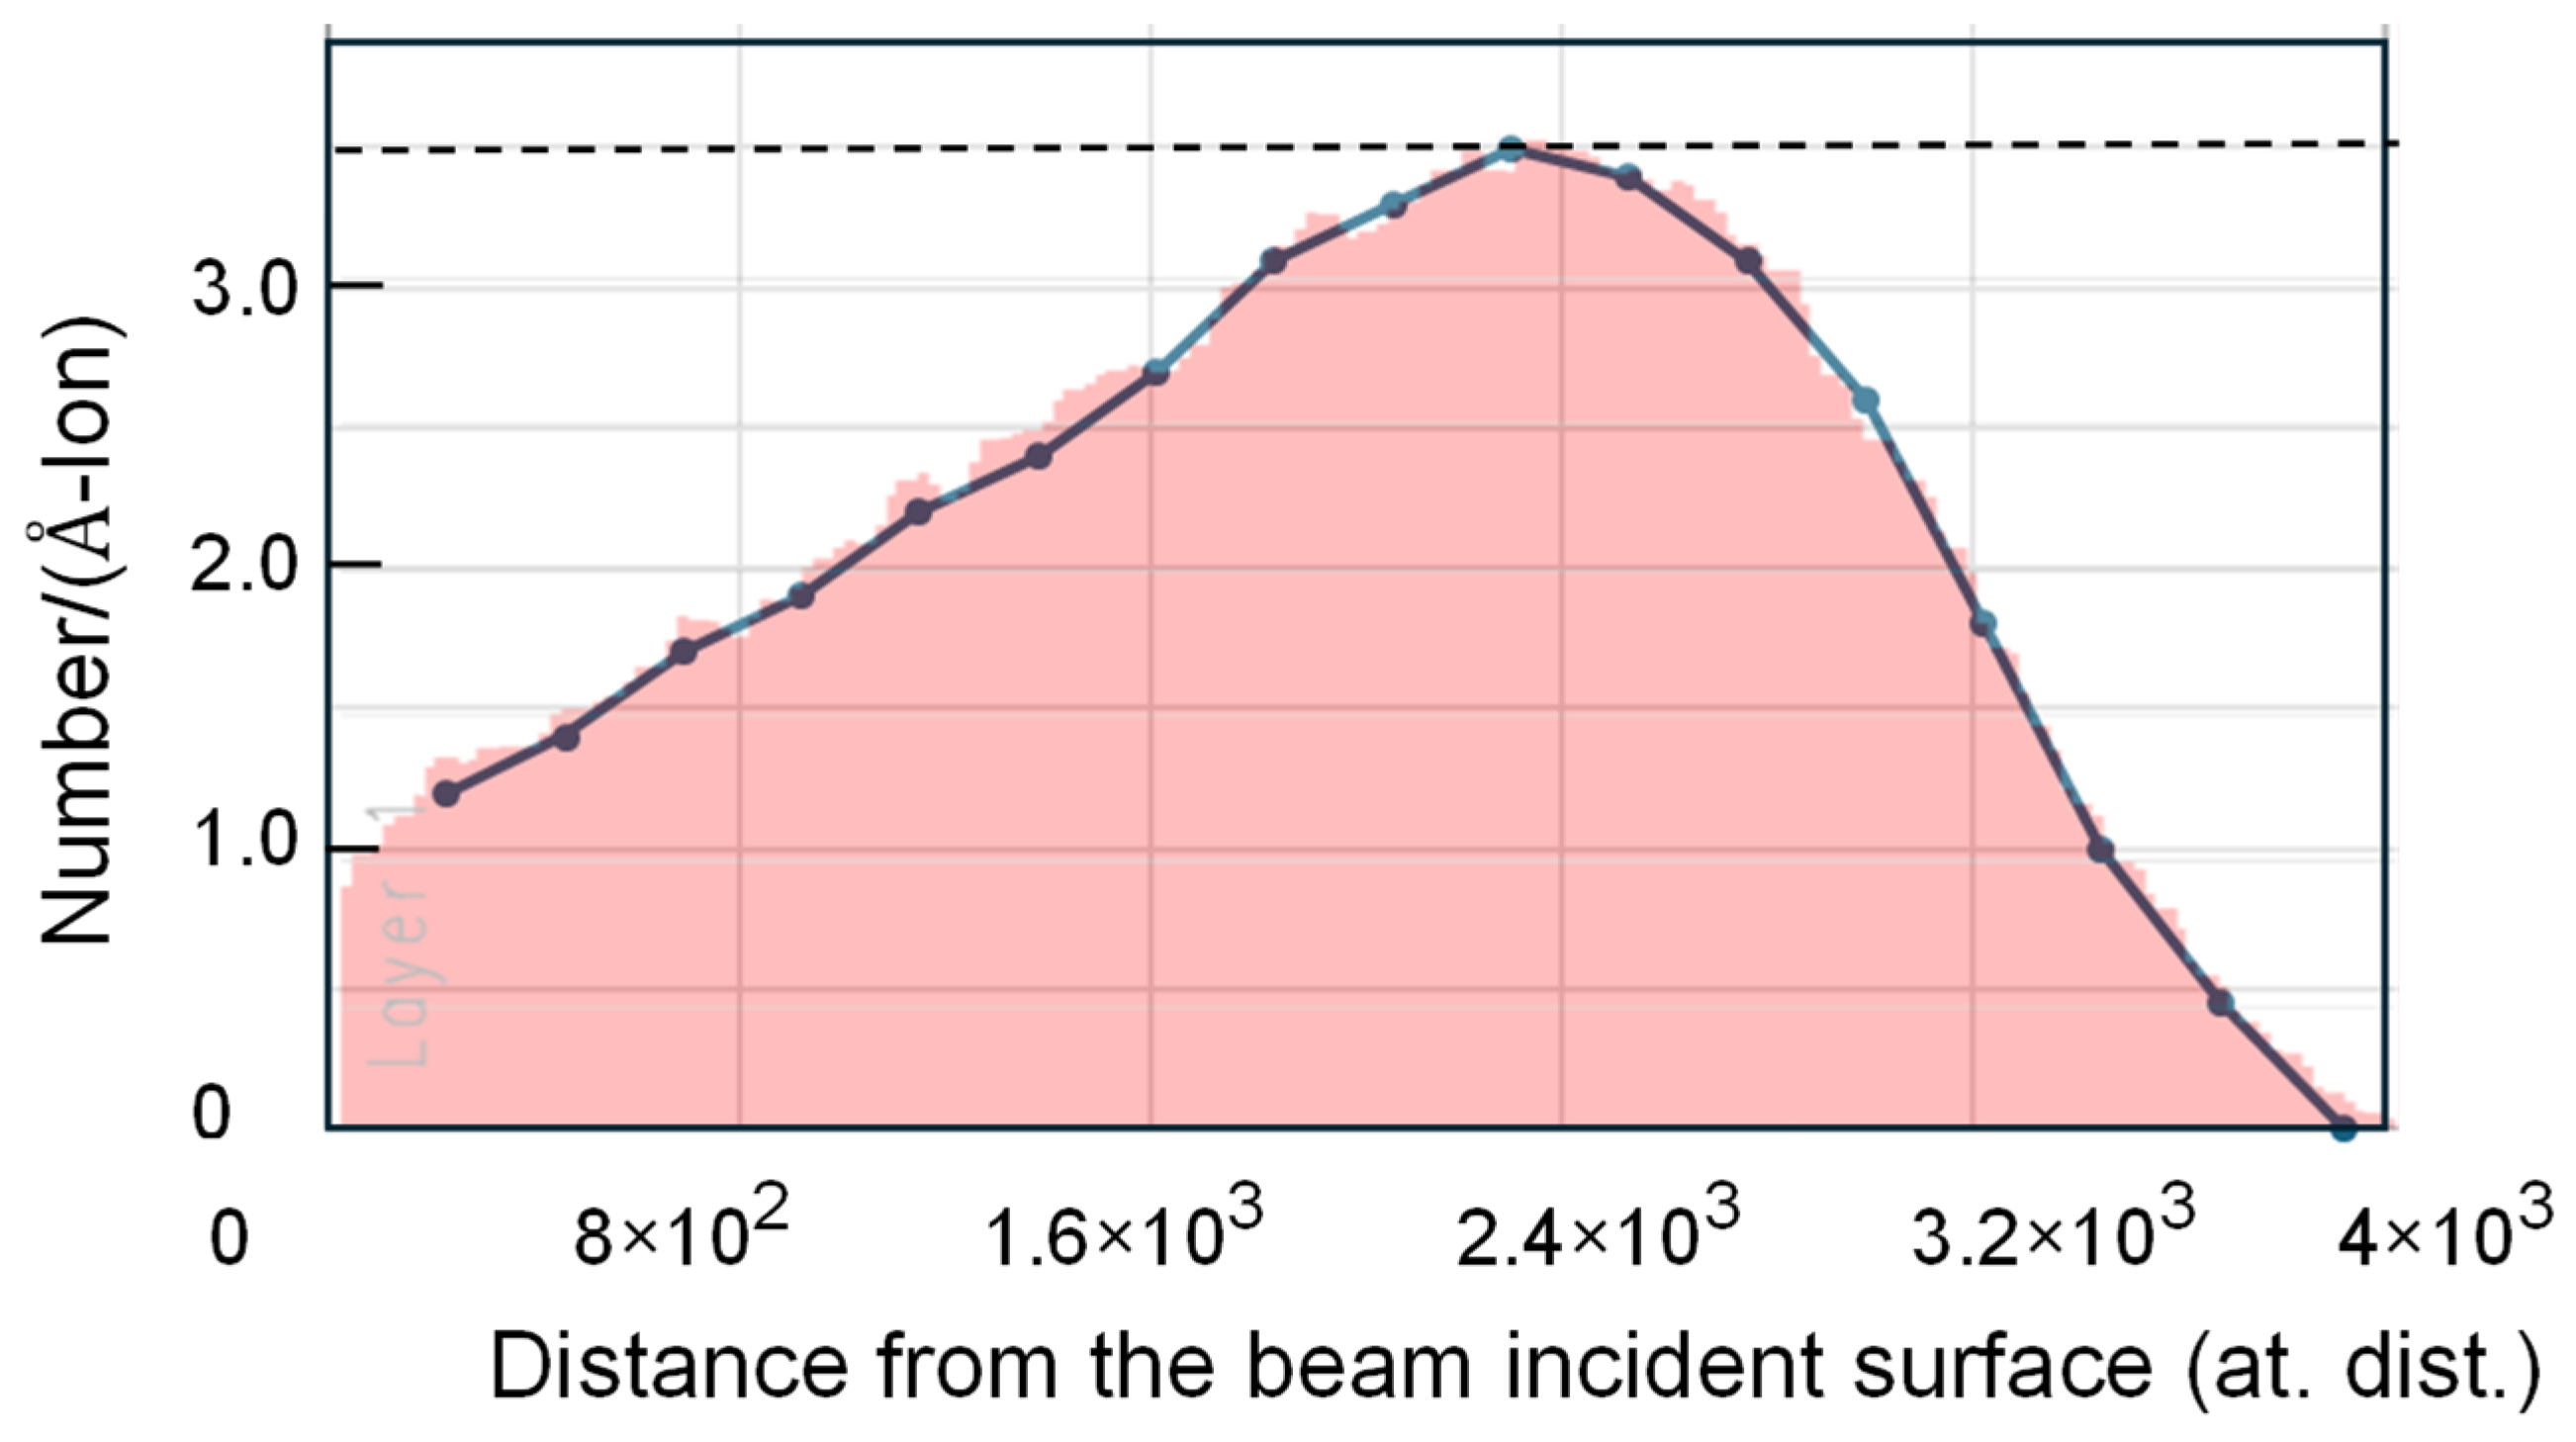
Charged particles have specific damage ranges (damage peaks) that depend on their energies, as shown in Figure 1 and Figure 2, calculated in the case of 100 MeV and 2 MeV self-ion irradiated iron by SRIM [8], respectively. Consequently, the localized damage area is near the particle incident surface. It is well-known that the evolution of defect structures depends on the geometry between the pre-existing sinks and the damage area. The surface of materials strongly influences the formation and growth of point defect clusters because of the sink efficiency. For instance, Kiritani et al. effectively utilized surfaces to detect point defect behaviors and clarified the roles of interstitials and vacancies for defect structure evolution under neutron irradiations [9]. The surface acts as a sink for interstitials and vacancies. Since the mobility of interstitials is higher than that of vacancies, the easy annihilation of interstitials at sinks facilitates the nucleation and growth of vacancy clusters.
In the case of higher energy ions (100 MeV), a sharply localized distribution of point defects was formed, as shown in Figure 1. The steep decrease in damage following the peak also played an important role in damage evolution. In contrast, in the case of lower energy ion irradiation (2 MeV), a relatively smooth distribution of damage was produced, as shown in Figure 2. The defect structure evolution is expected to be different from that caused by high-energy ion irradiations. Displacement per atom (dpa) is a measure used to quantify irradiation damage. Many researchers have utilized the maximum peak value of the damage peak region to express the damage by dpa. However, it remains unclear whether the peak value accurately represents the damage structure evolution when compared with homogeneous flat irradiation such as that produced by neutron irradiation in nuclear reactors. The damage structure of ion irradiation must be compared before applying the data to real nuclear systems.
As the defect evolutions are caused by the diffusion of point defects, they are affected by the distribution of point defects formed by irradiation. If the diffusion of point defects occurs in a shorter period than the formation of point defect clusters, there should be a large difference in the formation of defect clusters from the flat damage irradiation. The influence of the damage profile is a problem that needs to be solved.
This paper employed reaction kinetic analysis using rate equations [10,11,12,13,14,15] to examine the defect evolution caused by self-ion irradiated iron and compare it to that resulting from homogeneous flat damage irradiation. For the development of damage evolution, point defect migration plays an important role. Therefore, two irradiation temperatures, a low temperature of 273 K (low mobility) and a high temperature of 573 K (high mobility), were investigated. Understanding the effect of damage distribution, two accelerating voltages of 100 MeV and 2 MeV were chosen. The choice of these irradiation energies was based on the large difference in the damage profiles and the distances from the surface, as shown in Figure 1 and Figure 2.

2. Methods

The model employed for the calculations was nearly identical to that utilized in previous studies [7,16,17,18] and was based on rate theory. It characterizes the reaction rates among point defects and their associated defect clusters. The following assumptions were made in the calculations:
(1)
Mobile defects are interstitials, di-interstitials, vacancies, and di-vacancies.
(2)
Quadri-interstitials (loops) and quadri-vacancies (voids) are set to stable nuclei of clusters.
(3)
Thermal dissociation occurs in clusters containing fewer than three point defects.
(4)
The effect of cascade damage is represented in the direct formation of tri-interstitials and tri-vacancies as AIC × P(x) and AVC × P(x) in the following equations.
In these four assumptions, the important features in damage structure evolutions by point defect accumulations are included. The time dependence of ten variables was calculated for the following quantities: the concentration of interstitials (CI), di-interstitials (CI2), tri-interstitials (CI3), interstitial clusters (interstitial-type dislocation loops, CIC), vacancies (CV), di-vacancies (CV2), tri-vacancies (CV3), vacancy clusters (voids, CVC), the total interstitials in interstitial-type dislocation loops (RIC), and the total vacancies in voids (RVC). The rate equations are expressed as follows:
d C I d t = P x + D 2 C I x 2 + 2 Z I 2 _ B B I 2 M I C I 2 + Z I 3 _ B B I 3 M I C I 3 2 Z I _ I C I M I C I Z V _ I C V ( M I + M V ) C I Z I 2 _ I C I 2 ( M I + M I 2 ) C I Z V 2 _ I C V 2 ( M I + M V 2 ) C I Z I 3 _ I C I 3 M I C I Z V 3 _ I C V 3 M I C I Z S I _ I S I M I C I Z S V _ I S V M I C I + Z V 2 _ I 2 C V ( M I 2 + M V 2 ) C I 2 + Z I 3 _ 2 V C I 3 M V 2 C V 2   ,
d C V d t = P x + D 2 C V x 2 + 2 Z V 2 _ B B V 2 M V C V 2 + Z V 3 _ B B V 3 M V C V 3 + Z V 2 _ I C V 2 ( M I + M V 2 ) C I Z V _ I C V M I C I 2 Z V _ V C V M V C V Z I 2 _ V C V ( M I 2 + M V ) C I 2 Z V 2 _ V C V 2 ( M V + C V 2 ) C V Z I 3 _ V C I 3 M V C V Z V 3 _ V C V 3 M V C V Z S I _ V S I M V C V Z S V _ V S V M V C V + Z V 3 _ I 2 C V 3 M I 2 C I 2   ,
d C I 2 d t = D 2 C I 2 x 2 Z I 2 _ B B I 2 M I C I 2 + Z I 3 _ B B I 3 M I C I 3 + Z I _ I C I M I C I Z I 2 _ I C I 2 ( M I + M I 2 ) C I + Z I 3 _ V C I 3 M V C V Z V _ I 2 C V ( M I 2 + M V ) C I 2 2 Z I 2 _ I 2 C I 2 M I 2 C I 2 Z V 2 _ I 2 C V 2 ( M I 2 + M V 2 ) C I 2 Z I 3 _ I 2 C I 3 M I 2 C I 2 Z V 3 _ I 2 C V 3 M I 2 C I 2 Z S I _ I 2 S I M I 2 C I 2 Z S V _ I 2 S V M I 2 C I 2 ,
d C V 2 d t = D 2 C V 2 x 2 Z V 2 _ B B V 2 M V C V 2 + Z V 3 _ B B V 3 M V C V 3 Z V 2 _ I C V 2 ( M I + M V 2 ) C I + Z V 3 _ I C V 3 M I C I + Z V _ V C V M V C V Z V 2 _ V C V 2 ( M V + M V 2 ) C V Z V 2 _ I 2 C V 2 ( M I 2 + M V 2 ) C I 2 2 Z V 2 _ V 2 C V 2 M V 2 C V 2 Z I 3 _ V 2 C I 3 M V 2 C V 2 Z V 3 _ V 2 C V 3 M V 2 C V 2 Z S I _ V 2 S I M V 2 C V 2 Z S V _ V 2 S V M V 2 C V 2 C S M V 2 C V 2   ,
d C I 3 d t = A I C P ( x ) Z I 3 _ B B I 3 M I C I 3 + Z I 2 _ I C I 2 M I C I Z I 3 _ I C I 3 M I C I Z I 3 _ V C I 3 M V C V Z I 3 _ I 2 C I 3 M I 2 C I 2 Z I 3 _ V 2 C I 3 C V 2 M V 2 ,
d C V 3 d t = A V C P x Z V 3 _ B B V 3 M V C V 3 Z V 3 _ I C V 3 M I C I + Z V 2 _ V C V 2 ( M V + M V 2 ) C V Z V 3 _ V C V 3 M V C V Z V 3 _ I 2 C V 3 M I 2 C I 2 Z V 3 _ 2 V C V 3 M V 2 C V 2 ,
d C I C d t = Z I 3 _ I C I 3 M I C I + 2 Z I 2 _ I 2 C I 2 M I 2 C I 2 + Z I 3 _ I 2 C I 3 M I 2 C I 2   ,
d C V C d t = Z V 3 _ V C V 3 M V C V + 2 Z V 2 _ V 2 C V 2 M V 2 C V 2 + Z V 3 _ V 2 C V 3 M V 2 C V 2 ,
d R I C d t = 4 Z I 3 _ I C I 3 M I C I + Z S I _ I S I M I C I Z S I _ V S I M V C V + + 4 Z I 2 _ I 2 C I 2 M I 2 C I 2 + 5 Z I 3 _ I 2 C I 3 M I 2 C I 2 + 2 Z S I _ I 2 S I M I 2 C I 2 2 Z S I _ V 2 S I M V 2 C V 2 ,
d R V C d t = Z S V _ I S V M I C I + 4 Z V 3 _ V C V 3 M V C V + Z S V _ V S V M V C V 2 Z S V _ I 2 S V M I 2 C I 2 + 4 Z V 2 _ V 2 C V 2 M V 2 C V 2 + 5 Z V 3 _ V 2 C V 3 M V 2 C V 2 + 2 Z S V _ V 2 S V M V 2 C V 2 ,
S I = 2 π R I C C I C 1 / 2 ,
S V = ( 48 π 2 R V C C V C 2 ) 1 / 3 ,
where P(x) is the damage rate at position x from the surface, Z is the number of sites in the spontaneous reaction for each process indicated by the corresponding subscript, and S is the total sink efficiency of the clusters. The mobility of the defects, M, is expressed as ν   exp ( E M k T ) , where ν is the effective frequency associated with the vibration of the defects in the direction of the saddle point, which is taken as 1013/s. EM, k, and T are the migration energy, the Boltzmann constant, and absolute temperature, respectively. B is the dissociation probability of vacancies and interstitials, and is expressed as ν   exp ( E B k T ) , where EB is the binding energy. The subscripts I, V, IC, and VC denote interstitials, vacancies, interstitial clusters (interstitial-type dislocation loops), and vacancy clusters (voids), respectively. The concentrations are expressed in fractional units. These terms are almost the same as those in our previous papers [7,16,17,18]. For example, in the equation dCI/dt, D 2 C I x 2 : the diffusion term employing second-order discrete difference equation; Z I 2 _ B B I 2 M I C I 2 : the dissociation of di-interstitials and formation of two interstitials; Z I 3 _ B B I 3 M I C I 3 : the dissociation of tri-interstitials; Z I _ I C I M I C I : the formation of di-interstitials; Z V _ I C V ( M I + M V ) C I : the interstitial-vacancy mutual annihilation; Z I 2 _ I C I 2 ( M I + M I 2 ) C I : the formation of tri-interstitial clusters; Z V 2 _ I C V 2 ( M I + M V 2 ) C I : the absorption of interstitials by di-vacancy; Z I 3 _ I C I 3 M I C I : the absorption of interstitials by tri-interstitials; Z V 3 _ I C V 3 M I C I : absorption of interstitials by tri-vacancies; Z S I _ I S I M I C I : the absorption of interstitials by interstitial clusters; Z S V _ I S V M I C I   : the absorption of interstitials by vacancy clusters; Z I 2 _ V C V ( M I 2 + M V 2 ) C I 2 : the absorption of vacancies by di-interstitials; Z I 3 _ 2 V C I 3 M V 2 C V 2   : the absorption of di-vacancies by tri-interstitials. The coefficients used in the simulation and the corresponding values in iron are in Table 1 [7]. These values were determined considering the bias effects of defects [19] as between the interstitial (including cluster) and interstitial (cluster): 10, between the interstitial (cluster) and vacancy (cluster): 9, and between the interstitial (cluster) and vacancy (cluster): 8. These are simple, but contain enough reactions between point defects and their clusters. The equations were solved with CVODE in SUite of Nonlinear and DIfferential/ALgebraic equation Solvers (SUNDIALS v7.1.0) [20].
Two accelerating voltage cases were investigated: 100 MeV and 2 MeV self-ion irradiated iron. The damage distributions are shown in Figure 1 and Figure 2, where the vacancy distributions were calculated using SRIM [8]. High-energy particle irradiation produces cascade damage. In a cascade, the same number of interstitials and vacancies are formed. A vacancy-rich area is surrounded by an interstitial area. Interstitial distribution was assumed here to be 20 atomic distances deeper than that of the vacancies, considering the length of the replacement collision sequence [21,22,23]. The damage rate distribution based on SRIM is named here as “localized damage irradiation” and compared with homogeneous flat damage irradiation, like neutron irradiation, using the damage rate of the peak value of localized damage (named “homogeneous damage irradiation”), as shown in the broken lines in Figure 1 and Figure 2. The damage rate at the peak position and that for homogeneous damage irradiation by 2 MeV and 100 MeV was 1 × 10⁻⁵ dpa/s, and the total damage at the peak was 1 dpa. Two irradiation temperatures of 273 K and 573 K were simulated. The specimen thickness was assumed to be 4 × 10⁴ atomic distances (iron: 9.9 μm). The choice of the value is a typical size of the grains in pure metals after annealing.
Table 1. Coefficients used in the simulation and the corresponding values.
EI [24]EV [24]EI2 [24]EV2AICAVCZI_IZV_IZV_VZI2_IZI2_V
0.33 eV0.68 eV0.42 eV2.0 eV0.000140.00141098109
ZV2_IZV2_VZI2_I2ZI2_V2ZV2_I2ZV2_V2ZI3_IZI3_VZV3_IZV3_VZI3_I2ZI3_V2
981099810998109
ZV3_I2ZV3_V2ZSI_IZSV_IZSI_VZSV_VZSI_I2ZSV_I2ZSI_V2ZSV_V2
981099810998

3. Results

3.1. Self-Ion Irradiated Iron at 100 MeV

3.1.1. Irradiation at 573 K

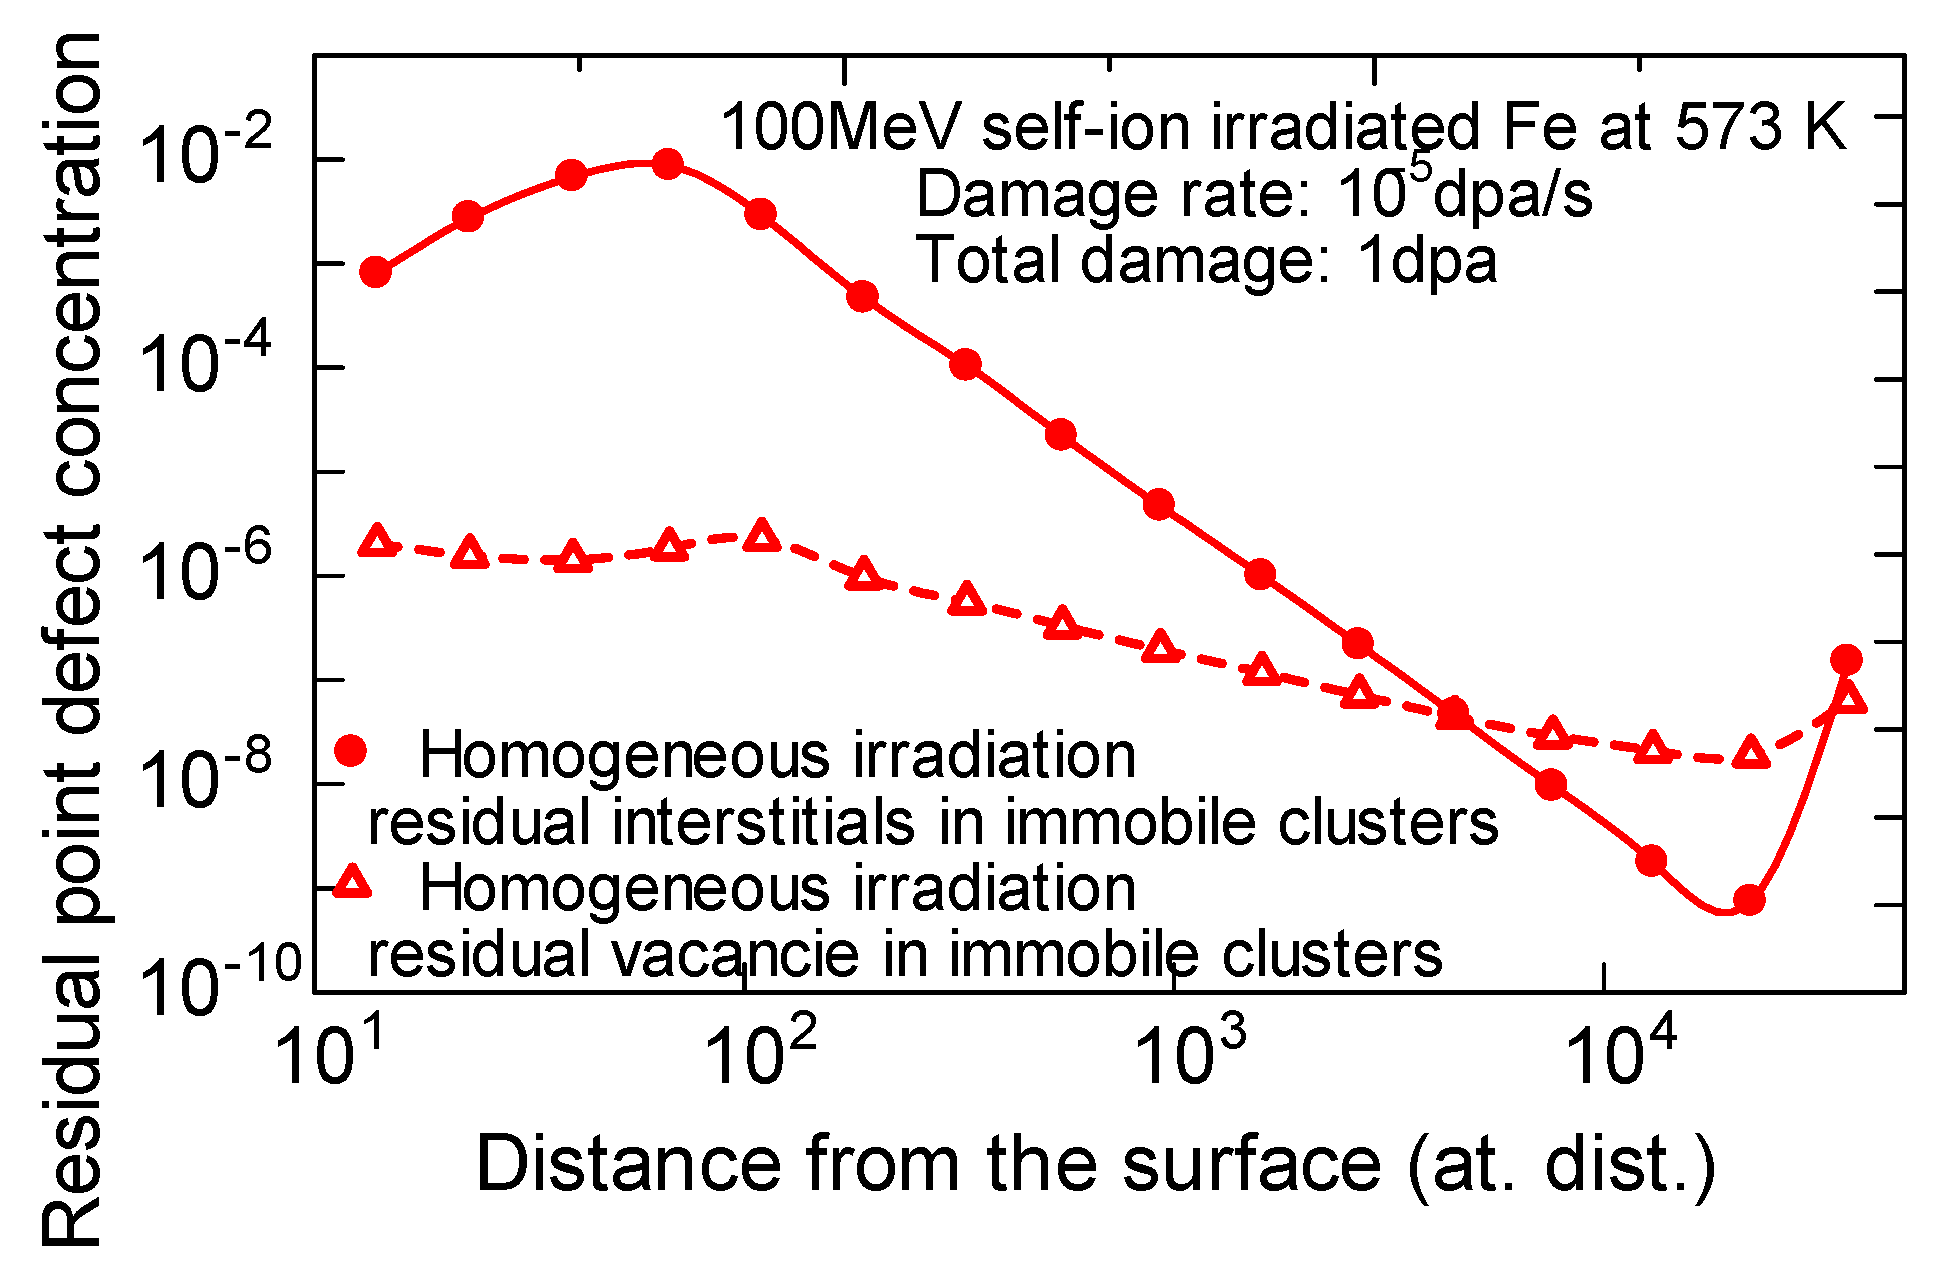
The depth distributions of the point defects and their clusters were simulated. Residual point defects in immobile clusters, which contained more than four-point defects, are shown in Figure 3 in the case of homogeneous damage irradiation. The concentrations of both residual interstitials at 573 K and vacancies decreased with the increasing depth and reached a minimum at 2 × 10⁴ atomic distances. An increase in residual interstitials near the surface area was observed in neutron-irradiated Ni [25]. In the deeper area, most of the vacancies annihilated with the interstitials. However, near the surface, the escape of vacancies to the surface promoted the clustering of interstitials. The increase at 3.7 × 10⁴ atomic distances was the effect of the back surface because of the specimen thickness of 4 × 10⁴ atomic distances.
Figure 4 shows the comparison of two irradiation modes (i.e., localized damage irradiation and homogeneous damage irradiation). The accumulations of residual point defects near the damage peak area were significant in localized damage irradiation. At 3.2 × 10⁴ atomic distances, a steep decrease in the residual interstitials and the corresponding increase in residual vacancies can be seen in the figure. The position corresponded to the start of a steep decrease in the damage peak.

3.1.2. Irradiation at 273 K

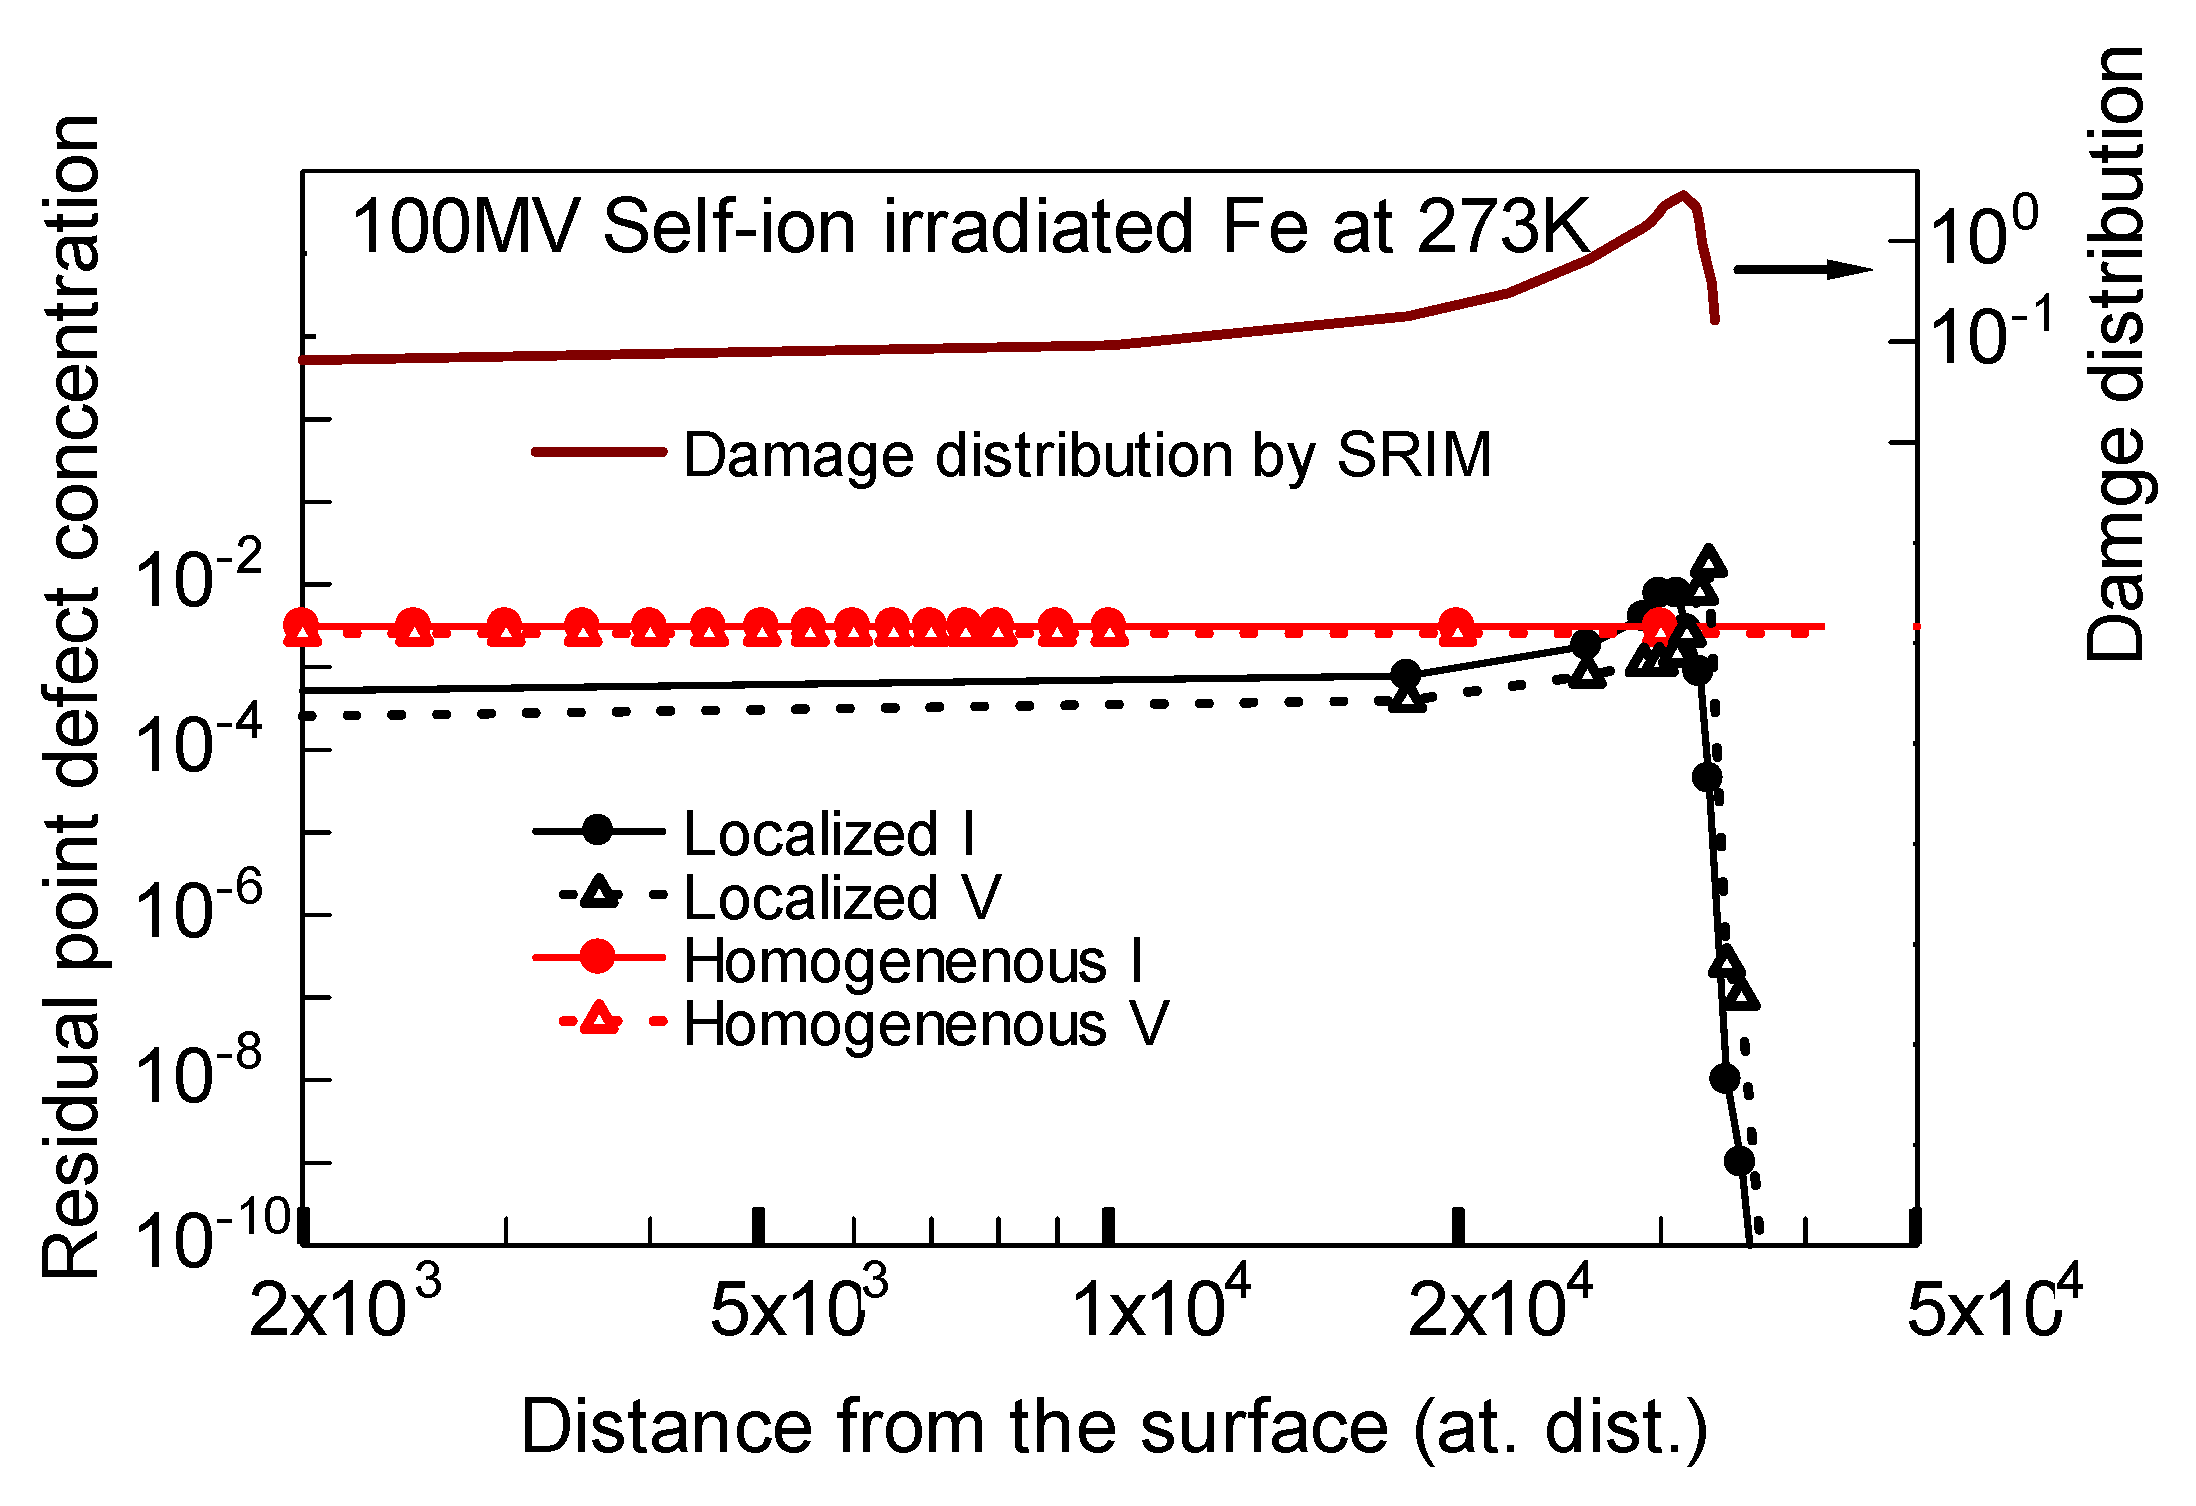
The accumulation of point defects in clusters was quite different from the 573 K irradiation. Both localized damage irradiation and homogeneous damage irradiation were almost the same from the point of point defect accumulation, as shown in Figure 5. The difference between the accumulation of vacancies and interstitials was not significant in both energies.

3.2. Self-Ion Irradiated Iron at 2 MeV

3.2.1. Irradiation at 573 K

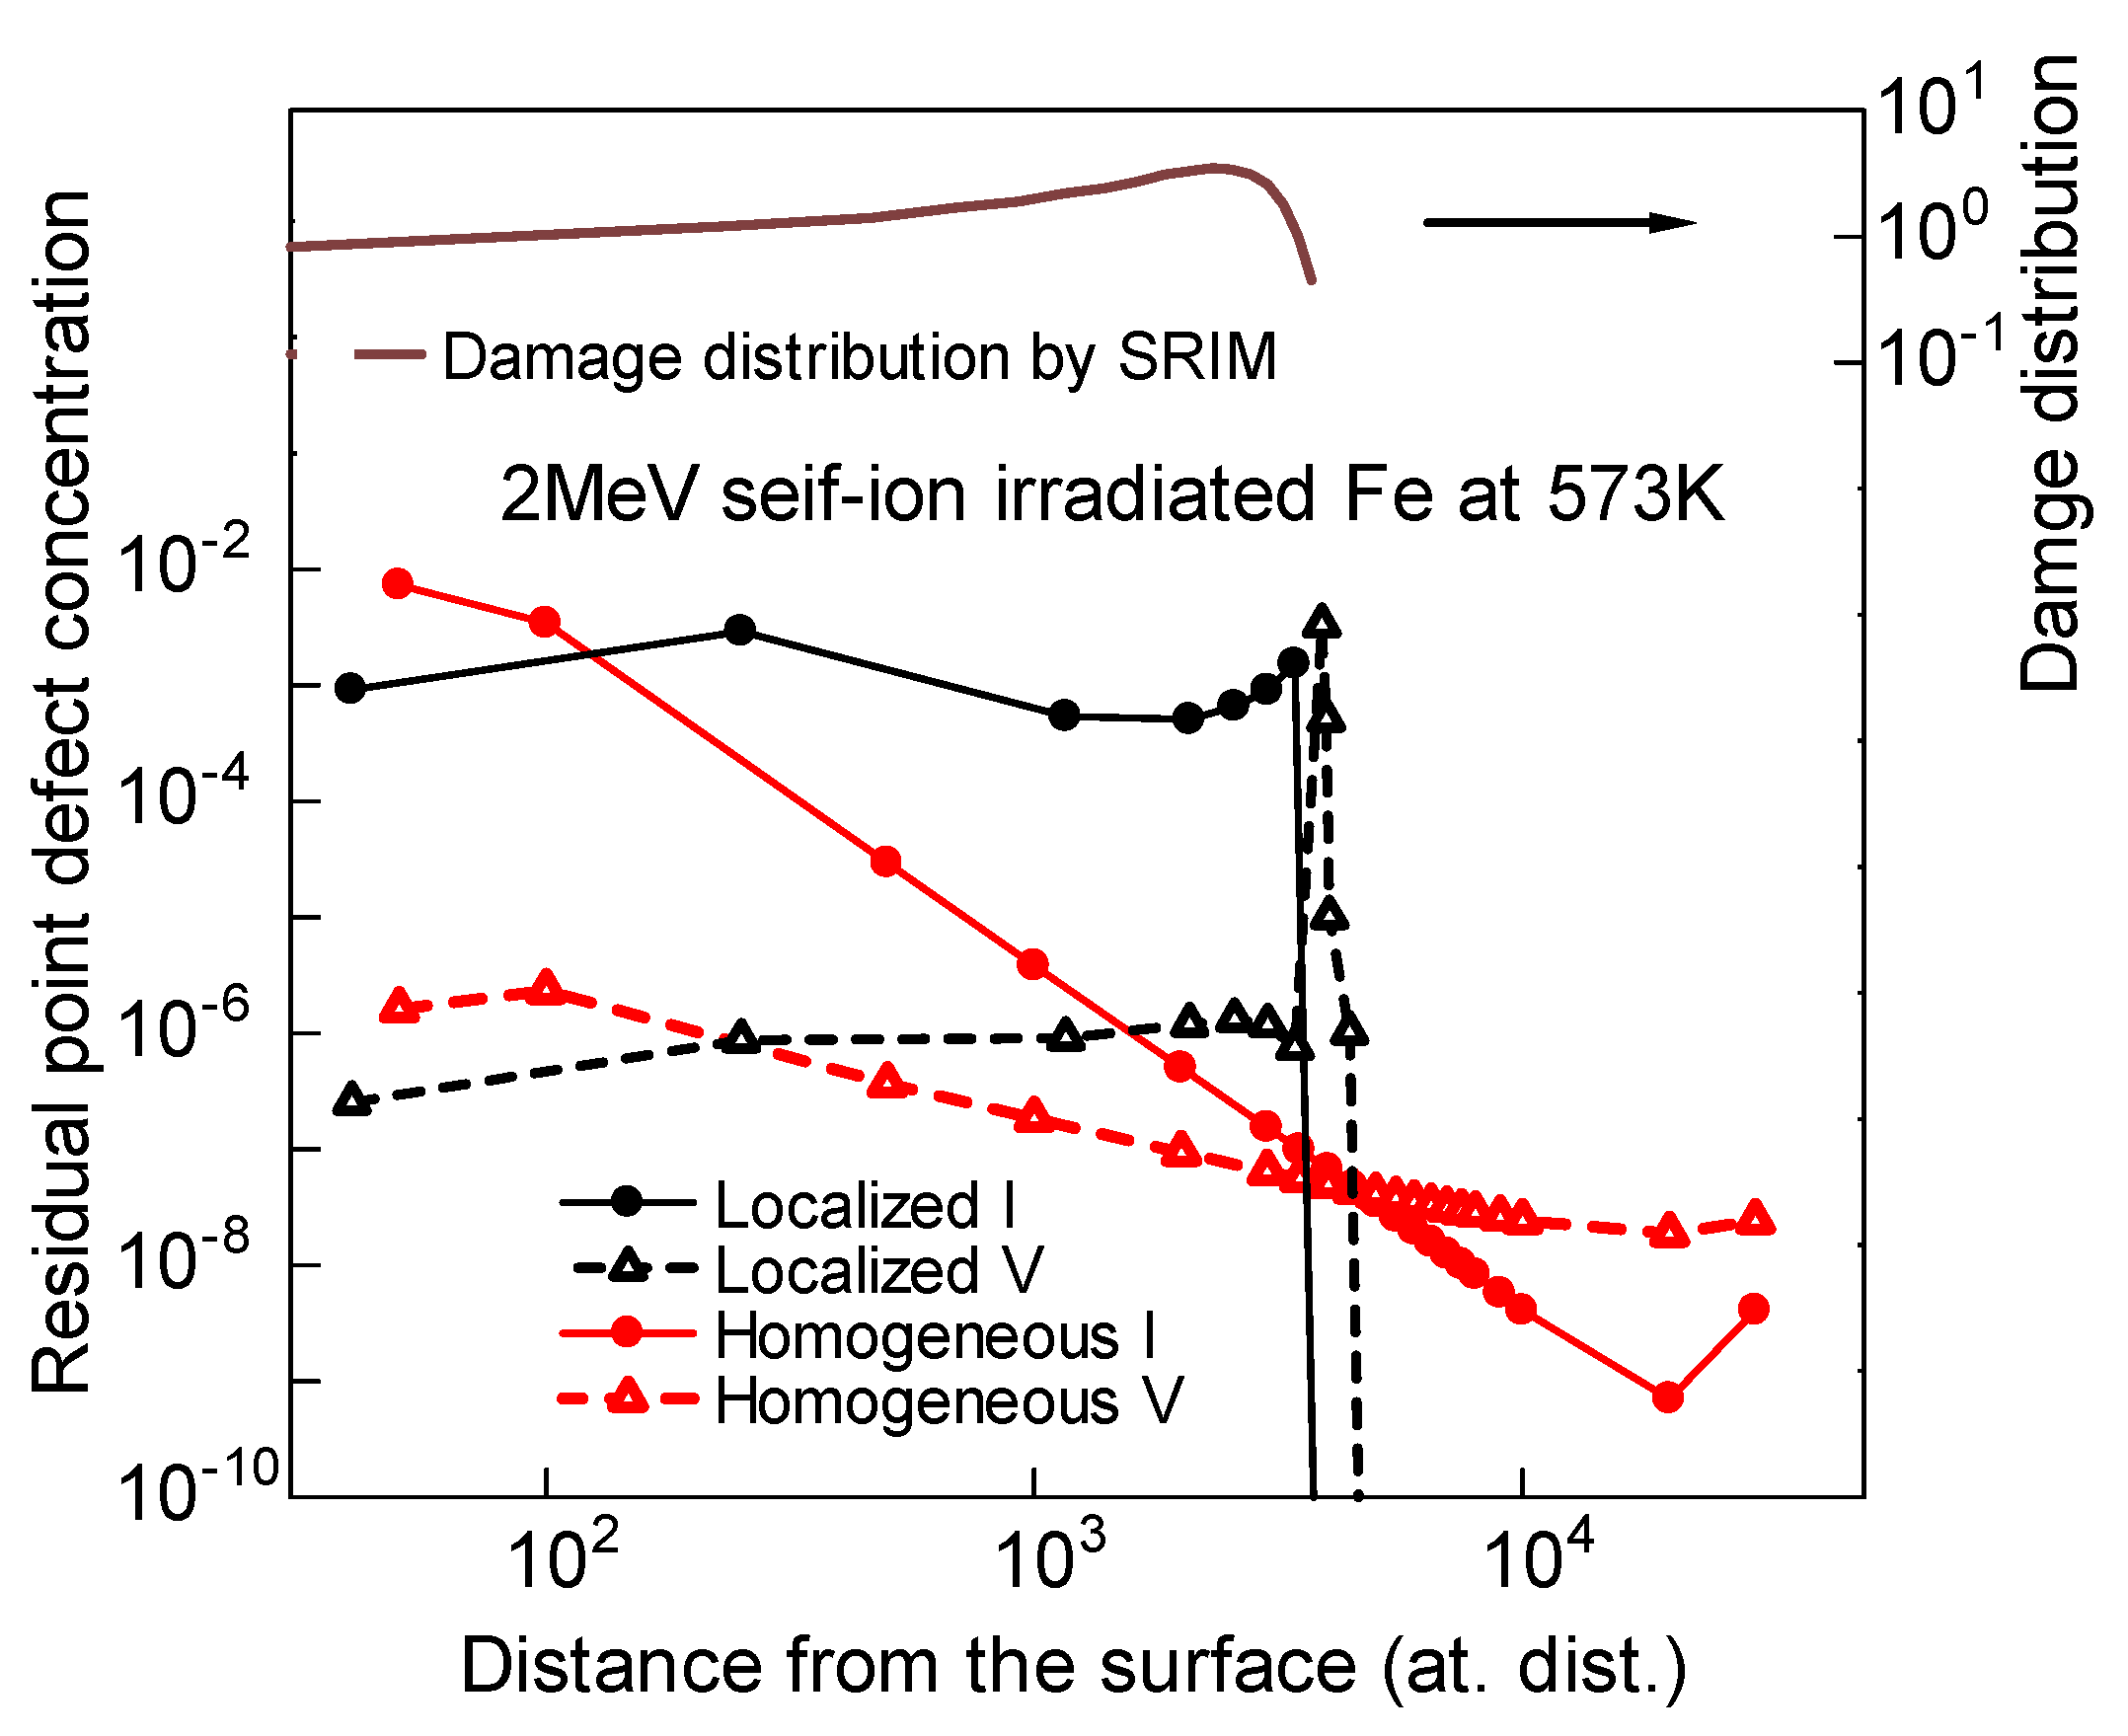
Figure 6 shows the depth distribution of point defects in the immobile point defect clusters in two 2 MeV irradiation cases. The tendency of localized damage irradiation was almost the same as the 100 MeV irradiation. A steep decrease in the residual interstitials and an increase in the residual vacancies occurred at the depth of 2.6 × 10³ atomic distances, which also corresponded to the start of the decrease in damage.

3.2.2. Irradiation at 273 K

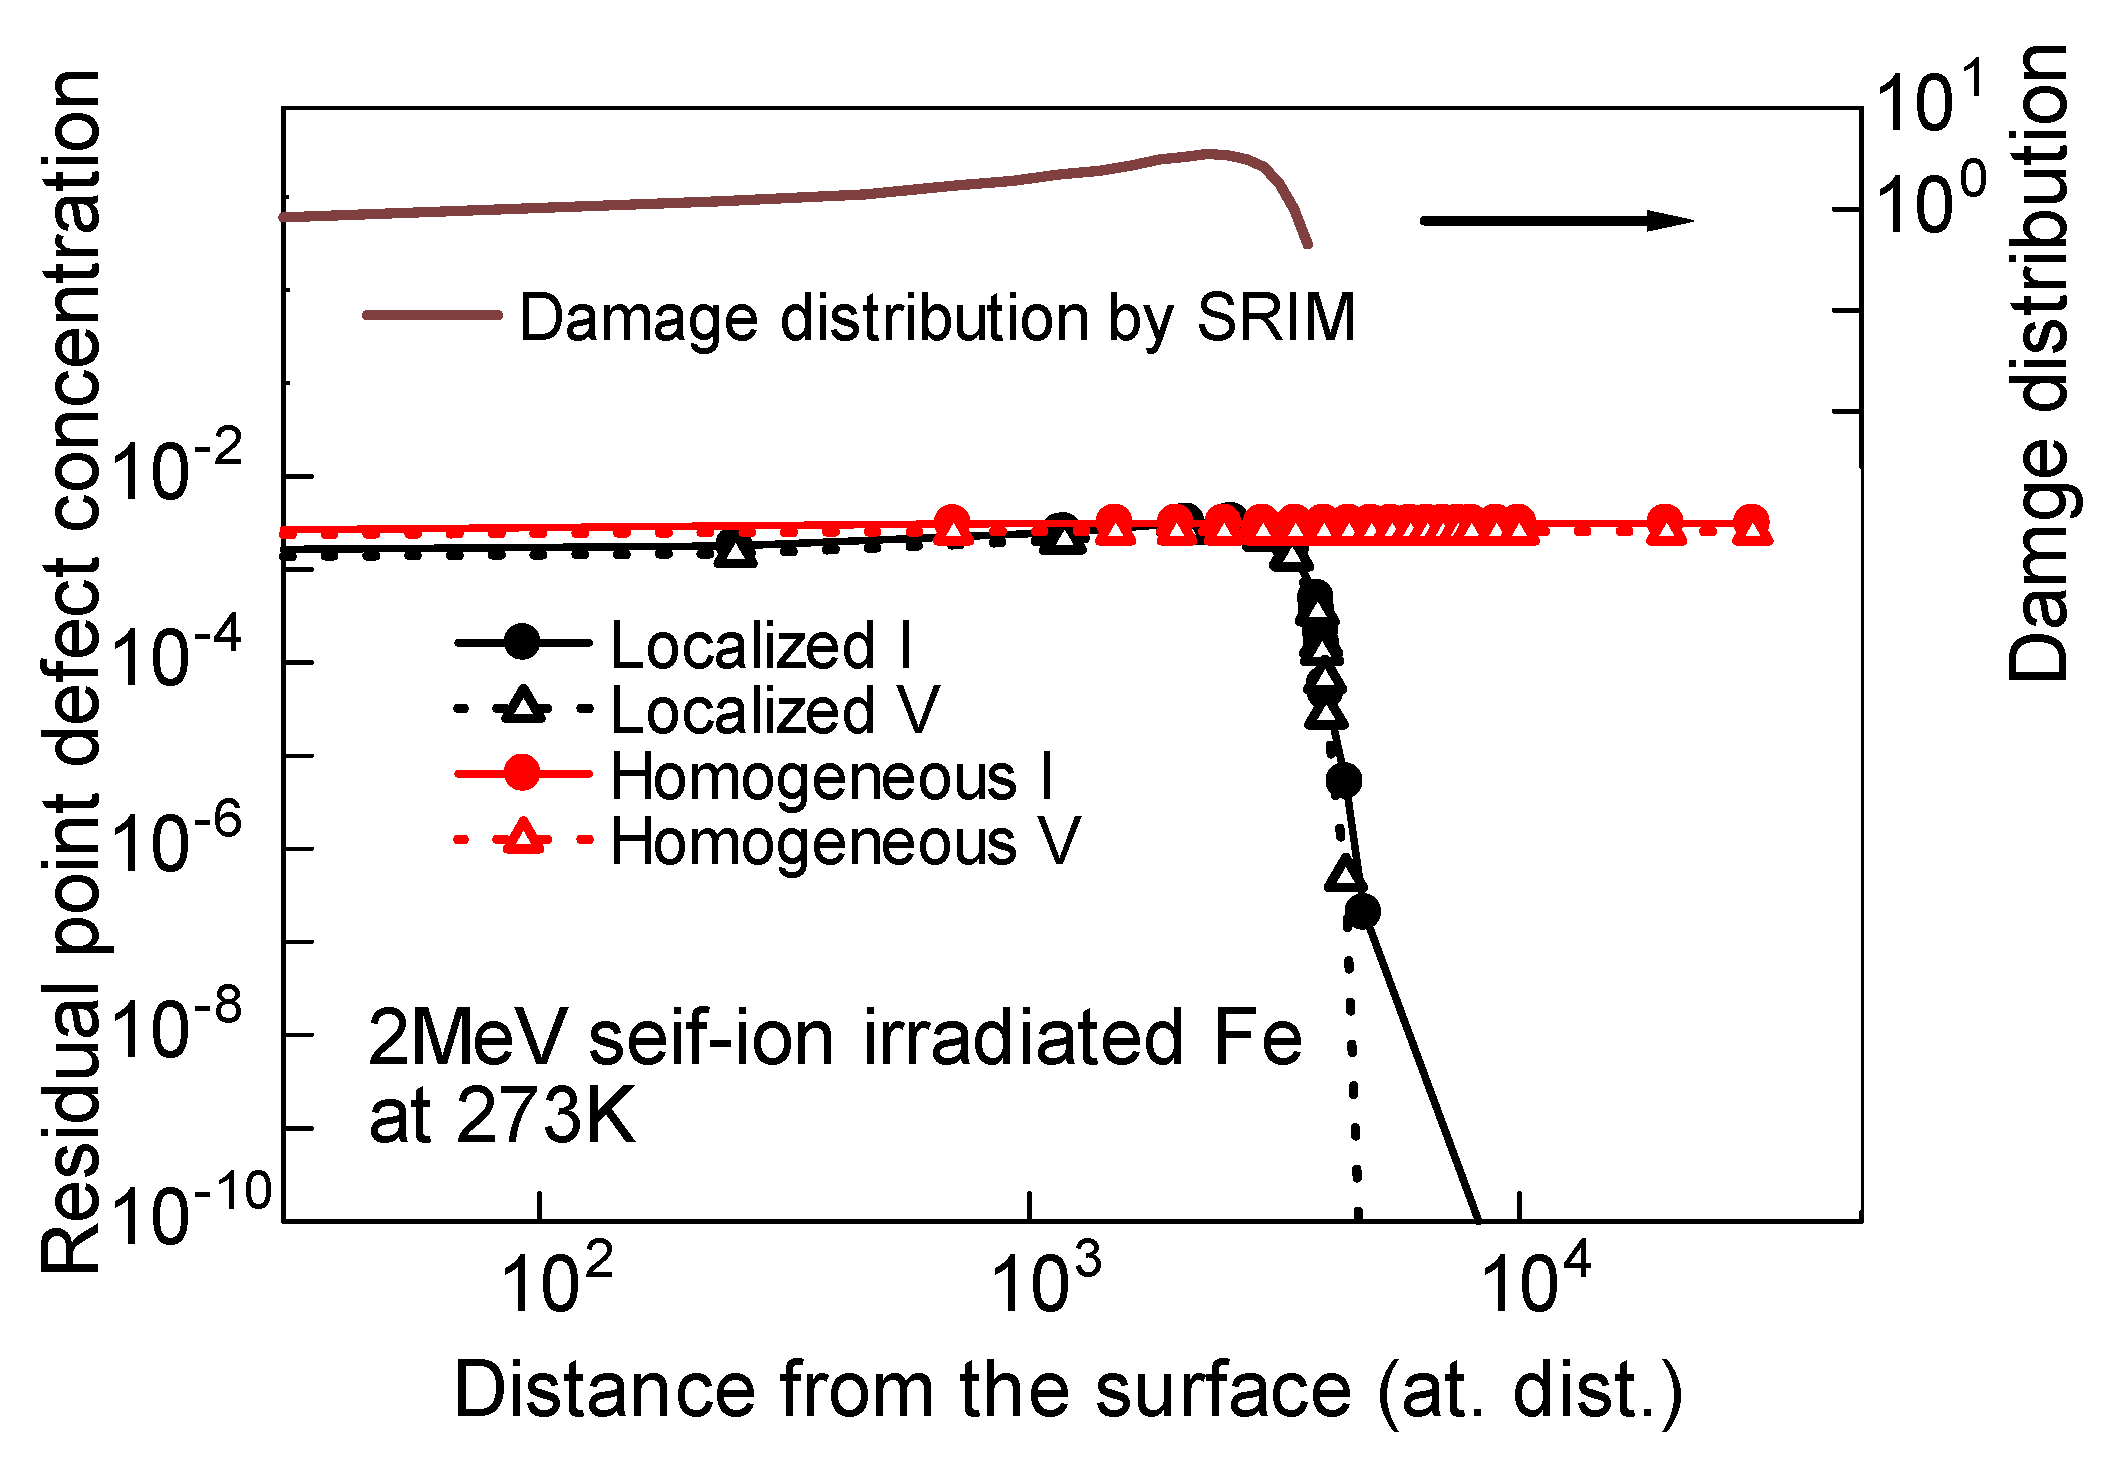
Figure 7 shows the accumulation of point defects in clusters. The residual point defect distributions were quite different from those at 573 K irradiation. The accumulations by both localized damage distribution and homogeneous damage irradiation were almost the same. The difference between the accumulation of vacancies and interstitials was not significant in both irradiations. The residual point defect distribution was almost constant, even by the localized damage irradiation. It was caused by the high mutual annihilation rate between interstitials and vacancies near the damage peak area.

4. Discussions

Even in homogeneous damage irradiation, the surface effect was significant for accumulating residual point defects in clusters at 573 K. At the center of the specimen, the concentration reached a minimum, as shown in Figure 3. The strong effect of the front and back surface was due to the low migration energy of vacancies, 0.68 eV [24], and a high irradiation temperature of 573 K. The increase in residual vacancies and the decrease in residual interstitials from 3.2 × 10⁴ to 2.6 × 10³ atomic distances for 100 MeV and 2 MeV irradiations, respectively, were caused by two reasons. One was the higher mobility of interstitials than vacancies. The other is the high sink efficiency of the area deeper than the damage peak. The area between the surface and the damage peak received some damage, but there was no damage at all in the deeper area from the damage peak. The easy escape of interstitials to the deeper area with no damage caused a decrease in the formation of interstitial clusters and promoted the growth of vacancy clusters near the peak position. The distribution of residual vacancies was not at the damage peak but at a little deeper area caused by the migration of vacancies during irradiation.
On the other hand, the point defect accumulation by 273 K irradiation was quite different from that by 573 K irradiation. The difference between the localized damage irradiation and homogeneous damage irradiation was small at both temperatures. This means that the damage rate of the peak value of the damage area is a good measure to express dpa. This is because the mobility of both point defects was low, and the defect clusters were formed at the damage area. The decrease in mobility seemingly corresponded to the increase in the migration energy of point defects. In the case of iron and steels, the vacancy migration energy between 1.1 and 1.2 eV is often a good value to explain experimental results [26,27]. The lower migration energy of 0.68 eV used in the present simulation, which was obtained by the first-principle calculations [24] and is a reliable value of vacancies for their jumps, made it possible to understand the effect caused by the short-range migration of vacancies [28]. The effect caused by long-range migration, such as the growth of vacancy clusters, is not explained by the low migration energy because of the existence of impurities like carbon [29]. Impurities interact with vacancies and interstitials and make their mobility decrease. A higher migration energy corresponds to lower temperature irradiation. Therefore, using a high migration energy for vacancies may be better for the comparison of the present simulation to experiments with specimens affected by impurities, even pure metals.
For post-irradiation experiments to study the irradiation effects, by selecting the depth from the beam incident surface, it is possible to obtain data on several damage rates and the total damage through a single irradiation experiment. For example, cross-sectional observations of transmission electron microscopy [30,31], nano-indentation [32], and slow positron annihilation spectroscopy [33,34] modifying the positron energy make it possible to obtain defect structures at the desired depth and the total damage (dpa). From the point of damage evolution, however, such experiments do not convey the results of homogeneous damage irradiation, as indicated by the current simulation.

5. Concluding Remarks

A preliminary investigation was conducted to compare the defect structures caused by two initial damage distributions: the damage distribution obtained by SRIM, and the homogeneous damage caused by the peak irradiation rate. The simulation demonstrated the difficulty of estimating damage structures only by dpa in the case of ion irradiation compared with homogeneous damage irradiation, especially at higher temperatures. The migration energy of vacancies and the irradiation temperature are important factors as well as the damage profile. For the development of nuclear materials using accelerated ions, it is necessary to comprehend the characteristics of the irradiation. This study is the first to explore the problem of using displacement per atom (dpa) as a measure of damage caused by ion irradiation.

Funding

This research received no external funding.

Data Availability Statement

The original contributions presented in this study are included in the article. Further inquiries can be directed to the corresponding author.

Conflicts of Interest

The author declares no conflicts of interest.

References

  1. Taller, S.; Chen, Y.; Song, R.; Chen, W.Y.; Jokisaari, A. An approach to combine neutron and ion irradiation data to accelerate material qualification for nuclear reactors. J. Nucl. Mater. 2025, 603, 155385. [Google Scholar] [CrossRef]
  2. Khiara, N.; Coulombier, M.; Raskin, J.P.; Bréchet, Y.; Pardoen, T.; Onimus, F. Helium nano-bubbles in copper thin films slows down creep under ion irradiation. Acta Mater. 2025, 288, 120854. [Google Scholar] [CrossRef]
  3. Robert Lürbke, R.; Riesch, J.; Feichtmayer, A.; Curzadd, B.; Höschen, T.; Neu, R. Experimental investigation of the impact of irradiation damages on the mechanical properties of tungsten. Nucl. Mater. Energy 2025, 42, 101858. [Google Scholar] [CrossRef]
  4. Liu, H.; Ge, W.; Wang, Y. Re-evaluating ion and neutron irradiation data with calculated applicable arc-dpa. Radiat. Eff. Defects Solids 2021, 176, 441–452. [Google Scholar] [CrossRef]
  5. Huang, J.; Gao, Z.; Liu, H.; Ma, P.; Liu, Y.; Ge, W.; Luo, F.; Cao, L.; Huang, J.; Xue, J.; et al. Effect of Damage Rate on the Cavity Swelling of Pure Nickel Irradiated with Triple Ion Beams. Metals 2022, 12, 1106. [Google Scholar] [CrossRef]
  6. Li, Y.; French, A.; Hu, Z.; Garner, F.A.; Shao, L. The dependence on displacement rate and temperature of near-surface void-denuding in self-ion irradiated pure polycrystalline and single-crystal iron. J. Nucl. Mater. 2024, 599, 155262. [Google Scholar] [CrossRef]
  7. Yoshiie, T.; Kinomura, K. Effect of pulse irradiation on the evolution of damage structure. Nucl. Instrum. Methods Phys. Res. Sect. B 2020, 479, 51–54. [Google Scholar] [CrossRef]
  8. Ziegler, J.F.; Ziegler, M.D.; Biersack, J.P. SRIM-The stopping and range of ions in matter (2010). Nucl. Instrum. Methods Phys. Res. Sect. B 2010, 268, 1818–1823. [Google Scholar] [CrossRef]
  9. Kiritani, M. Observation and analysis of defect structures evolution from radiation damage by D-T fusion neutrons. J. Nucl. Mater. 1986, 137, 261–278. [Google Scholar] [CrossRef]
  10. Sizmann, R. The effect of radiation upon diffusion in metals. J. Nucl. Mater. 1978, 69–70, 386–412. [Google Scholar]
  11. Yoshida, N.; Kiritani, M. Point Defect Clusters in Electron-Irradiated Gold. J. Phys. Soc. Jpn. 1973, 35, 1418–1429. [Google Scholar] [CrossRef]
  12. Kiritani, M.; Yoshida, N.; Takata, T.; Maehara, Y. Growth of Interstitial Type Dislocation Loops and Vacancy Mobility in Electron Irradiated Metals. J. Phys. Soc. Jpn. 1975, 38, 1677–1686. [Google Scholar] [CrossRef]
  13. Stoller, R.E.; Odette, G.R. Microstructural evolution in an austenitic stainless steel fusion reactor first wall. J. Nucl. Mater. 1986, 141–143, 647–653. [Google Scholar] [CrossRef]
  14. Was, G.S. Fundamentals of Radiation Materials Science: Metal and Alloys; Springer: Berlin/Heidelberg, Germany, 2007; Section 5. [Google Scholar]
  15. Adjanor, G. Complete characterization of sink-strengths for mutually 1D-mobile defect clusters: Extension to diffusion anisot ropy analog cases. J. Nucl. Mater. 2022, 572, 153970. [Google Scholar] [CrossRef]
  16. Yoshiie, T.; Xu, Q.; Sato, K. Reaction kinetic analysis of damage rate effects on defect structural evolution in Fe-Cu. Nucl. Instrum. Methods Phys. Res. Sect. B 2013, 303, 37–41. [Google Scholar] [CrossRef]
  17. Yoshiie, T.; Sato, K.; Xu, Q.; Nagai, Y. Reaction kinetic analysis of reactor surveillance data. Nucl. Instrum. Methods Phys. Res. Sect. B 2015, 352, 125–129. [Google Scholar] [CrossRef]
  18. Yoshiie, T.; Kinomura, A.; Nagai, Y. Reaction kinetic analysis of reactor surveillance data II. Nucl. Instrum. Methods Phys. Res. Sect. B 2017, 393, 97–100. [Google Scholar] [CrossRef]
  19. Kuramoto, E.; Ohsawa, K.; Tsutsumi, T. Study of fundamental features of bias effect in metals under irradiation. J. Nucl. Mater. 2002, 307–311, 982–987. [Google Scholar] [CrossRef]
  20. Hindmarsh, C.; Brown, P.N.; Grant, K.E.; Lee, S.L.; Serban, R.; Shumaker, D.E.; Woodward, C.S. SUNDIALS: Suite of nonlinear and differential/algebraic equation solvers. ACM Trans. Math. Softw. 2005, 31, 363–396. [Google Scholar] [CrossRef]
  21. Morishita, K.; Sekimura, N.; de Rubia, T.D.L. A molecular dynamics study for ultrafast process of radiation damage in materials. J. Nucl. Mater. 1997, 248, 400–404. [Google Scholar] [CrossRef]
  22. Hou, M.; Souidi, A.; Becquart, C.S. Replacement collision sequence studies in iron. Nucl. Instrum. Methods Phys. Res. Sect. B 2002, 196, 31–38. [Google Scholar] [CrossRef]
  23. Becquart, C.S.; Backer, A.D.; Olsson, P.; Domain, C. Modelling the primary damage in Fe and W: Influence of the short range interactions on the cascade properties: Part 1—Energy transfer. J. Nucl. Mater. 2021, 547, 152816. [Google Scholar] [CrossRef]
  24. Goryaeva, A.M.; Dérès, J.; Lapointe, C.; Grigorev, P.; Swinburne, T.D.; Kermode, J.R.; Ventelon, L.; Baima, J.; Marinica, M.-C. Efficient and transferable machine learning potentials for the simulation of crystal defects in bcc Fe and W. Phys. Rev. Mater. 2021, 5, 103803. [Google Scholar] [CrossRef]
  25. Yoshiie, T.; Kojima, S.; Satoh, Y.; Hamada, K.; Kiritani, M. Detection of the role of free point defects from the variation of defect structures near permanent sinks in neutron irradiated metals. J. Nucl. Mater. 1992, 191–194, 1160–1165. [Google Scholar] [CrossRef]
  26. Lin, Y.R.; Bhattacharya, A.; Zinkle, S.J. Analysis of position-dependent cavity parameters in irradiated metals to obtain insight on fundamental defect migration phenomena. Mater. Des. 2023, 226, 111668. [Google Scholar] [CrossRef]
  27. Kiritani, M.; Tanakata, H.; Moriyama, K.; Fujita, F.E. Mobility of Latice Vacancies in Iron. Philos. Mag. A 1979, 40, 779–802. [Google Scholar] [CrossRef]
  28. Kuramoto, E.; Abe, H.; Takenaka, M.; Hori, F.; Kamimura, Y.; Kimura, M.; Ueno, K. Positron annihilation lifetime study of irradiated and deformed Fe and Ni. J Nucl. Mater. 1996, 239, 54–60. [Google Scholar] [CrossRef]
  29. Hu, Z.; Shao, L. Effects of Carbon on Void Nucleation in Self-Ion-Irradiated Pure Iron. Nucl. Sci. Eng. 2024, 198, 145–157. [Google Scholar] [CrossRef]
  30. Li, Z.C.; Abe, H.; Sekimura, N. Analysis of defects formation and mobility during ion irradiation by coherent precipitates. Mater. Trans. 2006, 47, 259–262. [Google Scholar] [CrossRef]
  31. Mulewska, K.; Dominguez-Gutierrez, F.J.; Kalita, D.; Byggmästar, J.; Wei, G.Y.; Chromiński, W.; Papanikolaou, S.; Alava, M.J.; Kurpaska, Ł.; Jagielski, J. Self–ion irradiation of high purity iron: Unveiling plasticity mechanisms through nanoindentation experiments and large-scale atomistic simulations. J. Nucl. Mater. 2023, 586, 154690. [Google Scholar] [CrossRef]
  32. Bergner, F.; Kaden, C.; Das, A.; Merino, S.; Diego, G.; Hähner, P. Nanoindentation applied to ion-irradiated and neu-tron-irradiated Fe-9Cr-NiSiP model alloys. J. Appl. Phys. 2022, 132, 045101. [Google Scholar] [CrossRef]
  33. Zhao, S.; Chen, H.; Li, Y.; Jin, S.; Wu, Y.; Zhou, C.; Li, X.; Tang, H.; Yu, W.; Xia, Z. Characteristics of solar wind radiation damage in lunar soil: PAT and TEM study. Nanomaterials 2022, 12, 1135. [Google Scholar] [CrossRef] [PubMed]
  34. Slugen, V.; Brodziansky, T.; Veternikova, J.S.; Sojak, S.; Petriska, M.; Hinca, R.; Farkas, G. Positron annihilation atudy of RPV ateels radiation loaded by hydrogen ion implantation. Materials 2022, 15, 7091. [Google Scholar] [CrossRef] [PubMed]
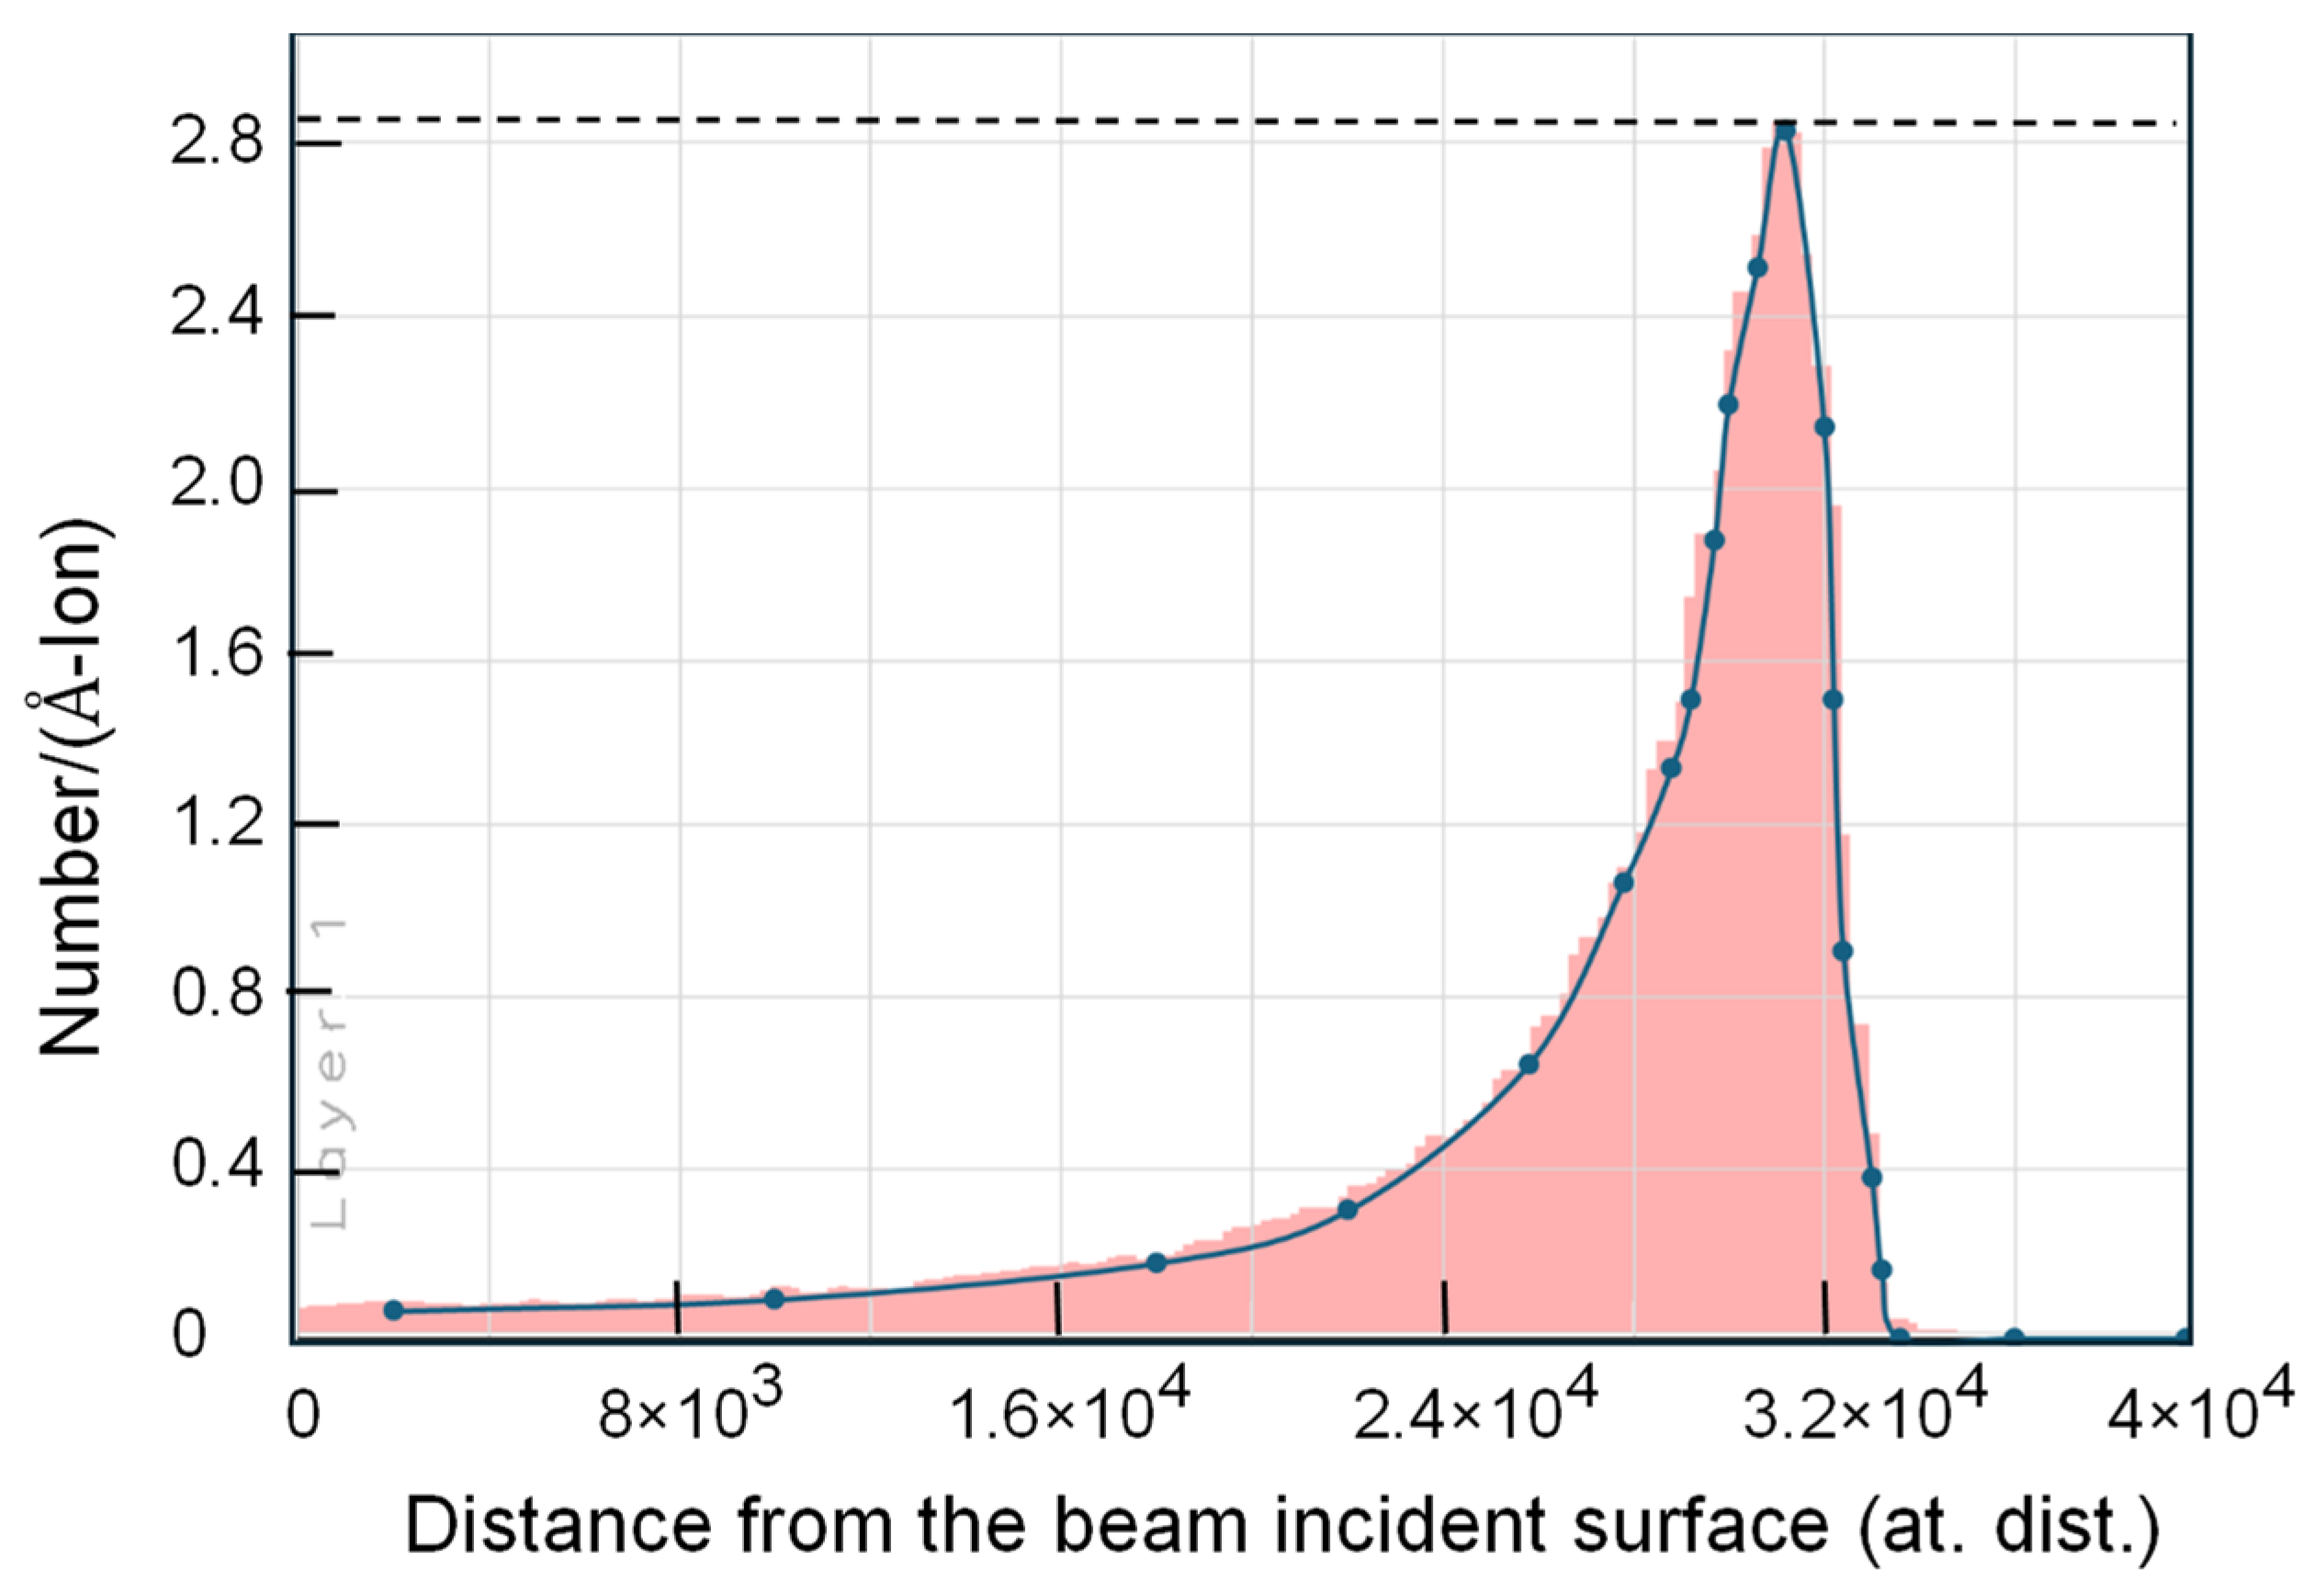
Figure 1. Damage distribution of the 100 MeV ion irradiated iron by SRIM. The broken line indicates homogeneous flat damage irradiation. The closed circles serve as points that made the damage profile in the simulation.
Metals 15 00555 g001
Figure 2. Damage distribution of the 2 MeV self-ion irradiated iron by SRIM. The broken line indicates homogeneous flat damage irradiation. The closed circles serve as points that made the damage profile in the simulation.
Metals 15 00555 g002
Figure 3. Residual point defects in immobile clusters in the 100 MeV homogeneous self-ion irradiated iron at 573 K to 1 dpa with 1 × 10⁻⁵ dpa/s.
Metals 15 00555 g003
Figure 4. Comparison of the residual point defects in clusters between the localized damage irradiation and homogeneous damage irradiation with 100 MeV at 573 K to 1 dpa. Localized I: residual interstitials in self-ion irradiated iron using SRIM. Homogeneous I: residual interstitials in homogeneous damage irradiation.
Metals 15 00555 g004
Figure 5. Comparison of residual point defects in clusters between the localized damage irradiation and homogeneous damage irradiation with 100 MeV at 273 K to 1 dpa. Localized I: residual interstitials in self-ion irradiated iron using SRIM. Homogeneous I: residual interstitials in homogeneous damage irradiation.
Metals 15 00555 g005
Figure 6. Comparison of residual point defects in clusters between localized damage irradiation and homogeneous damage irradiation with 2 MeV at 573 K to 1 dpa. Localized I: residual interstitials in self-ion irradiated iron using SRIM. Homogeneous I: residual interstitials in homogeneous damage irradiation.
Metals 15 00555 g006
Figure 7. Comparison of residual point defects in clusters between localized damage irradiation and homogeneous damage irradiation with 2 MeV at 273 K to 1 dpa. Localized I: residual interstitials in self-ion irradiated iron using SRIM. Homogeneous I: residual interstitials in homogeneous damage irradiation.
Metals 15 00555 g007
Disclaimer/Publisher’s Note: The statements, opinions and data contained in all publications are solely those of the individual author(s) and contributor(s) and not of MDPI and/or the editor(s). MDPI and/or the editor(s) disclaim responsibility for any injury to people or property resulting from any ideas, methods, instructions or products referred to in the content.