Article

Impact of Melt Refining on Secondary Al-Si Alloys’ Microstructure and Tensile Mechanical Performance

by
Wei Gu
,
Huixin Jin
*,
Xue Wang
and
Jiajun Jiang
School of Materials and Metallurgy, Guizhou University, Guiyang 550025, China
*
Author to whom correspondence should be addressed.
Metals 2025, 15(5), 556; https://doi.org/10.3390/met15050556
Submission received: 9 April 2025 / Revised: 11 May 2025 / Accepted: 14 May 2025 / Published: 18 May 2025
(This article belongs to the Section Metal Casting, Forming and Heat Treatment)

Abstract

Secondary Al-Si alloys typically encompass several impurities that substantially influence the materials’ microstructure and mechanical performance. This study employed a composite addition of chlorinated salt fluxing and an aluminum–boron master alloy to reduce the levels of the impurity elements magnesium (Mg), titanium (Ti), and vanadium (V) in secondary Al-Si alloys. The investigation of the performance mechanism revealed that the distribution of alloys’ grain orientation and the ratio of small-angle grain boundaries were modified via synergistic purification, leading to the refined microstructure and mechanical performance of secondary Al-Si alloys. The removal rates of impurity elements under these optimal refining conditions were 89.9% for Mg, 68.9% for Ti, and 61.5% for V. The refined alloy exhibited a 45.5% decrease in grain size and a 28.7% improvement in tensile strength compared to the raw material. These findings demonstrate that fluxing can improve the extraction of Ti and V from secondary Al-Si alloy melts of aluminum–boron master alloys, providing a new cost-effective strategy for the removal of impurities and the optimization of the properties of secondary Al-Si alloys.

1. Introduction

Secondary aluminum refers to the recycling process involving the sorting and smelting of recovered aluminum waste products. This approach has significantly contributed to the conservation of natural resources and sustainable development in the aluminum industry [1,2,3,4]. The primary raw materials for secondary aluminum production include scrap aluminum alloys from door/window frames, construction materials, and cable components. The resulting recycled aluminum finds diverse applications across the transportation, construction, electronics, and electrical appliance industries [5,6,7]. However, challenges arise from the inherent complexity of scrap sources. The varied nature of aluminum waste products containing multiple impurity elements leads to contamination risks and an inconsistent raw material quality. This variability complicates the preservation of aluminum product grades during recycling [8,9]. Excessive impurity elements can induce critical defects in secondary aluminum products, including inclusions and cracks, which adversely affect their mechanical properties, casting performance, and surface quality [10,11,12,13]. The impurity content serves as a key indicator of melt cleanliness in secondary aluminum processes [14,15]. Melt refinement emerges as a crucial purification stage in secondary aluminum production, playing a pivotal role in developing high-quality aluminum alloys and ensuring the final product’s integrity [16,17,18].
Magnesium plays distinct roles in various aluminum alloys. It serves as an alloying element in Al-Mg and Al-Si-Mg alloys but acts as an impurity in A356, A380, and A390 alloys. The composition of these alloys must be meticulously controlled to ensure optimal mechanical properties [19,20]. Barrera et al. [21] demonstrated that adding SiO2 beneath molten aluminum at elevated temperatures oxidized the Mg to form MgO, which was removed as slag. This method reduced the Mg content from 1.2% to 0.02%. A novel composite fluxing system utilizing a NaCl matrix with MnCl2 additives was developed in the current study. The application of this fluxing during melt refinement operations resulted in a notable Mg reduction within regenerated aluminum melts. The optimized fluxing composition enhanced Mg removal efficiency through combined chemical reactions and physical adsorption mechanisms.
In electrical-grade aluminum, V and Ti emerge as critical conductivity inhibitors. These elements induce lattice distortion through solid solution effects, significantly degrading the electrical performance [22,23,24]. Ludwig et al. [25] further revealed that excessive V content promotes abnormal grain growth in A356 alloys, compromising their mechanical properties. Despite these findings, research on the simultaneous removal of Mg, Ti, and V impurities from secondary aluminum remains limited. While aluminum–boron master alloys have shown effectiveness in primary aluminum purification, their application mechanisms and performance enhancement in secondary aluminum systems require systematic investigation.
This study addresses these research gaps through a comprehensive analysis of flux-refined secondary aluminum alloys. Microstructure evolution and mechanical property enhancement were systematically investigated through optical microscopy (OM), scanning electron microscopy (SEM), and electron backscatter diffraction (EBSD) under varying fluxing conditions and aluminum–boron master alloy additions. Technical challenges exist in the large-scale industrial implementation of refinement techniques such as electromagnetic stirring and ultrasonic treatment. The developed strategy enables a simultaneous enhancement of strength and ductility in secondary aluminum alloys without requiring process modifications, demonstrating significant potential for the industrial-scale production of high-performance secondary aluminum materials.

2. Experimental

2.1. Materials

The secondary Al-Si alloy feedstock was sourced from a professional industrial supplier in Guizhou Province (Guizhou Yingjuheng New Materials Co., Ltd, Liupanshui, China). Following standardized remelting and casting procedures, the chemical composition was determined by optical emission spectroscopy (OES) and is detailed in Table 1. The analysis revealed that the alloy consisted of 96.8 wt.% Al and 1.94 wt.% Si as the primary constituents, with trace elements comprising the remaining 1.26 wt.%. Aluminum–boron master alloys (the boron content was 3.29 wt.%) were procured from specialized manufacturers in Zhejiang Province (Junli metal auxiliary materials, Taizhou, China). Figure 1 presents the XRD characterization of the fluxing, demonstrating that its crystalline composition was dominated by NaCl and MnCl2, with minor Na2SO4 phases. This crystalline salt matrix was specifically formulated for enhanced impurity adsorption capacity during melt refinement.

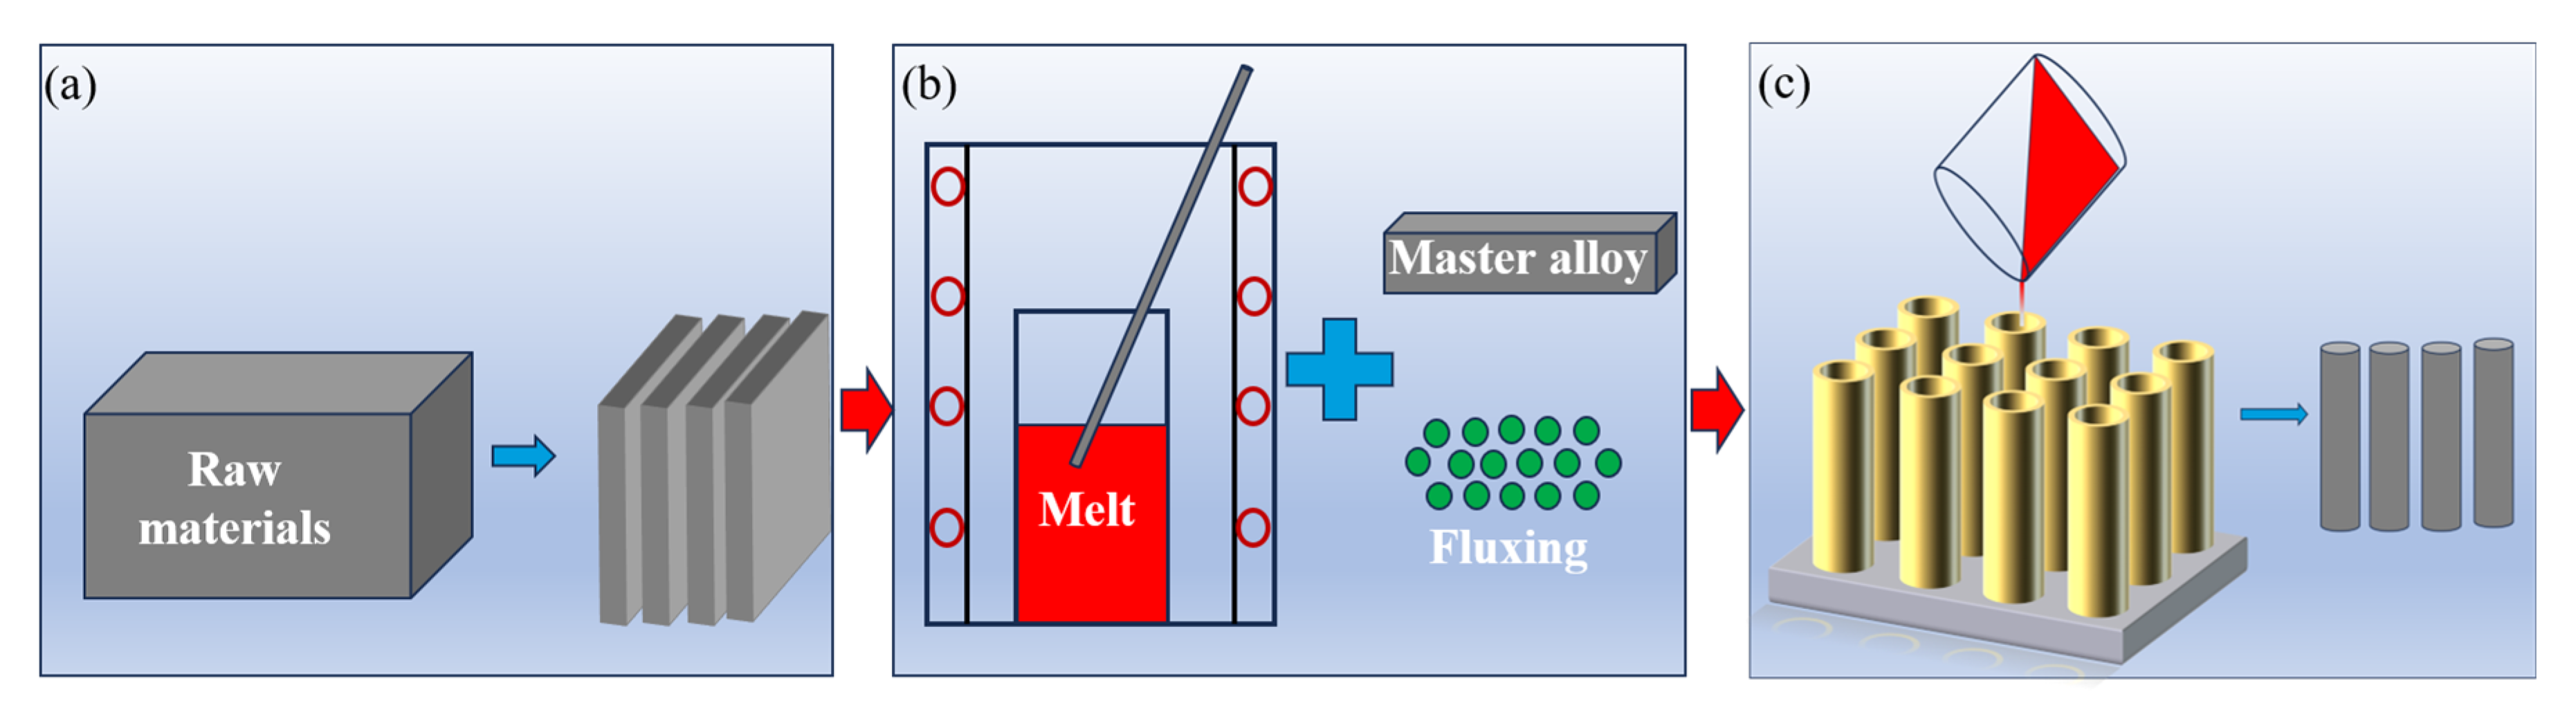
2.2. Experimental Procedure

In this study, secondary Al-Si alloy ingots were utilized as raw materials. The secondary Al-Si alloy’s raw material was sectioned into 200 g specimens and loaded into a corundum crucible. The furnace was heated to 400 °C at a ramp rate of 7 °C/min and held at this temperature for 20 min to ensure the thermal equilibrium of the crucible. Subsequently, the temperature was elevated to 780 °C, at which point aluminum–boron master alloy strips were introduced into the molten aluminum. The melt was maintained at 780 °C for 20 min to ensure the complete dissolution of both the secondary Al-Si alloys and aluminum–boron master alloy (0.4 wt.%–0.8 wt.%). The fluxing was incorporated (0.3 wt.%–0.7 wt.%) encased in aluminum foil and stirred thoroughly after 2–3 min. After 25 min of refining, slag was removed from the melt through a bottom-to-top skimming procedure. The purified aluminum melt was allowed to settle for 0–120 min to facilitate the impurities’ sedimentation before being cast into a preheated graphite mold (200 °C). An overview of the experimental methodology is illustrated in Figure 2.
Tensile specimens were fabricated in strict compliance with the Chinese National Standard GB/T228-2002 [26]. For the microstructure analysis, cubic samples with nominal dimensions of 10 mm × 10 mm × 3 mm were cut and prepared. The sample surfaces were sequentially ground with silicon carbide abrasive papers ranging from 1000 to 5000 grit. Subsequently, electropolishing was carried out in a solution of 5% HClO4 and 95% C2H5OH under a constant voltage of 20 V for 20 s. Finally, the samples were chemically etched using a mixed-acid solution containing 2% HCl, 3% HNO3, and 5% HF to enhance the microstructural visibility.

2.3. Characterization Devices

The chemical composition of the secondary Al-Si alloy raw material and refined samples was quantitatively characterized using optical emission spectroscopy (OES; SPECTROMAXx LAMMO5, SPECTRO, Kleve, Germany). Microstructural features, including grain morphology, were examined via optical microscopy (OM; SOPTOP ICX4IM, SOPTOP, Ningbo, China). Scanning electron microscopy (SEM; OXFORD EM-30PLUS, COXEM, Beijing, China) analysis was conducted with a gold sputtering current of 10 mA. Phase identification was performed by X-ray diffraction (XRD; Bruker D8 Advance, Bruker, Germany) using a Cu Kα radiation source over a 2θ range of 5–90° at a scanning rate of 10°/min. Mechanical properties were evaluated using an electronic universal testing machine (MTS E45.105, MTS, Dongguan, China) under a constant crosshead speed of 1 mm/min.

3. Results and Discussion

3.1. Melt Refining

Systematic experimental validation revealed that the concentrations of additional impurity elements remained largely unchanged compared to the raw material. The potential influence of other impurity elements (e.g., Fe) on the mechanical properties lies beyond the scope of the present investigation. This study investigated the mechanisms for removing Mg, Ti, and V impurities from secondary Al-Si alloy melts, with a focused analysis of the effects of standing time, fluxing, and aluminum–boron master alloy dosage on purification efficiency.

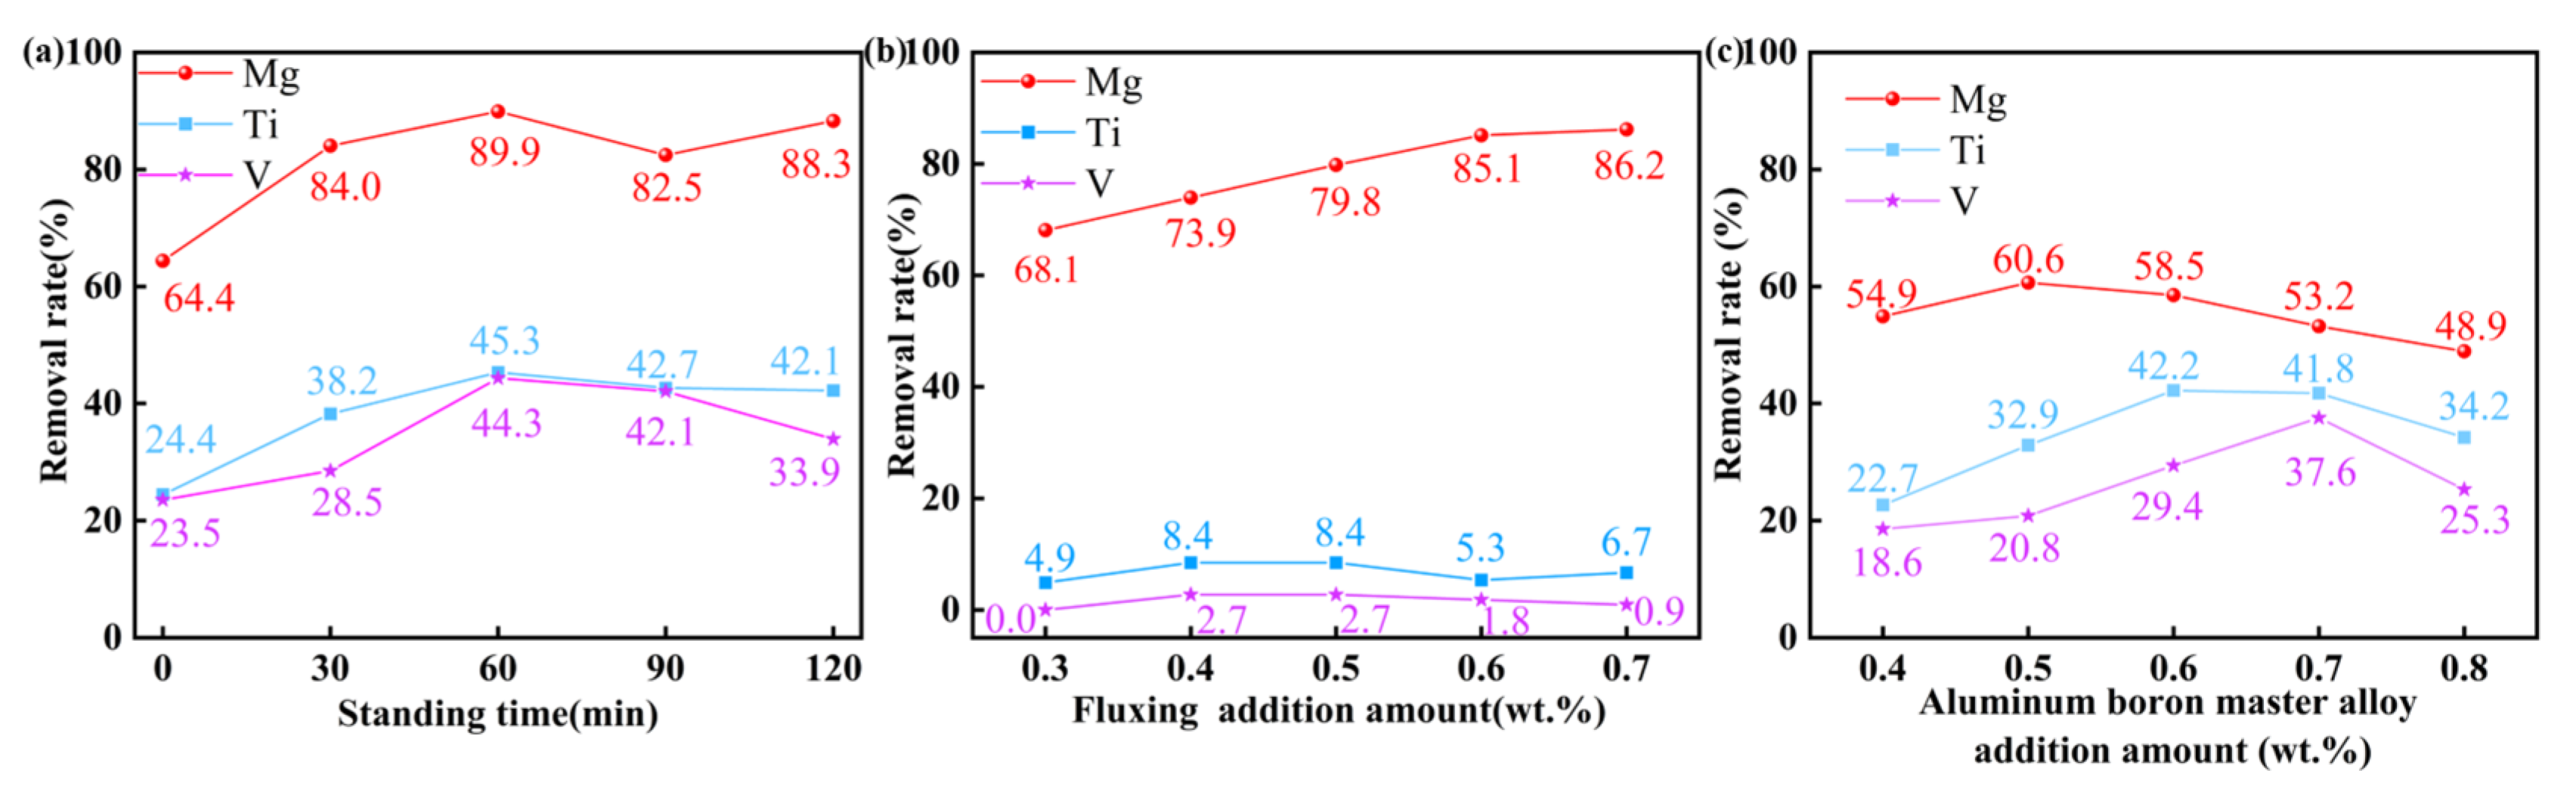
3.1.1. The Effect of Standing Time and a Single Additive

The effect of the standing duration on impurity removal efficiency in secondary Al-Si alloys melts was studied under the following fixed parameters: a refining temperature of 780 °C, refining time of 25 min, the addition of 0.5 wt.% fluxing, and the addition of 0.4 wt.% aluminum–boron master alloy. As shown in Figure 3a, the removal rates of Ti and V initially increased with a prolonged standing time, followed by slight fluctuations. The optimal standing time was found to be 60 min, which simultaneously achieved peak removal efficiencies of Mg, Ti, and V.
The effects of separately added fluxing and aluminum–boron master alloy on the decontamination efficacy of secondary Al-Si alloys’ melt were examined under the following parameters: a refining temperature of 780 °C, refining duration of 25 min, and standing period of 60 min.
Figure 3b shows the dependence of Mg, Ti, and V removal rates on the addition of fluxing. Under the condition of adding fluxing separately, the removal rate of Mg showed a significant positive correlation with the fluxing dosage. The highest removal rate of Mg reached 86.2% when the fluxing addition was 0.7 wt.%. In contrast, the removal rates of Ti and V remained relatively unaffected, indicating that fluxing primarily targets Mg’s removal. Figure 3c illustrates the impact of adding aluminum–boron master alloy alone on the removal of Mg, Ti, and V. The addition of aluminum–boron master alloy alone has a distinct impact on the removal of Mg. This may be attributed to being associated with the oxidation of Mg at elevated temperatures. The maximum removal rate of Ti reached 42.2% at a 0.6 wt.% addition of aluminum–boron master alloy. The maximum removal rate of V reached 37.6% with the addition of 0.7 wt.% aluminum–boron master alloy. Moreover, the removal of Ti is more effective than that of V when the same amount of aluminum–boron master alloy is added.

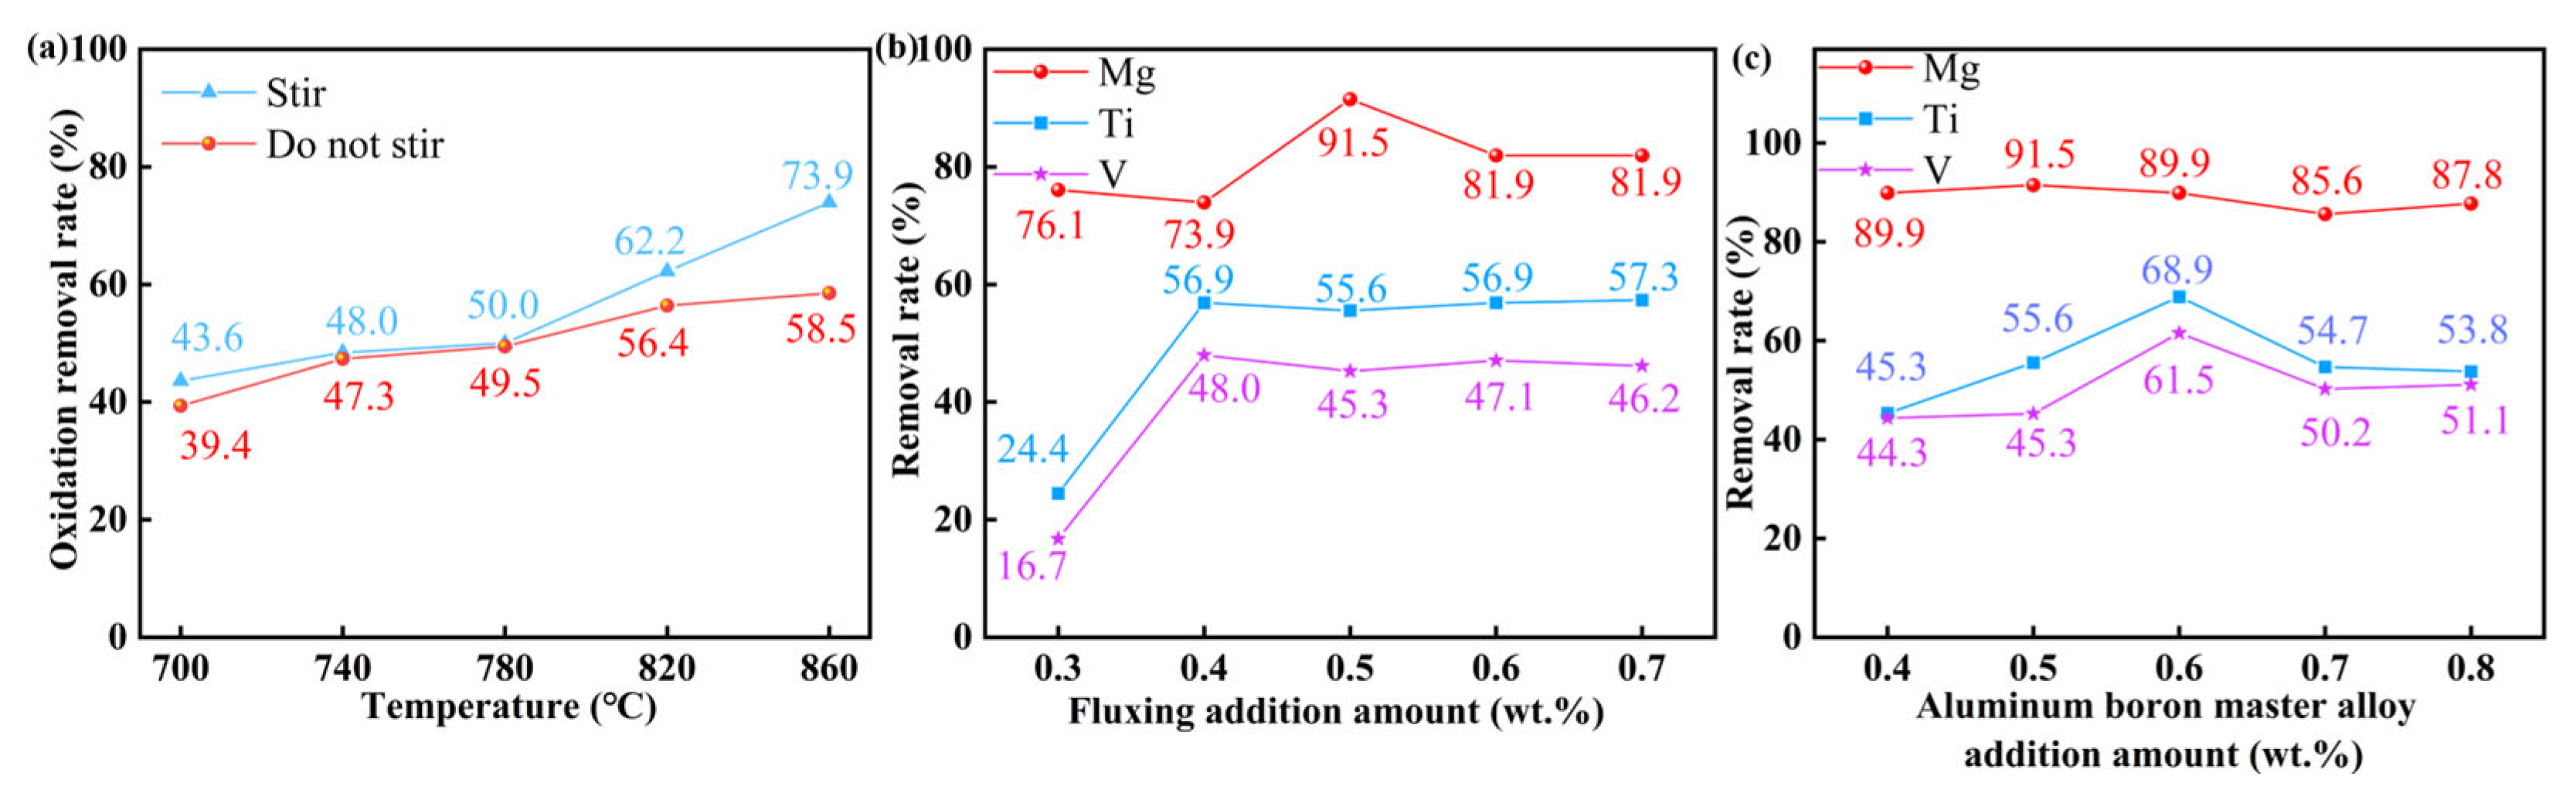
3.1.2. Oxidative Removal of Mg and the Effect of Composite Addition

The oxidative removal mechanism of Mg was specifically investigated in this study due to its persistent elimination, even under the addition of aluminum–boron master alloy. Figure 4a presents temperature-dependent Mg removal behavior under additive-free conditions, revealing a positive correlation between temperature (700–860 °C) and Mg’s oxidation efficiency. Notably, mechanical stirring showed a negligible impact on Mg removal below 780 °C. At a temperature of 780 °C during the stirring operation, the elimination rate of the oxidized impurity element Mg is 50.0%. Consequently, the elimination of the impurity element Mg in this study encompasses its oxidative removal.
The impact of the composite addition of a fluxing and aluminum–boron master alloy on the decontamination efficacy of secondary Al-Si alloys’ melt was examined under the following parameters: a refining temperature of 780 °C, refining duration of 25 min, and standing period of 60 min.
Figure 4b illustrates the impact of the addition of fluxing on the elimination of impurity elements with the incorporation of 0.5 wt.% aluminum–boron master alloy. With the addition of 0.3 wt.% fluxing, Ti was removed at a rate of 24.4%, whereas V was removed at a rate of 16.7%, both under the same conditions of the addition of aluminum–boron master alloy.
The removal rates of Ti and V by the additive increased to 56.9% and 48.0%, respectively, when the fluxing quantity was elevated to 0.4 wt.%. The elimination impact was significantly enhanced. With the addition of 0.5 wt.% of fluxing, the total removal efficiencies for the impurity elements Mg, Ti, and V were 91.5%, 55.6%, and 45.3%, respectively, indicating optimal performance. It was therefore decided to select a fluxing addition of 0.5 wt.%, presuming all other variables (refining temperature of 780 °C, refining duration of 25 min, and standing period of 60 min) remained constant.
Figure 4c illustrates the curve depicting the removal of impurity elements by the aluminum–boron master alloy with the incorporation of 0.5 wt.% fluxing. The removal of the impurity elements Mg, Ti, and V is optimally attained with the addition of aluminum boron master alloy at 0.6 wt.%, resulting in reductions of 89.9%, 68.9%, and 61.5%, respectively, under identical fluxing circumstances. Under other constant conditions, the additional amount of aluminum–boron master alloy is selected as 0.6 wt.%. The chemical composition of the sample obtained under the optimal refining conditions (0.5 wt.% fluxing + 0.6 wt.% aluminum boron master alloy) is shown in Table 2. The analysis revealed that the alloy consists of 96.9 wt.% Al and 1.93 wt.% Si as primary constituents, with trace elements comprising the remaining 1.17 wt.%.
Unlike the absence of fluxing, with the incorporation of 0.5 wt.% post-refinement, the additive exhibited a significantly elevated rate of Ti and V elimination. This indicates that the aluminum–boron master alloy may more efficiently eliminate Ti and V impurities from the secondary Al-Si alloy melt when fluxing is incorporated. The impurity elements Ti and V in the secondary Al-Si alloy melt react with the aluminum–boron master alloy, producing impurity phases that are absorbed by the fluxing, ultimately resulting in the formation of ash and removal. In conclusion, assuming all other variables are constant, the optimal refining conditions were identified as a standing duration of 60 min, 0.5 wt.% fluxing, and 0.6 wt.% aluminum–boron master alloy.

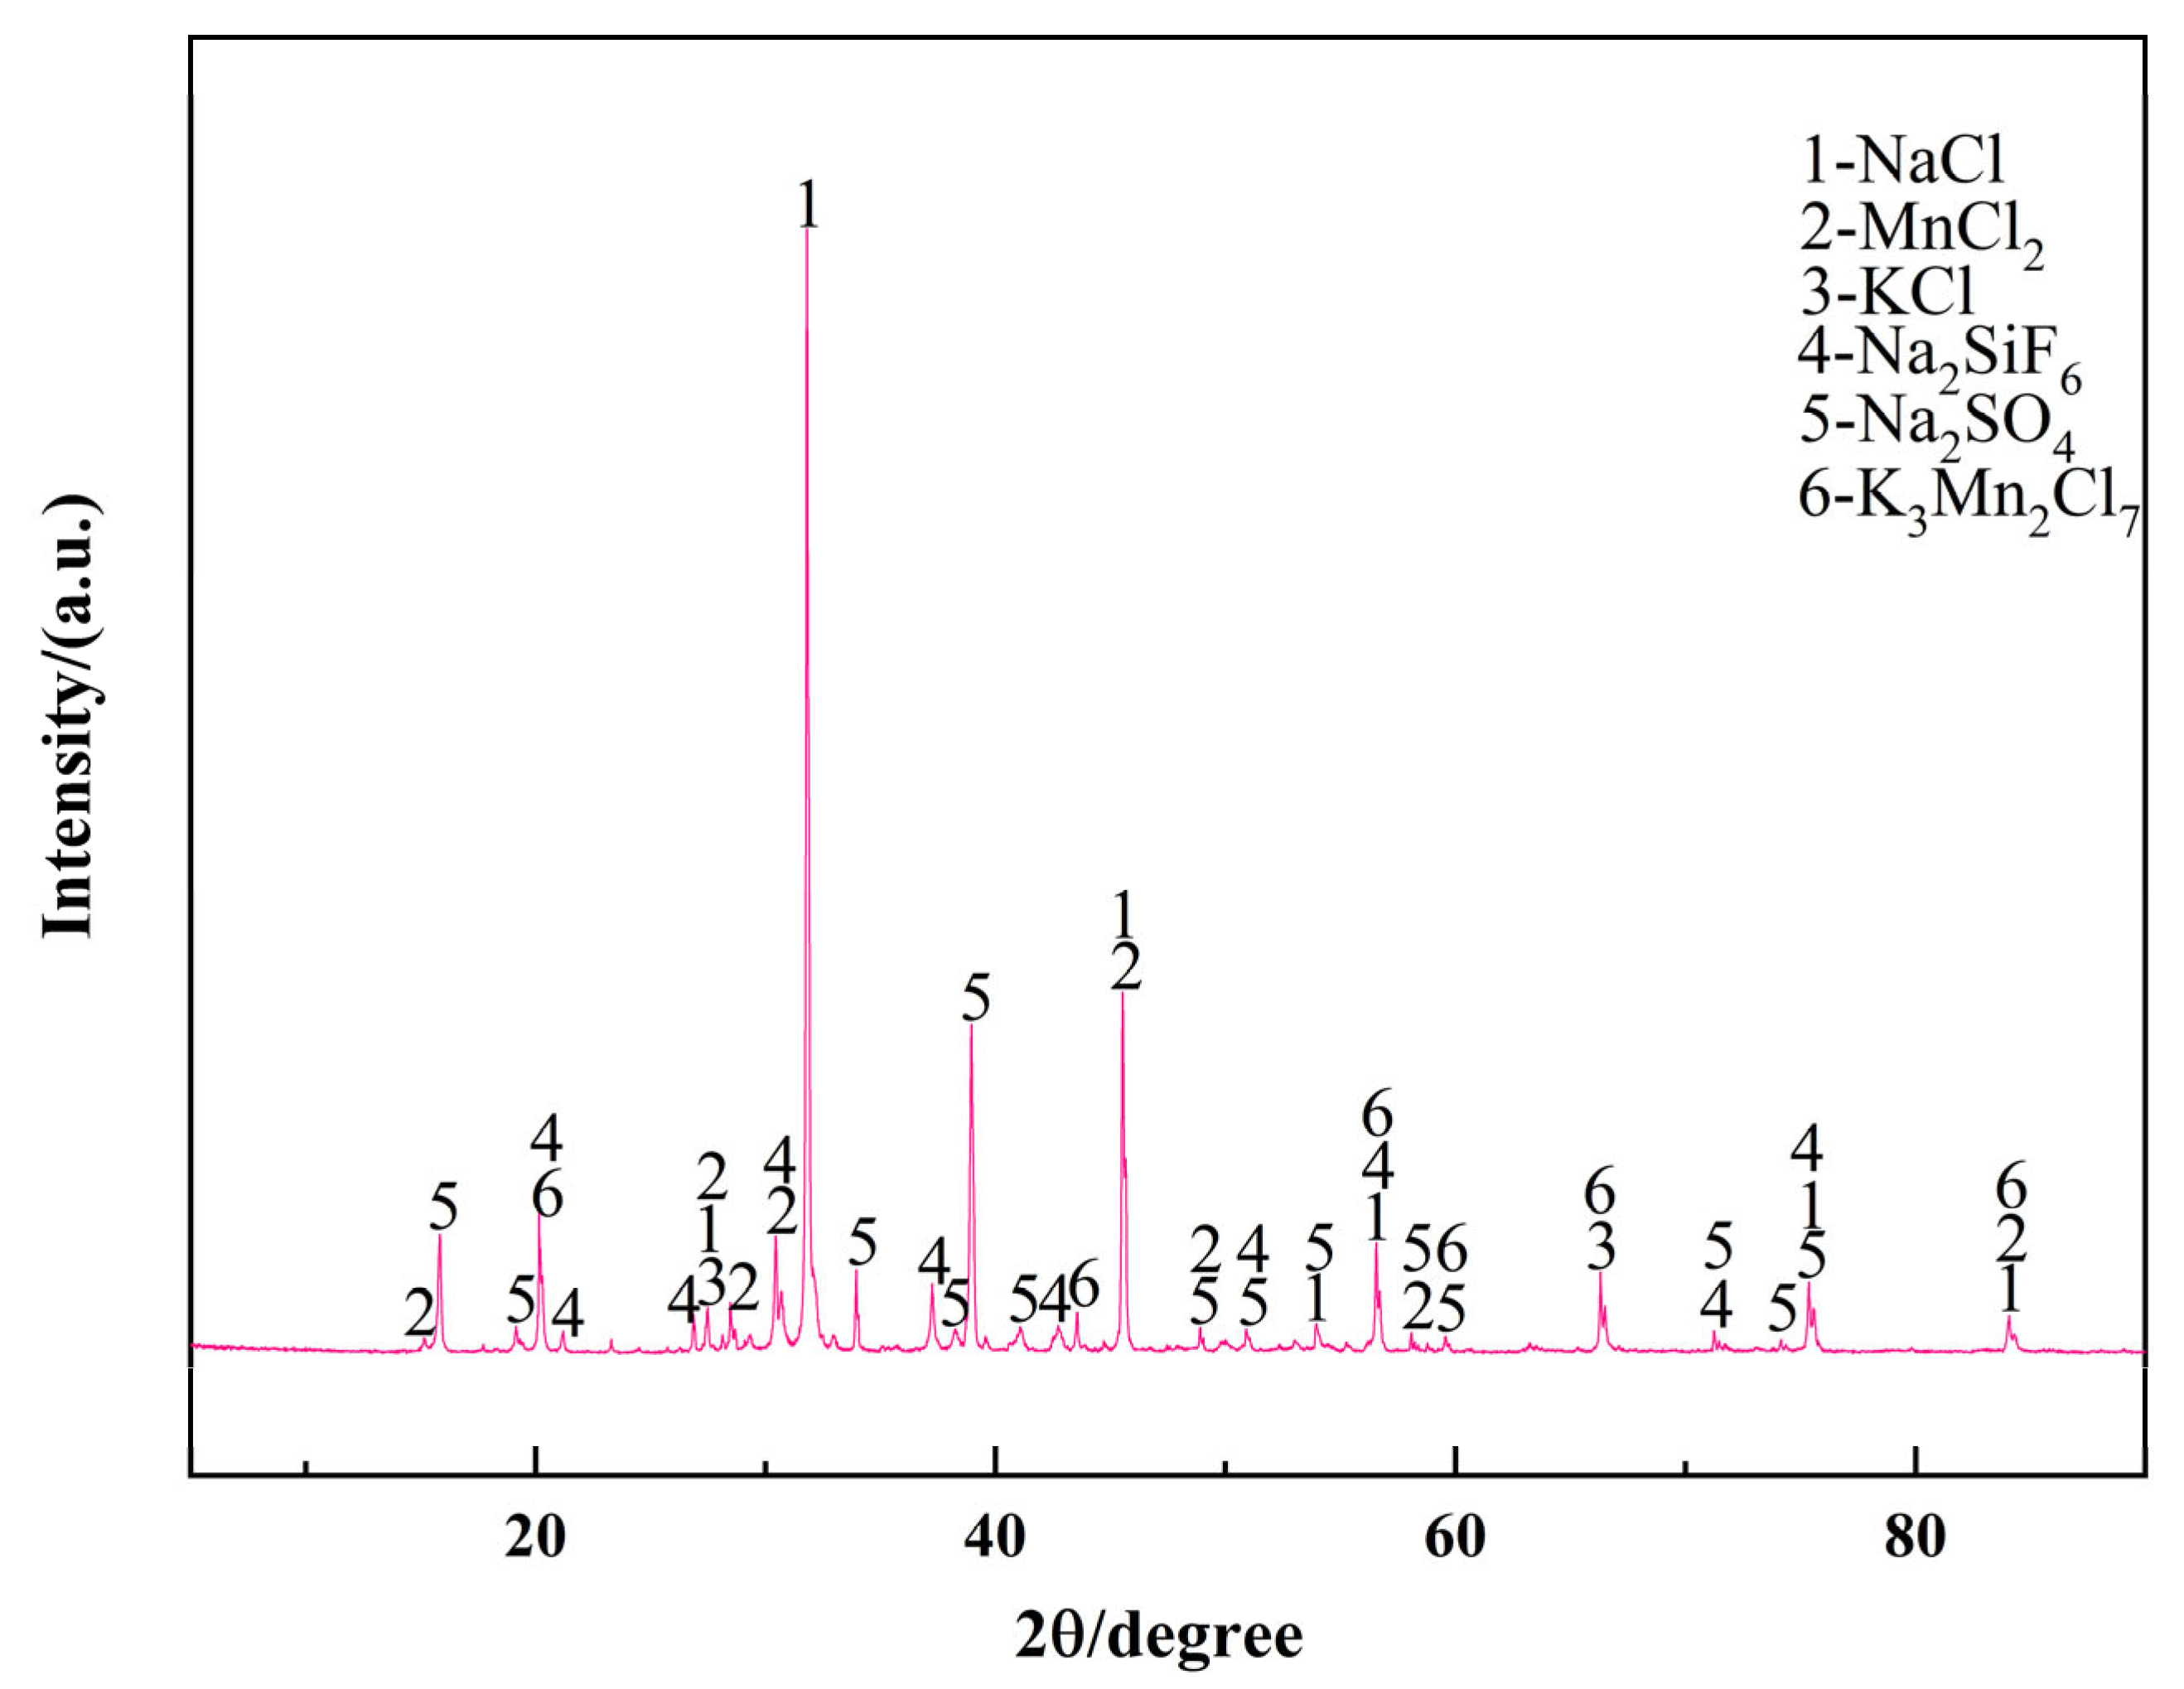
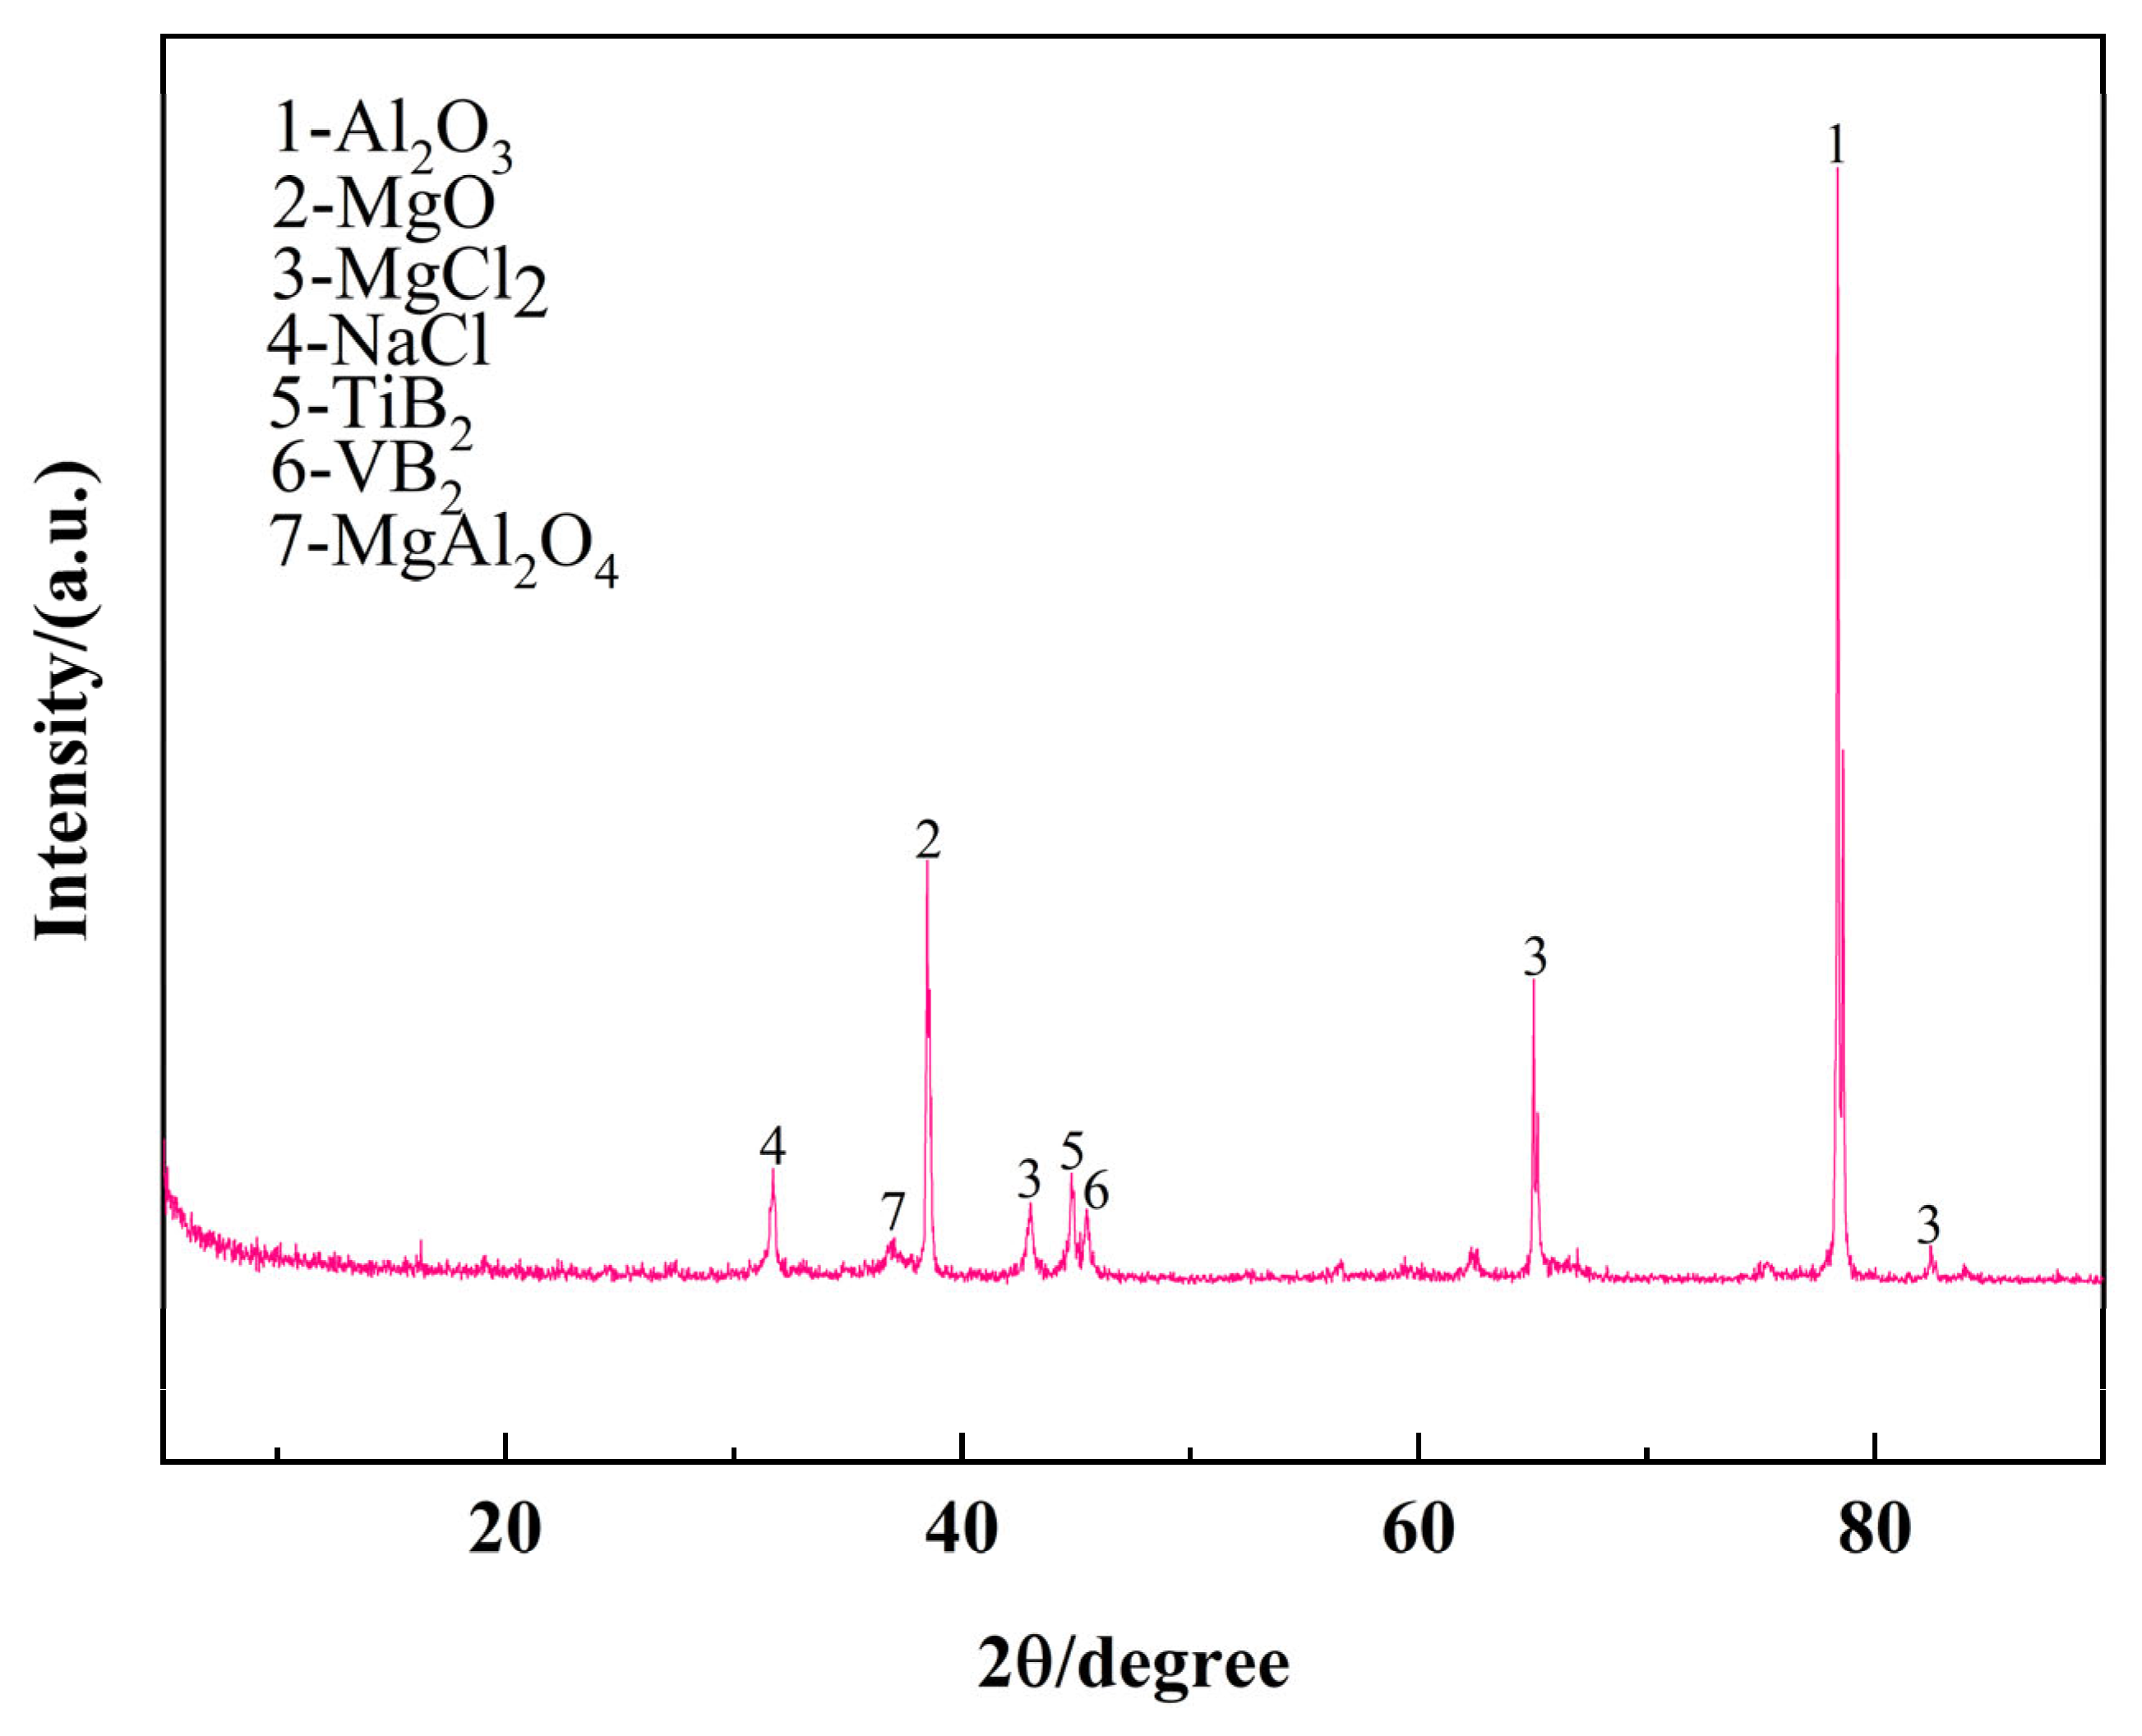
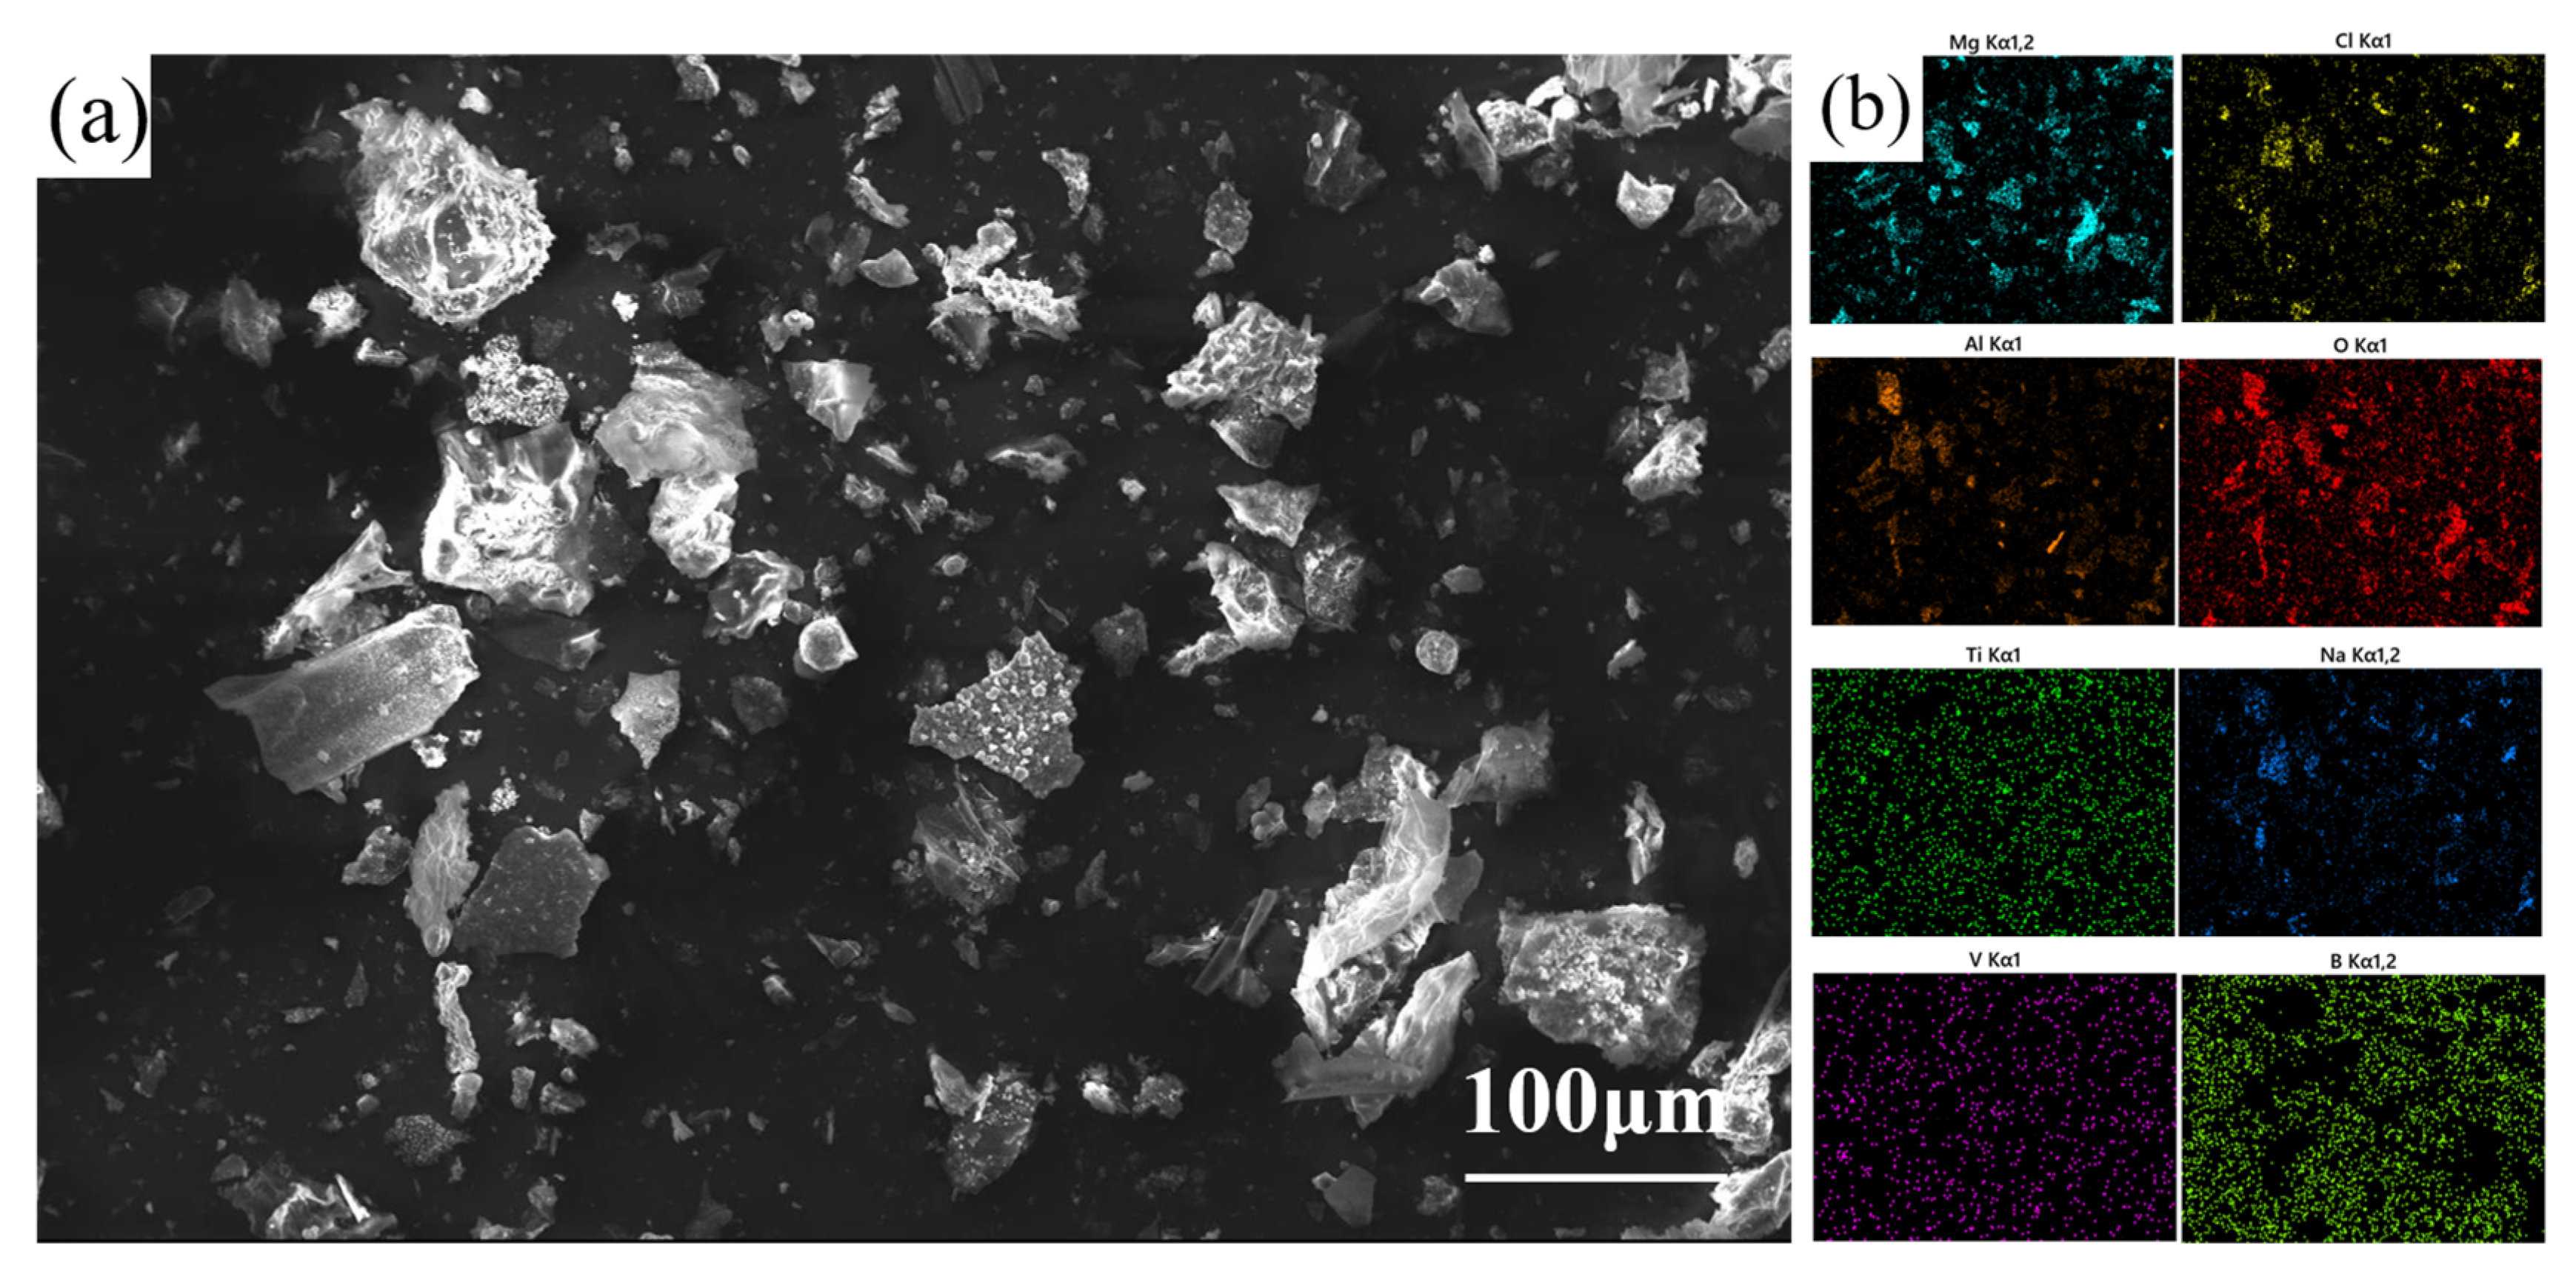
3.2. Analysis of Secondary Al-Si Alloy Slag

The phase composition and elemental distribution of the purification slag were analyzed by XRD and scanning electron microscopy with energy-dispersive spectroscopy (SEM-EDS) under optimal conditions (0.5 wt.% fluxing + 0.6 wt.% aluminum–boron master alloy).
Figure 5 presents the XRD pattern of the secondary Al-Si alloy slag, revealing the presence of highly crystalline Al2O3, MgO, MgCl2, TiB2, and VB2 phases. These crystalline phases indicate that Ti and V impurities reacted with boron from the aluminum–boron master alloy to form stable boride compounds (TiB2, VB2), while Mg was removed primarily through oxidation and chlorination.
Figure 6a shows the SEM micrograph of the slag, showing irregularly shaped agglomerates with a heterogeneous morphology, consistent with efficient slag–metal separation. Figure 6b shows a surface scan analysis of the ash elements. Combined XRD and SEM analyses showed that the impurity elements Mg, Ti, and V were removed mainly in the form of MgO, MgCl2, TiB2, and VB2 into the gray slag after the composite addition of the melt and aluminum–boron master alloy.

3.3. Characterization
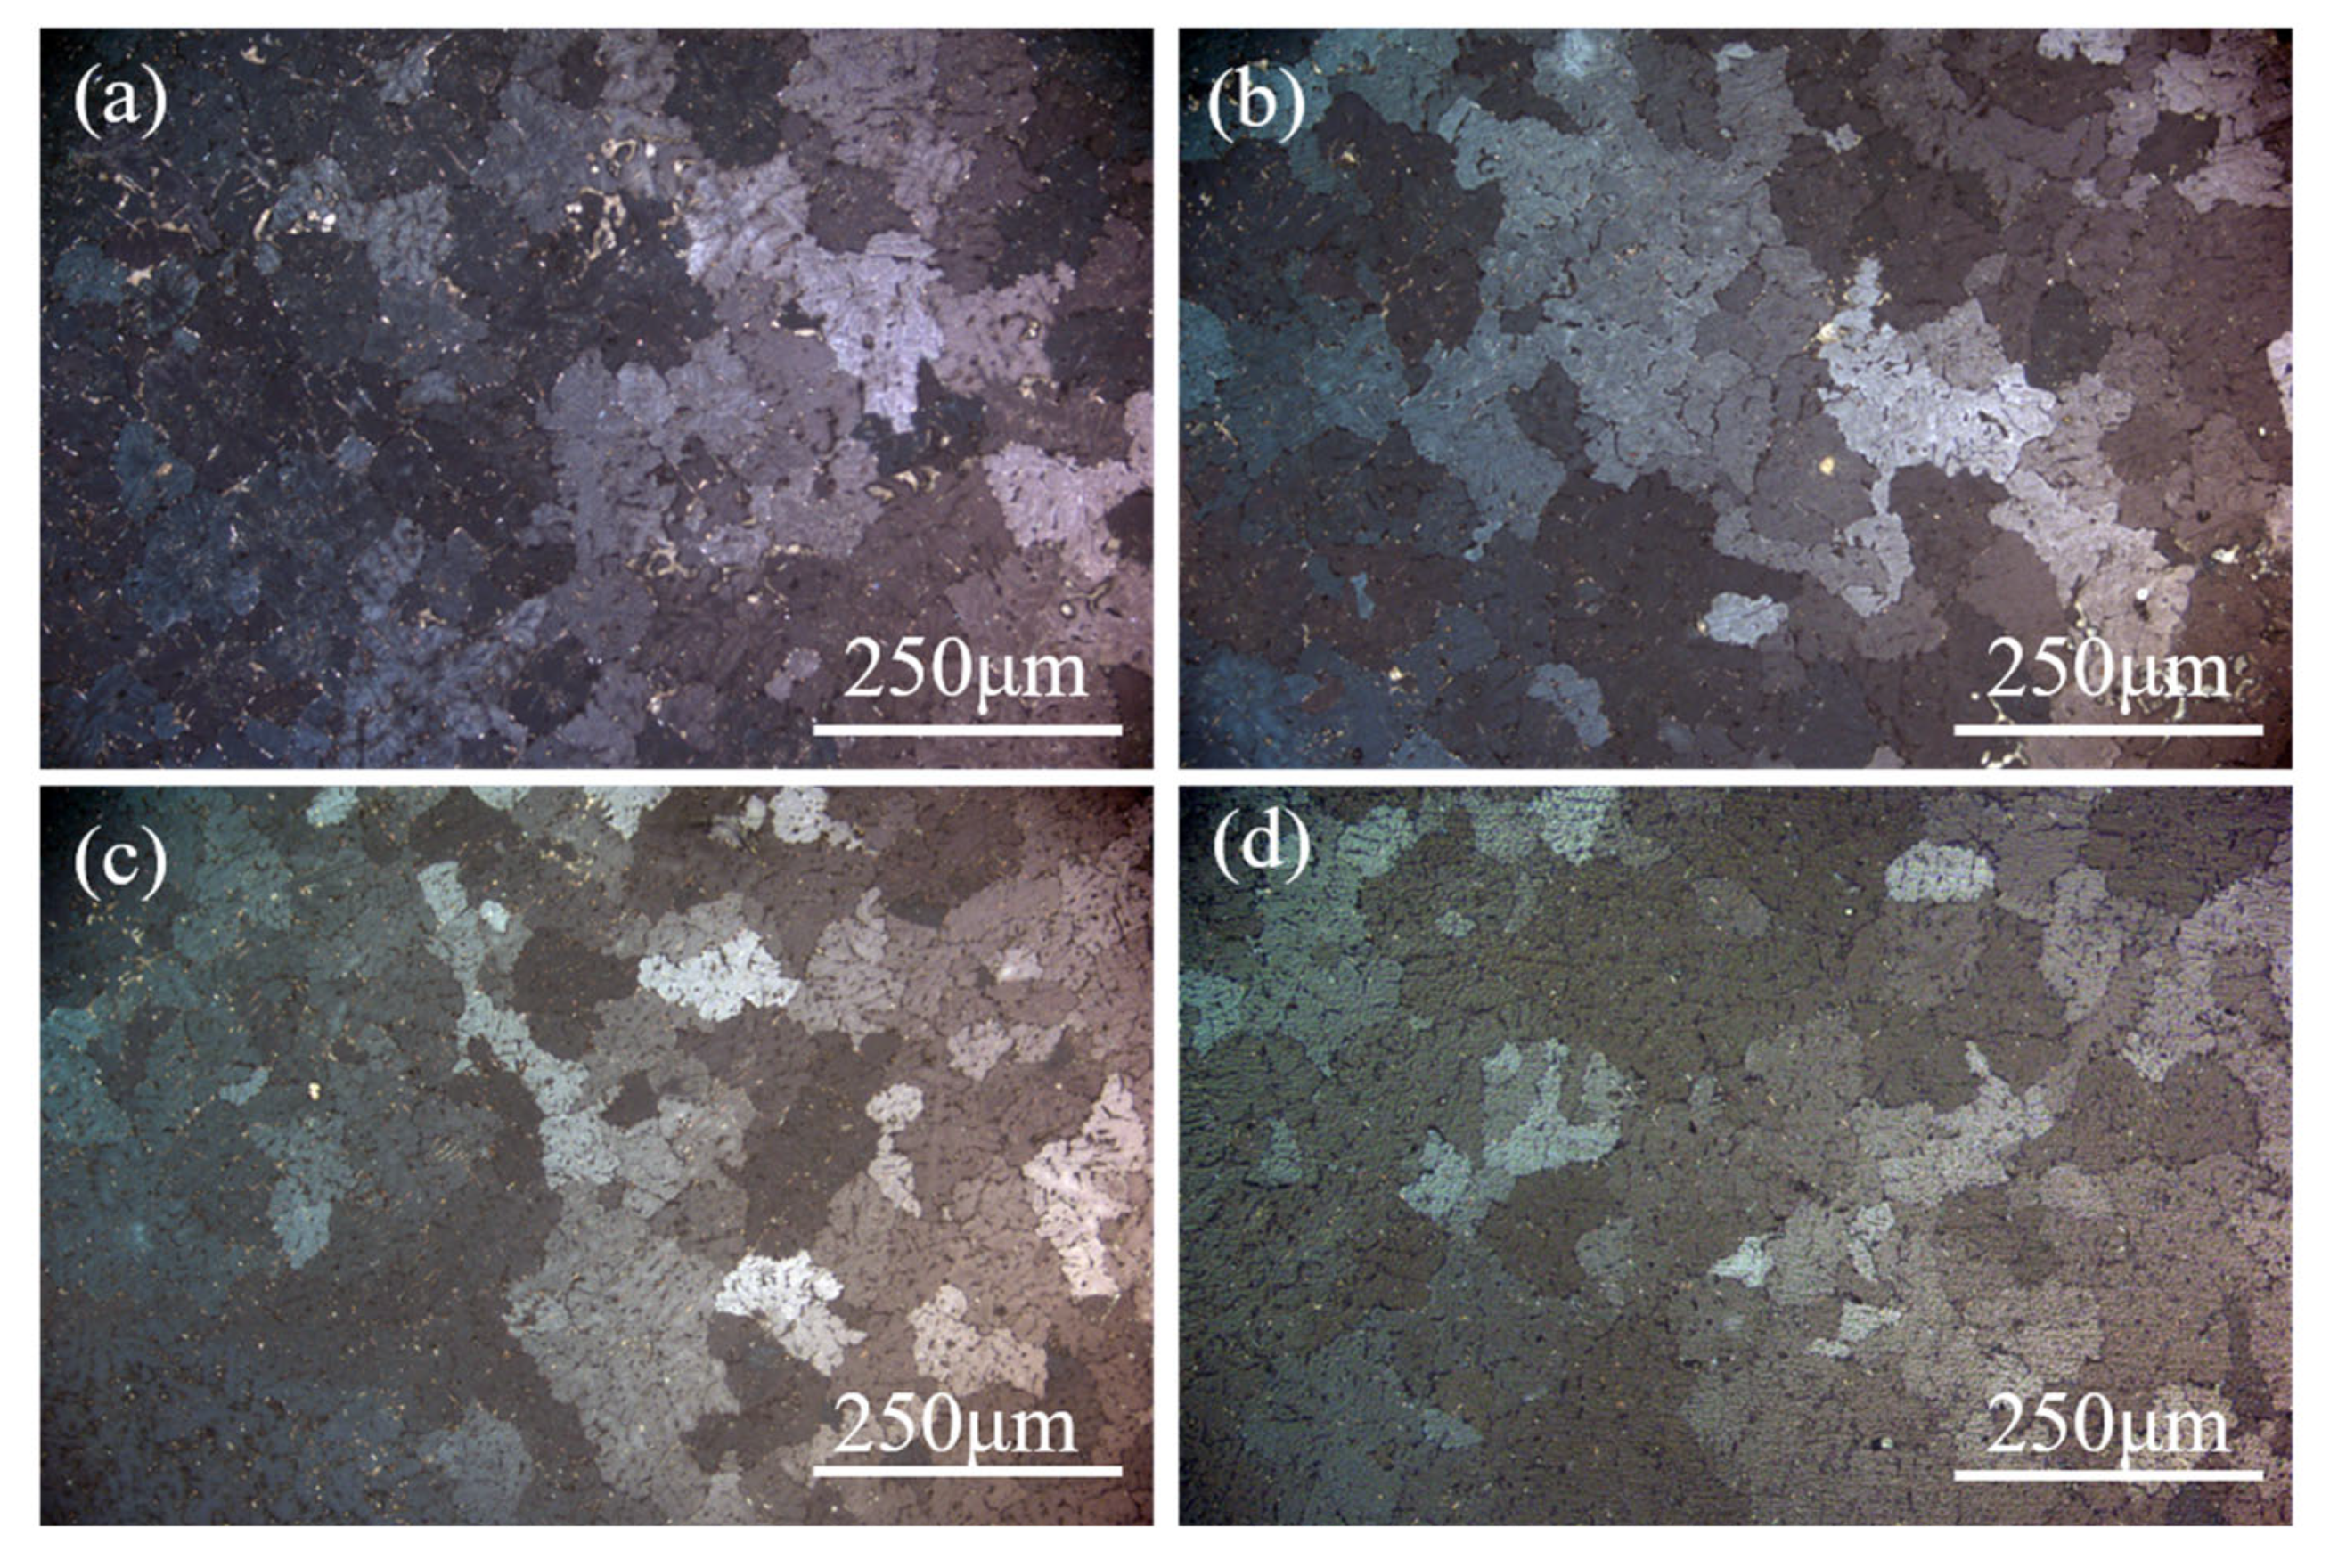
3.3.1. OM Analysis

Grain size distribution in the tested samples was quantified using ImagePro 6.0 software. Figure 7 summarizes the microstructural characteristics under different purifications. Figure 7a reveals coarse and irregular grain boundaries in the as-received secondary Al-Si alloys, with an average grain size of 513.2 μm. Porosity (bright regions) was observed, indicating inherent material inhomogeneity. Figure 7b illustrates that the tissue defects of the test materials were improved, with an average grain size of 483.3 μm following the incorporation of 0.5 wt.% fluxing alone. Figure 7c shows the test sample with the addition of aluminum–boron master alloy alone, which has an average grain size of 345.9 μm. Figure 7d illustrates that the average grain size of the test sample was 279.9 μm following the incorporation of 0.5 wt.% fluxing and 0.6 wt.% aluminum–boron master alloy. The samples demonstrated a 45.5% grain size reduction and significant grain boundary refinement. This indicates that the matrix is purified by a precise amount of fluxing and aluminum–boron master alloy. Grain boundaries become finer as a result of less impurity aggregation at them [27,28,29,30]. Furthermore, the incorporation of aluminum–boron master alloy can function as an inoculation, resulting in finer alloy grains and impeding grain growth, thereby purifying the grains [31,32,33].

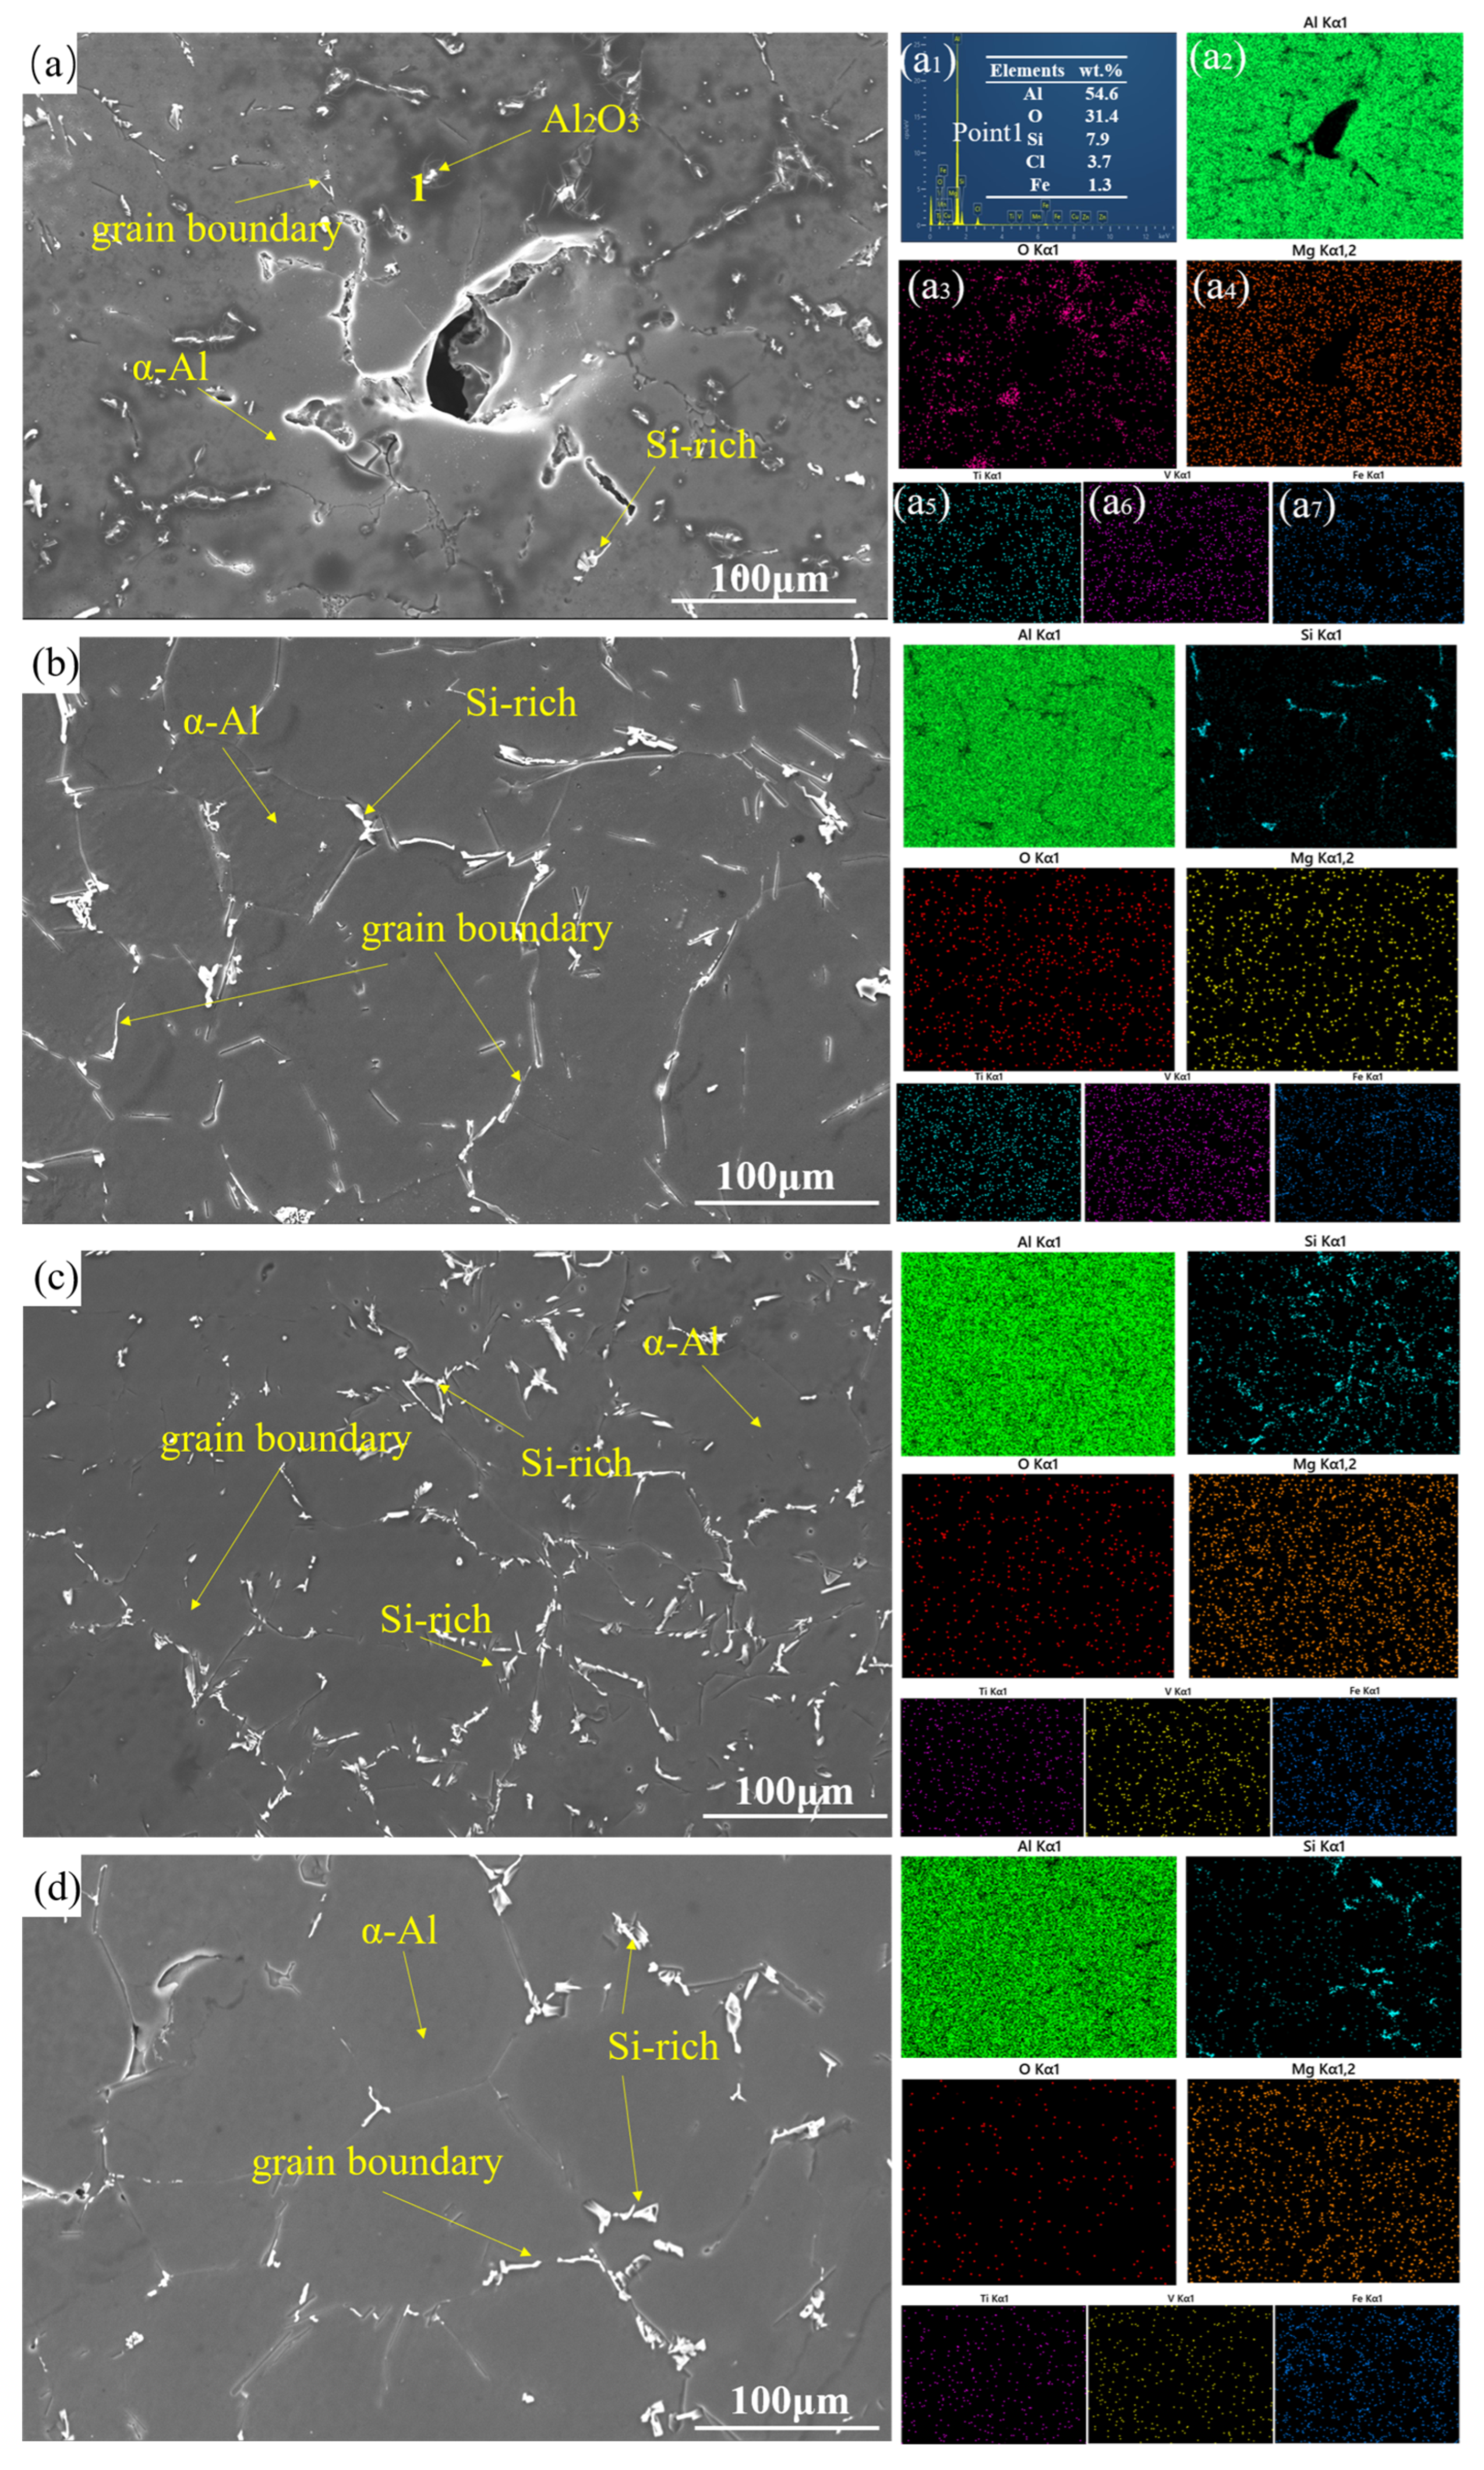
3.3.2. SEM-EDS Analysis

Figure 8 shows an SEM micrograph of a secondary Al-Si alloy composed of α-Al dendrites and rich-silicon phases. Figure 8a presents the SEM micrograph of the raw secondary Al-Si alloys, revealing surface contamination and structural defects. The corresponding elemental maps (Figure 8(a2,a7)) demonstrate heterogeneous distributions of Mg, Ti, and V impurities, consistent with the observed microstructural inhomogeneity. Energy-dispersive spectroscopy analysis at Point 1 (Figure 8(a1)) identified a non-metallic inclusion dominated by Al and O with an atomic ratio of 3:2 (O:Al), confirming the presence of an Al2O3 cluster. Figure 8b shows reduced porosity compared to the raw material, attributable to the formation of MgO/MgCl2 slag. Figure 8c shows finer grain boundaries, indicating boron-induced grain refinement. Figure 8d presents the SEM analysis of the test samples incorporating the composite. The combination of fluxing and the aluminum–boron master alloy effectively eliminates non-metallic inclusions in secondary Al-Si alloys, while also affecting the impurity elements.

3.3.3. Mechanical Performance

Figure 9a,b presents the stress–strain curves and tensile properties of the tested specimens (60 min standing time), respectively. The raw material exhibited a tensile strength of 109.1 MPa, a yield strength of 71.8 MPa, and an elongation at break of 6.7%. With the addition of 0.5 wt.% fluxing, the tensile strength increased to 123.8 MPa (13.5% improvement), the yield strength rose to 79.7 MPa (11.0% improvement), and the elongation at break reached 7.8%, indicating a moderate enhancement in ductility and strength. In contrast, the addition of 0.6 wt.% aluminum–boron master alloy resulted in a tensile strength of 135.3 MPa (24.0% improvement), yield strength of 84.5 MPa (17.7% improvement), and elongation at break of 10.2%, highlighting the role of boron-mediated grain refinement in improving both strength and ductility. The synergistic combination of 0.5 wt.% fluxing and 0.6 wt.% aluminum–boron master alloy achieved an optimal mechanical performance: the tensile strength peaked at 140.4 MPa (28.7% increase vs. raw material), the yield strength was 87.5 MPa (21.9% increase), and the elongation at break reached 10.6%. These improvements are attributed to microstructural refinement and inclusion removal.

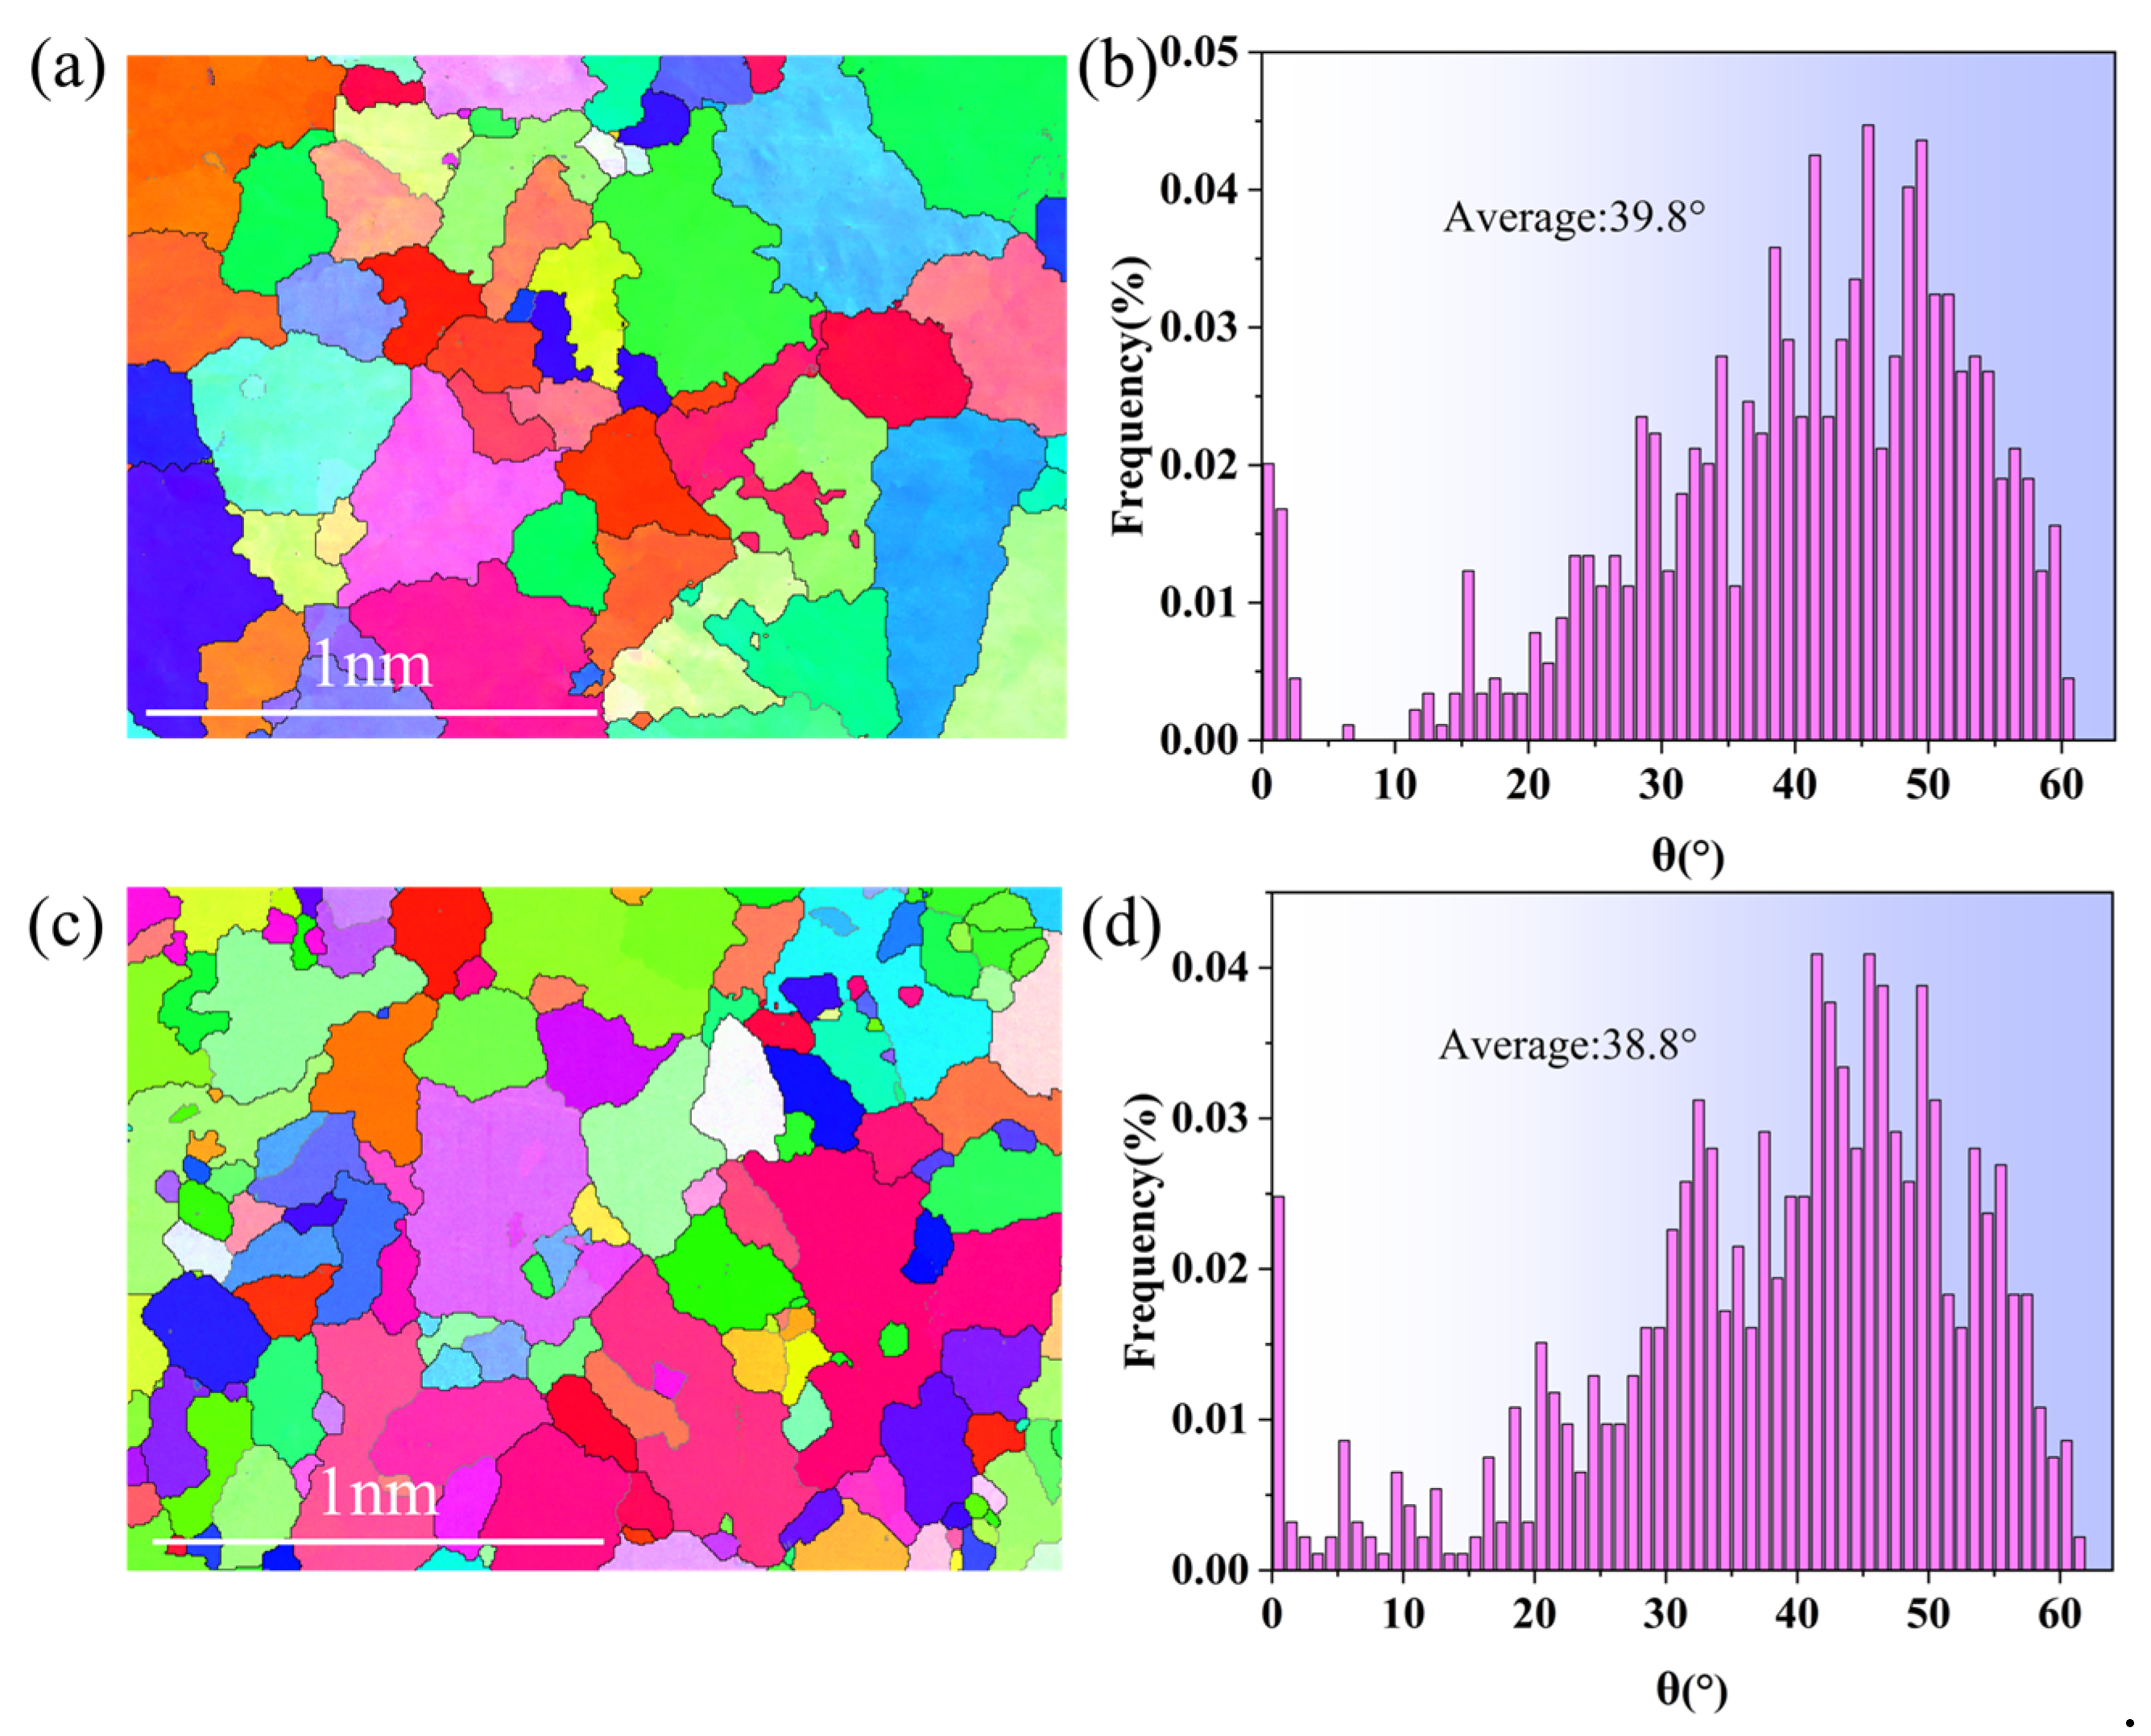
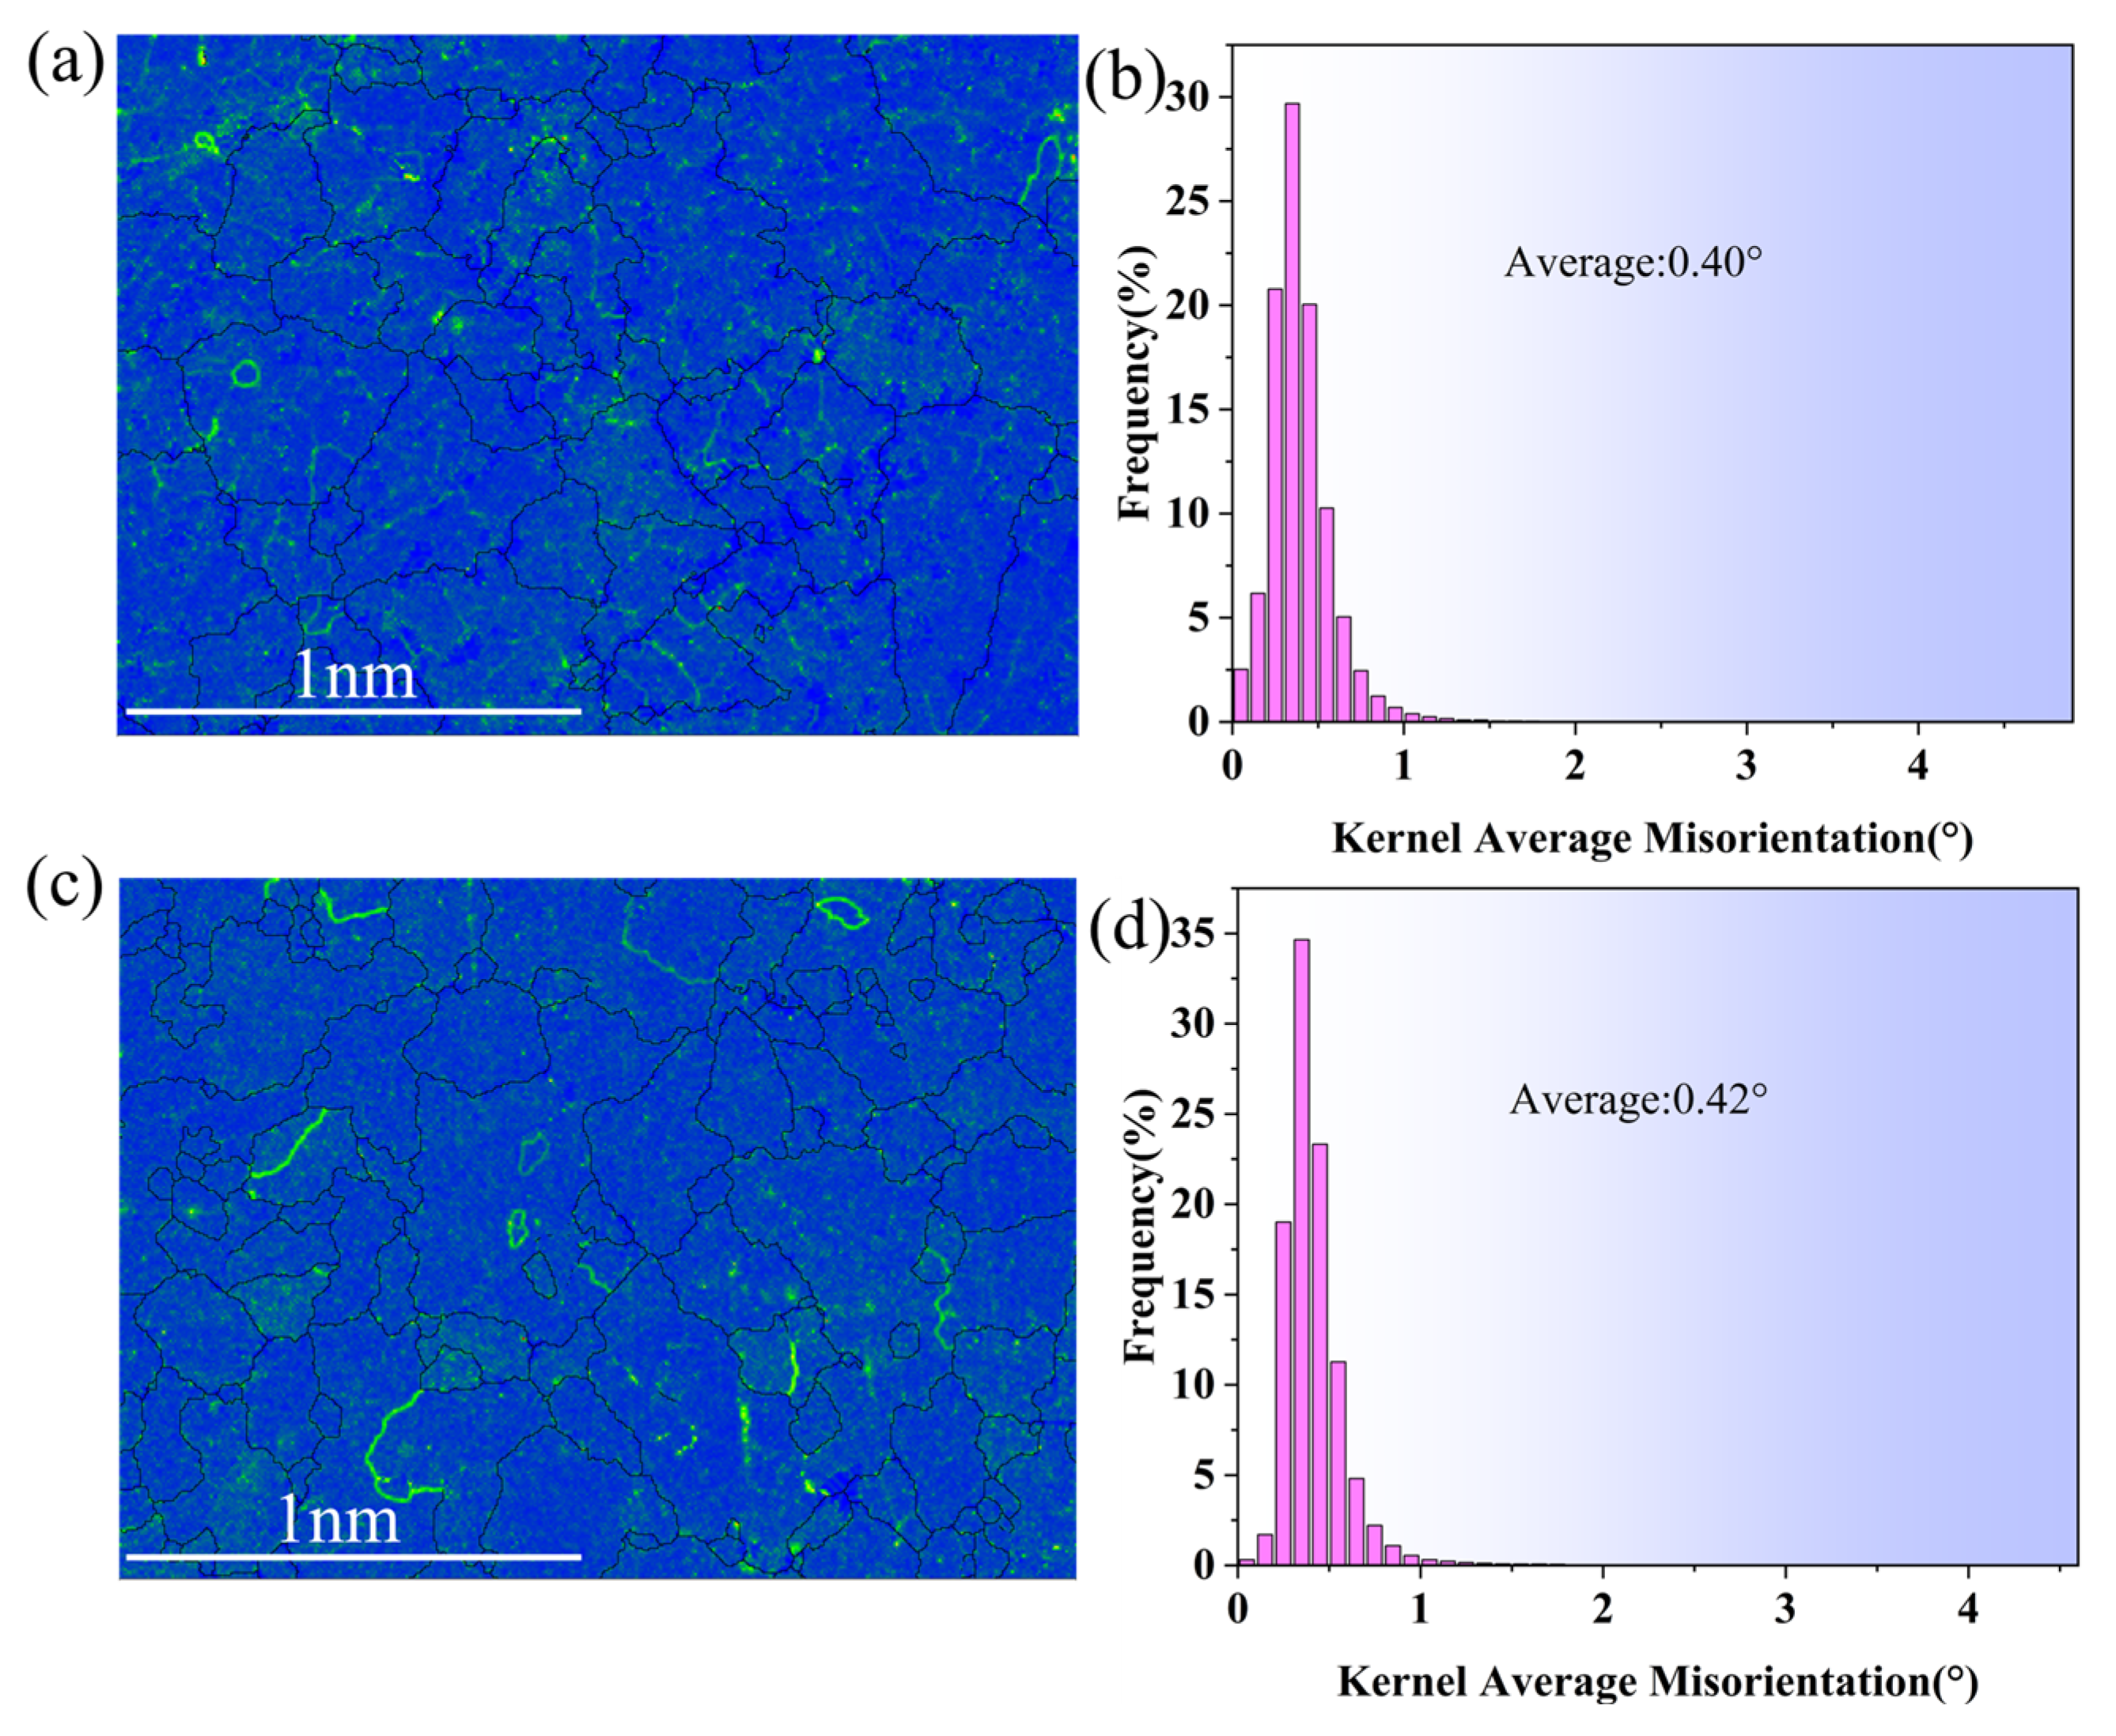
3.3.4. EBSD Analysis

The arrangement of grain orientation substantially influences a material’s mechanical properties. The material’s strength and fluidity are improved by an optimal distribution of grain orientations, which promotes stress transfer and the movement of grain boundaries. Figure 10a,b show the Inverse Pole Figure (IPF) map and the average grain orientation difference plots of the raw materials. Figure 10c,d illustrate the IPF and average grain orientation difference plots of the alloy samples with composite additions. In the IPF diagram, grains with varying orientations are identified by their corresponding colors. Gray lines denote small-angle grain boundaries (0° < θ < 15°), whereas black lines signify large-angle grain boundaries (θ > 15°). According to the EBSD data, the average grain orientation difference and the fraction of small-angle grain boundaries in the feedstock are 39.8° and 9.4%, respectively. The composite samples exhibited an average grain orientation variation of 38.8° and a minor-angle grain boundary proportion of 21.7%. The fraction of small-angle grain boundaries increases (130.9% improvement), but the average grain orientation difference decreases relative to the raw material. A reduced average grain orientation difference in the metal material results in a more uniform structure, which enhances the material’s mechanical properties. The distribution of the alloy’s grain orientation and the proportion of small-angle grain boundaries can be regulated through the composite addition of fluxing and aluminum–boron master alloy, hence influencing the alloy’s structural characteristics.
Larger Kernel Average Misorientation (KAM) values suggest a greater density of dislocations in the grain’s substructure, indicating the magnitude of strain stored energy inside the material. Figure 11 illustrates the KAM plots of the composite additive alloy and the raw material samples. The composite additive alloy samples exhibited an average KAM value of 0.42°, whereas the raw material samples demonstrated an average of 0.40°. The composite addition elevated the alloy’s average KAM value, hence enhancing the strain storage energy. The geometrically necessary dislocation (GND) density of a material correlates with the local orientation discrepancy [34]. A higher geometrically necessary dislocation density in the material correlates with increased strength. The geometrically necessary dislocation density of the raw material is 1.4 × 10¹⁴ m−2, while that of the test alloy samples increases to 1.5 × 10¹⁴ m−2, indicating a significant enhancement following the incorporation of 0.5 wt.% fluxing and 0.6 wt.% aluminum–boron master alloy in the composite. EBSD results indicate that the incorporation of 0.5 wt.% fluxing and 0.6 wt.% aluminum–boron master alloy significantly enhances the mechanical properties of the experimental alloy.

3.3.5. Fracture Analysis

Figure 12 illustrates the tension fracture morphology of the samples. Figure 12a illustrates that the fracture of the raw material sample is predominantly deconvoluted, featuring a limited number of shallow, small tough nests and smooth shrinkage defects resembling grapes. Shrinkage defects impair the overall mechanical properties of the alloy material. The fracture morphology of the samples after the addition of 0.5 wt.% fluxing and 0.6 wt.% aluminum–boron master alloy is seen in Figure 12b,c. Compared to the raw material, both sample groups exhibited significantly reduced shrinkage defects, characterized by tough nests and localized tear ridges. Figure 12d illustrates the tensile fracture morphology of the alloy samples with composite additions. Based on a certain degree of metamorphic refinement in its alloy organization, the fracture exhibits numerous tough nests, an increased tearing prism, and significantly enhanced plasticity, categorizing it as a ductile–brittle fracture.
The fractographic analysis revealed that the synergistic incorporation of 0.5 wt.% fluxing and aluminum–boron master alloy resulted in the optimal enhancement of the tensile properties of the recycled aluminum alloy. This combined modification strategy demonstrated a statistically significant improvement in the both ultimate tensile strength and elongation percentage compared to the raw material, as evidenced by quantitative mechanical testing and the microscopic characterization of fracture surface morphologies.

3.4. Exploration of Refining Principles

Thermodynamic simulations were performed using FactSage8.0 software with an integrated aluminum alloy database. At a refining temperature of 780 °C, the Gibbs free energy change (ΔG) for Mg oxidation (Reaction 1) was calculated to be negative, confirming the spontaneity of Mg’s removal via oxidation. The MnCl2 component in the fluxing reacted spontaneously with the secondary Al-Si alloy melt, generating MgCl2 and AlCl3 (Reactions 2–3), both exhibiting negative ΔG values. During the addition of fluxing, Mg in the melt combined with Cl to form MgCl2 and volatile AlCl3 (boiling point: 183 °C). The low-density MgCl2 was efficiently scavenged by either fluxing slag or adsorption onto rising AlCl3 bubbles, accounting for the observed 89.9% Mg removal efficiency.
The elimination of the impurity elements Ti and V involves two primary procedures. The aluminum–boron master alloy will rapidly dissolve upon the addition of high-temperature aluminum liquid. In the secondary Al-Si alloy melt, the element B interacts with the impurity elements Ti and V. Certain impurity elements, specifically Ti and V, will be removed as TiB2 and VB2 during refining operations like stirring and slagging. The residual impurity phases TiB2 and VB2 are eliminated during the precipitation process from the secondary Al-Si alloys solution. Both reactions proceed spontaneously with a negative change in Gibbs free energy (Reactions (4) and (5)).
2Mg(s) + O2(g) = 2MgO(s) ΔG780 °C = −873,331.3 J
MnCl2(s) + Mg(s) = Mn(s) + MgCl2(s) ΔG780 °C = −121,607.3 J
3MnCl2(s) + 2Al(l) = 3Mn(s) + 2AlCl3(g) ΔG780 °C = −176,200.0 J
Ti(s) + 2B(s) = TiB2(s) ΔG780 °C = −321,583.7 J
V(s) + 2B(s) = VB2(s) ΔG780 °C = −249,651.5 J
A thermodynamic phase diagram was generated using FactSage8.0 software with an integrated aluminum alloy database. This study focuses on the secondary Al-Si alloy raw material, specifically aluminum liquid (Al-2Si-0.736Fe-0.0225Ti-0.0221V). Figure 13 illustrates the equilibrium phase diagram for the addition of B below 0.024 wt.%. The TiB2 phase commences precipitation in the melt at temperatures below 1022 °C. The cooling procedure facilitates the precipitation of TiB2, VB2, and other stages. The TiB2 phase preferentially precipitates in the melt, while the VB2 phase begins to precipitate at temperatures below 797 °C. An increased temperature correlates with the enhanced solubility of B in the melt. Furthermore, it can be shown that during the standing process of secondary Al-Si alloys’ melting, the impurity elements Ti and V are removed by settling in phases such as TiB2 with VB2 [35].

4. Conclusions

The present study puts forth an eco-efficient purification strategy for secondary Al-Si alloys through the synergistic application of 0.5 wt.% fluxing and 0.6 wt.% aluminum–boron master alloy, achieving a simultaneous impurity removal and enhancement of mechanical properties under industrially viable conditions. On the basis of the results of the experimental investigation and the discussions made in the earlier sections, the following conclusions can be drawn:
(1)
The composite additive achieved removal efficiencies of 89.9% Mg, 68.9% Ti, and 61.5% V. The effect of aluminum–boron master alloy on the elimination of impurity elements Ti and V can be improved by the use of fluxing. Grain refinement and organization flaws can be improved by adding aluminum boron master alloy and fluxing;
(2)
The amalgamation of fluxing and aluminum–boron master alloy can modify the grain orientation distribution of secondary Al-Si alloys and augment their geometrical dislocation density, thus improving their mechanical properties;
(3)
The tensile properties were considerably enhanced by the use of 0.6 wt.% aluminum–boron master alloy and 0.5 wt.% fluxing. The yield strength was 87.5 MPa, the elongation at break was 10.6%, and the tensile strength was 140.4 MPa, which was 28.7% greater than the raw material.

Author Contributions

X.W. and J.J., Conceptualization; W.G. and H.J., Methodology; W.G. and H.J., Validation; W.G. and H.J., Formal analysis; X.W. and J.J., Investigation; H.J., Resources; W.G. and H.J., Writing—original draft; W.G. and H.J., Writing—review and editing; W.G. and H.J., Visualization; X.W. and J.J., Supervision; H.J., Funding acquisition. All authors have read and agreed to the published version of the manuscript.

Funding

This study was funded by the Science and Technology Program of Guizhou Province ([2024]123).

Data Availability Statement

The raw data supporting the conclusions of this article will be made available by the authors on request.

Acknowledgments

We are grateful to Guizhou University for providing the characterization technique.

Conflicts of Interest

The authors declare that they have no conflicts of interest.

Abbreviations

The following abbreviations are used in this manuscript:
MgMagnesium
TiTitanium
VVanadium
IPFInverse Pole Figure
KAMKernel Average Misorientation
GNDGeometrically Necessary Dislocation

References

  1. Hu, K.; Chen, W.; Geng, J.G. Effect of pulsed electric field on the microstructure and mechanical properties of a recycled ADC 12 aluminum alloy. Proc. Inst. Mech. Eng. Part L J. Mater. Des. Appl. 2024, 238, 430–445. [Google Scholar] [CrossRef]
  2. Xiang, K.; Qin, L.; Zhao, Y.; Huang, S.; Du, W.; Boller, E.; Rack, A.; Li, M.; Mi, J. Operando study of the dynamic evolution of multiple Fe-rich intermetallics of an Al recycled alloy in solidification by synchrotron X-ray and machine learning. Acta Mater. 2024, 279, 120267. [Google Scholar] [CrossRef]
  3. Guo, B.; Wang, Y.; Huang, Y.; Peng, J.; Di, Y.; Wang, C.; Wang, K. Upcycling of scrap aluminum to pure aluminum through molten salt electrolysis. Process Saf. Environ. 2024, 191, 94–101. [Google Scholar] [CrossRef]
  4. Al-Alimi, S.; Yusuf, N.K.; Ghaleb, A.M.; Lajis, M.A.; Shamsudin, S.; Zhou, W.; Altharan, Y.M.; Abdulwahab, H.S.; Saif, Y.; Didane, D.H.; et al. Recycling aluminium for sustainable development: A review of different processing technologies in green manufacturing. Results Eng. 2024, 23, 102566. [Google Scholar] [CrossRef]
  5. Zhou, B.; Liu, B.; Zhang, S.; Lin, R.; Jiang, Y.; Lan, X. Microstructure evolution of recycled 7075 aluminum alloy and its mechanical and corrosion properties. J. Alloys Compd. 2021, 879, 160407. [Google Scholar] [CrossRef]
  6. Mantelli, A.; Arcaleni, R.; Girelli, L.; Tonelli, L.; Montesano, L.; Pola, A. Preliminary Investigation on the Use of Recycled A356 Alloy for Semi-Solid Processing. SSP 2023, 347, 83–89. [Google Scholar] [CrossRef]
  7. Du, S.; Zhang, S.; Wang, J.; Wang, M.; Lv, Z.; Xu, Z.; Ma, L.; Liu, C.; Wang, J.; Liu, J.; et al. Sustainable recycling of aluminum scraps to recycled aerospace-grade 7075 aluminum alloy sheets. Sustain. Mater. Techno 2024, 41, e01100. [Google Scholar] [CrossRef]
  8. Sarkar, A.; Aktunali, M.; Marthe Arbo, S.; Holmestad, J.; Mario Viespoli, L.; Nyhus, B.; Ringen, G.; Razavi, N. A study on the influence of impurity content on fatigue endurance in a 6082 Al-alloy. Int. J. Fatigue 2024, 186, 108406. [Google Scholar] [CrossRef]
  9. Srinath, P.; Bhagyanathan, C. Effective reduction of iron impurities in recycled aluminium-silicon alloy type LM-6 through sedimentation and filtration with synthesized Mn, Cr and Zr transition metal powders. Mater. Res. Express 2024, 11, 106508. [Google Scholar] [CrossRef]
  10. Huang, Y.; Gao, X.; Liu, Y.; Sheng, Z.; Fan, X. A qualitative and quantitative investigation of nonmetallic inclusions in molten Al–Mg, Al–Cu, and Al–Zn–Mg–Cu alloys. J. Mater. Res. Technol. 2024, 28, 87–96. [Google Scholar] [CrossRef]
  11. Du, S.; Zhang, S.; Wang, M.; Wang, J.; Lv, Z.; Xu, Z.; Liu, C.; Wang, J.; Liu, J.; Liu, B. High-temperature heat treatment attenuating the influence of micron-sized inclusions on the microstructure and properties of recycled Al-Zn-Mg-Cu alloy sheet. J. Mater. Res. Technol. 2024, 30, 4147–4158. [Google Scholar] [CrossRef]
  12. Zhang, L.; Lv, X.; Wiredu, D.L.N.; And Bai, C. Mathematical Modeling on the Removal of Impurity Elements from Molten Aluminum. Miner. Process. Extr. Met. Rev. 2012, 33, 1–54. [Google Scholar] [CrossRef]
  13. Chen, G.; Huang, S.; Fu, G.; Wu, J.; Chen, R.; Zheng, X. Optimization of impurity removal and purification flux components and their application in the production of A356 aluminum alloy. J. Phys. Conf. Ser. 2024, 2845, 012008. [Google Scholar] [CrossRef]
  14. Gudmundsson, S.H.; Matthiasson, J.; Björnsson, B.M.; Gudmundsson, H.; Leosson, K. Quantitative in-situ analysis of impurity elements in primary aluminum processing using laser-induced breakdown spectroscopy. Spectrochim. Acta B 2019, 158, 105646. [Google Scholar] [CrossRef]
  15. Zhang, L.; Lv, X.; Torgerson, A.T.; And Long, M. Removal of Impurity Elements from Molten Aluminum: A Review. Min. Proc. Ext. Met. Rev. 2011, 32, 150–228. [Google Scholar] [CrossRef]
  16. Wu, J.; Djavanroodi, F.; Gode, C.; Attarilar, S.; Ebrahimi, M. Melt refining and purification processes in Al alloys: A comprehensive study. Mater. Res. Express 2022, 9, 032001. [Google Scholar] [CrossRef]
  17. Chen, W.; Liu, Y.; Peng, H.; Wang, J.; Su, X. Effect of strontium and melt purification on the solidification microstructure of hypereutectic Al-Si alloys. Mater. Today Commun. 2023, 34, 105310. [Google Scholar] [CrossRef]
  18. Liu, G.; Ren, Y.; Ma, W.; Morita, K.; Lei, Y.; Zhan, S.; Lv, G.; Li, S.; Wang, Z.; Li, R. Recent advances and future trend of aluminum alloy melt purification: A review. J. Mater. Res. Technol. 2024, 28, 4647–4662. [Google Scholar] [CrossRef]
  19. Al Mahmood, A.; Kader, M.A.; Islam, M.B.; Hossain, R. Sustainable transformation of waste Aluminium into high-performance composites: A review. Int. J. Light. Mater. Manuf. 2025, 8, 194–204. [Google Scholar] [CrossRef]
  20. Gaustad, G.; Olivetti, E.; Kirchain, R. Improving aluminum recycling: A survey of sorting and impurity removal technologies. Resour. Conserv. Recycl. 2012, 58, 79–87. [Google Scholar] [CrossRef]
  21. Barrera-Méndez, F.; Escobedo-Bocardo, J.C.; Cortés-Hernández, D.A.; Almanza-Robles, J.M.; Muñoz-Arroyo, R.; And Hernández-García, H.M. Magnesium Removal from Molten Al-Si Alloys Using Zeolite. Can. Metall. Q. 2010, 49, 163–170. [Google Scholar] [CrossRef]
  22. Wang, Y.; Zhu, L.; Niu, G.; Mao, J. Conductive Al Alloys: The Contradiction between Strength and Electrical Conductivity. Adv. Eng. Mater. 2021, 23, 2001249. [Google Scholar] [CrossRef]
  23. Cui, X.; Wu, Y.; Zhang, G.; Liu, Y.; Liu, X. Study on the improvement of electrical conductivity and mechanical properties of low alloying electrical aluminum alloys. Compos. Part B Eng. 2017, 110, 381–387. [Google Scholar] [CrossRef]
  24. Cui, X.; Ye, H.; Liu, H.; Li, X.; Man, Q.; Li, H.; Cui, H.; Feng, R.; Pan, Y. The improvement mechanism of good matching between electrical conductivity and mechanical properties for Al-4Si-0.8Mg-0.6Fe alloy. J. Alloys Compd. 2023, 938, 168275. [Google Scholar] [CrossRef]
  25. Ludwig, T.H.; Schaffer, P.L.; Arnberg, L. Influence of Vanadium on the Microstructure of A356 Foundry Alloy. Light. Met. 2016, 64, 1023–1028. [Google Scholar] [CrossRef]
  26. GB/T228-2002; Metallic Materials Tensile Test at Room Temperature. China Standard Press: Beijing, China, 2002.
  27. Tan, Q.; Yin, Y.; Prasad, A.; Li, G.; Zhu, Q.; StJohn, D.H.; Zhang, M. Demonstrating the roles of solute and nucleant in grain refinement of additively manufactured aluminium alloys. Addit. Manuf. 2022, 49, 102516. [Google Scholar] [CrossRef]
  28. Yang, J.; Xu, Y.; Bao, S.; Akhtar, S.; Tundal, U.; Tjøtta, S.; Li, Y. Effect of Inclusion and Filtration on Grain Refinement Efficiency of Aluminum Alloy. Met. Mater. Trans. A 2022, 53, 1000–1012. [Google Scholar] [CrossRef]
  29. Zhao, Y.; He, W.; Song, D.; Shen, F.; Li, X.; Sun, Z.; Wang, Y.; Liu, S.; Du, Y.; Fernández, R. Effect of ultrasonic melt processing and Al-Ti-B on the microstructural refinement of recycled Al alloys. Ultrason. Sonochem. 2022, 89, 106139. [Google Scholar] [CrossRef]
  30. Zhang, L.; Jiang, H.; He, J.; Zhao, J. Improved grain refinement in aluminium alloys by re-precipitated TiB2 particles. Mater. Lett. 2022, 312, 131657. [Google Scholar] [CrossRef]
  31. Liu, X.; Wang, B.; Li, Q.; Wang, J.; Zhang, C.; Xue, C.; Yang, X.; Tian, G.; Liu, X.; Tang, H. Quantifying the Effects of Grain Refiners Al-Ti-B and La on the Microstructure and Mechanical Properties of W319 Alloy. Metals 2022, 12, 627. [Google Scholar] [CrossRef]
  32. Zhang, X.; Le, Q.; Zhao, D.; Jiang, Y.; Wang, Y.; Wang, T.; Liao, Q. Research status and prospect of grain refinement in aluminum alloy. J. Mater. Res. Technol. 2025, 34, 1880–1893. [Google Scholar] [CrossRef]
  33. Song, D.; Zhao, Y.; Jia, Y.; Li, X.; Fu, Y.; Zhang, W. Synergistic effects of Mn and B on iron-rich intermetallic modification of recycled Al alloy. J. Mater. Res. Technol. 2023, 24, 527–541. [Google Scholar] [CrossRef]
  34. Zhang, K.; Liu, X.; Fan, P.; Zhu, L.; Wang, K.; Wang, L.; Zhao, C. Characterization of geometrically necessary dislocation evolution during creep of P91 steel using electron backscatter diffraction. Mater. Charact. 2023, 195, 112501. [Google Scholar] [CrossRef]
  35. Khaliq, A.; Alghamdi, A.S.; Rajhi, W.; Subhani, T.; Ramadan, M.; Halim, K.S.A.; Qian, M. Thermodynamic and Kinetic Analyses of the Removal of Impurity Titanium and Vanadium from Molten Aluminum for Electrical Conductor Applications. Met. Mater. Trans. B 2021, 52, 3130–3141. [Google Scholar] [CrossRef]
Figure 1. XRD pattern of the fluxing used in the experiment.
Metals 15 00556 g001
Figure 2. The main experimental flow of this study. (a) Secondary Al-Si alloy ingot cutting, (b) Refining secondary Al-Si melt by adding fluxing and aluminum-master boron alloys, (c) Casting secondary Al-Si liquid into a rod shape.
Metals 15 00556 g002
Figure 3. The effect of standing time and a single additive: (a) The effect of standing time, (b) The effect of adding fluxing, (c) The effect of adding aluminum–boron master alloy.
Metals 15 00556 g003
Figure 4. Oxidative removal of Mg and effect of composite addition: (a) Oxidative removal of Mg, (b) Addition of 0.5 wt.% aluminum–boron master alloy, (c) Addition of 0.5 wt.% fluxing.
Metals 15 00556 g004
Figure 5. XRD pattern of ash residue.
Metals 15 00556 g005
Figure 6. (a) SEM image of secondary Al-Si alloy slag, (b) Scanning analysis of secondary Al-Si alloy slag’s elemental surface.
Metals 15 00556 g006
Figure 7. Grain size organization of the samples: (a) raw material, (b) 0.5 wt.% fluxing, (c) 0.6 wt.% aluminum boron master alloy, (d) composite additions.
Metals 15 00556 g007
Figure 8. SEM image and EDS data: (a) raw material, (a1) energy spectrum analysis at point 1, (a2a7) element surface scanning analysis, (b) 0.5 wt.% fluxing, (c) 0.6 wt.% aluminum boron master alloy, (d) composite addition.
Metals 15 00556 g008
Figure 9. (a) Stress–strain diagram, (b) Tensile properties.
Metals 15 00556 g009
Figure 10. (a) IPF of raw material (gray lines indicate small-angle grain boundaries, and black lines indicate large-angle grain boundaries); (b) average grain orientation difference of raw material, (c) IPF of composite addition (gray lines indicate small-angle grain boundaries, and black lines indicate large-angle grain boundaries); (d) composite addition average grain orientation difference.
Metals 15 00556 g010
Figure 11. (a) KAM of raw material, (b) Raw material KAM distribution histogram, (c) KAM of composite addition, (d) Composite addition KAM distribution histogram.
Metals 15 00556 g011
Figure 12. Tensile fracture topography: (a) raw material, (b) 0.5 wt.% fluxing, (c) 0.6 wt.% aluminum boron master alloy, (d) composite addition.
Metals 15 00556 g012
Figure 13. Equilibrium phase diagram of Al-2Si-0.736Fe-0.0225Ti-0.0221V.
Metals 15 00556 g013
Table 1. Composition of secondary Al-Si alloys’ raw materials.
ElementAlSiFeCuMnMgTiV
Content wt.%96.81.940.7360.2120.05160.01880.02250.0221
Table 2. Composition of secondary Al-Si alloys after refining.
ElementAlSiFeCuMnMgTiV
Content wt.%96.91.930.7230.2090.05080.00190.00700.0085
Disclaimer/Publisher’s Note: The statements, opinions and data contained in all publications are solely those of the individual author(s) and contributor(s) and not of MDPI and/or the editor(s). MDPI and/or the editor(s) disclaim responsibility for any injury to people or property resulting from any ideas, methods, instructions or products referred to in the content.

