Article

Isothermal Oxidation Kinetics of Iron Powders Under Vapor Atmosphere

1
School of Metallurgy and Power Engineering, Chongqing University of Science and Technology, Chongqing 401331, China
2
College of Materials Science and Engineering, Chongqing University, Chongqing 400044, China
3
Warwick Manufacturing Group, University of Warwick, Coventry CV4 7AL, UK
*
Author to whom correspondence should be addressed.
Metals 2025, 15(5), 553; https://doi.org/10.3390/met15050553
Submission received: 24 March 2025 / Revised: 14 May 2025 / Accepted: 15 May 2025 / Published: 16 May 2025
(This article belongs to the Special Issue Advanced Metal Smelting Technology and Prospects)

Abstract

:
Semisteel is the byproduct of the titania slag smelting process of ilmenite concentrate with an electric furnace. To enhance the added value of semisteel, a centrifugal granulation–water curtain process was adopted to manufacture iron powders. The oxidation characteristics of granulated powders were analyzed by thermogravimetry (TG), X-ray diffraction (XRD), and scanning electron microscopy (SEM). To obtain iron powders with high purity, the isothermal oxidation kinetics of pure iron powders under vapor atmosphere were studied. TG measurements of pure iron powders were conducted at 1073 K, 1173 K, and 1273 K using a humidity generating instrument and a thermal analyzer. The results indicate that the oxidation rate increases with the increasing temperature and decreasing powder size. The entire isothermal oxidation process of iron powders with different sizes (0.3 mm < d1 < 0.35 mm, 0.4 mm < d2 < 0.45 mm, and 0.5 mm < d3 < 0.55 mm) comprises two stages. The first oxidation stage is controlled by chemical reaction; the second oxidation stage is controlled by both internal diffusion and chemical reaction. The activation energies and oxidation reaction rate equations of iron powders at different stages are calculated.

1. Introduction

Titanium dioxide (TiO2), the most commonly utilized titanium compound, is broadly used in a wide range of applications such as pigments, adsorbents, and plastic additives [1,2,3,4]. The titanium dioxide is mostly manufactured through the chloride and sulfate processes, the latter of which accounted for more than 84% of Chinese titanium dioxide output in 2023. The sulfuric acid process for titanium dioxide comprises leaching, reducing, settling, hydrolyzing, and calcining process. Generally, the mixture of ilmenite concentrates and high-titania slag is adopted as a raw material in the sulfuric acid process. There is a small amount of Fe2O3 in ilmenite concentrate, resulting in the existence of Fe3+ in titanyl sulfate solution affecting the whiteness of titanium dioxide [4,5]. Iron powders are mainly used to reduce Fe3+ during the reducing step.
Semisteel, discharged at temperatures of more than 1923 K, is the byproduct of the titania slag smelting process of ilmenite concentrate with an electric furnace. Semisteel has the characteristic of low carbon and high sulfur, which greatly influences its usage in the steelmaking process. The semisteel is suitable for manufacturing iron powders applied in the sulfate process, which not only enhances the product’s added value, but also eliminates the necessity for carbon addition and desulfurization procedures. At present, the major iron powder production techniques in China are the Hoganas and water atomization processes [6,7,8]. The main raw material of the Hoganas and water atomization processes are iron concentrate powders and hot metal, respectively. The water atomization process features by high-pressure water impinging, which consumes considerable amounts of water and electricity. Difficulties also exist in heat recovery and in efficiently separating fine iron powders from cooling water. Thus, a novel technique combining a circle of water curtain with a rotary cup atomizer was proposed to manufacture iron powders in our previous work [9].
The molten semisteel flows onto the rotating cup atomizer, and may form droplets or unstable ligaments or films, which will later break up into droplets. Numerous droplets are cooled by water or vapor, then solidified into powders. As for the granulation process, the powder size is mainly affected by rotating speed [10,11], liquid flow rate [12,13], liquid temperature [14], and cup parameters [15,16,17,18,19]. The water curtain, installed around the atomizer, aims to accelerate the cooling process of iron droplets and reduce the oxygen content of iron powders. A large amount of hot vapor is produced while the droplets passing through the water curtain. The vapor can be applied in the leaching steps of the sulfuric acid process, and in other fields as well. The iron droplets/powders are oxidized by hot vapor during the granulation process. The most commonly used iron powders in the industrial sulfate process require the oxygen content of less than 13 wt.% [9].
To obtain high purity iron powders with less water consumption, the oxidation behavior of iron powder under vapor atmosphere should be investigated. The oxidation kinetics of metallic iron or steel have been studied by scholars. The function between mass gain and time includes liner, parabolic, cubic, and logarithmic relation [20]. In the initial stage of the oxidation reaction, metallic iron comes into direct contact with the reaction gas, which provides sufficient oxygen to meet the needs of the oxidation reaction. The oxidation rate of iron is controlled by chemical reactions, and the oxidation process follows a linear law. In the later stage of oxidation reaction, the iron oxide formed on the surface of the sample completely covers the metal iron, acting as a barrier between the internal metal iron and the reaction gas. The oxidation rate of iron is controlled by the diffusion rate of oxygen ions in the iron oxide, and the oxidation process follows a parabolic law. If the iron oxide on the surface of the sample is only ferrous oxide, the diffusion rate of oxygen ions in the iron oxide is much lower than that of iron ions. The oxidation reaction rate of iron is controlled by the diffusion rate of iron ions in ferrous oxide, and the oxidation process follows a logarithmic law.
However, the previous studies were mainly conducted under air or oxygen atmosphere. The oxidation behavior of metallic iron under vapor atmosphere is not yet clear. Therefore, the oxidation kinetics of the pure iron powders of different sizes under vapor atmosphere were investigated by thermogravimetry (TG). Additionally, the activation energies and oxidation reaction rate equations of iron powders at different stages were calculated.

2. Experiment

2.1. Materials

The main chemical composition of semisteel used in present work is Fe, S, and C with a content of 97.40 wt.%, 0.35 wt.%, and 1.50 wt.%, respectively.

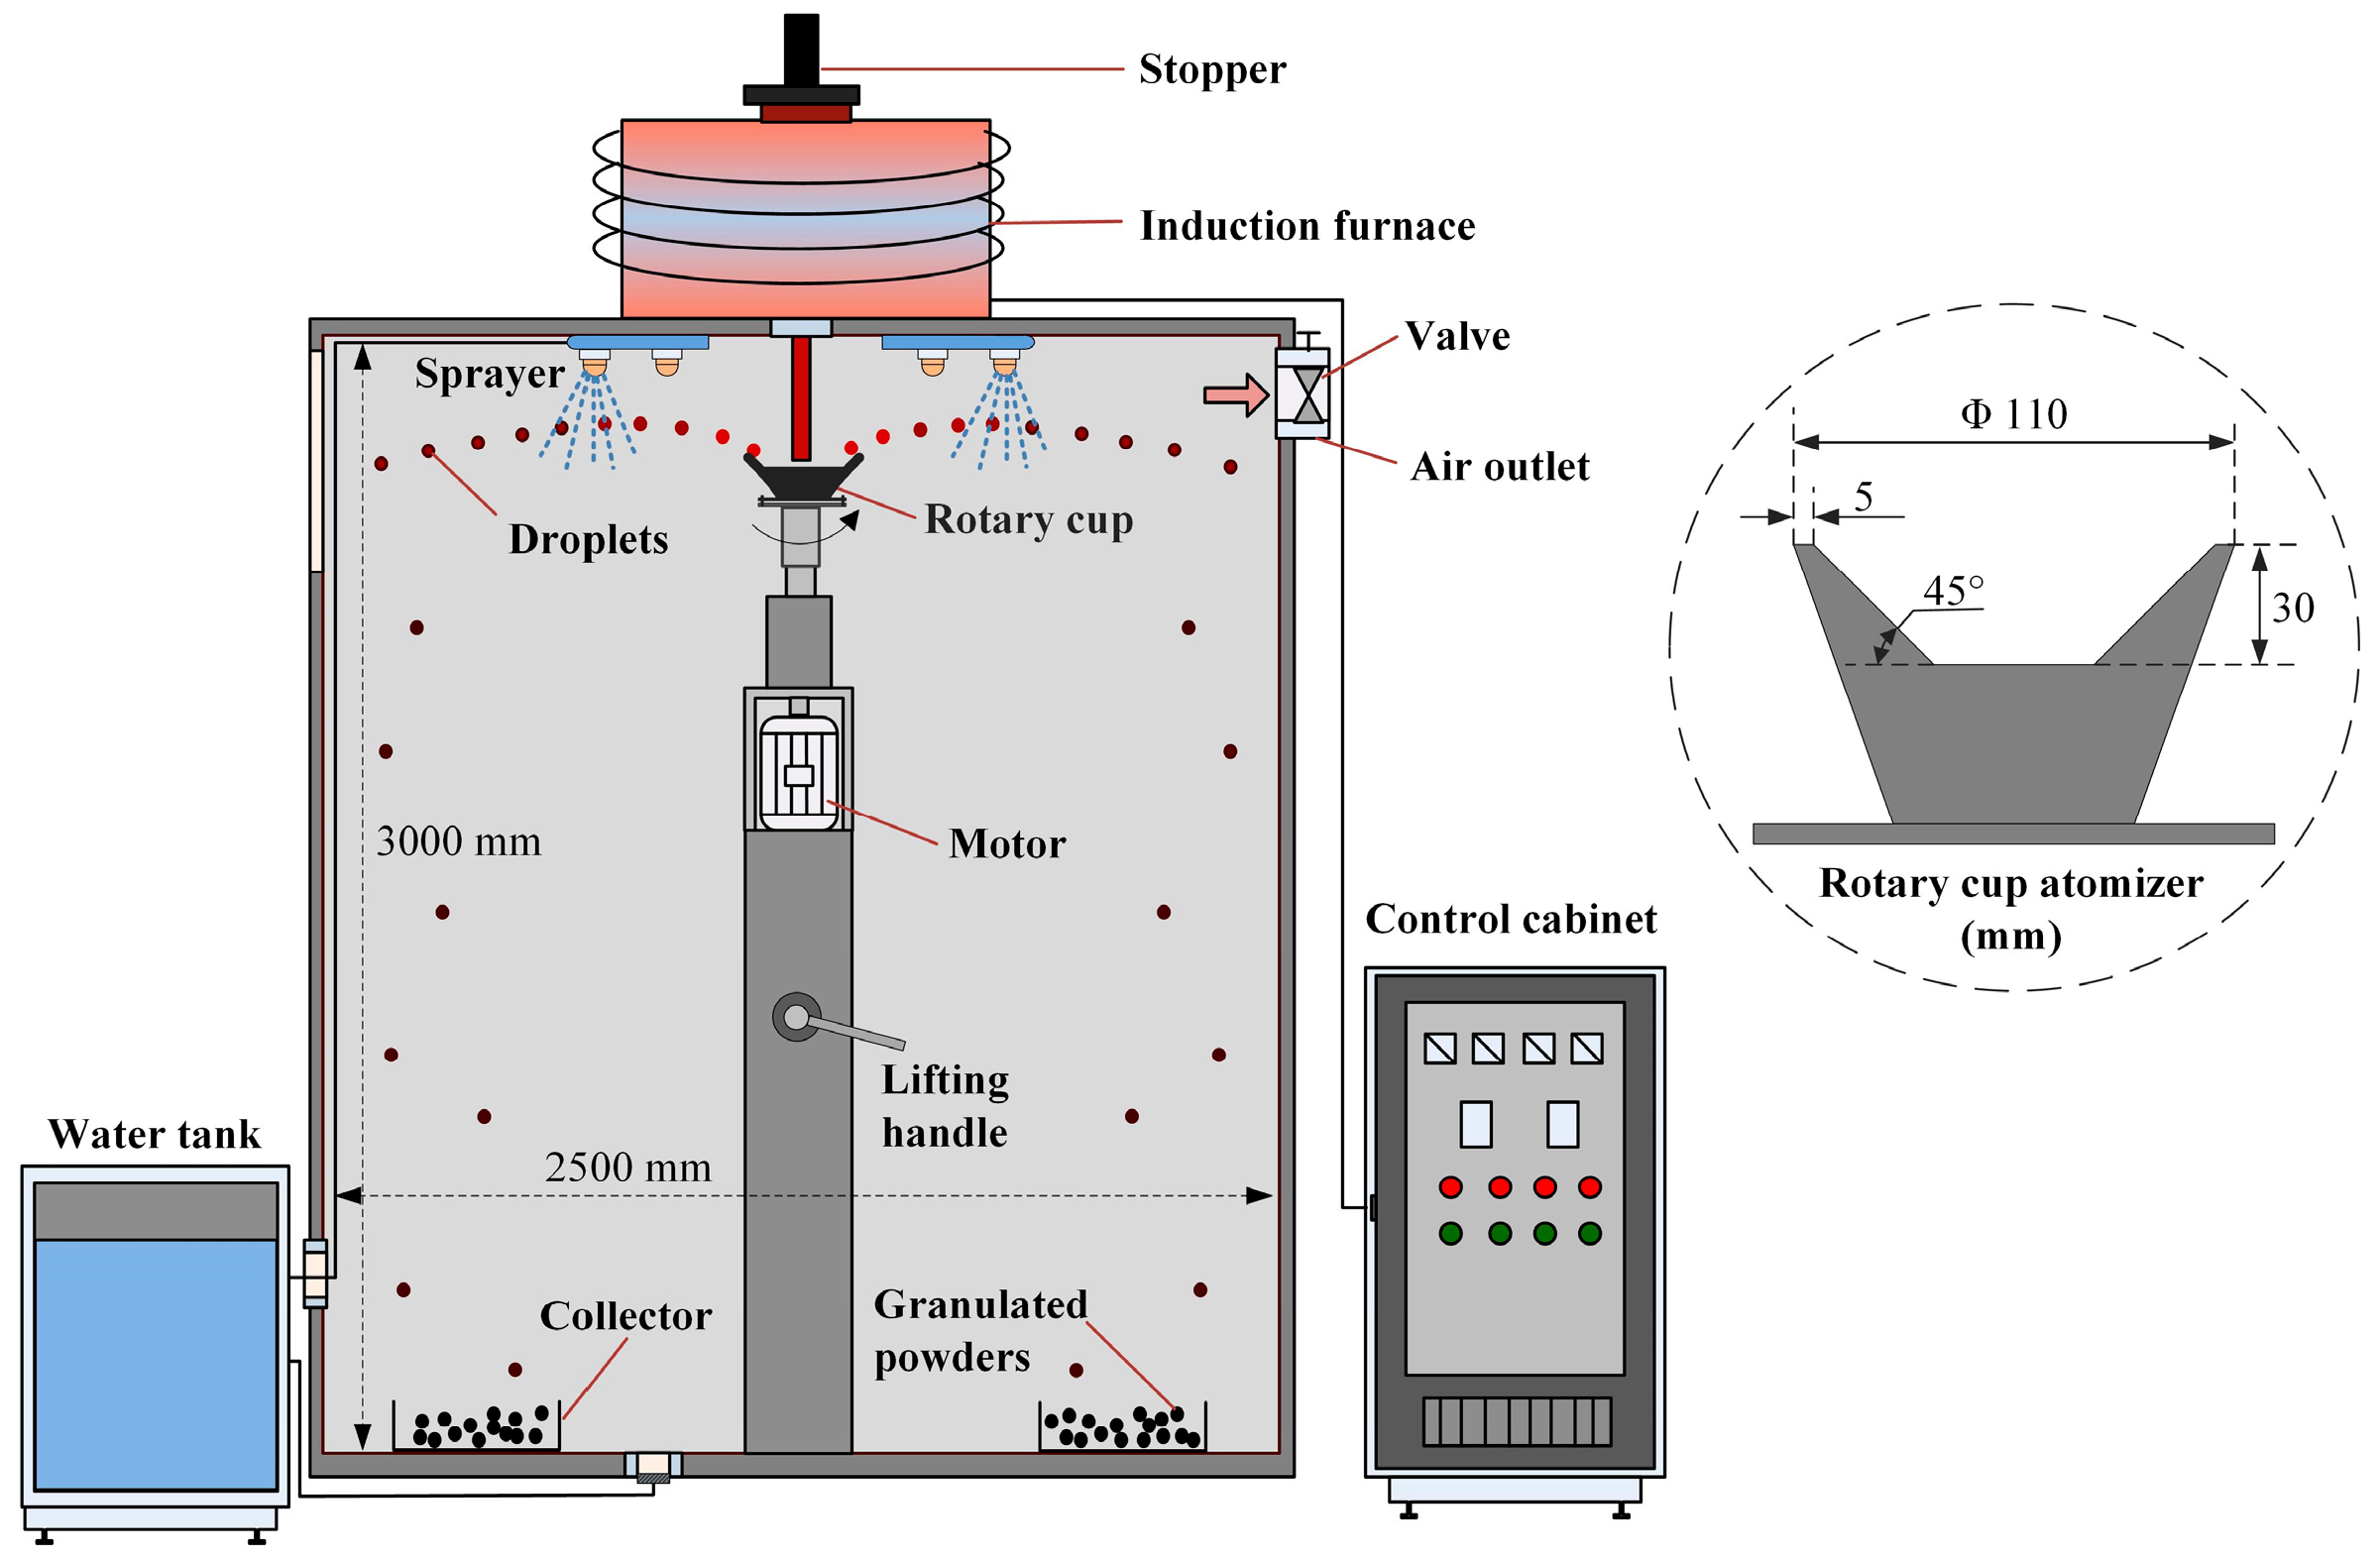
2.2. Granulation Experiment

The laboratory-scale apparatus of the centrifugal granulation–water cooling process, as schematically shown in Figure 1, mainly comprises an induction furnace, a rotational driving system, a rotary cup, powder collectors, and a water cooling system [9]. Semisteel, with a weight of 2000 g, was filled into a graphite crucible and then heated to 1723 K in the induction furnace. Turn on the water cooling system, a circle of water curtain was formed around the atomizer. The high-temperature semisteel was transported into iron droplets under the centrifugal force of rotary cup. Numerous droplets were cooled by water and formed powders when passing through the water curtain. The flow rate of water and molten semisteel was 0.25 L/min and 1.30 × 10⁻⁵ m3/s, respectively. The diameter and rotary speed were 110 mm and 1500 r/min.

2.3. Oxidation Characteristics of Granulated Powders

X-ray diffraction (XRD) analysis was conducted on the outer surface of granulated pow-der. The sectional morphology of granulated powders with different sizes were analyzed by scanning electron microscopy (SEM). Additionally, the oxidation degree of granulated powders was measured by thermogravimetric (TG) experiments using a Setsys Evo TG/DTA 1750 thermal analyzer (Setaram, Lyon, France). The reducing gas was hydrogen and nitrogen with a volume ratio of 3:1.

2.4. Isothermal TG Measurements of Pure Iron Powders

The samples adopted in this study were pure iron powders. TG measurements of the isothermal oxidation kinetics of the iron powder were conducted using a humid gas generator (Setaram Wetsys, Setaram, Lyon, France) and a thermal analyzer (Setsys Evo TG/DTA 1750, Setaram, Lyon, France).
Pure iron powder samples (100 mg) were placed in an Al2O3 crucible, and then heated at a rate of 20 K·min−1 to 1073, 1173, and 1273 K. High purity argon (30 mL·min−1) was introduced into the reaction tube during the heating process of samples. After holding 10 min at the target temperature, vapor (30 mL·min−1) was flowed into the reaction tube. The carrier gas of vapor was He, and the relative humidity was set as 90%. The experimental scheme is shown in Table 1. To remove effect of buoyance force or system error on the oxidation experiments, a blank test was performed. The TG results of iron powders were recorded at the isothermal reaction stage.

3. Results and Discussion

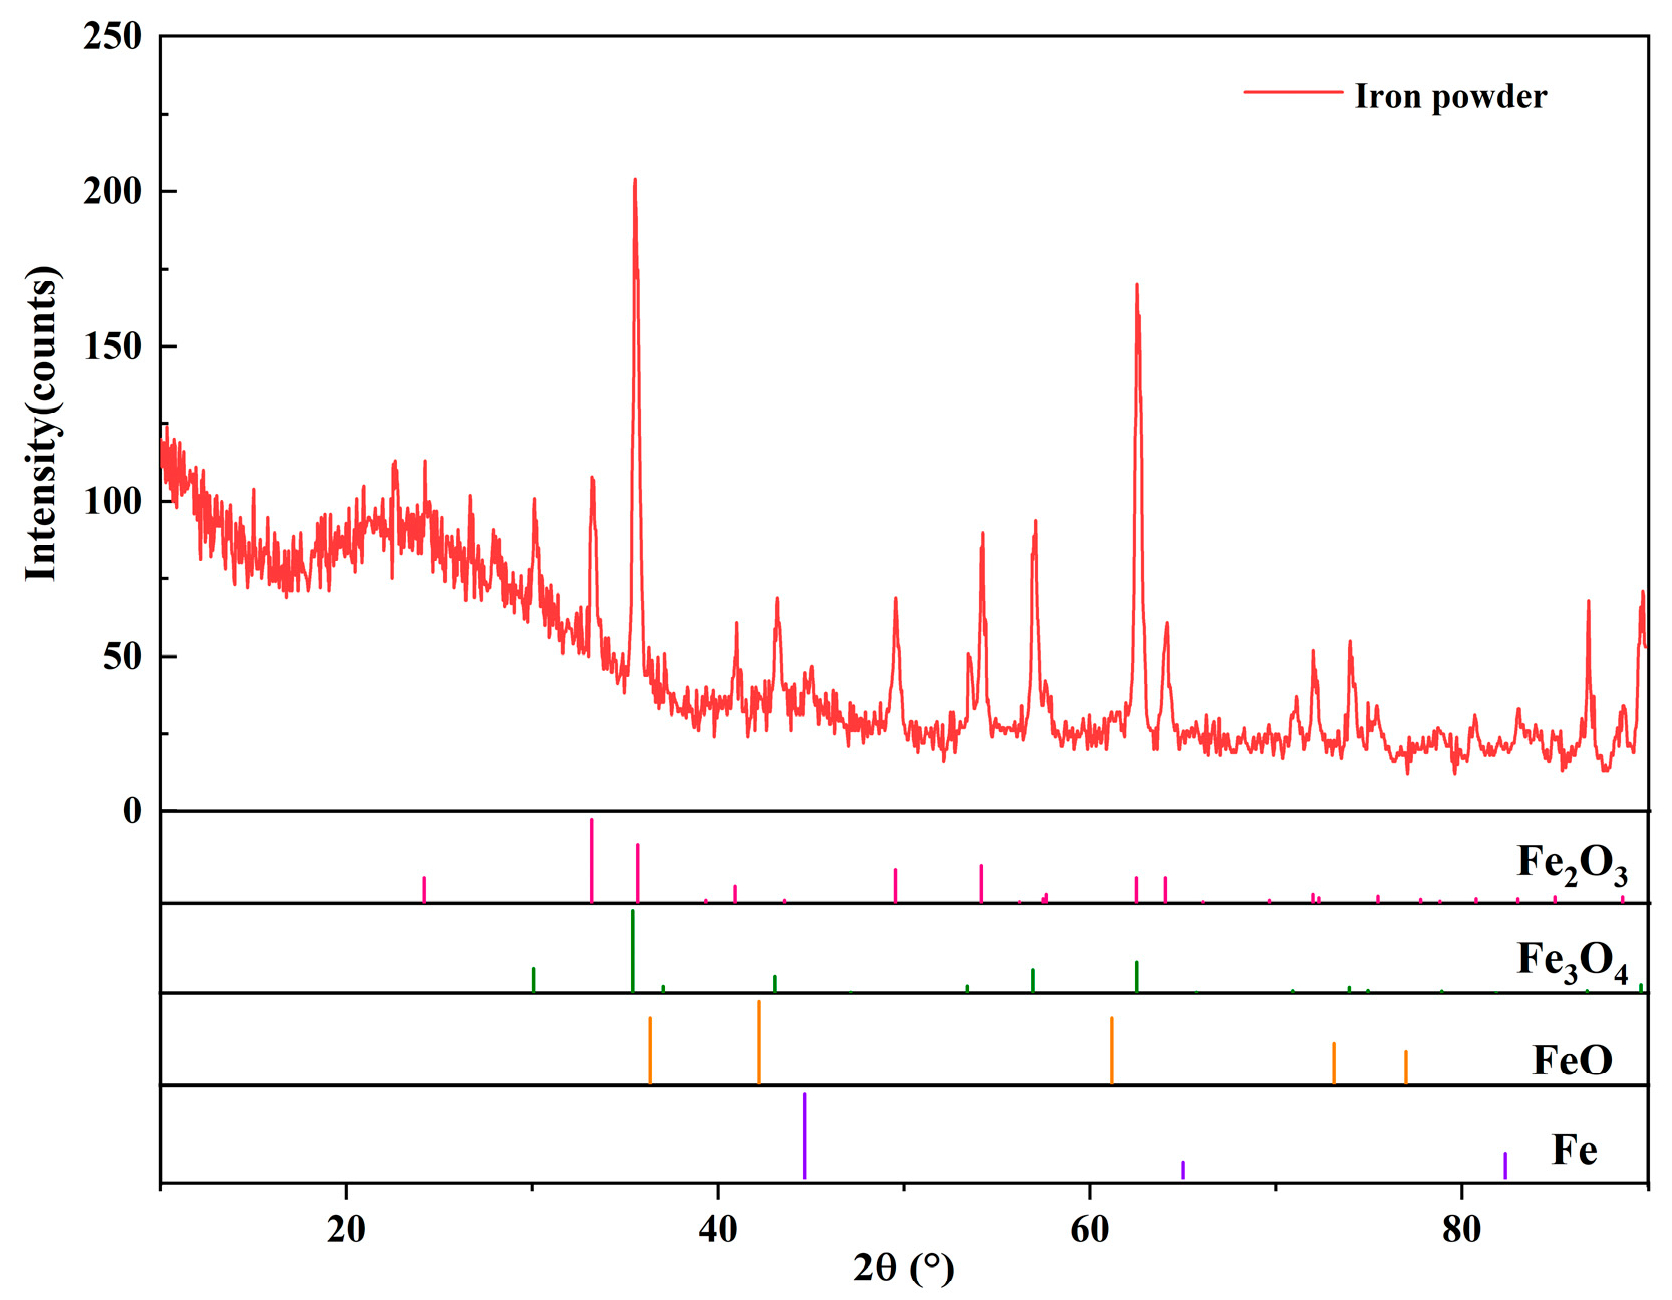
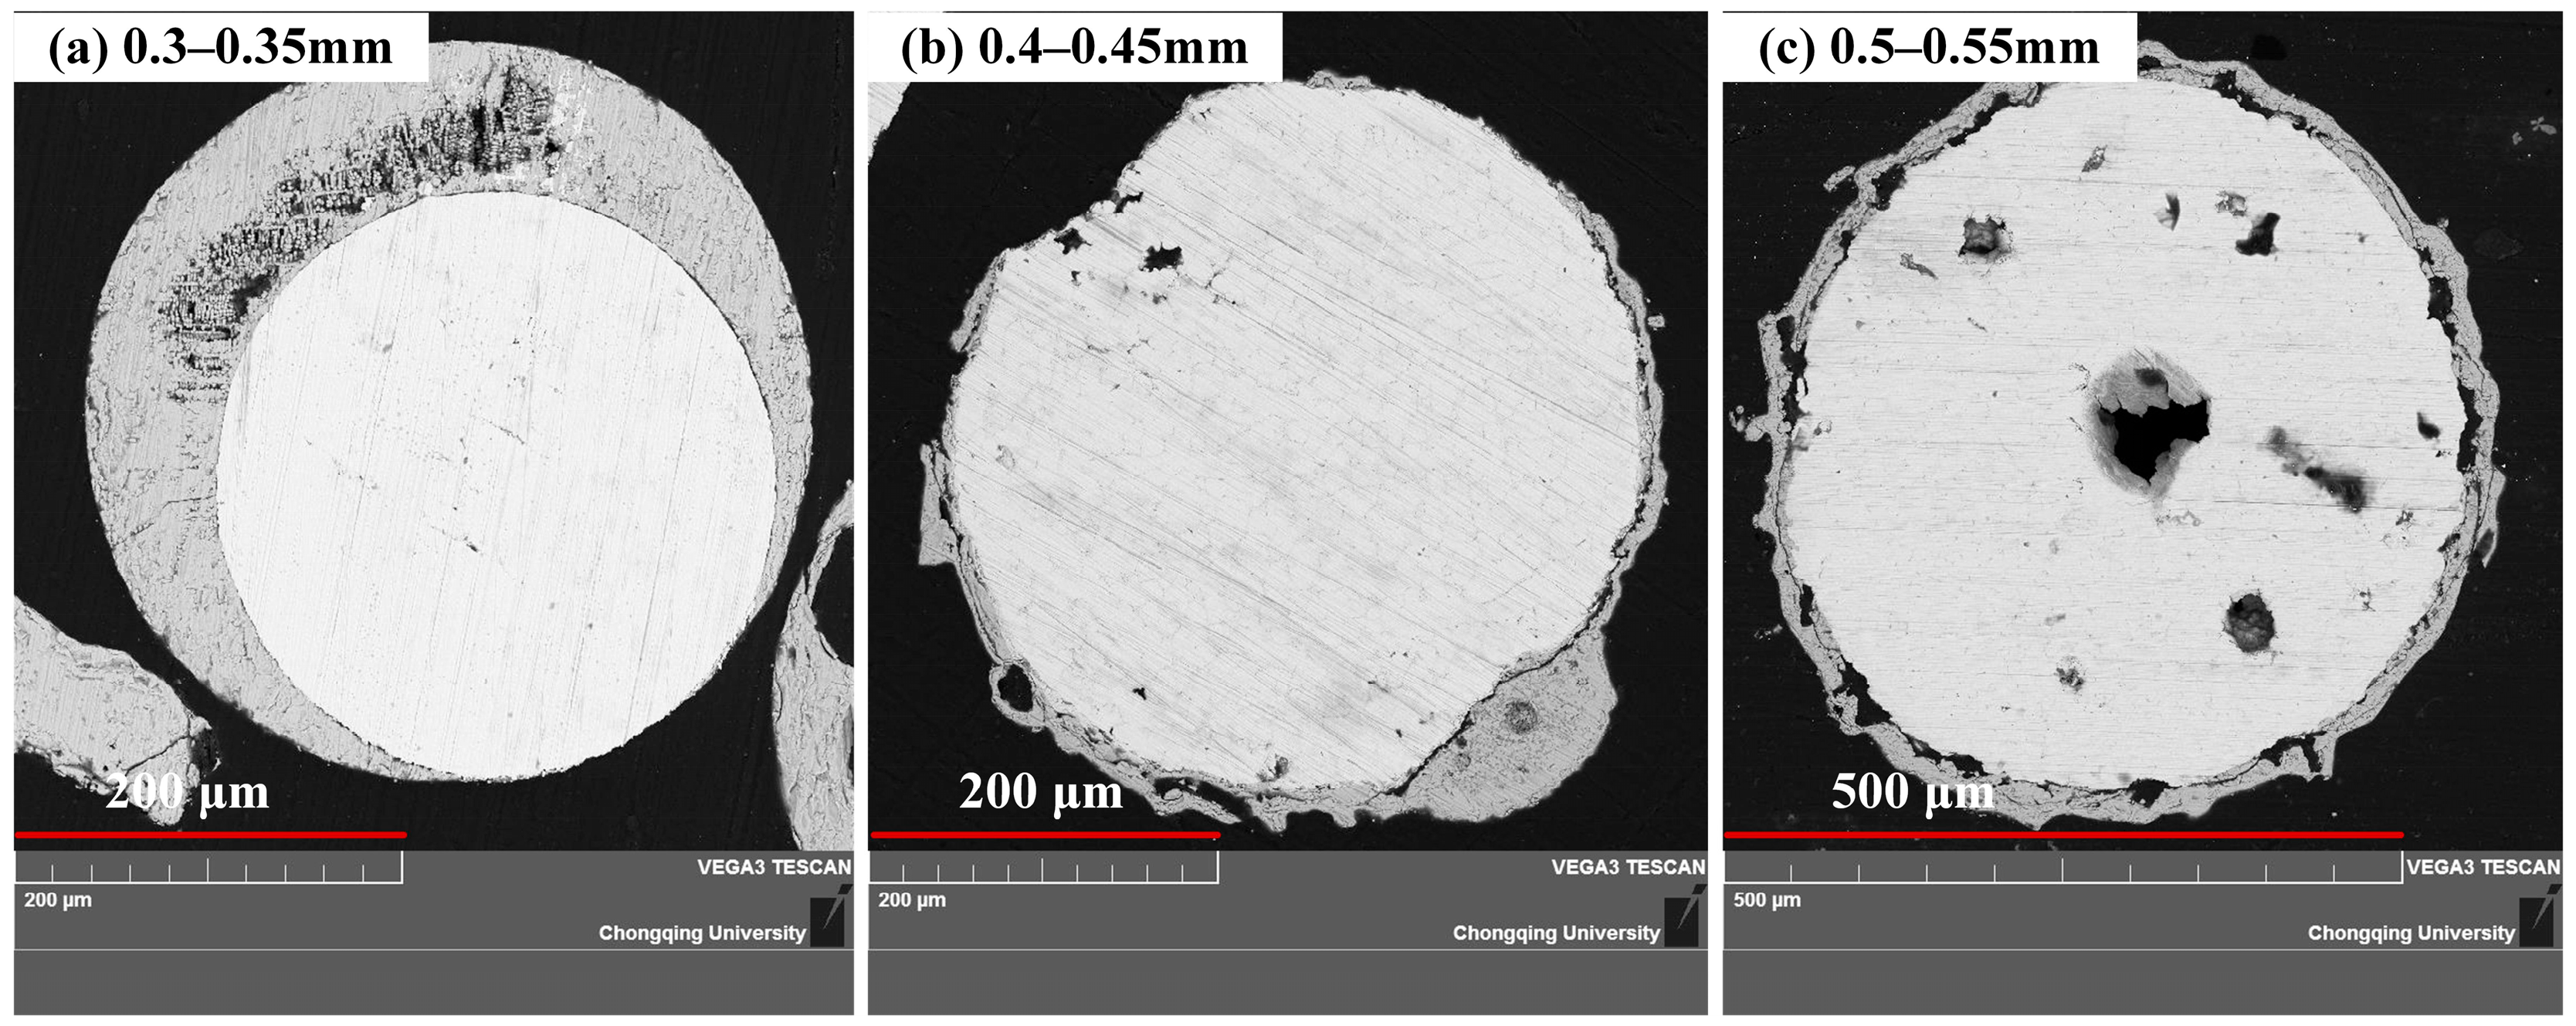
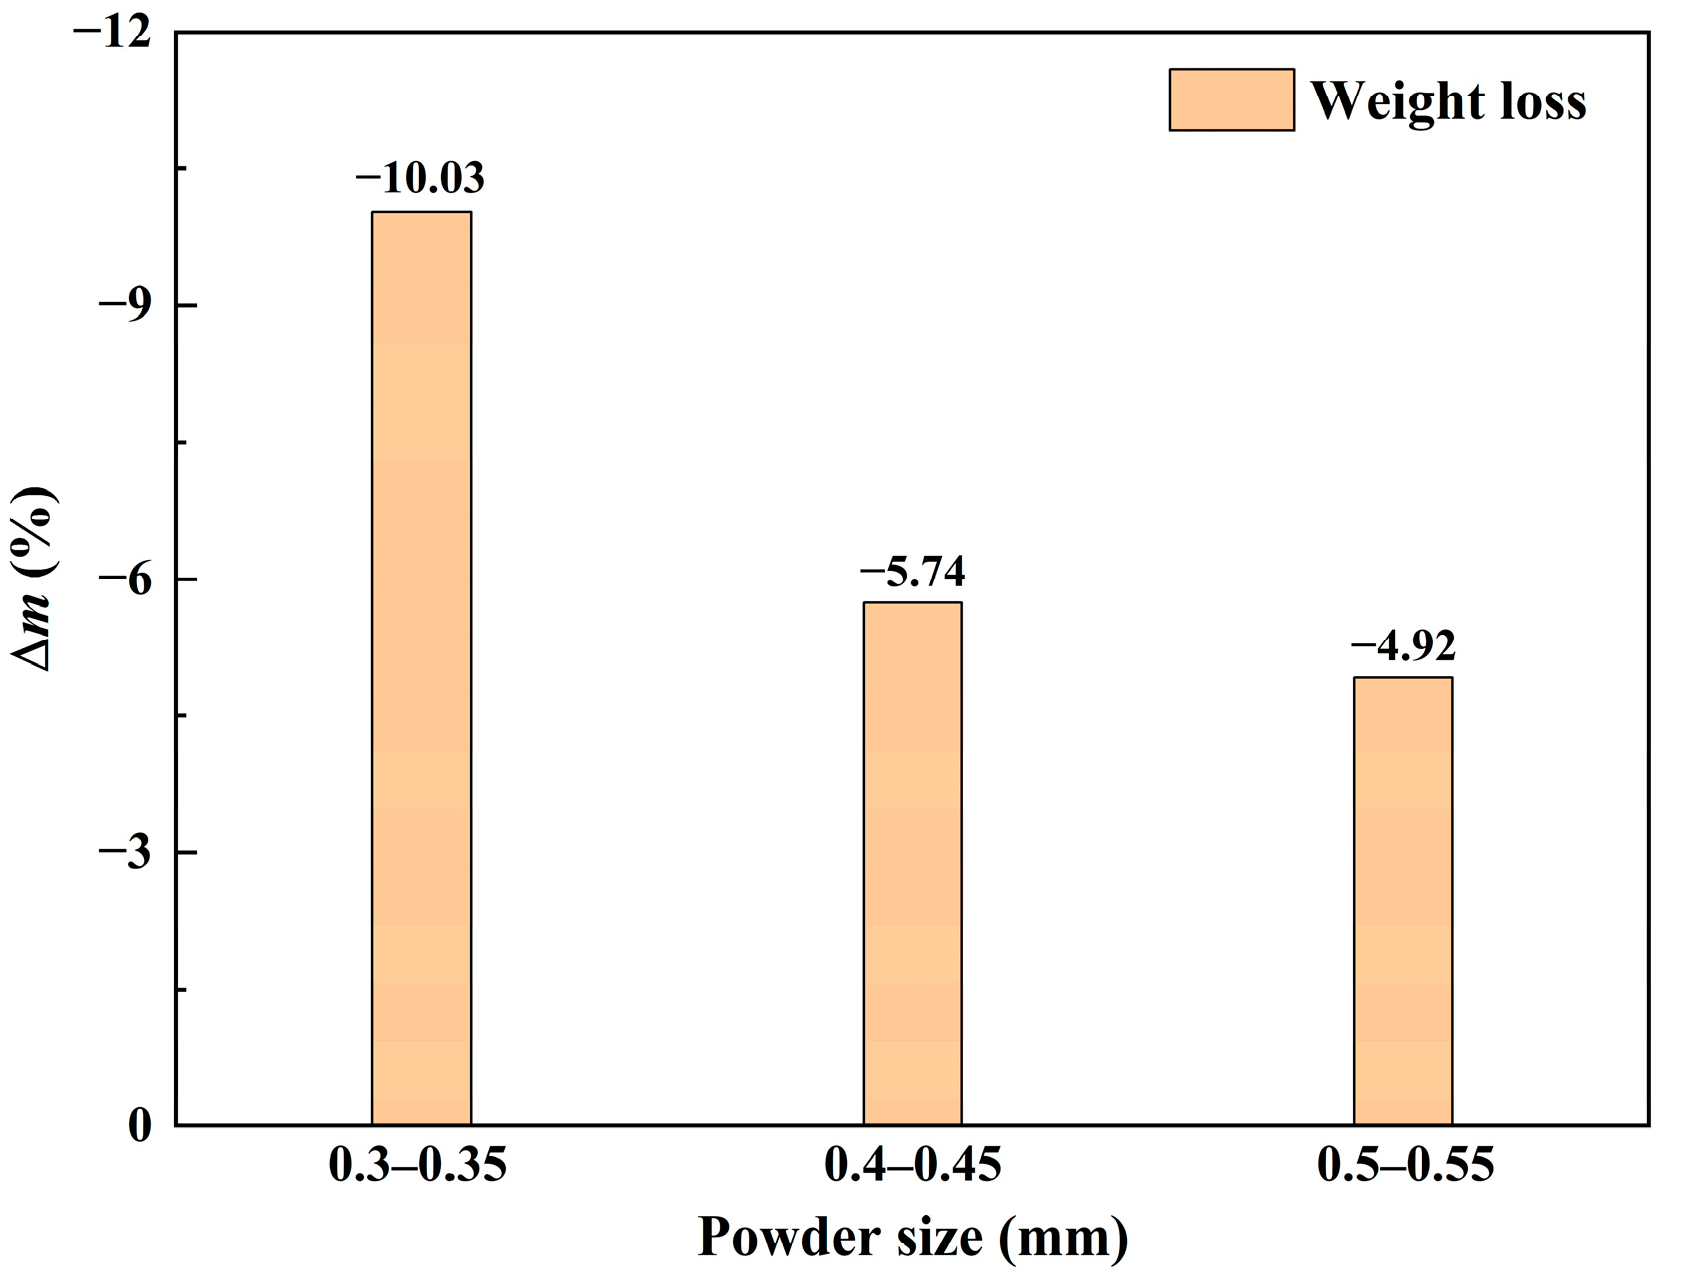
3.1. Oxidation Characteristics of Granulated Powders

As shown in Figure 2, the main phases of granulated powder outer surface are Fe3O4 and Fe2O3.
Figure 3 shows the microstructural image of granulated powders within the range of 0.3–0.55 mm. An oxide layer formed on the powder outer surface. The dark and light gray phases are iron oxides and metallic iron.
The granulated powders were reduced by hydrogen and nitrogen with a volume ratio of 3:1. When the reduction time is 1 h, the weight loss of granulated powders keep nearly constant [9]. The granulated powders’ weight loss can be considered their oxygen content because of their low carbon and sulfur contents. Figure 4 shows the oxygen content decrease from 10.03% to 4.92% as the granulated powder size increase from 0.3–0.35 mm to 0.5–0.55 mm. The granulated powder with big size has a lower oxygen content due to its small specific surface area.

3.2. Isothermal TG Analysis of Pure Iron Powders
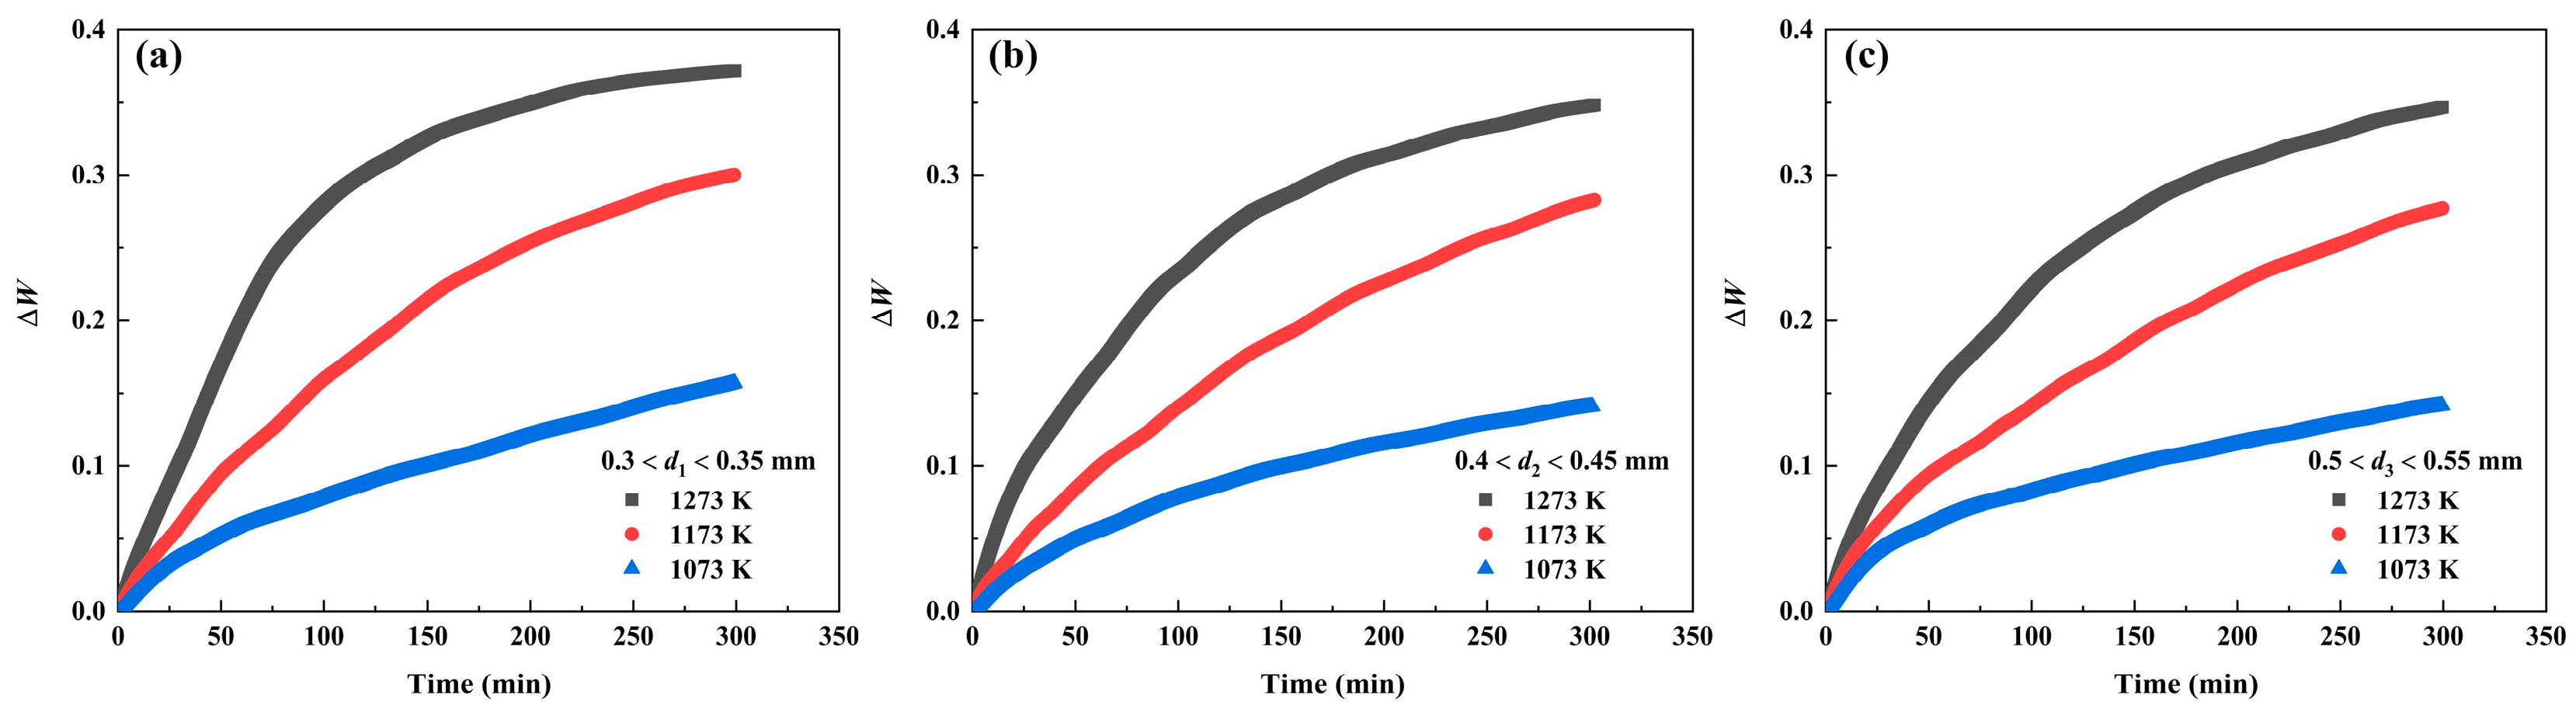
3.2.1. TG Analysis

Figure 5 depicts the TG curves of the iron powder samples oxidizing in vapor. These curves selected at different temperatures increase gradually with time when vapor is introduced into the reaction tube. The oxidation process varies from 1073 K to 1273 K. For samples with a diameter of 0.3–0.35 mm, the oxidation process is completed in 290 min at 1273 K, as shown in Figure 5a. There is no plateau that appears in the TG curve at 1073 K and 1173 K when the reaction time is up to 300 min. After a 300 min reaction, the unit mass gain (ΔW) increases with the increase in temperature, ranging from 0.16 mg to 0.37 mg. The difference has also existed in the oxidation process of samples with different powder size. The oxidation rate increases with the increasing temperature and decreasing powder size.

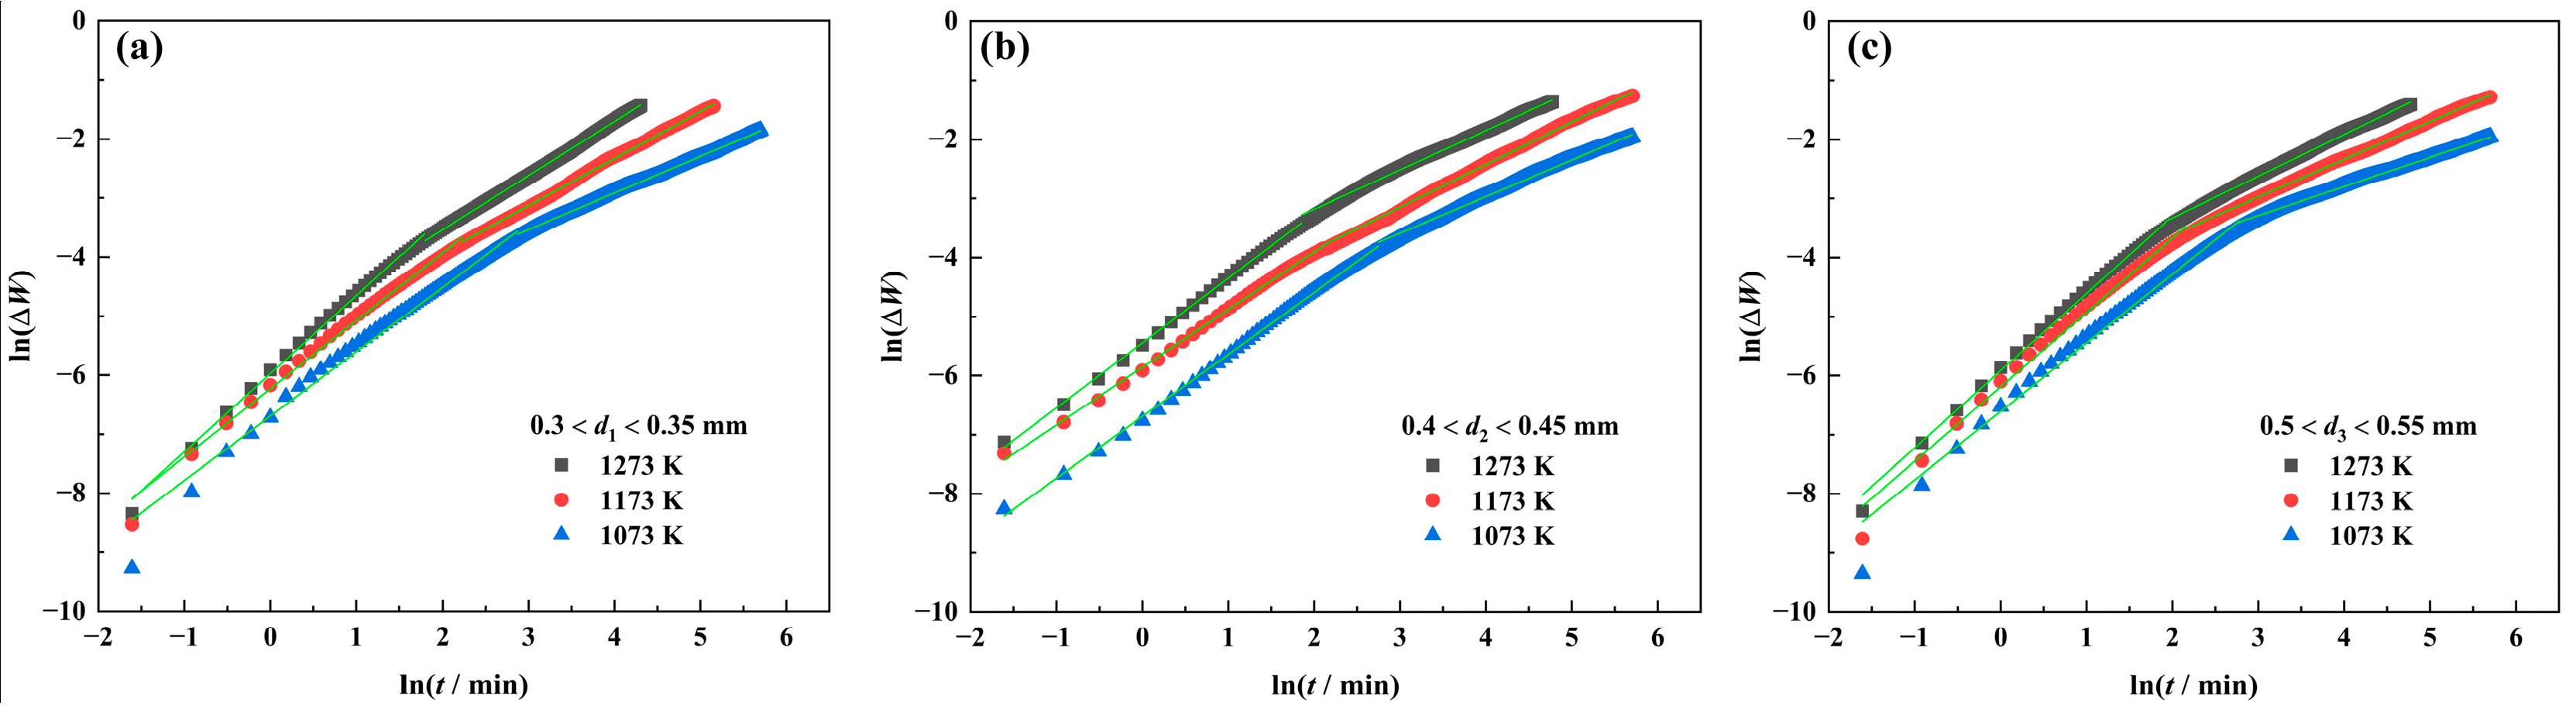
3.2.2. Reaction Mechanism

According to Kofstad, an oxidation process obeying linear, parabolic or cubic law is generally expressed as Equation (1) [21,22].
W)n = k(T) t,
where ΔW is unit mass gain, n is the reaction order, k(T) is rate constant, and t is time. Equation (2) can be obtained by taking the natural logarithm of both sides of Equation (1), and formulated as follows:
ln (ΔW) = (1/n) ln k(T) + (1/n) ln t,
This equation is generally adopted to evaluate experimental data, where vertical axis is ln (ΔW) and horizontal axis is ln t; the intercept and the slope of the fitting line is (1/n) ln k(T) and 1/n, respectively. The 1/n can be obtained by the slope of the fitting line of ln (ΔW) against ln t, as illustrated in Figure 6. The curve exhibits a notable inflection, indicating that the reaction order has changed. The oxidation process can be divided into two stages. According to slope of fitting line, the reaction order is calculated, as shown in Table 2.
The n values of powders with different sizes in the first stage are close to 1. Assuming that the unit mass gain is linearly correlated with t, which satisfies the following formula:
ΔW = k(T) t,
Figure 7 depicts the data fitting of Equation (3) for powders with different sizes in the first stage. The fitting line’s slope is rate constant, as shown in Table 3. The oxidation process follows a linear law, and the oxidation rate of iron is controlled by chemical reactions.
From Table 3, the n values of almost all powders with different sizes in the second stage is in the range of 1 to 2, assuming that the relationship between ΔW and t follows the mixed rule of linearity and parabola, and the average value of n is taken as the actual reaction order. Figure 8 depicts the data fitting of all powders with different sizes in the second stage. The fitting line’s slope is rate constant, as shown in Table 4. The second oxidation stage is controlled by chemical reaction and internal diffusion.

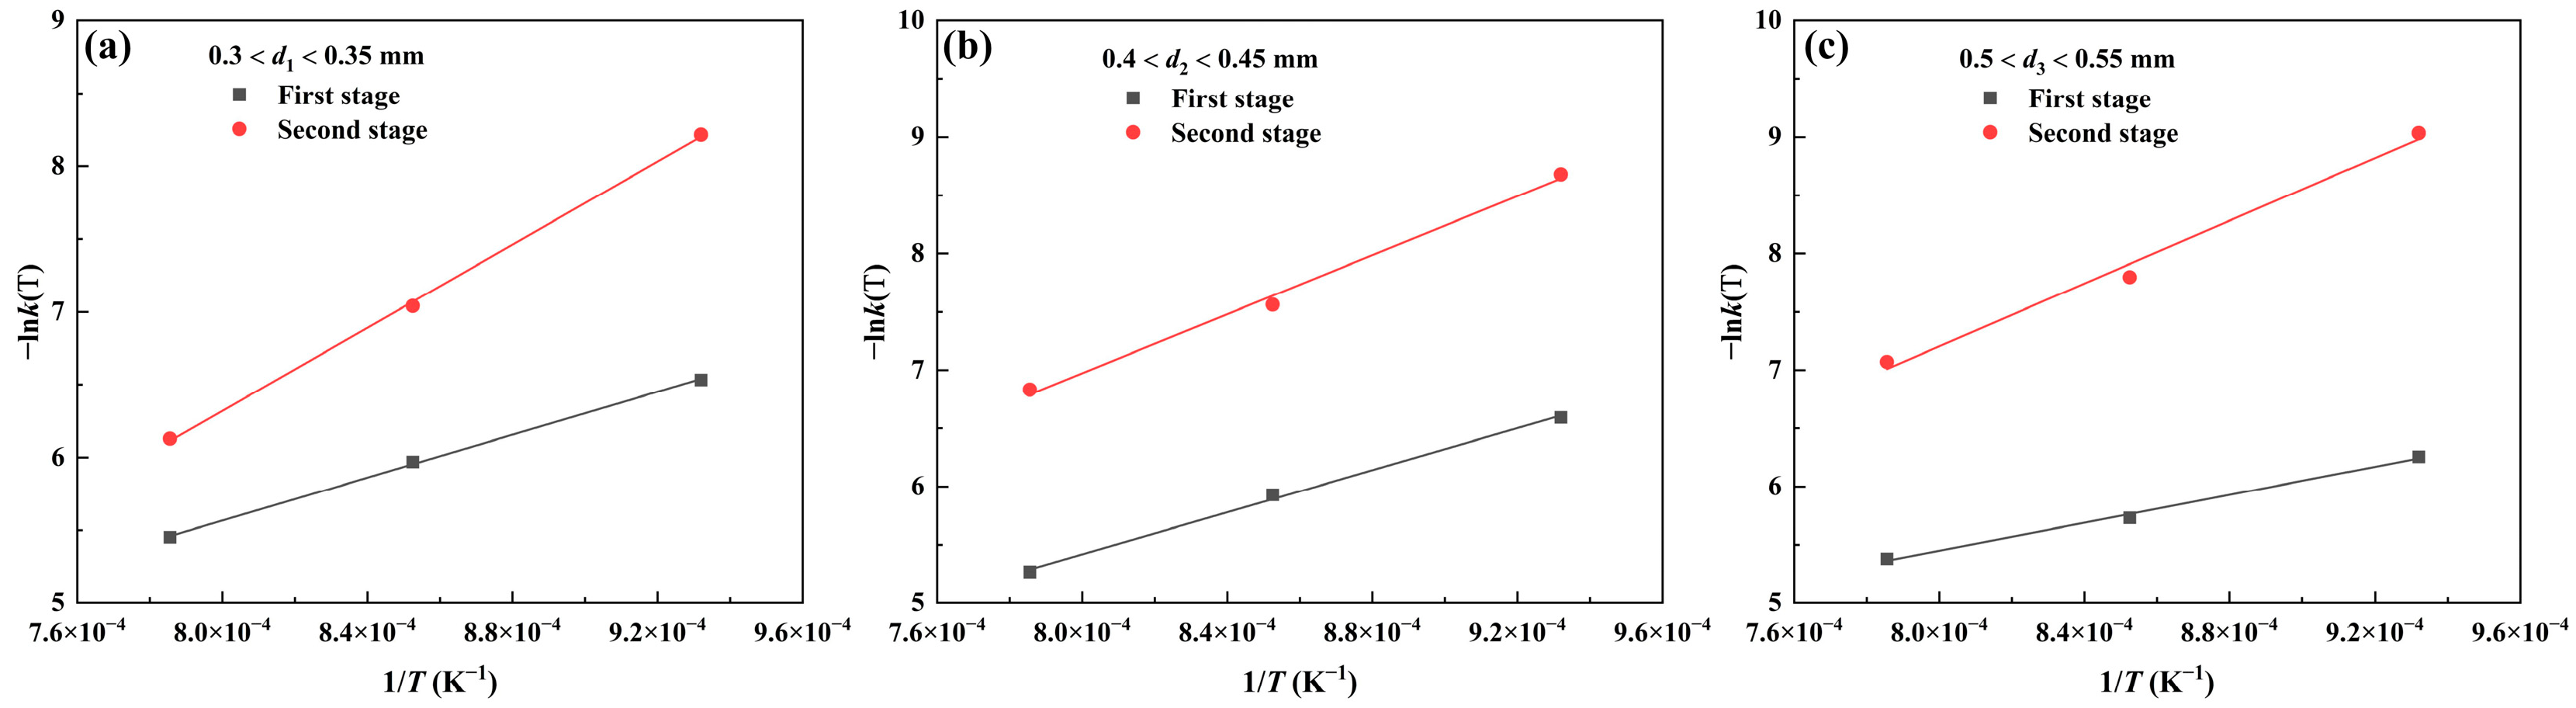
3.2.3. Reaction Activation Energy

The rate constant k(T) can be expressed as follows based on the Arrhenius equation [23,24],
k(T) = A exp(−E/RT),
where A refers to pre-exponential factor, E refers to the activation energy, and R refers to the gas constant. Equation (5) can be formulated by calculating the natural logarithm on both sides of Equation (4).
ln k(T) = E/RT + ln A,
As depicted in Figure 9, −E/R and ln A can be calculated by the fitting line’ slope and intercept. The apparent activation energy and pre-exponential factor can be calculated by the slope and intercept value. The activation energy of the oxidation of iron powders with different sizes are shown in Table 5.
The activation energy values, as shown in Table 5, are not correlated with the iron powder size. From Figure 5, the unit mass gain of iron powders with varying particle sizes at 1073 K ranges from 0.157 to 0.141, which is approximately half of the unit mass gain observed at 1173 K. The data obtained at 1073 K may exert a certain influence on the calculation of activation energy.

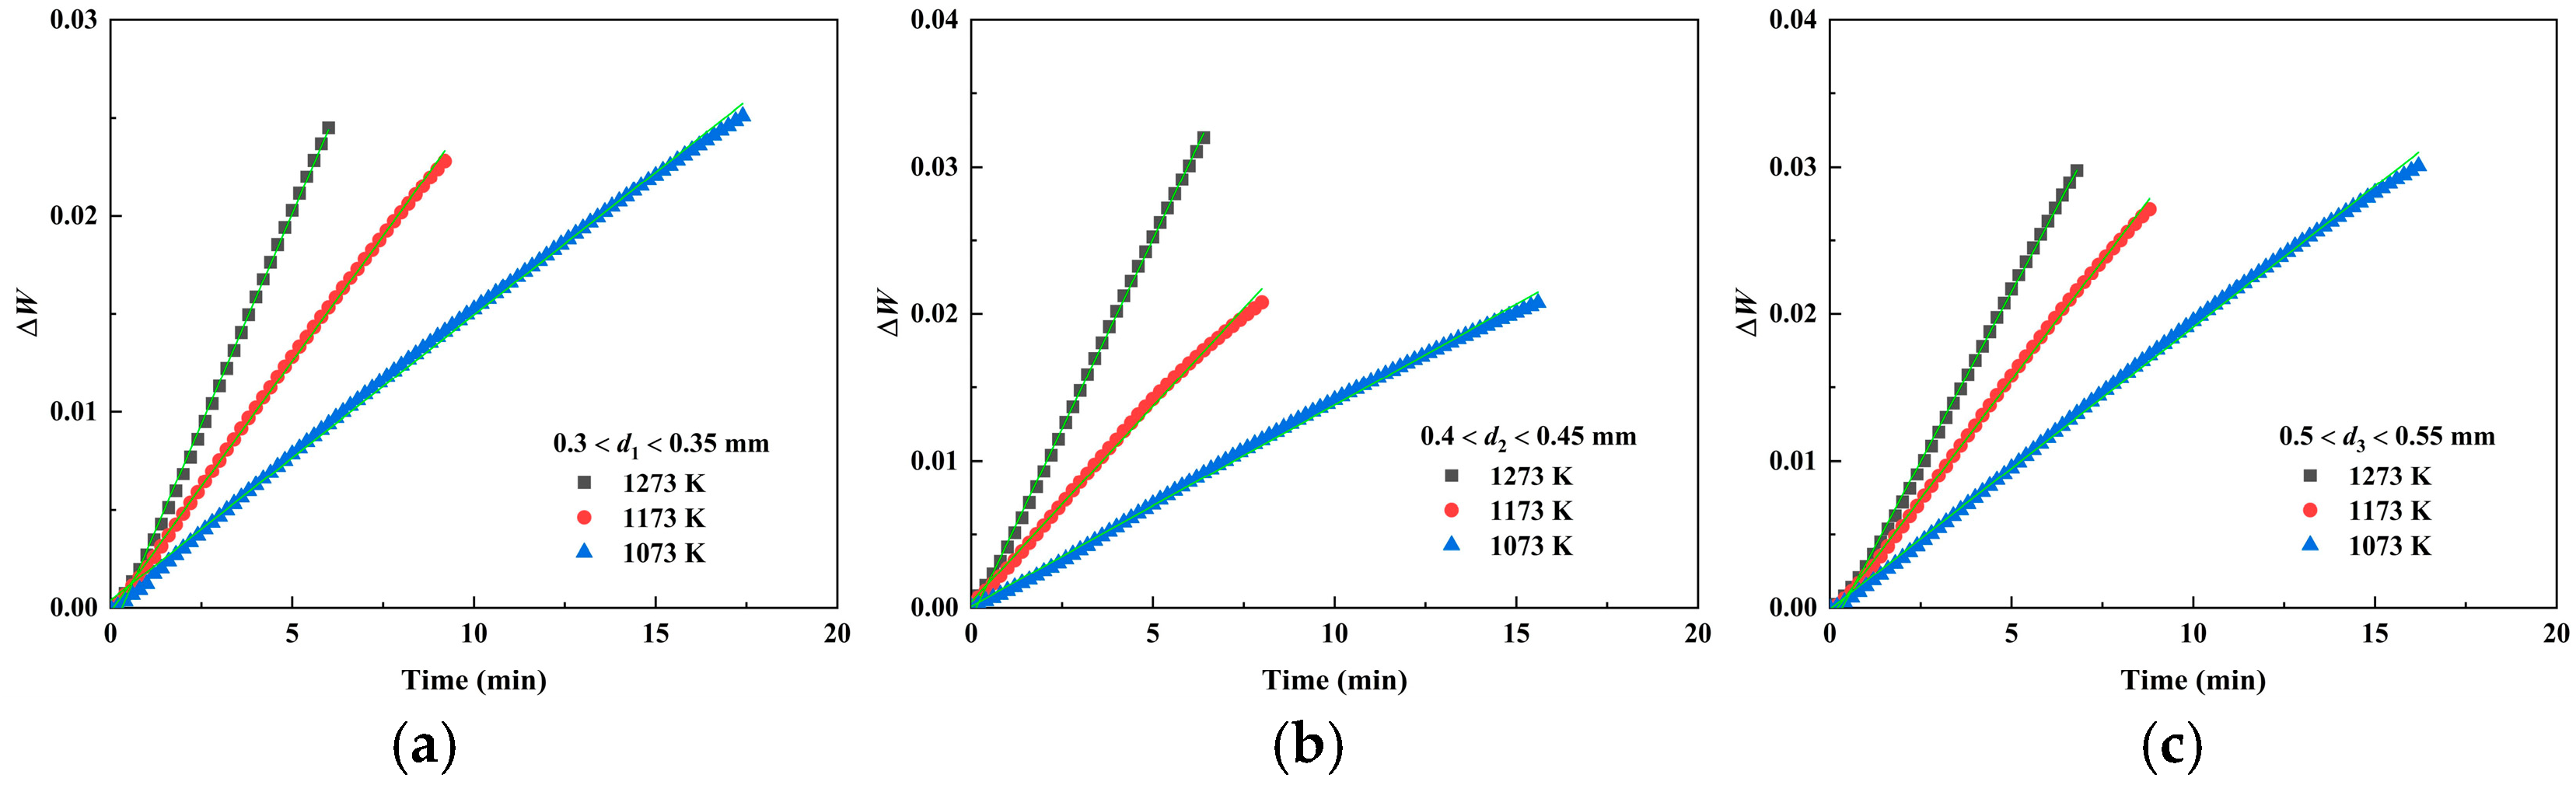
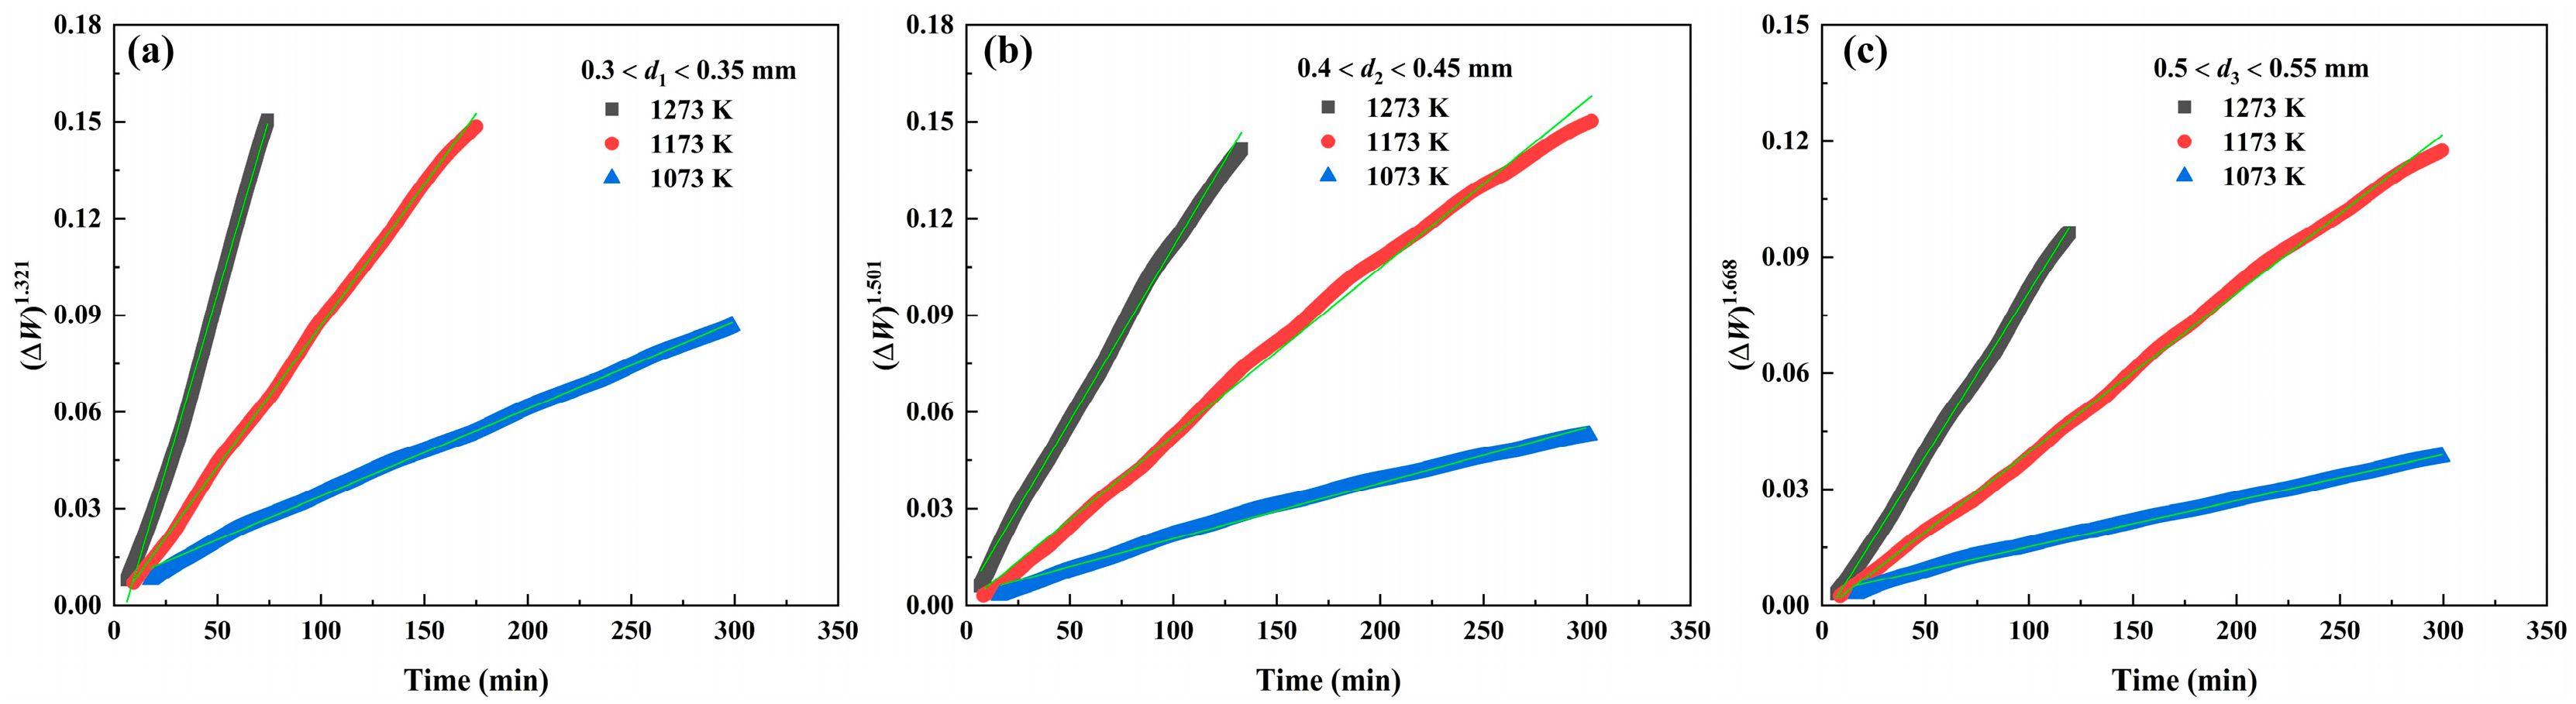
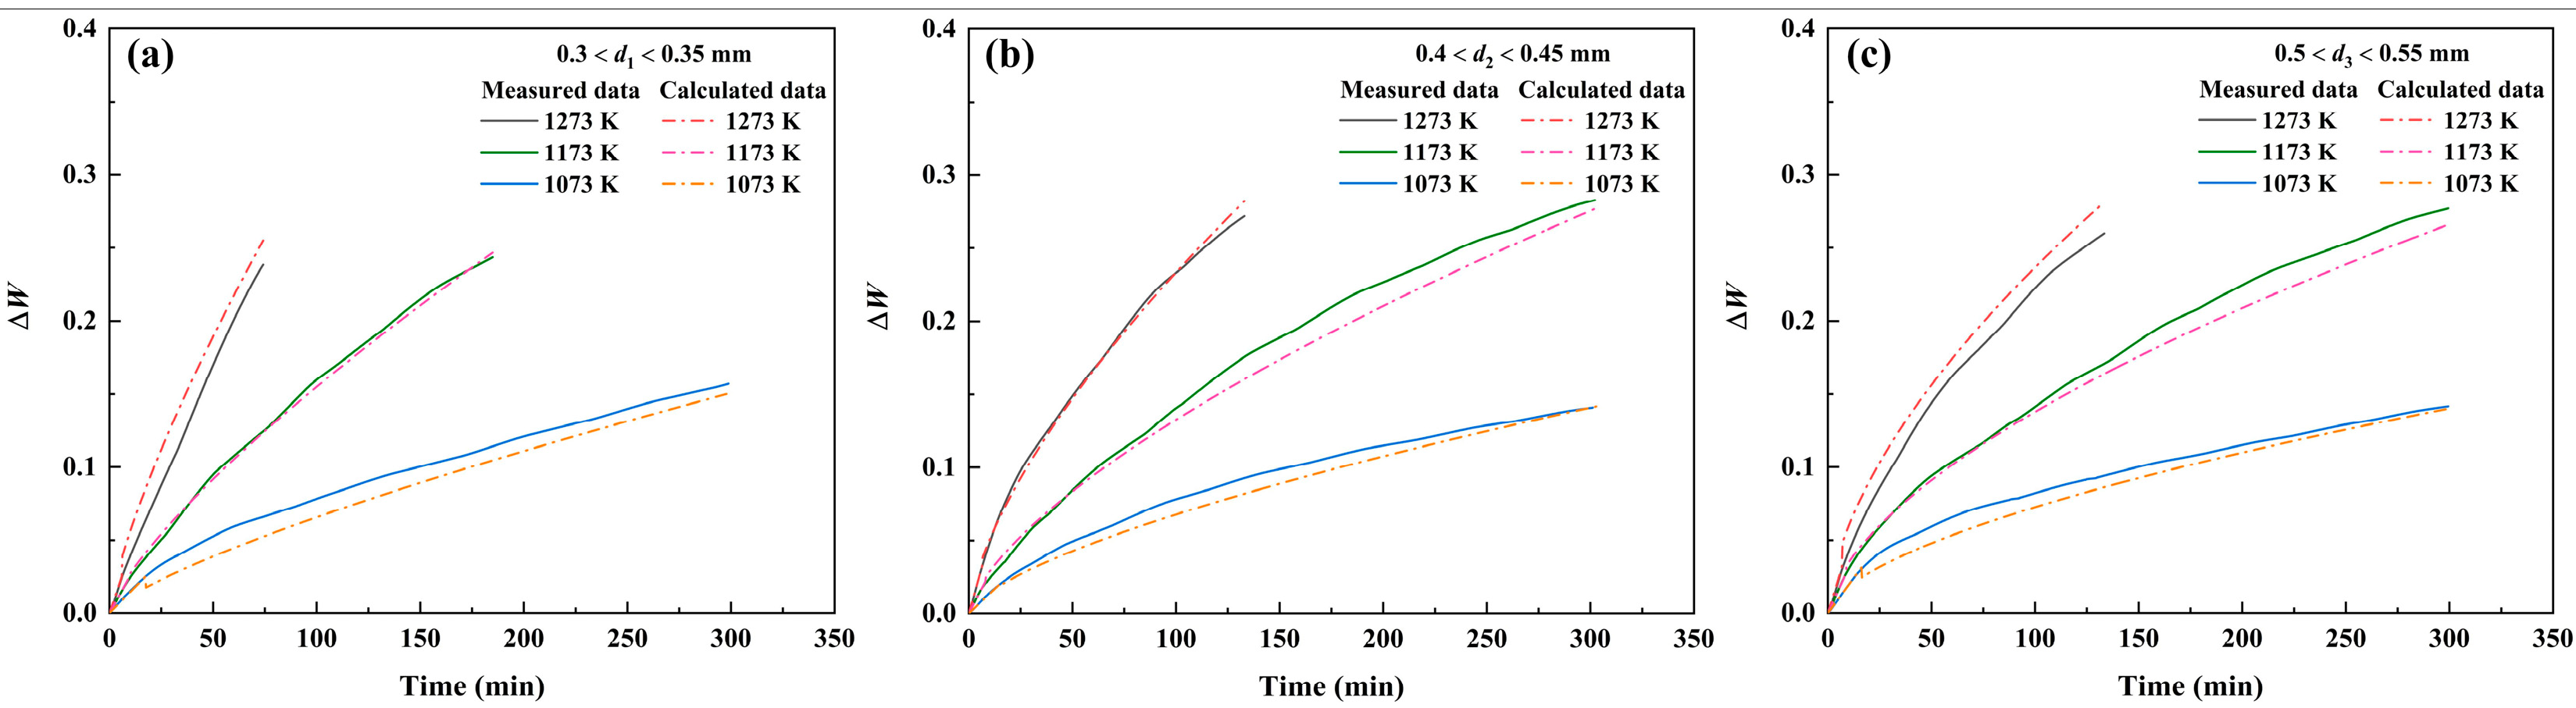
3.2.4. Oxidation Reaction Rate

On the basis of Equations (1) and (4), the oxidation reaction rate of iron powders can be expressed as
W)n = A exp(−E/RT) t,
According to the activation energies and pre-exponential factors of all samples with different sizes in Table 5, the oxidation reaction rate equations are listed in Table 6. Figure 10 shows the comparison between measured data in present experiments and calculated data based on oxidation reaction rate equations.

3.2.5. Discussion

According to isothermal TG analysis of pure iron powders at 1073 K–1273 K, the oxidation of powders ranging from 0.3–0.35 mm to 0.5–0.55 mm under vapor atmosphere are divided into two stages. The relationship between ΔW and t in the first stage follows a linear law, and the oxidation rate of iron powder is controlled by chemical reactions. While the relationship between ΔW and t in the second stage follows mixed rule of linearity and parabola, and the oxidation rate of iron powder is controlled by chemical reaction and internal diffusion. The oxidation rate of pure iron powders under vapor atmosphere increases with increasing temperature and decreasing powder size. As the particle size further decreases or the reaction temperature further increases, the oxidation rate of the powders may only be controlled by the chemical reaction during the entire reaction process. Then, the powders will reach the maximum oxidation degree in a shorter time. From the perspective of granulation process, the cooling effect of water curtain should be enhanced as the granulated powder size decrease.
The performance of the oxidation reaction rate equations is evaluated on the basis of the mean absolute deviation of the approximation curve from the experimental data, which is expressed by the following equation:
Δ = 1 N n = 1 N d i , p r e d d i , m e a s d i , m e a s × 100 %
where di,pred is the unit mass gain of iron powder predicted using the oxidation reaction rate equation, and di,meas is the unit mass gain of iron powder measured in present study. As the reaction temperature increases from 1073 K to 1273 K, the deviations of powders with a diameter of 0.3–0.35 mm are 12.90%, 2.90%, and 21.51%; the average relative errors of powders with a diameter of 0.4–0.45 mm are 7.89%, 5.95%, and 2.33%; the average relative errors of powders with a diameter of 0.5–0.55 mm are 9.05%, 5.04%, and 13.13%.

4. Conclusions

(1)
An oxide layer formed on the granulated powder outer surface consists of Fe3O4 and Fe2O3.
(2)
The oxidation rate of pure iron powders under vapor atmosphere increases with the increasing temperature and decreasing powder size.
(3)
The kinetic mechanism of first stage consistent with the linear law, and the rate-controlling step is a chemical reaction; whereas the kinetic mechanism of second stage consistent with the integrated law of line and parabola, and the rate-controlling step include internal diffusion and chemical reaction.
(4)
For iron powders in the range of 0.3 mm < d1 < 0.35 mm, 0.4 mm < d2 < 0.45 mm, and 0.5 mm < d3 < 0.55 mm, the reaction activation energy at the first oxidation stage is 61.276, 75.119, and 49.919 KJ/mol; the reaction activation energy at the second oxidation stage is 118.648, 105.354, and 111.968 KJ/mol.

Author Contributions

Conceptualization, W.H.; methodology, Z.Y.; formal analysis, W.H., J.C., Y.D. and Z.Y.; investigation, W.H.; resources, W.H.; data curation, W.H.; writing—original draft preparation, J.C. and Y.D.; writing—review and editing, W.H. and Z.Y.; visualization, J.C. and Y.D.; supervision, Z.Y.; project administration, W.H.; funding acquisition, W.H. All authors have read and agreed to the published version of the manuscript.

Funding

This research was funded by Natural Science Foundation Project of Chongqing (No. cstc2021jcyj-msxmX0911), Chongqing Science and Technology Commission (No. sl202100000144).

Data Availability Statement

The original contributions presented in this study are included in the article. Further inquiries can be directed to the corresponding author.

Conflicts of Interest

The authors declare no conflicts of interest.

References

  1. Wang, D.; Chu, J.; Li, J.; Qi, T.; Wang, W. Anti-caking in the production of titanium dioxide using low-grade titanium slag via the NaOH molten salt method. Powder Technol. 2012, 232, 99–105. [Google Scholar] [CrossRef]
  2. Tian, C. A Novel Approach for comprehensive utilization by leaching pyrite cinder with titanium dioxide waste acid by response surface methodology. ACS Omega 2024, 9, 8510–8519. [Google Scholar] [CrossRef]
  3. Narayan, R.; Raju, K. Use of calcined clay as part replacement of titanium dioxide in latex paint formulations. J. Appl. Polym. Sci. 2015, 77, 1029–1036. [Google Scholar] [CrossRef]
  4. Lv, W.; Liu, F.; Chu, M.; Lv, X.; Barati, M. Characterisation of titania slag produced by a novel process: Acidolysis performance. Can. Metall. Q. 2022, 61, 454–463. [Google Scholar] [CrossRef]
  5. Xiong, X.; Wang, Z.; Wu, F.; Li, X.; Guo, H. Preparation of TiO2 from ilmenite using sulfuric acid decomposition of the titania residue combined with separation of Fe3+ with EDTA during hydrolysis. Adv. Powder Technol. 2013, 24, 60–67. [Google Scholar] [CrossRef]
  6. Wu, J.; Xu, B.; Dong, Z.; Zhou, Y.; Xu, L.; Li, G.; Jiang, T. Preparation of high-purity reduced iron powder by Höganäs process from ultra-pure magnetite concentrate. J. Cent. South Univ. 2023, 9, 3006–3020. [Google Scholar] [CrossRef]
  7. Liu, Y.; Niu, S.; Li, F.; Zhu, Y.; He, Y. Preparation of amorphous Fe-based magnetic powder by water atomization. Powder Technol. 2011, 213, 36–40. [Google Scholar] [CrossRef]
  8. Liu, J.; Dong, Y.; Wang, P.; Zhao, H.; Pang, J.; Li, X.; Zhang, J. Simulation and experiment investigations on fabrication of Fe-based amorphous powders by a novel atomization process equipped with assisted gas nozzles. J. Iron Steel Res. Int. 2022, 30, 1142–1155. [Google Scholar] [CrossRef]
  9. Huang, Q.; He, W.; Lv, X. Preparation of iron powders with semi-steel by rotary cup atomizer. J. Iron Steel Res. 2020, 32, 563–570. [Google Scholar]
  10. Mizuochi, T.; Akiyama, T.; Shimada, T.; Kasai, E.; Yagi, J. Feasibility of rotary cup atomizer for slag granulation. ISIJ Int. 2001, 41, 1423–1428. [Google Scholar] [CrossRef]
  11. Sahoo, K.; Kumar, S. Influence of surface and edge profile of a spinning disc on its atomization characteristics in direct drop mode. Chem. Eng. Sci. 2024, 287, 119743. [Google Scholar] [CrossRef]
  12. Xie, J.; Zhao, Y.; Dunkley, J. Effects of processing conditions on powder particle size and morphology in centrifugal atomisation of tin. Powder Metall. 2004, 47, 168–172. [Google Scholar] [CrossRef]
  13. Tan, Y.; Ding, B.; Shi, j.; Yan, H.; Wu, Y.; Wu, J. Modelling the film fragmentation of industrial-scale centrifugal granulation of high-temperature molten slag. Powder Technol. 2023, 426, 118654. [Google Scholar] [CrossRef]
  14. Liu, J.; Yu, Q.; Duan, W.; Qin, Q. Experimental investigation on ligament formation for molten slag granulation. Appl. Therm. Eng. 2014, 73, 888–893. [Google Scholar] [CrossRef]
  15. Plookphol, T.; Wisutmethangoon, S.; Gonsrang, S. Influence of process parameters on SAC305 lead-free solder powder produced by centrifugal atomization. Powder Technol. 2011, 214, 506–512. [Google Scholar] [CrossRef]
  16. Liu, J.; Yu, Q.; Guo, Q. Experimental investigation of liquid disintegration by rotary cups. Chem. Eng. Sci. 2012, 73, 44–50. [Google Scholar] [CrossRef]
  17. Zhu, X.; Zhang, H.; Tan, Y.; Wang, H.; Liao, Q. Analogue experimental study on centrifugal-air blast granulation for molten slag. Appl. Therm. Eng. 2015, 88, 157–164. [Google Scholar] [CrossRef]
  18. Liu, J.; Yu, Q.; Li, P.; Du, W. Cold experiments on ligament formation for blast furnace slag granulation. Appl. Therm. Eng. 2012, 40, 351–357. [Google Scholar] [CrossRef]
  19. Tan, Y.; Chen, X.; Jia, M.; Ding, B.; Wu, J.; Qin, Y. Redefining limits: Impact of nozzle diameter on film flow and atomization beyond the synchronizing radius. Chem. Eng. J. 2025, 505, 159816. [Google Scholar] [CrossRef]
  20. Vourlias, G.; Pistofidis, N.; Chrissafis, K. High-temperature oxidation of precipitation hardening steel. Thermochim. Acta 2008, 478, 28–33. [Google Scholar] [CrossRef]
  21. Kofstad, P.; Hauffe, K.; Kjllesdal, H.; Siekevitz, P.; Diczfalusy, E. Investigation on oxidation mechanism of titanium. Acta Chem. Scand. 1958, 12, 239–266. [Google Scholar] [CrossRef]
  22. Chen, R.; Yeun, W. Review of the high-temperature oxidation of iron and carbon steels in air or oxygen. Oxid. Met. 2003, 59, 433–468. [Google Scholar] [CrossRef]
  23. Yan, R.; Liu, Z.; Chu, M.; Liu, P.; Dang, S.; Li, N.; Li, X. Effect of coke reactivity on reduction behaviours and non-isothermal kinetics of sinter at 1173–1373 K. Ironmak. Steelmak. 2023, 50, 1502–1511. [Google Scholar] [CrossRef]
  24. Wu, M.; Li, Z.; Huang, J.; Wang, Q.; Li, T.; Yang, S.; He, H.; Jiang, Y. Non-isothermal kinetics of coke and iron ore melting reduction with variable activation energy model. Fuel 2024, 357, 129991. [Google Scholar] [CrossRef]
Figure 1. Schematic of granulation experiment.
Metals 15 00553 g001
Figure 2. XRD pattern of iron powder outer surface.
Metals 15 00553 g002
Figure 3. SEM images of iron powders’ cross section: (a) 0.3–0.35 mm; (b) 0.4–0.45 mm; (c) 0.5–0.55 mm.
Metals 15 00553 g003
Figure 4. Variation in weight loss of granulated powders with different sizes.
Metals 15 00553 g004
Figure 5. Unit mass gain of iron powders at 1073, 1173 and 1273 °C: (a) 0.3 < d1 < 0.35 mm; (b) 0.4 < d2 < 0.45 mm; (c) 0.5 < d3 < 0.55 mm.
Metals 15 00553 g005
Figure 6. ln (ΔW)-ln t of iron powders with different sizes at 1073, 1173 and 1273 K: (a) 0.3 < d1 < 0.35 mm; (b) 0.4 < d2 < 0.45 mm; (c) 0.5 < d3 < 0.55 mm.
Metals 15 00553 g006
Figure 7. ΔW-t of iron powders with different sizes at the first oxidation stage: (a) 0.3 < d1 < 0.35 mm; (b) 0.4 < d2 < 0.45 mm; (c) 0.5 < d3 < 0.55 mm.
Metals 15 00553 g007
Figure 8. Data fitting of iron powders with different sizes at the second oxidation stage: (a) 0.3 < d1 < 0.35 mm; (b) 0.4 < d2 < 0.45 mm; (c) 0.5 < d3 < 0.55 mm.
Metals 15 00553 g008
Figure 9. −lnk(T)-1/T curves of iron powders with different sizes at 1073, 1173 and 1273 K: (a) 0.3 < d1 < 0.35 mm; (b) 0.4 < d2 < 0.45 mm; (c) 0.5 < d3 < 0.55 mm.
Metals 15 00553 g009
Figure 10. The comparison between measured result and calculated result about the TG curves: (a) 0.3 < d1 < 0.35 mm; (b) 0.4 < d2 < 0.45 mm; (c) 0.5 < d3 < 0.55 mm.
Metals 15 00553 g010
Table 1. Experimental scheme of isothermal oxidation.
Raw MaterialPowder Size/mmOxidation Temperature/K
Iron powder 10.3 < d1 < 0.35 11073, 1173, 1273
Iron powder 20.4 < d2 < 0.451073, 1173, 1273
Iron powder 30.5 < d3 < 0.551073, 1173, 1273
1 d1, d2, and d3 are the diameters of iron powder 1, iron powder 2, and iron powder 3, respectively.
Table 2. The n values of all samples in different stage and the corresponding Pearson’s r.
Powder Size/mm Periodnr
1073 K1173 K1273 K1073 K1173 K1273 K
0.3 < d1 < 0.35First stage0.9170.8680.7560.9930.9960.998
Second stage1.6161.2551.0920.9990.9990.999
0.4 < d2 < 0.45First stage0.9531.0240.9120.9990.9990.999
Second stage1.6161.3871.4990.9970.9980.998
0.5 < d3 < 0.55First stage0.8610.7940.7650.9930.9940.998
Second stage2.0281.5651.4120.9990.9990.998
Table 3. The k values of all powders and the corresponding Pearson’s r in first stage.
Powder Size/mm Periodk (10−3)r
1073 K1173 K1273 K1073 K1173 K1273 K
0.3 < d1 < 0.35First stage1.462.564.290.9990.9990.999
0.4 < d2 < 0.45First stage1.372.665.160.9990.9980.999
0.5 < d3 < 0.55First stage1.823.244.610.9990.9990.999
Table 4. The k values of all powders and the corresponding Pearson’s r in second stage.
Powder Size/mm Periodk (10−3)r
1073 K1173 K1273 K1073 K1173 K1273 K
0.3 < d1 < 0.35Second stage0.270.882.180.9990.9990.998
0.4 < d2 < 0.45Second stage0.170.521.080.9960.9990.999
0.5 < d3 < 0.55Second stage0.120.410.850.9990.9990.999
Table 5. The activation energy and pre-exponential factor values at different stage.
Powder Size/mm PeriodEA
0.3 < d1 < 0.35First stage61,275.581.39
Second stage118,647.83163.60
0.4 < d2 < 0.45First stage75,119.116.11
Second stage105,354.1023.69
0.5 < d3 < 0.55First stage49,918.790.52
Second stage111,967.8335.52
Table 6. The oxidation reaction rate equations at different stages.
Powder Size/mm PeriodOxidation Reaction Rate Equations
0.3 < d1 < 0.35First stageΔW = 1.39 exp(−61,275.58/RT) t
Second stageW)1.321 = 163.60 exp(−118,647.83/RT) t
0.4 < d2 < 0.45First stageΔW = 6.11 exp(−75,119.11/RT) t
Second stageW)1.501 = 23.69 exp(−105,354.10/RT) t
0.5 < d3 < 0.55First stageΔW = 0.52 exp(−49,918.79/RT) t
Second stageW)1.668 = 35.52 exp(−111,967.83/RT) t
Disclaimer/Publisher’s Note: The statements, opinions and data contained in all publications are solely those of the individual author(s) and contributor(s) and not of MDPI and/or the editor(s). MDPI and/or the editor(s) disclaim responsibility for any injury to people or property resulting from any ideas, methods, instructions or products referred to in the content.

