Abstract
316LN stainless steel (316LN SS) with a gradient structure was produced by ultrasonic surface rolling processing (USRP). The surface quality of the 316LN SS specimen was improved significantly after the USRP. The experimental results showed that with an increasing number of rolling passes, the thickness of the gradient structure layer increased, and the microhardness decreased in a gradient from the surface to the matrix. The results also indicated that the optimal parameters were as follows: 220 rad/min lathe speed, 0.11 mm rolling space, 0.2 rad/min feed rate, and 5 rolling passes. Under these parameters, the tested surface residual compressive stress (SRCS) value was nearly 32 times higher than that achieved after conventional processing on the surface of 316LN stainless steel. Moreover, the microstructure exhibits an increase in the subgrain boundary density and low-angle grain boundaries (LAGBs, misorientation < 15°) of the steel, providing an easy way to enhance the properties, including the mechanical and corrosion resistance of 316LN stainless steel.
1. Introduction
316LN stainless steel (SS) is commonly used to produce primary coolant pipes of third-generation pressurized water reactor (PWR) [1]. However, various failure modes, including pitting corrosion, stress corrosion, and corrosion fatigue, often break out during their prolonged operation in high-temperature and high-pressure circulating water environments [2,3,4]. Failure modes are often influenced by synergistic effects of environment, material properties, and residual stresses [5]. Various surface strengthening techniques, including ultrasonic laser strengthening (UIP), water jet peening (WJP), and laser peening (LP), can be used to refine surface microstructure, thereby prolonging the operational lifespan of the primary coolant pipes produced by 316LN SS and mitigating potential failures [6,7,8,9,10].
USRP represents a recently developed surface strengthening technique. Ultrasonic rolling is different from hydraulic deep rolling. While hydrostatic deep rolling relies on fluid pressure to induce deformation, USRP combines static force with ultrasonic vibrations (20–40 kHz), enabling deeper stress penetration and finer grain refinement. Both techniques improve fatigue resistance, but USRP achieves higher dislocation density due to its high-frequency impacts. Optimal performance outcomes can be attained by fine-tuning USRP parameters, including static force [11,12,13,14], feed rate [12,14], ultrasonic frequency [13,14], rolling spacing [15], and rolling passes [16,17]. Recently, numerous researchers have studied these parameters to achieve excellent performance. For example, Tan et al. [12] investigated the impact of various static forces and feed rates on the surface characteristics and properties of TC17 titanium alloy during USRP. The results indicated that at 1600 N static force and a feed rate of 2500 mm/min, the maximum residual compressive stress was up to 966 MPa. Zhao et al. [14] optimized three variables (static force, ultrasonic frequency, and feed rate) for the USRP of TC 11 titanium alloy, resulting in a higher surface microhardness that was 46.6% greater than the untreated sample. Pape et al. [17] proposed a novel bearing fatigue life prediction model that considers subsurface compressive residual stresses, focusing on the surface properties of rolling contact machine elements. Bearings were machined using hard turning, hard turning followed by deep rolling, and a combined turn-rolling process to study the effect of residual stress changes on fatigue life. The results showed that processing methods involving deep rolling significantly reduced surface roughness and introduced beneficial compressive stresses, increasing the L10 fatigue life of bearings by a factor of 2.5 and thereby providing an effective approach to improving resource efficiency. Based on the aforementioned results, an optimal performance combination can be achieved by optimizing two or three variables. However, the synergistic effect of all factors is often overlooked. Each response factor is directly linked to USRP parameters, including feed rate, ultrasonic frequency, rolling spacing, rolling passes, etc. Studying the combined effects of all parameters leads to higher experimental costs.
The Taguchi method is known for its cost-effectiveness and high efficiency in the field of quality engineering [18,19]. The Taguchi method is a statistical approach designed to optimize process parameters with minimal experimental trials. It employs orthogonal arrays to systematically vary parameters and analyzes signal-to-noise (S/N) ratios to identify optimal conditions. This method is cost-effective and accounts for parameter interactions, making it ideal for industrial applications where resource efficiency is critical. Additionally, it significantly minimizes the required number of experiments and accounts for parameter interactions [20]. Yet, the method to optimize the performance of 316LN SS by manipulating the USRP parameters remains unclear. The present study focuses on the preliminary examination of how lathe speed, amount of rolling (i.e., static force), feed speed, and rolling passes impact the SRCS of 316LN. Table 1 lists the detection values of each group of experiments. The signal-to-noise (S/N) ratios were calculated for each parameter combination, where S/N-1 corresponds to surface roughness optimization and S/N-2 to microhardness maximization.

Table 1.
The L25 orthogonal experimental design and its corresponding results.
2. Materials and Methods
316LN stainless steel was used in this study. The samples with a diameter of 25 mm and a length of 200 mm were cut from the main coolant pipe of the PWR AP1000. Cross-sections were prepared by wire-EDM cutting perpendicular to the rolling direction, mounted in conductive resin, and polished to a 0.05 μm finish. Measurements were taken along the depth axis at 50 μm intervals. Its chemical composition is shown in Table 2. Following turning operations, specimens were sequentially cleaned in acetone (10 min ultrasonic bath) to remove oils, then etched in aqua regia (HCl:HNO3 3:1) for 30 s to eliminate oxides, then air-dried for subsequent use. The USRP was employed in the experiment, utilizing the CKD6140I CNC machine tool in conjunction with the ultrasonic rolling device developed by Qilu University of Technology (Jinan, China). Figure 1a,b illustrate the processing equipment. The ultrasonic rolling device comprises four primary components, i.e., an ultrasonic generator, transducer, horn, and rolling head. The device was operated at a frequency of 28 kHz with an amplitude of 5 μm and utilized a cemented-carbide ball with a diameter of 10 mm [21]. Ultrasonic frequency mechanical vibrations of a specific amplitude were applied along the normal direction of the workpiece surface by the rolling head. These vibrations were transmitted to the rotating workpiece surface under controlled static pressure and feed speed, resulting in significant elastic–plastic deformation on the steel surface. The machining process is illustrated in Figure 1c.

Table 2.
Chemical composition of the 316LN SS (wt.%).
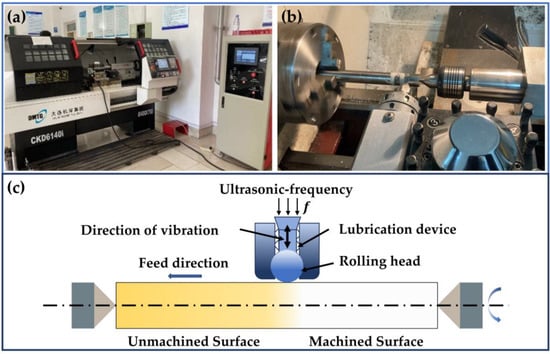
Figure 1.
(a) USRP equipment; (b) machining process; (c) schematic illustration of USRP treatment.
The AutoMATE II X-ray diffractometer (Rigaku Corporation, Tokyo, Japan) was used to measure surface residual stress. It utilized the fixed Ψ0 method for scanning, with the Ψ0 angles automatically selected according to the device’s default settings, comprising a total of seven values. The angles used were −45°, −35°, −25°, 0°, 25°, 35°, and 45°, respectively. Subsequently, the least squares method was employed to fit the measured 2θ and Sin2ψ values in order to determine the stress level. The LEXTOLS4000 laser confocal scanning microscope (Waltham, MA, USA) was employed to measure the surface profile, and the samples were cleaned with acetone and alcohol before measurement to ensure cleanliness. The microstructure of the samples was observed using the Zeiss SUPRATM55 field emission scanning electron microscope (SEM) (Oberkochen, Germany). During the preparation process of SEM and EBSD samples, it was necessary to grind them sequentially using sandpapers up to 2000#, and then they were polished. Finally, they were etched at room temperature (25 °C) with a 10% oxalic acid solution at a voltage of 10 V for 90–120 s and with a 20% perchloric acid ethanol solution at a voltage of 30 V (the current was approximately 1 A) for about 30 s, respectively. After that, they were ultrasonically cleaned with alcohol and deionized water and then blow-dried for backup. The cross-section of the sample was measured using an HV-1000 Vickers hardness tester (Beijing, China) after being gradually ground and polished. A load of 200 N was applied for 15 s, and measurements were taken at three different points at the same depth. Finally, the hardness of the samples was represented by a scatter diagram, and the cylindrical specimens were cut using a wire electrical discharge machining machine. Samples were cut every 10 mm from the areas processed under different machining parameters. During measurement, V-blocks were used for fixing the specimens. Hardness is shown as a function of depth.
3. Results and Discussion
3.1. Surface Morphology
The surface morphologies under selected experimental conditions before and after USRP are depicted in Figure 2a–h. To compare comprehensively and intuitively the changes on the surface morphology of the sample under diverse processing conditions, the workpiece surface contour curve perpendicular to the feed direction is emphasized. The measurement area corresponds to the shaded section in Figure 2, with the profile curve outcome illustrated in Figure 2i. Peak-to-Valley (PV, the variance in the highest and lowest points of a curve) and Root Mean Square (RMS) were used to quantify the characteristic alterations in surface morphology [22]. Specific values are detailed in Table 3. The RMS calculation method is outlined in Equation (1):
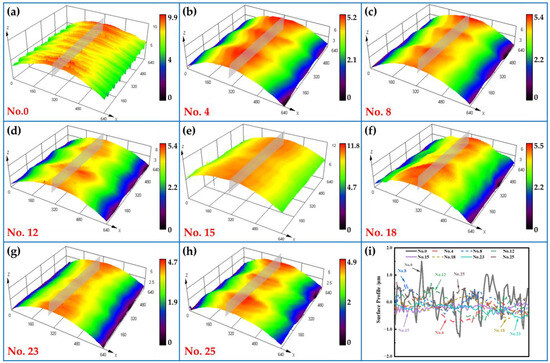
Figure 2.
Surface micro-morphologies of USRP under specific experimental conditions. (a–h) Three-dimensional surface topographies (with the shaded part representing the sampling area); (i) contour curve of the sampled region.

Table 3.
Surface morphology characteristic signals under various processing conditions.
Figure 2a,i demonstrate that upon completion of turning, the surface exhibits prominent marks, substantial depth, and noticeably undulating morphology. Following USRP (Figure 2b–i), irregular surface scratches and grooves, along with other micro-surface defects, are notably eradicated, resulting in an increased distance between adjacent peaks and troughs, ultimately forming a continuous flat surface in the local region.
The alterations in the surface profile characteristics under varied processing conditions are outlined in Table 3. In comparison to the surface profile post-finish turning (No. 0), the PV and RMS values witnessed a reduction after URSP treatment. For sample No. 15, the most significant alterations occurred in the PV (85.0% reduction) and RMS (53.78% reduction) values, respectively. This observation suggested a significant alteration in the workpiece’s surface profile following URSP treatment, though the distinctive features of peaks and troughs remain incompletely eradicated. This incomplete eradication of surface features (Figure 3) occurs because of the iterative cyclic process wherein the rolling head continuously exerts pressure, causing the upward peak of the workpiece surface to compress and leading to the plastic deformation of the material to fill the corresponding valley [23].
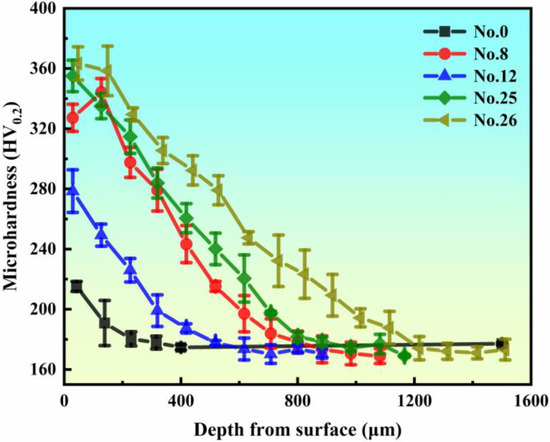
Figure 3.
Microhardness of the sample obtained by turning and USRP.
Figure 3 illustrates the gradient distribution of microhardness in both the original sample and selected samples after USRP. The diagram reveals that the samples subjected to turning (No. 0) and USRP exhibited work-hardening, with microhardness varying on a gradient with depth. The surface microhardness of the USRP-treated sample exceeds that of the turned sample (No. 0) and diminishes with increasing distance from the treated surface. The significant work hardening results from increased plastic deformation in the surface layer due to USRP’s high-frequency impact, leading to the formation of high-density dislocations, grain boundaries, and grain refinement.
3.2. Cross-Section Microstructure Analysis
The cross-sectional morphologies of the original sample and several typical samples after USRP are illustrated in Figure 4. Figure 4a–e present the cross-sectional morphologies of samples No. 0, No. 8, No. 12, No. 25, and No. 26, respectively. The left side shows the surface of the rolled sample, while (f) displays the SEM image of the surface deformation layer of sample No. 12. The results indicate that varying USRP parameters resulted in different deformation layer thicknesses (defined as the region where distinct deformation bands were visible in the cross-sectional structure, which might differ from the thickness of the hardened layer, as shown in the hardness gradient distribution diagram in Figure 3). These variations were closely related to the USRP process, with the deformation directly influencing the degree of hardening, which, in turn, indirectly reflects the magnitude of residual compressive stress; that is, a thicker deformation (hardening) layer corresponds to a higher residual compressive stress value. As noted above, the deformation layer thickness for the optimal process parameter, sample No. 26, was 469.18 μm, which was the largest thickness observed in Figure 4. And its residual compressive stress value (Table 1) was significantly higher than those of the other samples.
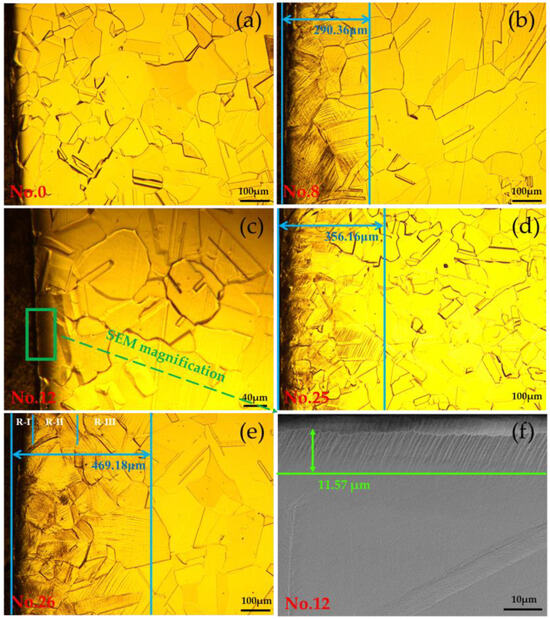
Figure 4.
(a) No. 0, (b) No. 8, (c) No. 12, (d) No. 25, and (e) No. 26 depict grain boundary diagrams, and (f) No. 12 presents a high-rate SEM image. The left surface in these figures is the rolling surface.
The cross-sections of the samples were studied further using scanning electron microscopy (SEM) at a higher magnification, as illustrated in Figure 5. Figure 5a depicts the original sample (No. 0), (b) shows the cross-sectional SEM image of the sample No. 8, (c) presents a locally enlarged view of sample No. 8, (d) represents sample No. 26, and (e), (f), and (g) illustrate the enlarged images of the microstructures of the deformed layer at varying depths from the surface. The figure reveals that numerous mechanical deformation bands were present on the cross-section of the sample following USRP treatment, as depicted in Figure 5c. At depths of 2 μm (Figure 5e), 200 μm (Figure 5f), and 400 μm (Figure 5g) from the surface, deformation bands with varying densities were observed. As depth increased, the density of deformation bands decreased. This phenomenon was attributed to the interaction of various slip bands during plastic deformation following USRP treatment, indicating that the cross-section of the sample developed a gradient structure.
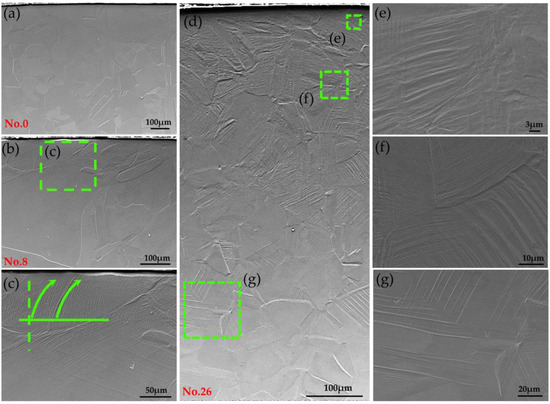
Figure 5.
SEM images of the sample section: (a) No. 0, (b) No. 8, (c) a local area of No. 8, (d) No. 26, and (e–g) represent images taken at depths of 2 μm, 200 μm, and 400 μm from the surface, respectively.
Figure 6a,b present the inverse pole figure (IPF) and the corresponding Grain Reference Orientation Deviation (GROD) for specimens No. 0 and No. 25, respectively. Figure 6a shows that the original sample exhibits irregular austenite grains and some annealing twins. The high strain resulted in the area near the surface of the USRP sample being unindexed. The USRP sample and the original sample (No. 0) exhibit similar grain size and morphology away from the rolling surface, indicating that the USRP process altered the microstructure primarily around the rolling surface. The GROD maps in Figure 6a1,b1 display the local orientation distribution within the grains, reflecting the deformation of the grains. Similarly, the local misorientation of grains is predominantly concentrated around the rolling surface, with greater grain deformation observed closer to the machined surface. A minimal change in GROD is observed in the undeformed sample (No. 0), suggesting the presence of a partial dislocation substructure post-material formation. Following plastic deformation via USRP, there is a significant increase in the local GROD values within the grains. Several strip-like aggregations of misorientation were observed. These aggregations represented slip bands consisting of multiple slip surfaces that interact with grain boundaries, resulting in the formation of ‘dislocation blooms’ near the boundaries [24].
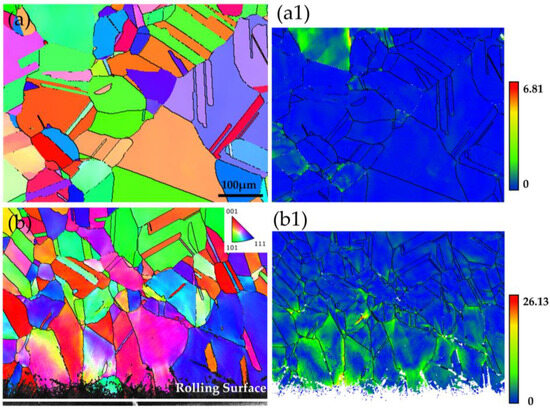
Figure 6.
No. 0 and No. 25 cross-sectional EBSD analyses; (a,b) IPF maps indicating changes in crystal orientation; and (a1,b1) GROD maps visualizing the distribution of grain deformation.
The grain boundaries of 316LN stainless steel (Figure 7a) could also be altered by making use of USRP treatment. The diagram illustrates the grain boundary characteristics of various USRP-treated samples and the distribution of different grain boundary types. Misorientation angles ranging from 2° to 15° were classified as low-angle grain boundaries (LAGBs). Misorientation angles greater than 15° are classified as high-angle grain boundaries (HAGBs) [25]. The high-angle grain boundaries (HAGBs) constituted 97.5%, and twin boundaries (TBs) account for 68.4% (with the percentage of twins calculated from the total coincidence lattice grain boundaries) in the unrolled sample, while the small-angle grain boundaries (LAGBs) comprised only 2.5%. For sample No. 12 with a lower degree of deformation, the proportions of LAGBs and HAGBs were 5.81% and 94.2%, respectively, and the proportion of twin crystal (TB) was similar to that of No. 0. As the degree of deformation increases, a transition from HAGBs to LAGBs occurs, as illustrated in Figure 7b–e. The high-density LAGBs observed in the sample after USRP treatment were concentrated around the HAGB grains. Furthermore, with increasing deformation, the original HAGBs significantly diminished while LAGBs increased. LAGB, referred to as a dislocation-type grain boundary [26], is formed by the accumulation of full dislocation slip. This indicates that the increase in the fraction of LAGBs is attributed to dislocation accumulation and the formation of subgrain boundaries resulting from the severe plastic deformation induced by USRP. It is important to note that the dark area in Figure 7c represents a defect in the cross-section. These defects are attributable to impurities introduced during the sample preparation process, which adversely affect the quality of the EBSD analysis.
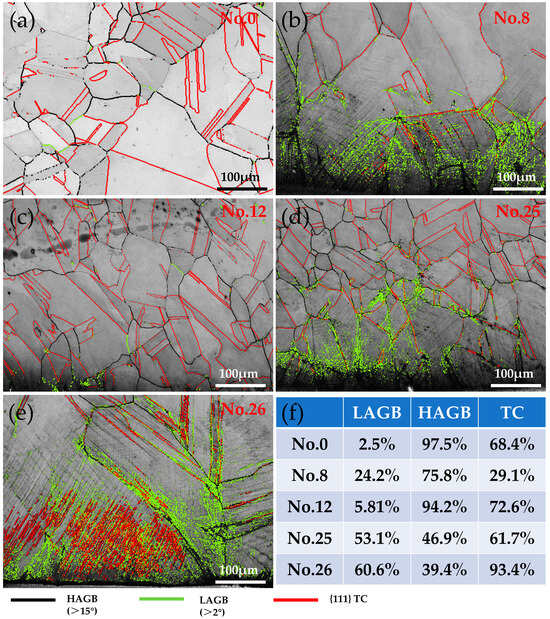
Figure 7.
(a) No. 0, (b) No. 8, (c) No. 12, (d) No. 25, and (e) No. 26 grain boundary diagrams and (f) misorientation angle distribution statistics.
However, a TB content of 93.4% was observed in sample No. 26, significantly higher than in other samples. These twins exhibit a pronounced alignment along the rolling direction, suggesting that they may be mechanical twins. Therefore, it can be inferred that due to the numerous slip systems and low stacking fault energy (SFE) of the austenite in 316LN, when the rolling force applied by the USRP process reaches the critical stress required for FCC iron twin nucleation, these twins contribute to the plastic deformation process and increase in quantity.
Residual compressive stress is a macroscopic manifestation of the microstructure. During the USRP, the irregular austenite grains on the surface of the sample undergo plastic deformation due to the high-frequency impact force and static pressure from the rolling head, which induces relative motion between the grains and results in a high dislocation density. Driven by the rolling force, dislocations continue to slip and migrate, forming numerous low-angle grain boundaries. High-density dislocations are inevitably pinned by grain boundaries, second-phase particles, or other dislocations during their movement, leading to local stress concentrations at dislocation pinning sites, particularly at grain boundaries. Upon cessation of rolling, the high-energy state within the grains dissipates local stress through lattice rearrangement, thereby resulting in the formation of a uniform compressive stress layer on the surface of the steel.
3.3. Residual Stress Analysis
As can be seen from Table 1, when other parameters remain constant, changes in the lathe speed can alter the heating conditions of the workpiece and the material deformation rate during the ultrasonic rolling process [27]. When the rolling amount is 0.03 mm, the feed rate is 0.2 mm/r, and the number of rolling passes is 9; as the lathe speed increases from 100 r/min to 180 r/min, the residual compressive stress increases from 552.06 MPa to 1029.74 MPa. However, when the speed further increases to 260 r/min, the residual compressive stress drops to 943.01 MPa. At lower speeds, the energy transferred to the workpiece surface per unit time is relatively low, resulting in insufficient material deformation and a relatively small residual compressive stress. As the speed increases, more energy is input, and the material undergoes more significant plastic deformation, causing the residual compressive stress to increase to some extent [28]. Nevertheless, an excessively high speed can cause a rapid increase in the workpiece surface temperature, leading to material softening or even annealing, which offsets part of the residual compressive stress and causes a decrease in its value. Regarding the rolling amount, its magnitude directly determines the pressure applied to the workpiece surface and the degree of material plastic deformation. When the lathe speed is 100 r/min and the feed rate is 0.1 mm/r, as the rolling amount increases from 0.03 mm to 0.05 mm, the residual compressive stress surges from 552.06 MPa to 1223.49 MPa. But when the rolling amount is further increased to 0.09 mm, the residual compressive stress drops to 763.56 MPa. An appropriate increase in the rolling amount can cause more intense plastic deformation in the material surface layer, increase the dislocation density, and thus form a higher residual compressive stress [29]. However, when the rolling amount is too large, the material surface may experience excessive deformation, leading to a decline in surface quality and damage to the internal organizational structure, which instead weakens the residual compressive stress [30].
The feed rate affects the contact time between the rolling tool and the workpiece surface and the force distribution. A lower feed rate means that the rolling tool acts on a unit area for a longer time, enabling more sufficient plastic deformation of the material and contributing to the formation of a higher residual compressive stress. Conversely, an excessively high feed rate results in insufficient action of the rolling tool on the workpiece surface, non-uniform material deformation, and a reduction in the residual compressive stress. An increase in the number of rolling passes can, to a certain extent, accumulate the plastic deformation of the material and gradually increase the residual compressive stress [31]. However, when the number of rolling passes is excessive, the material surface may experience work-hardening fatigue due to repeated processing, leading to the accumulation of internal damage in the material, and the residual compressive stress may no longer increase or even decrease.
Looking at the data as a whole, in Experiment 2 (lathe speed 100 r/min, rolling amount 0.05 mm, feed rate 0.15 mm/r, number of rolling passes 3), the residual compressive stress reaches 1223.49 MPa; in Experiment 6 (lathe speed 140 r/min, rolling amount 0.03 mm, feed rate 0.15 mm/r, number of rolling passes 5), the residual compressive stress is 1453.43 MPa; in Experiment 18 (lathe speed 220 r/min, rolling amount 0.07 mm, feed rate 0.1 mm/r, number of rolling passes 7), the residual compressive stress is 1295.02 MPa, etc. The residual compressive stress values corresponding to these data points are relatively high. If the goal is solely to obtain the maximum residual compressive stress, the parameter combination in Experiment 6 (lathe speed 140 r/min, rolling amount 0.03 mm, feed rate 0.15 mm/r, number of rolling passes 5) stands out within the scope of this experiment, with a residual compressive stress reaching 1453.43 MPa. However, the actual optimal parameter set cannot be determined solely based on the residual compressive stress index. Multiple factors, such as processing efficiency, surface quality, and production costs, need to be comprehensively considered. For example, although certain parameter combinations can generate a high residual compressive stress, if they require an excessive number of rolling passes or a low feed rate, it will significantly reduce the processing efficiency and increase production costs, and they may not be the optimal choice in actual production. Therefore, in practical applications, the optimal ultrasonic rolling process parameters should be determined by weighing various factors according to specific production requirements and process specifications.
4. Conclusions
- (1)
- Through Taguchi experimental design, the optimal parameters for improving the microstructure of 316LN SS were determined as follows: the lathe speed was 220 rad/min, the space of rolling was 0.11 mm, the feed rate was 0.2 rad/min, and the number of rolling passes was 5. Among them, rolling passes exerted the most significant influence on the SRCS. Under these optimal parameters, the tested SRCS value was nearly 32 times higher than that achieved after conventional processing on the surface of 316LN stainless steel.
- (2)
- Dislocation slip, movement, and even the formation of deformation twins occurred during the plastic deformation under the ultrasonic surface rolling process. The microstructure exhibits an increase in subgrain boundary density and LAGBs. The combined effect of these features is beneficial in improving the properties of 316LN stainless steel.
- (3)
- When the rolling experiment parameters of the sixth group are selected (lathe speed of 140 r/min, rolling amount 0.03 mm, feed rate of 0.15 mm/r, and number of rolling passes 5), the surface residual compressive stress reaches its maximum value, approximately 1453.43 MPa. At this time, relatively speaking, not only can a relatively fast processing rate be achieved, but the maximum residual stress and a good processing effect can also be obtained.
- (4)
- The surface roughness of specimens after ultrasonic surface rolling processing (USRP) can be reduced by up to 85%, demonstrating the potential application of USRP in nuclear pipeline systems where surface roughness would otherwise accelerate corrosion.
Author Contributions
L.J.: Conceptualization; software; validation; formal analysis; investigation; data curation; writing—original draft preparation; project administration; X.F.: software; validation; data curation; supervision; H.W.: data curation; supervision; G.S.: validation; data curation; B.Y.: conceptualization; editing; supervision; project administration; funding acquisition. All authors have read and agreed to the published version of the manuscript.
Funding
This study was financially supported by the Key R&D Program of Shandong Province (No. 2021CXGC010209), the Fundamental Research Funds for the Central Universities (No. FRF-BD-23-01), Natural Science Foundation of Shandong Province (No. ZR2022ME218) and Nuclear Technology Support Center, State Administration of Science, Technology and Industry for National Defence.
Data Availability Statement
The original contributions presented in this study are included in the article. Further inquiries can be directed to the corresponding author.
Conflicts of Interest
Author Huanchun Wu was employed by the Suzhou Nuclear Power Research Institute Co., Ltd. The remaining authors declare that the research was conducted in the absence of any commercial or financial relationships that could be construed as a potential conflict of interest.
References
- Chen, X.; Dai, X.; Qian, H.; Yang, B.; Zhao, J. Effects of surface nanocrystallization on the oxide film formed on 316LN stainless steel in a high-temperature aqueous environment. Mater. Corros. 2022, 73, 125–133. [Google Scholar] [CrossRef]
- Chen, X.; Li, Y.; Zhu, Y.; Bai, Y.; Yang, B. Improved corrosion resistance of 316LN stainless steel performed by rotationally accelerated shot peening. Appl. Surf. Sci. 2019, 481, 1305–1312. [Google Scholar] [CrossRef]
- Xiong, Z.; Wang, Y.; Yang, B.; Wang, Y. Stress corrosion cracking of 316LN stainless steel with orthogonal scratches. J. Mater. Res. Technol. 2023, 24, 10040–10052. [Google Scholar] [CrossRef]
- Li, Y.; Cockings, H.; Mignanelli, P.M.; Whittaker, M.; Cockings, B.J.; Buckingham, R.; Bache, M.R. High temperature corrosion-fatigue behavior of a shot peened nickel based superalloy. Corros. Sci. 2022, 207, 110577. [Google Scholar] [CrossRef]
- Yu, L.; Saida, K.; Araki, H.; Sugita, K.; Mizuno, M.; Nishimoto, K.; Chigusa, N. Mechanism for stress relaxation behavior of the residual stress improving treatments with water jet peening and buffing. Mater. Sci. Eng. A 2020, 796, 140221. [Google Scholar] [CrossRef]
- John, M.; Ralls, A.M.; Misra, M.; Menezes, P.L. Effect of ultrasonic impact peening on stress corrosion cracking resistance of austenitic stainless-steel welds for nuclear canister applications. J. Nucl. Mater. 2023, 584, 154590. [Google Scholar] [CrossRef]
- Ming, T.; Xue, H.; Zhang, T.; Han, Y.; Peng, Q. Improving the corrosion and stress corrosion cracking resistance of 316 L stainless steel in high temperature water by water jet cavitation peening. Surf. Coat. Technol. 2022, 438, 128420. [Google Scholar] [CrossRef]
- Okimura, K.; Konno, T.; Narita, M.; Ohta, T.; Toyoda, M. Reliability of water jet peening as residual stress improvement method for alloy 600 PWSCC mitigation. In Proceedings of the 16th International Conference on Nuclear Engineering, Orlando, FL, USA, 11–15 May 2008; Volume 2008, pp. 565–570. [Google Scholar]
- Ji, W.; Zhou, R.; Vivegananthan, P.; See Wu, M.; Gao, H.; Zhou, K. Recent progress in gradient-structured metals and alloys. Prog. Mater. Sci. 2023, 140, 101194. [Google Scholar] [CrossRef]
- Lei, Y.B.; Wang, Z.B.; Zhang, B.; Luo, Z.P.; Lu, J.; Lu, K. Enhanced mechanical properties and corrosion resistance of 316L stainless steel by pre-forming a gradient nanostructured surface layer and annealing. Acta Mater. 2021, 208, 116773. [Google Scholar] [CrossRef]
- Xu, Q.; Jiang, D.; Zhou, J.; Qiu, Z.; Yang, X. Enhanced corrosion resistance of laser additive manufactured 316L stainless steel by ultrasonic surface rolling process. Surf. Coat. Technol. 2023, 454, 129187. [Google Scholar] [CrossRef]
- Tan, L.; Zhang, D.; Yao, C.; Ren, J. Effects of ultrasonic surface rolling parameters on surface integrity of TC17 alloy. J. Mater. Eng. Perform. 2019, 28, 6736–6745. [Google Scholar] [CrossRef]
- Li, G.; Qu, S.G.; Pan, Y.X.; Li, X.Q. Effects of the different frequencies and loads of ultrasonic surface rolling on surface mechanical properties and fretting wear resistance of HIP Ti–6Al–4V alloy. Appl. Surf. Sci. 2016, 389, 324–334. [Google Scholar] [CrossRef]
- Zhao, X.; Xue, G.; Liu, Y. Gradient crystalline structure induced by ultrasonic impacting and rolling and its effect on fatigue behavior of TC11 titanium alloy. Results Phys. 2017, 7, 1845–1851. [Google Scholar] [CrossRef]
- Teimouri, R.; Liu, Z.; Wang, B. Analytical modeling of surface generation in ultrasonic ball burnishing including effects of indentation pile-up/sink-in and chipping fracture. Arch. Civ. Mech. Eng. 2020, 20, 144. [Google Scholar] [CrossRef]
- Xu, X.; Liu, D.; Zhang, X.; Liu, C.; Liu, D.; Ma, A. Effects of ultrasonic surface rolling on the localized corrosion behavior of 7B50-T7751 aluminum alloy. Materials 2020, 13, 738. [Google Scholar] [CrossRef] [PubMed]
- Pape, F.; Maiss, O.; Denkena, B.; Poll, G. Enhancement of roller bearing fatigue life by innovative production processes. Ind. Lubr. Tribol. 2019, 71, 370–377. [Google Scholar] [CrossRef]
- Song, C.; Wang, H.; Sun, Z.; Wei, Z.; Yu, H.; Chen, H.; Wang, Y. Optimization of process parameters using the Grey-Taguchi method and experimental validation in TRIP-assisted steel. Mater. Sci. Eng. A 2020, 777, 139084. [Google Scholar] [CrossRef]
- Taguchi, G.; Chowdhury, S.; Wu, Y. Appendix A: Orthogonal arrays and linear graphs: Tools for Quality Engineering. In Taguchi’s Quality Engineering Handbook; John Wiley & Sons: Hoboken, NJ, USA, 2007. [Google Scholar]
- Girish, B.M.; Satish, B.M.; Sarapure, S.; Basawaraj. Optimization of wear behavior of magnesium alloy AZ91 hybrid composites using Taguchi experimental design. Metall. Mater. Trans. A 2016, 47, 3193–3200. [Google Scholar] [CrossRef]
- Cheng, Y.; Wang, Y.; Wang, Z.; Huang, P.; Zhang, P.; Guo, Q. Ultrasonic surface rolling strengthening and its parameter optimization on bearing raceway. Mater. Des. 2023, 232, 112156. [Google Scholar] [CrossRef]
- Sobri, M.; Shuhaimi, A.; Hakim, K.M.; Mamat, M.H.; Najwa, S.; Mazwan, M.M.; Ameera, N.; Musa, M.Z.; Rusop, M. Effect of annealing on surface of Nickel (Ni)/Indium Tin Oxide (ITO) nanostructures measured by Atomic Force Microscopy (AFM). Adv. Mater. Res. 2013, 832, 51–55. [Google Scholar] [CrossRef]
- Wu, D.; Lv, H.; Wang, H.; Yu, J. Surface micro-morphology and residual stress formation mechanisms of near-net-shaped blade produced by low-plasticity ultrasonic rolling strengthening process. Mater. Des. 2022, 215, 110513. [Google Scholar] [CrossRef]
- Gussev, M.N.; Leonard, K.J. In situ SEM-EBSD analysis of plastic deformation mechanisms in neutron-irradiated austenitic steel. J. Nucl. Mater. 2019, 517, 45–56. [Google Scholar] [CrossRef]
- Li, X.; Guan, B.; Wang, Y.-L.; Wei, Y.-L.; Li, B. Ascertaining the microstructural evolution and strengthening mechanisms of the gradient nanostructured pure titanium fabricated by ultrasonic surface rolling process. Surf. Coat. Technol. 2023, 473, 130047. [Google Scholar] [CrossRef]
- Tao, H.; Zhou, C.; Zheng, Y.; Hong, Y.; Zheng, J.; Zhang, L. Anomalous evolution of corrosion behaviour of warm-rolled type 304 austenitic stainless steel. Corros. Sci. 2019, 154, 268–276. [Google Scholar] [CrossRef]
- Bernoulli, D.; Cao, S.C.; Lu, J.; Dao, M. Enhanced repeated frictional sliding properties in 304 stainless steel with a gradient nanostructured surface. Surf. Coat. Technol. 2018, 339, 14–19. [Google Scholar] [CrossRef]
- Zhu, R.; Zhang, X.; Huang, P.; Wang, X.; Wang, X. Impact of surface ultrasonic rolling on cavitation erosion behavior of 304 stainless steel. Surf. Coat. Technol. 2020, 383, 125280. [Google Scholar]
- Jayalakshmi, M.; Huilgola, P.; Bhat, B.R.; Bhat, K.U. Insights into formation of gradient nanostructured (GNS) layer and deformation induced martensite in AISI 316 stainless steel subjected to severe shot peening. Surf. Coat. Technol. 2018, 344, 295–302. [Google Scholar] [CrossRef]
- Ghosh, S.; Bibhanshu, N.; Suwas, S.; Chatterjee, K. Surface mechanical attrition treatment of additively manufactured 316L stainless steel yields gradient nanostructure with superior strength and ductility. Mater. Sci. Eng. A 2021, 820, 141540. [Google Scholar] [CrossRef]
- Ralls, A.M.; Baldwin, C.; She, Y.; Wang, X.; Jiang, Y.; Menezes, P.L. Assessing the tribo-corrosion resistance of surface nanostructured stainless-steel. Surf. Coat. Technol. 2024, 483, 130755. [Google Scholar] [CrossRef]
Disclaimer/Publisher’s Note: The statements, opinions and data contained in all publications are solely those of the individual author(s) and contributor(s) and not of MDPI and/or the editor(s). MDPI and/or the editor(s) disclaim responsibility for any injury to people or property resulting from any ideas, methods, instructions or products referred to in the content. |
© 2025 by the authors. Licensee MDPI, Basel, Switzerland. This article is an open access article distributed under the terms and conditions of the Creative Commons Attribution (CC BY) license (https://creativecommons.org/licenses/by/4.0/).