Article

Springback Control of Profile by Multi-Point Stretch-Bending and Torsion Automatic Forming Based on FE-BPNN

by
Yu Wen
,
Jicai Liang
,
Yi Li
and
Ce Liang
*
Key Laboratory of Automobile Materials, Ministry of Education, College of Materials Science and Engineering, Jilin University, Changchun 130025, China
*
Author to whom correspondence should be addressed.
Metals 2025, 15(5), 544; https://doi.org/10.3390/met15050544
Submission received: 8 April 2025 / Revised: 9 May 2025 / Accepted: 13 May 2025 / Published: 14 May 2025

Abstract

:
Springback control is a critical factor in profile stretch-bending-torsion forming. A new stretch-bending-torsion automatic forming method based on the mixture of finite element and BP neural network (FE-BPNN) is proposed. The method enhances the shape accuracy of profiles after single-step forming. Initially, the study introduces the 3D multi-point stretch-bending and torsion (3D MPSBT) forming machine and its forming principles. Subsequently, it details the springback prediction method and automatic forming control approach based on BPNN. A springback control model is established through numerical simulation and experiments. The proposed springback control method is compared with a springback factor-based approach from other researchers using hollow rectangular profiles undergoing combined bending and torsion deformation as the research object. The results validate the effectiveness and advantages of the proposed method.

1. Introduction

Lightweight design is a vital pathway for energy conservation and emission reduction, making it a prominent research focus in recent years. Lightweighting strategies primarily involve material design, structural design, and system-level optimization [1]. Due to its low density and ease of processing, aluminum alloys are widely used in transportation applications [2]. Among aluminum alloy components, bent aluminum profiles, often employed as structural elements, minimize system weight while enhancing structural strength. Typical profile bending methods include stretch-bending, roll-bending, free bending [3], and extrusion bending. However, aluminum profiles exhibit elastic recovery or springback upon unloading, leading to shape inaccuracies. Thus, effective springback prediction and control are key research areas in profile bending forming.
From a process perspective, Chatti et al. [4] reduced springback by superimposing stresses during forming and applying roller-induced compression to bent sections before unloading. Xu et al. [5] proposed a continuous extrusion bending forming process that reduces springback by altering stress distributions. From an analytical perspective, Zhao et al. [6] developed a theoretical model for springback in small-curvature planar bending using classical elastoplastic theory and strain superposition principles, meeting engineering application needs. Yu et al. [7] built a springback model for L-shaped steel profiles in rotary stretch-bending, analyzing the effects of pre-stretching and post-stretching on springback angles. Zhao et al. [8] established a mechanical model for the stretch-bending of arbitrary cross-section profiles. It provides an analytical solution for planar springback based on stress and strain distribution across the cross-section. Ma et al. [9] developed a full-moment (FM) model for predicting springback in stretch-bent profiles, validated through experiments and simulations on hollow rectangular aluminum profiles.
However, these analytical methods have limitations. They often neglect the additional effects of molds, simplify material models, or assume specific cross-sectional shapes. A universal analytical model for springback is challenging to establish for complex cross-sections and large deformations. Neural networks, excelling in classification, regression, and prediction tasks, overcome computational difficulties arising from complex part geometries. For sheet metal springback prediction, Fu et al. [10] combined genetic algorithms (GA) with BPNN to develop a springback prediction model for high-strength steel gas-bending, achieving satisfactory accuracy in press brake design applications. Ruan et al. [11] optimized BPNN weights using GA, applying the GA-BP model to predict springback in complex sheet metal parts, achieving relative errors between 0.24% and 9.62%, compared to 0.33% to 23.59% for BPNN alone. Xu et al. [12] integrated GA, particle swarm optimization (PSO), and improved PSO with BPNN, achieving high prediction accuracy (R2 = 0.98, MSE = 0.021, MRE = 1.92%) while demonstrating computational efficiency, albeit with limited experimental data (28 samples). Mrabti et al. [13] used artificial neural networks (ANN) for sheet metal deep-drawing springback prediction, optimizing process parameters via PSO to reduce springback by 90%. Hou et al. [14] proposed a springback prediction method for cylindrical cups using dimensionality-reduction neural networks, showing reduced training time and uncertainty compared to deep neural networks.
In tube or profile applications, neural networks have seen limited use. Kongnoo et al. [15] studied the effect of activation functions on neural network accuracy for predicting tube bending springback angles, achieving optimal performance (R2 = 99.42%, MSE = 0.0019) with a Sigmoid function and 98 neurons in the hidden layer. Wang et al. [16] introduced a geometry/process-integrated Graph Neural Network framework for grid-based tube bending springback simulation, achieving finite element-level accuracy and extending its application to V-bend springback in sheets. Ha et al. [17] trained ANN models for rectangular tube bending springback using data from experiments and analytical methods, achieving higher prediction accuracy than models trained on experimental data alone.
While most studies apply neural networks to predict springback in one-dimensional deformations of sheets or profiles, this paper develops an FE-BPNN-based springback model for 3D MPSBT of hollow rectangular aluminum profiles. The model incorporates wall thickness, horizontal and vertical bending radii, and torsion angles to predict springback in the x and y directions. It is integrated into the motion control system of multi-point die heads, enabling rapid forming and springback control. Additionally, the proposed method is compared with Chen et al.’s [18] springback factor-based approach, highlighting its advantages.

2. Automatic Control Process and Methods for Multi-Point Stretch-Bending-Torsion of Profiles

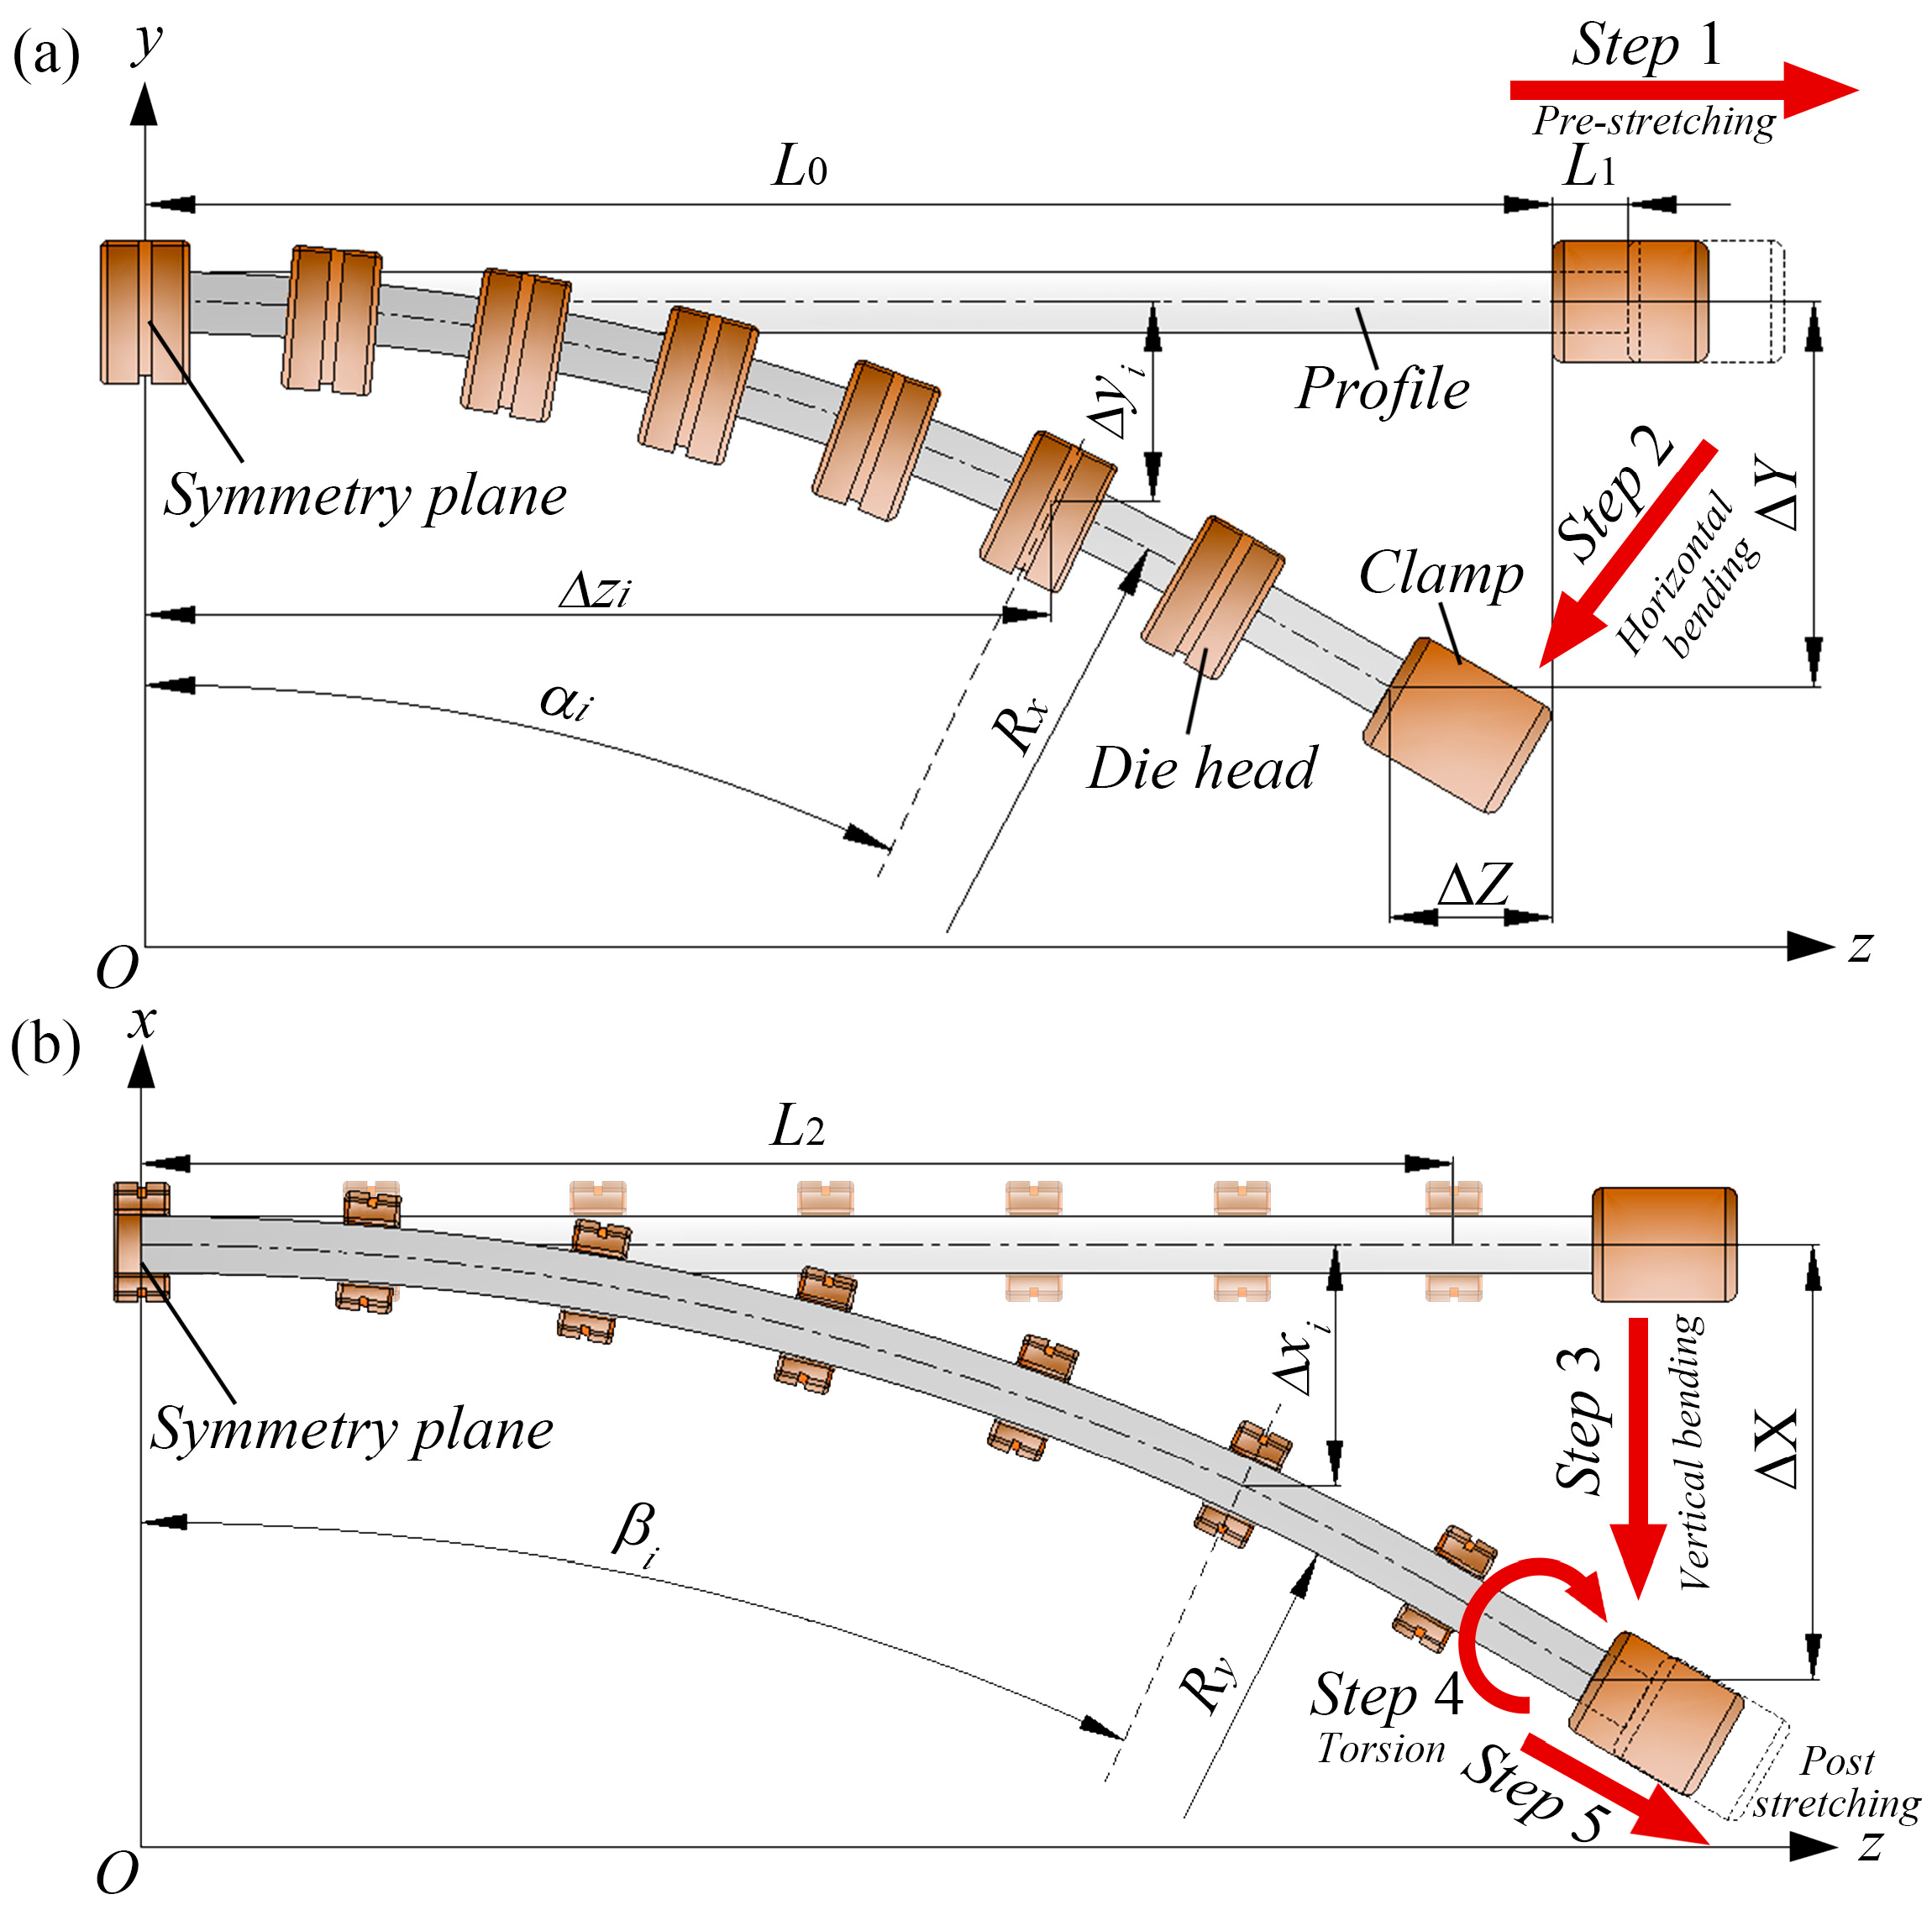
2.1. Multi-Point Stretch-Bending-Torsion Forming Process

Figure 1 shows the machine for the 3D MPSBT combined deformation of profiles. The process begins with pre-stretching the profile along Axis-3 using clamps at both ends. The clamps rotate about Axis-2 to achieve horizontal bending in the Oxz plane. Next, the clamps move along Axis-2, rotating about Axis-4 to complete vertical bending in the Oyz plane. After bending, the clamps rotate around Axis-5 to induce torsion about the profile’s axis, followed by a translational motion along Axis-5 to finalize the post-stretching phase. The movements of the die units and the die heads during these stages are controlled by servo motors. Figure 2 illustrates the profile-forming steps, which serve as the basis for analysis in Section 2.2. Due to the symmetry of bending and torsion along the profile’s length, only half of the profile is considered for the study.

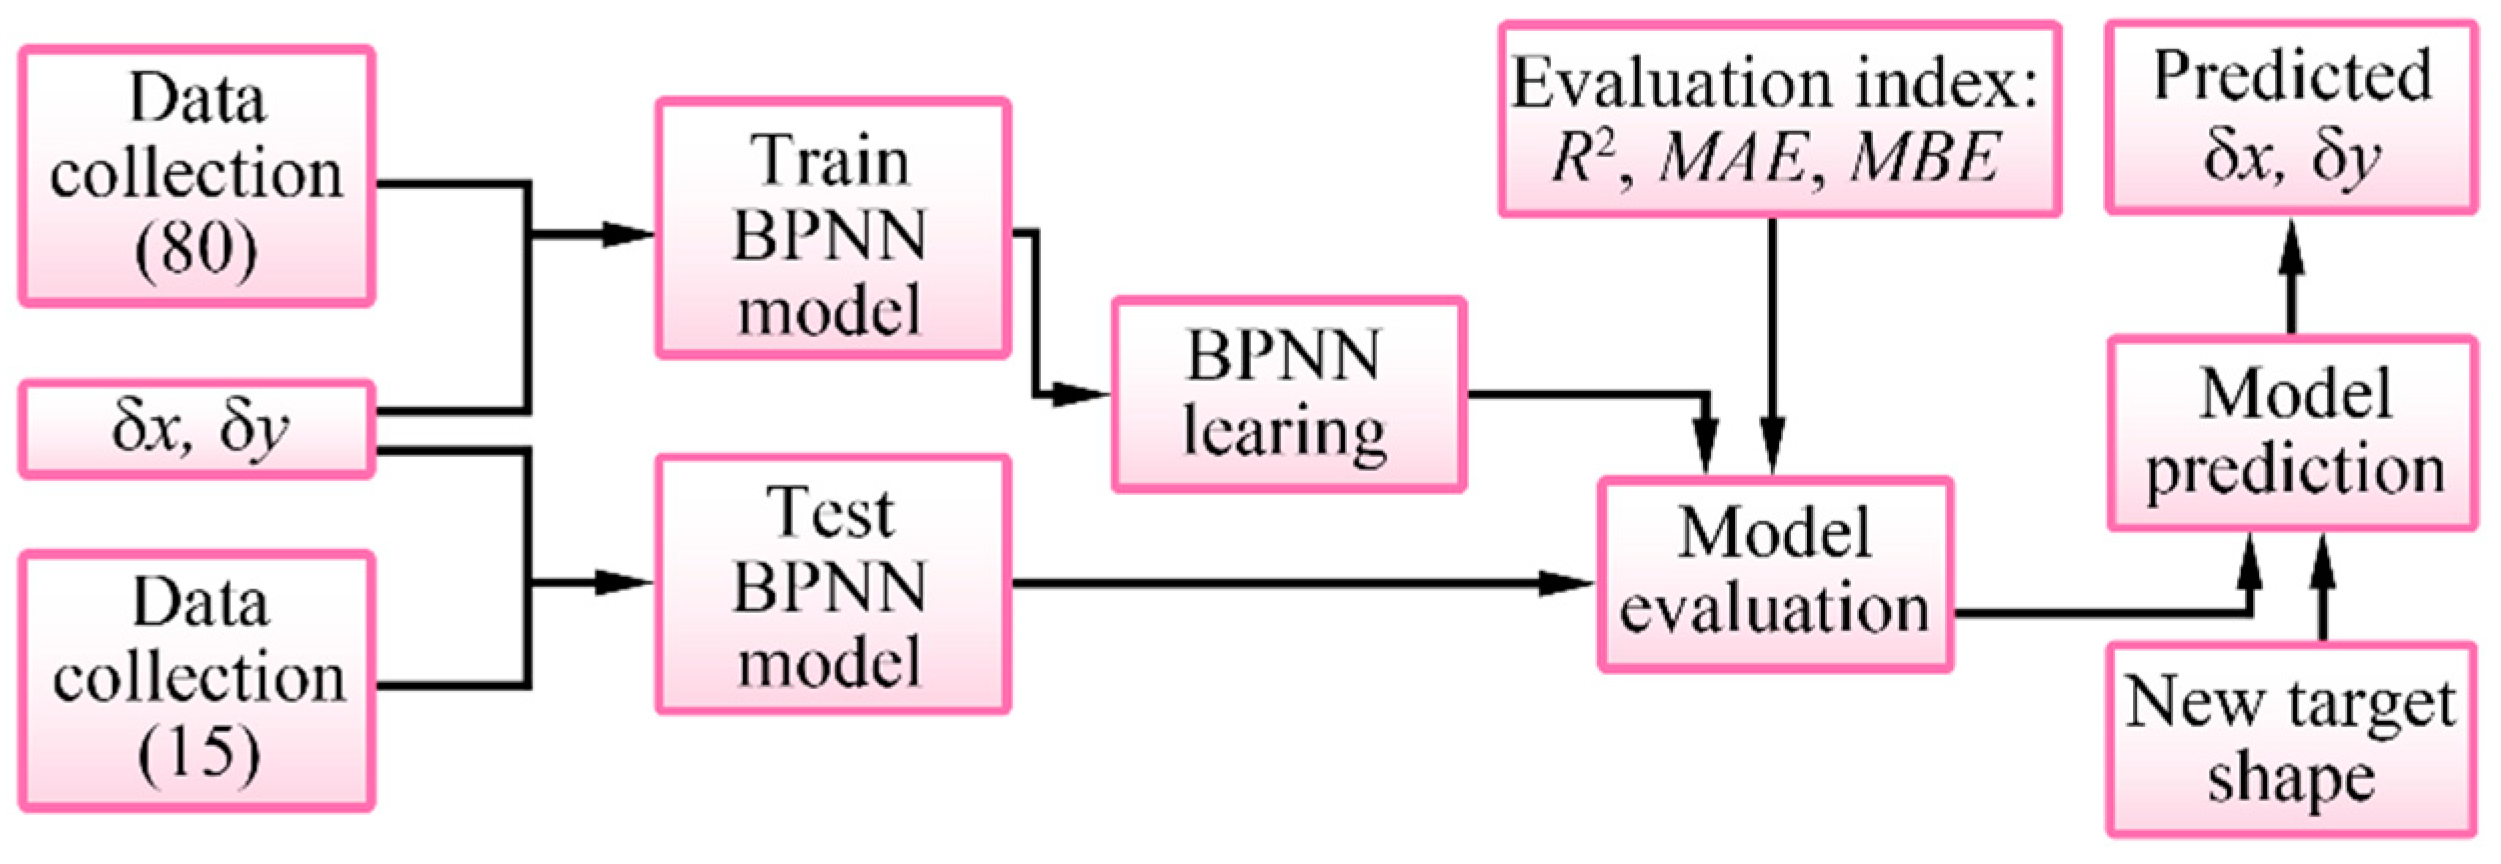
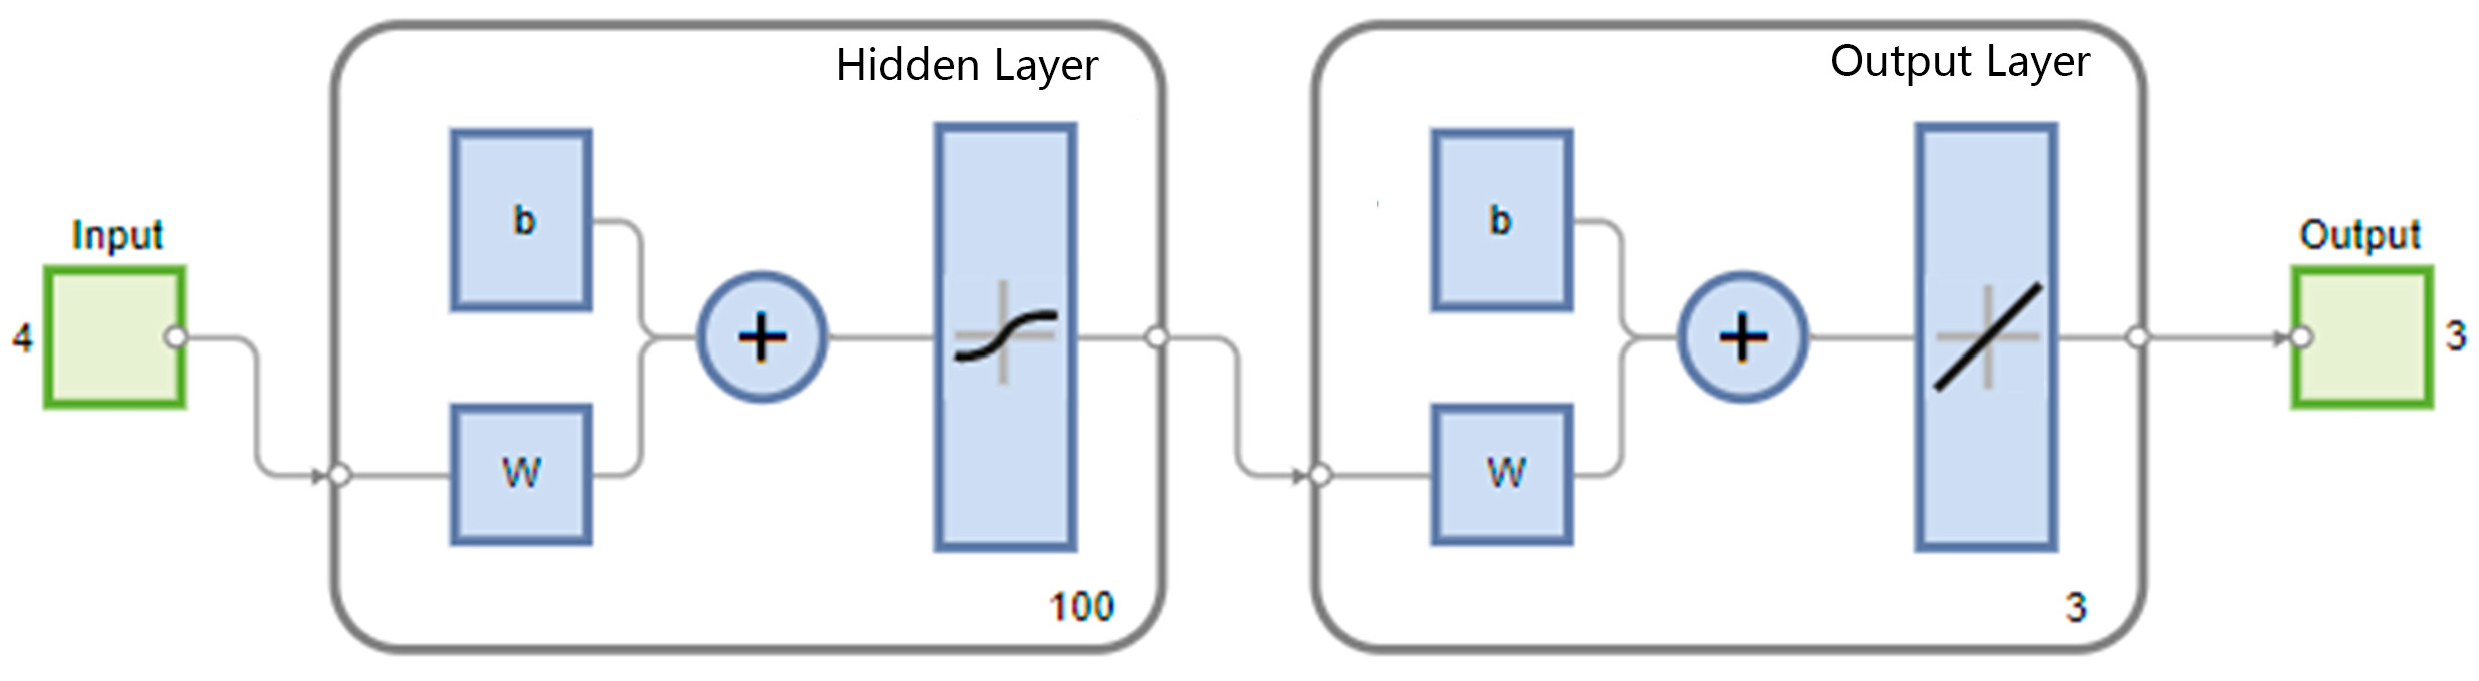
2.2. Establishing the BP Neural Network Model

Various neural network models are employed in machine learning. The BP neural network (BPNN) is a supervised learning algorithm based on a feedforward neural network optimized through backpropagation to minimize prediction errors. BPNN is particularly suited for handling nonlinear relationships, making it widely applicable in classification and regression tasks. This study uses BPNN to train and predict springback to control profile formation.
BPNN consists of an input layer, a hidden layer, and an output layer. The number of neurons in the hidden layer significantly impacts the fitting results: too few neurons can lead to underfitting, while too many may cause overfitting, reducing the model’s generalization ability for new data. A suitable number of neurons is determined through iterative trials. A key distinction between BPNN and feedforward networks is that they use training functions based on error backpropagation. Traditional training algorithms include the Levenberg–Marquardt, conjugate gradient, gradient descent, and Bayesian regularization backpropagation algorithms.
This study adopts the Bayesian regularization algorithm, which adjusts network complexity during backpropagation to reduce overfitting risks. Introducing a regularization term into the objective function balances fitting accuracy and controls weight magnitude, enhancing the model’s generalization ability. This approach is suitable for small datasets and complex nonlinear problems. The BPNN model is trained using the Bayesian regularization backpropagation algorithm with a maximum of 1000 iterations, an error target of 1 × 10⁻⁶, and a learning rate of 0.01. The input variables are the bending radii in the Oyz and Oxz planes, the torsion angle about the z-axis, and the profile wall thickness. The output variables are the springback displacements δx and δy in the x and y directions. The activation function for the hidden layer is tansig, while purelin is used for the output layer. A total of 95 simulation experiments were designed: 80 for the training set and 15 for the test set. The trained model predicts springback under new forming conditions. The BPNN code is executed using MATLAB R2023a, and the model establishment process is shown in Figure 3.

2.3. Automatic Control Method

The automatic control system for the 3D MPSBT machine integrates springback prediction calculations, a PLC controller, sensors, actuators, and a feedback mechanism. First, input the target shape parameters into the BPNN model, and the BPNN model predicts the springback based on the target shape. If the predicted springback exceeds engineering tolerances, compensation is applied to the forming dimensions, and the springback prediction is recalculated iteratively until the springback meets requirements. The forming trajectories of the die heads and clamps that meet the requirements are transmitted to the PLC controller. The PLC controller processes the commands for stretching length, compensated bending radii, and torsion angles, calculating the speed and displacement of each die head. Control signals are sent to motors to drive the die head’s movements and rotations. Sensors monitor the movements of the die heads and convert them into electrical signals, which are transmitted to the controller for closed-loop control. The controller continuously adjusts motor inputs based on real-time feedback from the sensors, ensuring that the actual die-head movements match the intended ones. The automatic control process is illustrated in Figure 4.
The profile is clamped at both ends before forming. The controller uses Equation (1) to determine the z-axis displacement Δzi, y-axis displacement Δyi, and rotation angle αi around the x-axis for each die head, achieving the target horizontal bending position.
z i = R x × s i n i 1 × sin 1 L 2 / R x N y i = R x × 1 c o s sin 1 Z i R x α i = sin 1 Z i R x
where i is the die head number, starting from the central symmetry plane, which is 1, 2, 3,…, N. L2 is the forming area length, that is, the length of the profile from the central symmetry plane to the last die head body, and Rx is the horizontal bending radius.
Then, the clamp drives the profile to stretch along the z-axis to complete the pre-stretching, and the pre-stretching amount is defined as L1. When bent horizontally, the trajectory of the clamp can be described by Equation (2):
Z = L 0 + L 1 R x × z N R x L 0 + L 1 R x × z N R x × cos sin 1 z N R x Y = R x × 1 c o s sin 1 z N R x + L 0 + L 1 R x × sin 1 z N R x × z N R x  
where ΔZ and ΔY represent the z and y axis displacements of the clamp, ΔzN is the displacement of the die head nearest to the clamp, and L0 is the original profile length.
After horizontal bending, the process transitions to vertical bending. Die head movements along the x-axis (Δxi) and rotation angles (βi) around the y-axis are described by Equation (3):
x i = R y × 1 cos sin 1 z i R y β i = sin 1 Z i R y
where Ry is the vertical bending radius of the profile.
The bending angle of the clamp around the y-axis in the vertical bending stage is βN, and the moving distance along the x-axis is calculated by the following:
X = z N R y × L 0 + L 1 Z R y × sin 1 z N R y + R y × 1 cos sin 1 z N R y
Following vertical bending, the torsion process begins, during which the die heads remain stationary. The torsion angle (γi) around axis 5 is computed as:
γ i = θ R x L 2 × sin 1 z i R x
where θ is the total torsion angle, that is, the torsion angle of the die head closest to the clamp and the clamp’s torsion angle.
Finally, the clamp performs post-stretching along its axis, with the post-stretch length denoted as L3. During this phase, the die heads remain stationary, and the clamp displacements (Xc, Yc, Zc) are calculated as:
X c = L 3 × z N R y × cos L 2 R x Y c = L 3 × sin L 2 R x Z c = L 3 × cos sin 1 z N R y × cos L 2 R x
In the above steps, set the smooth movement of each moving part in each step to reach the target position precisely at the end of each stage of forming.

3. Numerical Simulation and Experiment

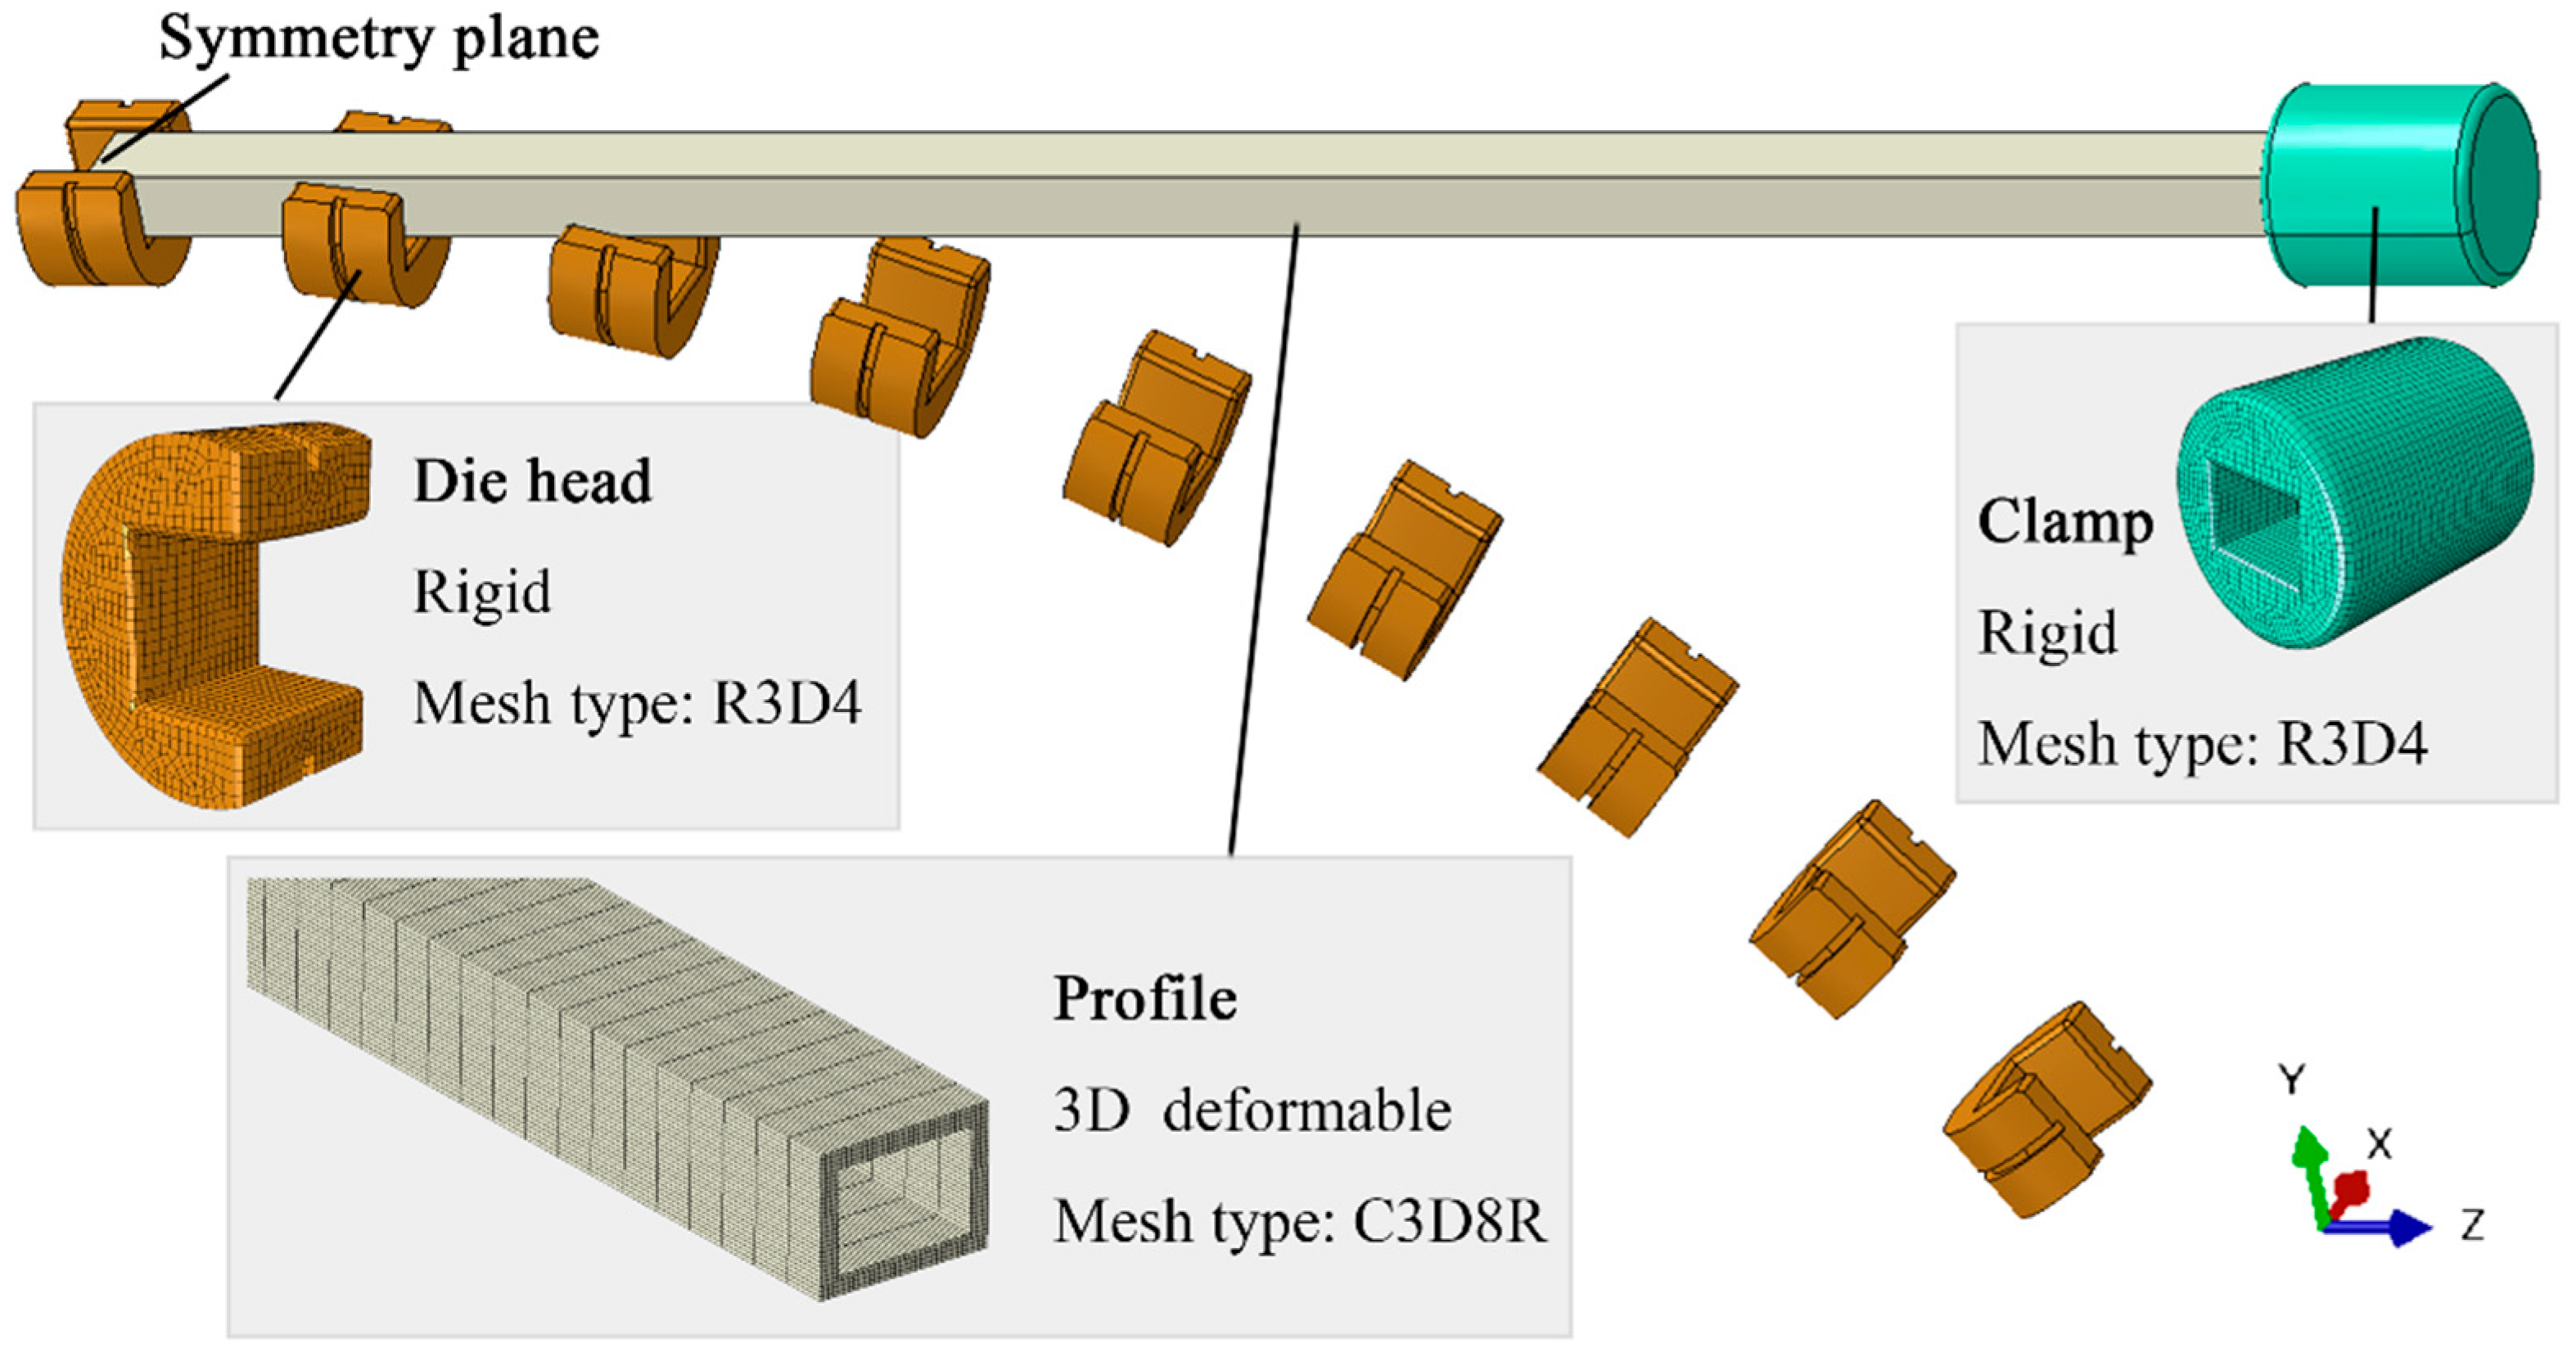
3.1. Numerical Model

Figure 5 illustrates the assembly diagram for the numerical simulation of the multi-point stretch-bending-torsion (MPSBT) forming process. This model is established and simulated by ABAQUS 2020. The model consists of a profile, die heads, and clamps. Considering the symmetry of the profile, only half of the profile is modeled to save computational time. The profile material is 6005A aluminum alloy with a length of 1500 mm and a hollow rectangular cross-section of 40 mm × 30 mm. This material exhibits isotropy. Uniaxial tensile tests were conducted using an electronic universal testing machine with a loading speed of 0.1 mm/min. The stress–strain curves obtained are shown in Figure 6. The material model is an elastoplastic model. The aluminum alloy has an elastic modulus of 70 GPa, a yield strength of 264.33 MPa, and a Poisson’s ratio of 0.33. The numerical simulation defines the aluminum profile as a 3D deformable body using C3D8R mesh elements with dimensions 1 mm × 1 mm × 5 mm. The die heads and clamps, assumed rigid, are modeled as 3D discrete rigid shells using R3D4 mesh elements with a general size of 5 mm × 5 mm. Mesh refinement is applied at rounded transitions. Contact between the die heads and the profile is a general contact with normal hard contact and tangential friction. Based on experience, the friction coefficient is set to 0.1. The clamp is bound to the profile. The profile’s symmetry plane’s boundary condition is ZSYMM, while other boundary conditions and motion trajectories are calculated using Equations (1)–(6). Explicit analysis is used for computation. The bending radii in different directions, the torsion angle about the z-axis, and the wall thickness of the profiles are listed in Table 1. The pre-stretching and post-stretching amounts are set to 1% of the profile length for all profiles. A full factorial experiment with all variable combinations would require 192 tests. A total of 95 combinations of variables are randomly generated using a uniform distribution in MATLAB for numerical simulations and training the BPNN model to reduce computational time.
Taking a horizontal bending radius of 1500 mm, a vertical bending radius of 6000 mm, a torsion angle of 20°, and a wall thickness of 3 mm as examples, the stress and strain changes of the profile before and after springback are demonstrated, as shown in Figure 7. It can be seen that the stress before springback is basically between 249.3 MPa and 304.6 MPa, and the stress after springback is basically between 0 and 28.16 MPa. The stress after springback is significantly reduced. However, the strain change is not obvious. The strain at the same position of the profile before and after springback is basically the same, and it changes regularly along the axis of the profile. The strain in the contact area between the profile and the die head is greater than that in the non-contact area.

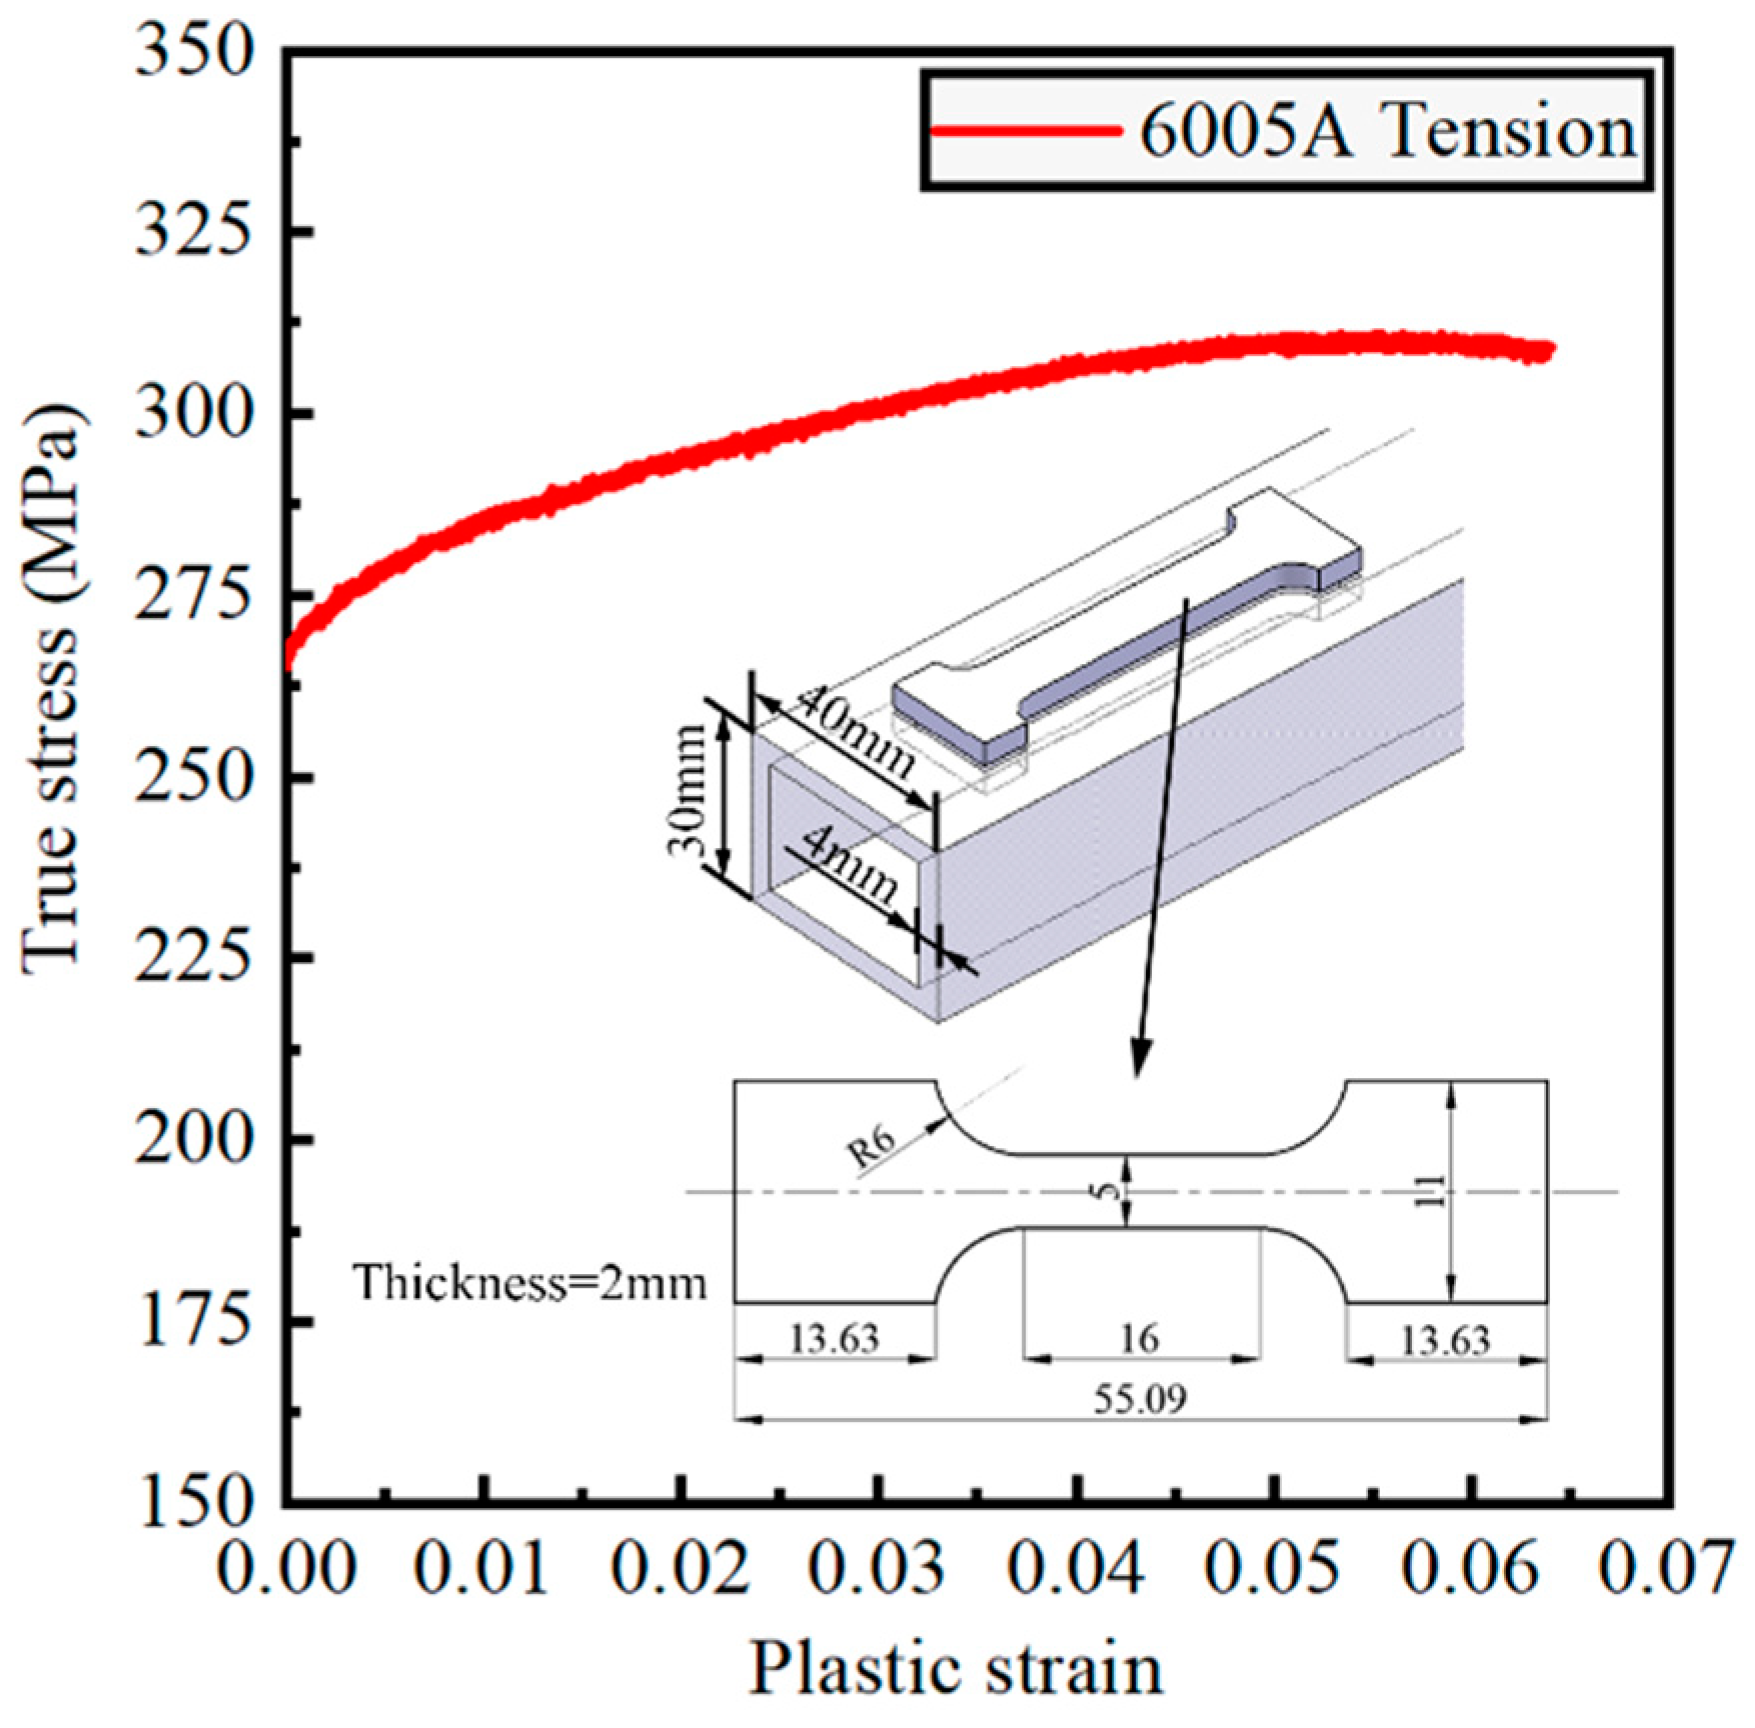
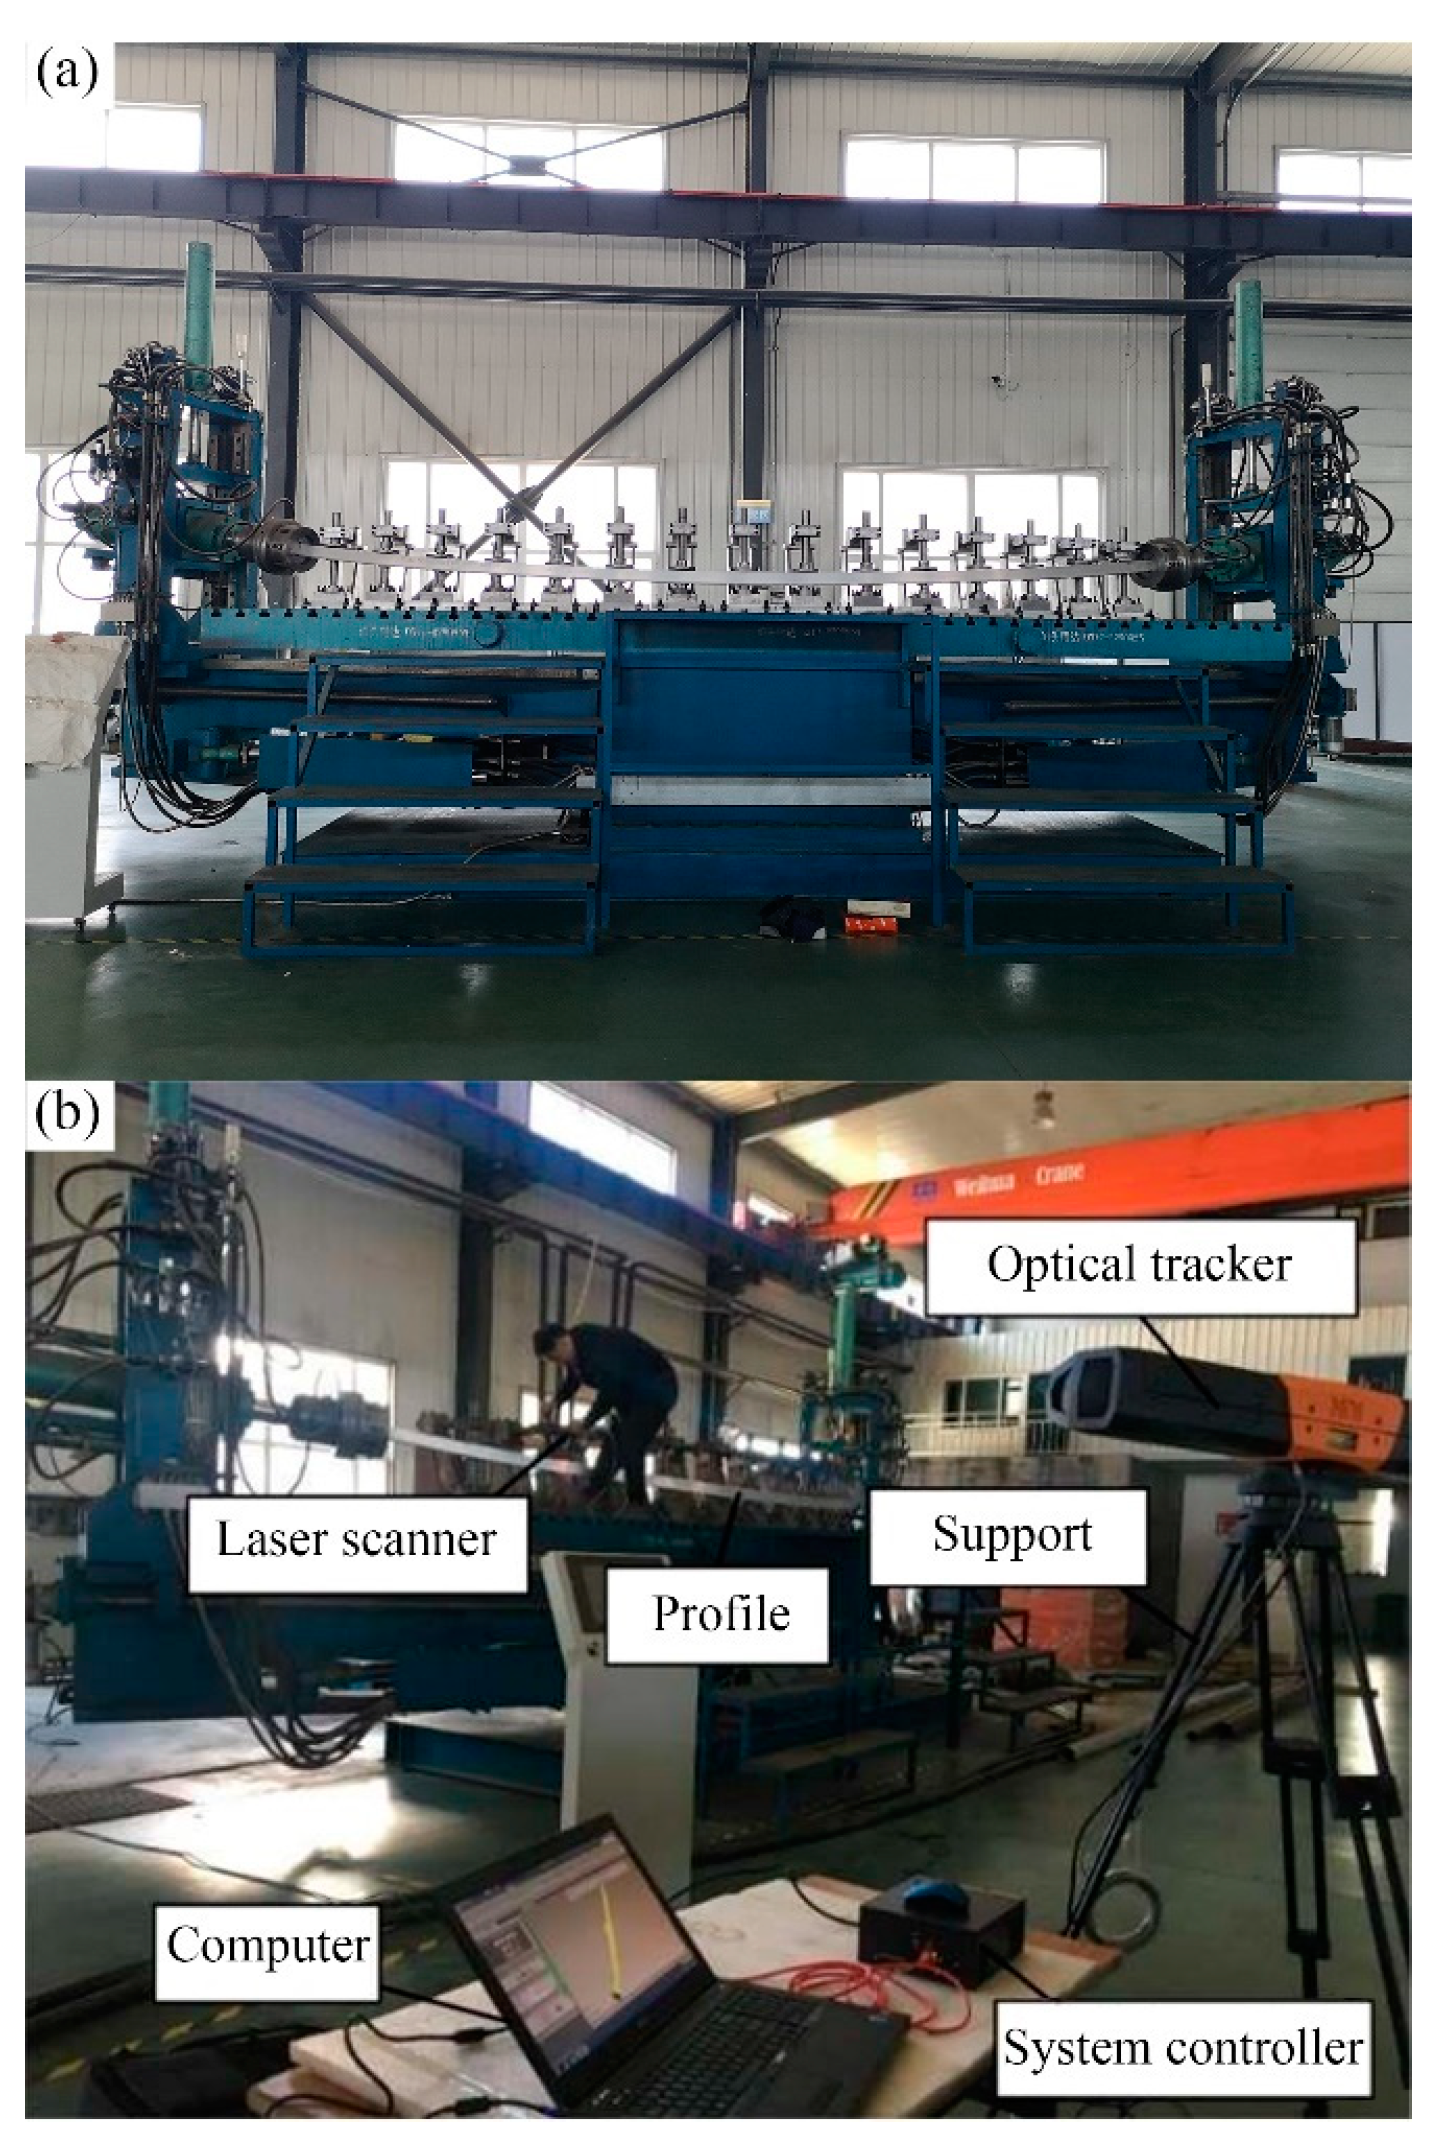
3.2. Experimental Analysis

Conducting experiments for all combinations would be prohibitively expensive. Hence, five combinations are selected for forming experiments. The material and dimensions of the experimental profiles match those used in the numerical simulation. The forming equipment is depicted in Figure 8. The PRO CMM3500 can be used to scan the spatial shape and structure of objects with an accuracy of up to 20 μm. We use this device to measure the shape of profiles and evaluate the shape accuracy by using the scanning points obtained by Polyworks MS 2020. The target forming parameters and the springback results from experiments and simulations are presented in Table 2. After unloading, the profiles exhibited displacements along the x, y, and z axes. However, the primary concern is springback along the x and y axes, as z-axis displacements are secondary effects caused by x and y-axis springbacks. Consequently, comparisons focus on springback displacements in the x and y directions. Positive values indicate displacement in the positive axis direction, while negative values denote displacement in the negative direction. The most significant error is observed in the second comparison group, where the experimental and simulated x-axis springbacks are −10.87 mm and −10.13 mm, respectively, with an error of 6.85%. It validates the accuracy of the numerical simulation. Subsequent analyses rely on the numerical model for computations.

4. Results and Discussion

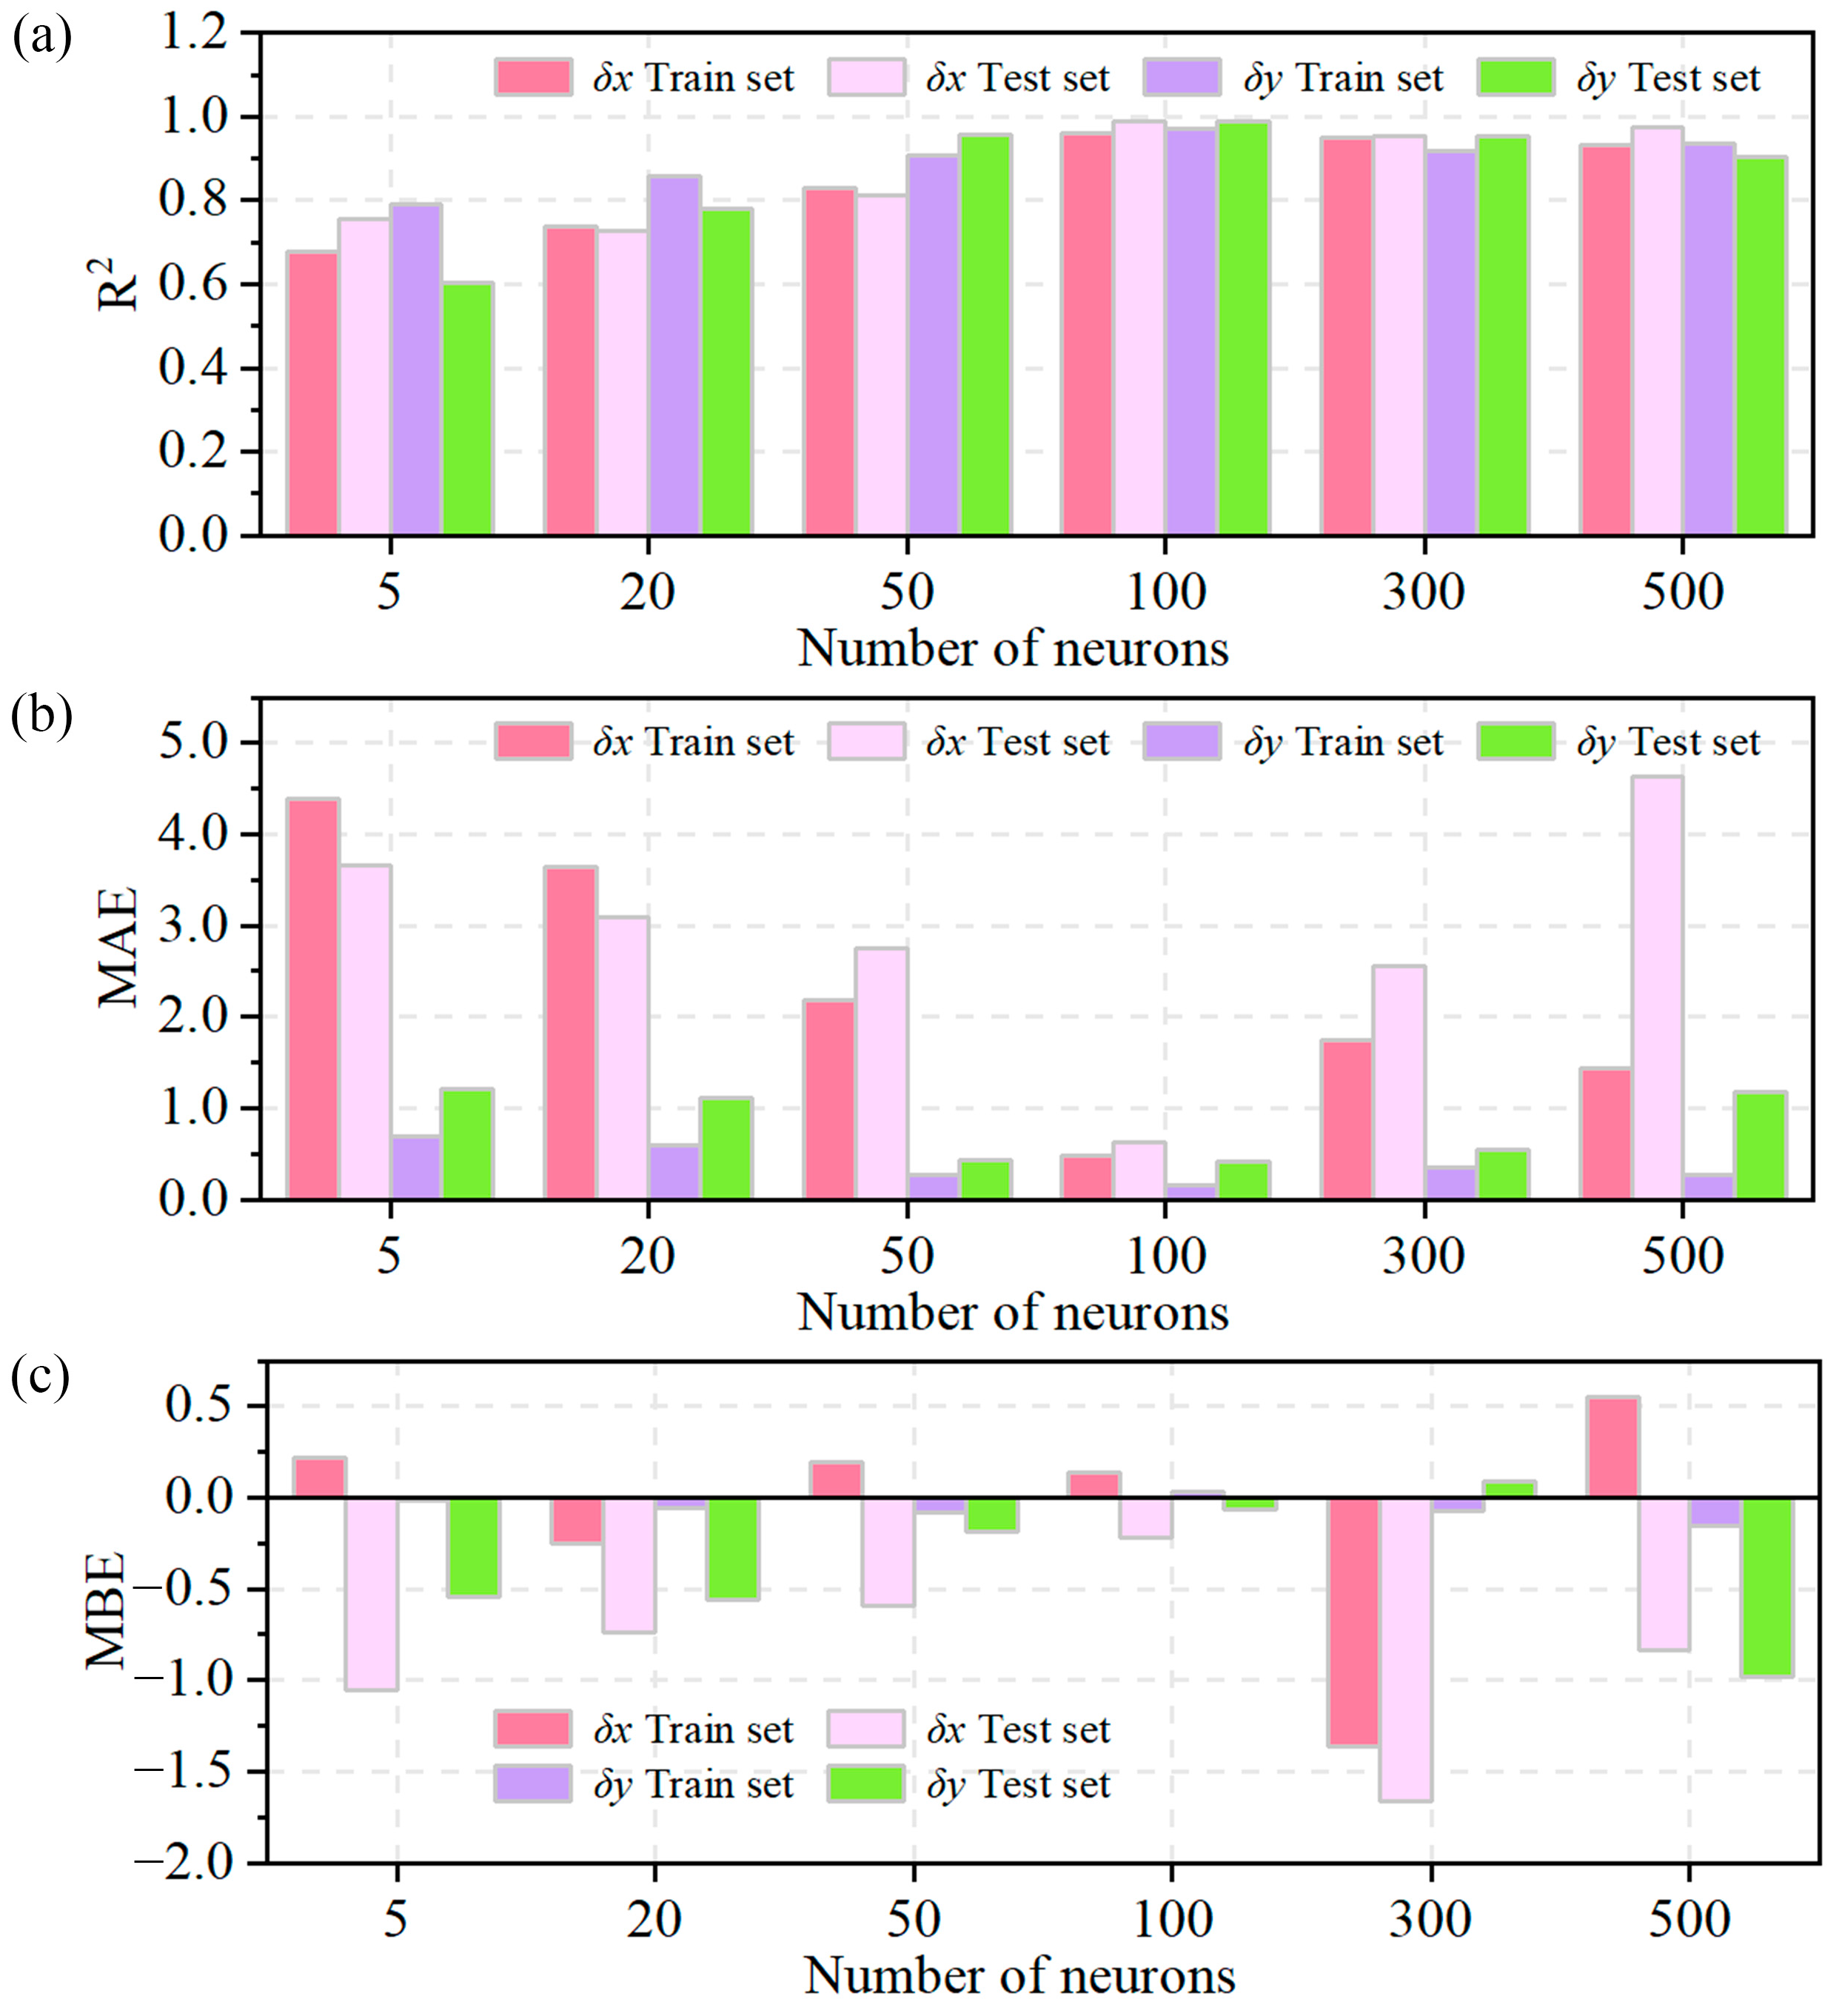
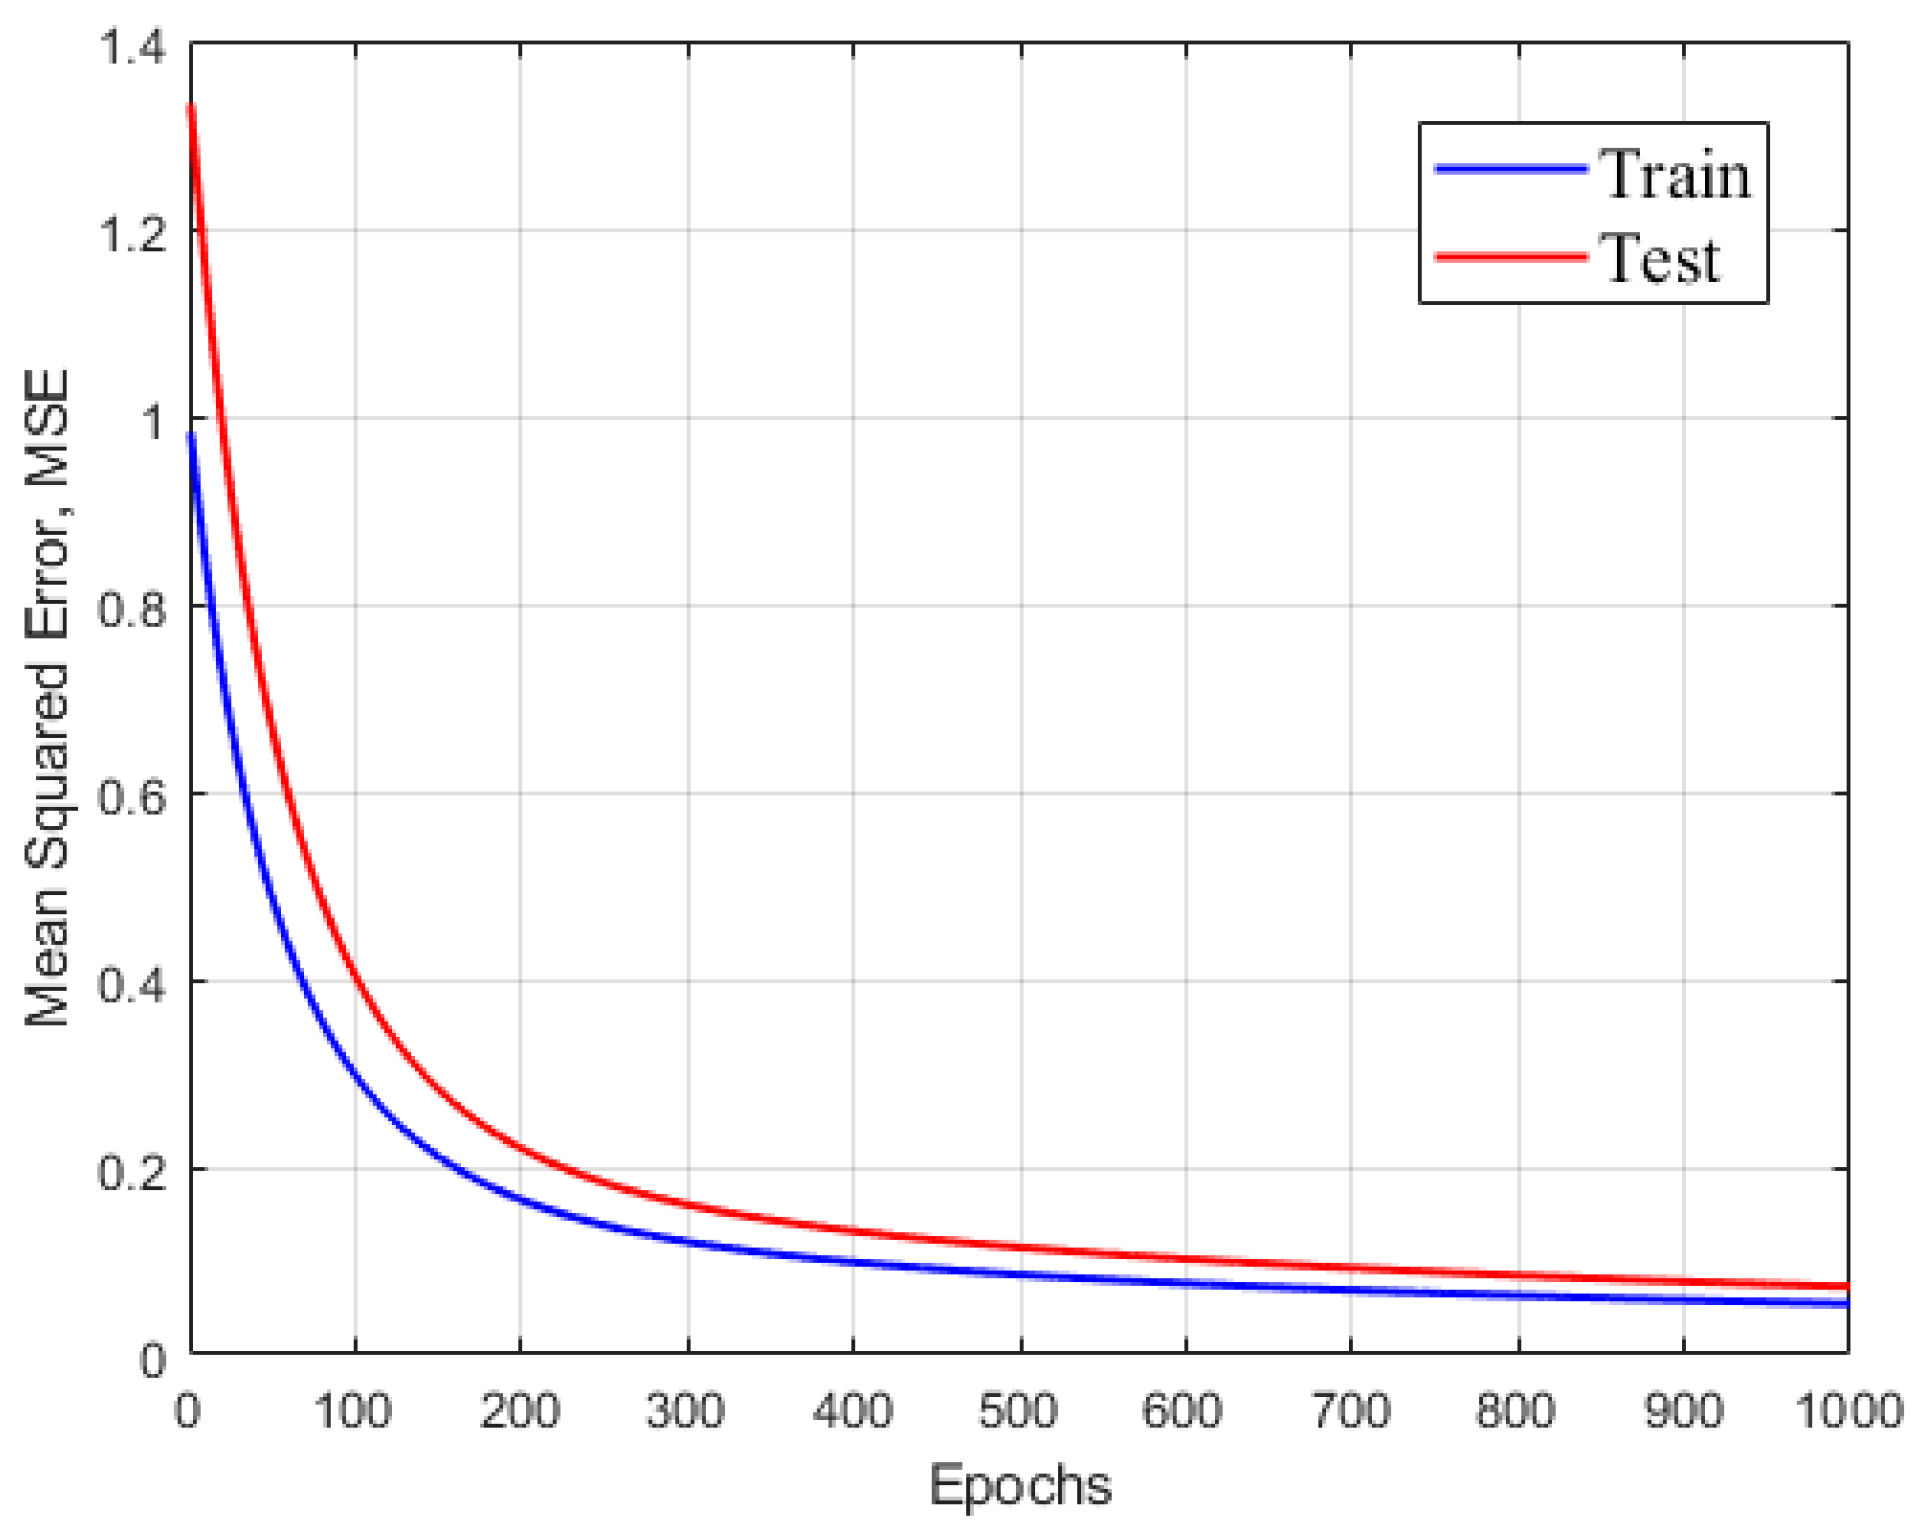
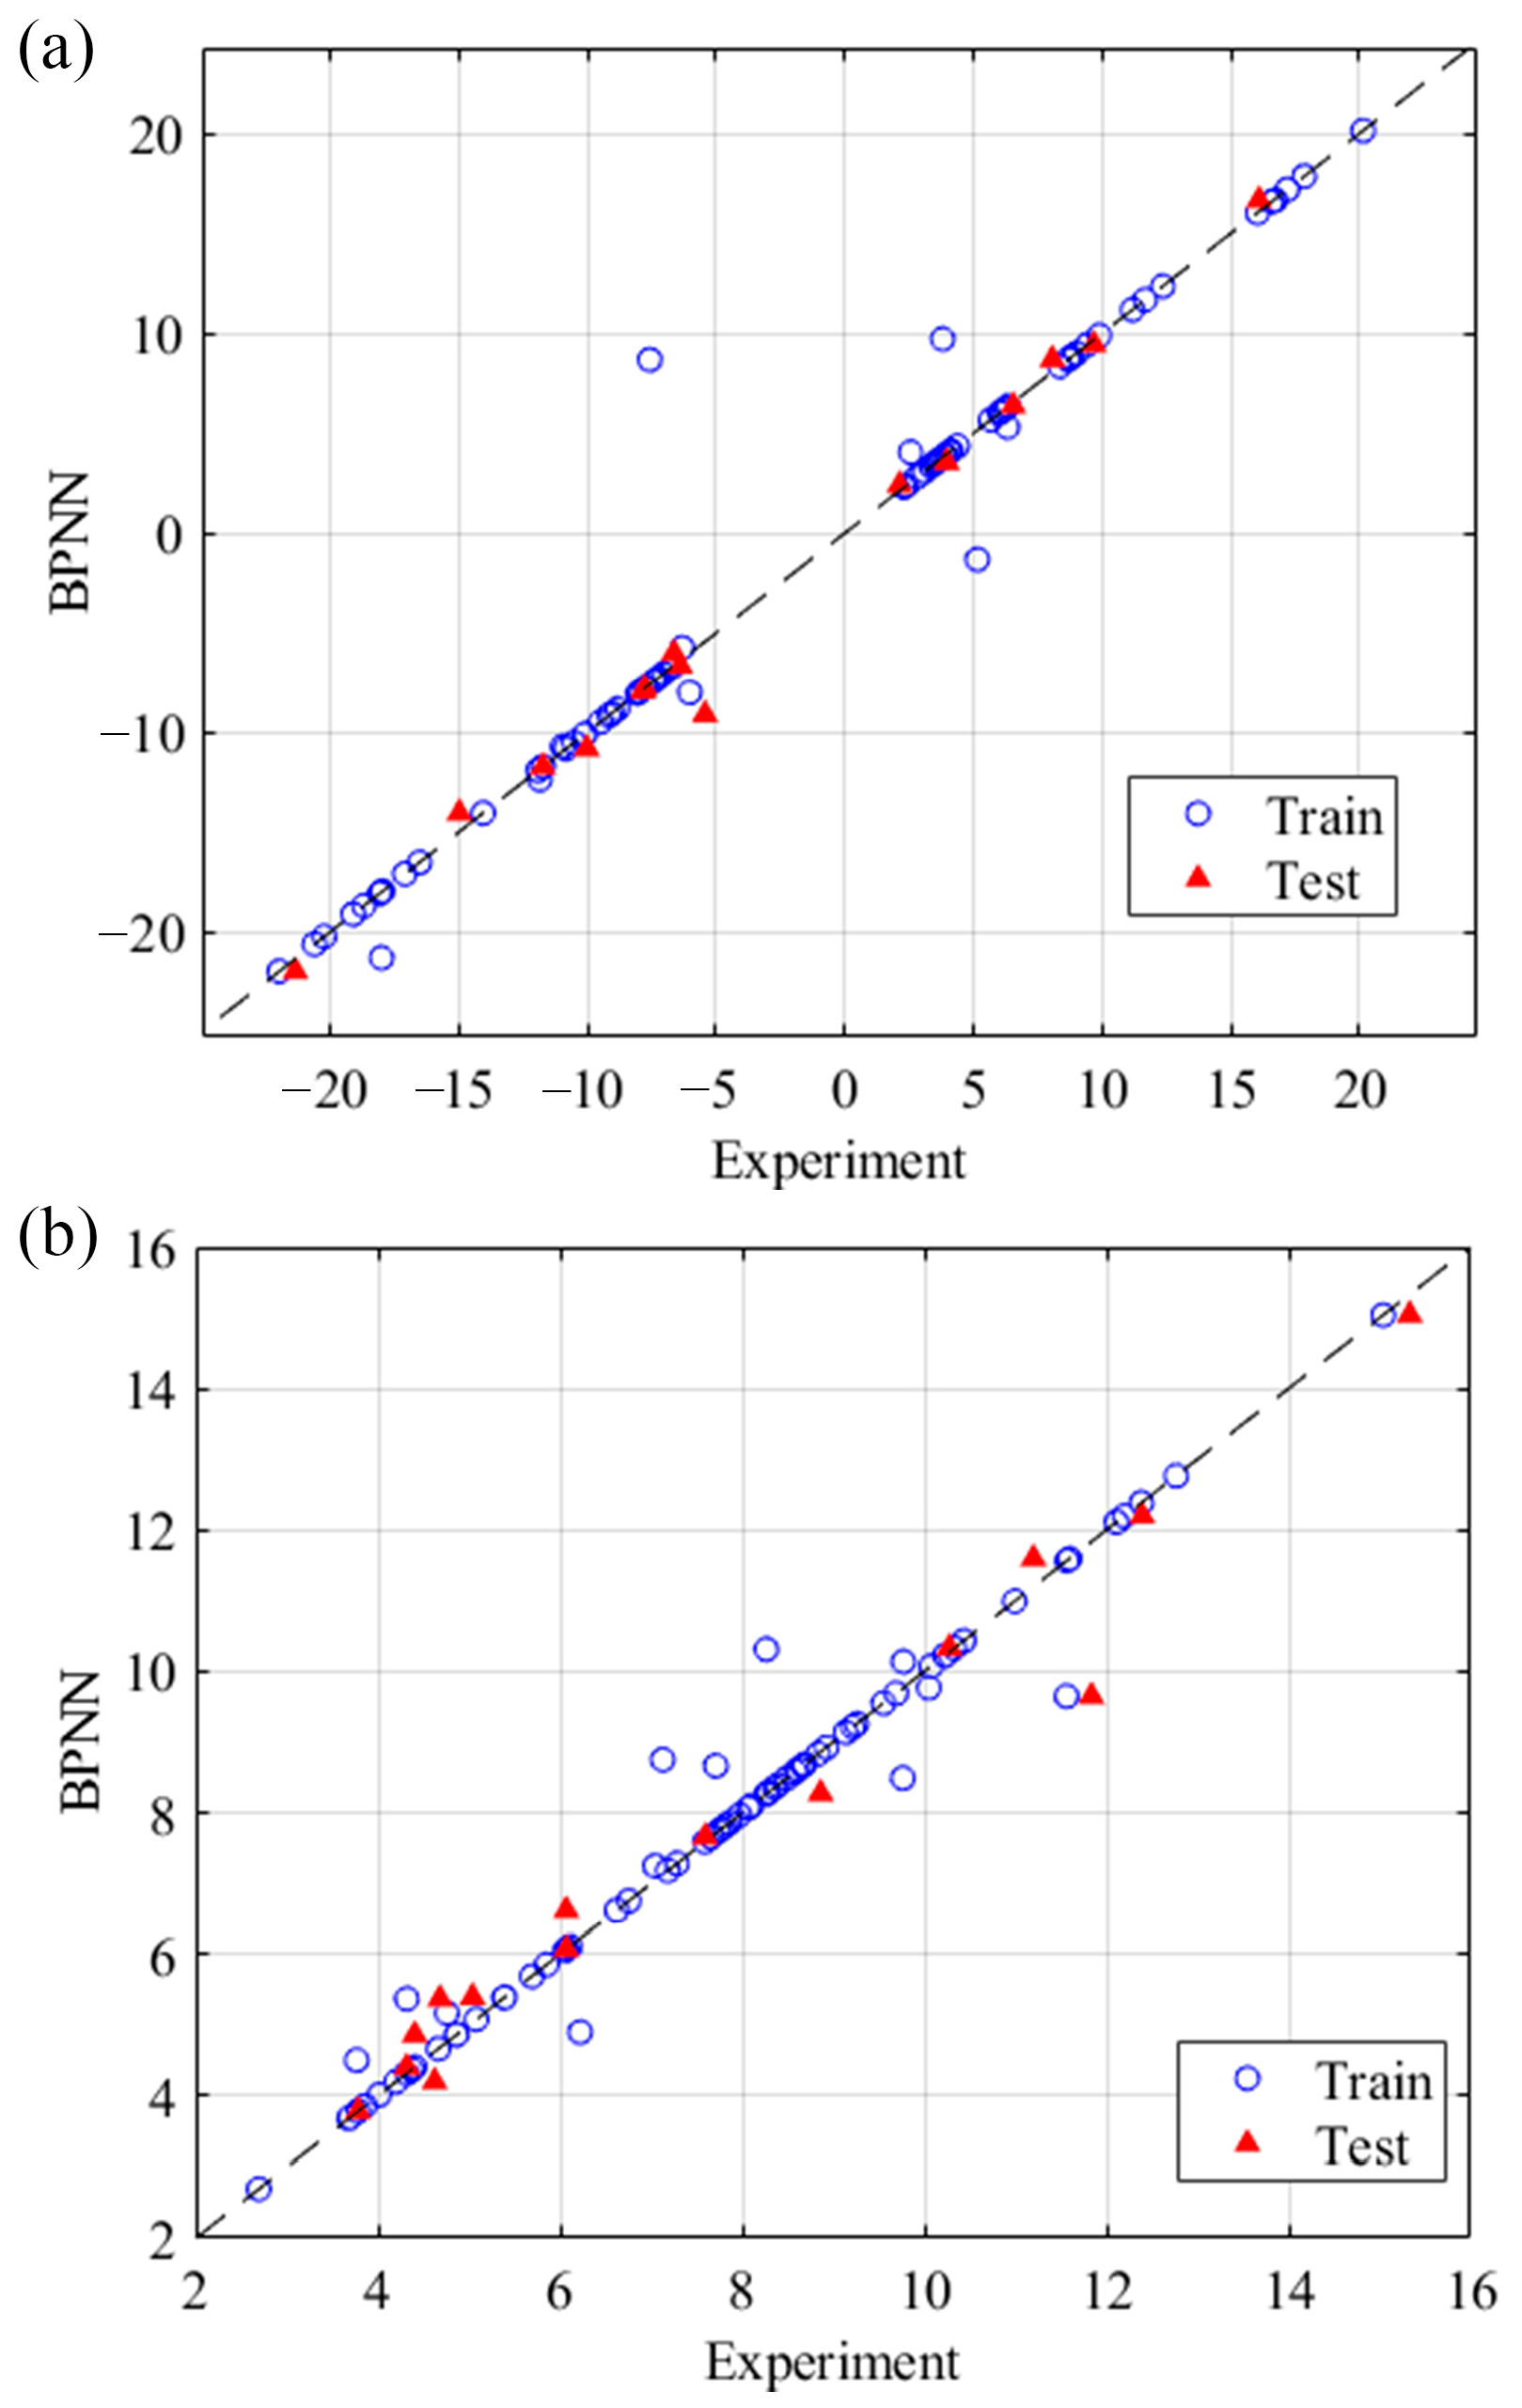
4.1. Neural Network Prediction Accuracy Analysis

The accuracy of the FE-BPNN model is evaluated using metrics R2, MAE, and MBE. R2 is an evaluation index describing the correlation between the fitted and original data. The closer R2 is to 1, the better the fitting effect. The calculation formula is as follows:
R 2 = 1 n × M S E i = 1 n ( y i y ¯ i ) 2
where n is the number of samples, yi is the actual value, y ¯ i is the mean value, and MSE (Mean Squared Error) is calculated as:
M S E = 1 n i = 1 n y i y ^ i 2
where y ^ i is the predicted value.
MAE is the average absolute error, that is, the average value of the absolute error between the predicted and actual values. The smaller the MAE, the smaller the mean error of the model and the more accurate the prediction. Its expression is:
M A E = 1 n i = 1 n y i y ^ i
MBE is the mean deviation error, the average deviation between the actual and predicted values, which assesses whether the model has systematic bias. A positive MBE indicates a low forecast, a negative MBE indicates a high forecast, and 0 indicates no systematic bias. Therefore, the closer the MBE is to 0, the smaller the systematic bias of the model. MBE can be calculated by:
M B E = 1 n i = 1 n y i y ^ i
The number of hidden layer neurons directly affects the accuracy of the model. To optimize the BPNN, six configurations with varying numbers of neurons (5, 20, 50, 100, 300, 500) are trained and tested. Figure 9 shows the fit accuracy for each configuration. As the number of neurons increased, R2 improved, peaking at 100 neurons where R2 values for training (δ and δy) are 0.96198 and 0.96972, and for testing are 0.98863 and 0.9882. It indicates good fitting and generalization capabilities. Beyond 100 neurons, improvements were minimal, but computation time increased. MAE and MBE showed a trend of first decreasing and then increasing, reaching their minimum values at 100 neurons. It avoids underfitting or overfitting. The final FE-BPNN structure with 100 neurons is shown in Figure 10. The MSE convergence curve (Figure 11) stabilizes below 0.1 after 1000 iterations without oscillations, confirming model convergence.
Figure 12 compares experimental results with FE-BPNN predictions for δx and δy. High consistency is observed, with only minor deviations for a few data points.

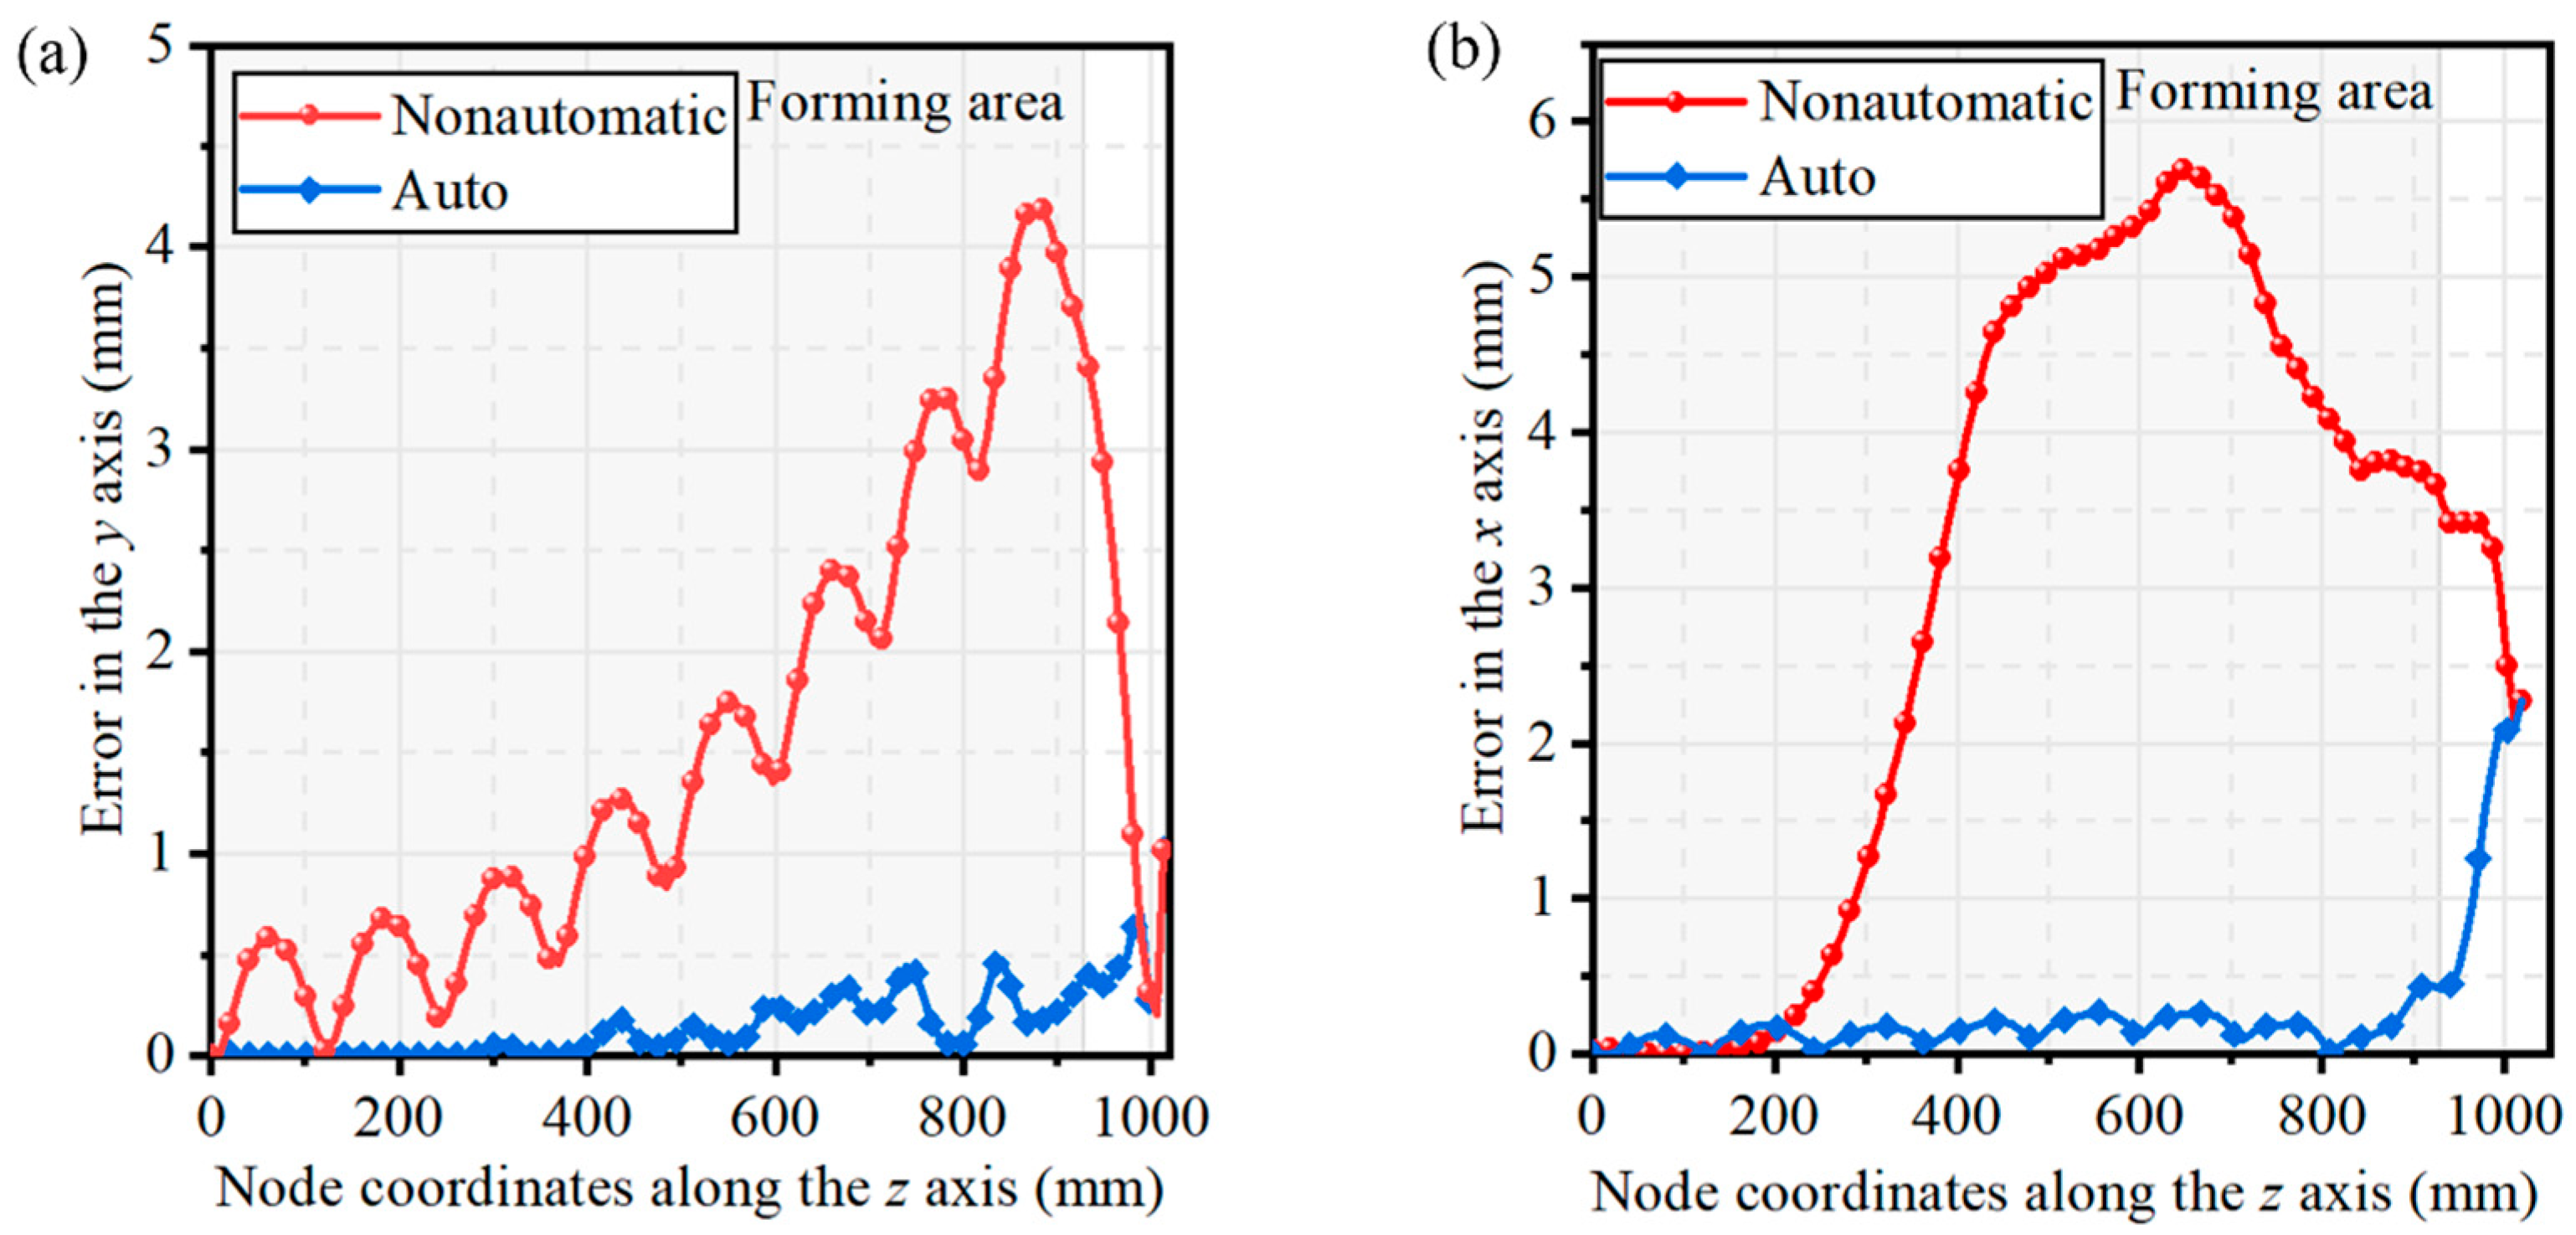
4.2. Analysis of Automatic Forming Accuracy

Numerical simulations compared profiles formed with mold automatic motion and passive movement to evaluate the advantage of automatic adjustment over manual adjustment. The profile parameters were Rx = 1500 mm, Ry = 4500 mm, θ = 20°, and t = 3 mm. The bending of profiles in the Oyz plane mainly affects the displacement of profiles along the y-axis. The displacement of the lower surface of profiles along the y-axis is measured, and the results are shown in Figure 13a. It can be seen that the forming profile in the two forming modes is very close to the ideal shape, and only the profile at 800–950 mm has a small error when the mold is not automatically adjusted. The maximum error during auto-forming is 0.46 mm at z = 842 mm, and the maximum error during non-auto-forming is approximately 4.20 mm at z = 876 mm. This is because, no matter which die head movement mode is used, the die heads have reached the predetermined position before the profile is attached. The non-automatic shape adjustment is controlled manually, and the automatic shape adjustment is adjusted by the control system, which significantly saves the adjustment time of the mold and improves the accuracy of the mold movement. The die head shaping method significantly affects the forming profile after bending in the Oxz plane, as shown in Figure 13b. The displacement of the outer wall of the profile along the x-axis is measured, and the profile formed under the automatic mold adjustment is consistent with the ideal shape. The maximum error is approximately 0.45 mm at z = 916 mm. In contrast, the profile without automatic adjustment began to appear with obvious errors at z = 300 mm. From z = 300 mm to 1000 mm, the error along the z-axis direction increases rapidly and stabilizes between 4.0 mm and 5.7 mm. At z = 825 mm, the error begins to gradually decrease, from 4.0 mm to 2.3 mm at z = 1013 mm. The forming accuracy of automatic forming on the y-axis and x-axis has increased by 83.3% and 92.1%, respectively.
Figure 14 shows the difference between the shape profile and the ideal value in the y-axis and x-axis directions under the two die-head motion modes. In the forming area, the forming error of the profile in the non-automatic forming mode reaches a maximum of 4.20 mm and 5.68 mm because when the profile is bent in the Oxz plane, the die head body is driven by the profile, which is equivalent to the profile bending freely in the Oxz plane. If the die head does not reach the specified position, the die head cannot provide adequate support for the profile. The maximum forming errors in two directions are 0.46 mm and 0.45 mm, respectively. Compared with the manual mode, the error is reduced by 89.05% and 92.08%, respectively. The error fluctuation along the z-axis indicates that the die head is in contact with the profile and the die exerts a force on the profile. Therefore, automatic mold adjustment can significantly improve the forming accuracy of parts.

4.3. Comparison with Springback Factor Control

In the previous research on springback compensation, Chen et al. [18] proposed a springback compensation method for profiles based on variable compensation factors. Their approach was first to determine the compensation factor for the first time α k 1 scope [a, b], then calculated using dichotomy α k 1 = a + b 2 into Equation (11) for the springback compensation,
C k j + 1 = C k j + α k j S k j D k j
where j is the number of iterations, k is section k of the profile, α k j is compensated factor, C is the mold surface, D is the target shape, and S is the profile shape after springback.
The iteration termination condition is:
C k j + 1 C k j m a x < ξ k , k = 1,2 , 3
where ξ k is maximum springback error.
The iteration is stopped when the springback error satisfies Equation (12). A second iteration, if not satisfied, the iteration of the compensation factor α k 2 meets the following:
α k 2 = a + b 2 + a 2 , ξ > 0 , a + b 2 + b 2 , ξ < 0 .
After the second iteration, use Equations (11) and (12) to judge whether the forming accuracy is satisfied. If not, repeat Equation (13) until Equation (12) is established and iteration is stopped.
In this paper, the bending and torsion forming experiments of 6005A profiles are carried out using the above method and the FE-BPNN-based automatic control forming method to compare the control effects of the two methods on springback. The iteration compensation factor range is [0, 2]. The target shape of the shaped part is the same as in Section 4.2. The error between the actual profile and the ideal profile after springback is shown in Figure 15. The forming area is from 0 to 927.5 mm along the z-axis. 927.5 mm to 1020 mm is the transition area from the profile forming area to the clamp. The part is considered qualified if the error between the actual contour of the forming zone and the ideal contour is less than 1.5 mm. As can be seen from the figure, the springback error in the forming zone increases gradually along the axis of the profile. In contrast, the springback error in the transition zone increases rapidly. After three iterations of compensation, the overall error of the profile, that is, the springback error at the clamp and the contour error of the forming area, decreased significantly. The contour errors of the forming zone δymax decreased from 3.75 mm to 1.04 mm and δxmax from 4.964.96 mm to 1.09 mm, which met the qualified conditions. The springback control effect of the first iteration is the most obvious, and the δymax and δxmax in the forming zone decrease by 1.45 mm and 1.79 mm, respectively. With the increase in iterations, the springback control effect decreases, and the δymax and δxmax decrease by 0.43 mm and 0.79mm, respectively, after the third iteration. The profile automatic control forming method based on FE-BPNN can control the error value within the qualified range after one forming. The maximum error in the non-forming zone is 1.44 mm and 1.12 mm, and the maximum error in the forming zone is 0.68mm and 0.74 mm, respectively. The accuracy of the profile product is higher than that obtained after three iterations of springback control. The forming errors in both directions were reduced by 35.05% and 32.41%, respectively.

5. Conclusions

The neural network model has high accuracy in fitting and forecasting. In this paper, BPNN is introduced into the prediction of 3D MPSBT forming of profiles to improve the prediction accuracy of profiles’ springback, and the prediction results are applied to the automatic shape control of the 3D MPSBT forming of profiles to improve the forming accuracy after unloading of profiles. The primary studies are summarized as follows:
  • Based on the 3D flexible multi-point stretch-bending and torsion machine, a 3D MPSBT-forming numerical model for profiles was established. The effectiveness of the numerical model was verified by comparing the test results with those of the numerical model, which was used for subsequent analysis.
  • A total of 95 test schemes were designed considering the profiles’ horizontal bending radius Rx, vertical bending radius Ry, torsion angle and direction θ, and wall thickness t. The springback of different combinations was obtained by numerical simulation. Based on the simulation results, the FE-BPNN model of springback prediction is established, and different indices verify its correctness. The automatic profile-forming control system uses the model to form the profile with high precision.
  • By comparing the shape difference between automatic forming and non-automatic forming, it is proved that automatic forming can obtain a high-precision shape contour. The effect of the automatic forming control method based on FE-BPNN proposed in this paper is compared with that of the springback factor proposed in other studies. The results show that under the target shape selected in this paper, the springback control method based on the springback factor needs three forming times to obtain qualified parts. The FE-BPNN-based automatic profile forming control method needs one forming time to obtain qualified parts, and the forming errors are reduced by 35.05% and 32.41% in two directions, respectively. The automatic control forming method based on BPNN can significantly improve the forming precision and save processing time.

Author Contributions

Conceptualization, Y.W. and Y.L.; Methodology, C.L.; Software, Y.W. and Y.L.; Validation, Y.W., Y.L. and C.L.; Formal analysis, Y.W.; Investigation, J.L.; Resources, J.L.; Data curation, Y.W. and Y.L.; Writing—original draft, Y.W.; Writing—review & editing, J.L. and C.L.; Visualization, J.L.; Supervision, J.L.; Project administration, C.L.; Funding acquisition, J.L. All authors have read and agreed to the published version of the manuscript.

Funding

This work was financially supported by Jilin Provincial Scientific and Technological Department (20220201048GX) and project of Jilin University on the Reform of Undergraduate Education Empowered by Artificial Intelligence (24AI032Z).

Data Availability Statement

The original contributions presented in this study are included in the article. Further inquiries can be directed to the corresponding authors.

Conflicts of Interest

The authors declare no competing interests.

References

  1. Rosenthal, S.; Maaß, F.; Kamaliev, M.; Hahn, M.; Gies, S.; Tekkaya, A.E. Lightweight in Automotive Components by Forming Technology. Automot. Innov. 2020, 3, 195–209. [Google Scholar] [CrossRef]
  2. Fröck, H.; Graser, M.; Reich, M.; Lechner, M.; Merklein, M.; Kessler, O. Numerical modelling of the process chain for aluminium Tailored Heat-Treated Profiles. Adv. Model. Simul. Eng. Sci. 2023, 10, 8. [Google Scholar] [CrossRef]
  3. Gantner, P.; Bauer, H.; Harrison, D.K.; De Silva, A.K.M. Free-Bending—A new bending technique in the hydroforming process chain. J. Mater. Process. Technol. 2005, 167, 302–308. [Google Scholar] [CrossRef]
  4. Chatti, S.; Hermes, M.; Weinrich, A.; Ben-Khalifa, N.; Tekkaya, A.E. New incremental methods for springback compensation by stress superposition. Int. J. Mater. Form. 2009, 2, 817–820. [Google Scholar] [CrossRef]
  5. Xu, L.; Pei, Y.; Liu, Z.; Gao, C.; Xie, P.; Xu, C.; Li, L. Manufacturing of curved profiles using an extrusion-bending continuous forming process. Thin-Walled Struct. 2024, 199, 111831. [Google Scholar] [CrossRef]
  6. Zhao, J.; Yin, J.; Ma, R.; Ma, L. Springback equation of small curvature plane bending. Sci. China Technol. Sci. 2011, 54, 2386–2396. [Google Scholar] [CrossRef]
  7. Yu, C.; Li, X. Theoretical analysis on springback of L-section extrusion in rotary stretch bending process. Trans. Nonferrous Met. Soc. China 2011, 21, 2705–2710. [Google Scholar] [CrossRef]
  8. Zhao, J.; Zhai, R.; Qian, Z.; Ma, R. A study on springback of profile plane stretch–bending in the loading method of pretension and moment. Int. J. Mech. Sci. 2013, 75, 45–54. [Google Scholar] [CrossRef]
  9. Ma, J.; Welo, T. Analytical springback assessment in flexible stretch bending of complex shapes. Int. J. Mach. Tools Manuf. 2021, 160, 103653. [Google Scholar] [CrossRef]
  10. Fu, Z.; Mo, J. Springback prediction of high-strength sheet metal under air bending forming and tool design based on GA–BPNN. Int. J. Adv. Manuf. Technol. 2011, 53, 473–483. [Google Scholar] [CrossRef]
  11. Ruan, F.; Feng, Y.; Liu, W. Springback Prediction for Complex Sheet Metal Forming Parts Based on Genetic Neural Network. In Proceedings of the 2008 Second International Symposium on Intelligent Information Technology Application, Shanghai, China, 20–22 December 2008; IEEE: New York, NY, USA, 2008; pp. 157–161. [Google Scholar] [CrossRef]
  12. Xu, B.; Li, L.; Wang, Z.; Zhou, H.; Liu, D. Prediction of springback in local bending of hull plates using an optimized backpropagation neural network. Mech. Sci. 2021, 12, 777–789. [Google Scholar] [CrossRef]
  13. El Mrabti, I.; Touache, A.; El Hakimi, A.; Chamat, A. Springback optimization of deep drawing process based on FEM-ANN-PSO strategy. Struct. Multidisc. Optim. 2021, 64, 321–333. [Google Scholar] [CrossRef]
  14. Jeffery, H.C.K.; Behdinan, K. Neural networks with dimensionality reduction for efficient springback prediction in deep drawing of multi-material cylindrical cups. J. Exp. Theor. Artif. Intell. 2023, 37, 111–130. [Google Scholar] [CrossRef]
  15. Kongnoo, S.; Sonthipermpoon, K.; Wannarumon, K. Springback optimization for CNC tube bending machine based on an artificial neural networks (ANNs). FME Trans. 2023, 51, 405–414. [Google Scholar] [CrossRef]
  16. Wang, Z.; Wang, C.; Zhang, S.; Qiu, L.; Lin, Y.; Tan, J.; Sun, C. Towards high-accuracy axial springback: Mesh-based simulation of metal tube bending via geometry/process-integrated graph neural networks. Expert Syst. Appl. 2024, 255, 124577. [Google Scholar] [CrossRef]
  17. Ha, T.; Welo, T.; Ringen, G.; Wang, J. Smart Control of Springback in Stretch Bending of a Rectangular Tube by an Artificial Neural Network. J. Manuf. Sci. Eng. 2023, 1–42. [Google Scholar] [CrossRef]
  18. Chen, C.; Liang, J.; Teng, F.; Li, Y.; Liang, C. Research on springback compensation method of 3D flexible stretch bending of multi-point roller dies. Int. J. Adv. Manuf. Technol. 2021, 112, 563–575. [Google Scholar] [CrossRef]
Figure 1. (a) 3D MPSBT forming machine, (b) die unit.
Metals 15 00544 g001
Figure 2. Steps of the stretch-bending-torsion forming process. (a) Pre-stretching and horizontal bending, (b) Vertical bending, torsion and post stretching.
Metals 15 00544 g002
Figure 3. BPNN-based springback prediction and modeling process.
Metals 15 00544 g003
Figure 4. Automatic control workflow.
Metals 15 00544 g004
Figure 5. Assembly diagram and mesh division for the numerical model.
Metals 15 00544 g005
Figure 6. Stress–strain curve of 6005A aluminum alloy.
Metals 15 00544 g006
Figure 7. Numerical simulation results for one combination with parameters: Rx = 1500 mm, Ry = 6000 mm, θ = 20°, t = 3 mm.
Metals 15 00544 g007
Figure 8. (a) 3D MPSBT forming equipment; (b) shape measurement of the profile.
Metals 15 00544 g008
Figure 9. Fitting accuracy of different neuron numbers, (a) R2, (b) average absolute error MAE, (c) mean deviation error MBE.
Metals 15 00544 g009
Figure 10. FE-BPNN structure.
Metals 15 00544 g010
Figure 11. Error decline curve.
Metals 15 00544 g011
Figure 12. Comparison of test results and fitting results of training set and test set data, (a) δx value, (b) δy value.
Metals 15 00544 g012
Figure 13. Comparison of auto-formed and non-auto-formed shapes, (a) displacement in y-axis, (b) displacement in x-axis.
Metals 15 00544 g013
Figure 14. Error comparison between the formed contour and the ideal value, (a) y-axis error, (b) x-axis error.
Metals 15 00544 g014
Figure 15. Error comparison between the actual and ideal contours after springback under the iterative compensation and automatic control forming conditions. (a) Springback in the Oyz plane, (b) maximun springback in the Oyz plane δymax, (c) springback in the Oxz plane, (d) maximun springback in the Oxz plane δxmax.
Metals 15 00544 g015
Table 1. Wall thickness and deformation dimensions of profiles.
DimensionsValue
Bending radius in the Oyz plane Rx/mm1000, 1500, 2000, 2500
Bending radius in the Oxz plane Ry/mm4500, 5000, 5500, 6000
Torsion angle θ−40, −20, 20, 40
Wall thickness t/mm2, 3, 4
Table 2. Comparison of experimental and numerical simulation results.
Forming ParameterSpringback Value/mm
Rx/mmRy/mmθt/mmδxδy
EXPFEERR/%EXPFEERR/%
110004500−40418.1917.2115.3811.9511.5683.2
215004500202−10.87−10.136.856.386.0585.07
315006000−2036.696.3225.5010.7310.0516.32
420005000404−9.43−8.8426.245.064.8703.76
5250055002026.586.2255.404.624.3186.55
Disclaimer/Publisher’s Note: The statements, opinions and data contained in all publications are solely those of the individual author(s) and contributor(s) and not of MDPI and/or the editor(s). MDPI and/or the editor(s) disclaim responsibility for any injury to people or property resulting from any ideas, methods, instructions or products referred to in the content.

