Article

Microstructure and Properties of Mooring Chain Steel Prepared by Selective Laser Melting

by
Xiaojie Cui
,
Xiaoxin Li
,
Changqing Hu
*,
Dingguo Zhao
,
Yan Liu
and
Shuhuan Wang
School of Metallurgy and Energy, Metallurgical Engineering, North China University of Science and Technology, Tangshan 063210, China
*
Author to whom correspondence should be addressed.
These authors contributed equally to this work.
Metals 2025, 15(5), 541; https://doi.org/10.3390/met15050541
Submission received: 5 March 2025 / Revised: 8 May 2025 / Accepted: 12 May 2025 / Published: 14 May 2025
(This article belongs to the Special Issue Manufacturing Processes of Metallic Materials)

Abstract

:
22MnCrNiMo steel, a high-strength low-alloy material, is primarily used in the production of mooring chains for offshore oil platforms, offshore wind turbines, and ships. The application of additive manufacturing technology allows for the direct fabrication of seamless mooring chains. This paper investigates the selective laser melting (SLM) process parameters for 22MnCrNiMo mooring chain steel, analyzing the effects of different process parameters on the microstructure, phase composition, and mechanical properties of the steel. The experimental results demonstrate that under the laser parameters of 200 W laser power, 800 mm/s scanning speed, 30 μm layer thickness, and 110 μm scanning spacing, the SLM-formed parts exhibit the best comprehensive mechanical properties, with a microhardness of 513.2 HV0.5, a tensile strength of 1223 MPa, a yield strength of 1114 MPa, an elongation of 8.5%, and an impact energy of 127 J. This study reveals the microstructure evolution and the mechanism of enhanced mechanical properties in SLM-fabricated 22MnCrNiMo steel, providing a new approach for the preparation of high-performance mooring chains using 22MnCrNiMo steel.

Graphical Abstract

1. Introduction

Mooring chain steel belongs to the category of high-strength low-alloy steel (HSLA) and is traditionally produced in steelworks through melting, casting, and rolling processes, resulting in steel billets. These billets are then heated at anchor chain processing plants, formed into links through bending and welding, and finally assembled into high-strength, corrosion-resistant mooring chains. Mooring chains are a critical component in the anchoring systems of offshore floating structures used in oil and gas extraction and wind energy generation [1,2,3,4].
Mooring chains have extensive application in offshore platforms, ship anchoring, and other marine engineering projects [5,6,7], particularly in R3- to R5-grade chains, whose mechanical and corrosion resistance properties have been extensively studied. R6-grade mooring chain steel has also been developed and is now in use. Continuously improving the mechanical properties of mooring chain steel can effectively enhance the performance of mooring chains [8,9,10]. However, the conventional manufacturing process of mooring chain steel involves bending, forming links, and welding, resulting in welds at each link, which typically exhibit lower impact toughness and corrosion resistance.
In the field of additive manufacturing of metal materials, selective laser melting (SLM) technology has emerged as an efficient, high-precision, and integrated method for the fast production of metal components. SLM can produce highly complex geometric parts with minimal fabrication steps and shorter production cycles, without the need for specific molds or pre-production costs [11,12,13]. Research by Chen et al. [14], Liverani et al. [15], and Karlsson et al. [16] highlights that parameters such as laser power, scanning speed, scanning strategies, and sample orientation significantly affect the microstructure, thereby influencing the mechanical properties of the fabricated components. Zhang et al. [17], Qiu et al. [18], and Montero-Sistiaga et al. [19] have studied the impact of laser power on porosity and grain structure development during manufacturing, which in turn affects the mechanical properties of the samples. Additionally, the composition of microstructures significantly influences mechanical properties; for instance, Wan et al. [20] proposed that both martensite and bainite structures contain high densities of dislocations, which, when moving, interact and increase stress, thereby enhancing the hardness and strength of steel samples. Sun et al. [21] demonstrated that the stress required for dislocation slip in crystal structures with twinning is 1 to 1.3 times higher than that without twinning.
Inspired by additive manufacturing technologies, the application of SLM in mooring chain fabrication enables the production of structurally integrated components with optimized performance. By leveraging new design strategies to align the relationship between the structure and properties of mooring chains, this paper employs SLM to fabricate high-performance 22MnCrNiMo mooring chain steel. The study focuses on altering the laser energy density parameters utilized for printing the steel and investigates the resulting phase organization and mechanical properties.

2. Experimental Materials and Methods

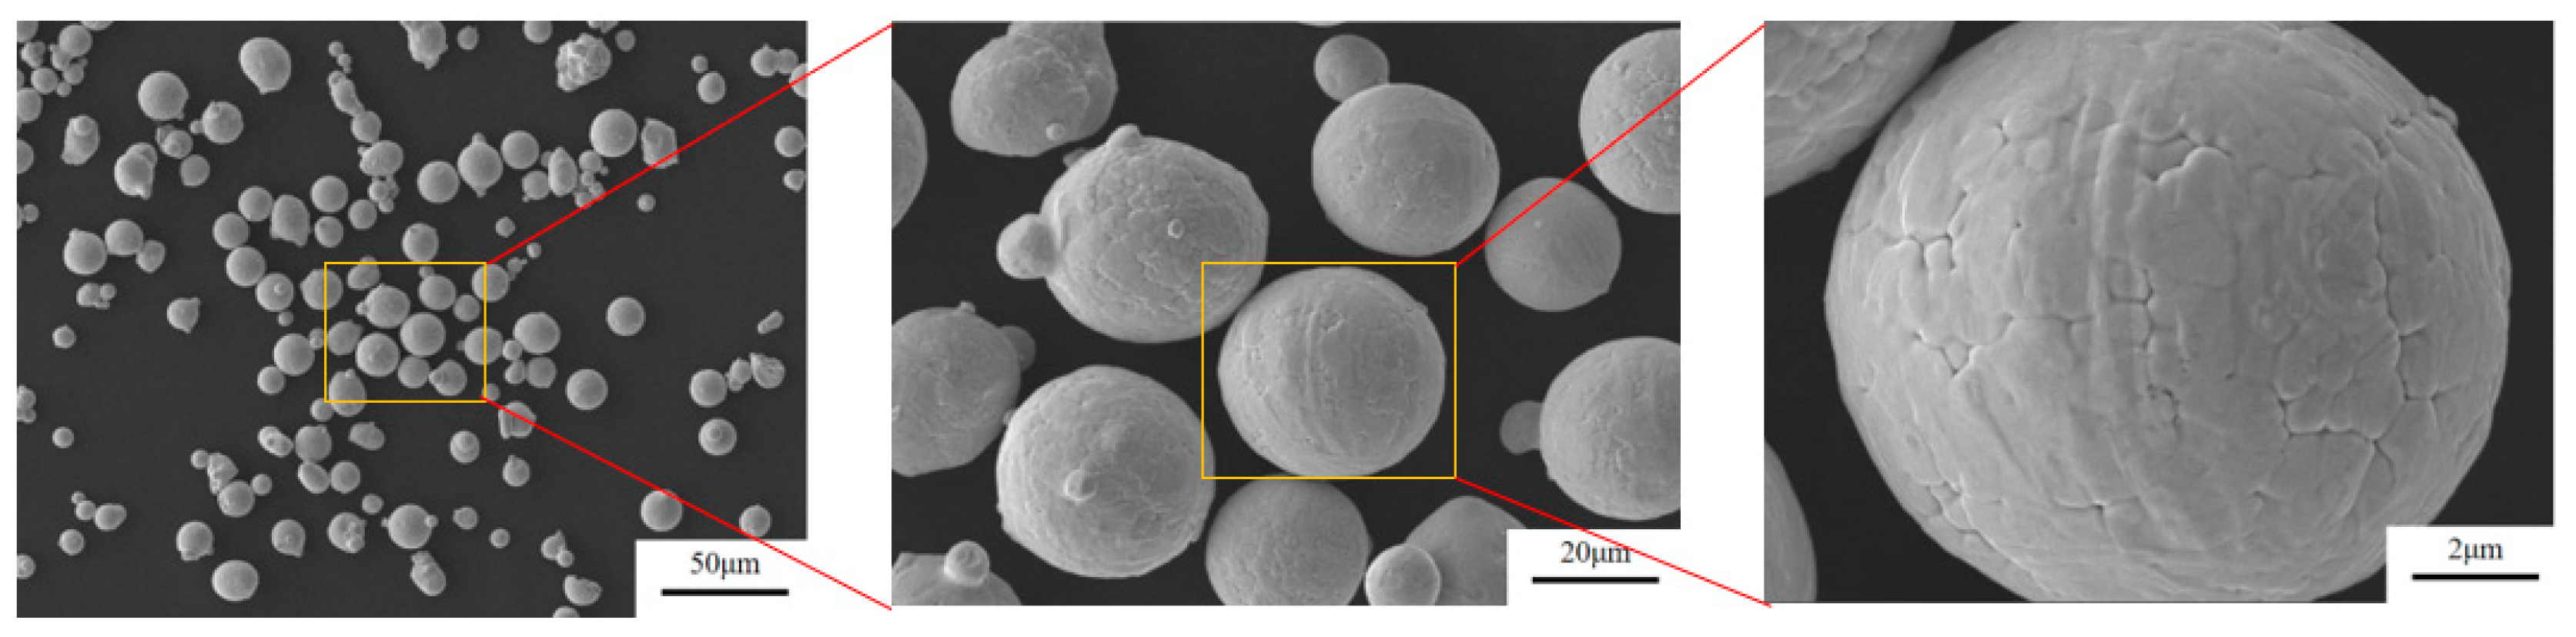
2.1. Mooring Chain Steel Experimental Materials

The experimental material was prepared using a vacuum induction melting gas atomization (VIGA) method to produce 22MnCrNiMo steel powder. This powder is produced by Foshan Chengfeng Material Technology Co., Ltd. (Foshan, China).
The primary chemical composition was analyzed using ICP-OES (Inductively Coupled Plasma Optical Emission Spectrometry) and a carbon–sulfur analyzer, as shown in Table 1. The steel belongs to the R4-grade mooring chain steel category.
The gas-atomized raw powder has a relatively fine particle size. The powder particle size distribution was measured using a Malvern laser particle size analyzer, and the resulting particle size distribution graph is shown in Figure 1. It can be observed that the proportion of powder with particle sizes suitable for 3D printing (15~53 μm) is the highest. The powder flowability was measured using a Hall flow meter, yielding a flow time of 18.6 s per 50 g. The apparent density of the powder was measured using a Topsizer particle size analyzer, resulting in a bulk density of 4.16 g/cm3.
The microstructure of the powder is shown in Figure 2. It can be observed that the powder exhibits a high sphericity with no significant agglomeration, making it suitable for SLM (selective laser melting) for the production of printed parts. The atomized powder was dried in a vacuum drying oven with drying parameters set at 80 °C for 6 h. After screening the powder through a specialized sieve, powder with a particle size range of 15–53 μm and an average particle size of 30.3 μm was selected as the raw material for additive manufacturing of mooring chain steel.

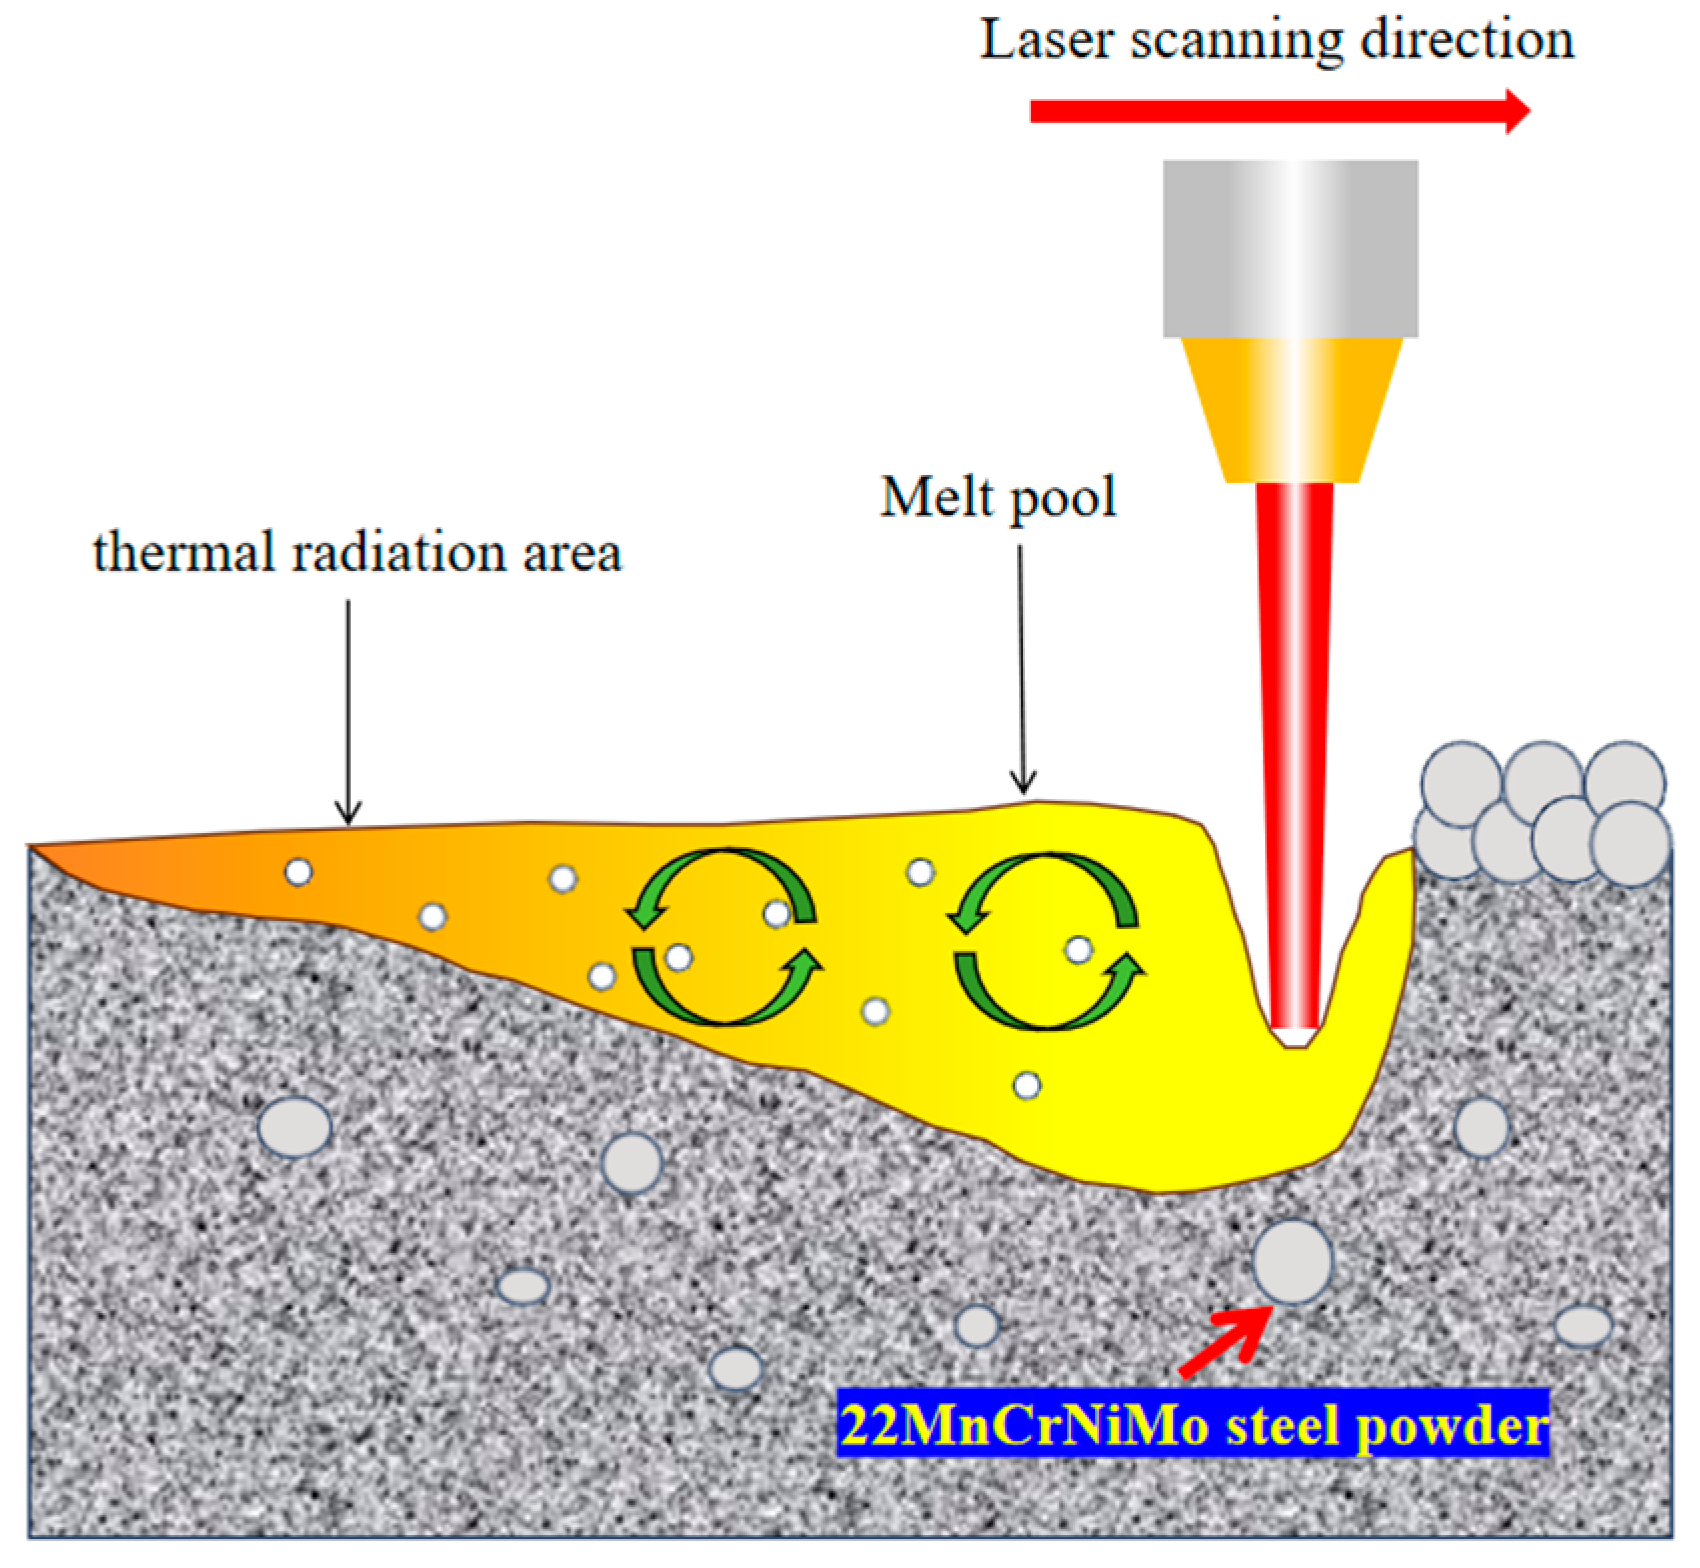
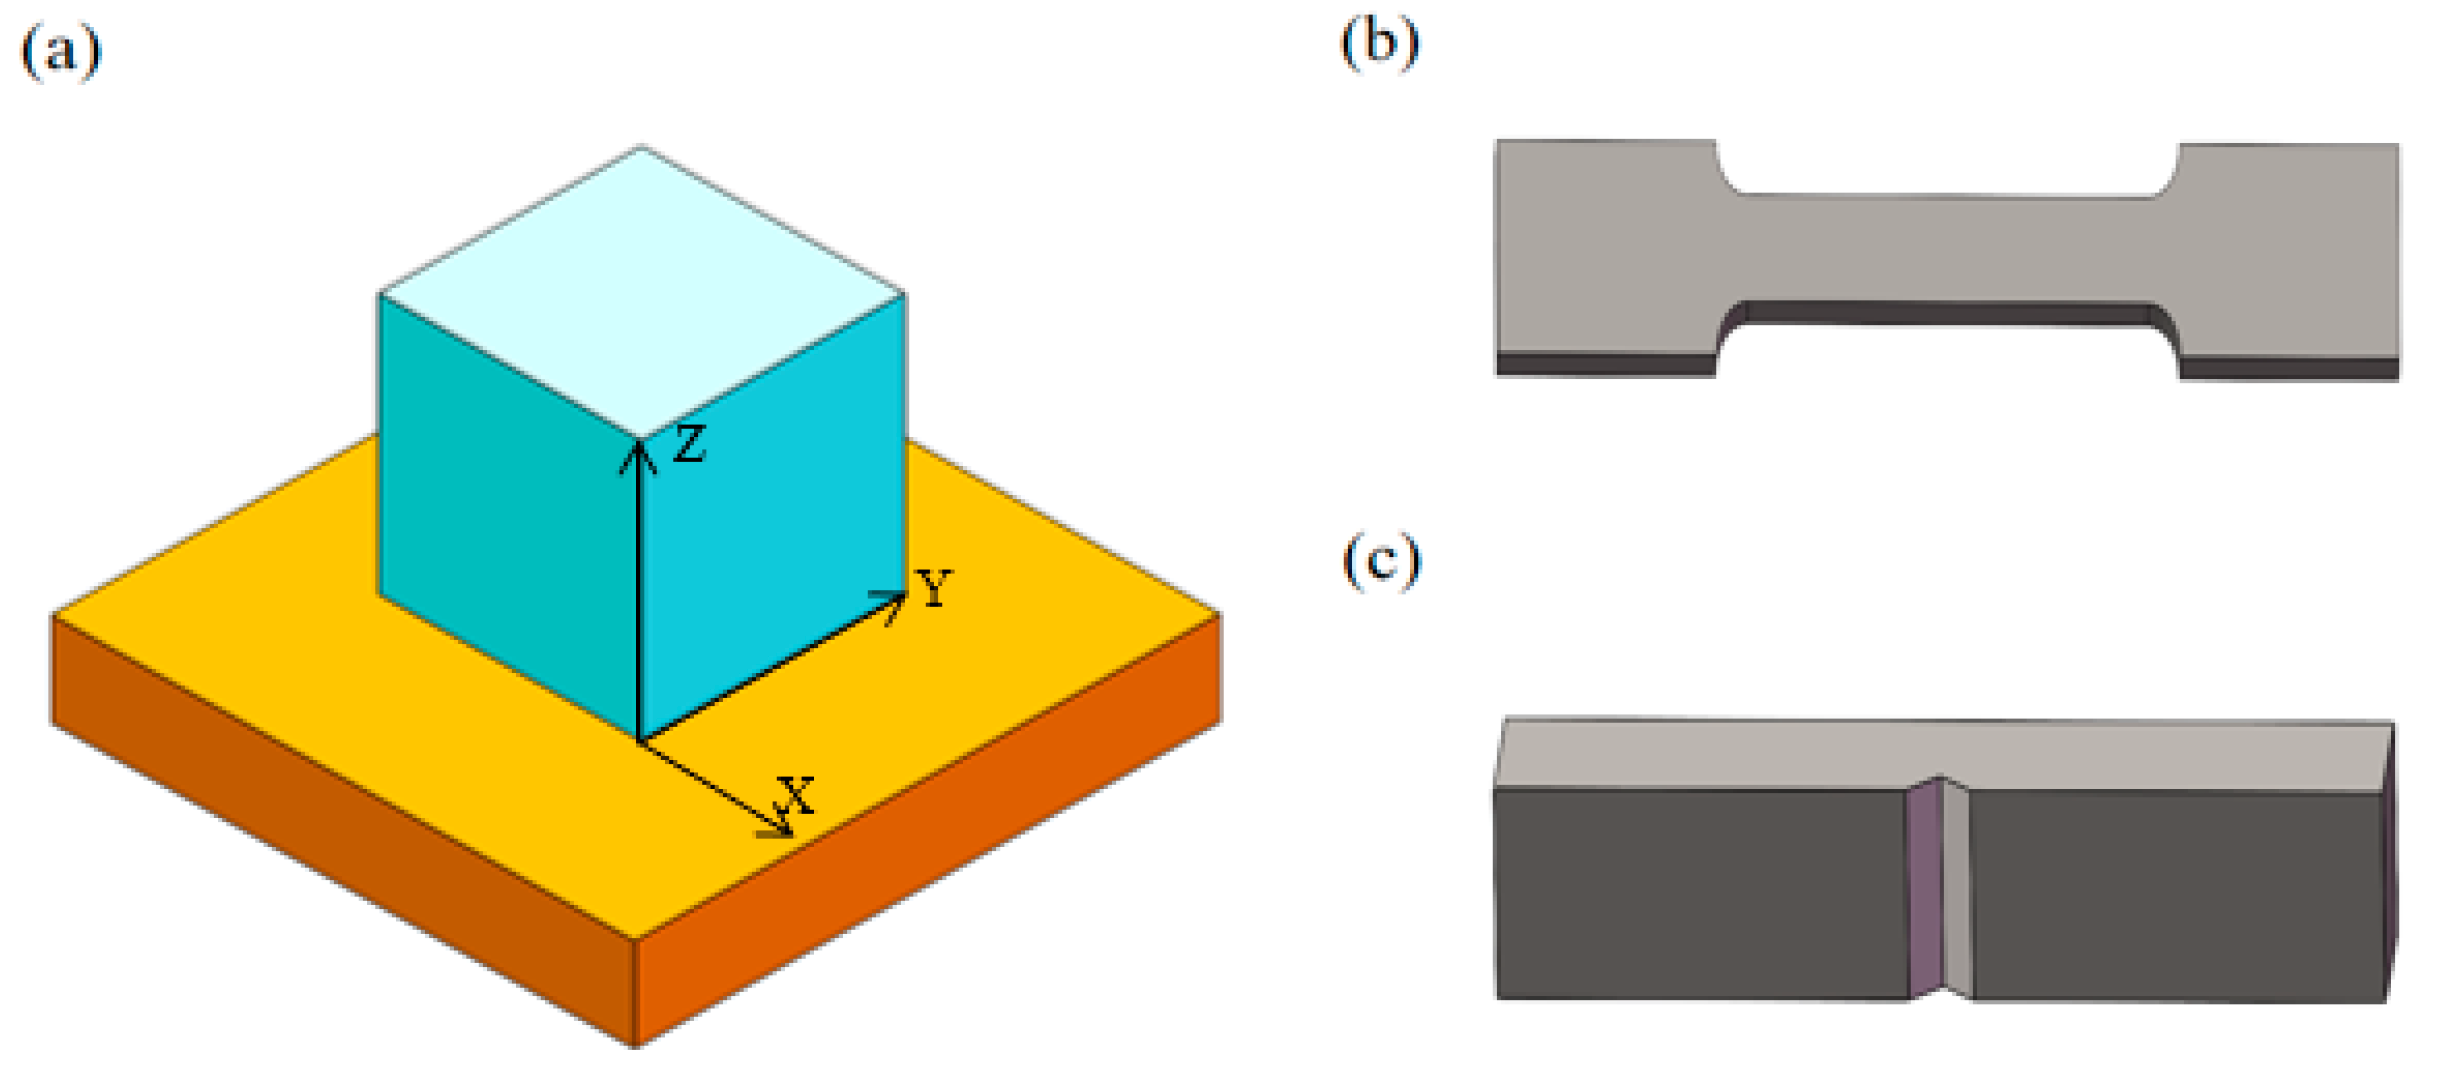
2.2. Method for Preparing Mooring Chain Steel by Selective Laser Melting

This study employed the EP-M150 small-scale metal laser additive manufacturing machine by Eplus3D (Beijing, China) to fabricate mooring chain steel components, as shown in Figure 3. The base plate of the equipment is circular with a diameter of 150 mm. The selective laser melting (SLM) equipment was equipped with a continuous single-mode ytterbium fiber laser (maximum power of 500 W, wavelength of 1080 ± 5 nm). The focusing optical system utilized an F-θ lens with a focal length of 254 mm, which produces a focused laser beam spot diameter of approximately 90 μm. The experimental equipment was also equipped with a base plate preheating device capable of reaching a preheating temperature of 150 °C. During the SLM process, argon gas was used as the protective gas to prevent oxidation of the samples, ensuring that the oxygen volume fraction inside the printer’s build chamber is less than 0.01%.
The schematic diagram of the process for preparing mooring chain steel by SLM is shown in Figure 4. After each layer of powder was melted, the forming cylinder descended by one layer. Then, the powder was re-spread on the powder bed, and the selective scanning continued for layer-by-layer printing. To minimize porosity and further melt the unmelted powder, a cross-scanning strategy was adopted, in which the laser scanning direction rotated periodically by 67° between adjacent layers.
In the experimental plan, the powder bed was set with a layer thickness (t) of 30 μm and a scan spacing (h) of 110 μm. The laser processing parameters include laser power (P) and scan speed (v). The laser power was optimized within a range of 175–325 W, while three scan speeds—800, 1000, and 1200 mm/s—were chosen. As shown in Table 2, the parameter combinations studied and their corresponding energy densities are listed. Typically, in SLM, the laser energy density E (J/mm3) is used as an evaluation metric for printing parameters, and the formula is shown in Equation (1) [22]:
E = P/(vhd)
where P is the laser power, v is the laser scanning speed, h is the thickness of the powder layer, and d is the laser scanning spacing.
A portion of the cube specimens, tensile specimens, and impact specimens obtained from the experiments is shown in Figure 5. As can be observed, the printed components exhibit good forming quality, with no macroscopic cracks or pores. The specimens have a high degree of density.

2.3. Testing Methods and Equipment for Microstructure and Properties of 22MnCrNiMo Steel

This study evaluates the mechanical properties and microstructural observations of three types of fabricated samples. These include 10 mm × 10 mm × 10 mm cubic specimens for microstructural observation and hardness testing, 70 mm × 31 mm × 5 mm tensile specimens, and 10 mm × 10 mm × 55 mm impact specimens, which have a 2 mm V-notch machined into them, as shown in Figure 6a–c.
Before conducting optical and scanning electron microscopy (SEM) observations, the samples were polished using sandpaper with grits ranging from 240 to 2000, followed by 20 min of polishing with 1 μm diamond paste. The polished samples were then observed under a LEICA DM2500M (Suzhou Nan Guang Electronics Technology Co., Ltd., Suzhou, China) wide-field metallographic optical microscope to examine the XY and XZ planes, with the orientation of the observation surfaces shown in Figure 6a.
The samples were analyzed using a ZEISS GEMINI300 (Guoyi Quantum Technology Co., Ltd., Hefei, China) field emission scanning electron microscope (SEM) to observe their metallographic and micro- structures. The SEM was equipped with an Oxford Nordlys3 fast electron backscatter diffraction (EBSD) system (Guoyi Quantum Technology Co., Ltd., Hefei, China). For metallographic etching, a 4% nitric acid alcohol solution was used. The etching solution was applied to the sample surface for 5 s, followed by rinsing with anhydrous ethanol. Prior to EBSD experiments, the samples were ion-etched for 60 min using a PECSII 685 (Gatan Company, Pleasanton, CA, USA) device.
Tensile specimens were designed according to the ISO 6892-1 standard and tested using an AG-X 100 kN electronic universal testing machine at room temperature (Shimadzu Corporation, Kyoto, Japan) with a tensile speed of 0.5 mm/min. The schematic of the tensile specimen is shown in Figure 6b. Impact specimens were tested using a PIT-450 pendulum impact testing machine at −20 °C, with the schematic shown in Figure 6c. The fracture morphologies of the tensile and impact specimens were observed using an SEM.
An FE-800 microhardness tester (Suzhou Nan Guang Electronics Technology Co., Ltd., Suzhou, China) was used to measure the Vickers hardness (HV) of the polished samples at room temperature. The tester is suitable for microscopic analysis, with a fixed loading force of 1 kg and a loading time of 15 s. Five random points were selected on each sample surface, and the average value of the measurements was taken as the hardness of the sample.

3. Experimental Results and Analysis

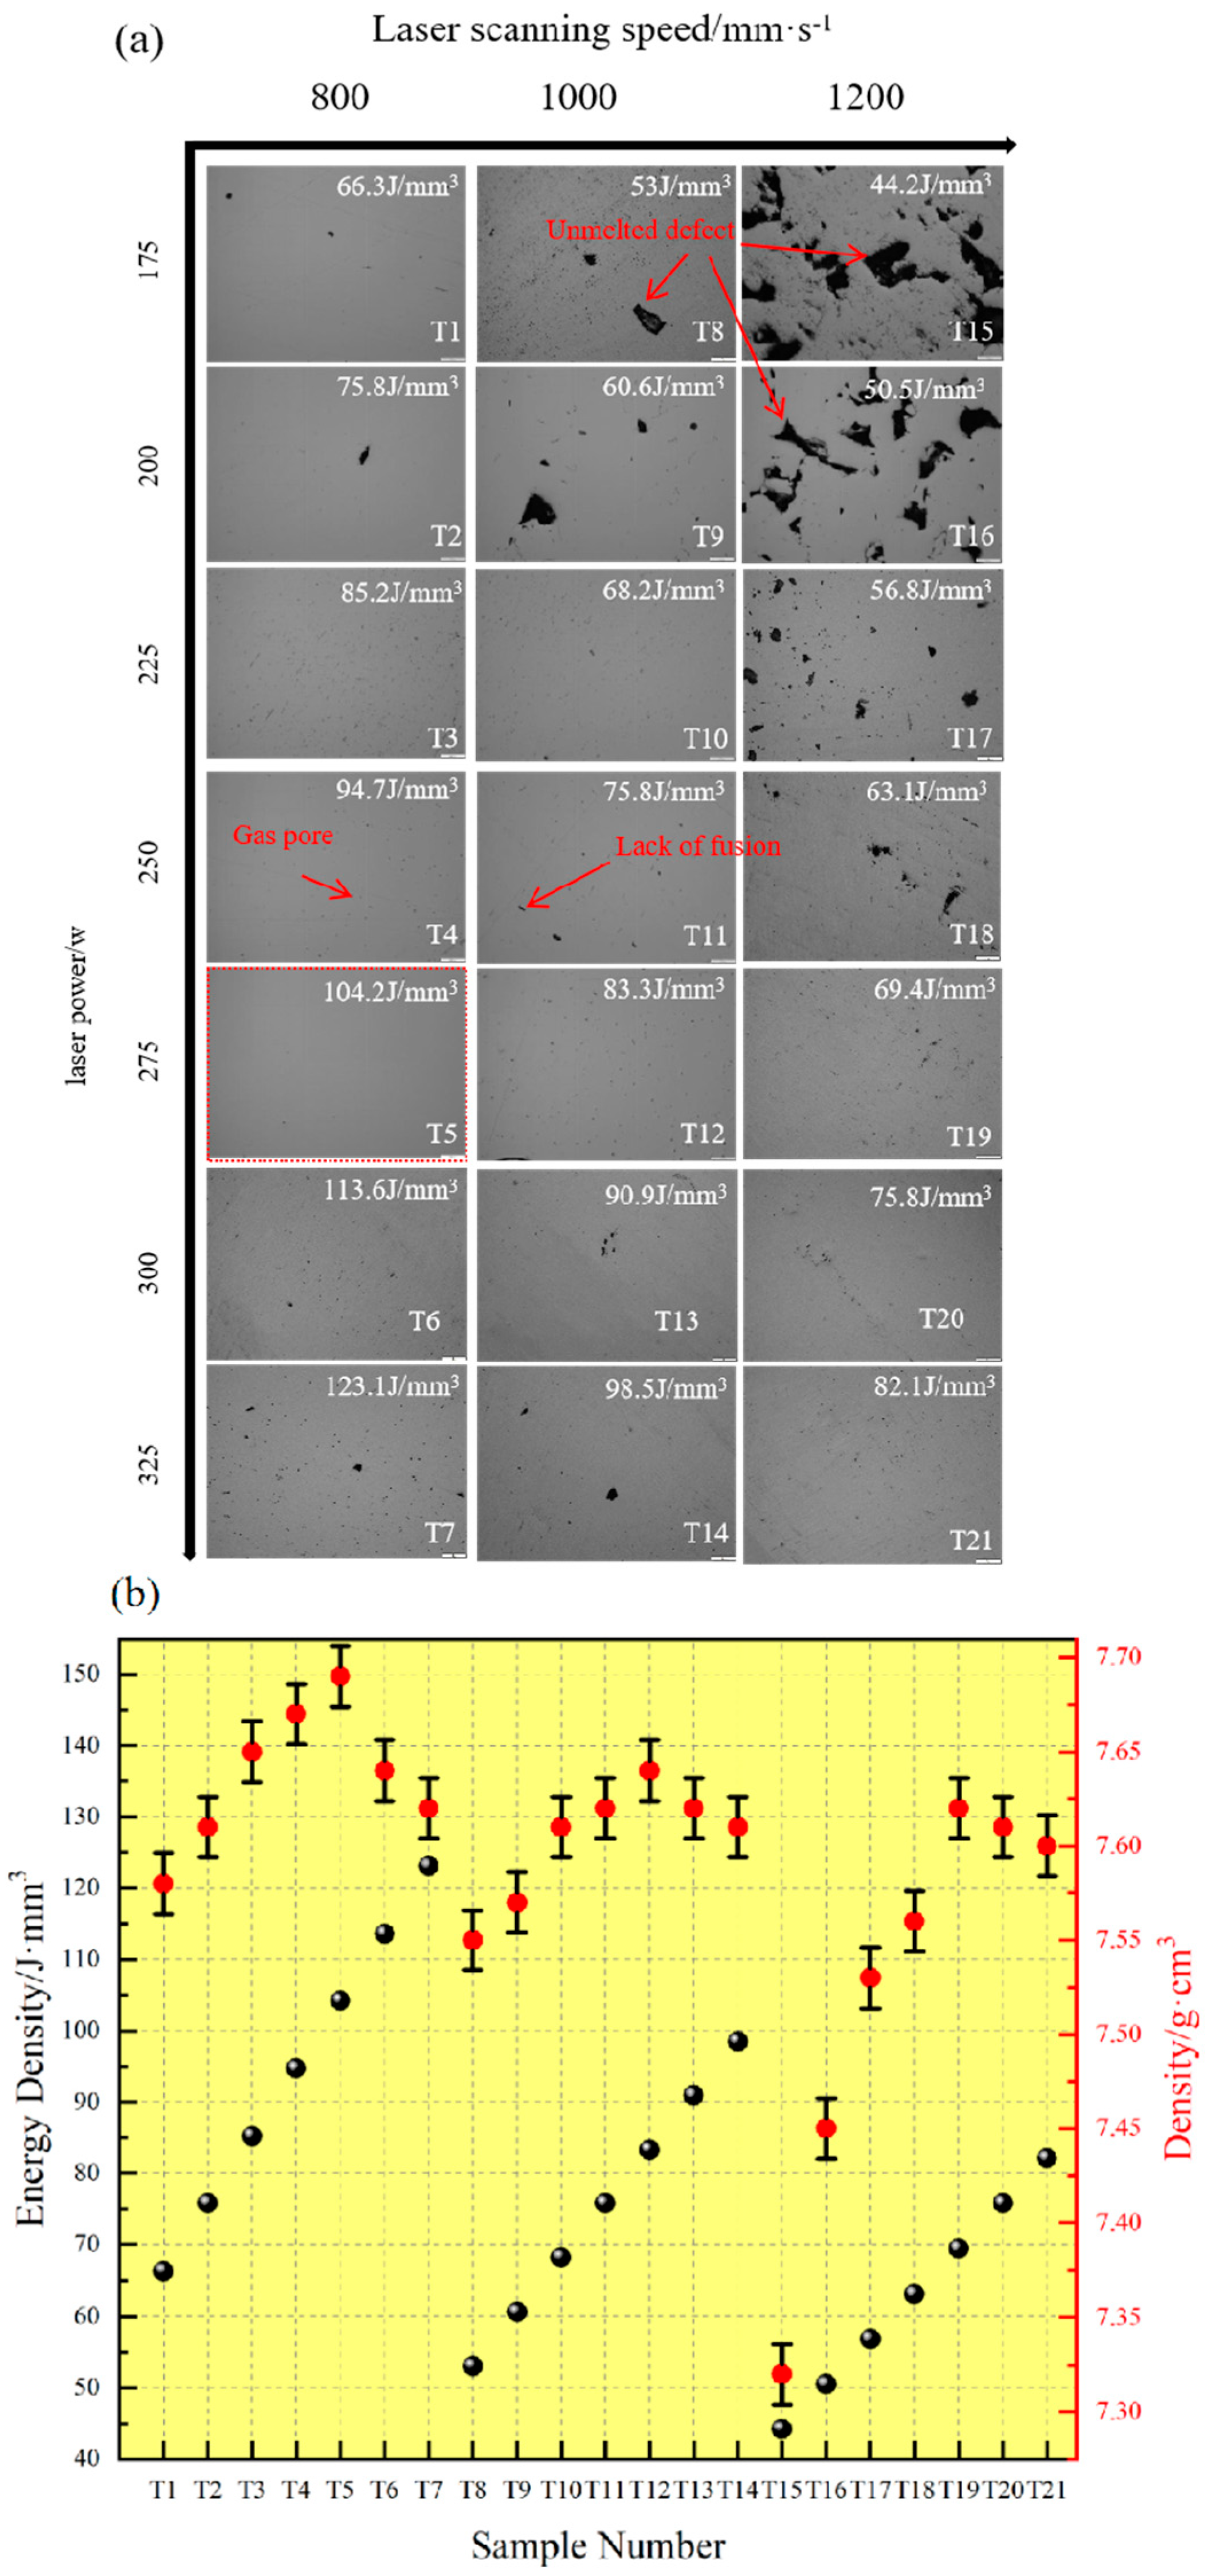
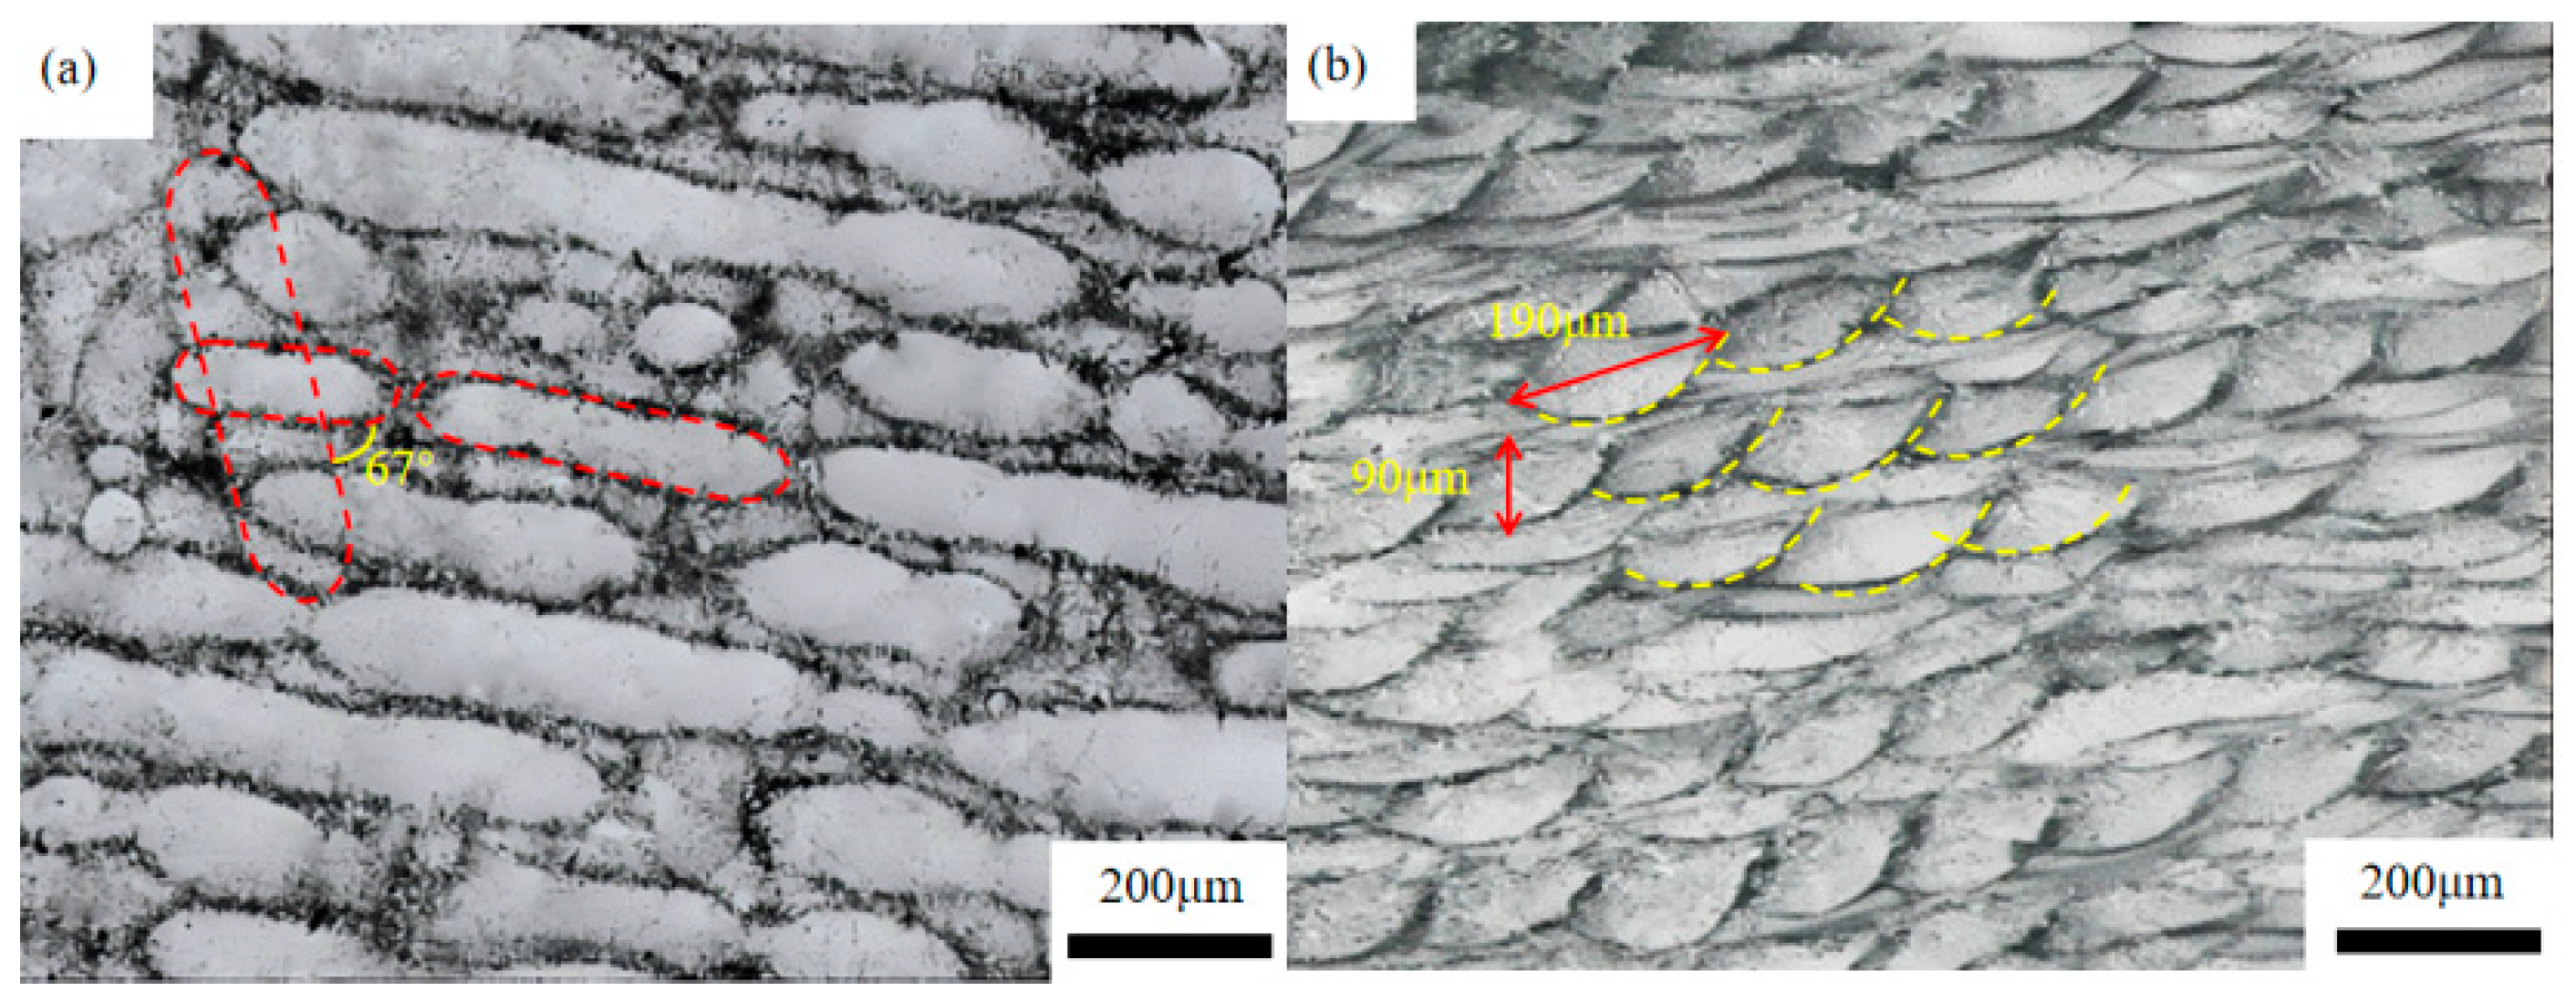
3.1. Parameter Optimization and Micro-Molten Pool Morphology of 22MnCrNiMo Steel Prepared by SLM

The P–V diagram of the formed 22MnCrNiMo steel samples prepared under different laser power and scanning speed conditions is shown in Figure 7a. Improper laser forming process parameters can easily lead to defects in the samples, such as pores, unmelted powder, and microcracks [23]. As can be seen in the figure, the number of defects in the samples increased with decreasing energy density.
Samples with excessively low laser energy density, such as sample T15, exhibit many defects. This is because the insufficient energy density prevented the powder from fully melting, resulting in unmelted material defects [24]. During the SLM (selective laser melting) process, where the laser beam cannot adequately penetrate previously deposited powder layers, defects can form between the deposition layers, as seen in sample T11. In samples T3 and T4, a few spherical micro-pores are present, primarily due to rapid solidification during the preparation process, which traps gases and often serves as a source of microcracks.
Controlling the energy density is crucial for reducing defects, and selecting an appropriate energy density can produce high-density components. Increasing the energy density can mitigate material defect formation and reduce porosity in the material. However, excessively high energy density can promote grain growth and may lead to overheating, which in turn affects material strength [25] and results in additional energy consumption.
Testing the sample density can also reflect the internal defect situation. The sample density ρ s is calculated using Equation (2) [26]. The variation in sample density ρ s is shown in Figure 7b, revealing that as the energy density increases, the density first rises and then decreases.
ρ s = m 1 m 1 m 2 × ρ 0
In the formula, m1 and m2 are the mass of the sample in air and ethanol liquid (concentration of 99.7%), g; ρ 0 is the density of ethanol liquid, g/cm3.
Taking into account all factors, we conducted in-depth experiments using the preparation process parameters for samples T1 to T7.
Formed parts of 22MnCrNiMo steel with a laser power of 275W were selected for observation using optical microscopy (OM) to analyze the morphology of the SLM (selective laser melting) micro-melt pools. Figure 8a shows the XY cross-section, illustrating the scanning traces of different orthogonal deposition layers. SLM is a layer-by-layer construction process, and, due to the scanning strategy involving 67° rotation for each layer, the micro-melt pools overlap and interconnect, resulting in a dense formation.
As seen in Figure 8b, the XZ plane features numerous “fish scale”-like micro-melt pools with diameters ranging from 150 to 200 μm and depths of 80 to 120 μm. This is typical of the lateral micro-melt pool morphology in selective laser melting.

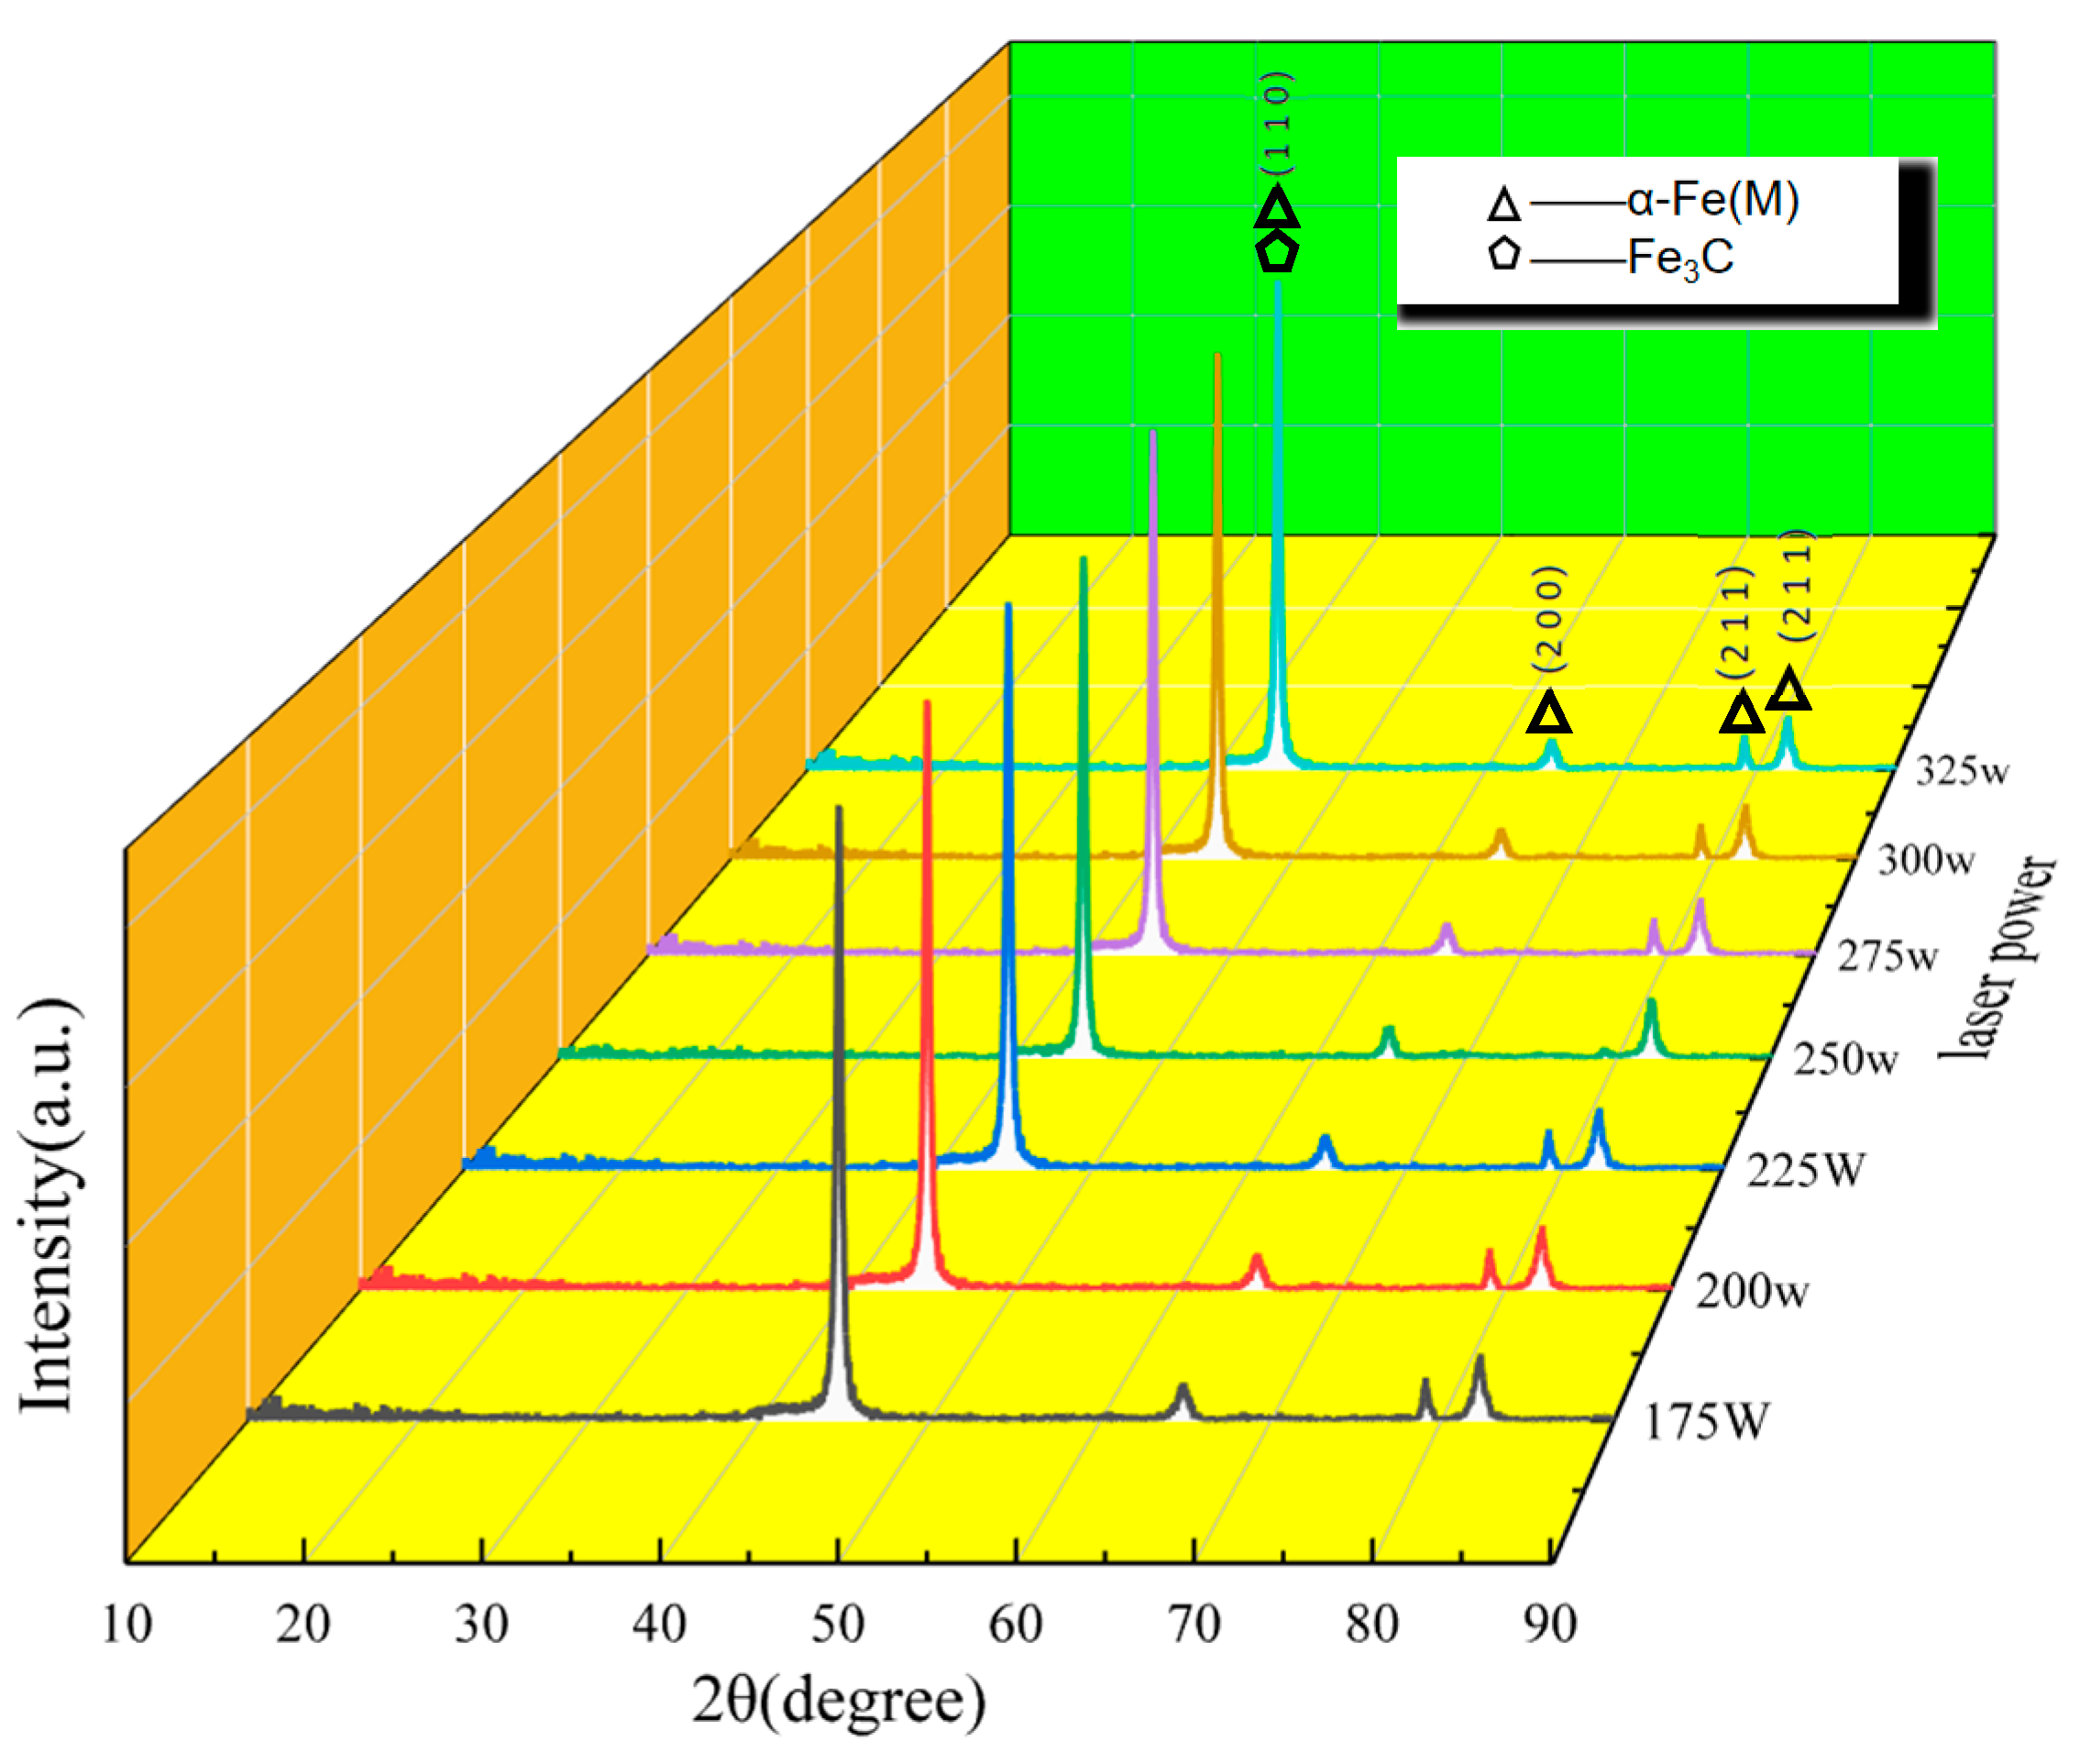
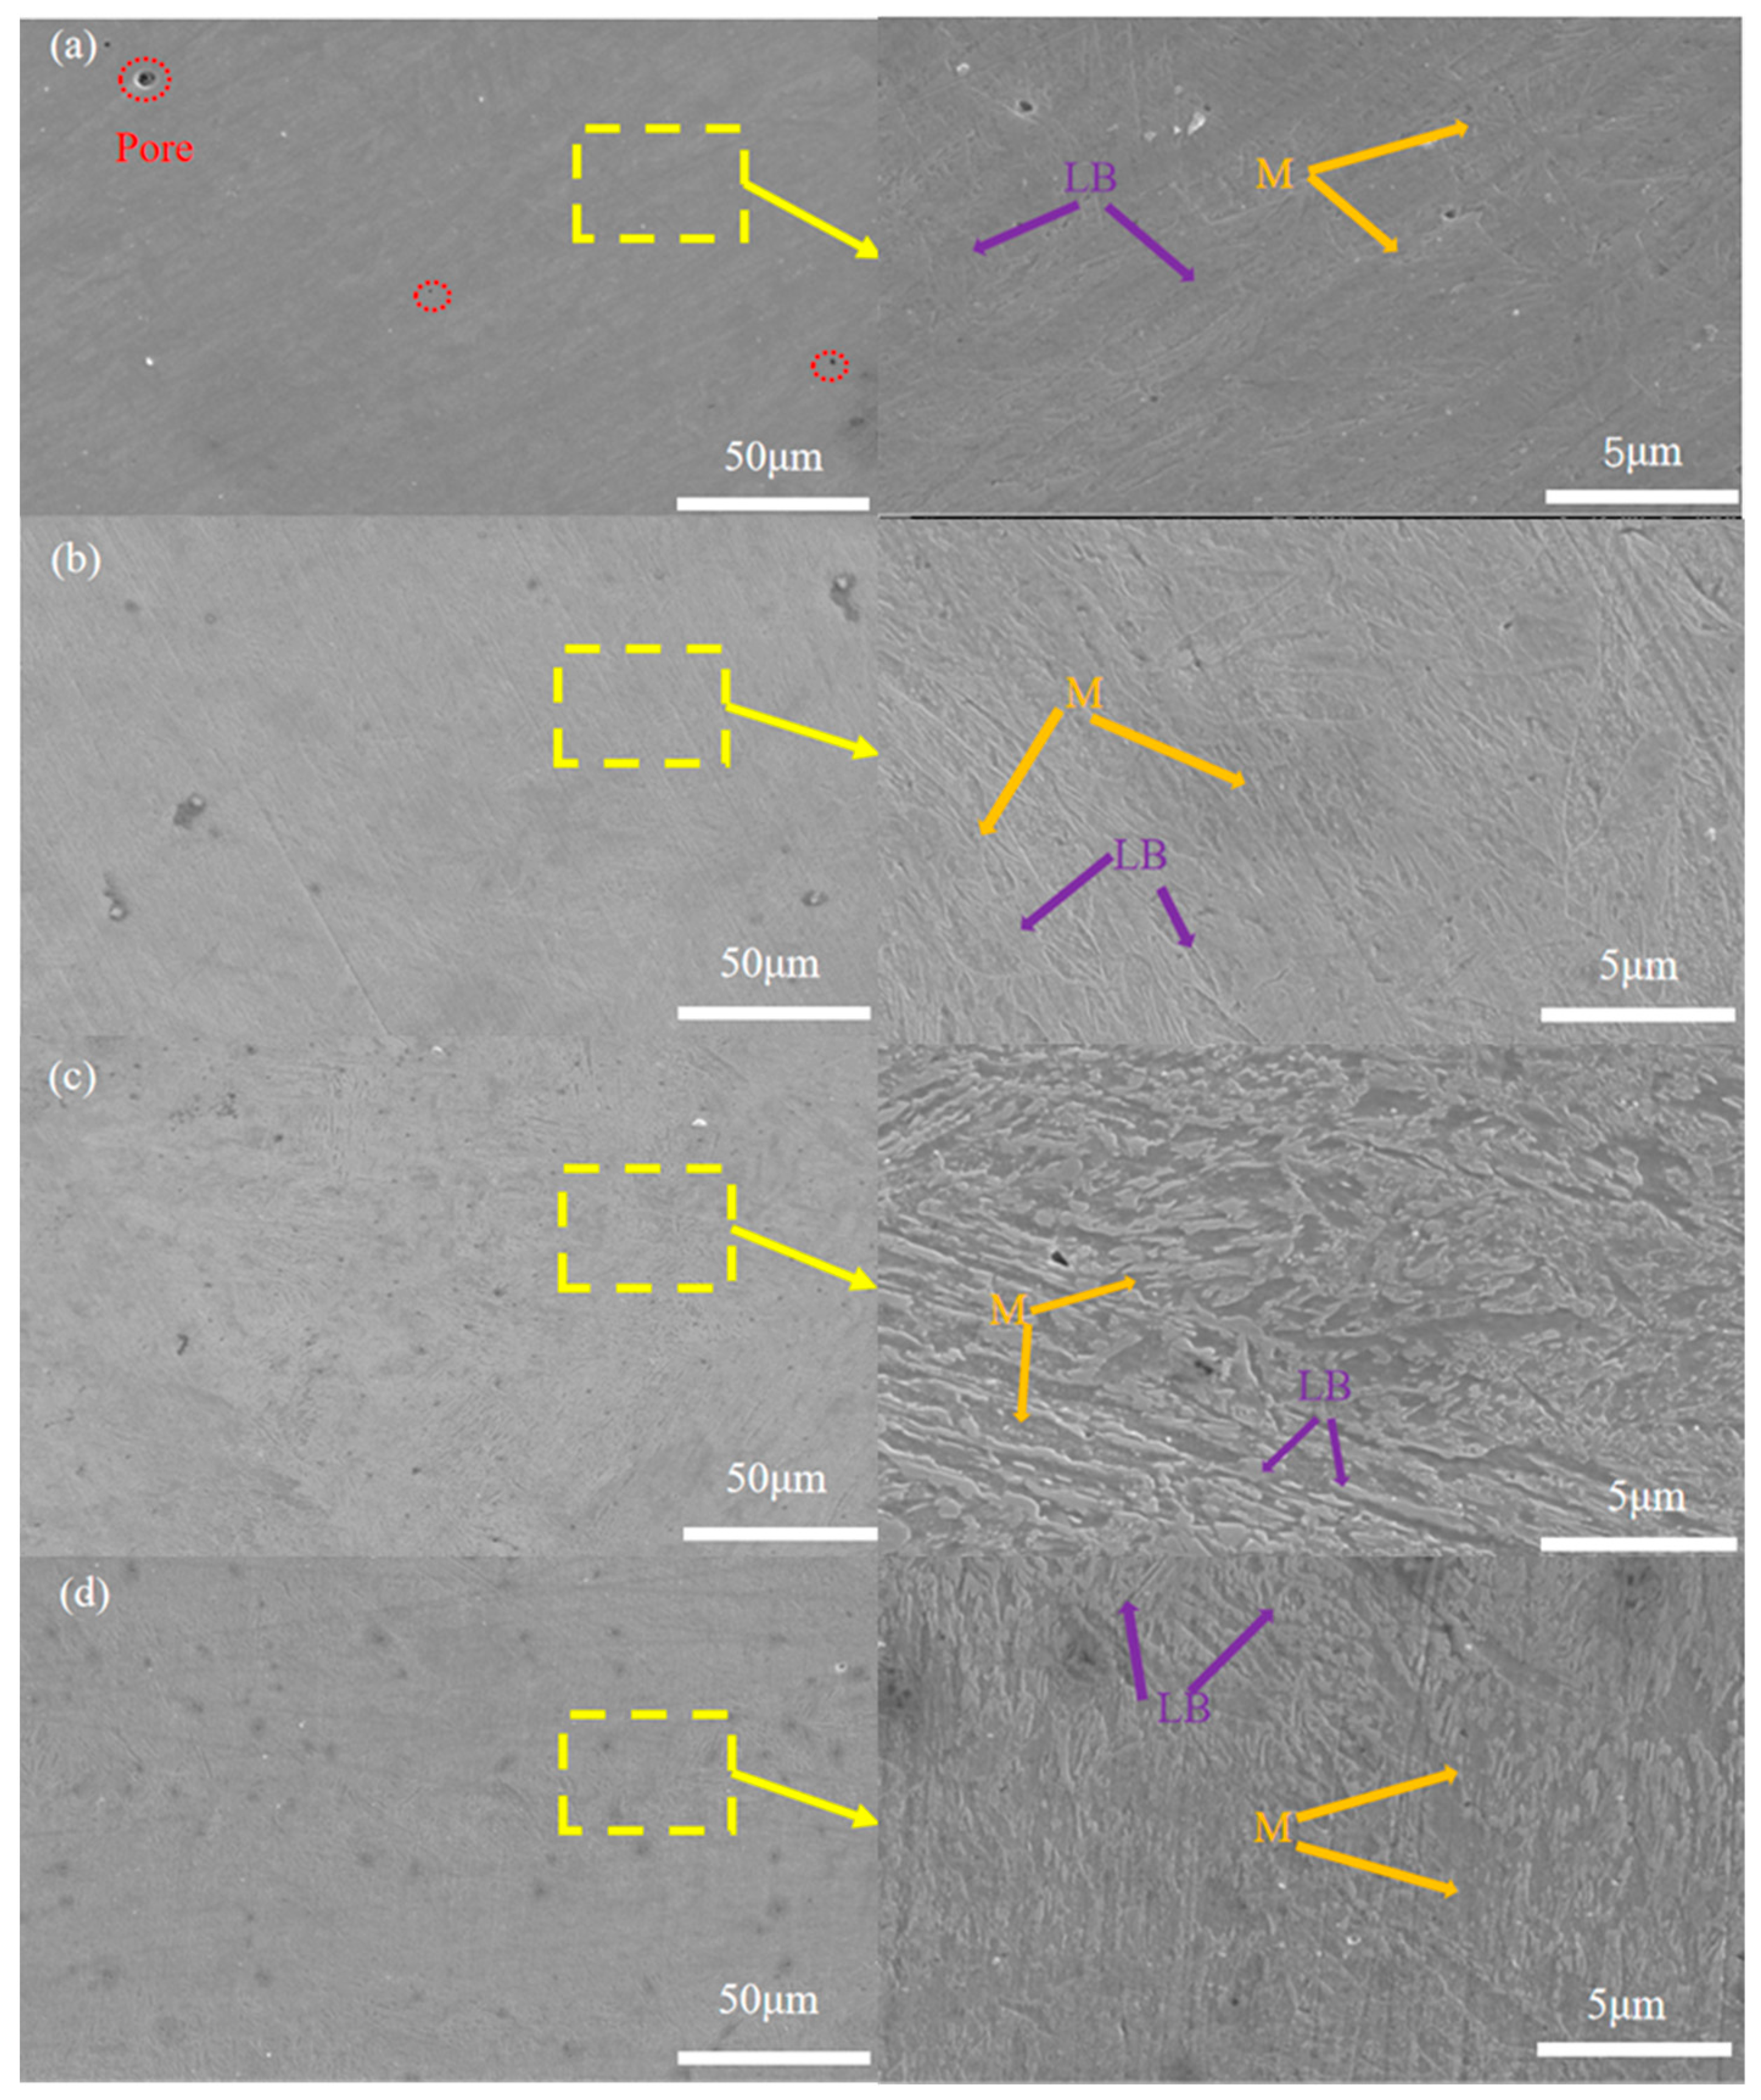
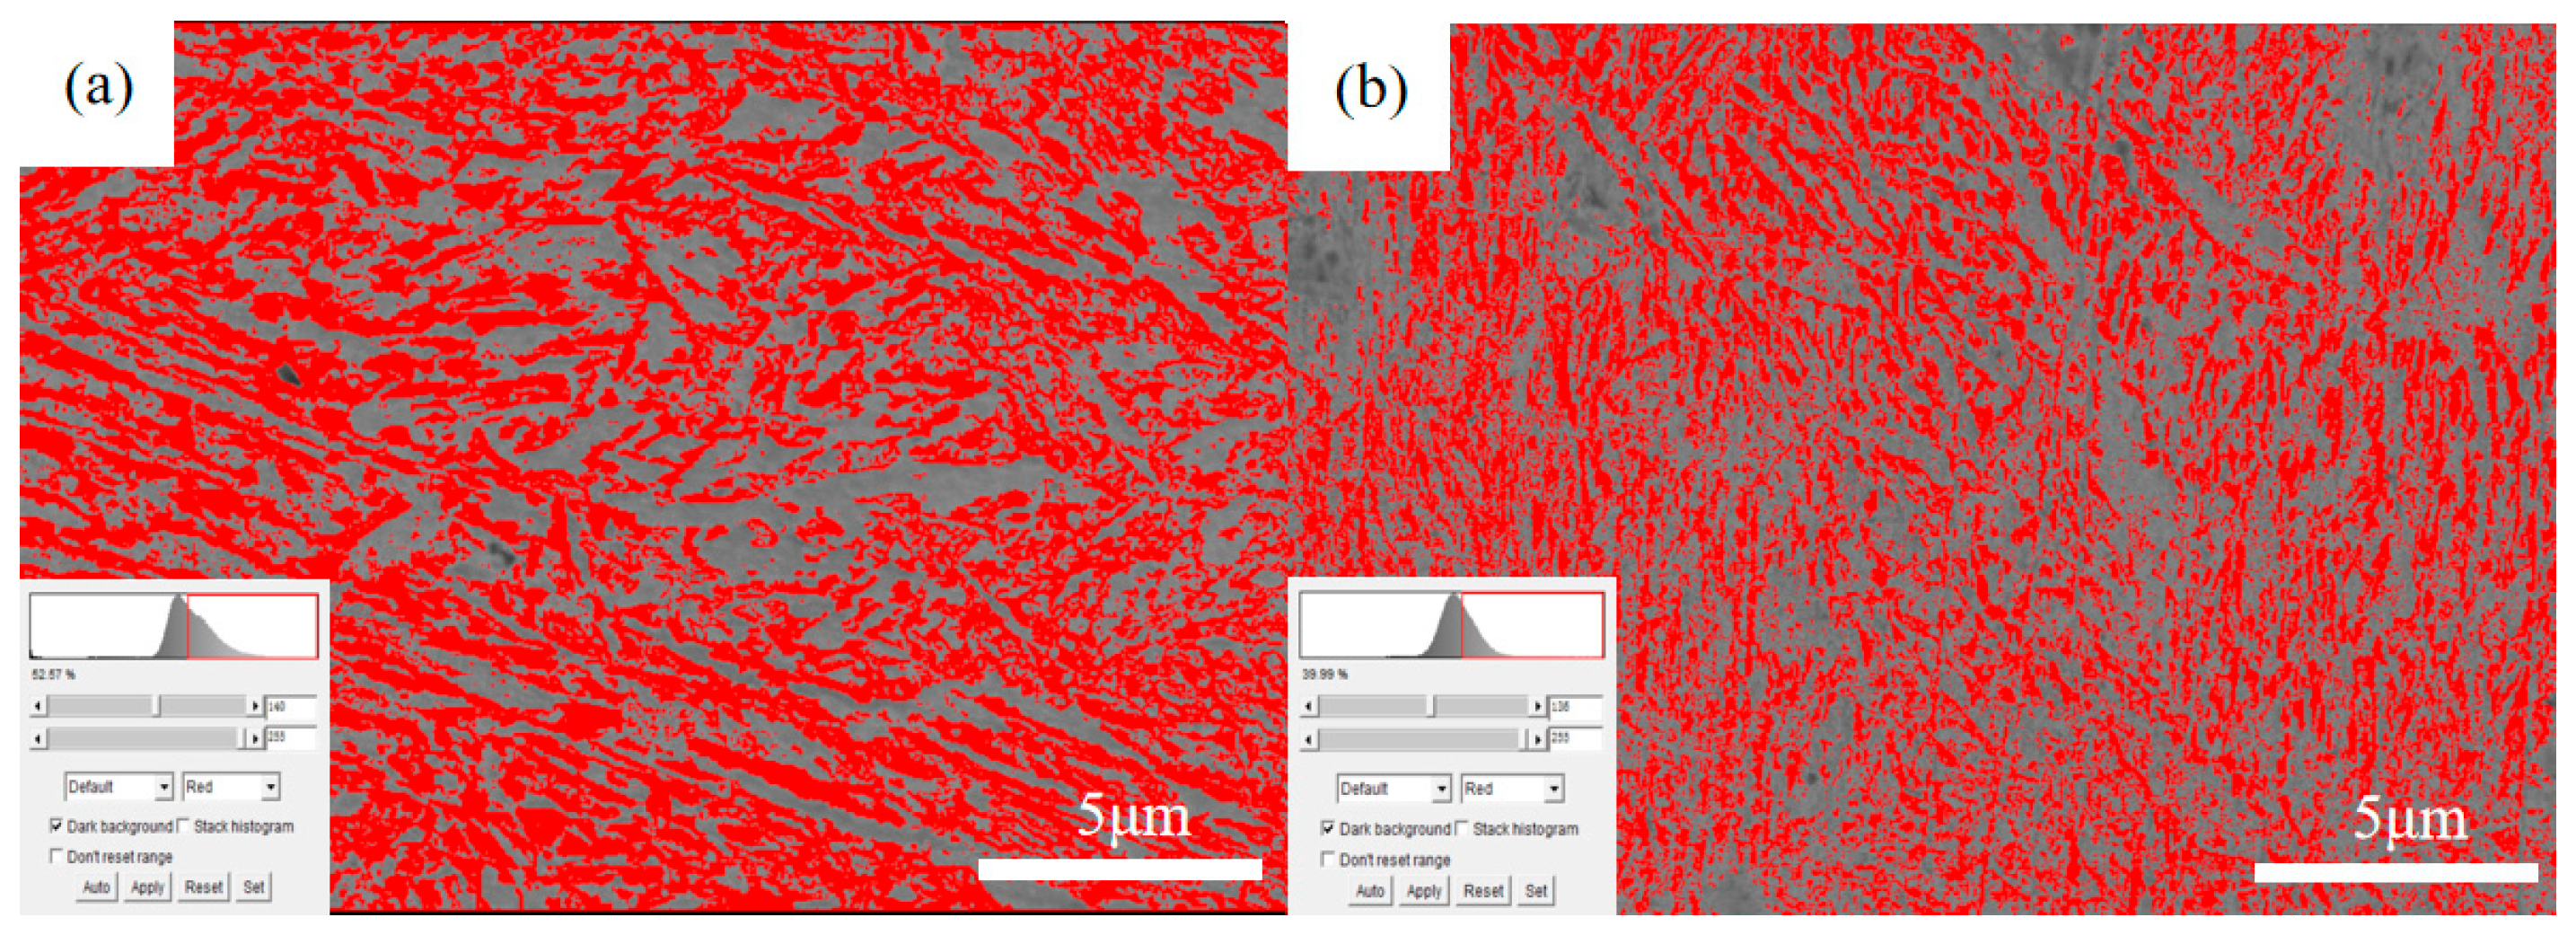
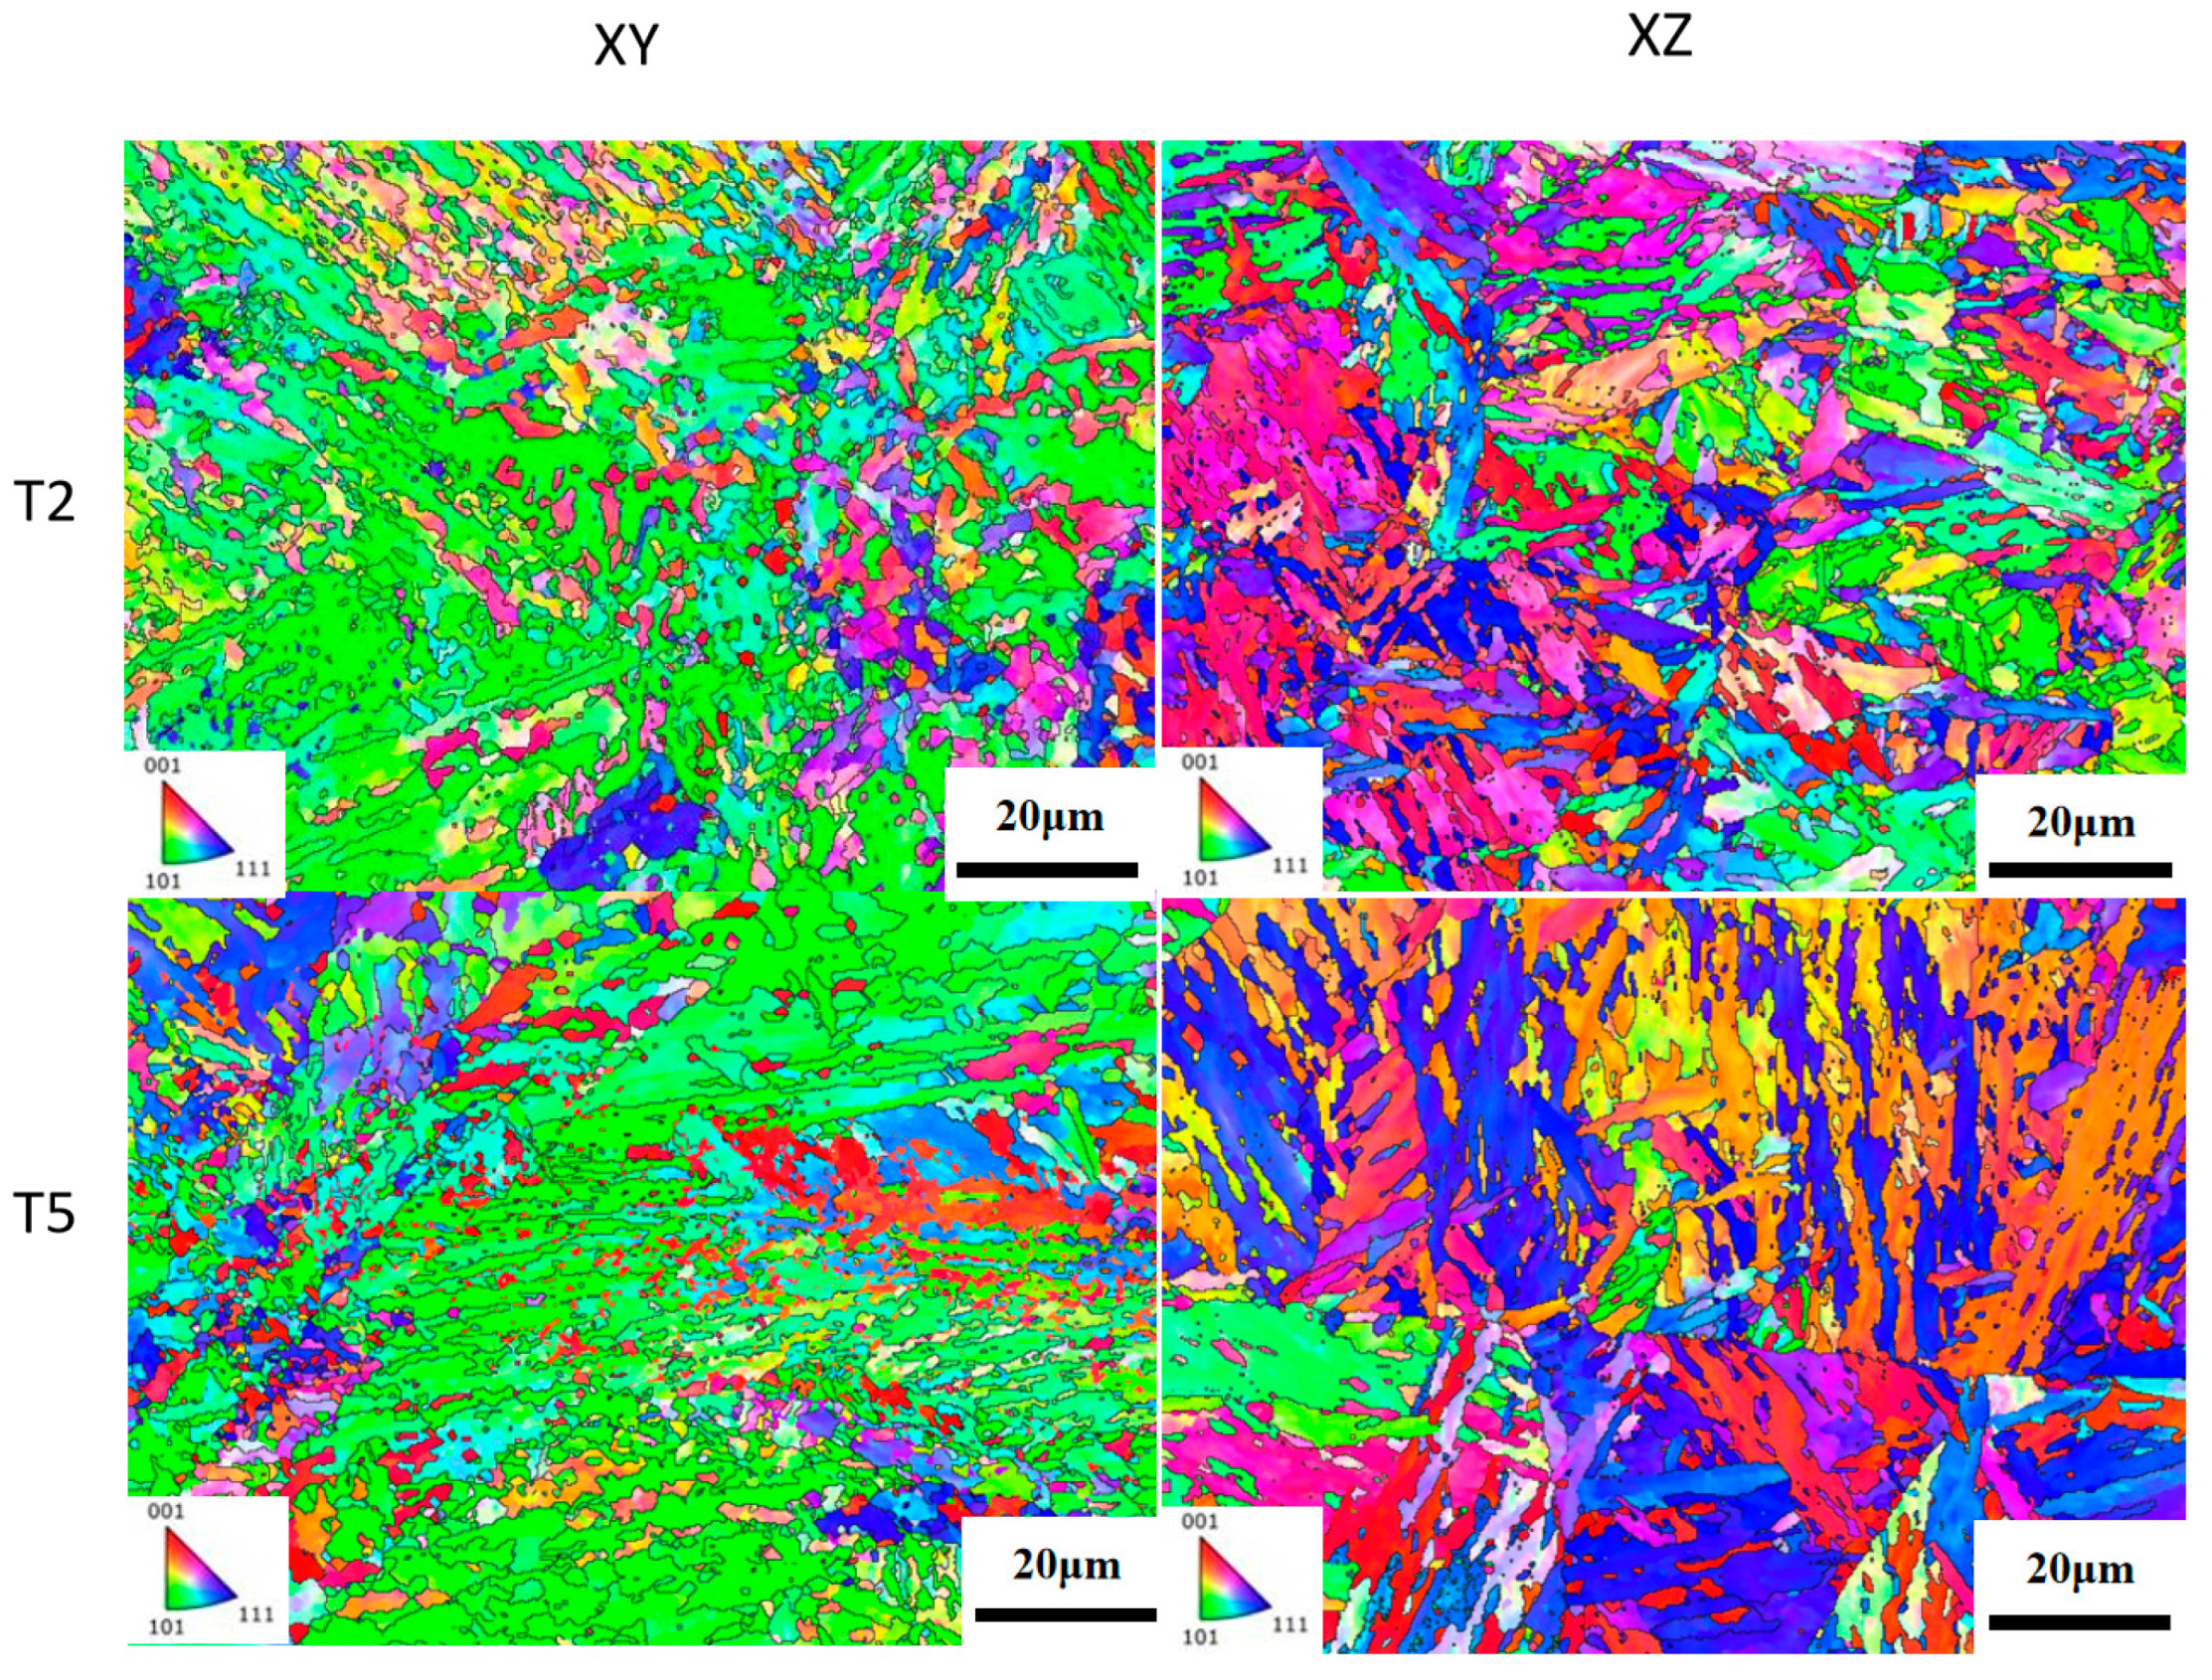
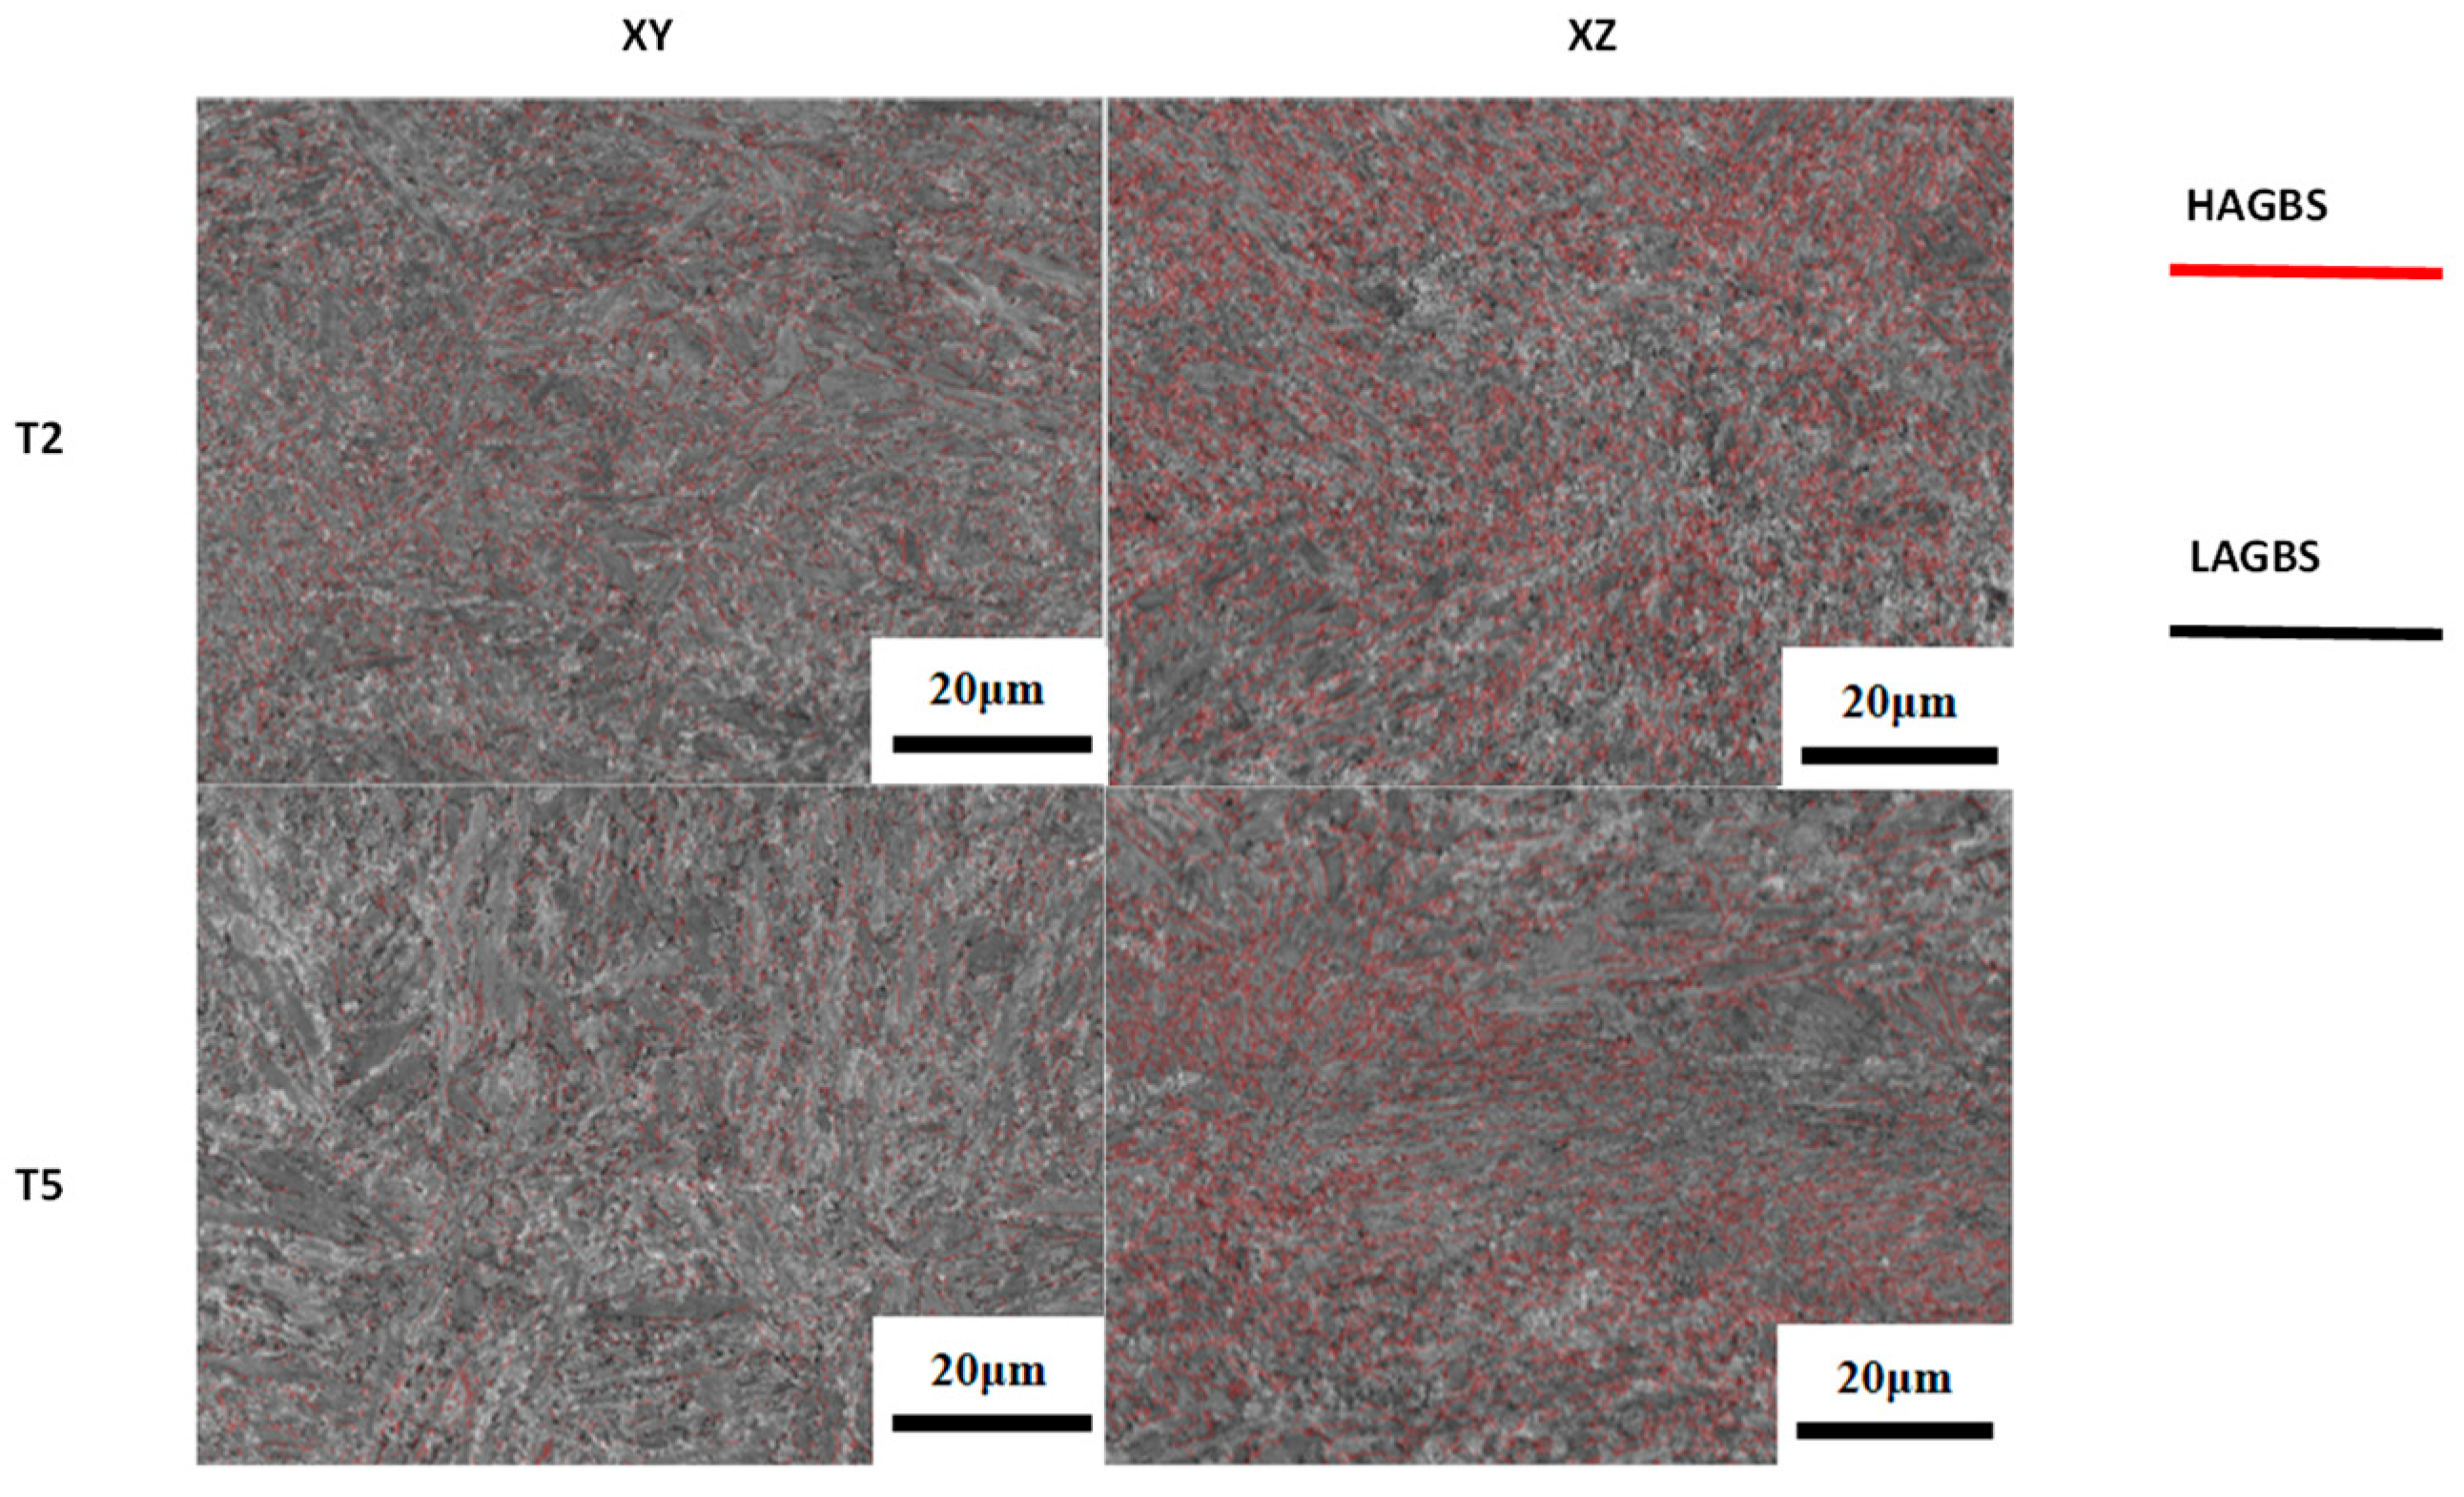
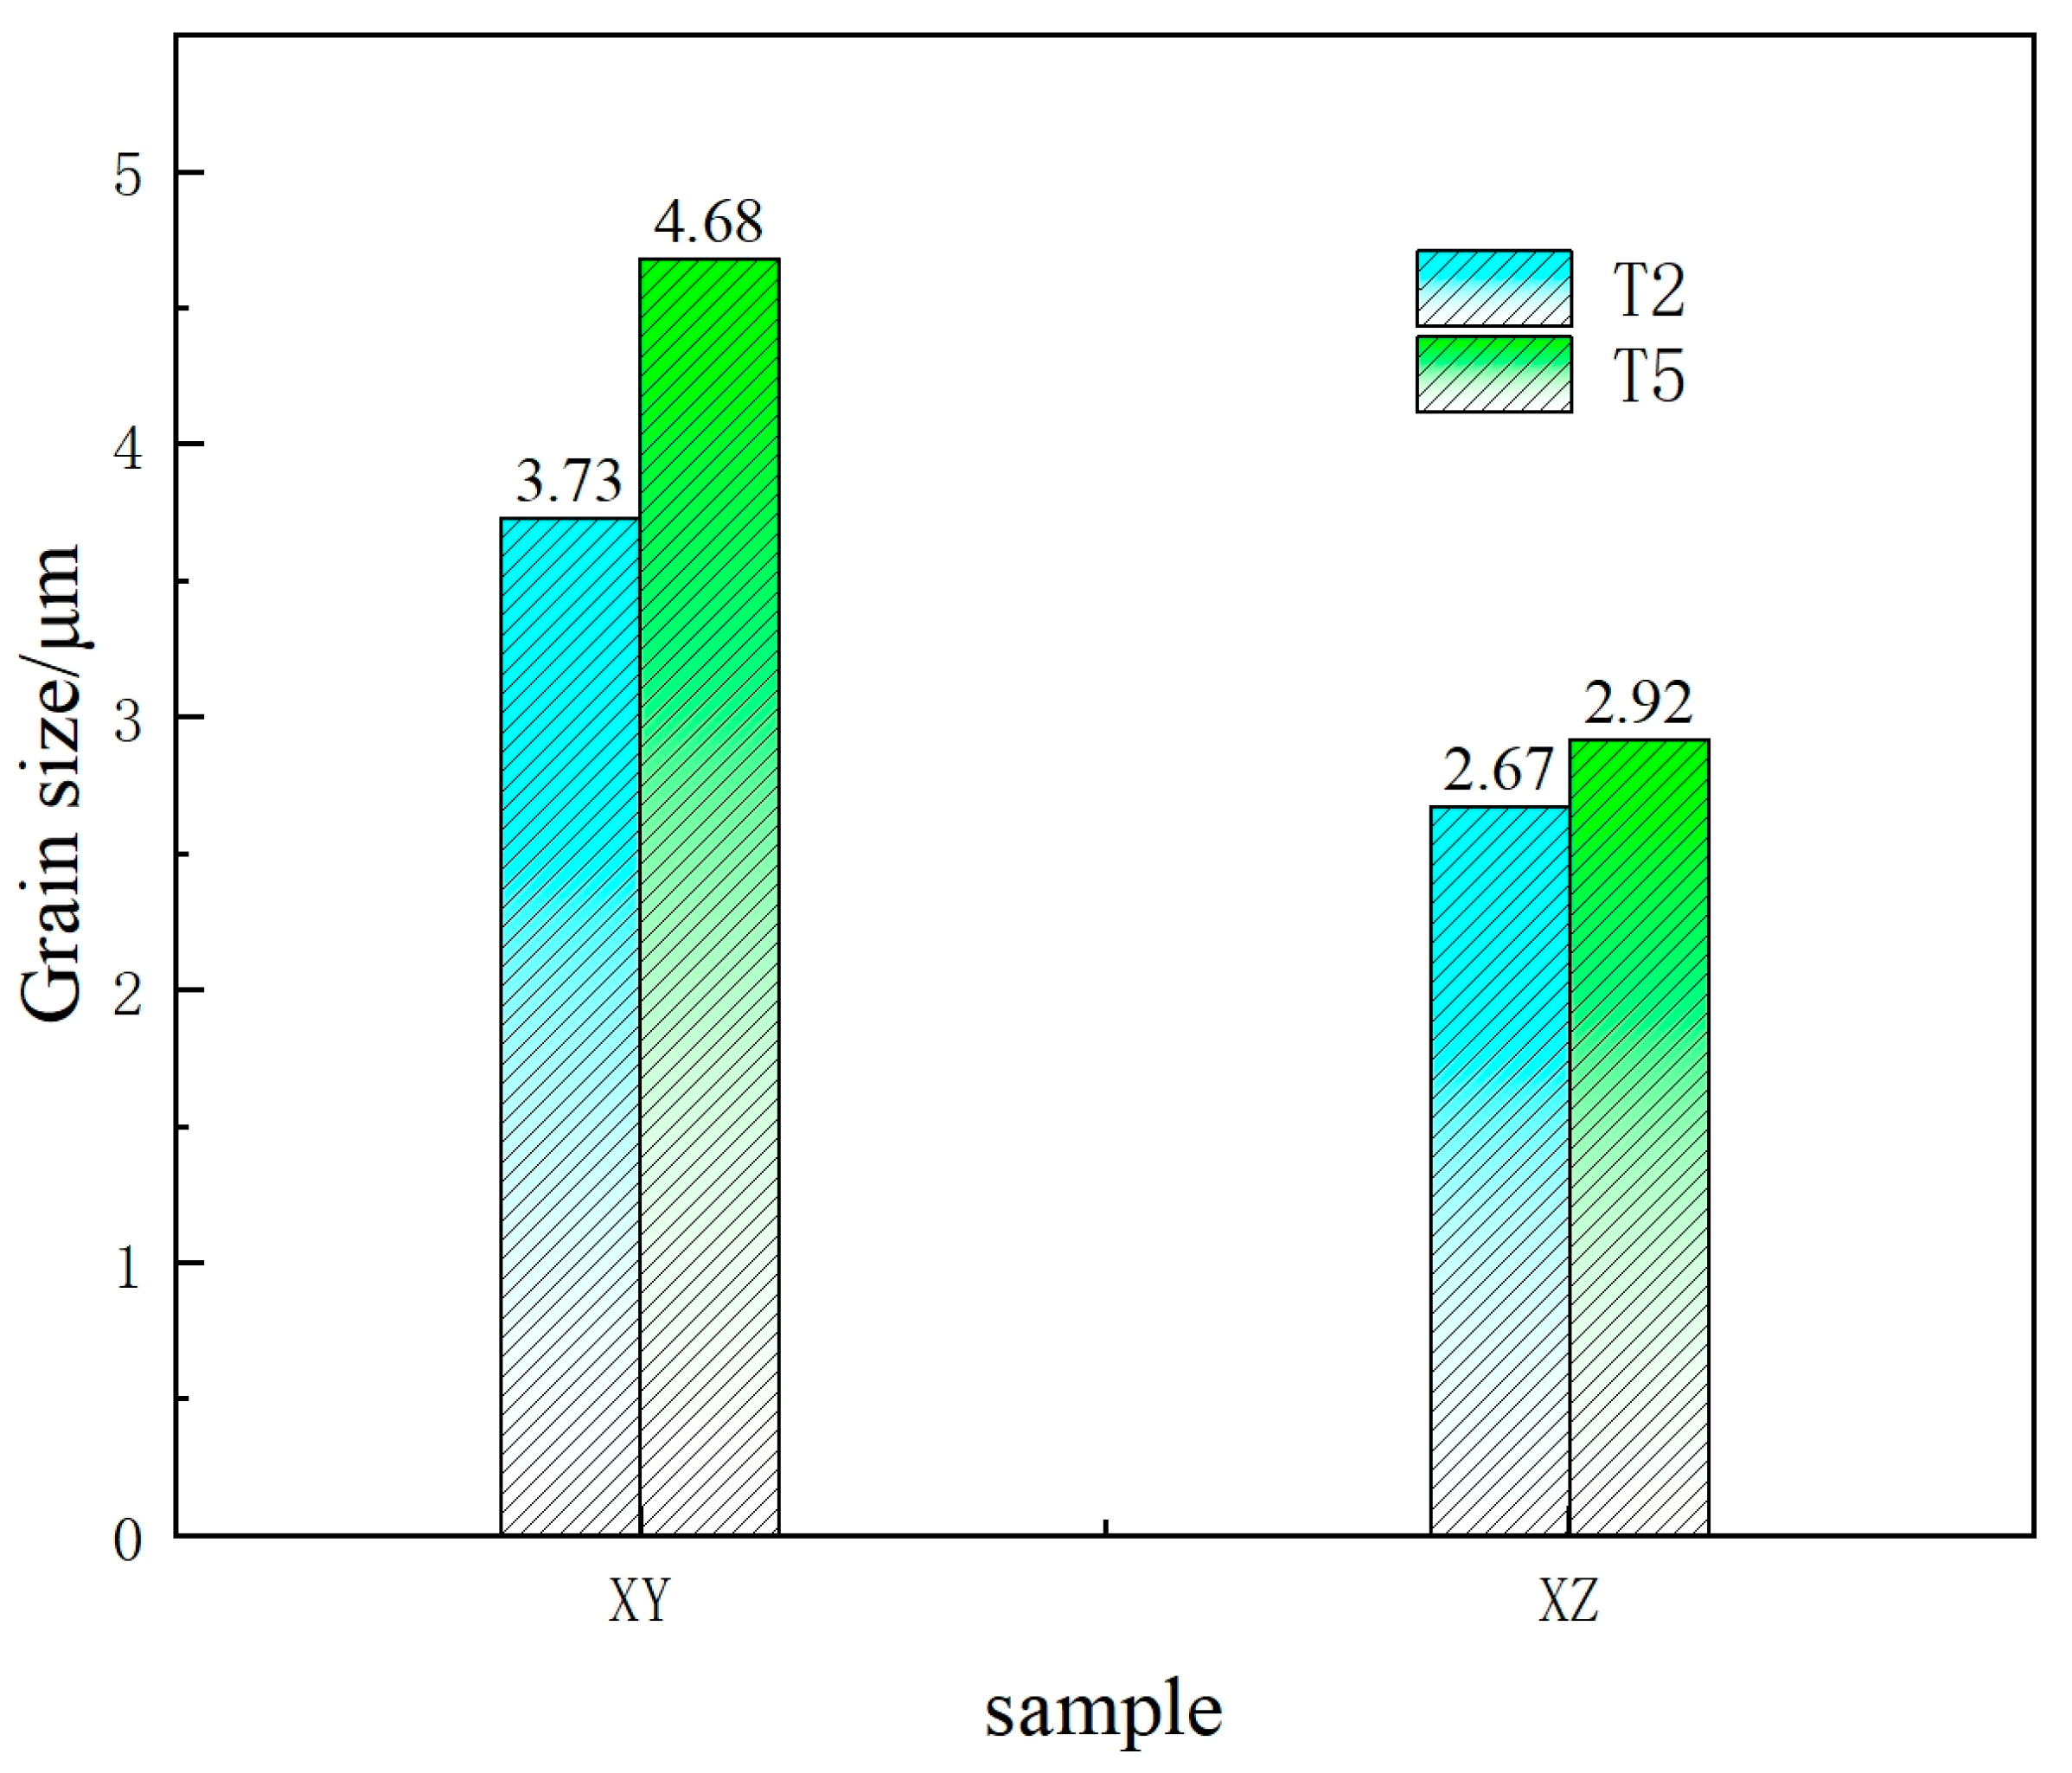
3.2. Microstructure of 22MnCrNiMo Steel Prepared by SLM

Figure 9 presents the XRD (X-ray Diffraction) patterns of 22MnCrNiMo steel samples prepared under different laser powers. The results indicate that the primary phase in the samples is α-FeM (where M represents elements such as Mo, Ni, and Cr), and the reinforcing phase includes Fe3C, among others. Compared with the standard diffraction peaks, the main peaks of the samples are shifted to the left by approximately 4°. This shift is attributed to lattice distortion caused by alloy atoms in the solid solution and thermal stresses induced by the laser forming process.
Since the experimental material composition was identical, the density increased from T1 to T5. Figure 10 shows the microstructures of typical samples T2 and T5, highlighting the microstructural characteristics of 22MnCrNiMo steel produced by SLM (selective laser melting). The predominant microstructures include lath martensite (M) and bamboo-leaf-shaped lower bainite (LB). The martensite exhibits a fine lath structure, while the lower bainite appears in the form of a layered or needle-like morphology.
Figure 10a,c display the XY and XZ cross-section microstructures of sample T2, which are predominantly composed of lath martensite and needle-like lower bainite. The average grain size is approximately 3–4 μm. No significant precipitated phases were observed at the grain boundaries. Due to the more pronounced grain organization in the XZ plane, ImageJ (1.52P) software was used to calculate the area ratios of martensite and lower bainite in the XZ plane, which are 47% and 53%, respectively, as shown in Figure 11a. In the figure, the red areas represent lower bainite, while the gray areas represent martensite. The alternating arrangement of martensite and lower bainite is evident.
Figure 10b,d show the XY and XZ cross-section microstructures of sample T5, which are also primarily composed of lath martensite and needle-like lower bainite. Compared to sample T2, the microstructural composition of T5 shows little variation. However, the area ratios of martensite and lower bainite calculated for the XZ plane using ImageJ are 60% and 40%, respectively, as illustrated in Figure 11b.
Martensite enhances the strength and hardness of mooring chain steel, while the lower bainite structure, in addition to providing high strength, reduces the notch sensitivity of the steel, thereby enabling the mooring chain steel to better withstand impact loads. Therefore, theoretically, the microstructure at 200 W should exhibit higher strength and impact toughness. As observed in the XZ plane, the two types of structures are interspersed, which is similar to the microstructural characteristics of 24CrNiMo steel fabricated using a higher laser energy density [27].
In this study, the lower laser energy density employed resulted in shorter solidification times, which may have contributed to the formation of lower bainite and martensite in the samples, thereby improving the strength of the 22MnCrNiMo steel. During the SLM process, the rapid cooling rate of the melt pools, as high as 105~106 K/s, easily lead to the formation of martensitic structures [28].
Figure 12 shows the EBSD (Electron Backscatter Diffraction) maps of 22MnCrNiMo steel on the XY and XZ planes at different laser powers (200 W and 275 W). The images reveal that SLM-fabricated 22MnCrNiMo steel exhibits a microstructure of columnar and equiaxed grains. The XY plane is dominated by lath martensite and needle-like bainite, with an average grain size of approximately 3–4 μm. No significant precipitated phases were observed at the grain boundaries, and no preferred orientations were present in the crystal structure. The grain size of the XZ plane is smaller compared to the XY plane, and the structure is predominantly single-phase BCC, with almost no FCC structure, which is a typical characteristic of SLM-fabricated materials. For cubic crystal structures, the EBSD results indicate the absence of significant preferred orientations.
The grain size of the EBSD maps was specifically analyzed using the Aztec crystal 2.1 software, which yielded an average grain size of 3.2 μm for sample T2 and 3.8 μm for sample T5.
Figure 13 illustrates the EBSD grain boundary analysis results of 22MnCrNiMo steel under different laser powers. Grain boundaries with orientation angles between 2° and 15° are classified as small-angle grain boundaries (LAGBS), represented by black lines in the figure. Grain boundaries with orientation angles greater than 15° are classified as large-angle grain boundaries (HAGBS), represented by red lines in the figure.
The microstructures under different processing parameters exhibit varying proportions of large-angle and small-angle grain boundaries. Specifically, for sample T2, the average proportion of HAGBs on the XY and XZ planes is 56%, while the average proportion of LAGBS is 44%. For sample T5, the average proportion of HAGBS on the XY and XZ planes is 44%, while the average proportion of LAGBS is 56%. Consequently, LAGBs dominates in sample T2, corresponding to the dark gray regions in the figure, while HAGBs dominates in sample T5, corresponding to the red regions.
LAGBS serve as an indicator of dislocations and residual stresses, whereas the presence of HAGBs can significantly enhance the toughness of the steel by effectively inhibiting the propagation of linear cracks [29].
Figure 14 shows a comparison of the average grain size of the XY and XZ planes of the samples under different laser powers. It can be seen from the figure that the average grain size of both the XY and XZ planes in the T2 sample is smaller than T5. Therefore, it can be concluded that the average grain size of the samples increases with the increase in laser energy density during SLM additive manufacturing.
The variation in the grain size of the samples is closely related to the nucleation density, m, and undercooling degree, ΔT, during the solidification process of the micro-melt pools, as expressed by Equation (3) shown below [30]:
m ( T ) = 0 T d n d ( T ) d ( T ) = m m a x T σ 0 T e x p [ ( T T N ) 2 2 ( T σ ) 2 ] d ( T )
where m m a x is the maximum nucleation density, T σ is the standard deviation, and T N is the average undercooling.
When the laser energy density is low, the temperature gradient is small, but the cooling rate is high, leading to a greater degree of undercooling. This results in a higher nucleation density and smaller grain size. Conversely, as the laser energy density increases, the cooling rate decreases, and the undercooling degree reduces, leading to a lower nucleation density and larger grain size.
Compared to low-alloy steels produced through forging or rolling, low-alloy steels prepared using the SLM process exhibit smaller grain sizes and a higher proportion of high-angle grain boundaries. The smaller grain size improves the strength and hardness of the samples.

3.3. Mechanical Properties of 22MnCrNiMo Steel

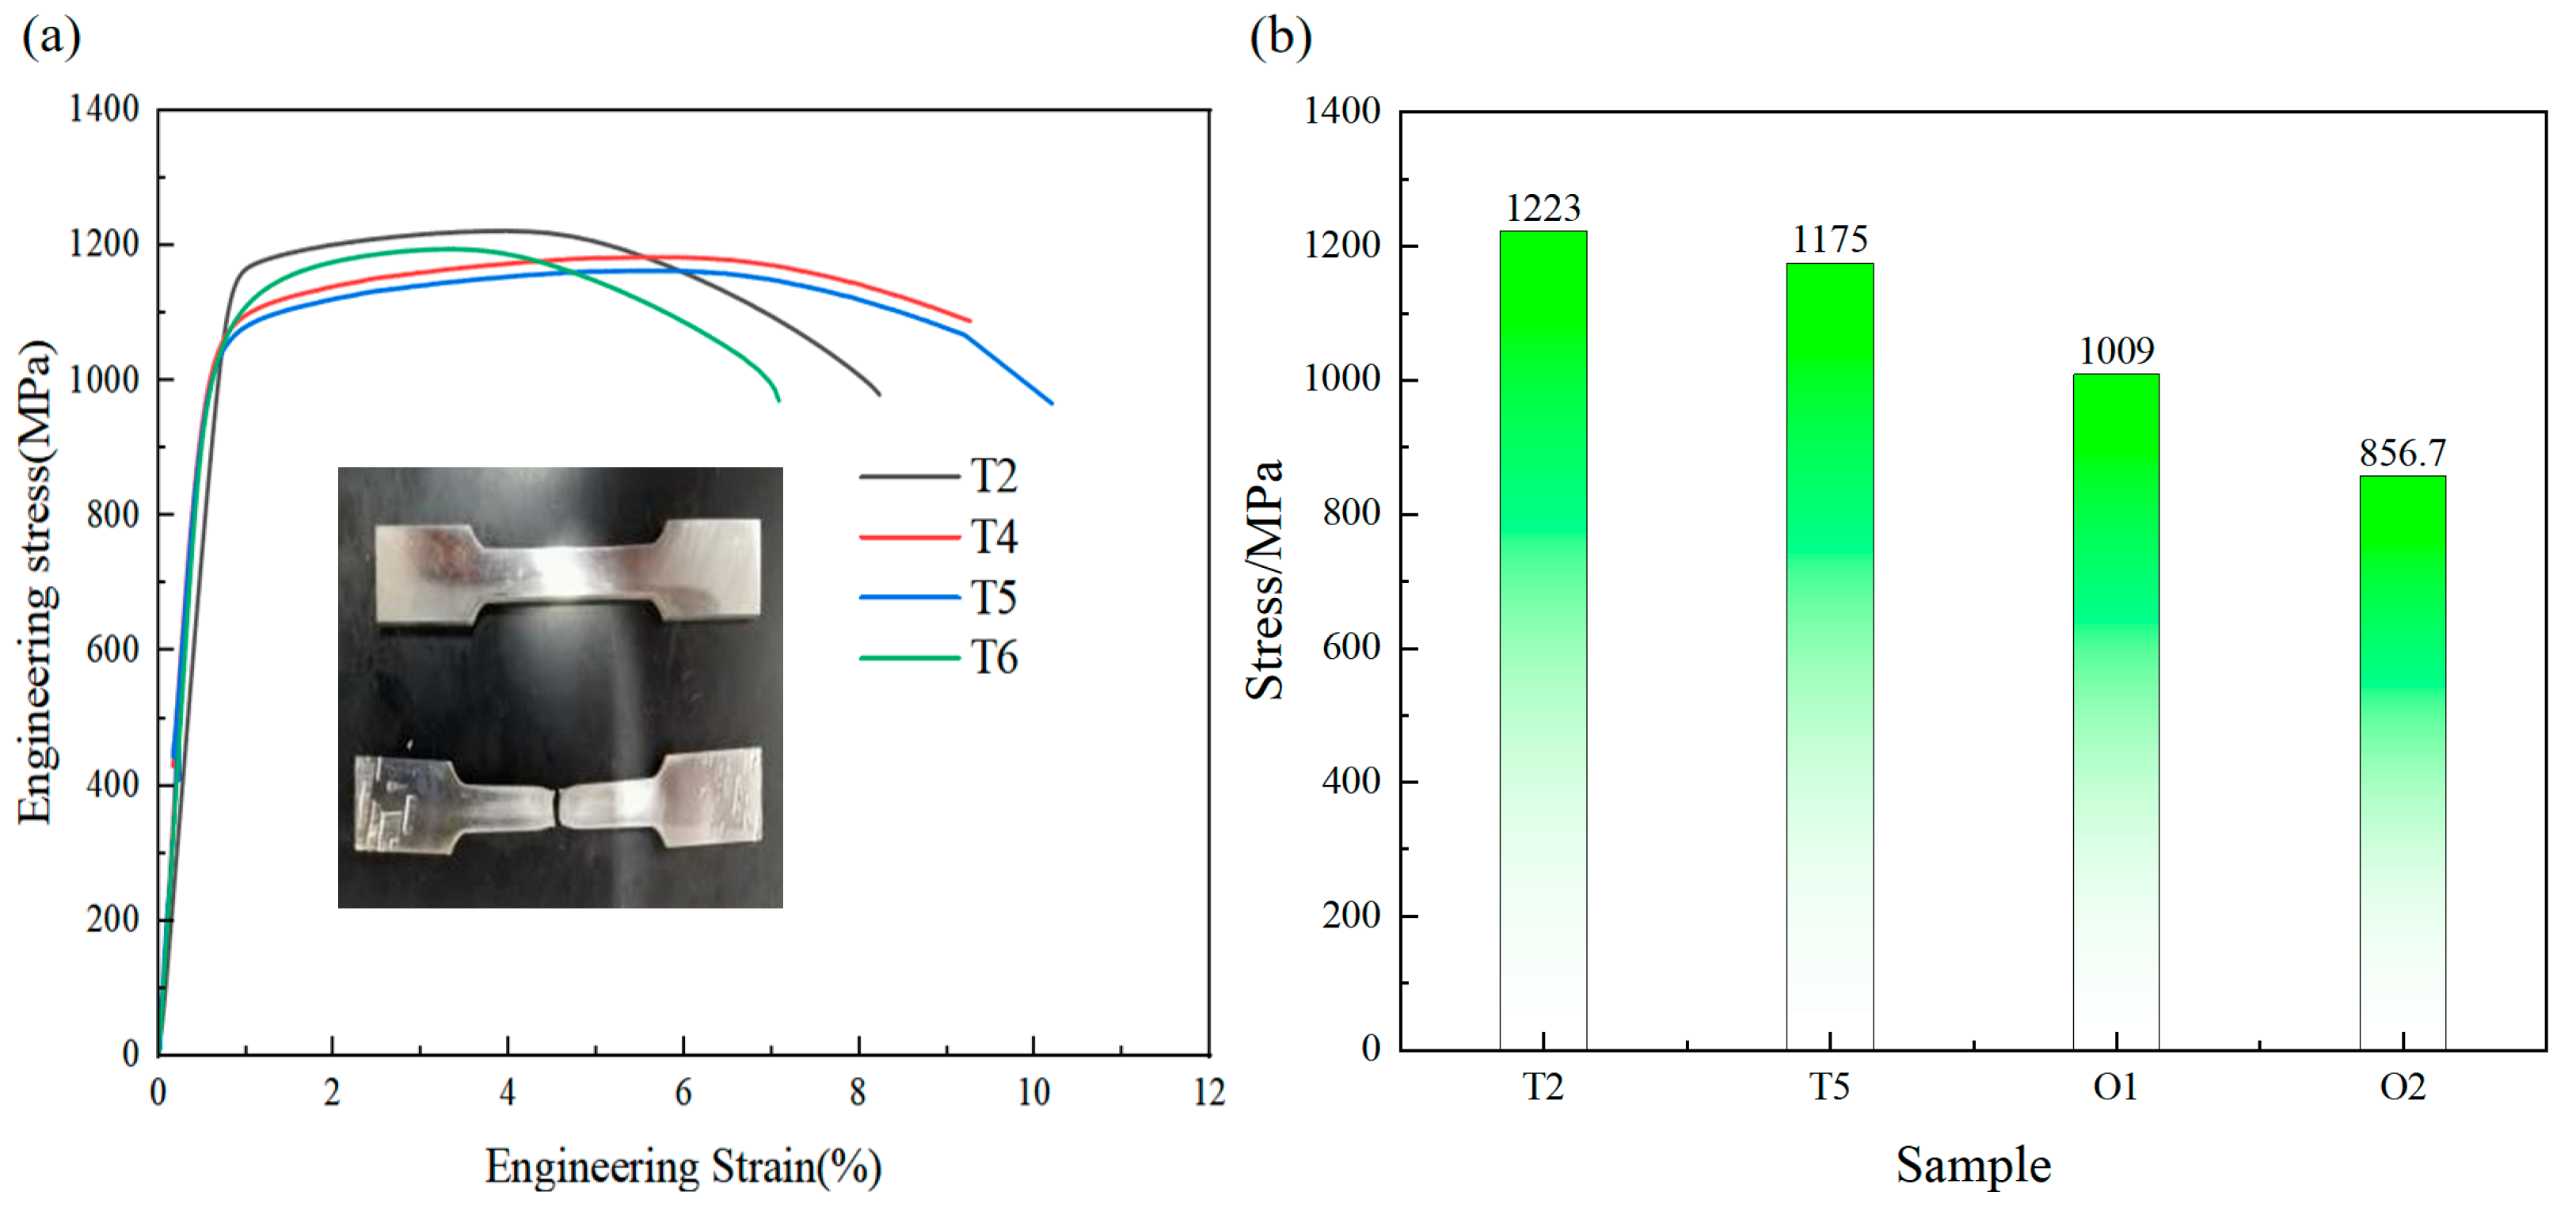
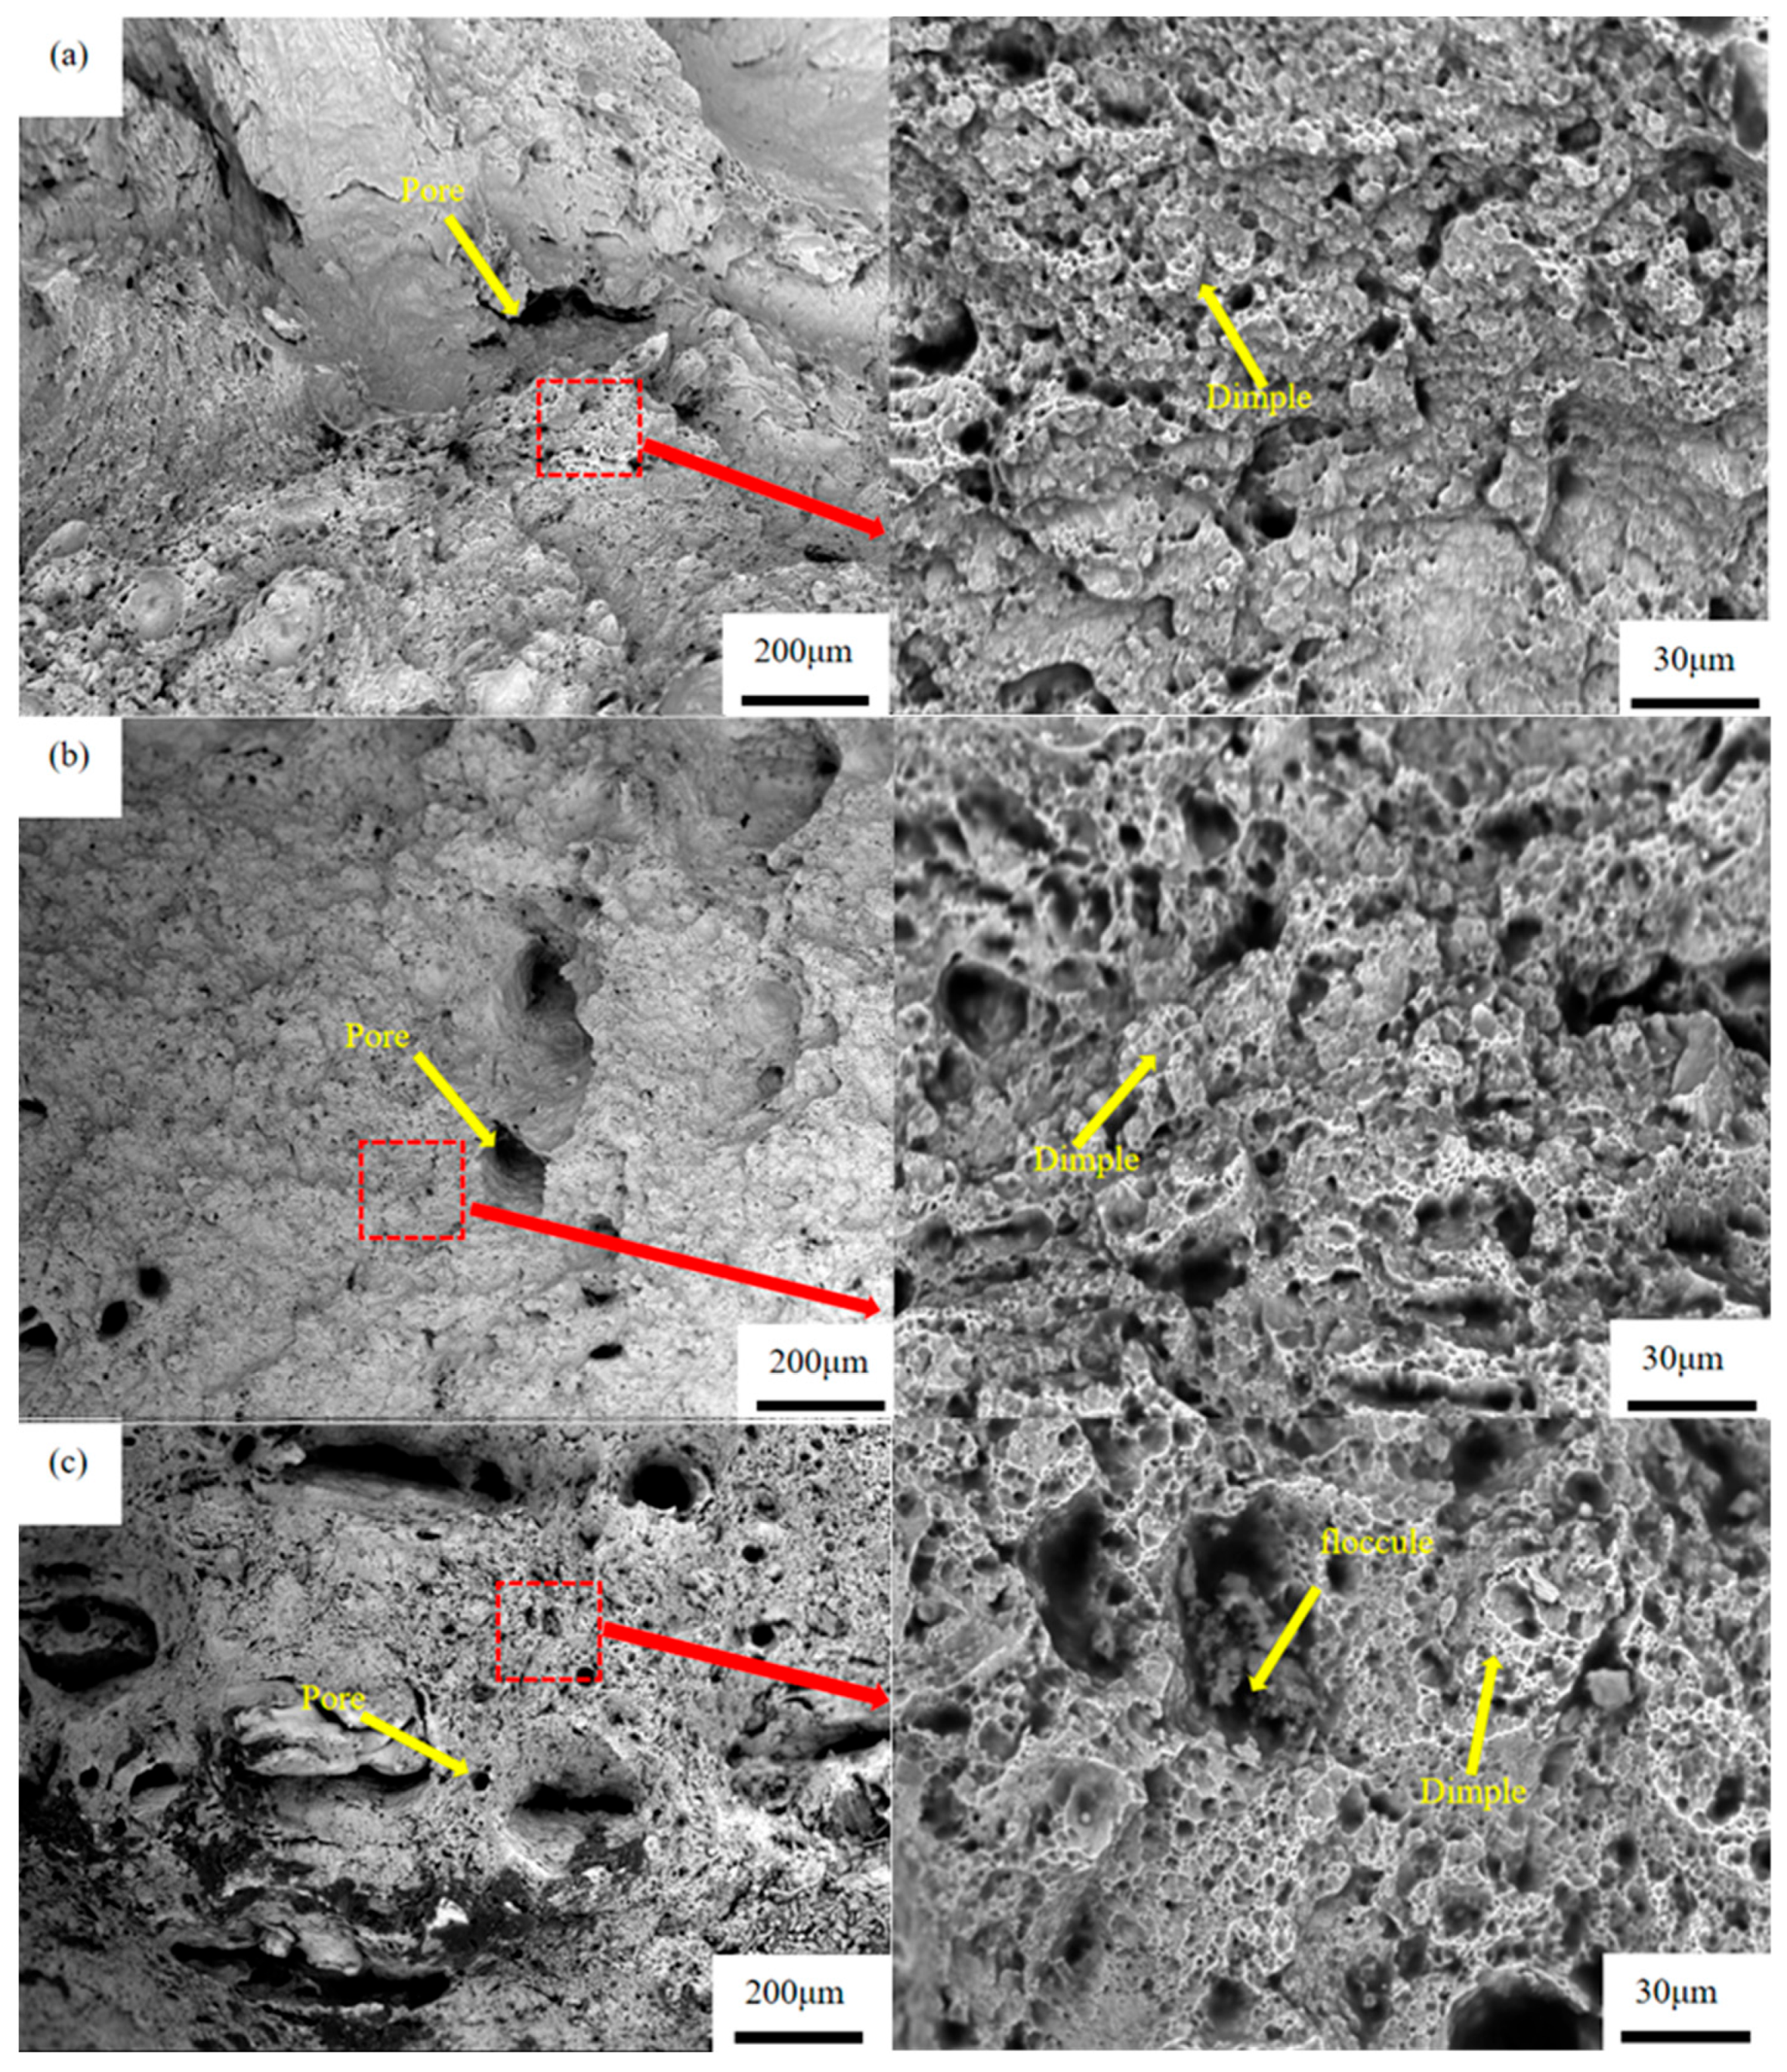
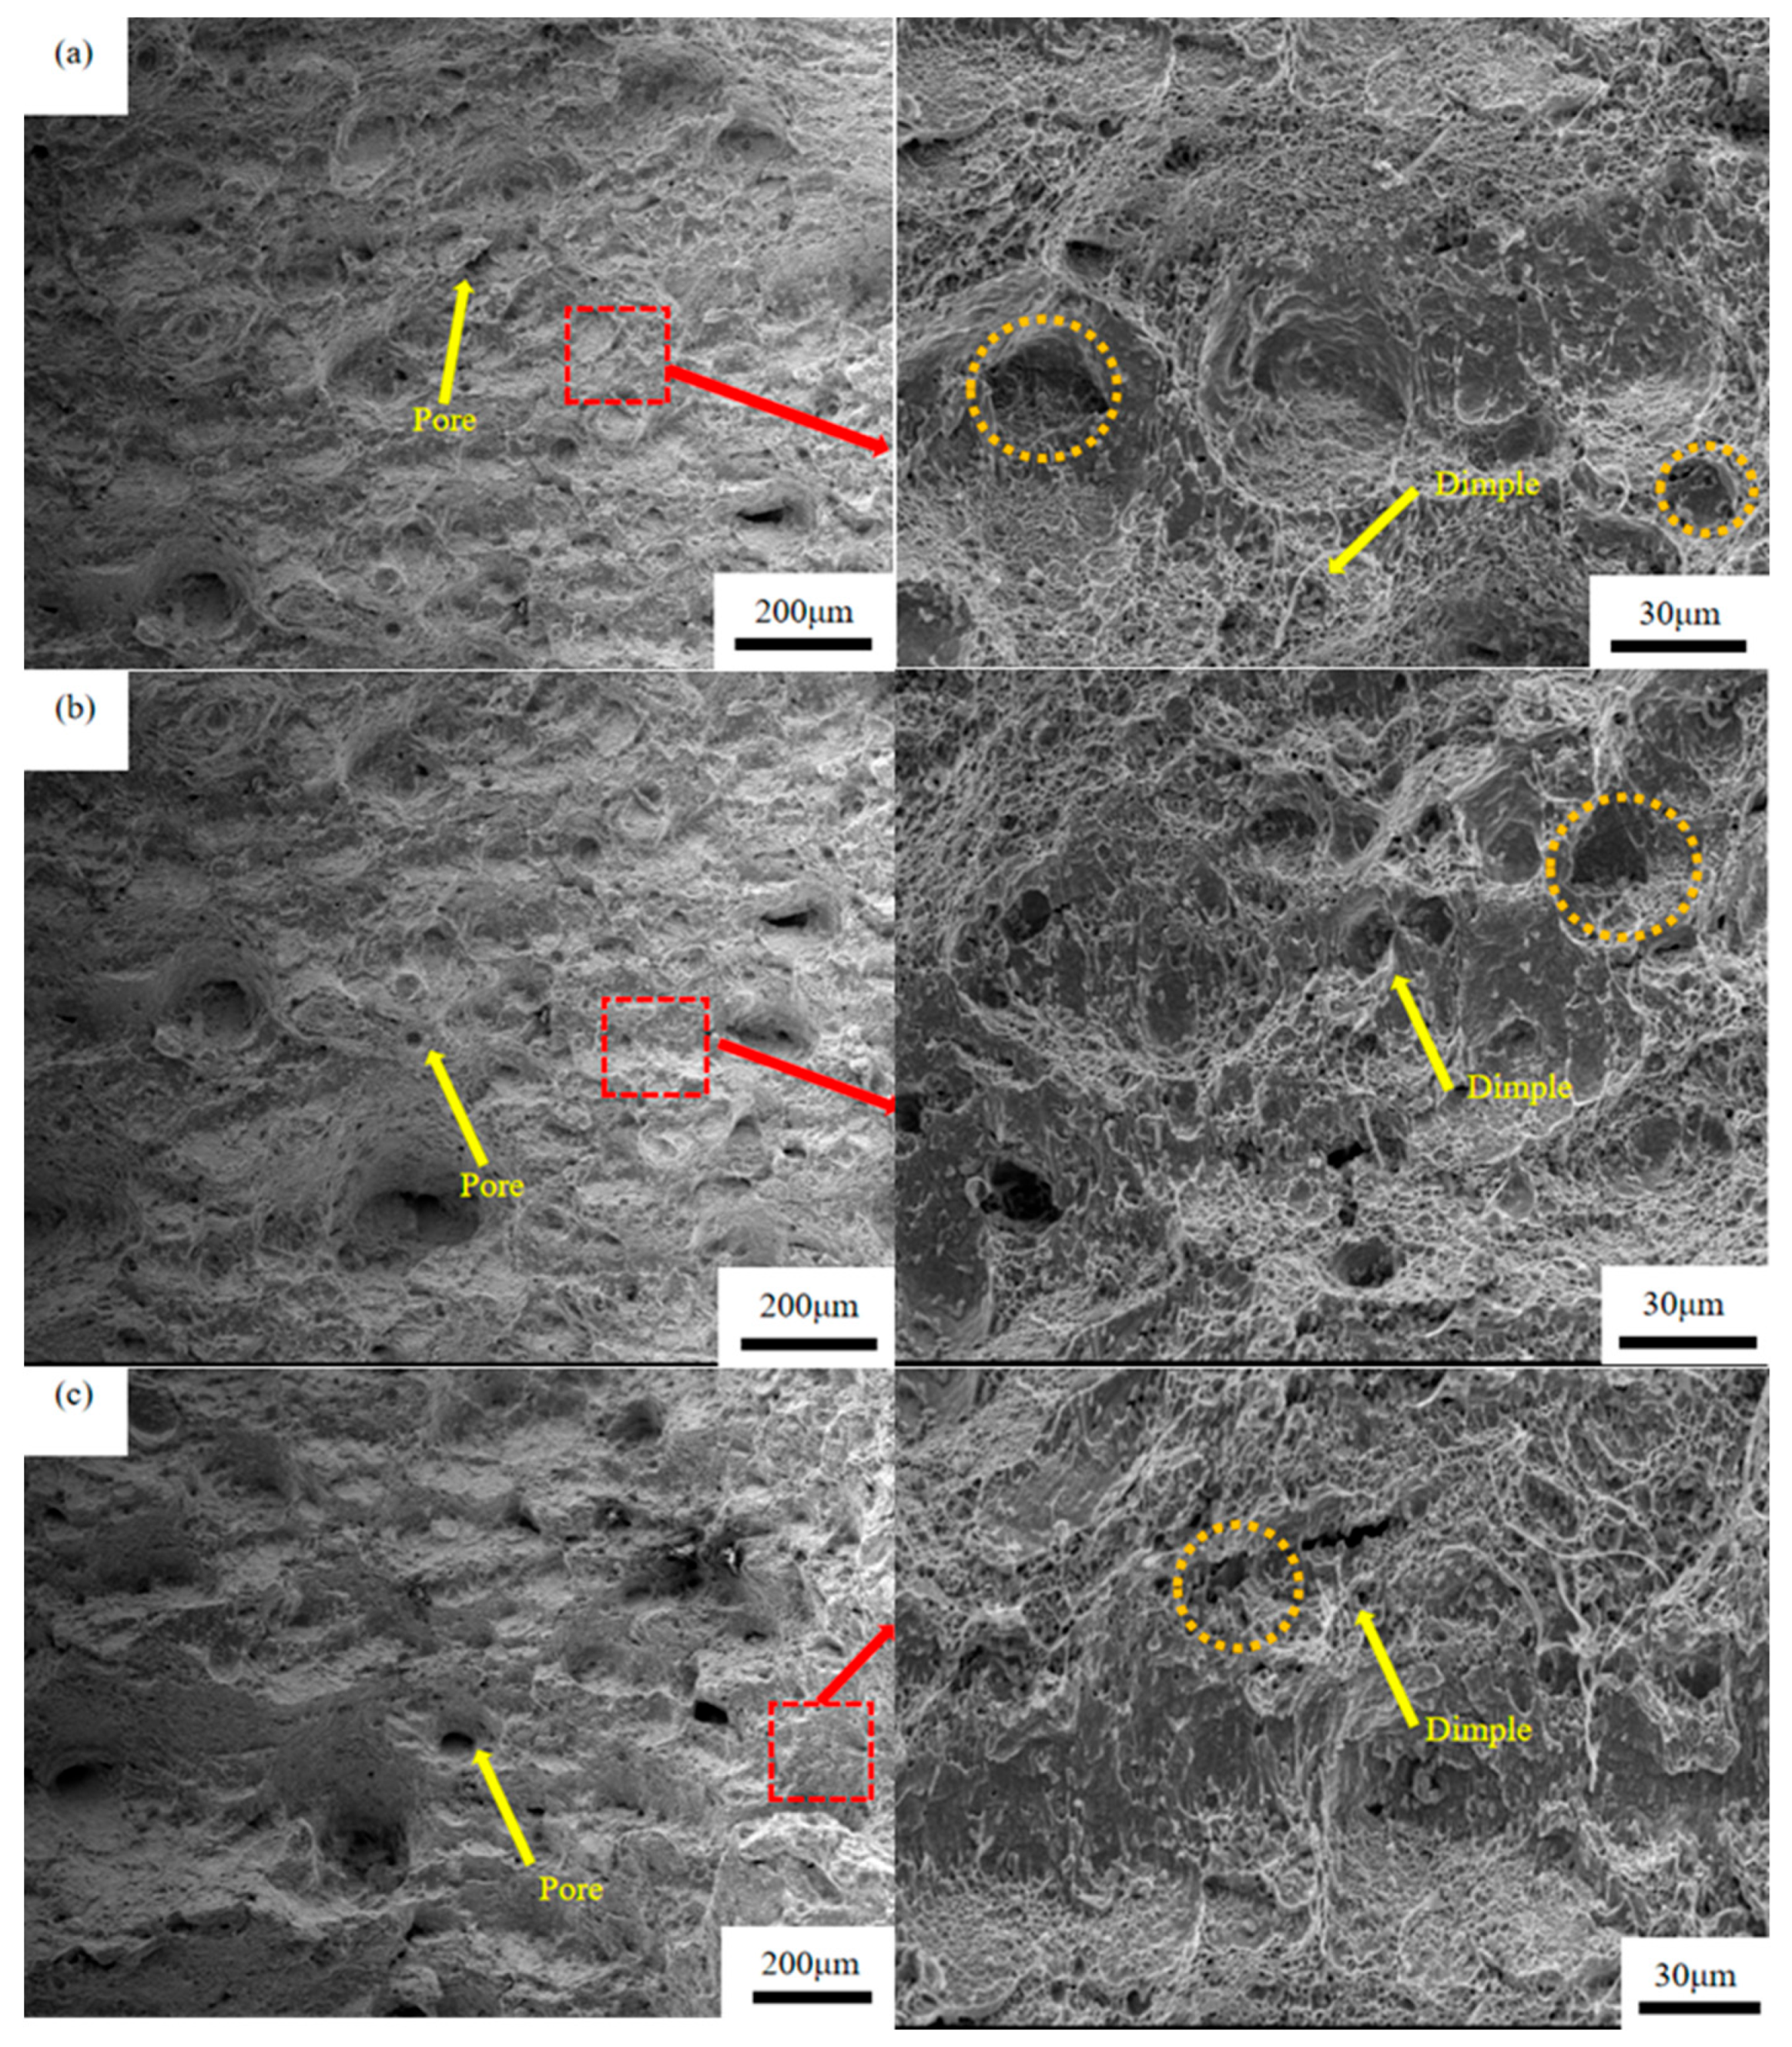
3.3.1. Tensile Properties of Mooring Chain Steel

Table 3 presents the mechanical properties data of 22MnCrNiMo steel fabricated under different laser parameters. As seen in the table, the tensile strength of 22MnCrNiMo steel produced by selective laser melting far exceeds the standard value of 860 MPa, averaging over 38% higher. Additionally, the variations in the strength and elongation of samples T2 and T5 align with the influence of the proportions of high-angle and low-angle grain boundaries on performance.
Experimental results also show that the elongation of SLM-formed steel is slightly lower than the standard value. Elongation mainly affects the plasticity of formed parts and their ductility during reprocessing. Since selective laser melting (SLM) can directly fabricate the desired shape without requiring additional reprocessing or shaping of specific forms, the influence of elongation in the SLM process is relatively insignificant.
As shown in Figure 15, a comparison of the schematic diagrams for the traditional manufacturing process and the new additive manufacturing process of mooring chains reveals that the traditional process for mooring chains involves smelting–casting–rolling–bending–welding, while the new additive manufacturing process eliminates the rolling, bending, and welding steps. This makes the requirement for elongation less critical. Therefore, the elongation requirements for 22MnCrNiMo mooring chain steel prepared by the new additive manufacturing process merit further evaluation, and the use of selective laser melting (SLM) technology for manufacturing mooring chains has pioneering and great significance.
Figure 16 shows the engineering stress–strain curves of 22MnCrNiMo steel specimens prepared under three typical laser powers: low, medium, and high (200 W, 250 W, 300 W, respectively). As can be seen in Figure 16a, the elongation of T5 is significantly higher than that of T2 and T6, while the maximum engineering stress of T2 is significantly higher than that of T5 and T6.
The T1 specimen with a laser power of 175W has the highest strength, with a tensile strength of 1227 MPa, a yield strength of 1116 MPa, and an elongation of 6.7%. The T4 specimen with a laser power of 275 W has the best plasticity, with an elongation of 10.2%, a tensile strength of 1175 MPa, and a yield strength of 1010 MPa. The elongation of the 22MnCrNiMo steel specimens first increases and then decreases with the increase in the laser power, while the tensile strength and yield strength show an opposite trend to the change in elongation.
The new additive manufacturing process produces mooring chain steel with superior performance compared with traditional manufacturing processes, as illustrated in Figure 16b. Qiu et al. [31] used 22MnCrNiMo steel sourced from 130 mm diameter annealed rolled bars for their experiments. The manufacturing process included electric furnace smelting, LF + VD, continuous casting, red material cold drawing and annealing, material production, pit cooling and holding, and final annealing. The final annealing temperature was 670 ± 10 °C, followed by air cooling to 500 °C at a cooling rate less than 30 °C/h. The samples were then held at 910 °C for 2.5 h before water quenching and tempered at 610 °C for 3 h followed by another water quench. Under these conditions, the experimental steel achieved a maximum tensile strength of 1009 MPa.
Mainier et al. [32] used 22MnCrNiMo steel for their experiments. The steel ingots were homogenized in a heat treatment furnace at 1200 °C for 15 h, then hot rolled into cylinders with a nominal diameter of 123 mm and a reduction ratio of 28:1. The samples were held at 900 °C for 1 h, water quenched, reheated to 650 °C, held for 2 h, and water quenched again. Under these conditions, the experimental steel achieved a maximum tensile strength of 857 MPa.
In comparison to 22MnCrNiMo steel produced by traditional manufacturing processes, the strength of steel produced by the new additive manufacturing process increased by over 18%. The SLM-fabricated 22MnCrNiMo steel samples had a high density, fewer internal defects, closely packed martensitic structures, a higher percentage of lower bainite, good impact toughness, and maintained high strength.
Figure 17 shows the room temperature tensile fracture morphologies of 22MnCrNiMo steel samples formed under different laser energy densities. With increasing laser power, the tensile specimens exhibited ductile fracture characteristics, with dimples evenly distributed across the fracture surfaces.
From Figure 17a, it can be seen that the sample presents a smooth layered section with small pores. At this time, the fracture surface has both ductile dimples and a smooth section, belonging to a mixed ductile and brittle section. Therefore, the elongation of the T2 sample is relatively low.
From Figure 17b, when the laser power reaches 250 W, the fracture surface of the sample shows no obvious unmelted or over-burned materials, but rather a dense and fine pore defect structure. Additionally, there are densely distributed dimples, indicating ductile fracture. Therefore, theoretically, the elongation of sample T4 should be higher than that of T2 and T6, which aligns with the experimental results.
From Figure 17c, sample T6 exhibits a tensile fracture surface with numerous large internal pore defects and some flocculent material. This is due to excessive laser power causing over-burning, which not only induces stress concentration during the tensile process, triggering microcracks and reducing the tensile strength of the sample, but also diminishes the sample’s ductility, adversely affecting its overall performance.
The grain size of 22MnCrNiMo steel manufactured by the traditional process is relatively large. For example, Liang Qiu et al. [31] measured that the grain size of the specimen processed by the annealing and rolling process was approximately 9.1 μm, with a tensile strength of 1006 MPa. Mainier et al. [32] measured that the grain size of the sample processed by the hot rolling process was approximately 10.5 μm, with a tensile strength of 856 MPa. Compared with the grain size of 9–11 μm of the samples processed by the traditional process, the grain size of the SLM process was 3–4 μm, a reduction of 70%. According to the principle of fine grain strengthening, the reduction in the metal grain size has a significant impact on the increase in strength. Compared with the traditional manufacturing process, the strength of the samples prepared by the new additive manufacturing process was increased by 20–50%. Figure 18 shows the relationship between the grain size and strength of samples under different processes.

3.3.2. Impact Toughness of Mooring Chain Steel

The impact toughness requirement for grade R4 22MnCrNiMo mooring chain steel is greater than 50 J at −20 °C. The impact performance of mooring chain samples produced by the SLM process under different laser powers, as shown in Figure 19, reveals the following: at laser powers of 175 W and 200 W, the absorbed impact energies of the samples are 121 J and 127 J, respectively, both exceeding the standard requirement. From 200 W to 325 W, the absorbed impact energy decreases with increasing laser power, but even at 325 W, the impact energy still meets the standard requirement. Notably, the impact energy at 200 W is significantly higher than at 275 W, which aligns with the influence of the area fraction of lower bainite and martensite. Therefore, the impact toughness of 22MnCrNiMo steel produced by the selective laser melting (SLM) process meets the requirements for grade R4 mooring chains.
Figure 20 shows the impact fracture morphology of the 22MnCrNiMo specimen. It can be seen from the figure that there are a large number of dimples on the impact fracture surface. During the impact process, a specimen undergoes local plastic deformation. Microscopically, it manifests as the continuous expansion and connection of micro-cracks inside the material under the action of shear stress, ultimately forming small pits. The size and depth of the dimples reflect the plastic deformation ability of the material during the impact process.
In the area where the dimples are deep and large, the material has experienced a large amount of plastic deformation before fracture and has good impact toughness. As shown in the area marked by the orange circle in Figure 20, deep and large dimples can be clearly seen. The number and size of pores on the fracture surface of the specimen under the laser power of 200 W were significantly smaller than those of the specimens under the laser powers of 250 W and 300 W. Under the action of impact load, stress concentration is likely to occur around the pore defects, leading to the initiation and propagation of micro-cracks.

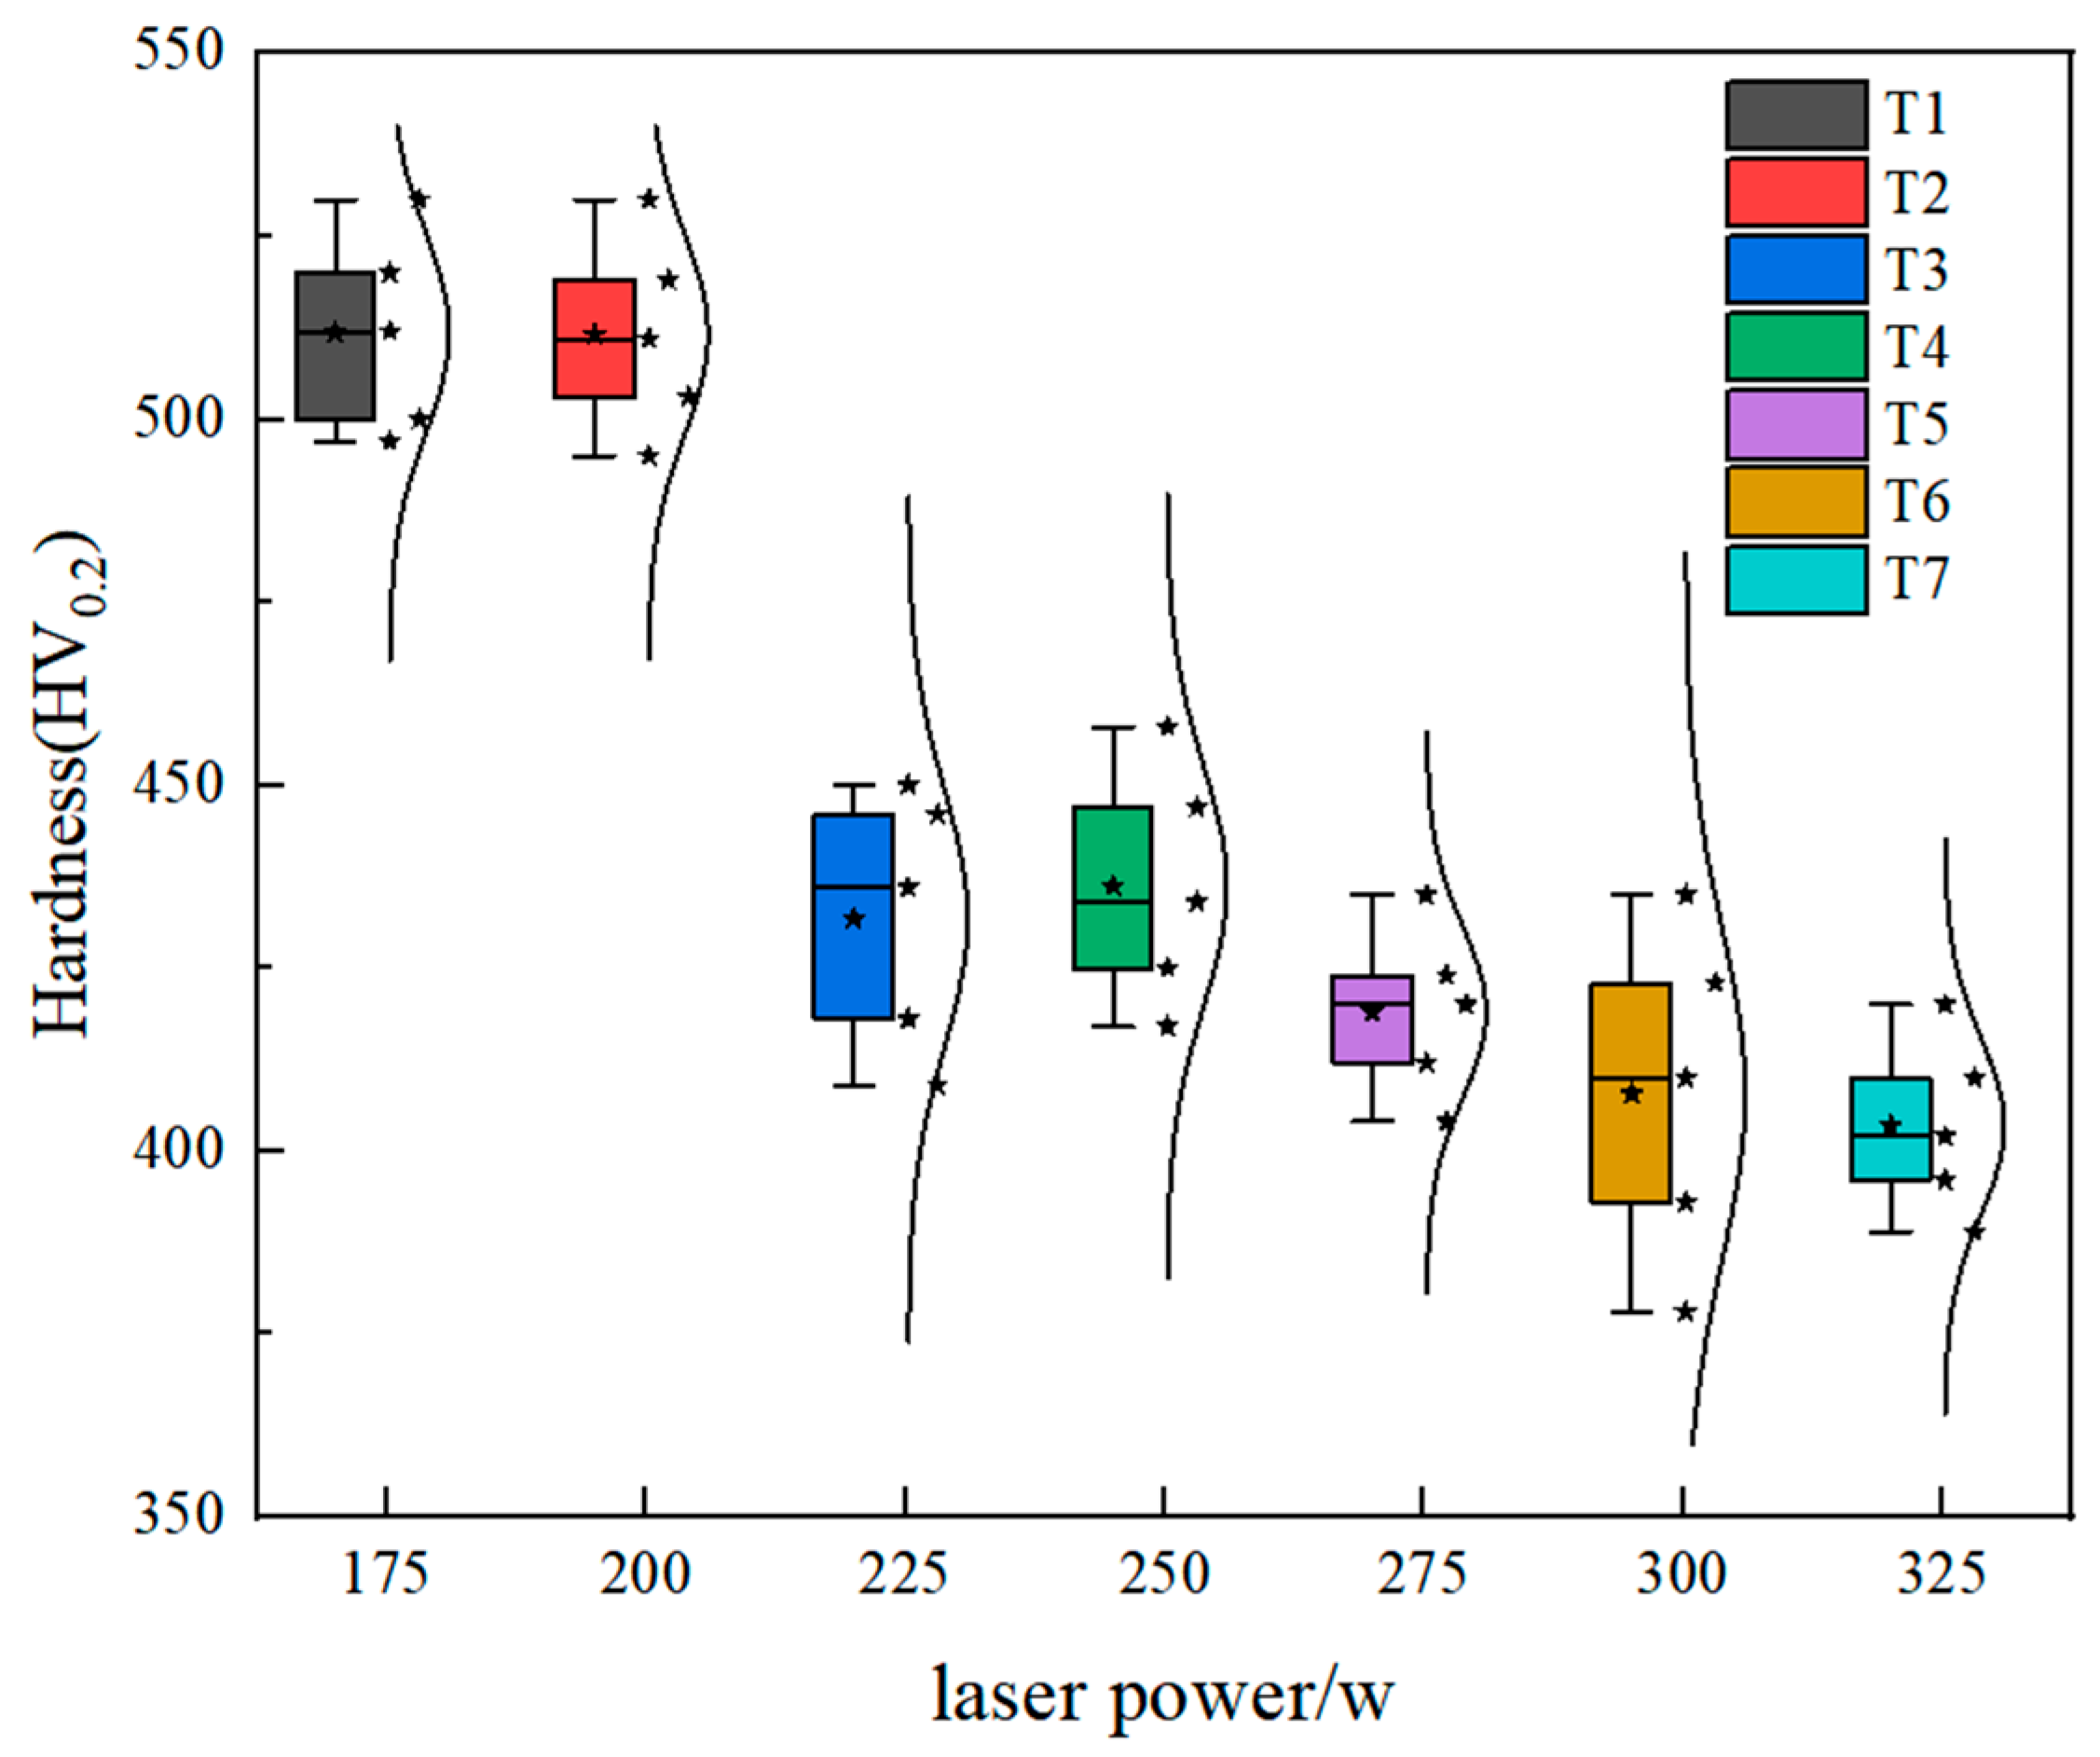
3.3.3. Hardness Properties of Mooring Chain Steel

Figure 21 illustrates the distribution of microhardness across the XZ section of 22MnCrNiMo steel samples prepared under different laser powers. The average hardness values for the samples prepared at laser powers of 175 W, 200 W, 225 W, 250 W, 275 W, 300 W, and 325 W are 514.4 HV0.5, 513.2 HV0.5, 436 HV0.5, 427 HV0.5, 416.4 HV0.5, 409.4 HV0.5, and 400.8 HV0.5, respectively. It can be observed that as the laser power increases, the microhardness of the samples exhibits a decreasing trend. Notably, the hardness of samples T1 and T2 is significantly higher than that of the other samples.
Usually, the grain size and density of a sample are the key factors determining its microhardness, and the relationship between microhardness (HV) and grain size (d) can be expressed by the Hall–Petch formula [33]:
H V = H 0 + K d 1 / 2
where H0 is the pure iron hardness determined by the crystal structure and dislocation density, and K represents the slope of the curve.
As can be seen from Equation (4), the finer the metal grains, the higher the micro-hardness. Therefore, among the parameters in this study, the specimen with an energy density of 66.29 J/mm3 should theoretically have the highest micro-hardness, and in fact, it is the parameter with the highest hardness. On the other hand, internal defects of the material, such as pores, cracks, and lack of fusion, are weak points under load. Thus, when the energy density is 123.11 J/mm3, it should also theoretically have a relatively high micro-hardness.
However, based on the experimental results, it is evident that grain refinement plays the most significant role in determining the microhardness of 22MnCrNiMo steel fabricated via SLM. Although samples prepared at higher energy densities exhibit relatively dense microstructures, the coarsening of their grains leads to a decrease in microhardness. This observation aligns with the findings of AlMangour et al. [34], who reported similar results for SLM-prepared SS316.
In summary, to improve the overall performance of 22MnCrNiMo steel produced via SLM, the optimal additive manufacturing parameters should be based on those used for sample T2. By selecting these parameters, the desired microstructure can be achieved, ensuring grain refinement and high densification, which are essential for the performance of mooring chain steel.

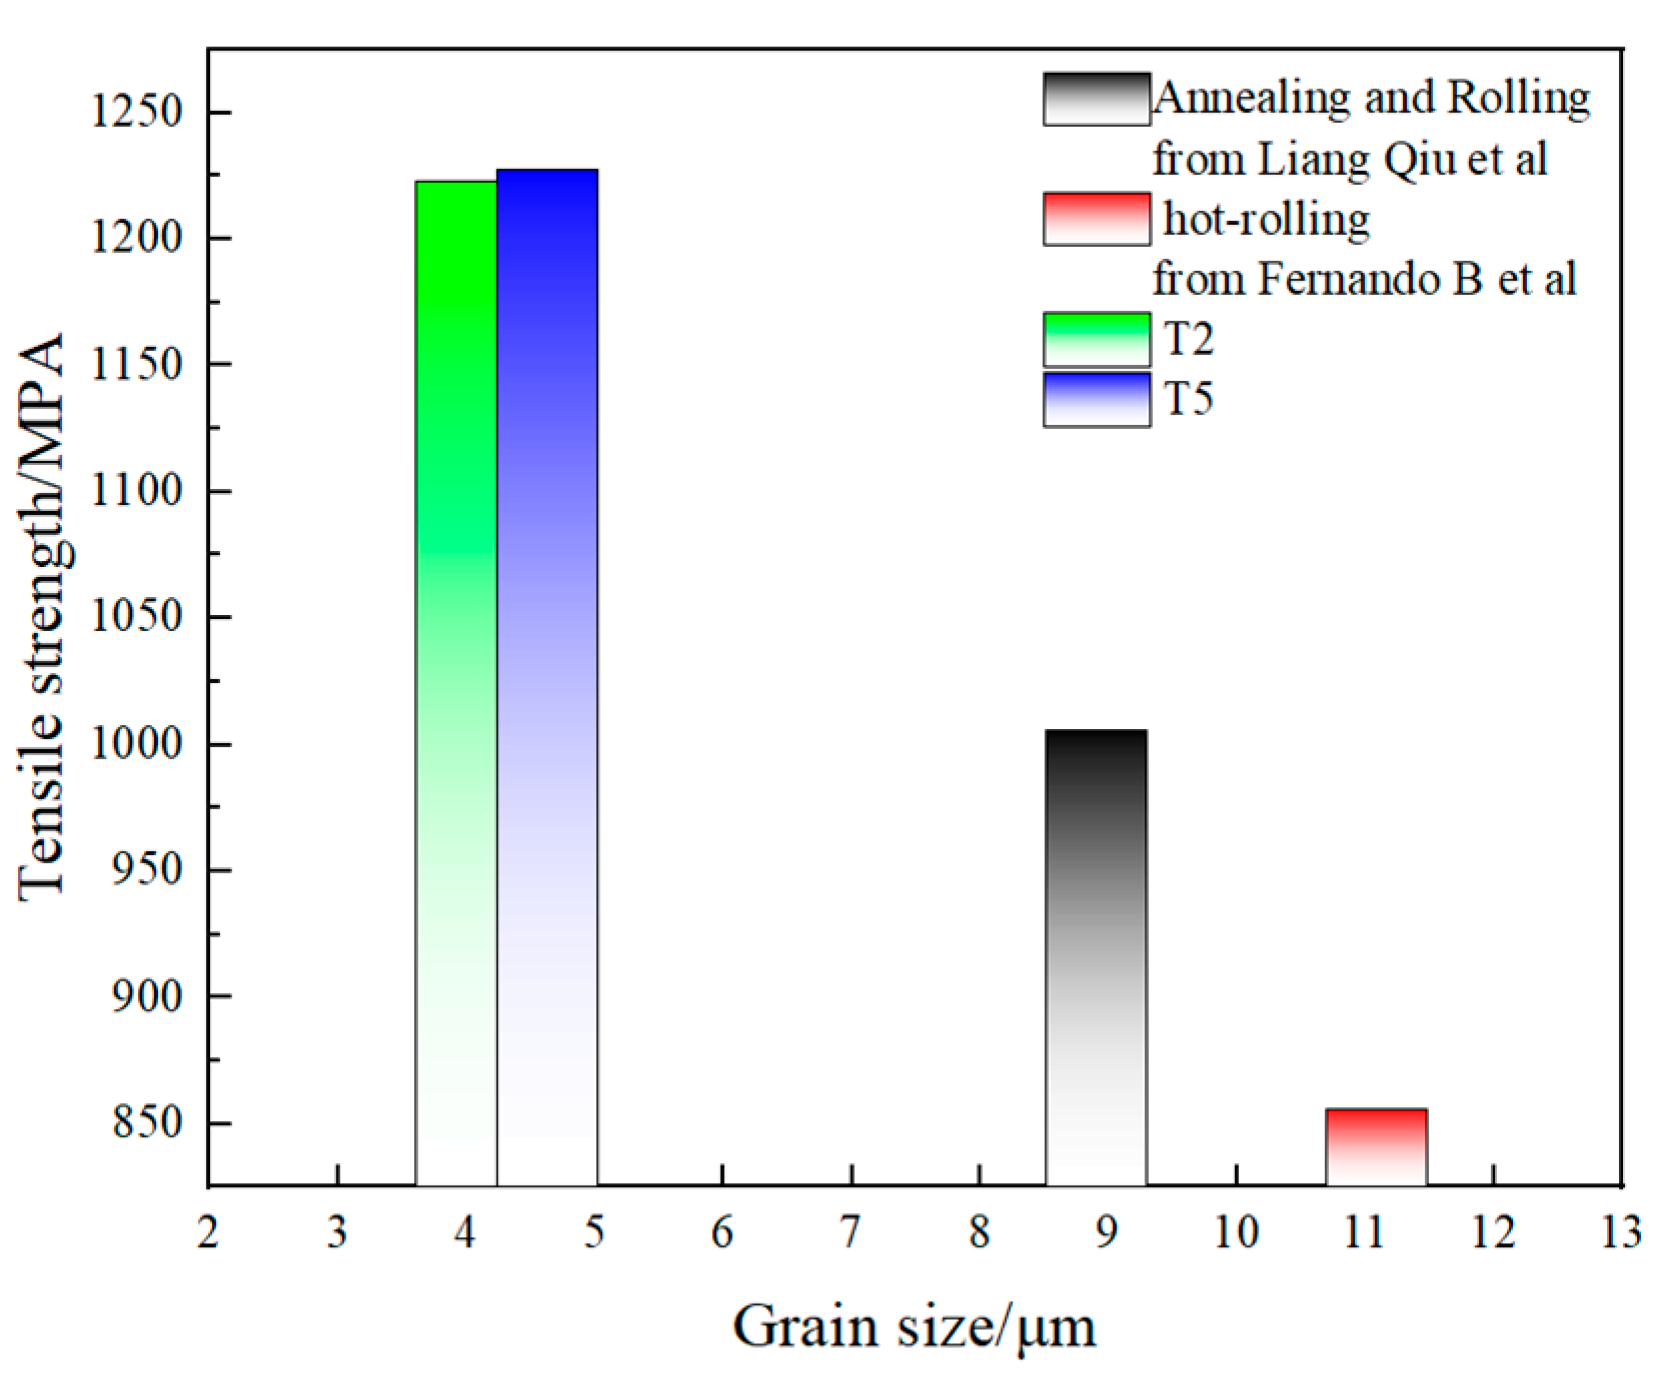
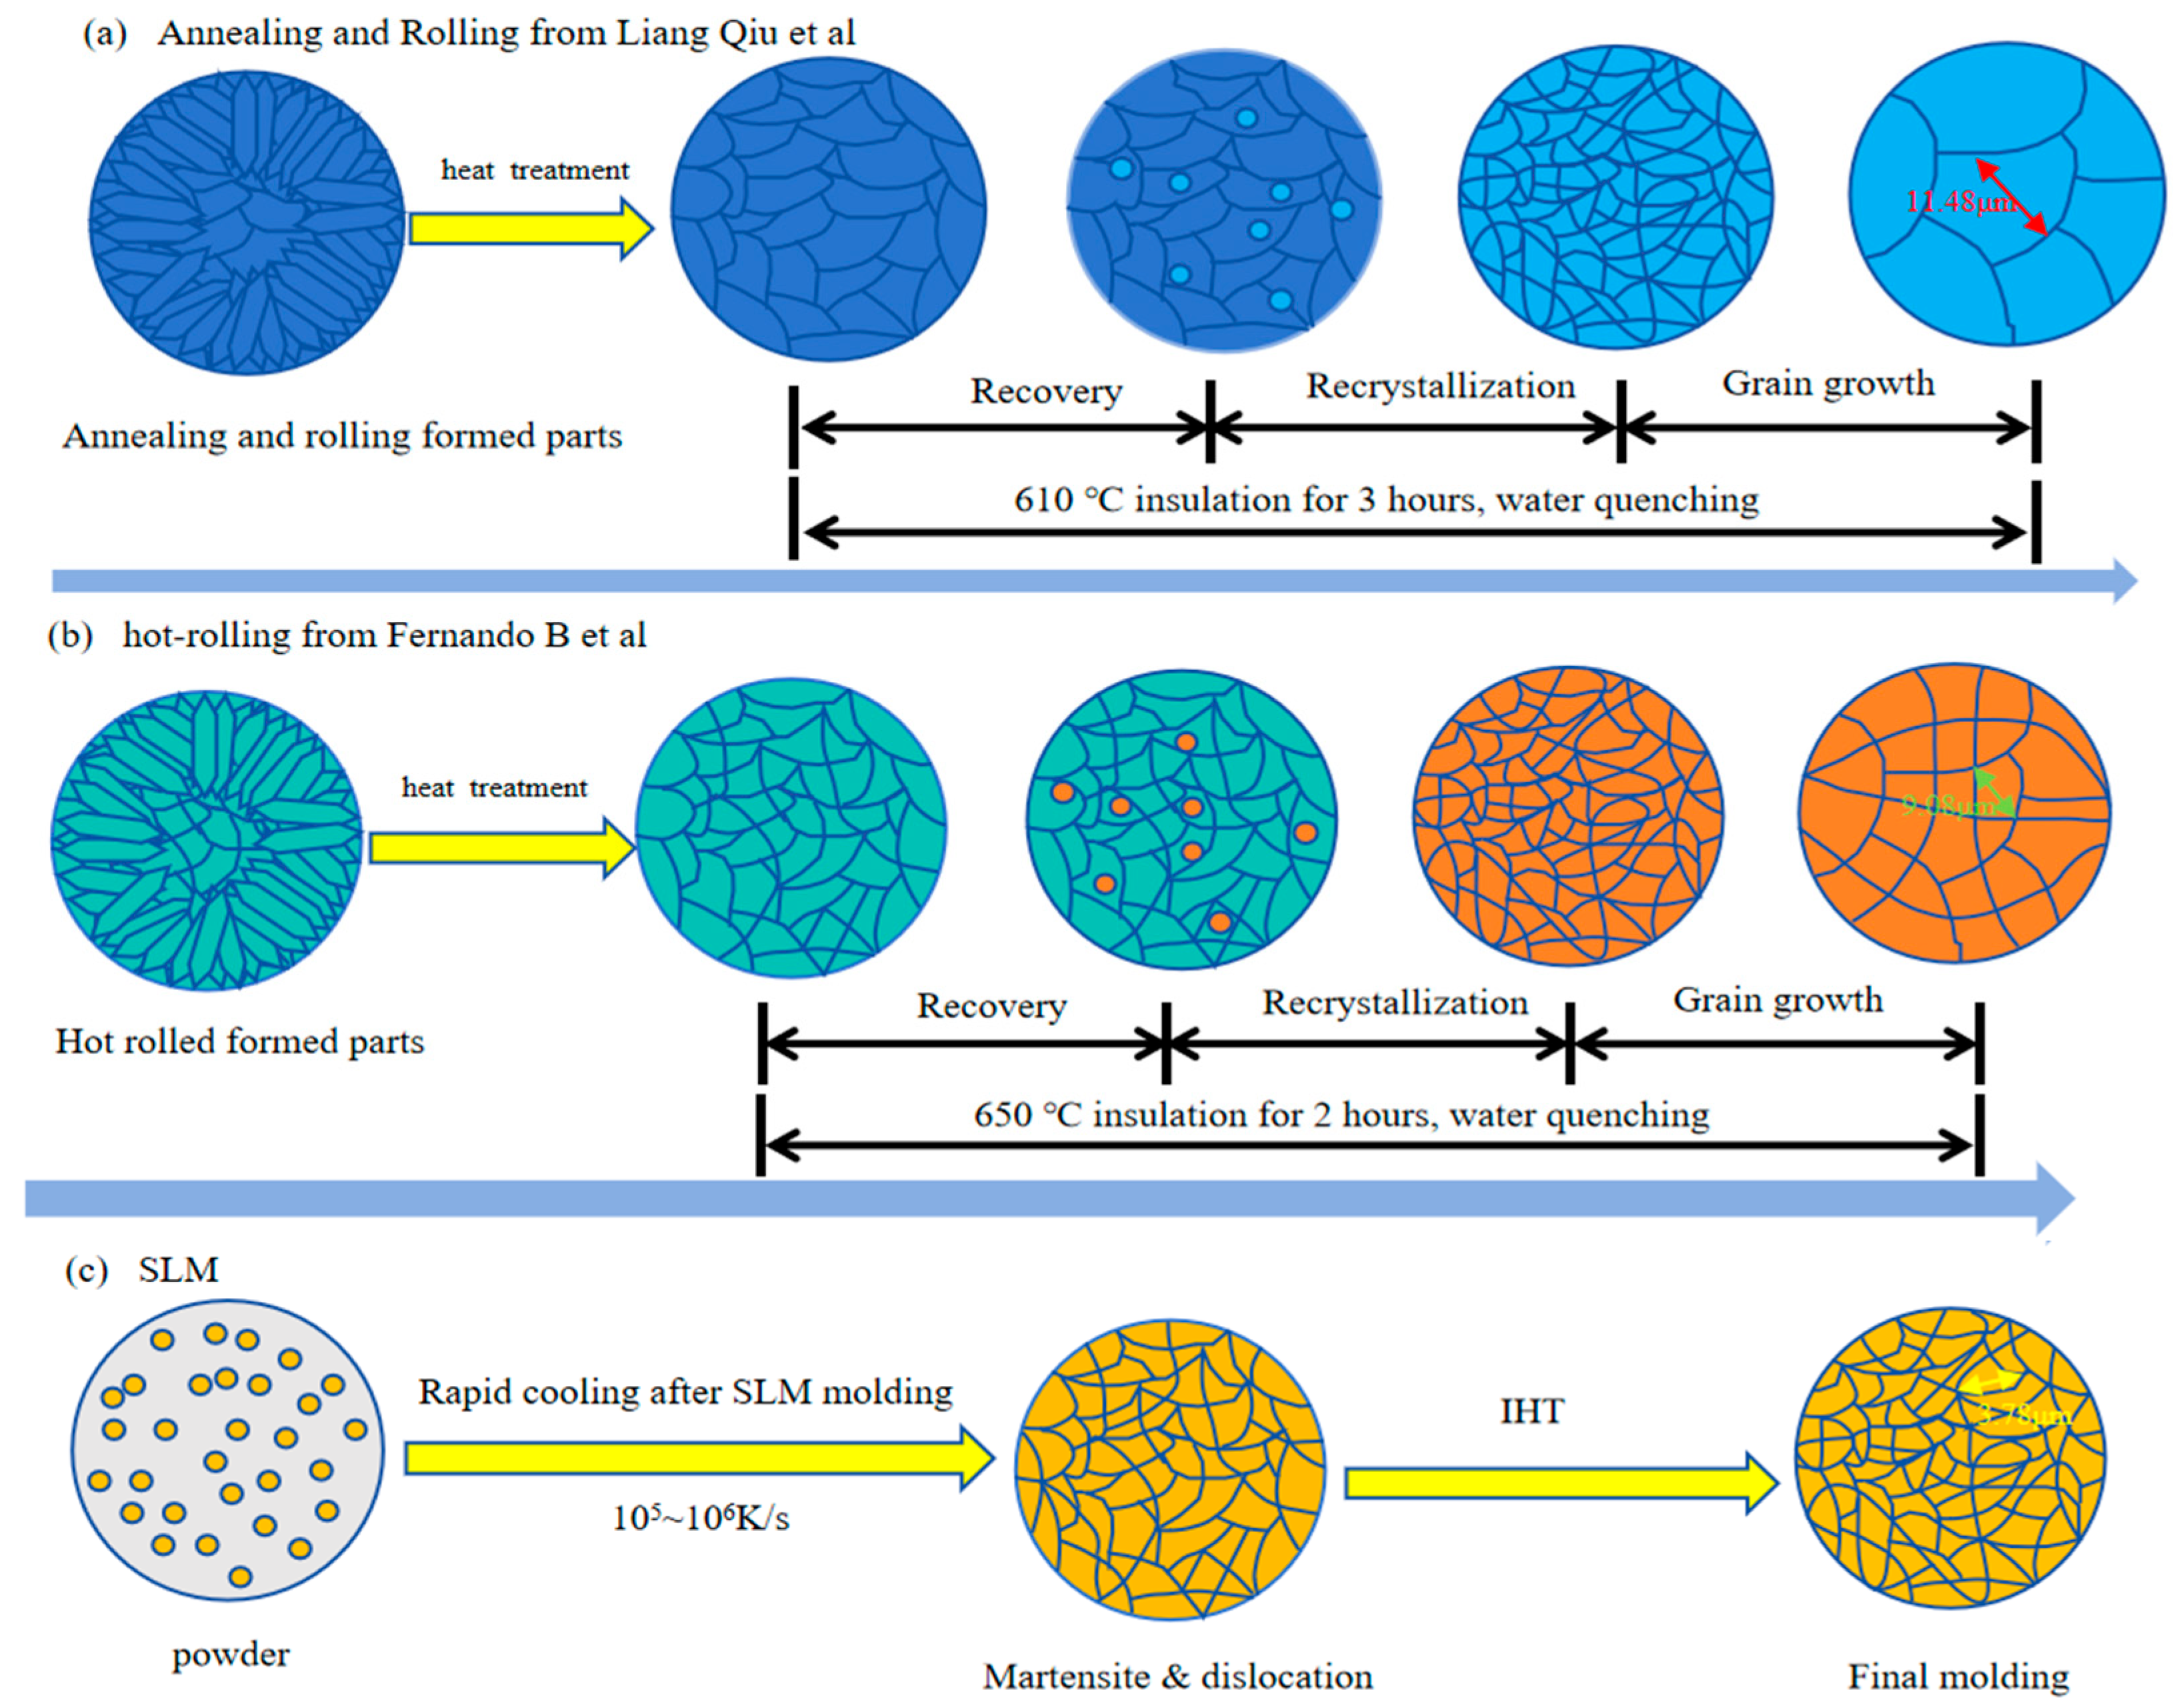
3.4. Grain Refinement Enhancement Mechanism of SLM Forming for Mooring Chain Steel

In the SLM (selective laser melting) process for fabricating mooring chain steel, the size of the molten pool formed is extremely small, often in the micrometer range. Due to the limited volume of liquid metal within the micro-melt pool, the space available for grain growth and the supply of liquid metal during the solidification process are both constrained. Consequently, the grain sizes formed are relatively fine. In contrast, traditional manufacturing processes involve larger melt pools, which provide sufficient space and liquid metal for continuous grain growth, resulting in relatively coarse grains.
Within the micro-melt pool, there exists a significant temperature gradient. The center of the melt pool is at a higher temperature, while the edges are relatively cooler. As the energy density increases, the depth of the melt pool increases, and the range of the temperature gradient expands. This temperature gradient causes the growth rate of grains near the edges to be relatively slow, while the growth of grains at the center is restricted by the edges. Under this non-uniform thermal field, grain growth occurs within a microscopic range.
During the SLM additive manufacturing process, the cooling rate of the micro-melt pool is extremely high, typically reaching 105 K/s or even higher. In contrast, the cooling rate during traditional water quenching after heat treatment is generally around 103 K/s [35]. Figure 22 illustrates the schematic variation in grain size under different manufacturing processes. The cooling rate in traditional manufacturing processes is much slower than that in SLM, which provides ample space for recrystallization, leading to coarse grains. Tan et al. [36] highlighted the unique cyclic heat treatment history of laser additive manufacturing imposes an intrinsic heat treatment (IHT) on the material during deposition. IHT involves a cyclic process of rapid cooling and heating, with high solidification rates. The rapid solidification characteristic of additive manufacturing prevents the atoms in the liquid metal from undergoing sufficient diffusion and arrangement, leaving insufficient time for grain growth. Within an extremely short timeframe, the liquid metal transforms into a solid state, and atoms can only form nuclei and grow within a small range, resulting in fine grain sizes.
The rapid solidification inherent in additive manufacturing processes significantly increases the nucleation rate of liquid metal. Under rapid solidification conditions, the undercooling of the liquid metal increases. Greater undercooling reduces the energy barrier for nucleation in the liquid phase, making it easier to form nuclei. The formation of a large number of nuclei leads to an increase in the number of grains. However, with each grain having a reduced growth space and limited supply of liquid metal, the overall grain size becomes finer.
This phenomenon is a direct consequence of the high cooling rates associated with additive manufacturing, which not only restrict the growth of individual grains but also enhance the nucleation process, ultimately leading to a finer microstructure. These fine grains contribute to improved mechanical properties, which are critical for the performance of materials like mooring chain steel fabricated via SLM.

4. Conclusions

When manufacturing mooring chains using traditional welding processes, the toughness at the weld seams is often inferior, leading to issues such as fracture or corrosion at these locations. In contrast, the novel additive manufacturing process utilizing SLM (selective laser melting) technology produces mooring chain steel with uniform material properties throughout, eliminating problems associated with weld seams. Additionally, the traditional manufacturing of complex-structure mooring chains typically requires multiple steps and intricate molds, which are costly and challenging. SLM technology, however, can directly manufacture mooring chains based on design models without the need for molds, enabling seamless and integrated production. Furthermore, SLM can produce mooring chains with complex internal cavities and unique shapes that are difficult to achieve with traditional processes, providing greater design flexibility for mooring chain applications. The main conclusions of this study are as follows:
  • The microstructure of 22MnCrNiMo steel primarily consists of martensite and lower bainite. As the laser power increases, the area of the heat-affected zone (HAZ) expands, leading to a higher proportion of bainite structures. Optimal results are achieved at a laser power of 200 W, where the grain size becomes fine and the grain orientation is irregular, resulting in a uniform sample microstructure. This uniformity is beneficial for enhancing the mechanical properties of the steel.
  • Under the laser parameters of 200 W laser power, a scanning speed of 800 mm/s, a layer thickness of 30 μm, and a scan spacing of 110 μm, the 22MnCrNiMo steel samples exhibit the best comprehensive mechanical properties. Specifically, the microhardness reaches 513.2 HV0.5, the tensile strength is 1223 MPa, the yield strength is 1114 MPa, the elongation is 8.5%, and the impact energy is 127 J.
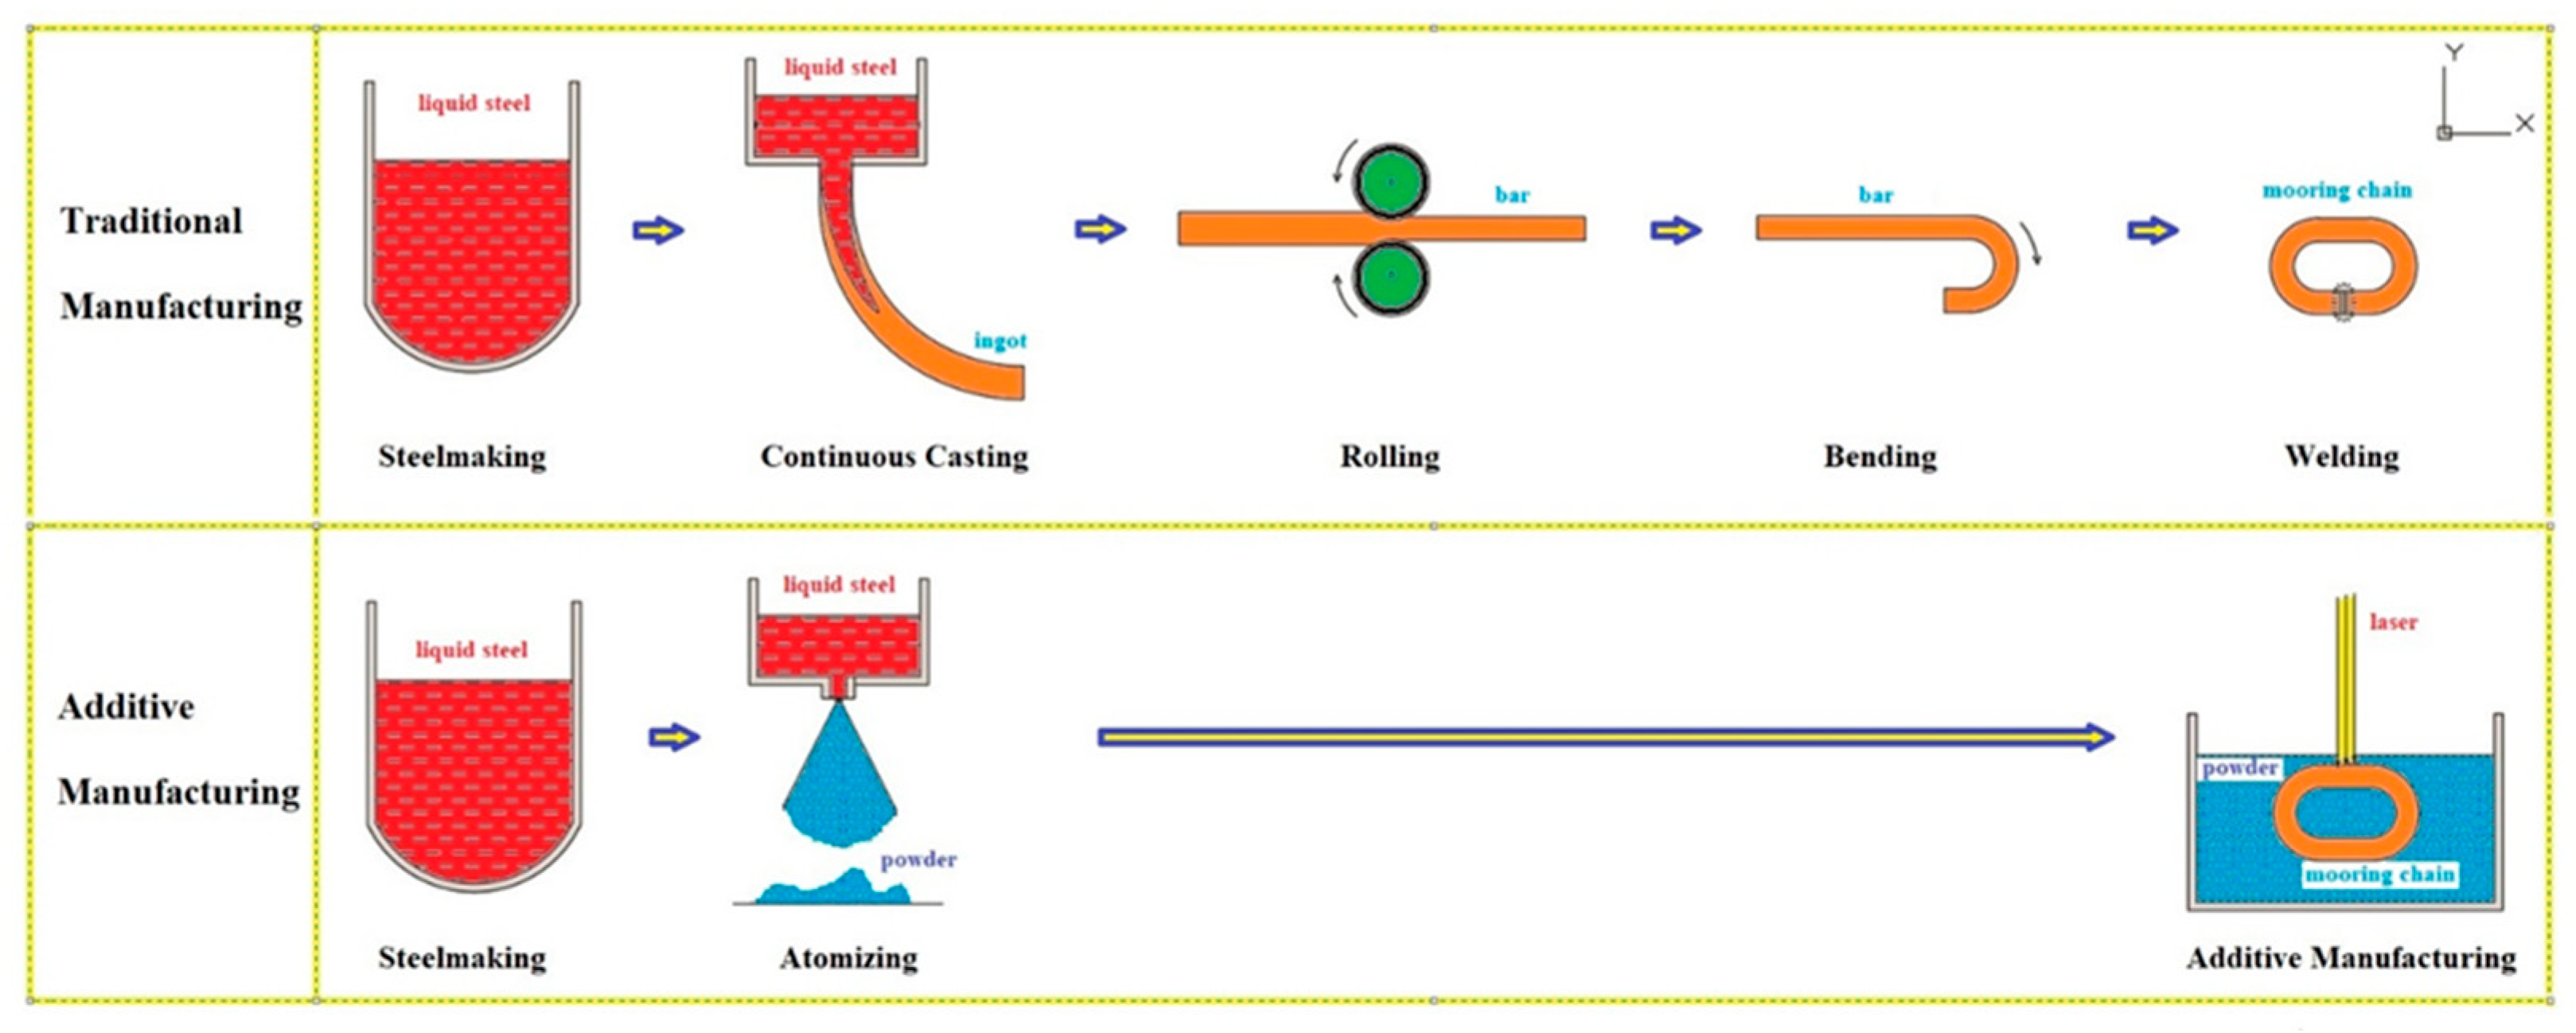
  • The selective laser melting (SLM) process creates micro-melt pools with a high solidification rate, which refines the grains of the mooring chain steel, significantly enhancing the sample’s strength. Compared with traditional manufacturing processes, the strength of 22MnCrNiMo steel produced using the SLM additive manufacturing process is increased by over 20%. This enhanced strength lays the foundation for the production of high-strength and high-toughness mooring chains.

Author Contributions

Methodology, C.H.; software, D.Z.; data curation, Y.L. and S.W.; writing—original draft, X.C.; writing—review and editing, X.L. All authors have read and agreed to the published version of the manuscript.

Funding

The work was supported by the National Natural Science Foundation of China (No. 52274336), Hebei Province Innovation Ability Improvement Plan (No. 24461002D).

Data Availability Statement

The datasets presented in this article are readily available.

Conflicts of Interest

The authors declare no conflicts of interest.

References

  1. Qvale, P.; Nordhagen, H.O.; Ås, S.K.; Skallerud, B.H. Effect of long periods of corrosion on the fatigue lifetime of offshore mooring chain steel. Mar. Struct. 2022, 85, 103236. [Google Scholar] [CrossRef]
  2. Fernandez, J.; Storesund, W.; Navas, J. Fatigue performance of grade R4 and R5 mooring chains in seawater. In Proceedings of the International Conference on Offshore Mechanics and Arctic Engineering, Rio de Janeiro, Brazil, 1–6 July 2012; American Society of Mechanical Engineers: New York, NY, USA, 2014; pp. 1–6. [Google Scholar]
  3. Ma, K.T.; Luo, Y.; Kwan, T.; Wu, Y. Mooring for floating wind turbines. Mooring Syst. Offshore Struct. 2019, 392, 299–315. [Google Scholar]
  4. Kang, J.; Sun, L.; Sun, H.; Wu, C. Risk assessment of floating offshore wind turbine based on correlation-FMEA. Ocean. Eng. 2017, 129, 382–388. [Google Scholar] [CrossRef]
  5. Pham, H.D.; Schoefs, F.; Cartraud, P.; Soulard, T.; Pham, H.H.; Berhault, C. Methodology for modeling and service life monitoring of mooring lines of floating wind turbines. Ocean. Eng. 2019, 193, 106603. [Google Scholar] [CrossRef]
  6. Gotoh, K.; Murakami, K.; Nakagawa, M.; Utsunomiya, T. Wear performance of the mooring chain used in floating wind turbines. In Proceedings of the International Conference on Offshore Mechanics and Arctic Engineering, Rio de Janeiro, Brazil, 1–6 July 2012; American Society of Mechanical Engineers: New York, NY, USA, 2017; pp. 1–6. [Google Scholar]
  7. Barrera, C.; Battistella, T.; Guanche, R.; Losada, I.J. Mooring system fatigue analysis of a floating offshore wind turbine. Ocean Eng. 2020, 195, 106670. [Google Scholar] [CrossRef]
  8. Sidhar, H.; Fenske, J.A.; Xu, W.; Baker, D.A.; Jin, H.W.; Neerav, V.; Xin, Y. High Manganese Steel for Mooring Chain Applications. Berg. Huettenmaenn. Monatsh. 2022, 167, 530–533. [Google Scholar] [CrossRef]
  9. Ankit, S.; Yoo Sang, C. Mooring chain strength tests and ductile failure modeling using micromechanics and phenomenology based failure models. Ocean. Eng. 2020, 195, 106663. [Google Scholar]
  10. Bergara, A.; Arredondo, A.; Altuzarra, J.; Martínez-Espanola, J.M. Calculation of stress intensity factors in offshore mooring chains. Ocean. Eng. 2020, 214, 107762. [Google Scholar] [CrossRef]
  11. Wei, M.W.; Chen, S.Y.; Xi, L.Y.; Liang, J.; Liu, C.S. Selective laser melting of 24CrNiMo steel for brake disc: Fabrication efficiency, microstructure evolution, and properties. Laser Technol. 2018, 107, 99–109. [Google Scholar] [CrossRef]
  12. Guenther, D.; Heymel, B.; Guenther, J.F.; Ederer, I. Continuous 3D-printing for additive manufacturing. Rapid Prototyp. 2014, 20, 320. [Google Scholar] [CrossRef]
  13. Kong, Z.; Wang, X.; Hu, N.; Jin, Y.; Tao, Q.; Xia, W.; Lin, X.-M.; Vasdravellis, G. Mechanical properties of SLM 316L stainless steel plate before and after exposure to elevated temperature. Constr. Build. Mater. 2024, 444, 137786. [Google Scholar] [CrossRef]
  14. Chen, M.T.; Gong, Z.; Zhang, T.; Zuo, W.; Zhao, Y.; Zhao, O.; Wang, Z. Mechanical behavior of austenitic stainless steels produced by wire arc additive manufacturing. Thin Walled Struct. 2023, 196, 111455. [Google Scholar] [CrossRef]
  15. Liverani, E.; Toschi, S.; Ceschini, L.A.; Fortunato, A. Effect of selective laser melting (SLM) process parameters on microstructure and mechanical properties of 316L austenitic stainless steel. Mater. Process. Technol. 2017, 249, 255–263. [Google Scholar] [CrossRef]
  16. Marattukalam, J.J.; Karlsson, D.; Pacheco, V.; Beran, P.; Wiklund, U.; Jansson, U.; Sahlberg, M. The effect of laser scanning strategies on texture, mechanical properties and site-specific grain orientation in selective laser melted 316L. Mater. Des. 2020, 193, 108852. [Google Scholar] [CrossRef]
  17. Zhang, A.; Wu, W.; Wu, M.; Liu, Y.; Zhang, Y.; Wang, Q. Influence of laser power on mechanical properties and pitting corrosion behavior of additively manufactured 316L stainless steel by laser powder bed fusion (L-PBF). Laser Technol. 2024, 176, 110886. [Google Scholar] [CrossRef]
  18. Qiu, C.; Kindi, M.A.; Aladawi, S.; Hatmi, I.A. A comprehensive study on microstructure and tensile behaviour of a selectively laser melted stainless steel. Sci. Rep. 2018, 8, 7785. [Google Scholar] [CrossRef]
  19. Montero-Sistiaga, M.L.; Godino-Martinez, M.K.; Boschmans, J.; Kruth, P.; Van Humbeeck, J.; Vanmeensel, K. Microstructure evolution of 316L produced by HP-SLM (high power selective laser melting). Addit. Manuf. 2018, 23, 402–410. [Google Scholar] [CrossRef]
  20. Wan, Y.C.; Xu, S.Y.; Liu, C.M.; Gao, Y.H.; Jiang, S.N.; Chen, Z.Y. Enhanced strength and corrosion resistance of Mg-Gd-Y-Zr alloy with ultrafine grains. Mater Lett. 2018, 213, 213–224. [Google Scholar] [CrossRef]
  21. Sun, J.J.; Liu, Y.N.; Zhu, Y.T.; Lian, F.L. Super-strong dislocation-structured high-carbon martensite steel. Sci. Rep. 2017, 7, 6596. [Google Scholar] [CrossRef]
  22. Zhang, Y.; Fang, Y.; Kim, M.K.; Duan, Z.; Yuan, Q.; Oh, E.; Suhr, J. In-situ TiCxNy nanoparticle reinforced crack-free CoCrFeNi medium-entropy alloy matrix nanocomposites with high strength and ductility via laser powder bed fusion. Compos. Part B-Eng. 2024, 273, 111237. [Google Scholar] [CrossRef]
  23. Kim, W.R.; Bang, G.B.; Park, J.H.; Lee, T.W.; Lee, B.S.; Yang, S.M.; Kim, G.H.; Lee, K.H.; Kim, G. Microstructural study on a Fe-10Cu alloy fabricated by selective laser melting for defect-free process optimization based on the energy density. J. Mater. Res. Technol. 2020, 9, 12834–12839. [Google Scholar] [CrossRef]
  24. Li, J.; Qu, H.; Bai, J. Grain boundary engineering during the laser powder bed fusion of TiC/316L stainless steel composites: New mechanism for forming TiC-induced special grain boundaries. Acta. Mater. 2022, 226, 117605. [Google Scholar] [CrossRef]
  25. King, W.E.; Barth, H.D.; Castillo, V.M.; Gallegos, G.F.; Gibbs, J.W.; Hahn, D.E.; Kamath, C.; Rubenchik, A.M. Observation of keyhole-mode laser melting in laser powder-bed fusion additive manufacturing. J. Mater. Process. Technol. 2014, 214, 2915–2925. [Google Scholar] [CrossRef]
  26. Bai, S.; Perevoshchikova, N.; Sha, Y.; Wu, X. The effects of selective laser melting process parameters on relative density of the AlSi10Mg parts and suitable procedures of the archimedes method. Appl. Sci. 2019, 9, 583. [Google Scholar] [CrossRef]
  27. Sun, M.; Chen, S.Y.; Wei, M.W.; Liang, J.; Liu, C.S.; Wang, M. Microstructure and properties of high power-SLM 24CrNiMoY alloy steel at different laser energy density and tempering temperature. Powder Metall 2021, 64, 1–7. [Google Scholar] [CrossRef]
  28. Khairallah, S.A.; Anderson, A. Mesoscopic simulation model of selection laser melting of stainless steel power. J. Mater. Res. Technol. 2014, 214, 2627–2636. [Google Scholar] [CrossRef]
  29. Cui, X.; Zhang, S.; Wang, C.; Zhang, C.H.; Chen, J.; Zhang, J.B. Microstructure and fatigue behavior of a laser additive manufactured 12CrNi2 low alloy steels. Mater. Sci. Eng. A 2020, 772, 138685. [Google Scholar] [CrossRef]
  30. Zinoviev, A.; Zinovieva, O.; Ploshikhin, V.; Romanova, V.; Balokhonov, R. Evolution of grain structure during laser additive manufacturing. Simulation by a cellular automata method. Mater. Des. 2016, 106, 321–329. [Google Scholar] [CrossRef]
  31. Liang, Q.; Junru, L.; Pengfei, Z.; Leiying, W.; Guojun, M. Effect of Niobium Microalloying on the Mechanical Properties in Grade R4 Mooring Chain Steel. Metall. Mater. Trans. 2024, 55, 695–705. [Google Scholar]
  32. Mainier, F.B.; Canto, M.O.; Meiriño, M.J. Characteristics of Grade R4 Steel Manufactured by Ingot Casting and Used in the Production of Offshore Mooring Chains. Trans. Marit. Sci. 2023, 12. [Google Scholar] [CrossRef]
  33. Augustin, A.; Huilgol, P.; Udupa, K.R.; Bhat, K.U. Effect of current density during electrodeposition on microstructure and hardness of textured Cu coating in the application of antimicrobial Al touch surface. J. Mech. Behav. Biomed. 2016, 63, 352–360. [Google Scholar] [CrossRef] [PubMed]
  34. AlMangour, B.; Grzesiak, D.; Cheng, J.; Ertas, Y. Thermal behavior of the molten pool, microstructural evolution and tribological performance during selective laser melting of TiC/316L stainless steel nanocomposites: Experimental and simulation methods. J. Mater. Res. Technol. 2018, 257, 288–301. [Google Scholar] [CrossRef]
  35. Sang Gun, L.; Massoud, K.; Jungho, L. Role of quenching method on cooling rate and microstructure of steels: Variations in coolant and its flow arrangement. Int. J. Heat Mass Transf. 2022, 189, 122702. [Google Scholar]
  36. Chaolin, T.; Qian, L.; Xiling, Y.; Lequn, C.; Jinlong, S.; Fern Lan, N.; Yuchan, L.; Tao, Y.; Youxiang, C.; Chain, T.L.; et al. Machine Learning Customized Novel Material for Energy-Efficient 4D Printing. Adv. Sci. 2023, 10, 2206607. [Google Scholar]
Figure 1. Particle size distribution of powder. The red line represents the percentage of each size, while the blue line shows the cumulative percentage, which totals 100%.
Metals 15 00541 g001
Figure 2. Microscopic morphology of 22MnCrNiMo steel powder prepared by aerosolization.
Metals 15 00541 g002
Figure 3. Additive manufacturing equipment for SLM experiment.
Metals 15 00541 g003
Figure 4. Schematic diagram of SLM technology preparation.
Metals 15 00541 g004
Figure 5. Cubic samples, tensile samples, and impact samples.
Metals 15 00541 g005
Figure 6. Schematic diagram of SLM-formed parts: (a) schematic diagram of cubic samples and observation direction, (b) schematic diagram of tensile samples, (c) schematic diagram of impact samples.
Metals 15 00541 g006
Figure 7. Optimization of parameters for SLM: (a) microstructure of samples, (b) statistics of density and energy density. The red dot represents density, and the black dot represents energy density.
Metals 15 00541 g007
Figure 8. OM photo of 22MnCrNiMo steel sample melted by selective laser melting: (a) XY section, (b) XZ section.
Metals 15 00541 g008
Figure 9. XRD patterns of 22MnCrNiMo steel samples under different laser powers.
Metals 15 00541 g009
Figure 10. Scanning electron microscope images of 22MnCrNiMo steel; (a) T2 XY plot (b) T5 XY plot (c) T2 XZ plot (d) T5 XZ plot.
Metals 15 00541 g010
Figure 11. Statistical chart of the proportion of lower bainite area: (a) T2, (b) T5.
Metals 15 00541 g011
Figure 12. EBSD image of 22MnCrNiMo steel.
Metals 15 00541 g012
Figure 13. Distribution of grain boundaries of 22MnCrNiMo steel.
Metals 15 00541 g013
Figure 14. Grain distribution of 22MnCrNiMo steel.
Metals 15 00541 g014
Figure 15. Schematic diagrams of Traditional Manufacturing (TM) process and Additive Manufacturing (AM) process for mooring chains.
Metals 15 00541 g015
Figure 16. Mechanical properties of 22MnCrNiMo steel under different manufacturing processes: (a) mechanical properties of 22MnCrNiMo steel via novel additive manufacturing processes; (b) tensile strength of mooring chain steel under different conventional manufacturing processes.
Metals 15 00541 g016
Figure 17. Tensile fracture morphology of 22MnCrNiMo steel: (a) T2, (b) T4, (c) T6.
Metals 15 00541 g017
Figure 18. Relationship between grain size and strength of samples under different processes [31,32].
Metals 15 00541 g018
Figure 19. Impact absorption energy of 22MnCrNiMo mooring chain samples under different laser powers.
Metals 15 00541 g019
Figure 20. Impact fracture morphology of 22MnCrNiMo sample: (a) T2, (b) T4, (c) T6. The red squares indicate the position of the enlarged image.
Metals 15 00541 g020
Figure 21. Hardness properties of 22MnCrNiMo steel under different laser powers. *—Represents the hardness values of the same item sampled at random points, with each sample taking 5 data points, and the average value being the final result.
Metals 15 00541 g021
Figure 22. Schematic diagram of grain size changes in different manufacturing processes [31,32]: (a) annealing and rolling, (b) hot rolling, (c) SLM.
Metals 15 00541 g022
Table 1. Chemical composition of 22MnCrNiMo steel powder (wt%).
ElementCSiMnSPCrMoNiNbCuAlFe
Actual composition0.2290.2361.3960.0010.0030.9460.3900.8150.0010.0260.028bal. *
R4 standard ingredient0.18~0.280.15~0.301.20~1.75≤0.025≤0.0250.40~1.300.20~0.600.40~1.40≤0.06≤0.200.020~0.05bal. *
* bal. refers to the balance amount, meaning the remaining composition is primarily Fe (iron).
Table 2. Experimental scheme and corresponding SLM process parameters.
Serial NumberLaser Power/WScanning Speed/mm·s−1Scanning Spacing/μmLayer Thickness/μmEnergy Density/J·mm−3
T11758001103066.3
T220075.8
T322585.2
T425094.7
T5275104.2
T6300113.6
T7325123.1
T8175100053.0
T920060.6
T1022568.2
T1125075.8
T1227583.3
T1330090.9
T1432598.5
T15175120044.2
T1620050.5
T1722556.8
T1825063.1
T1927569.4
T2030075.8
T2132582.1
Table 3. Mechanical properties of 22MnCrNiMo steel with different laser parameters.
SampleLaser Power/WTensile Strength/MPaYield Strength/MPaElongation/%
T1175128111216.7
T2200122311148.5
T3225119510898.9
T4250118410359.2
T52751175101010.2
T6300119010467.2
T7325119410516.9
S1standard>860 MPa>580 MPa>12
O1Liang et al. [31]1009929.518
O2Mainier et al. [32]85793716.1
Disclaimer/Publisher’s Note: The statements, opinions and data contained in all publications are solely those of the individual author(s) and contributor(s) and not of MDPI and/or the editor(s). MDPI and/or the editor(s) disclaim responsibility for any injury to people or property resulting from any ideas, methods, instructions or products referred to in the content.

