Article

Optimization of Roll Configuration and Investigation of Forming Process in Three-Roll Planetary Rolling of Stainless Steel Seamless Tubes

1
School of Materials Science and Engineering, Taiyuan University of Science and Technology, Taiyuan 030024, China
2
Collaborative Innovation Center of Steel Technology, University of Science and Technology Beijing, Beijing 100083, China
3
Coordinative Innovation Center of Taiyuan Heavy Machinery Equipment, Taiyuan University of Science and Technology, Taiyuan 030024, China
*
Author to whom correspondence should be addressed.
Metals 2025, 15(5), 540; https://doi.org/10.3390/met15050540
Submission received: 1 April 2025 / Revised: 29 April 2025 / Accepted: 9 May 2025 / Published: 13 May 2025

Abstract

Three-roll planetary rolling technology has emerged as a primary method for manufacturing seamless tubes due to its advantages, including significant single-pass deformation, low energy consumption, and the ability to continuously roll long workpieces. Based on the forming characteristics of three-roll planetary rolling, this study established a simulation model of the rolling process, which includes key parameters such as the friction coefficient, roll speed, and roll deflection angle. Using finite element software, the effects of these parameters on the rolling process are simulated and analyzed. By comparing critical indicators such as the equivalent stress, rolling temperature, and roundness of the workpiece, the influence of the process parameters on the forming quality of three-roll planetary rolling is revealed. The optimal parameter combination is determined as follows: a friction coefficient of 0.3, roll speed of 120 rpm, and roll deflection angle of 9°. This research provides a reliable theoretical foundation for subsequent roll profile design and process parameter optimization in three-roll planetary rolling.

1. Introduction

The rapid development of offshore umbilical cables and high-performance heat exchangers has significantly increased the demand for long-length, ultra-thin (length > 100 m, minimum wall thickness 0.2 mm) stainless steel seamless tubes [1,2,3,4,5]. However, domestic production currently relies on “cold drawing + cold rolling” processes [6,7,8], which involve welding multiple cold-rolled tubes followed by multi-pass drawing. These methods suffer from excessive processing steps, low efficiency, and poor yield. While spin forming is an alternative for long tubes, it requires axial feed motion, resulting in limited production speed and equipment constraints. Thus, there is an urgent need to develop new forming technologies for the continuous production of long seamless tubes [9,10].
Three-roll planetary rolling technology provides an effective solution to the low efficiency of traditional processes. As shown in Figure 1, three rollers are circumferentially arranged at 120° around the tube axis, each configured with a tilt angle (α) and a helix angle (β). Through the unique compound motion of rotation and revolution, this technology achieves dual processing effects: the tilt angle α generates axial thrust to enable automatic bite-in and continuous feeding of the tube, while the helix angle β governs radial compression to achieve efficient diameter and wall thickness reduction [11]. This process attains deformation equivalent to 6–8 passes of conventional rolling in a single pass, significantly enhancing production efficiency. Notably, since the helix angle β is typically fixed at 55° during mill manufacturing, precise control of the roller rotational speed and tilt angle α becomes critical for ensuring bite-in stability and wall thickness uniformity. Recent studies demonstrate that establishing correlations between key process parameters and product quality through simulation analysis has emerged as an effective approach to guarantee the reliable implementation of three-roll planetary rolling technology.
Hwang [12] discussed the influence of process conditions on the surface quality and roll pressure during the three-roll planetary rolling process, focusing on the structural principles and mechanical characteristics of the rolling machine. Through comparisons between analytical and experimental results, he optimized the roll shape and conditions to achieve a smoother surface and reduce spiral marks on the product. Shih et al. [13] explored the three-roll planetary rolling process using plastic materials. Through experiments and finite element simulations, they studied the pitch length and angle of spiral marks on the workpiece cross-section during the rolling process, as well as the depth of the end cavity, providing insights for process optimization. Li et al. [14] predicted the three-dimensional temperature field during the three-roll planetary rolling of TP2 copper tubes. They analyzed the temperature distribution and deformation characteristics using thermomechanical coupling simulations, which are crucial for understanding the rolling process and product quality. Shih et al. [15] elucidated the forming principles of three-roll planetary rolling technology through experimental and numerical analyses, confirming the rationality of the simulation model for this forming process. Han et al. [16] investigated the forming process of copper tubes through three-roll planetary rolling and obtained optimal process parameters for improving the quality of rolled pieces. They also verified the forming characteristics of this process. Dong et al. [17] explored the influence of mechanical behavior on the forming effect by simulating the three-roll planetary rolling process of copper tubes. Zeng et al. [18] compared the influence of different roll profiles on the forming effect of rolled pieces, providing new ideas for the roll profile design of three-roll planetary rolling mills. Combining the above analysis and research, it is considered feasible to produce stainless steel seamless tubes through three-roll planetary rolling technology. However, there are still deficiencies in the relevant technologies for producing stainless steel tubes using this forming method [19,20,21,22,23,24].
This study focuses on 304 stainless steel seamless tubes, employing finite element simulation to systematically investigate the influence patterns of key parameters—including the roller rotational speed, tilt angle, and friction coefficient—on the tubular product forming quality. The research aims to establish optimized process parameters and provide practical guidance for industrial production implementation.

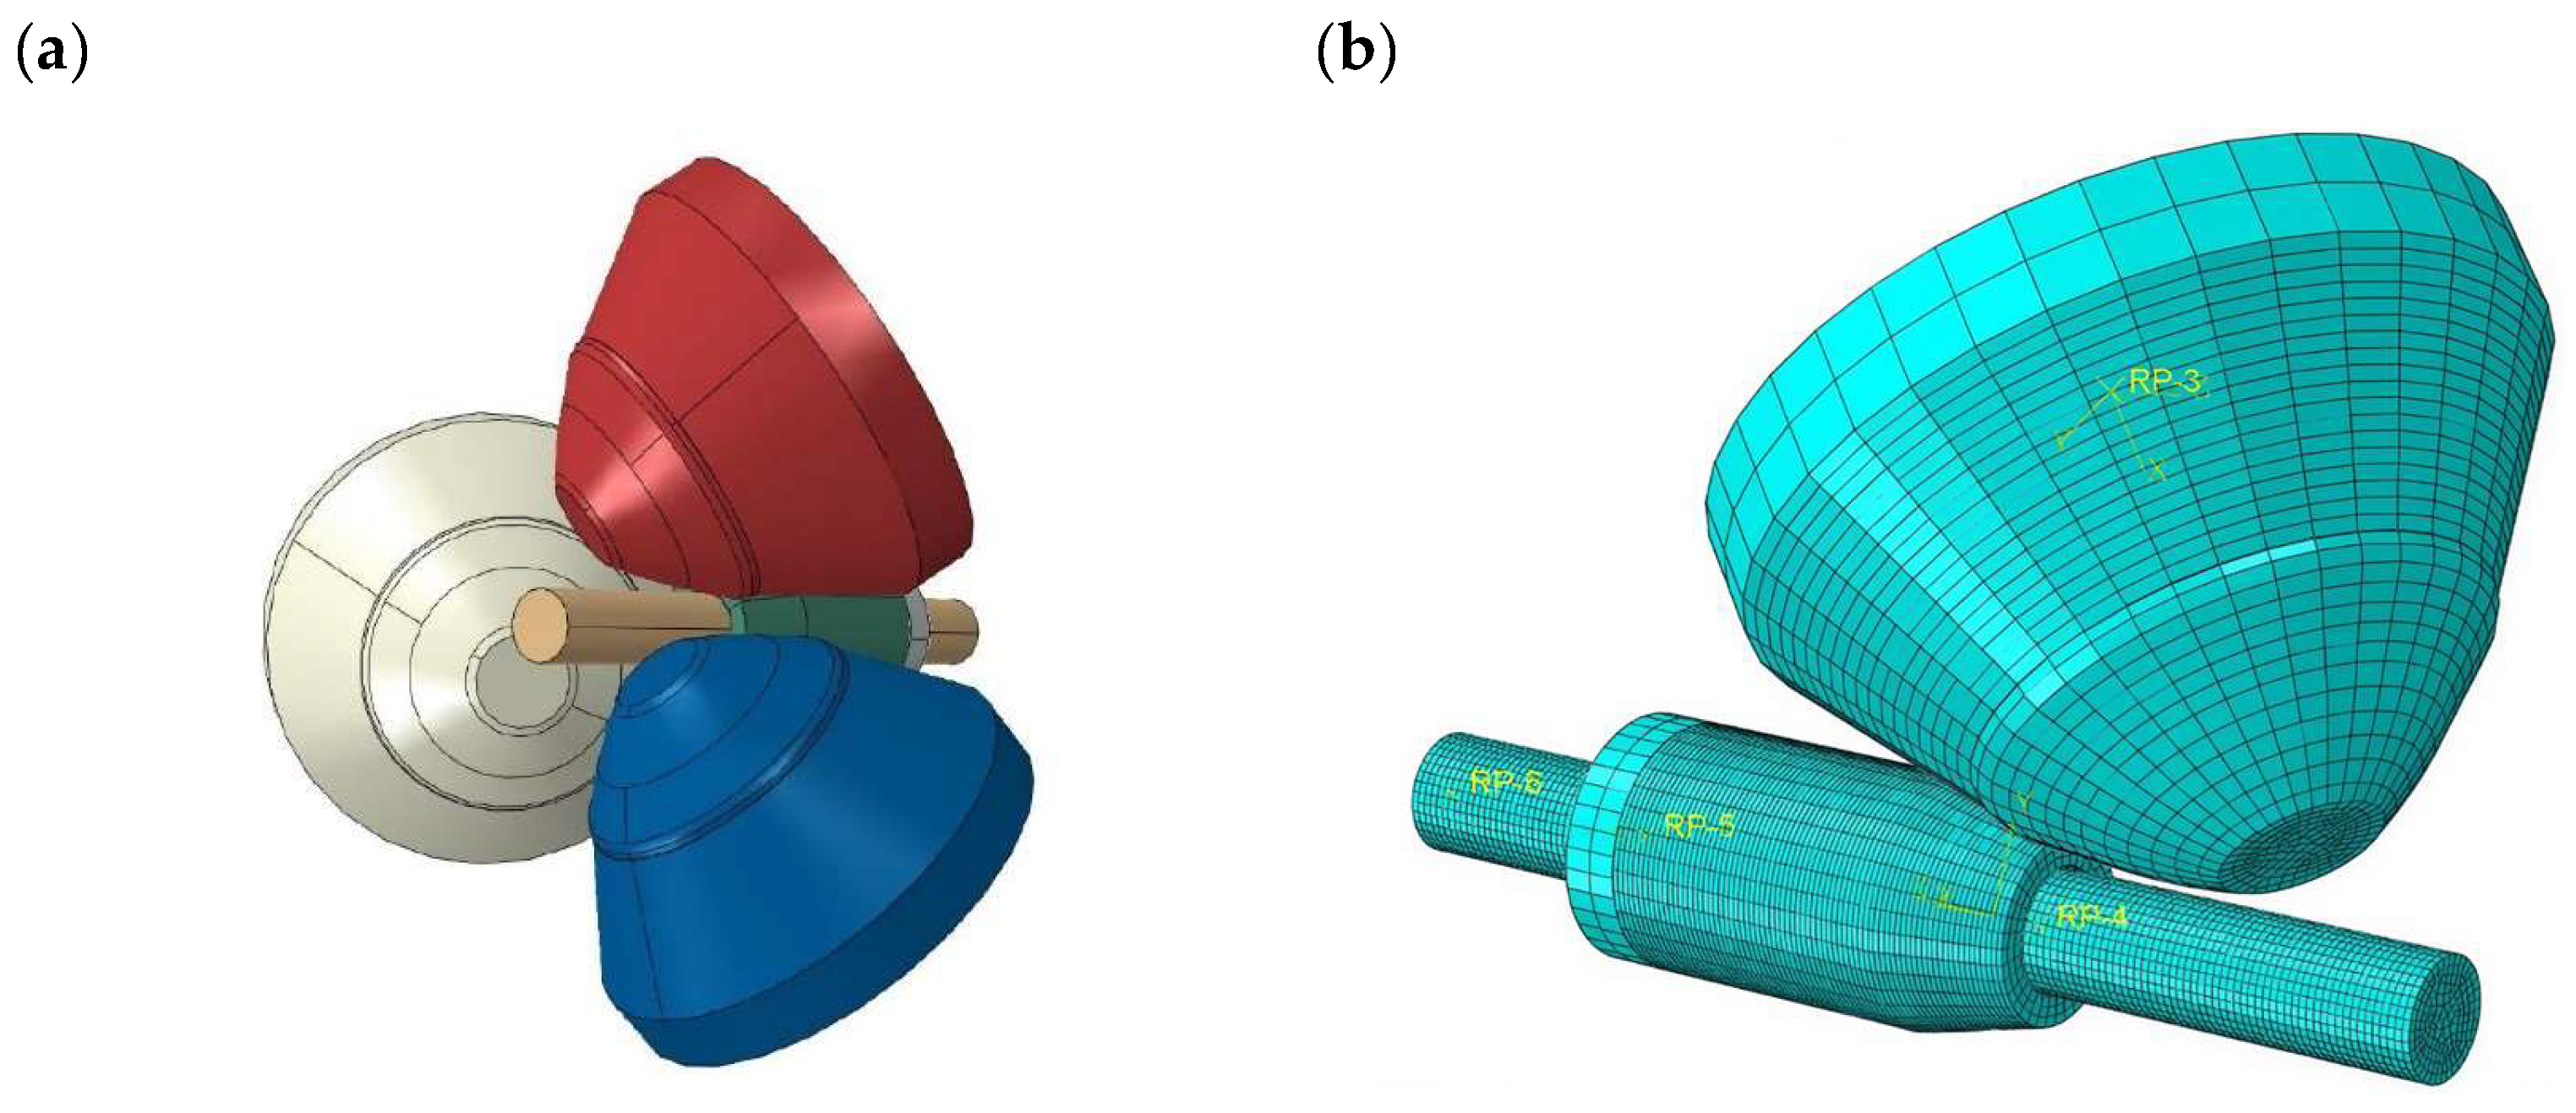
2. Simulation Parameter Setting

This study establishes a complete numerical model for the three-roll planetary rolling of 304 stainless steel pipes using the finite element simulation platform, as shown in Figure 2a [25,26,27]. The physical properties of the materials are listed in Table 1, while the initial and final dimensions of the pipes are provided in Table 2. The model configuration includes two critical contact pairs: roll outer surface–pipe outer surface contact, and mandrel–pipe inner surface contact. Boundary conditions encompass both the rotational (spinning) and orbital speeds of the rolls, as well as the axial feeding speed of the pipe prior to engagement. All components are meshed with eight-node three-dimensional linear solid elements (C3D8T). To analyze the deformation patterns in the pipe, its radial direction is divided into three mesh layers, and its circumferential direction is uniformly divided into 36 meshes, corresponding to 360°, facilitating node selection and stress gradient analysis during post-processing, as illustrated in Figure 2b.
The key process parameter ranges are determined based on actual production equipment from Enterprise [28,29,30], specifically including the following: roll speeds of 30–150 r/min, roll tilt angles of 7–11°, and friction coefficients of 0.2–0.5 (detailed in Table 3). The roll spinning speed is calculated from the orbital speed and the transmission ratio of the planetary gear system, with friction coefficients covering conventional metal plastic processing conditions.
During three-roll planetary rolling, the workpiece undergoes continuous stress state variations under the compressive action of three rotating rolls. The stress distribution exhibits significant spatial heterogeneity, creating pronounced stress gradients across different material points. To characterize this phenomenon, four equidistant monitoring points were selected along the radial cross-section of the workpiece in this study to analyze the temporal evolution of stress at each point throughout the entire rolling process (as illustrated in Figure 3). Additionally, three radial cross-sections are taken from the finished pipe segment after rolling. Twelve points are uniformly sampled around the outer circumference of each cross-section, and the average radius values at corresponding positions across the three cross-sections are calculated to evaluate the roundness. The sampling method is illustrated in Figure 4.

3. Effect of Roller Rotation Speed on Three-Roll Planetary Rolling Performance

This study emphasizes the critical importance of proper roller rotational speed selection for ensuring rolling stability and forming quality in three-roll planetary rolling. Based on actual production conditions, five rotational speeds (30 rpm, 60 rpm, 90 rpm, 120 rpm, 150 rpm) were systematically simulated. Through comprehensive analysis of the simulation results including equivalent stress distribution, temperature evolution, and roundness characteristics, the research summarizes the influence patterns of the roller speed on the tubular product quality and ultimately determines the optimal rotational speed parameter.

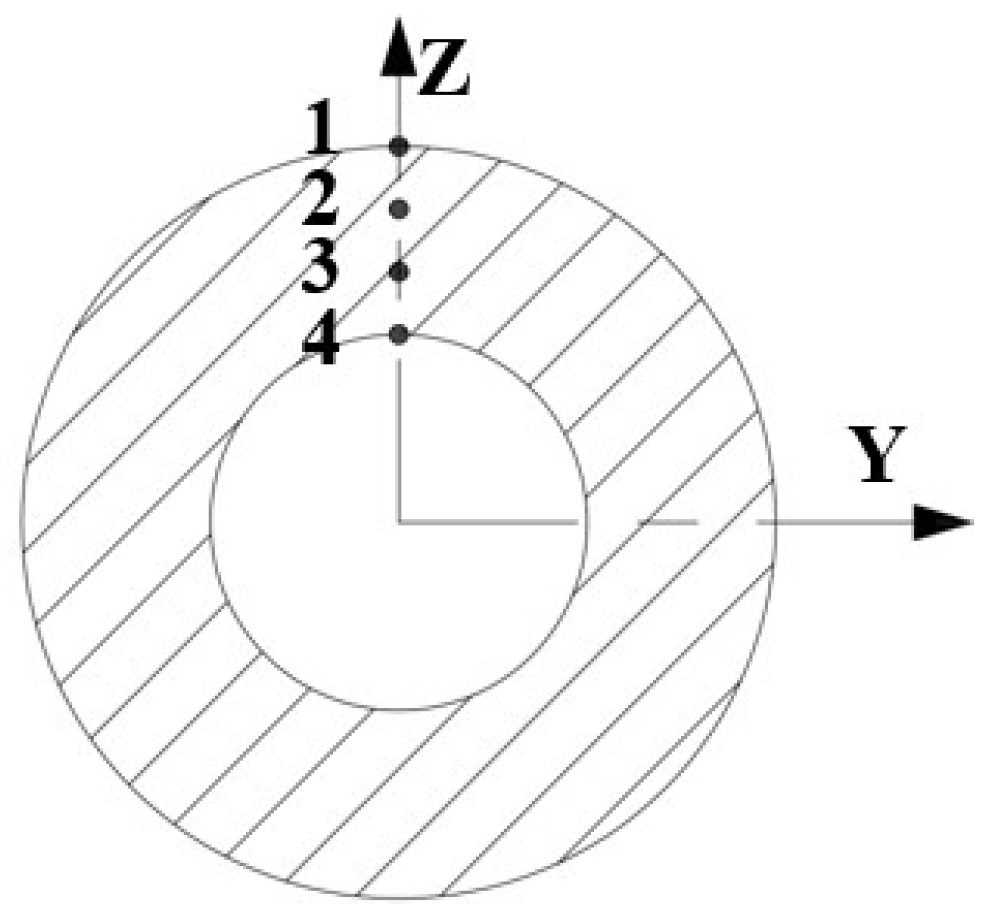
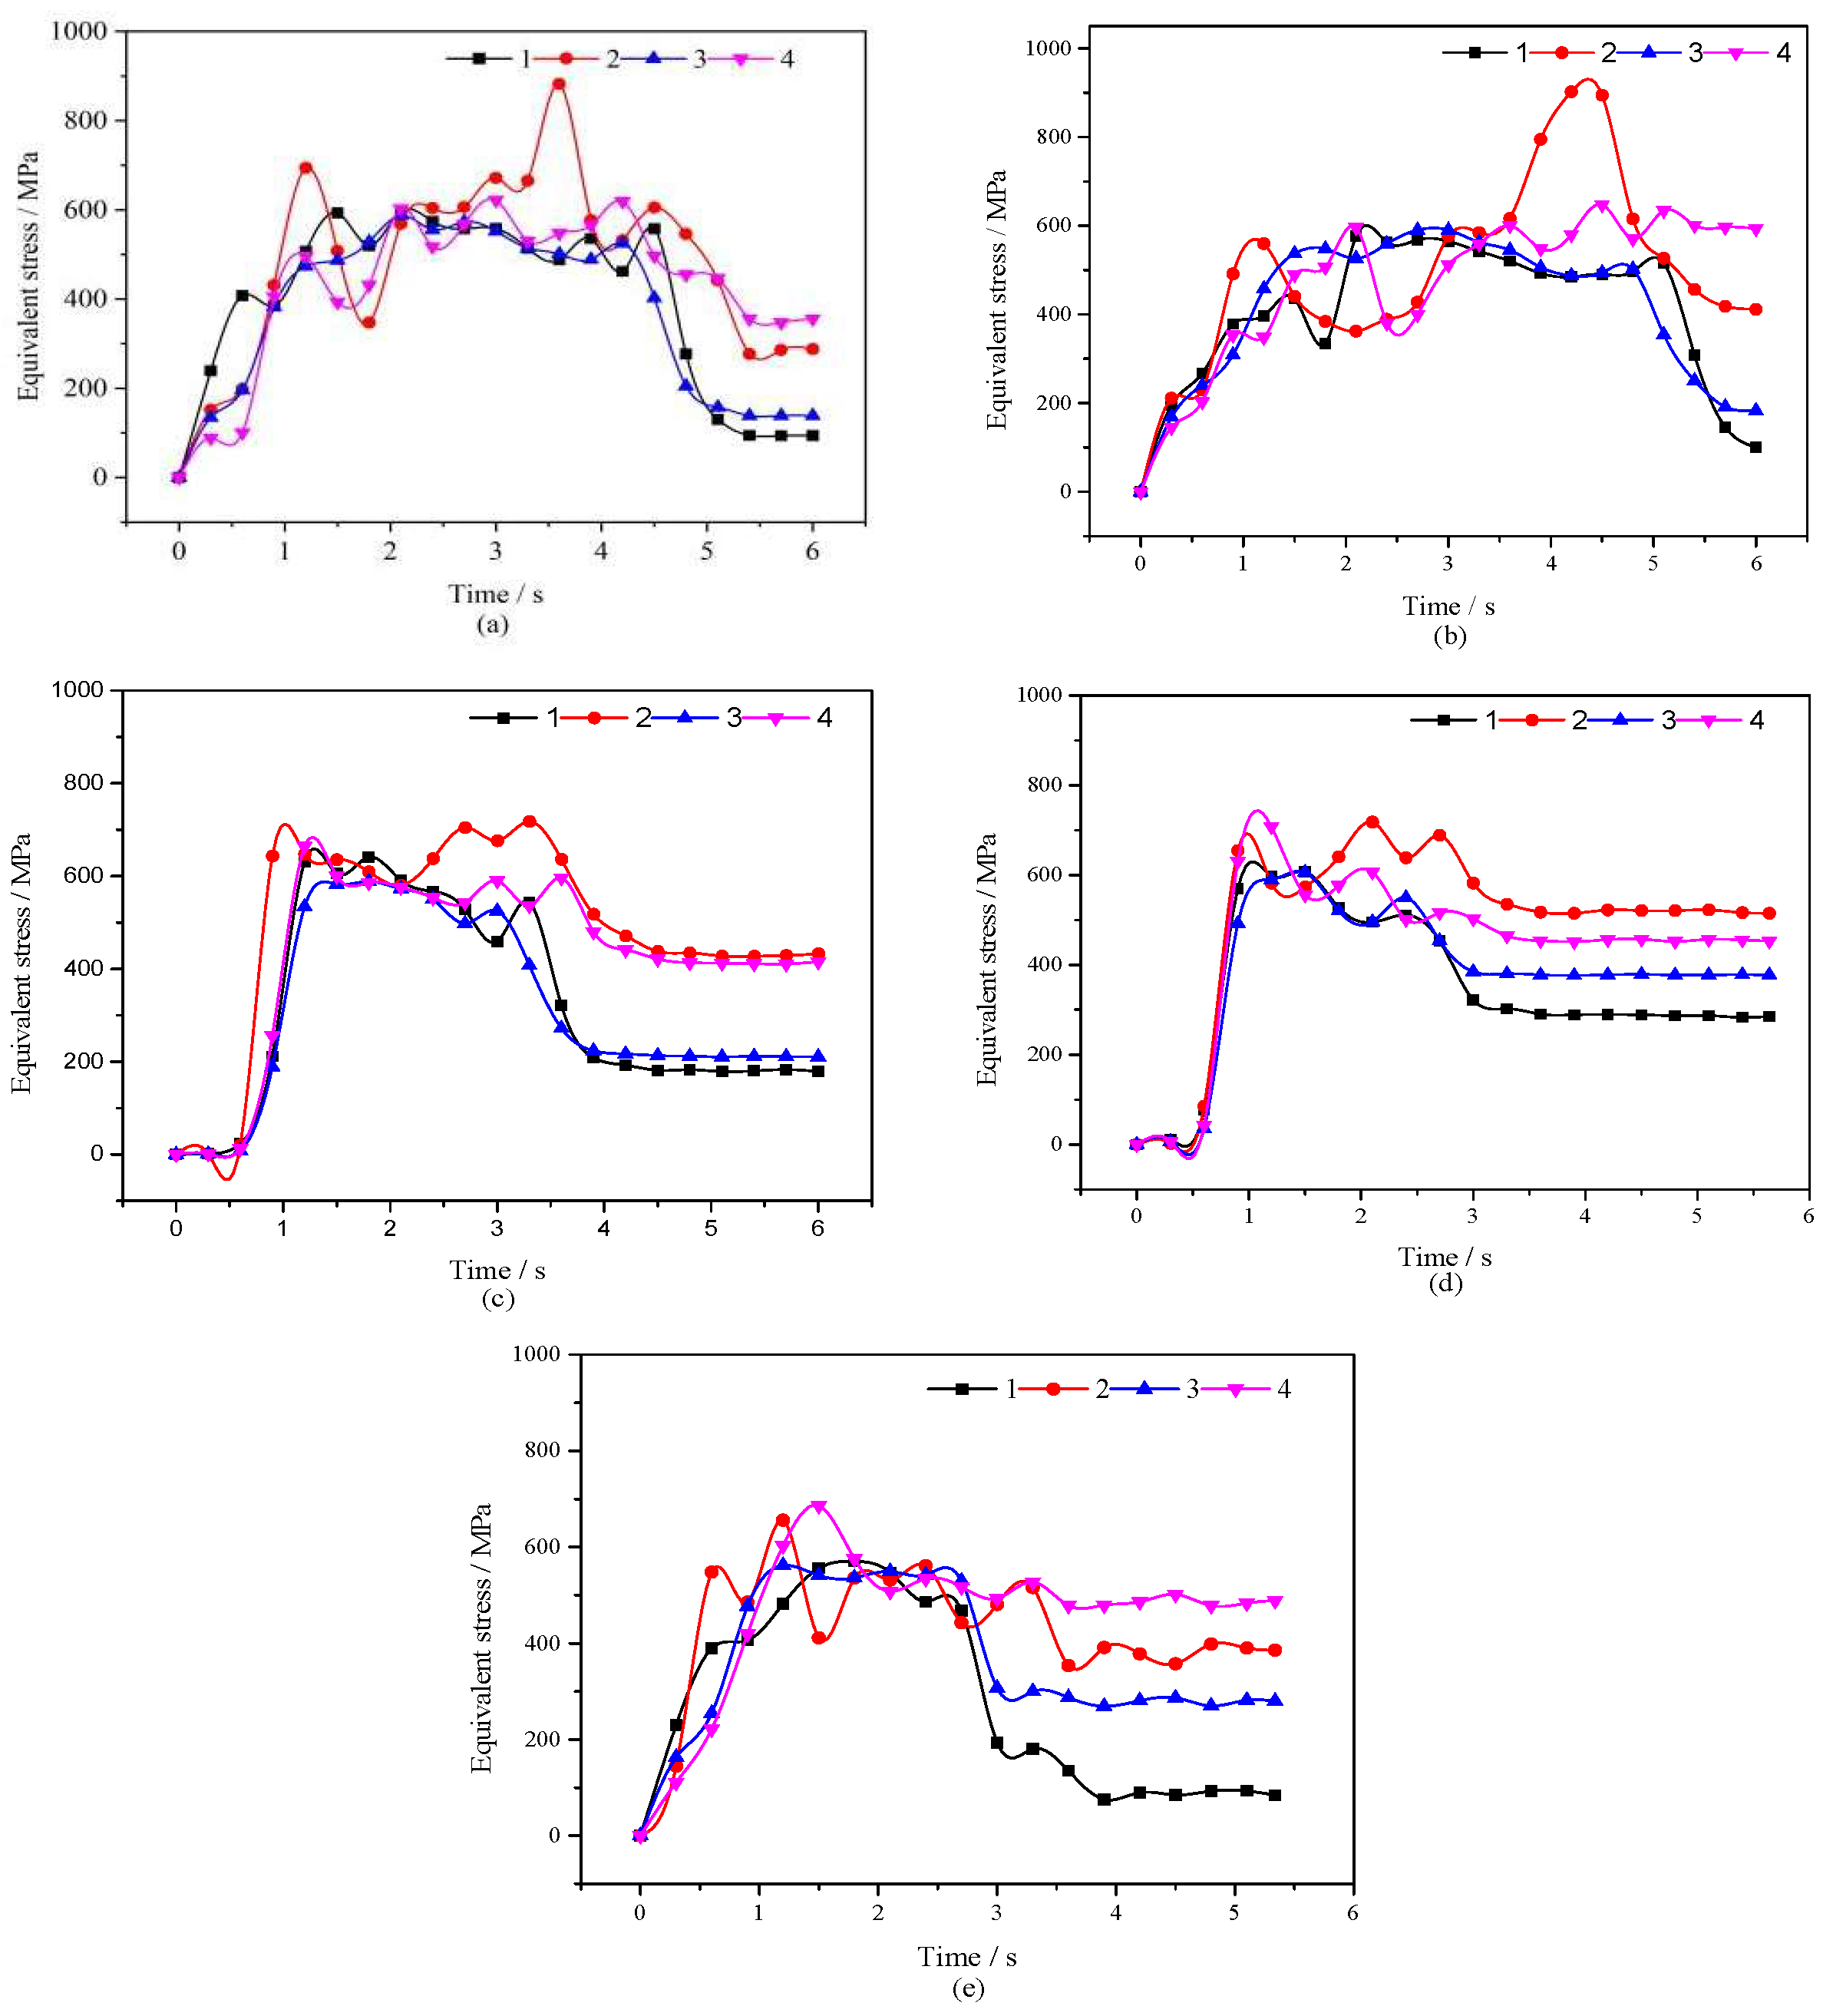
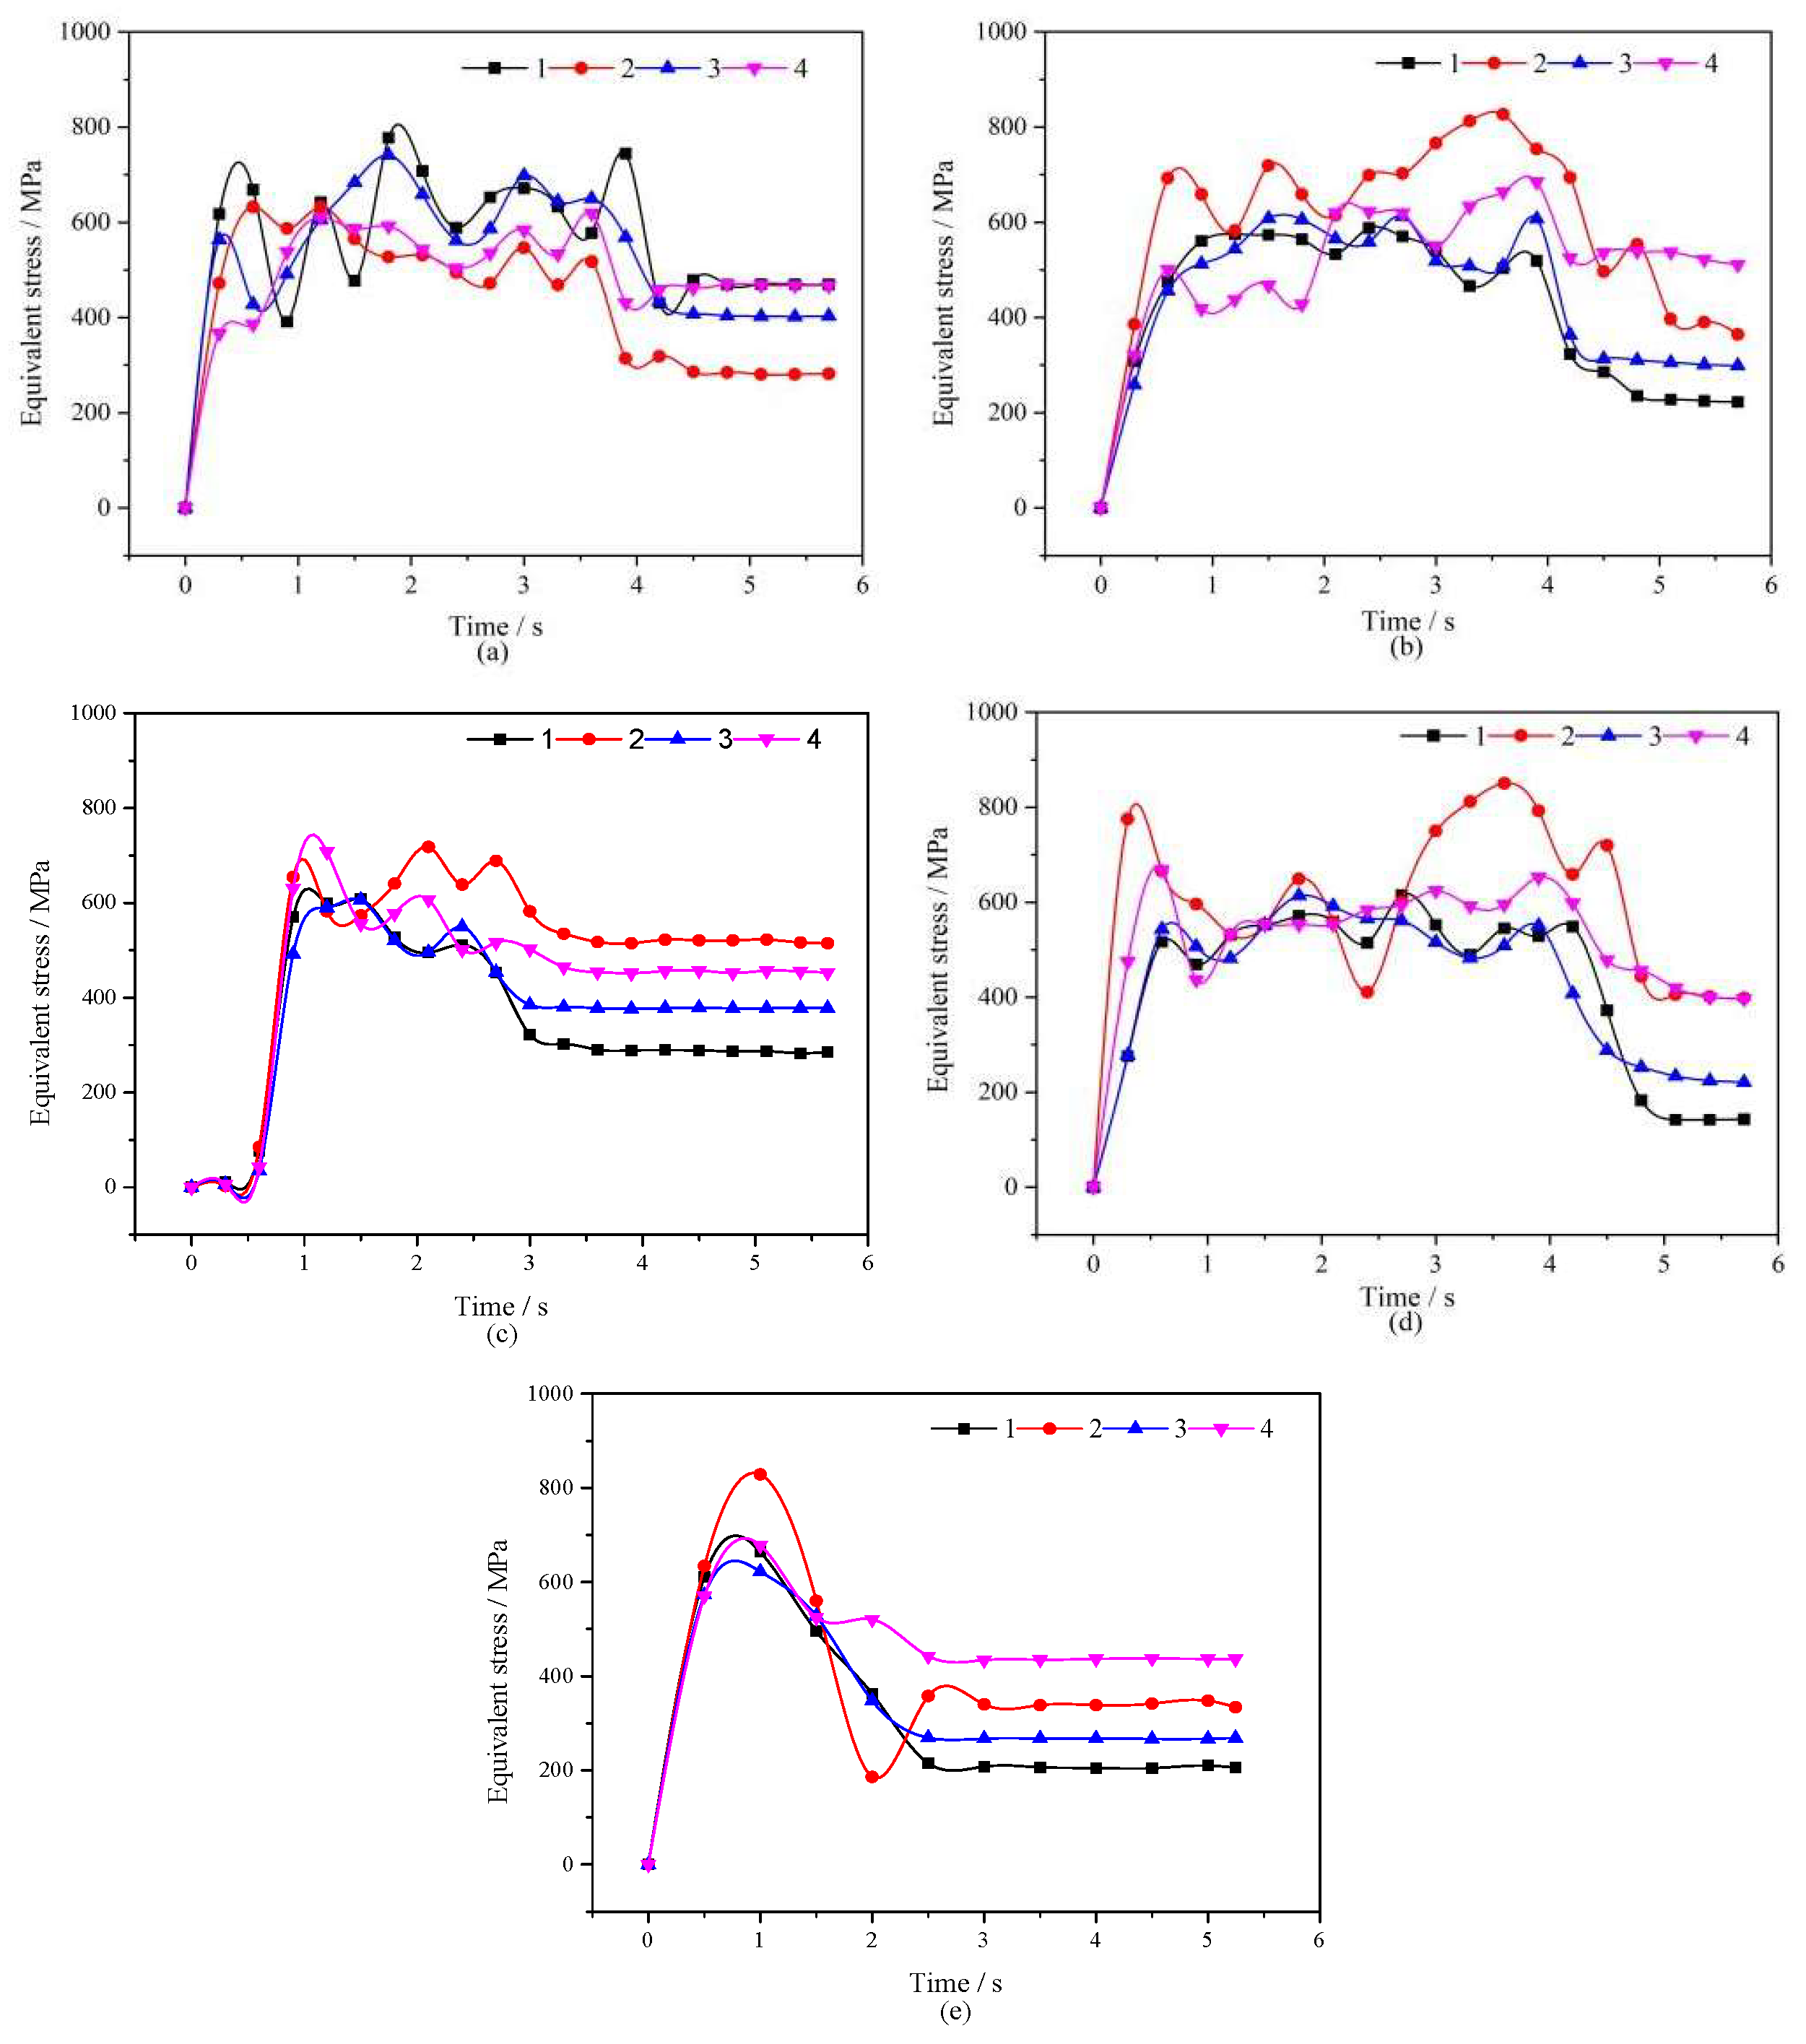
3.1. Equivalent Stress

In the three-roll planetary rolling process, the roll rotation speed plays a decisive role in the mechanism of equivalent stress distribution within the material, as shown in Figure 5. The roll speed parameter governs the distribution of the strain rate field, triggering multidimensional reconstruction of the material’s stress state. This necessitates focused analysis of equivalent stress distribution patterns to evaluate the rolling stability and parameter rationality. Experimental data demonstrate that within the 30–60 r/min speed range, the equivalent stress gradients at the tube outer wall reach 393 MPa and 418 MPa, respectively, as shown in Figure 5a,b, accompanied by significant stress fluctuations. Notably, under these conditions, the roll bite stability exhibits marked deterioration—evidenced by abnormal post-rolling stress peak migration to the inner wall region (217 → 411 MPa)—indicating failure to establish a steady-state rolling process. As the speed increases to 90–120 r/min, the system progressively enters a stable rolling regime. The equivalent stress gradient decreases from 309 MPa to 235 MPa, with a 47% improvement in post-rolling stress uniformity, as shown in Figure 5c,d. At 120 r/min specifically, the material exhibits an ideal stress decay gradient (229 → 210 MPa), and the anisotropy coefficient drops to 1.08, confirming optimized balance in three-dimensional stress states. However, when the speed exceeds 150 r/min, the outer wall gradient rebounds to 335 MPa, and the circumferential stress differential expands to 89 MPa. This phenomenon may correlate with inertial effect-induced additional stress fields under high-speed conditions.
Comprehensive analysis reveals that 120 rpm provides the most favorable conditions: minimal stress gradients during plastic deformation, reduced stress fluctuations, and the most uniform post-rolling stress distribution. Therefore, selecting a roller speed near 120 rpm is recommended for optimal rolling performance.

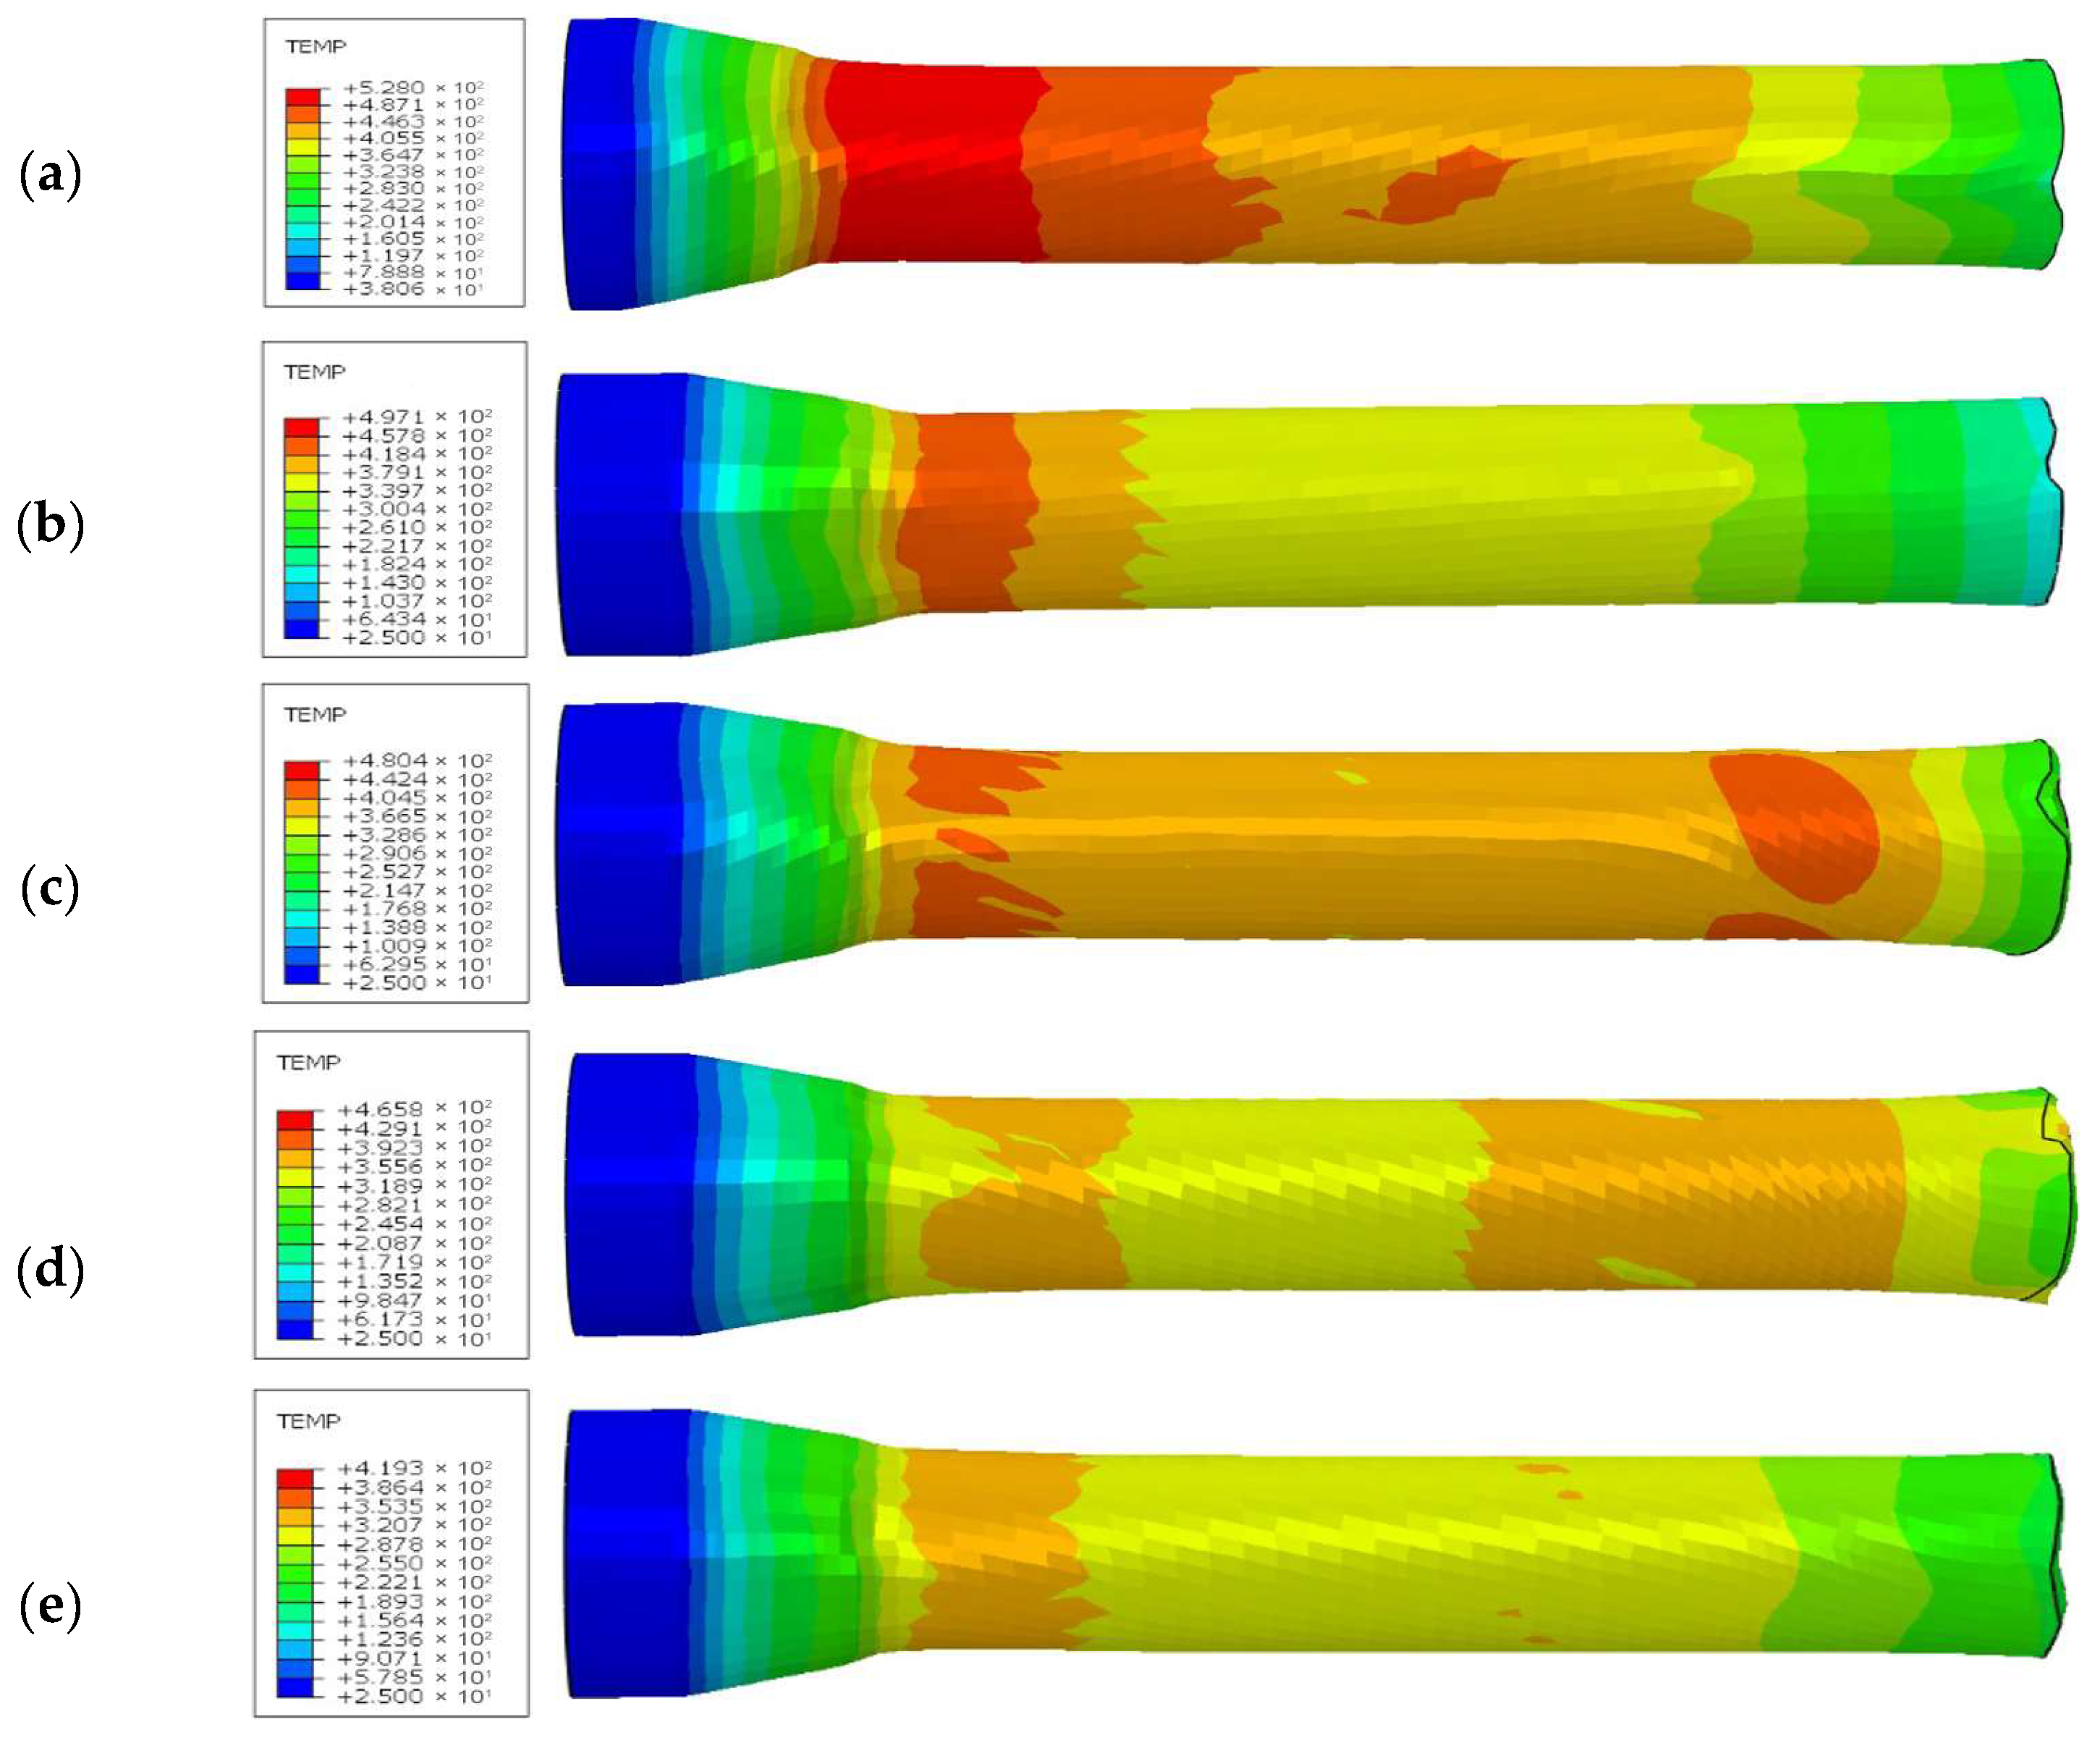
3.2. Deformation Temperature
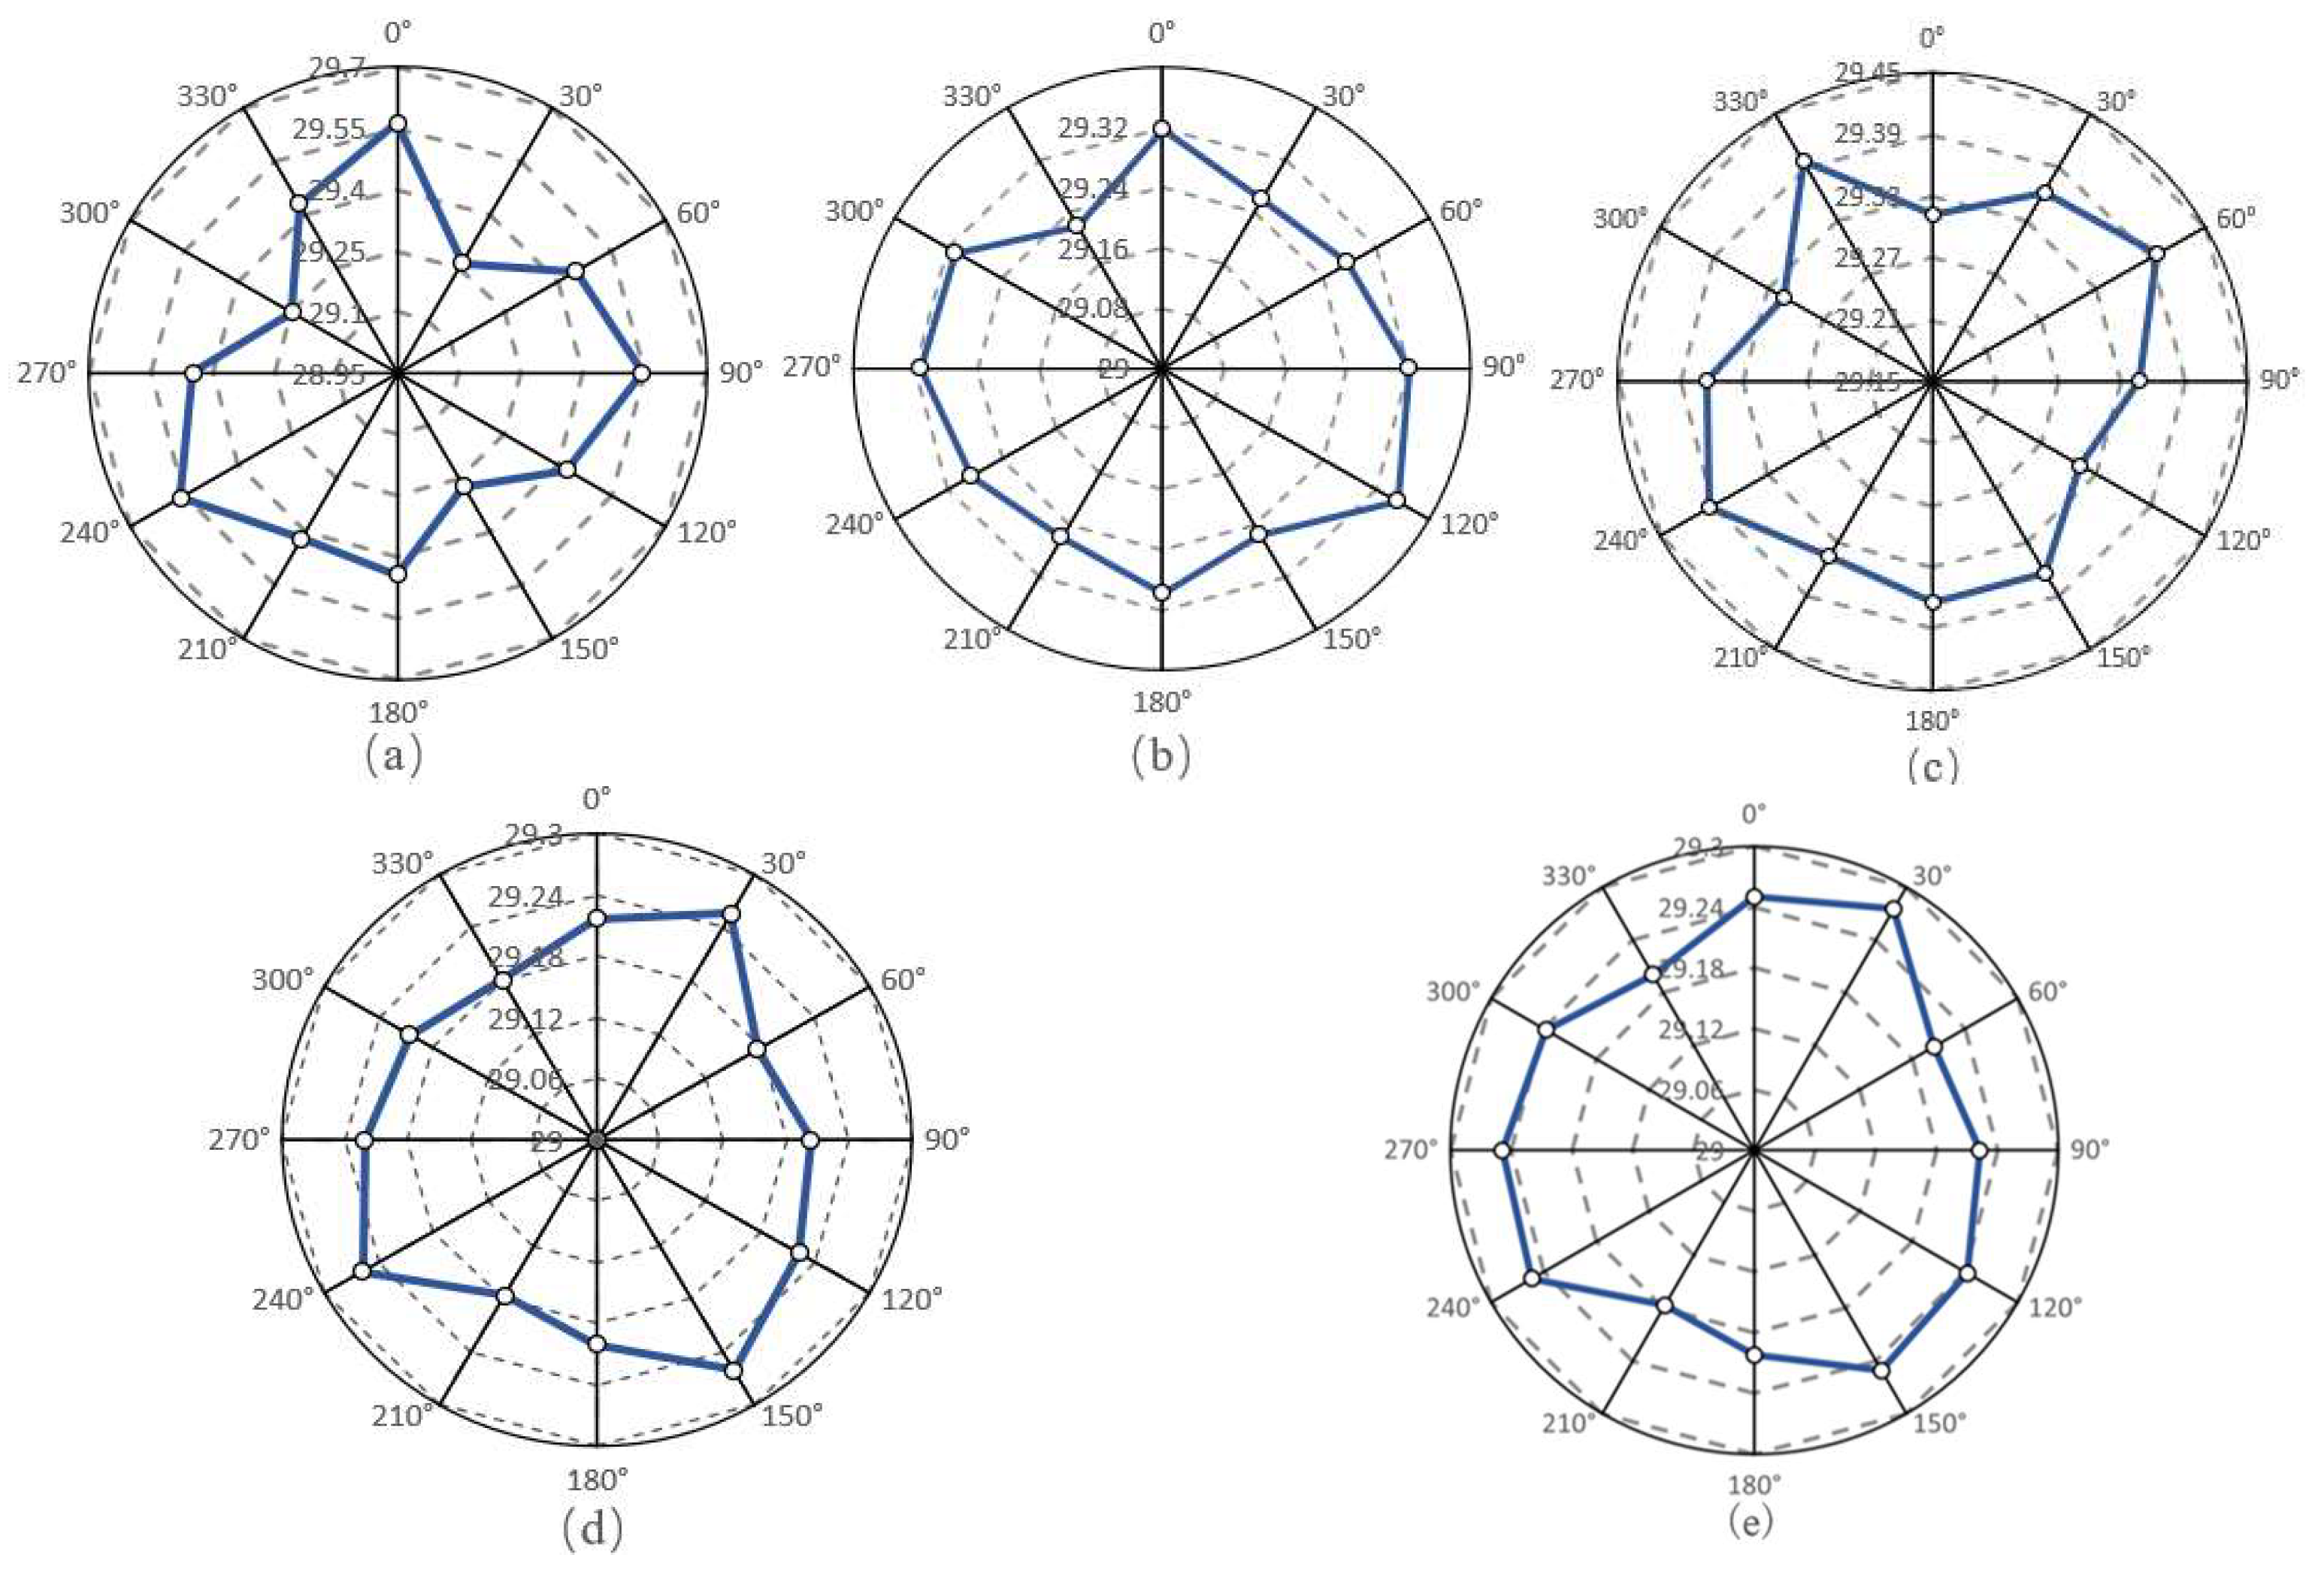
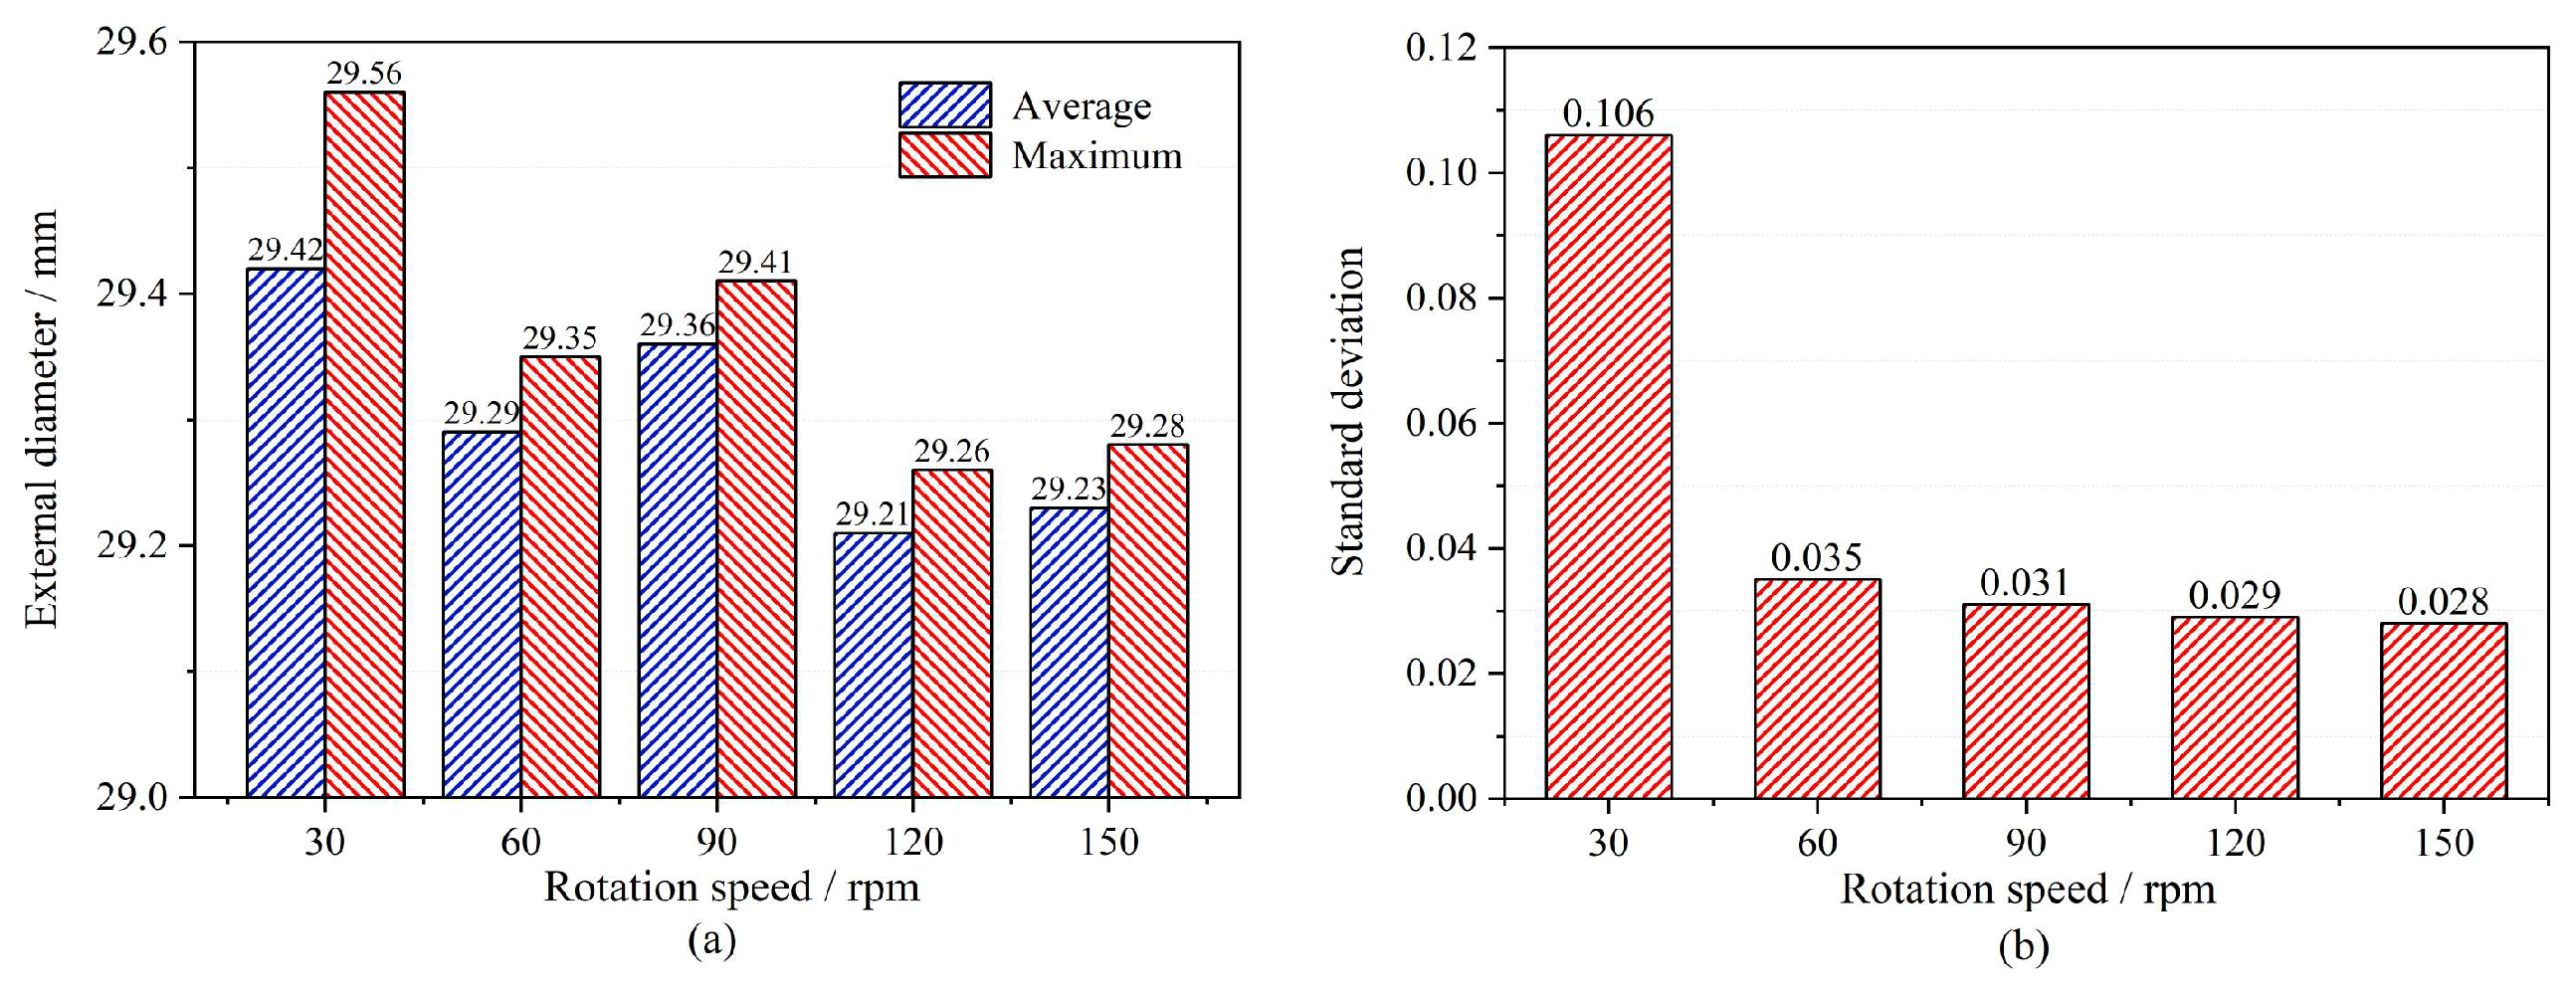
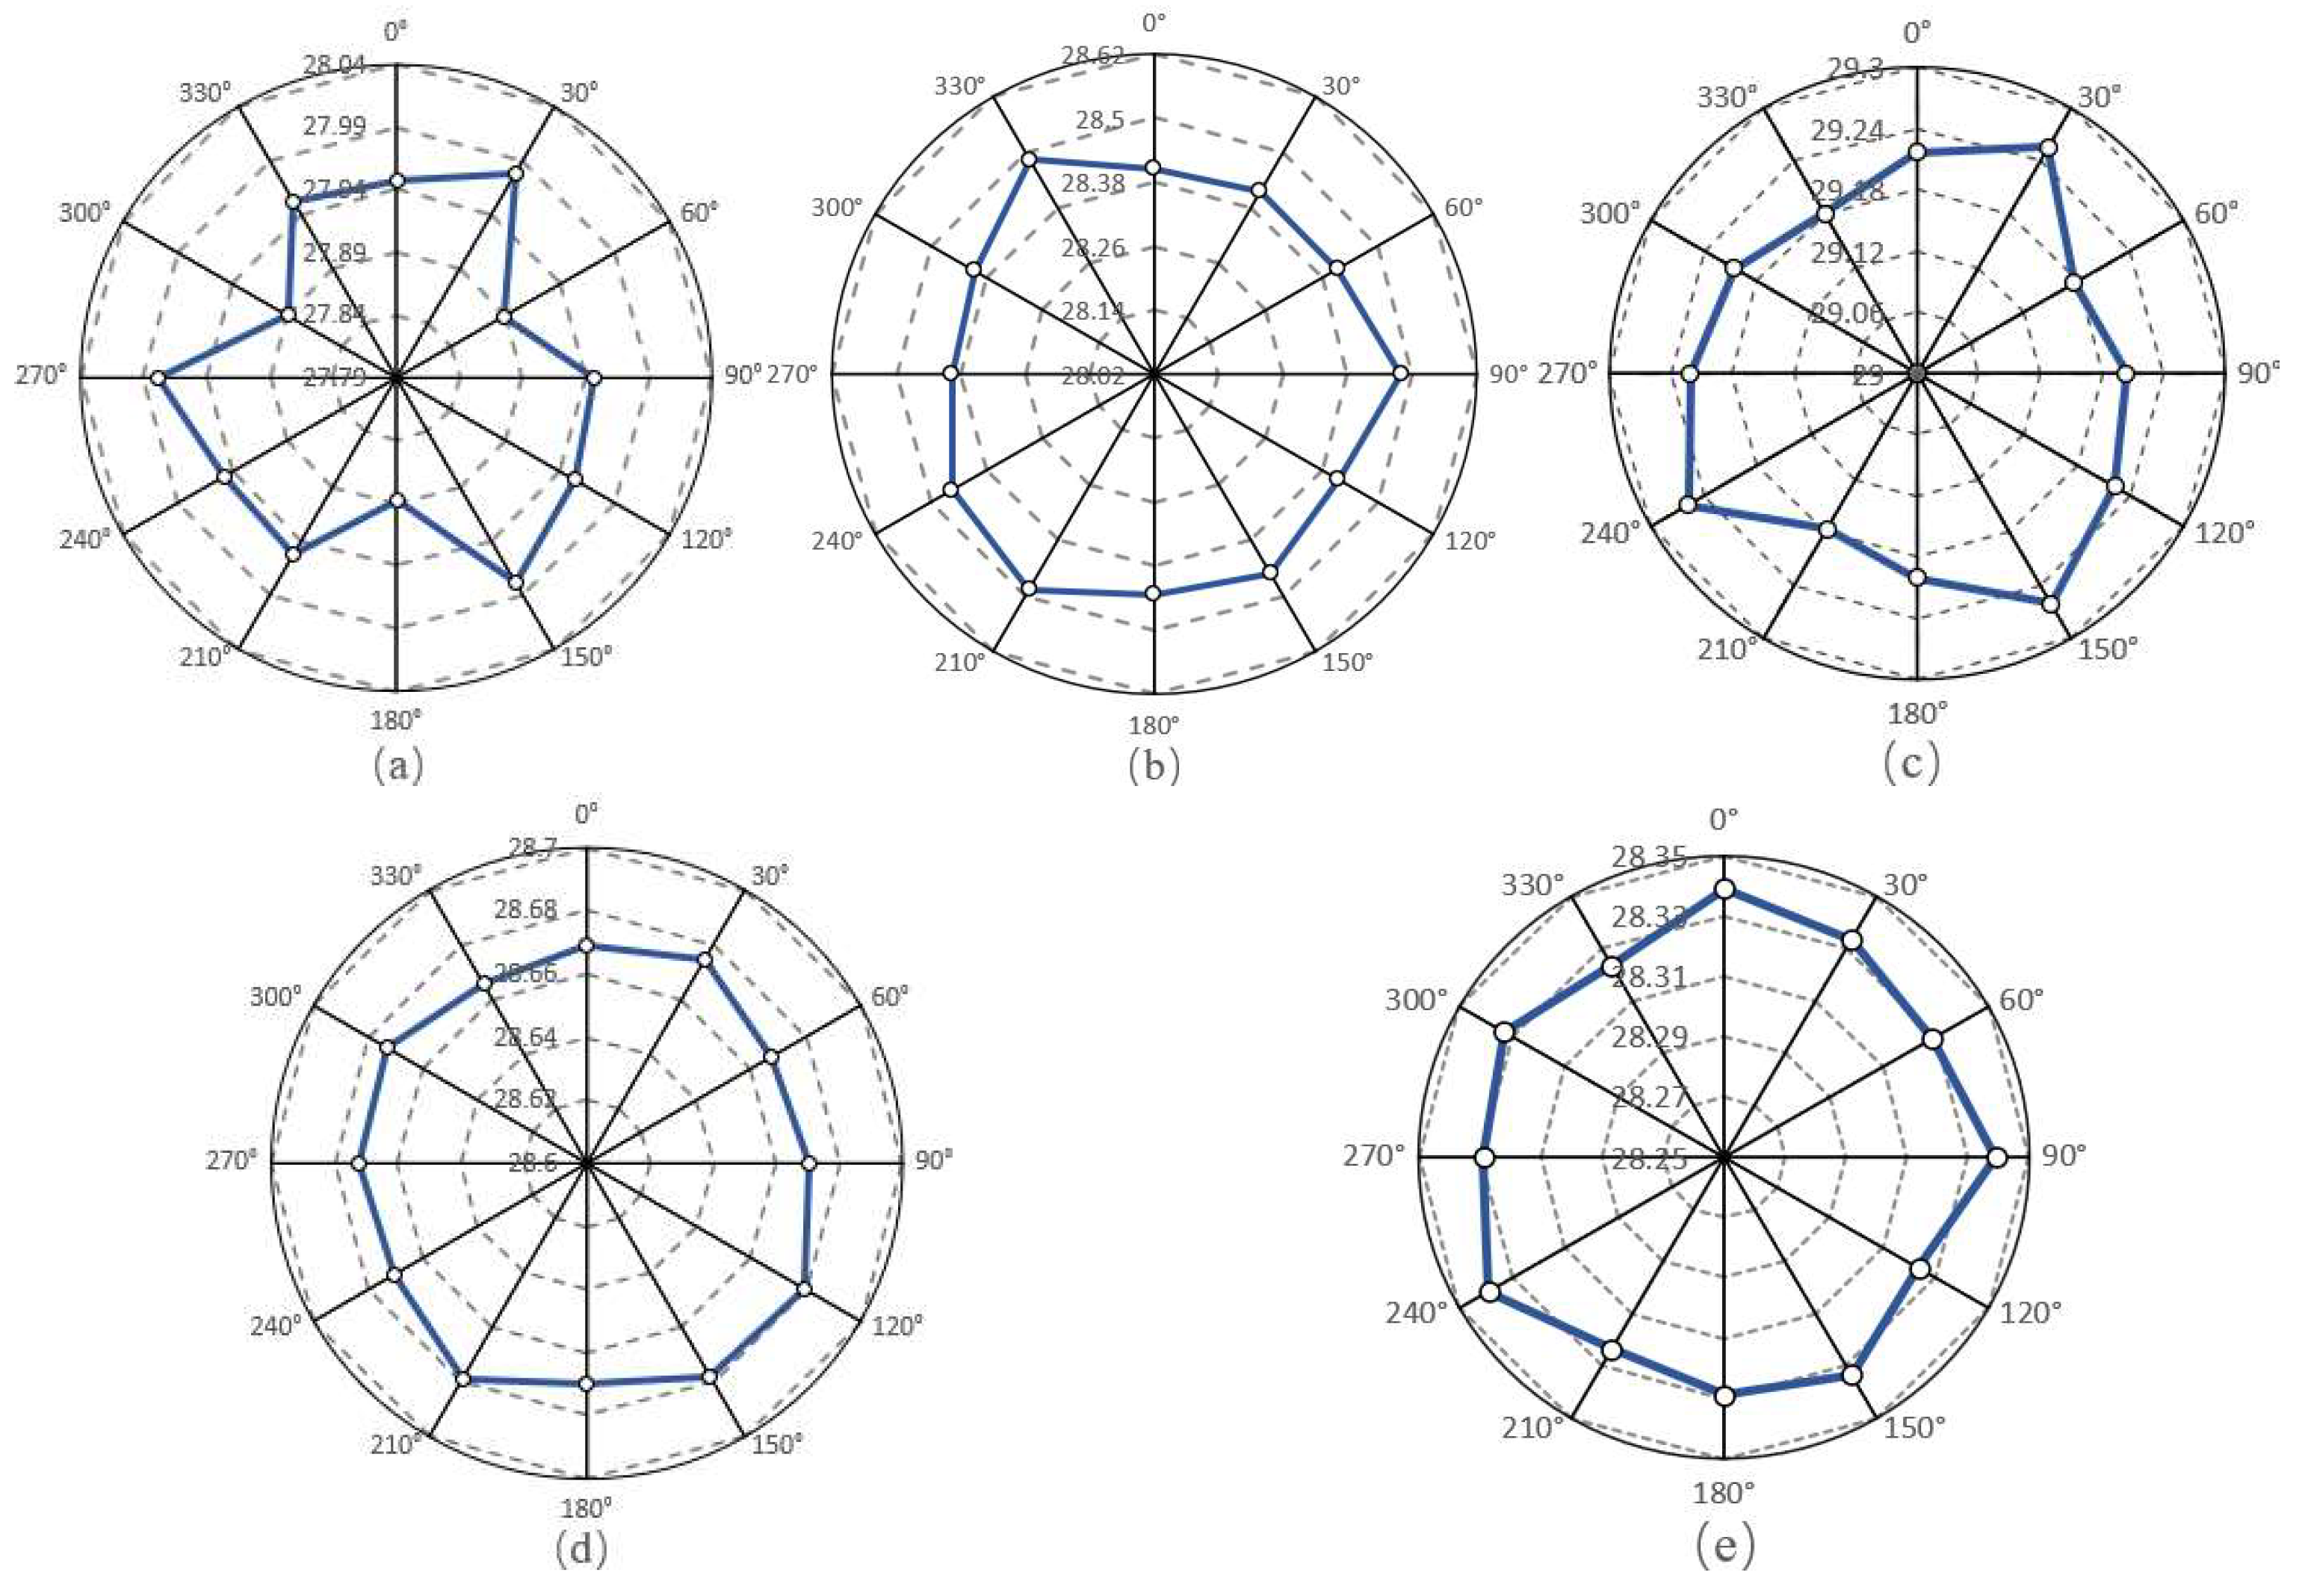
During the three-roll planetary rolling process, an increase in the rotational speed of the rolls leads to an increase in frictional heat between the workpiece and the rolls. As the rotational speed of the rolls increases, the frequency of friction also increases, resulting in a greater generation of frictional heat. This heat is partially absorbed by the workpiece, causing its temperature to rise. As observed in the changes in rolling temperature shown in Figure 6, the rolling temperature does not increase monotonically with the increase in roll rotational speed. Instead, a decrease in rolling temperature occurs as the roll rotational speed increases. As illustrated in Figure 6a,b, when the roll rotational speeds are 30 rpm and 60 rpm, respectively, despite the increase in roll speed, the maximum rolling temperature of the workpiece does not significantly increase, remaining at 419.32 °C and 442.27 °C, respectively. In Figure 6c,d, when the roll rotational speeds are 90 rpm and 120 rpm, the maximum temperatures of the workpiece even decrease, reaching 405.71 °C and 415.95 °C, respectively. However, in Figure 6e, as the roll rotational speed increases further and the deformation rate of the workpiece reaches a certain level, the proportion of deformation heat in the rolling temperature gradually increases. This results in a significant increase in the rolling temperature compared to the temperatures shown in Figure 6a to Figure 6d, with a discontinuous temperature gradient appearing. Specifically, when the rotational speed ranges from 30 to 120 rpm, the maximum rolling temperature of the workpiece remains around 420 °C. But when the rotational speed increases to 150 rpm, the maximum rolling temperature rapidly rises to 700.45 °C.

3.3. Roundness

Figure 7 presents a radar chart of the outer diameter dimensions of the finished tube at different roll rotational speeds. The analysis reveals that as the roll rotational speed increases, the precision of the outer diameter dimensions at circumferential points of the finished tube improves significantly. When the roll rotational speeds are 30 rpm, 60 rpm, and 90 rpm, as shown in Figure 7a–c, the distribution of the outer diameter dimensions of the finished tube is relatively scattered, exhibiting an overall disordered pattern. As the roll rotational speed rises to 120 rpm, as illustrated in Figure 7d, the radar chart of the outer diameter dimensions displays a triangular-like distribution, corresponding to the arrangement of the rolls in the three-roll planetary rolling process. When the speed increases to 150 rpm, as depicted in Figure 7e, the dimension distribution on the radar chart becomes more uniform, gradually approaching a circular distribution. In conjunction with the analysis in Figure 8a, it can be seen that when the roll rotational speed is 30 rpm, the average outer diameter of the finished tube is 29.42 mm, with a maximum value of 29.56 mm; at 60 rpm, the average decreases to 29.29 mm, with a maximum of 29.35 mm; at 90 rpm, the average slightly increases to 29.36 mm, with a maximum of 29.41 mm; at 120 rpm, the average drops to 29.21 mm, with a maximum of 29.26 mm; and at 150 rpm, the average is 29.23 mm, with a maximum of 29.28 mm. These data indicate that as the roll rotational speed increases, the difference between the average and maximum outer diameter dimensions of the finished tube gradually decreases, resulting in smaller surface dimension fluctuations. Figure 8b shows a comparison of the standard deviations of the outer diameters corresponding to different roll rotational speeds, with values ranging from low to high as 0.106, 0.035, 0.031, 0.029, and 0.028. Through the above comparative analysis, it can be concluded that as the roll rotational speed gradually increases, the degree of dispersion of the outer diameter dimension data decreases, and the precision of the outer diameter dimensions of the finished tube improves accordingly. Therefore, a higher roll rotational speed should be selected within the permissible range to ensure the dimensional accuracy of the finished tube.

4. Effect of Roller Rotation Speed on Three-Roll Planetary Rolling Performance

In three-roll planetary rolling processes, the tilt angle enables the roller’s inclined surface to generate axial thrust during rotation, achieving automatic bite-in and feeding of the tubular material, which critically affects production efficiency. Therefore, rational selection of the tilt angle (α) is essential. Considering the actual production conditions, this section conducts simulation studies with five tilt angles (7°, 8°, 9°, 10°, 11°) to systematically analyze their influence patterns on equivalent stress distribution, deformation temperature evolution, and roundness of finished tubes during the rolling process.

4.1. Equivalent Stress

The roll tilt angle has a significant impact on the equivalent stress during the planetary rolling process. Figure 9 presents the variation curves of equivalent stress at cross-sectional points under different roll tilt angles. When the roll tilt angle is 7°, as shown in Figure 9a, the equivalent stress experienced by the workpiece fluctuates intensely. The maximum equivalent stress gradients during and after rolling both occur at the outer wall, i.e., between points 1 and 2, with maximum values of 430 MPa and 188 MPa, respectively. As the roll tilt angle increases to 8°, as illustrated in Figure 9b, the fluctuations in equivalent stress become more pronounced. The maximum equivalent stress gradient appears at the outer wall of the workpiece, with a maximum value of 323 MPa, while the maximum gradient after rolling occurs at the inner wall, with a maximum value of 212 MPa. When the roll tilt angle is 9°, as depicted in Figure 9c, the maximum equivalent stress gradient is observed between points 1, 2, and 3, reaching a maximum value of 235 MPa. The stress gradient distribution after rolling is more uniform, with gradually decreasing gradients between points 1, 2, 3, and 4, and a maximum value of 229 MPa. As the roll tilt angle increases to 10°, as shown in Figure 9d, the maximum equivalent stress gradient appears at the outer wall of the workpiece, with a maximum value of 341 MPa. The stress gradient distribution after rolling is relatively uniform, with a maximum value of 259 MPa. When the roll tilt angle further increases to 11°, the stress gradient is the smallest, but the equivalent stress fluctuates significantly, with an amplitude as high as 600 MPa. The maximum gradient appears at the outer wall of the workpiece, with a maximum value of 177 MPa, while the maximum stress gradient after rolling is 128 MPa. Through the aforementioned analysis, it is evident that the roll tilt angle significantly influences the equivalent stress in planetary rolling. When the roll tilt angle is at 7°, 8°, and 10°, the fluctuation and gradient of the equivalent stress change drastically with the tilt angle. At 9°, the fluctuation of the equivalent stress is minimal, and the gradient distribution is uniform, resulting in the optimal outcome. At 11°, although the gradient is small, the fluctuation of the equivalent stress is substantial. Taking into account both the uniformity of the equivalent stress distribution and the degree of fluctuation, in order to achieve a more ideal equivalent stress distribution, the roll tilt angle should be selected around 9°.

4.2. Deformation Temperature

The influence of the roll tilt angle on the rolling temperature primarily stems from changes in the material deformation, heat transfer, and rolling conditions during the rolling process. As the roll tilt angle increases, the stress state and deformation mode of the workpiece during rolling undergo alterations, which may lead to changes in energy conversion and heat distribution during the rolling process. Figure 10 illustrates the temperature variation in the workpiece under different roll tilt angles. It can be observed from the figure that as the roll tilt angle gradually increases, the rolling temperature during the planetary rolling process also gradually decreases. This is attributed to the changes in the contact area and contact pressure distribution between the roll and the workpiece as the tilt angle increases, resulting in a delayed effect of heat conduction within the workpiece. When the tilt angle is 7°, as shown in Figure 10a, the maximum temperature of the workpiece during deformation is 529.05 °C. As the tilt angle increases to 8°, as depicted in Figure 10b, the maximum temperature of the workpiece drops to 497.14 °C. When the tilt angle is 9°, as illustrated in Figure 10c, the maximum temperature of the workpiece further decreases to 480.42 °C. At a tilt angle of 10°, as shown in Figure 10d, the maximum temperature of the workpiece is 465.83 °C. And when the tilt angle increases to 11°, as presented in Figure 10(e), the maximum temperature of the workpiece drops to 419.37 °C. By analyzing the influence of different tilt angles on the maximum temperature during the rolling process, it can be seen that the variation gradient of the maximum rolling temperature of the workpiece is relatively small, with a maximum gradient not exceeding 46.44 °C. However, significant delayed effects of heat conduction are observed in the workpiece at tilt angles of 7°, 8°, and 10°. At a tilt angle of 11°, temperature rebound occurs in some areas, indicating that the delayed heat conduction may lead to uneven distribution of residual stress in the finished tube, thereby affecting its dimensional accuracy and mechanical properties.

4.3. Roundness

Figure 11 presents a radar chart of the outer diameter dimensions of the finished tube at different roll tilt angles. Through analysis, it can be observed that as the roll tilt angle increases, the precision of the outer diameter dimensions at circumferential points of the finished tube is significantly improved. When the roll tilt angle is 7°, the distribution of the outer diameter dimensions of the finished tube is relatively scattered, with the radar chart exhibiting three protruding shapes overall, indicating significant variations in outer diameter dimensions. At roll tilt angles of 8° and 9°, the outer diameter dimension radar chart displays a triangular-like distribution, corresponding to the arrangement of the rolls in three-roll planetary rolling. When the tilt angle is 10° and 11°, the dimension distribution on the radar chart becomes more uniform, gradually approaching a circular distribution. In conjunction with the analysis in Figure 12a, it can be seen that when the roll tilt angle is 7°, the average outer diameter of the finished tube is 27.94 mm, with a maximum value of 27.97 mm. When the roll tilt angle is 8°, the average increases to 28.44 mm, with a maximum of 28.49 mm. As the roll tilt angle increases to 9°, the average further rises to 29.21 mm, with a maximum of 29.26 mm. At a roll tilt angle of 10°, the average outer diameter of the finished tube is 28.67 mm, with a maximum of 28.68 mm. When the roll tilt angle is 11°, the average is 28.33 mm, with a maximum of 28.34 mm. These data indicate that as the roll tilt angle increases, the difference between the average and maximum outer diameter dimensions of the finished tube gradually decreases, resulting in smaller surface dimension fluctuations. Figure 12b presents a comparison of the standard deviations of the outer diameters corresponding to different tilt angles, ranging from low to high as 0.031, 0.032, 0.029, 0.019, and 0.005. This occurs because the deflection angle governs the feeding speed after the initial roll bite, which subsequently affects both the contact angle and duration between the tube surface and rolls. These combined effects ultimately lead to observable variations in the achieved roundness. Through the above comparative analysis, it can be concluded that as the roll tilt angle gradually increases, the degree of dispersion of the outer diameter dimension data decreases, leading to improved precision of the outer diameter dimensions of the finished tube. Therefore, to ensure the dimensional accuracy of the finished tube, a larger roll tilt angle should be selected within the permissible range.

5. Influence of Friction Coefficient on Three-Roll Planetary Rolling Performance

In practical tube production, the surface friction coefficient between rollers and 304 stainless steel pipe during rolling varies within 0.2–0.6 due to differences in the roller materials, surface treatment methods, and lubrication selections. Considering the actual production conditions, this section selects four representative friction coefficients (0.2, 0.3, 0.4, 0.5) and conducts simulation studies based on the optimal process parameters established in previous sections (roller rotational speed: 120 rpm, tilt angle: 9°). The research aims to systematically investigate the influence of friction coefficient variations (resulting from different roller materials, surface treatments, and lubrication systems) on critical indicators in three-roll planetary rolling processes, including the equivalent stress distribution, deformation temperature evolution, and roundness characteristics of finished tubes.

5.1. Stress Distribution Characteristics

An excessive stress gradient can lead to an increase in the residual stress gradient inside the finished tube, thereby affecting the dimensional accuracy of the rolled workpiece. Therefore, analyzing the distribution of the stress gradient during planetary rolling is of great significance for the rational selection of the process parameters. Figure 13 shows the equivalent stress variation curves at different cross-sectional points under varying friction coefficients.
By analyzing the variation patterns of equivalent stress, it can be observed that as the friction coefficient increases, the stress fluctuations at cross-sectional points during rolling become more complex. When the friction coefficient is 0.2, as shown in Figure 13a, the maximum stress gradient during deformation occurs between Point 1 and Point 2, reaching 259 MPa. After rolling, the maximum stress gradient increases to 333 MPa, corresponding to the stress difference between Point 3 and Point 4, located near the inner wall of the workpiece. When the friction coefficient is 0.3, as shown in Figure 13b, the maximum stress gradient occurs among Point 1, Point 2, and Point 3, peaking at 235 MPa. However, the post-rolling stress gradient is relatively smaller, with a maximum of 229 MPa, observed between Point 1 and Point 2 near the outer wall. When the friction coefficient is 0.4, as shown in Figure 13c, the maximum stress gradient appears between Point 1 and Point 2, reaching 404 MPa. After rolling, the maximum stress gradient is 386 MPa, also located near the outer wall between Point 1 and Point 2. When the friction coefficient is 0.5, as shown in Figure 13d, the maximum stress gradient occurs between Point 2 and Point 3, peaking at 341 MPa. After rolling, the maximum stress gradient reaches 365 MPa, distributed in the middle section of the workpiece between Point 2 and Point 3. Thus, from the perspective of the stress gradient, selecting a friction coefficient of 0.3 is more reasonable.

5.2. Deformation Temperature
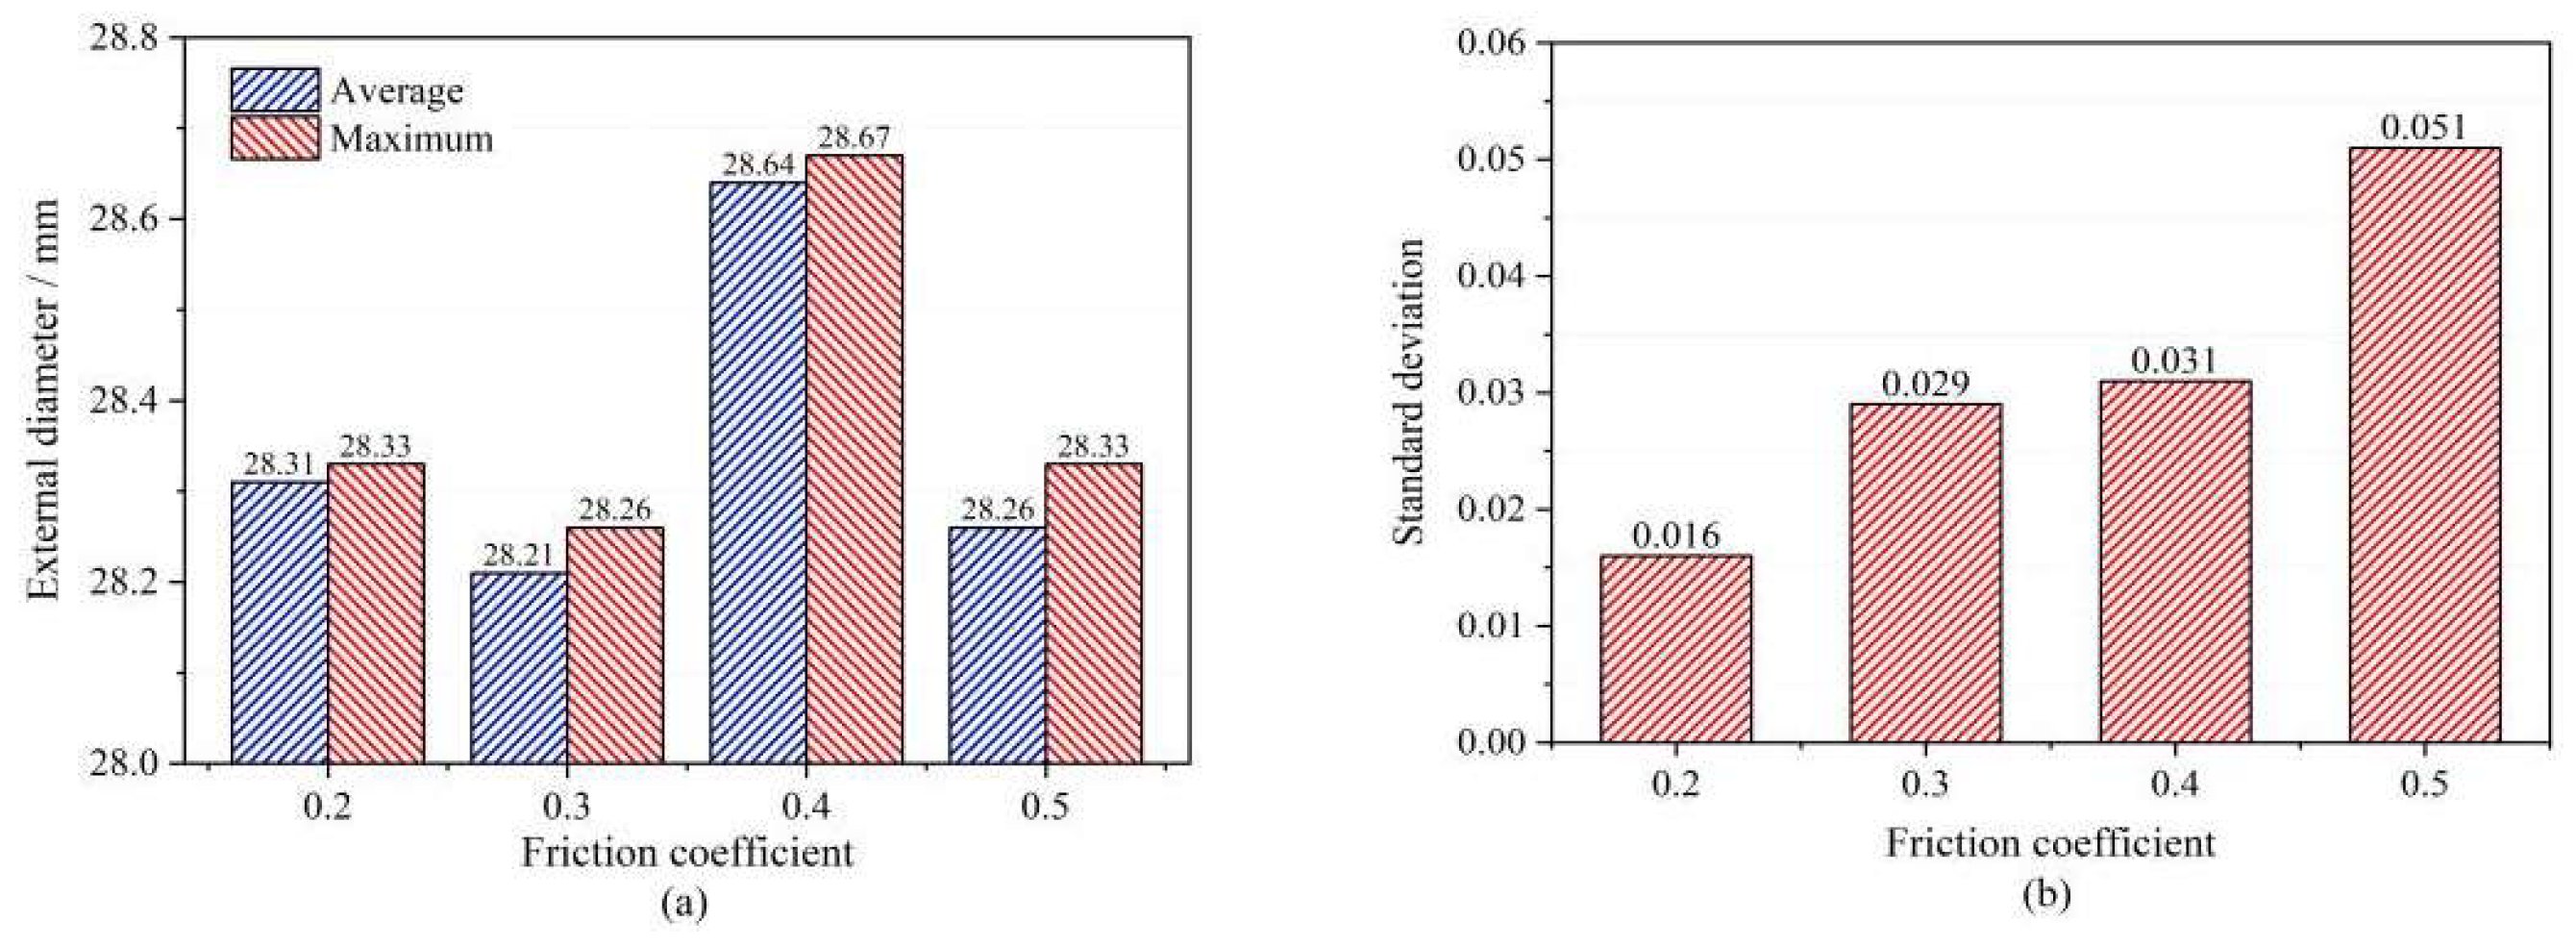
In three-roll planetary rolling, the workpiece undergoes severe deformation, and its temperature field evolution is primarily governed by four mechanisms: (1) frictional heating between rolls and workpiece, (2) deformation-induced heat generation, (3) convective heat transfer between workpiece and ambient air, and (4) thermal conduction between rolls and workpiece. Figure 14 illustrates the temperature variations in the workpiece during rolling under different friction coefficients. Key observations reveal that the rolling temperature increases progressively with higher friction coefficients: at a friction coefficient of 0.2, as shown in Figure 14a, the peak workpiece temperature reaches 528.09 °C. Notably, temperature rebound occurs in certain sections post-rolling, indicating that the maximum temperature does not coincide with the zone of maximum deformation. This phenomenon arises because the dominant heat source at low friction is deformation heat. However, the relatively low temperature in the deformation zone results in elevated stress levels, causing significant internal stress accumulation. Subsequent stress relaxation releases additional heat, leading to a delayed thermal conduction effect within the workpiece. When the friction coefficient increases to 0.3, as shown in Figure 14b, the maximum temperature rises to 432.75 °C, now concentrated in the region of maximum deformation. The temperature exhibits a gradient decline along the rolling direction, reflecting improved thermal equilibrium. At higher friction coefficients (0.4 and 0.5, Figure 14c,d), the deformation temperature escalates dramatically to 911.34 °C and 1114.25 °C, respectively. Such excessive temperatures detrimentally affect the mechanical properties of the workpiece. Moreover, they may trigger adverse reactions like oxidation and decarburization, further degrading product quality while accelerating roll wear and shortening service life.

5.3. Roundness

Figure 15 presents radar charts illustrating the outer diameter distribution of the finished tubes under different friction coefficients. At friction coefficients of 0.2 and 0.3, the radar charts exhibit quasi-triangular distributions, which correspond well with the geometric arrangement of rolls in three-roll planetary rolling. However, as the friction coefficient increases, the diameter distribution becomes increasingly disordered, indicating greater dispersion in the circumferential dimensional accuracy of the finished tubes. As evidenced by Figure 16a:
At μ = 0.2: average outer diameter = 28.31 mm, maximum = 28.33 mm;
At μ = 0.3: average = 28.21 mm, maximum = 28.26 mm;
At μ = 0.4: average increases to 28.64 mm, maximum = 28.67 mm;
At μ = 0.5: average decreases to 28.26 mm, maximum = 28.33 mm.
These measurements demonstrate that increasing the friction coefficients led to more pronounced variations between the average and maximum diameters, accompanied by greater surface dimensional fluctuations. Figure 16b compares the standard deviations of the outer diameters across different friction coefficients, showing progressively higher values of 0.016, 0.029, 0.031, and 0.051. This quantitative analysis confirms that dimensional dispersion intensifies with rising friction coefficients, resulting in the deteriorated outer diameter precision of the finished tubes.

6. Conclusions

(1) Speed optimization mechanism: The speed of the rollers significantly affects the stress distribution by regulating the strain rate field. When the speed is increased to 120 r/min, the equivalent stress gradient decreases to 235 MPa, and the stress uniformity index after rolling increases by 47%. At this point, friction heating and heat dissipation reach a dynamic equilibrium. Although the standard deviation of the outer diameter at 150 r/min reached 0.028, the deformation temperature of up to 700 °C caused an imbalance between material softening and work hardening, confirming that 120 r/min is a critical threshold for balancing forming quality and energy consumption.
(2) Deflection angle optimization criteria: A deflection angle of 9° can establish an optimal force–thermal coupling state, reducing the circumferential stress difference to 89 MPa while controlling the ellipticity tolerance within 0.08 mm. Theoretical calculations show that this angle makes the bite angle of the roll and the material flow velocity form a golden ratio, effectively coordinating the contradiction between rolling efficiency and dimensional accuracy.
(3) Friction coefficient regulation strategy: When the friction coefficient is 0.3, the fluctuation amplitude of equivalent stress is minimal, and the outer diameter distribution exhibits a stable quasi-triangular shape. When the coefficient is greater than 0.4, the temperature in the deformation zone exceeds 911 °C, triggering the dynamic recrystallization threshold, which may lead to grain coarsening and deterioration of mechanical properties.
(4) Practical application: Establish a “speed-deflection angle-friction coefficient” adjustment model, and determine the optimal parameter combination as 120 r/min × 9° × 0.3. This has already guided the actual production, reducing the number of rolling passes for the pipe and increasing the yield rate by 22%. This achievement has been successfully applied to the production line of marine umbilical cable pipes, with the finished product pipe roundness size error within 7%, while achieving a low axial stress gradient, promoting the upgrading of high-end stainless steel pipe manufacturing technology.

Author Contributions

Conceptualization, C.M.; Methodology, C.M.; Software, C.M., T.L., C.X. and R.J.; Investigation, C.M., T.L., C.X. and R.J.; Resources, M.S. and L.T.; Data curation, T.L., C.X. and R.J.; Writing—original draft, C.M.; Writing—review & editing, Z.C.; Visualization, T.L., C.X. and R.J.; Supervision, Z.C.; Project administration, Z.C., M.S. and L.T.; Funding acquisition, Z.C. All authors have read and agreed to the published version of the manuscript.

Funding

This research was funded by the National Natural Science Foundation of China (52175353, 52304390); the Shanxi Provincial Science and Technology Major Special Program “Unveiling the Commander-in-Chief” Project Mission Statement (202101110401009); Shanxi Province key research and development project (202102150401002, 202302150401003); Shanxi Province Outstanding Doctoral Research Funding (20242034); and Taiyuan University of Science and Technology Scientific Research Initial Funding (20232128).

Data Availability Statement

The datasets presented in this article are not readily available due to technical limitations. Requests to access the datasets should be directed to the corresponding author of the article, who can be reached at chuzhibing@tyust.edu.cn. Please include a brief description of your research interests and how accessing the datasets would benefit your research. The authors will consider each request on a case-by-case basis and may provide access under certain conditions such as signing a data use agreement and ensuring the confidentiality of the information.

Acknowledgments

We are grateful to Yuquan Li and Shaohua Yang from the School of Materials Science and Engineering, Taiyuan University of Science and Technology, Taiyuan, for their valuable guidance, support, and assistance throughout this research. Their expertise and knowledge contributed greatly to the success of this research.

Conflicts of Interest

The authors declare no conflicts of interest.

References

  1. Liang, G.; Tan, J.; Qian, X.; Xiang, Y.; Gou, Z.; Zhang, B.; Chen, T. Interfacial Bonding Properties Experimental Research of 316L Stainless Steel–Carbon Steel Clad Rebar in the Process of Intermediate and Finish Rolling. Metals 2025, 15, 108. [Google Scholar] [CrossRef]
  2. Sun, Y.Z.; Cao, S.P.; Gao, G. Effects of Extrusion Deformation on the Microstructure and Mechanical Properties of 5083 Seamless Tubes. Light Met. 2024, 33–38. (In Chinese) [Google Scholar] [CrossRef]
  3. Li, S.B.; Xie, J.-X. Fabrication of Thin-Walled 316L Stainless Steel Seamless Pipes by Extrusion Technology. J. Mater. Process. Technol. 2007, 183, 57–61. [Google Scholar] [CrossRef]
  4. Li, D.; He, Y.; Guo, L.G.; Shi, L.; Zhang, J.; Zheng, W.D. Microstructure Responses to Key Extrusion Parameters of Large-Scale Thick-Walled 304 Stainless Steel Pipes. Rare Met. Mater. Eng. 2014, 43, 2675–2681. [Google Scholar] [CrossRef]
  5. Mao, Y.R.; Qiu, C.L.; Gao, X.H. Finite Element Simulation Analysis of Lamination Defects in the Cross-Rolling Piercing Process of Seamless Steel Tubes. J. Steel Roll. 2023, 40, 59–64. (In Chinese) [Google Scholar]
  6. Wang, X.; Xiao, Z.; Zhou, T.; Jiang, X.F. Deformation Mechanism and Properties Evolution of a Copper Alloy with Ultra-High Strength After Cold Drawing and Subsequent Aging Treatment. Mater. Sci. Eng. A 2024, 912, 146952. [Google Scholar] [CrossRef]
  7. Li, Q.; Zhou, L.C.; Gao, H.; Wang, J.Y.; Cao, X.; Ma, J.F.; Jiang, J.Q.; Fang, F. Ultra-strong cold-drawn 2507 stainless steel wire with heterogenous microstructure of dual-phase and grain size. J. Mater. Res. Technol. 2024, 33, 6876–6889. [Google Scholar] [CrossRef]
  8. Fan, X.Y.; Hou, J.P.; Lu, Y.; Wang, S.; Liu, Z.Q.; Duan, Q.Q.; Wang, Q.; Zhang, Z.J.; Zhang, Z.F. Strengthening Mechanisms and Strength Prediction of Directionally Solidified Cu Wire Processed by Cold-Drawing. Mater. Today Commun. 2025, 42, 111421. [Google Scholar] [CrossRef]
  9. Dai, X.B.; Liu, Z.H.; Xu, Y. PSW Roll Profile Design Based on Matlab. J. Shaoyang Univ. Nat. Sci. Ed. 2016, 13, 76–81. (In Chinese) [Google Scholar]
  10. Li, L.M.; Zang, Y.; Zhang, Z.Z.; Yao, H.Z.; Zhang, B. Influence of Friction Condition on Copper Tube Planetary Rolling Process. J. Plast. Eng. 2009, 16, 115–119. (In Chinese) [Google Scholar]
  11. Liu, H.; Zhang, S.H.; Cheng, D.Y. Contact Zone Distribution Between Rolls andWorkpiece in Three-Roll Planetary Rolling. Forg. Stamp. Technol. 2011, 36, 46–49. (In Chinese) [Google Scholar]
  12. Hwang, Y.M.; Tsai, W.M.; Tsai, F.H.; Her, I. Analytical and Experimental Study on the Spiral Marks of the Rolled Product During Three-Roll Planetary Rolling Processes. Int. J. Mach. Tools Manuf. 2006, 46, 1555–1562. [Google Scholar] [CrossRef]
  13. Shih, C.K.; Hung, C.H. Experimental and Numerical Analyses on Three-Roll Planetary Rolling Process. J. Mater. Process. Technol. 2003, 142, 702–709. [Google Scholar] [CrossRef]
  14. Li, B.; Zhang, S.H.; Zhang, G.L.; Zhang, H.Q. Prediction of 3-D Temperature Field of TP2 Copper Tubes in Three-Roll Planetary Rolling Process. J. Mater. Process. Technol. 2008, 205, 370–375. [Google Scholar] [CrossRef]
  15. Shih, C.K.; Hung, C.H.; Hsu, R.Q. The Finite Element Analysis on Planetary Rolling Process. J. Mater. Process. Technol. 2001, 113, 115–123. [Google Scholar] [CrossRef]
  16. Han, Y.; Zhang, X.B.; Wang, Z.X.; Xiao, Y.; Gao, X.L.; Zhao, Y.Q. Study on Cooling Process of Copper Tube After Three-Roll Planetary Rolling. Int. Commun. Heat Mass Transf. 2020, 110, 104393. [Google Scholar] [CrossRef]
  17. Dong, Y.; Zhang, J.S.; Wang, Z.; Chen, S.P.; Zhao, Q.H.; Peng, Y.C.; Qu, S.W. Mechanical Behavior Analysis of Roller Shaft in Three-Roll Planetary Rolling Process of Copper Tube. Hot Work. Technol. 2016, 45, 111–115. (In Chinese) [Google Scholar]
  18. Zeng, Q.L. Study on Metal Flow and Its Stability During Planetary Rolling Process. Ph.D. Thesis, University of Science and Technology Beijing, Beijing, China, 2016. (In Chinese). [Google Scholar]
  19. Romantsev, B.; Goncharuk, A.; Aleshchenko, A.; Gamin, Y.; Mintakhanov, M. Development of Multipass Skew Rolling Technology for Stainless Steel and Alloy Pipes’ Production. Int. J. Adv. Manuf. Technol. 2018, 97, 3223–3230. [Google Scholar] [CrossRef]
  20. Mori, K.; Yoshimura, H.; Osakada, K. Simplified Three-Dimensional Simulation of Rotary Piercing of Seamless Pipe by Rigid-Plastic Finite-Element Method. J. Mater. Process. Technol. 1998, 80–81, 700–706. [Google Scholar] [CrossRef]
  21. Li, L.; Li, J.; Ye, B. Internal Damage Mechanism and Deformation Process Window of a Free-Cutting Stainless Steel Bar Rolled by Three-Roll Planetary Mill. J. Mater. Eng. Perform. 2022, 31, 1187–1194. [Google Scholar] [CrossRef]
  22. Hu, S.; Wang, C.; Wang, X.; Li, L.; Liu, S. Process Optimization of Planetary Rolling of Bismuth-Containing Austenitic Stainless Steel. J. Mater. Eng. Perform. 2022, 31, 2012–2022. [Google Scholar] [CrossRef]
  23. Zhou, Y.; Mao, Z.; Liu, Y.; Wang, J. Microstructure Evolution of Copper by Three Roll Planetary Milling. Solid State Phenom. 2018, 279, 44–48. [Google Scholar] [CrossRef]
  24. Fu, Y.; Cui, J.; Cao, Z. Cracks of Cu-Cr-Zr Alloy Bars Under Planetary Rolling. Rare Met. Mater. Eng. 2015, 44, 567–570. [Google Scholar]
  25. Zeng, Q.L.; Zang, Y.; Qin, Q. The Effect of Roll with Passive Segment on the Planetary Rolling Process. Adv. Mech. Eng. 2015, 7, 2. [Google Scholar] [CrossRef]
  26. Kharitonov, E.A.; Romanenko, V.P.; Budnikov, A.S. Pipe Behavior in a Three-Roller Screw-Rolling Mill. Steel Transl. 2014, 44, 769–772. [Google Scholar] [CrossRef]
  27. Jin, R.; Chu, Z.B. Numerical Simulation of Three-Roll Planetary Rolling Process for 304 Stainless Steel Pipe Blank. Forg. Stamp. Technol. 2024, 49, 59–66. (In Chinese) [Google Scholar]
  28. Hu, S.D.; Du, Z.H.; Yu, H.; Li, L.X. Process Parameter Optimization for Three-Roll Planetary Rolling of Bismuth-Containing Austenitic Stainless Steel Bars. J. Wuhan Univ. Sci. Technol. 2021, 44, 13–19. (In Chinese) [Google Scholar]
  29. Du, Z.H. Determination of Process Parameters for Three-Roll Planetary Rolling of Bismuth-Containing Bright Stainless Steel. Master’s Thesis, Wuhan University of Science and Technology, Wuhan, China, 2021. (In Chinese). [Google Scholar]
  30. Jin, R. Roll Configuration Design and Process Optimization for Three-Roll Planetary Rolling of 304 Stainless Steel Tubes. Ph.D. Thesis, Taiyuan University of Science and Technology, Taiyuan, China, 2024. (In Chinese). [Google Scholar]
Figure 1. Three-roll planetary spinning model structure diagram: (a) deflection angle α; (b) tilt angle β.
Metals 15 00540 g001
Figure 2. (a) Simulation pre-processing model; (b) C4D8T meshing.
Metals 15 00540 g002
Figure 3. Billet cross-section points.
Metals 15 00540 g003
Figure 4. Location of each section (left) and the distribution of the location of the pickup points (right).
Metals 15 00540 g004
Figure 5. Variation curve of equivalent force at point of pipe billet section. (a) 30 rpm, (b) 60 rpm, (c) 90 rpm, (d) 120 rpm, (e) 150 rpm.
Metals 15 00540 g005
Figure 6. Rolling temperature at different roll speeds. (a) 30 rpm, (b) 60 rpm, (c) 90 rpm, (d) 120 rpm, (e) 150 rpm.
Metals 15 00540 g006
Figure 7. Roundness of finished tubes at different roll speeds. (a) 30 rpm, (b) 60 rpm, (c) 90 rpm, (d) 120 rpm, (e) 150 rpm.
Metals 15 00540 g007
Figure 8. Different rotational speeds: (a) Comparison of mean and maximum values of finished pipe dimensions. (b) Comparison of standard deviation of outer diameters.
Metals 15 00540 g008
Figure 9. Variation curve of equivalent force at point of pipe billet section. (a) 7°, (b) 8°, (c) 9°, (d) 10°, (e) 11°.
Metals 15 00540 g009
Figure 10. Rolling temperature at different roller deflection angles. (a) 7°, (b) 8°, (c) 9°, (d) 10°, (e) 11°.
Metals 15 00540 g010
Figure 11. Roundness of finished pipes under different roll deflection angles. (a) 7°, (b) 8°, (c) 9°, (d) 10°, (e) 11°.
Metals 15 00540 g011
Figure 12. (a) Comparison of mean and maximum values of finished pipe dimensions. (b) Comparison of standard deviation of outer diameters.
Metals 15 00540 g012
Figure 13. Variation curve of equivalent force at point of pipe billet section. (a) f = 0.2, (b) f = 0.3, (c) f = 0.4, (d) f = 0.5.
Metals 15 00540 g013
Figure 14. Rolling temperature at different coefficients of friction. (a) f = 0.2, (b) f = 0.3, (c) f = 0.4, (d) f = 0.5.
Metals 15 00540 g014
Figure 15. Radar diagram of finished tubes with different friction coefficients. (a) f = 0.2, (b) f = 0.3, (c) f = 0.4, (d) f = 0.5.
Metals 15 00540 g015
Figure 16. (a) Comparison of mean and maximum values of finished pipe dimensions. (b) Comparison of standard deviation of outer diameters.
Metals 15 00540 g016
Table 1. The physical parameters of 304 stainless steel pipes.
Density
(g·cm−3)
Elastic Modulus (GPa)Thermal Expansion Coefficient (W·(m·K)−1)Poisson’s Ratio
7.931941.670.3
Table 2. Tube dimensions.
Initial OD (mm)Initial ID (mm)Final OD (mm)Final ID (mm)Reduction (%)
8440504068
Table 3. Process parameter selection scheme.
Friction Coefficient (μ)0.20.30.40.5/
Roll speed (rpm)306090120150
Roll deflection angle (°)7891011
Disclaimer/Publisher’s Note: The statements, opinions and data contained in all publications are solely those of the individual author(s) and contributor(s) and not of MDPI and/or the editor(s). MDPI and/or the editor(s) disclaim responsibility for any injury to people or property resulting from any ideas, methods, instructions or products referred to in the content.

