Article

Keyhole Depth Prediction in Laser Deep Penetration Welding of Titanium Alloy Based on Spectral Information

1
School of Mechanical and Automotive Engineering, Shanghai University of Engineering Science, Shanghai 201620, China
2
Shanghai Collaborative Innovation Center of Intelligent Manufacturing Robot Technology for Large Components, Shanghai 201620, China
3
Engineering Research Center of Micro-Nano and Intelligent Manufacturing, Ministry of Education, Kaili 556011, China
*
Author to whom correspondence should be addressed.
Metals 2025, 15(5), 527; https://doi.org/10.3390/met15050527
Submission received: 14 March 2025 / Revised: 24 April 2025 / Accepted: 1 May 2025 / Published: 7 May 2025
(This article belongs to the Section Welding and Joining)

Abstract

Laser deep penetration welding has been widely applied in industrial fields. However, keyhole depth during the welding process significantly affects the service performance of final products. Based on the spectral signals generated in the laser welding process, this study employs a Long Short-Term Memory (LSTM) neural network to predict keyhole depth in titanium alloy welding. A coaxial plasma optical information acquisition system is established to collect spectral signals emitted from the welding plasma and analyze the relationship between keyhole depth and plasma spectral features. By analyzing the spectral signals and calculating the plasma temperature, the mapping model between the plasma temperature and keyhole depth is built. The LSTM network prediction results show that the average relative error between the predicted and actual values is 2.31%, which demonstrates that the method proposed in this study has high accuracy for predicting keyhole depth in laser deep penetration welding.

1. Introduction

Titanium alloys are widely used in the manufacturing of aerospace, automotive, and medical devices due to their high strength, excellent corrosion resistance, and biocompatibility [1]. Laser beam welding plays a crucial role in the processing of titanium alloys [2,3]. However, the high reflectivity and low thermal conductivity of titanium alloys pose challenges to the stability of laser deep penetration welding [4]. Fluctuations in keyhole depth during the welding process significantly affect the final product quality. Traditional quality inspection methods are typically performed post-welding, lacking real-time monitoring and adjustment capabilities [5]. To improve the welding quality, it is necessary to monitor the keyhole depth during the laser beam welding of titanium alloys [6].
The impacts of welding speeds, laser powers, and laser modes on keyhole depth have been studied [7]. Fabbro et al. [8] analyzed the effects of welding speed and laser power on keyhole depth and molten pool behavior, demonstrating that higher welding speeds enhance laser reflections inside the keyhole and increase its depth. They revealed that at low welding speeds, the keyhole has a high depth-to-width ratio and a near-cylindrical shape, while at high speeds, the depth-to-width ratio decreases [9]. Kaufmann et al. [10] investigated the influence of laser wavelengths and welding speed on keyhole geometry in copper welding. They found that increased infrared laser reflections within the keyhole amplify the impact of welding speed on keyhole depth.
The formation of keyhole depth is not a stable process. Vision-based keyhole and molten pool monitoring have been popular applications [11]. Luo et al. [12] used a coaxial high-speed camera with green auxiliary lighting to capture molten pool images. Zhang et al. [13] designed a coaxial vision system to capture keyhole images, using the keyhole area to determine penetration states. Due to the limitations of camera setting angles, internal keyhole morphology changes are difficult to capture. To address this problem, researchers have explored advanced optical imaging methods for real-time keyhole monitoring. Sokolov et al. [14] applied optical coherence tomography (OCT) to monitor the keyhole depth. Schmoeller et al. [15] further validated the accuracy of OCT-based keyhole depth measurement. Patterson [16] used inline coherent imaging (ICI) to track keyhole morphology evolution in laser welding and analyzed the effects of welding parameters on keyhole geometry.
Spectral analysis has been widely applied in weld quality monitoring [17,18]. She et al. [19] developed a multi-sensor monitoring system that acquires plasma spectra from the keyhole and molten pool to detect the depth of the molten pool. Sibillano et al. [20] and Kong et al. [21] investigated the correlation between plasma temperature fluctuations and weld defects. It has been found that there is a strong relationship between plasma temperature variations and weld quality. Garcia-Allende et al. [22] developed a near-infrared imaging spectroscopy method for monitoring arc welding quality, characterizing the spatial properties of plasma during welding.
Many researchers have employed deep learning methods to extract welding features and establish a relationship between keyhole depth and welding information [23,24]. Cai et al. [25] developed a monitoring system based on deep learning, extracting keyhole and molten pool features and using a Deep Belief Network (DBN) to identify penetration states. Zhang et al. [26] used a high-speed camera to capture molten pool images and adopted a Convolutional Neural Network (CNN) to predict weld penetration. Pandiyan [27] et al. utilized wavelet transforms to extract acoustic emission (AE) spectrograms and applied two CNN architectures to predict build quality indicators during laser additive manufacturing. Luo et al. [28] combined high-speed imaging and acoustic emission techniques to visualize keyhole dynamics and designed a hybrid CNN–LSTM model for penetration monitoring. Chokkalingham et al. [29] captured infrared images of the molten pool, extracting tail length and width features to train an Artificial Neural Network (ANN) for predicting weld width and keyhole depth. Bum et al. [30] employed Support Vector Machines (SVM) and shallow neural networks to predict the penetration state of steel welding. Kang et al. [31] used molten pool images captured by a CCD camera and plasma spectra as inputs to build a CNN model predicting the keyhole depth in Cu–Al laser welding.
However, due to the extreme temperatures and intense light generated during the welding process, accurate keyhole depth prediction is still a restriction in laser deep penetration welding research. In this study, a coaxial CCD system is used to capture plasma photoelectric and spectral signals during welding. The spectral and photoelectric characteristics of plasma are analyzed to investigate the relationship between keyhole depth and plasma behavior. The Long Short-Term Memory (LSTM) network is proposed for keyhole depth prediction. This model extracts key features from plasma optical information, achieving accurate real-time keyhole depth prediction during laser deep penetration welding. The aim of this study is to assess the feasibility and accuracy of using plasma optical signals in combination with a LSTM model for the real-time prediction of keyhole depth, thereby providing a foundation for intelligent control of titanium alloy laser welding processes.

2. Experimental Setup and Material Properties

2.1. Experimental Setup

The experimental setup is shown in Figure 1. It consists of an RFL-C3000S single-mode continuous fiber laser (Wuhan Raycus, Wuhan, China), a PDA10A2 photodetector (Thorlabs Shanghai, Shanghai, China), an FX-2000 spectrometer (Shanghai Idea Optics, Shanghai, China), a high-speed data acquisition card (ART Technology, Beijing, China), and a Y-type optical fiber (Shanghai Idea Optics, Shanghai, China). The workpiece is a Ti-6Al-4V titanium alloy plate with dimensions of 45 mm (L) × 5 mm (W) × 6 mm (T). The laser beam is perpendicular to the workpiece surface, forming a 0.5 mm diameter laser spot. The Y-type optical fiber has a core diameter of 200 μm and supports a transmission wavelength range of 360–2500 nm. The end of the double fiber core of the Y-type fiber connects to the collimator, while the two single-core ends connect the FX-2000 spectrometer and the PDA10A2 photodetector, respectively.
The experiment utilized an MFSC-6000W single-mode continuous-wave fiber laser (Maxphotonics, Shenzhen, China). This laser system features a maximum output power of 6000 W with a 1060 nm wavelength and a 4 nm spectral bandwidth (3 dB). The beam parameter product (BPP) is 2.8 mm × mrad, delivered through a QBH fiber output connector with a 20 m fiber cable length and a 100 μm core diameter. The QBH connector interfaces with a BF330-4KW laser head (Empower, Shanghai, China), achieving a zero-defocus spot diameter of 0.5 mm for the complete laser delivery system. This study employed the Acuteye high-speed imaging system V4.0. During welding, the high-speed camera captured keyhole morphology at 2200 frames per second (fps) and transmitted the data to the image acquisition software in real-time. This study used an FX-2000 fiber optic spectrometer to collect the plasma spectra inside the keyhole during the welding process. The spectrometer features high sensitivity and strong anti-interference capabilities. Additionally, it adopts dual-blaze grating technology with a UV-sensitive CCD detector, capable of receiving optical intensity information across the 200-1100 nm wavelength range. The experiment employed a Y-shaped optical fiber (FIB-Y-200-NIR) produced by Shanghai Zolix Optics, designed for welding plasma spectral collection. The fiber has a core diameter of 200 μm and operates within a wavelength range of 360–2500 nm. The experiment used a PDA10A2 photoelectric converter produced by Thorlabs Shanghai in the photoelectric signal acquisition system. The PDA10A2 model features a wide detection wavelength range of 200–1100 nm, a fast response time of up to 150 MHz, and a sensing CCD area of 0.8 mm2.
During welding, the plasma radiation inside the keyhole is collected by the optical system within the laser head and transmitted through the Y-type optical fiber to the spectrometer and photoelectric converter. The FX-2000 spectrometer captures light intensity data within the 200–1100 nm wavelength range, with a wavelength resolution of 0.11 nm and a sampling frequency of 10 ms. The PDA10A2 photoelectric converter connects a high-speed data acquisition card. This setup enables the real-time coaxial acquisition of plasma spectral and photoelectric information during the welding process.
This study focuses on predicting the keyhole depth in deep penetration laser welding. In the keyhole mode (laser power density greater than 107 W/cm2), the high-power density laser rapidly heats the metal, causing it to vaporize instantly. The recoil pressure generated by the vaporization of the molten metal creates a narrow and deep hole at the laser spot location. This unique keyhole shape allows for the laser energy to penetrate deep into the base material, significantly improving the energy absorption rate. Therefore, the three groups of laser power used are 1500, 2000, and 2500 W. The experimental parameters are listed in Table 1. The three groups of experiments only varied the laser power, and the welding speed was set to 10 mm/s, the defocus distance was set to 0 mm, and the shielding gas flow rate was set to 13 L/min.

2.2. Material Properties of Ti-6Al-4V

In this study, laser deep penetration welding is performed using a self-fusion welding method on flat plates. The titanium alloy used in the experiment is Ti-6Al-4V with dimensions of 45 mm (length) × 8 mm (width) × 6 mm (thickness). During the welding process, argon gas (99.99% purity) is used to shield the weld pool and prevent the oxidation of the weld seam. The chemical composition of the Ti-6Al-4V alloy is shown in Table 2.
Ti-6Al-4V titanium alloy is characterized by high mechanical strength and low density. It can operate continuously and stably in high-temperature environments ranging from 400 °C to 500 °C, demonstrating excellent high-temperature performance. Additionally, it has good corrosion resistance and is capable of withstanding various chemical media. Ti-6Al-4V has a high melting point of up to 1660 °C. Due to its high melting point and low thermal conductivity, higher energy input is required during welding, and the heat diffusion in the material is relatively slow, which can lead to overheating in the weld zone. Therefore, selecting Ti-6Al-4V as the research subject for keyhole prediction in laser deep penetration welding not only contributes to greater stability and weld quality in laser welding but also enables broader application prospects for Ti-6Al-4V.

3. Analysis of the Plasma Photonic Signal Inside the Keyhole

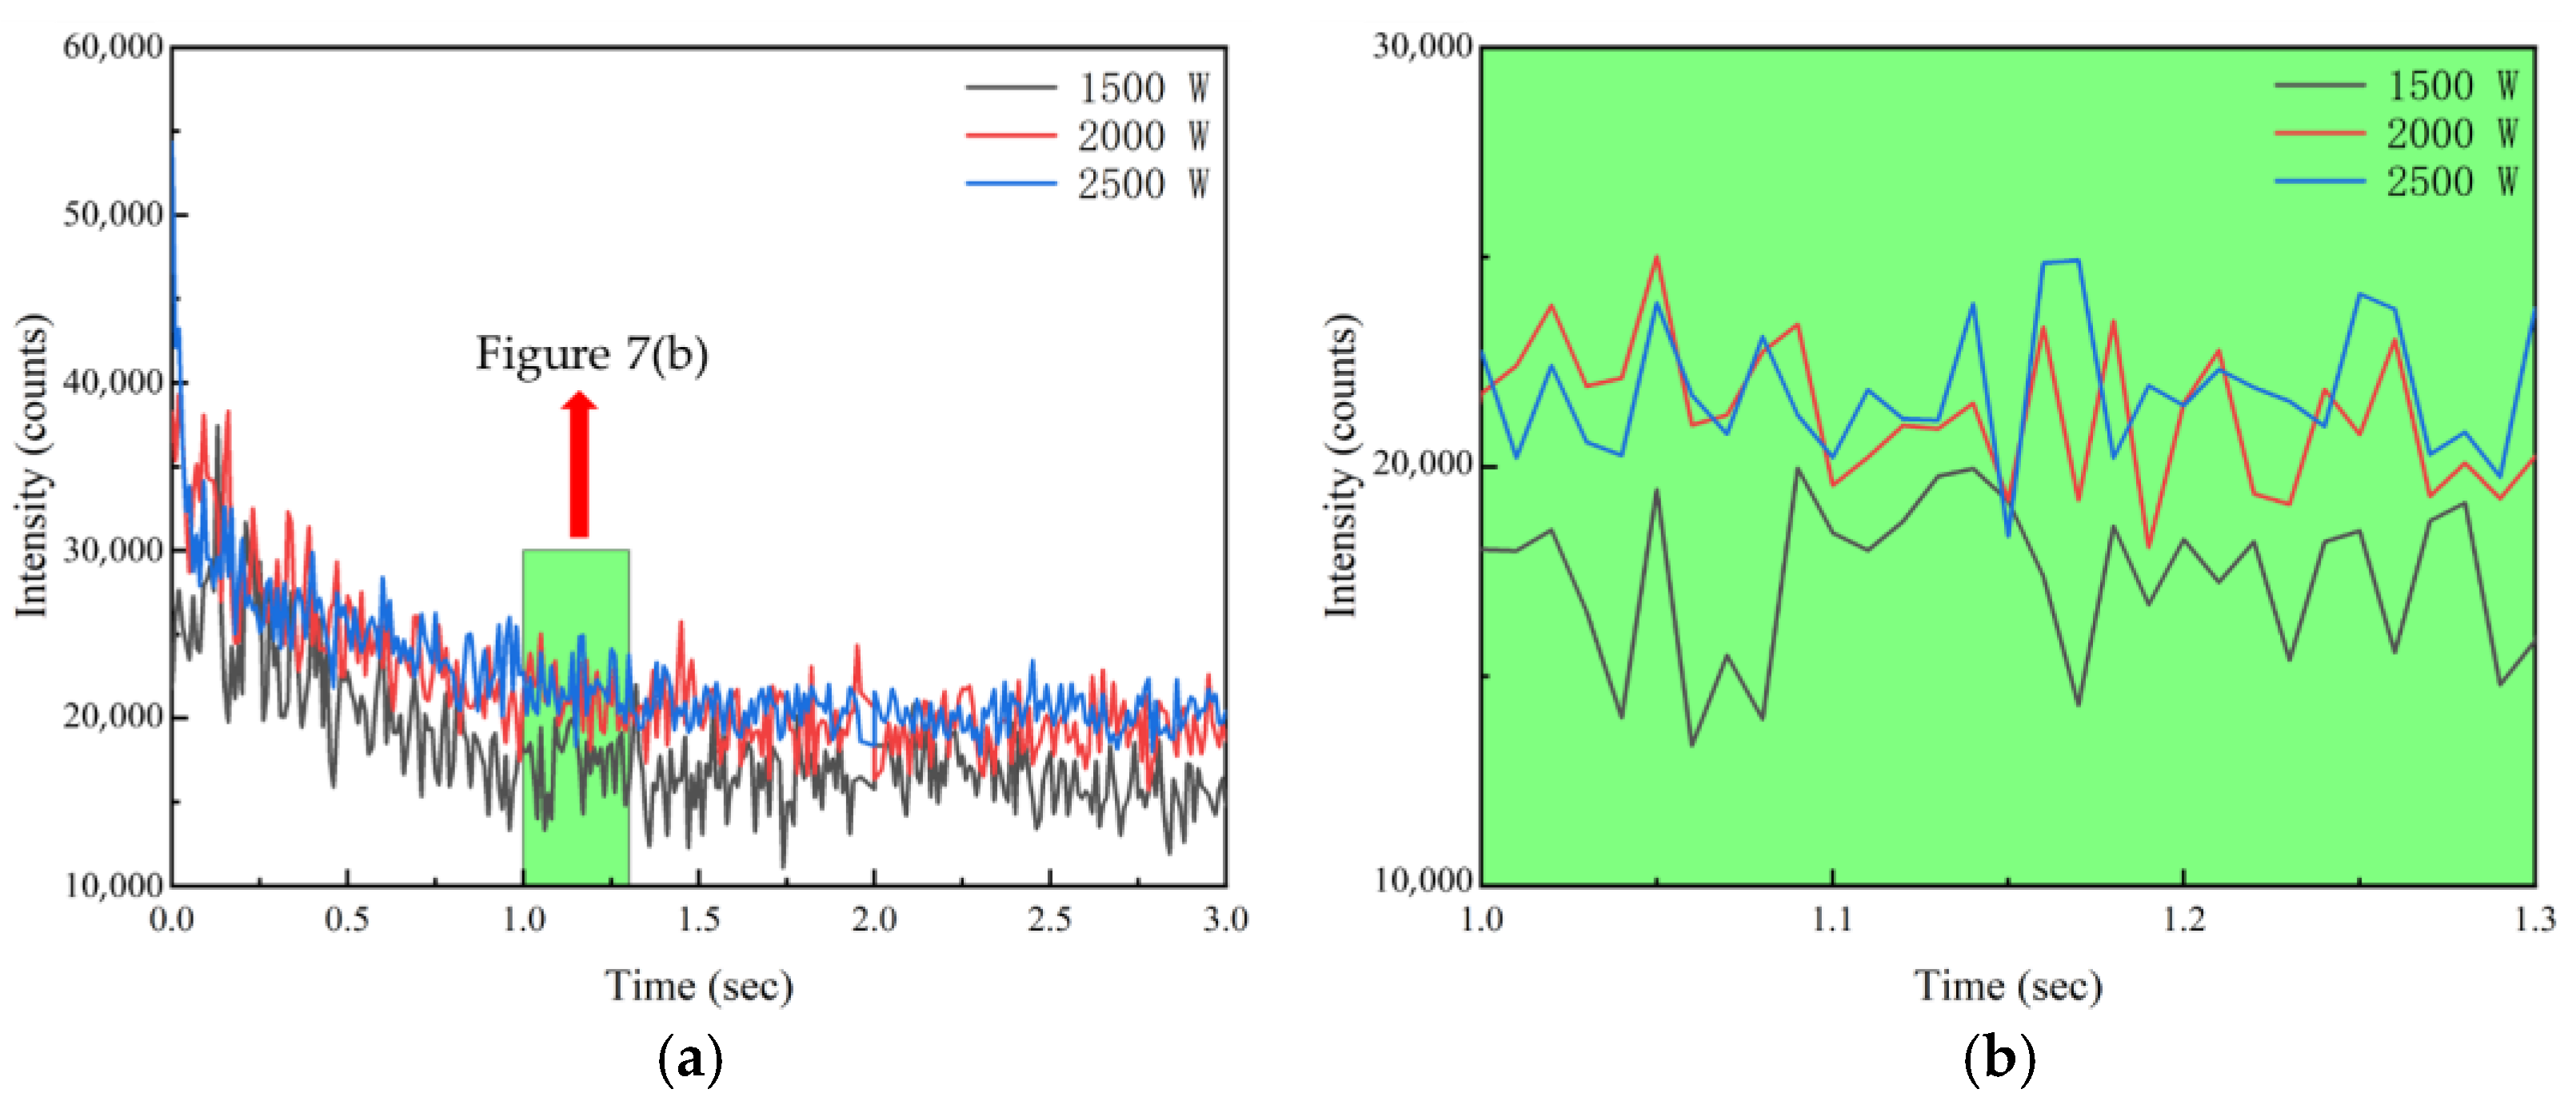
3.1. Time–Domain Analysis of the Photoelectric Signal

Figure 2 illustrates the variation of the plasma photoelectric signal over time. Figure 2a shows the overall variation of the photoelectric signal. Figure 2b–d show the signal changes at the initial stage, the welding stage, and at the end of the welding process. During the initial stage of welding, the photoelectric signal rapidly increases and quickly reaches a significant peak. As the laser power increases, the time of this peak occurs earlier. Under the same welding speed of 10 mm/s, the peak voltage appears at 0.00155 s, 0.00094 s, and 0.0004 s for laser powers of 1500 W, 2000 W, and 2500 W, respectively. Although higher laser power causes the peak voltage to appear earlier, the amplitude of the peak voltage gradually decreases. When the laser power increases from 1500 W to 2500 W, the peak voltage decreases from 8.69 V to 6.04 V. This is because higher laser power enhances the keyhole formation, improving the absorption of laser energy and reducing the peak voltage of the plasma photoelectric signal in the initial welding stage. Higher laser power more readily excites metal atoms, allowing them to reach an excited state and generate a peak signal more quickly at the beginning of welding. As the welding process continues, the laser energy is absorbed by the base material, and the depth of the keyhole gradually increases, leading to a weakening of the plasma photoelectric signal. As shown in Figure 2c,d, in the later stages of welding, the photoelectric signal gradually stabilizes. This indicates that the plasma inside the keyhole has reached a dynamic equilibrium state.
As shown in Table 3, the mean values of the photoelectric signal are calculated. It is shown that with increasing laser power, the signal intensity increases. This trend is consistent with the variations in the plasma photoelectric signal observed in Figure 2. Table 3 also shows that as the laser power increases, the variance of the photoelectric signal exhibits an increasing trend. Specifically, when the laser power increases from 1500 W to 2500 W, the variance of the plasma photoelectric signal rises from 0.026 to 0.038. This result indirectly supports an important observation: with increasing laser power, the dynamic behavior of the keyhole becomes more intense, leading to greater plasma fluctuations. The increase in laser power signifies a higher energy input into the welding zone, which not only facilitates the excitation of metal atoms but also causes rapid changes in temperature and pressure within the welding region.

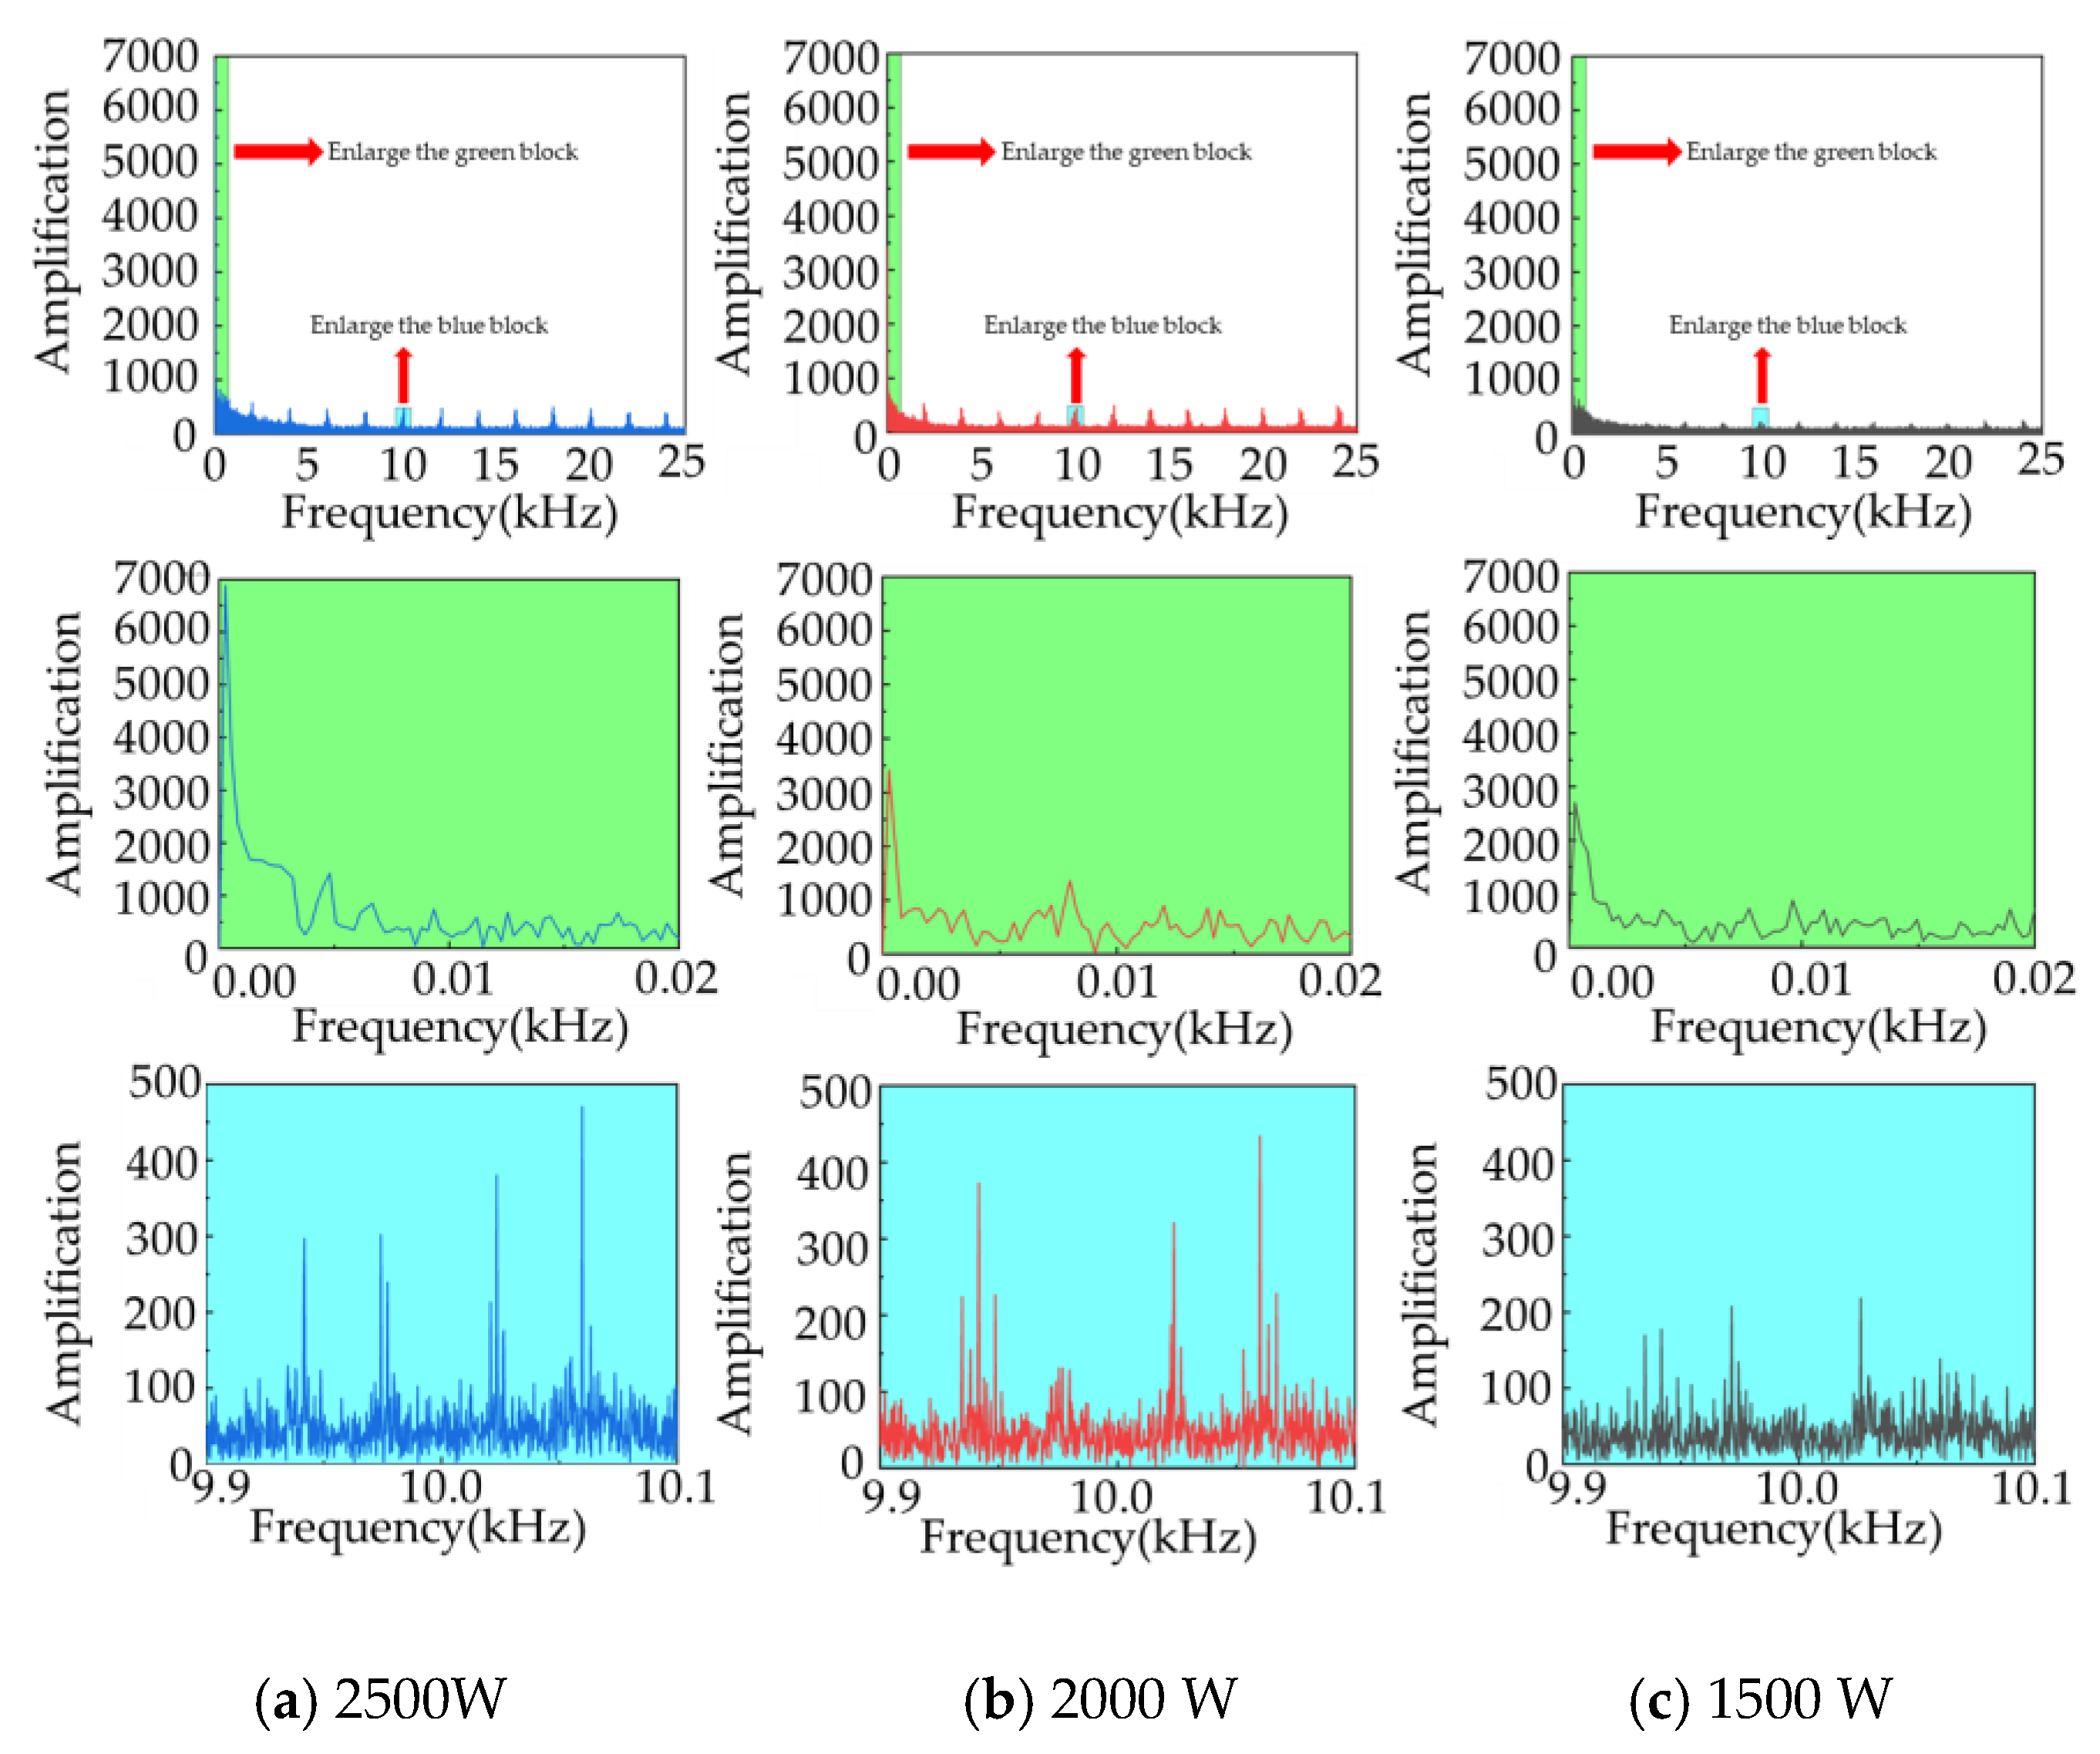
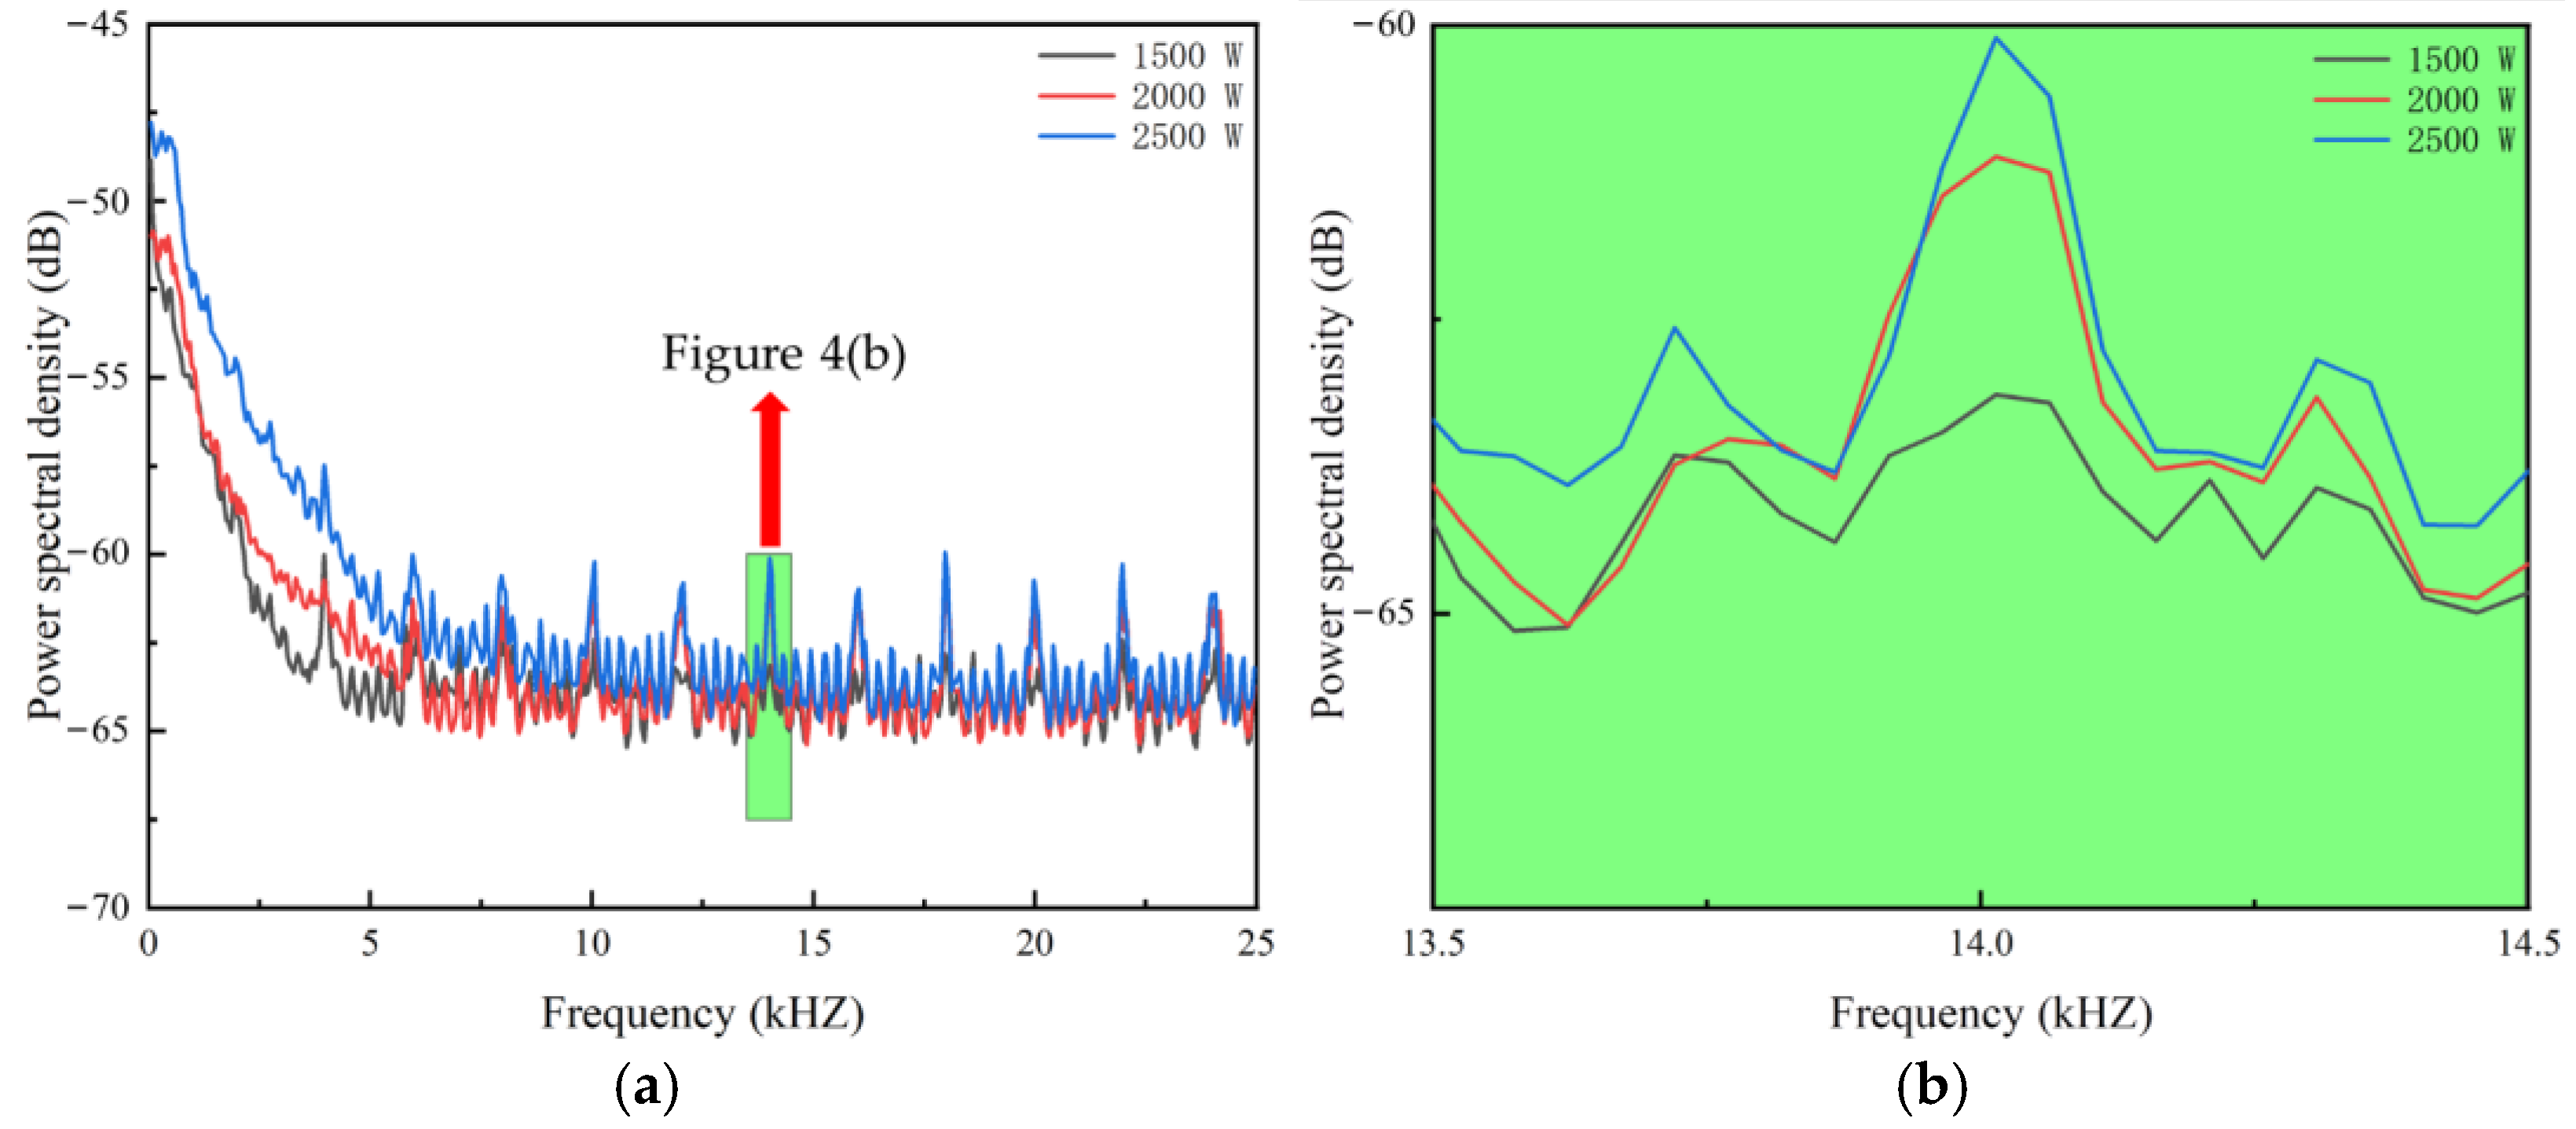
3.2. Frequency–Domain Analysis of the Photoelectric Signal

To extract the characteristics of the raw plasma photoelectric signal, a Fourier transform of the plasma photoelectric signal inside the keyhole was performed, as shown in Figure 3. It can be observed that the peak signal distribution of the plasma photoelectric signal remains similar under different laser powers. As the laser power increases from 1500 W to 2500 W, the amplitude of the photoelectric signal in the low-frequency range rises significantly. In the high-frequency range above 2.5 kHz, the peak signal exhibits clear periodic variations, appearing with a periodicity corresponding to a 2 kHz frequency.
The power spectral density (PSD) calculation method was applied to process the plasma photoelectric signal. Figure 4 presents the computed PSD results of the photoelectric signal. The power amplitude of the plasma photoelectric signal inside the keyhole increases with laser power. In the low-frequency range, the power amplitude of the plasma photoelectric signal varies significantly under different laser power levels. However, as the frequency increases, this difference gradually diminishes. Most of the high-energy plasma photoelectric signals inside the keyhole are concentrated below 2.5 kHz. As the frequency increases, the power amplitude decreases to −60 dB, and distinct characteristic peaks emerge at frequencies above 2.5 kHz. The distribution of the PSD characteristic peaks in the high-frequency region remains highly similar under different laser power levels. In the high-frequency range, both PSD and FFT exhibit the same periodic variation pattern.

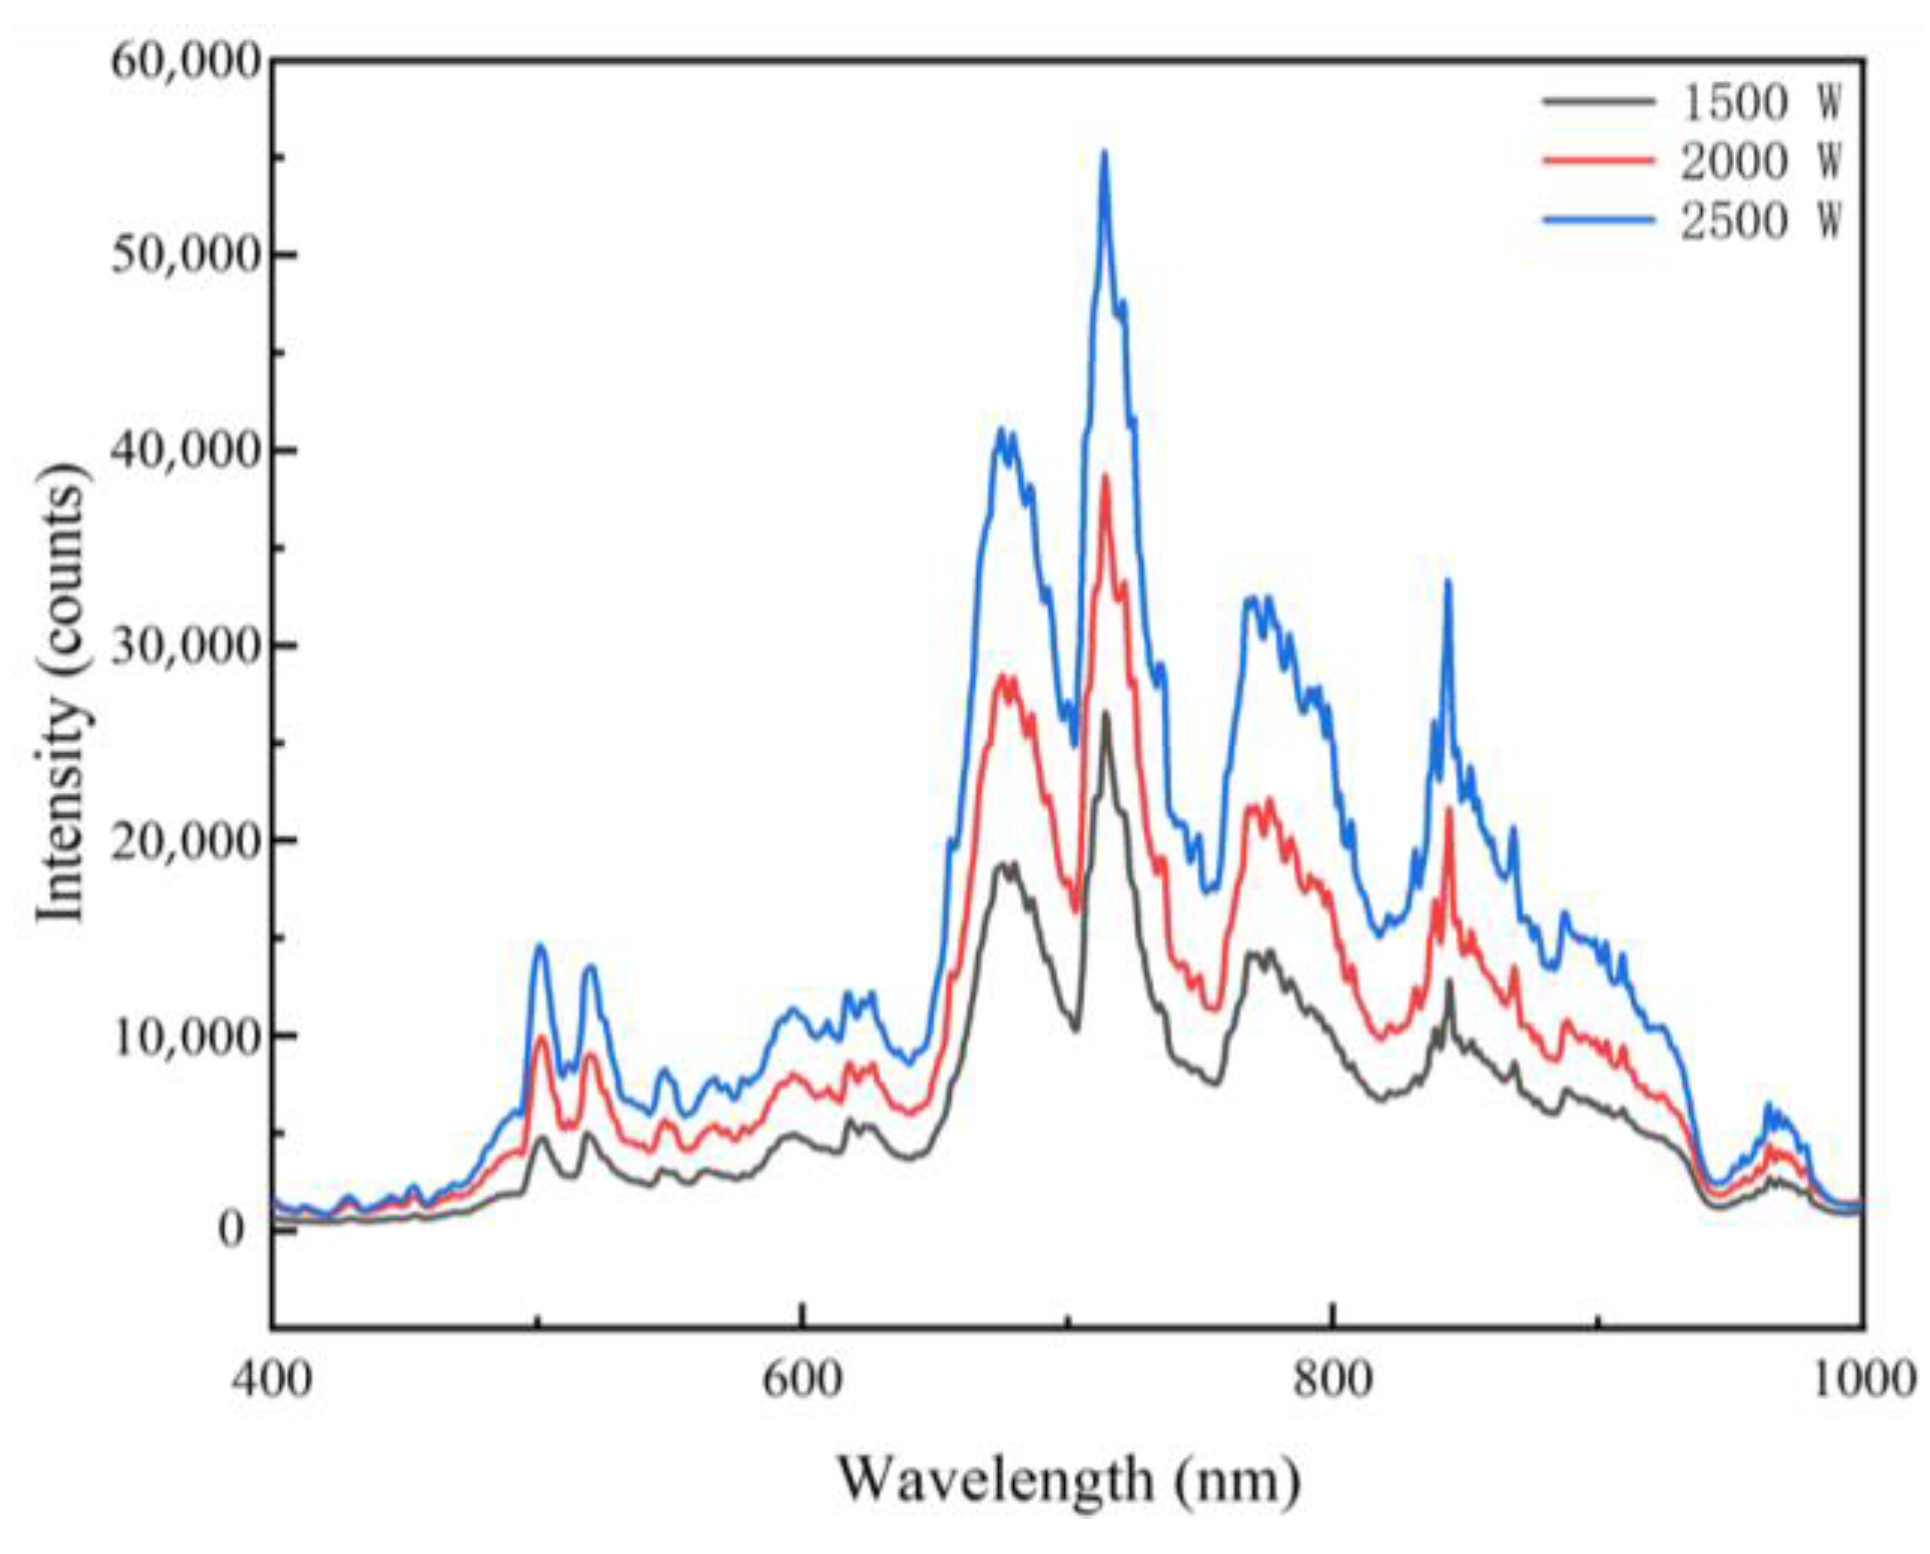
4. Spectral Analysis of Plasma Inside the Keyhole

A detailed study of the spectral characteristics of plasma during titanium alloy welding is crucial for understanding keyhole morphology changes. Figure 5 presents the raw spectral images of plasma captured during the welding process. From the figure, the plasma spectral pattern i exhibits a high degree of similarity throughout the entire laser welding process. This indicates that the spectral characteristics of plasma remain relatively stable. Within the observed wavelength range of 400–1000 nm, the plasma intensity rapidly increases at the beginning of welding and then gradually stabilizes. Furthermore, as the laser power increases, the radiation intensity of the plasma also correspondingly strengthens.
Since the plasma spectra in titanium alloy laser welding exhibit consistent characteristics throughout the entire process, extracting a single-frame spectrum is sufficient for analyzing the spectral features of plasma. Figure 6 shows the spectral distribution of plasma during the initial welding stage. Distinct spectral peaks are observed at wavelengths of 501.656 nm, 518.771 nm, 625.724 nm, 713.664 nm, 776.932 nm, and 843.629 nm. Moreover, the wavelengths at which these plasma characteristic peaks appear remain unaffected by changes in laser power, demonstrating the high stability of the spectral characteristics of plasma under different laser power conditions during welding.
To further analyze the variation of plasma intensity over time, the spectral line corresponding to the highest intensity peak at 713.664 nm was selected as the research focus. Figure 7 depicts the temporal evolution of plasma intensity at the 713.664 nm wavelength. The analysis of intensity fluctuations in the figure indicates that in the initial stage of welding, the plasma intensity rises sharply and exhibits significant oscillations. As the welding time progresses to 1.0 s, the oscillations decrease markedly, and the plasma intensity stabilizes at around 20,000. Further observations reveal that at a laser power of 1500 W, the oscillations in plasma intensity are more obvious compared to laser powers of 2000 W and 2500 W. This phenomenon may be attributed to insufficient energy at lower power levels, which fails to maintain a stable keyhole morphology.

5. Spectral Feature Extraction of Plasma and Keyhole Depth Prediction

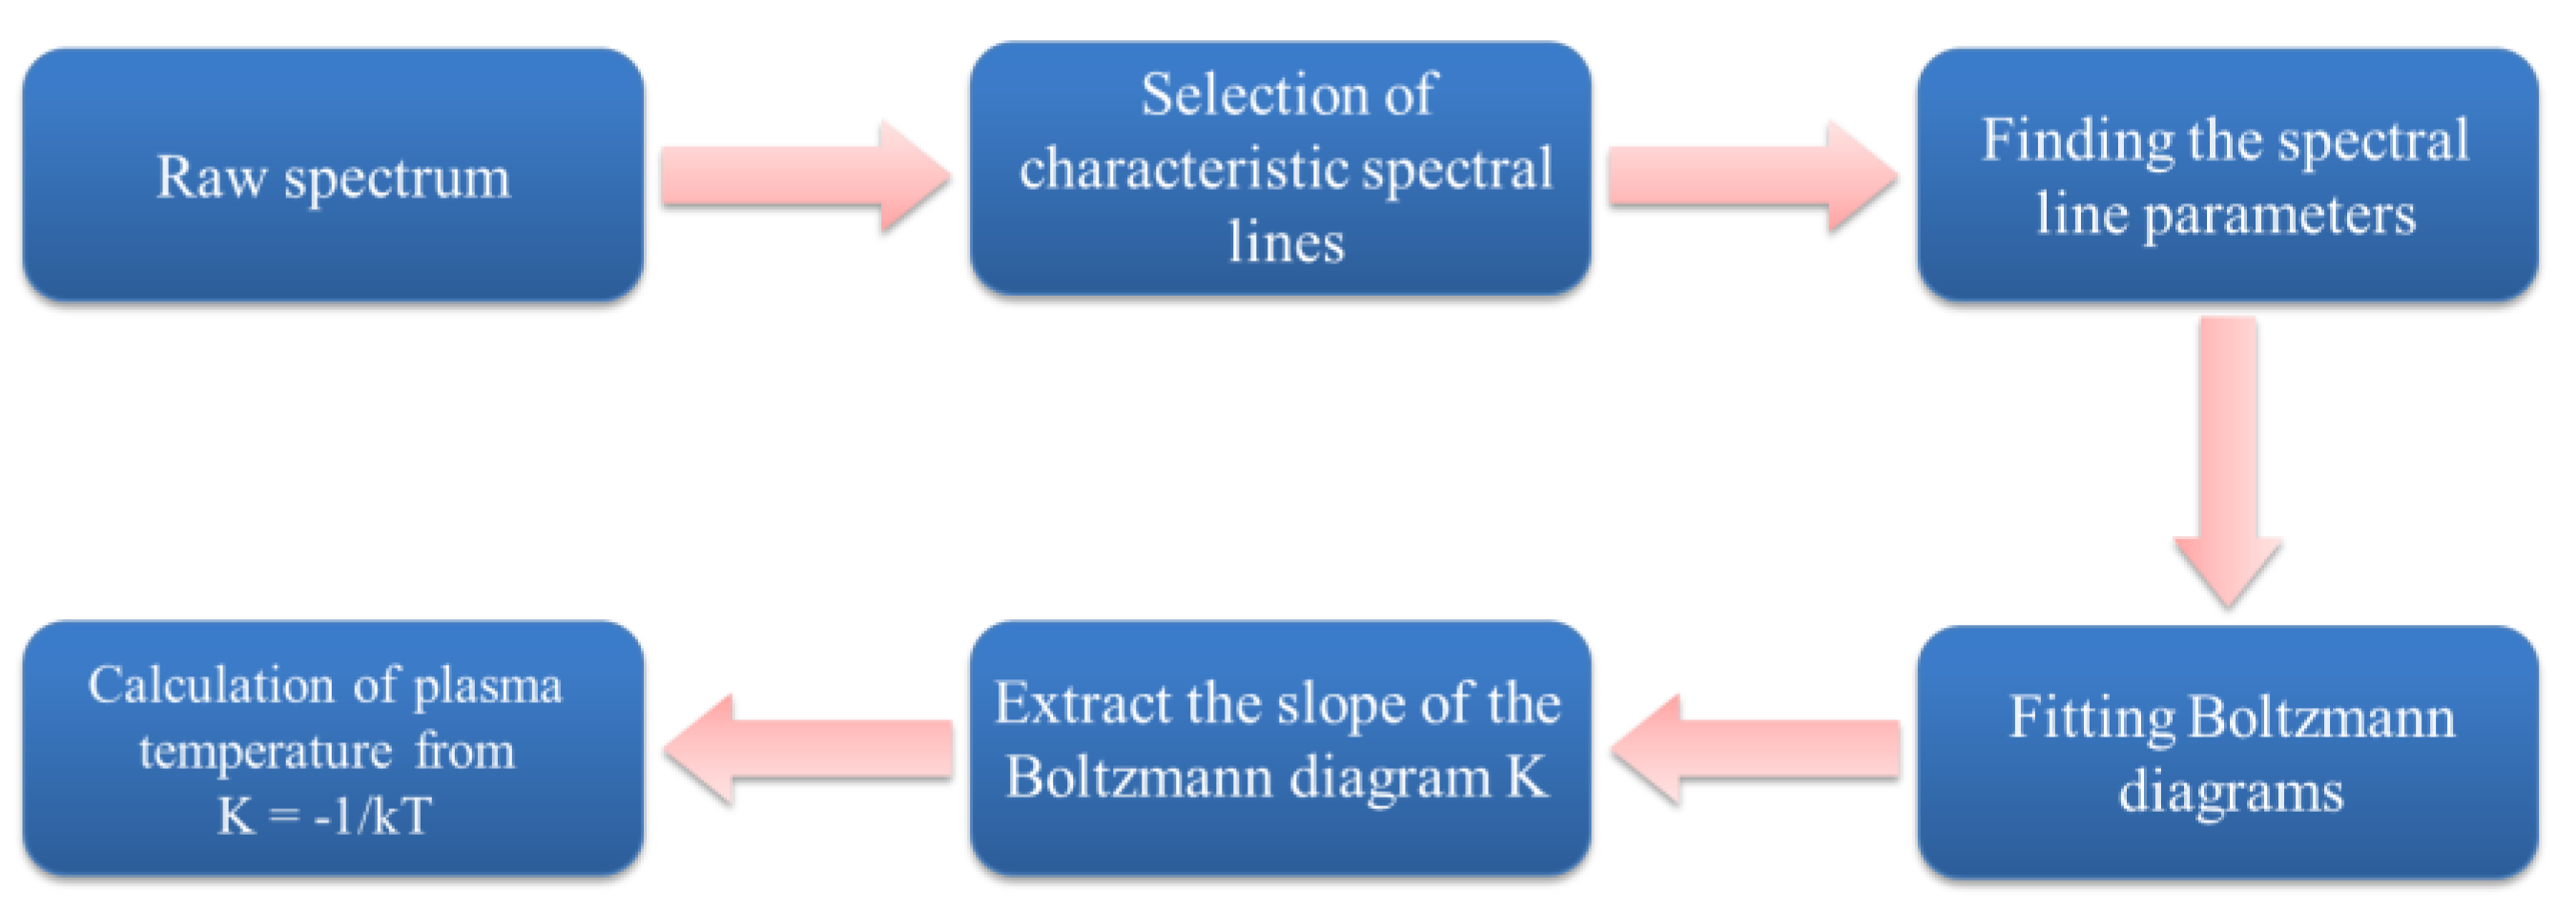
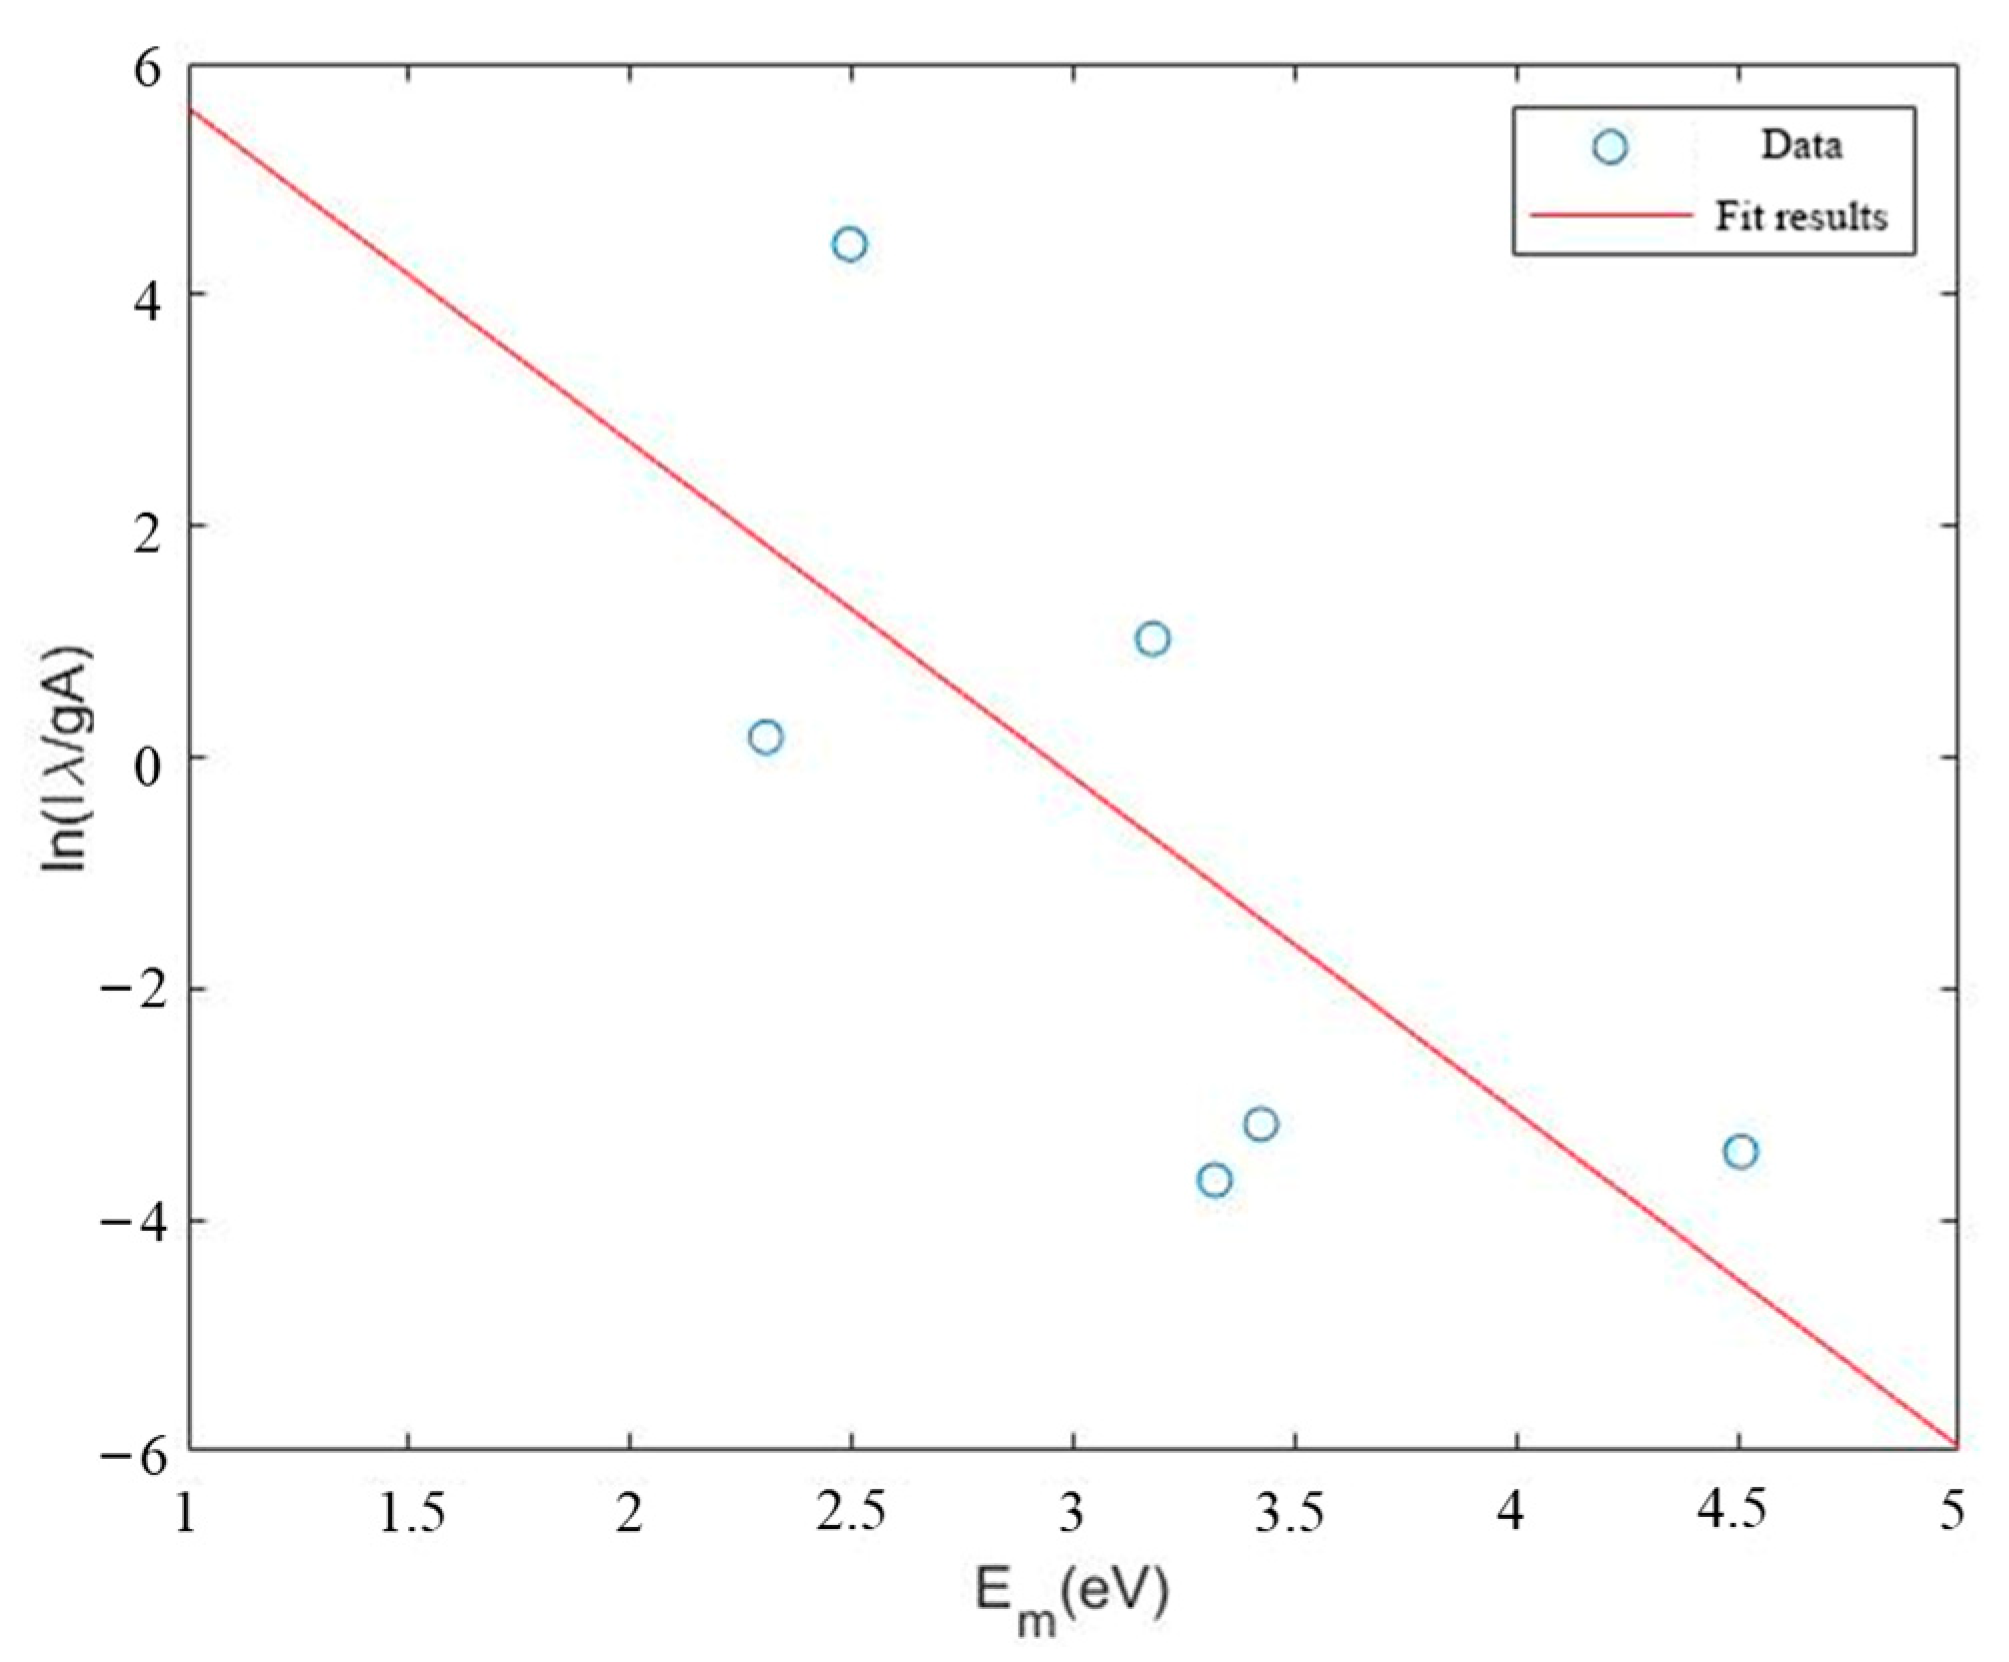
5.1. Calculation of Plasma Temperature Based on Spectroscopy

Each spectral dataset from 400 nm to 1000 nm contains 2048 wavelength dimensions, covering ultraviolet, visible, and infrared light. These rich spectral data have a wealth of welding-related information. However, due to the massive data volume and redundancy, establishing a direct relationship between the spectral data and keyhole depth is highly challenging. Therefore, before constructing a prediction model, it is necessary to extract the spectral features of the plasma. This study employs the Boltzmann plot method to calculate the plasma temperature, reducing the 2048 wavelength dimensions to 300 spectral features.
As shown in Figure 8, the procedure for solving plasma temperature consists of the following steps. First, suitable characteristic spectral lines are selected by referencing the database provided by the National Institute of Standards and Technology (NIST). Then, an in-depth analysis is conducted on the selected spectral lines to extract key parameters such as spectral intensity and wavelength. Using these parameters, the plasma temperature is calculated. The calculated data are used to construct and fit the Boltzmann plot. By performing linear fitting on the Boltzmann plot, a straight line is obtained. Finally, based on the straight-line slope, the plasma temperature can be accurately determined.
From the time–domain analysis of the spectrum, it is observed that under different laser power levels, distinct characteristic peaks appear at 501.656 nm, 518.771 nm, 625.724 nm, 713.664 nm, 776.932 nm, and 843.629 nm. Based on this observation, these six wavelengths were selected to calculate the plasma temperature. Considering the abundant Ti elements in the Ti-6Al-4V alloy, titanium atoms are easily excited to emit characteristic spectral lines. Therefore, TiI spectral line data were chosen to compute the data points for fitting the Boltzmann plot to determine the plasma temperature.
To obtain the required spectral parameters, this study referenced the atomic spectral database provided by NIST. Using these data, the relevant parameters of six TiI spectral lines were obtained, as shown in Table 4.
By plotting the six TiI spectral lines from Table 4 on the Boltzmann plot, as shown in Figure 9, the measured slope of the fitted line is −2.365. This allows for determining the variation of plasma temperature over time during the welding process.
Figure 10 demonstrates the variation process of plasma temperature. At the beginning of welding, the plasma temperature rises slowly and then gradually stabilizes. Under laser power levels of 2500 W, 2000 W, and 1500 W, the stabilized plasma temperatures reach approximately 4600 K, 4400 K, and 4100 K, respectively. Additionally, it can be observed from the figure that the stability of plasma is influenced by laser power. As the laser power increases, the fluctuation amplitude of the plasma temperature also increases. Plasma temperature fluctuations indicate instability in the plasma state, which may directly affect the morphology and depth of the keyhole. Higher plasma temperatures correspond to higher energy densities, which could promote the vaporization of molten metal material, thereby influencing the depth of the keyhole.

5.2. Prediction of Keyhole Depth During Welding

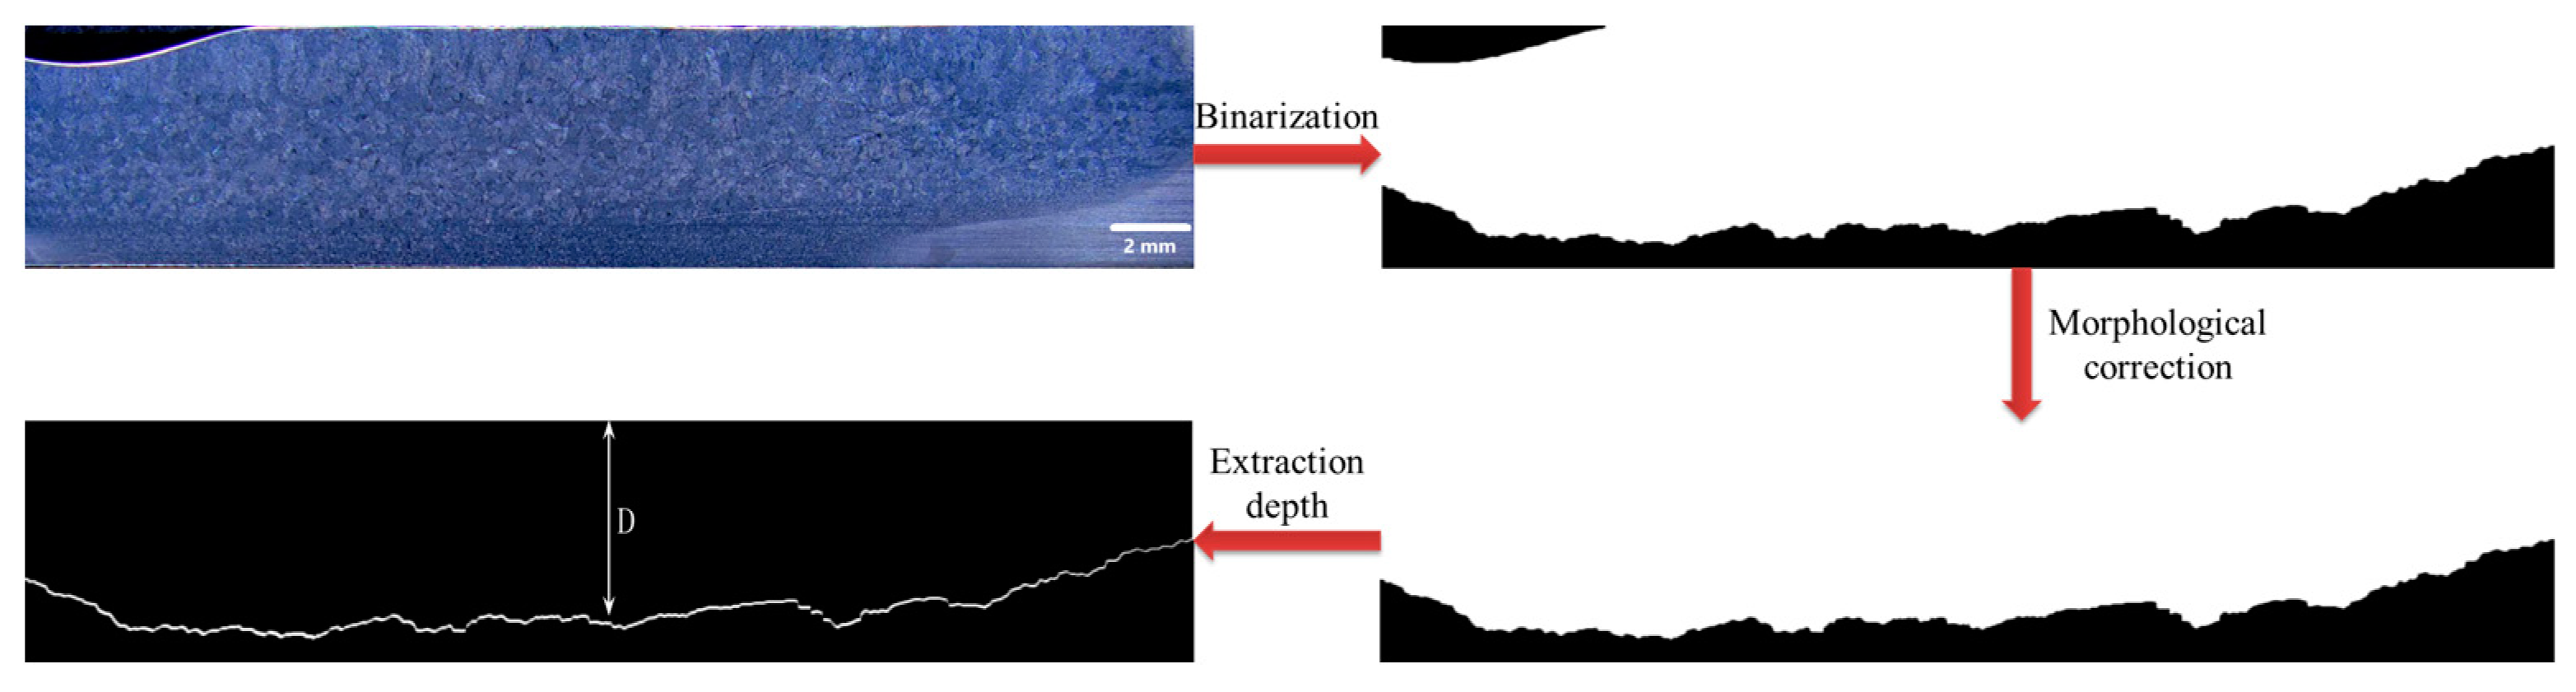
5.2.1. Data Preparation

In this study, two sets of process parameters, 1500 W with 10 mm/s and 2500 W with 10 mm/s, were used as the training dataset for the LSTM model. The objective is to predict the keyhole depth under the process parameters of 2000 W with 10 mm/s. During each welding experiment, 300 spectral images were collected, and 300 plasma temperature data points were computed. Each set of process parameters was repeated three times for a total of 1800 data points.
Figure 11 presents the metallographic cross-section of titanium alloy along the weld axis after welding. Figure 12 shows the sectioning along the weld axis. As seen in Figure 11, it is evident that the weld region is divided into three parts: a grain area with a crystalline structure as the background material, a heat-affected area with a smooth surface and a darker material color, and a substrate area with a smooth surface and a lighter background color. During the welding process, the titanium alloy absorbs laser energy, melts, and then solidifies. Grayscale segmentation can be used to extract keyhole depth information and establish a mapping relationship between keyhole depth, plasma temperature, photodetector signal variations, and process parameters.
The process of extracting the keyhole depth is illustrated in Figure 13. First, based on the significant grayscale differences in the original metallographic image, a binarization process is applied to identify the boundary between the grain zone and the heat-affected zone. To improve the accuracy of keyhole depth measurement, morphological repair is performed. After repairing, edge detection is applied to the weld region to obtain the contour curve of the grain zone and extract the keyhole depth. To establish a correspondence between keyhole depth and plasma temperature, the keyhole depth was extracted at 0.1 mm intervals, yielding a total of 300 data points.

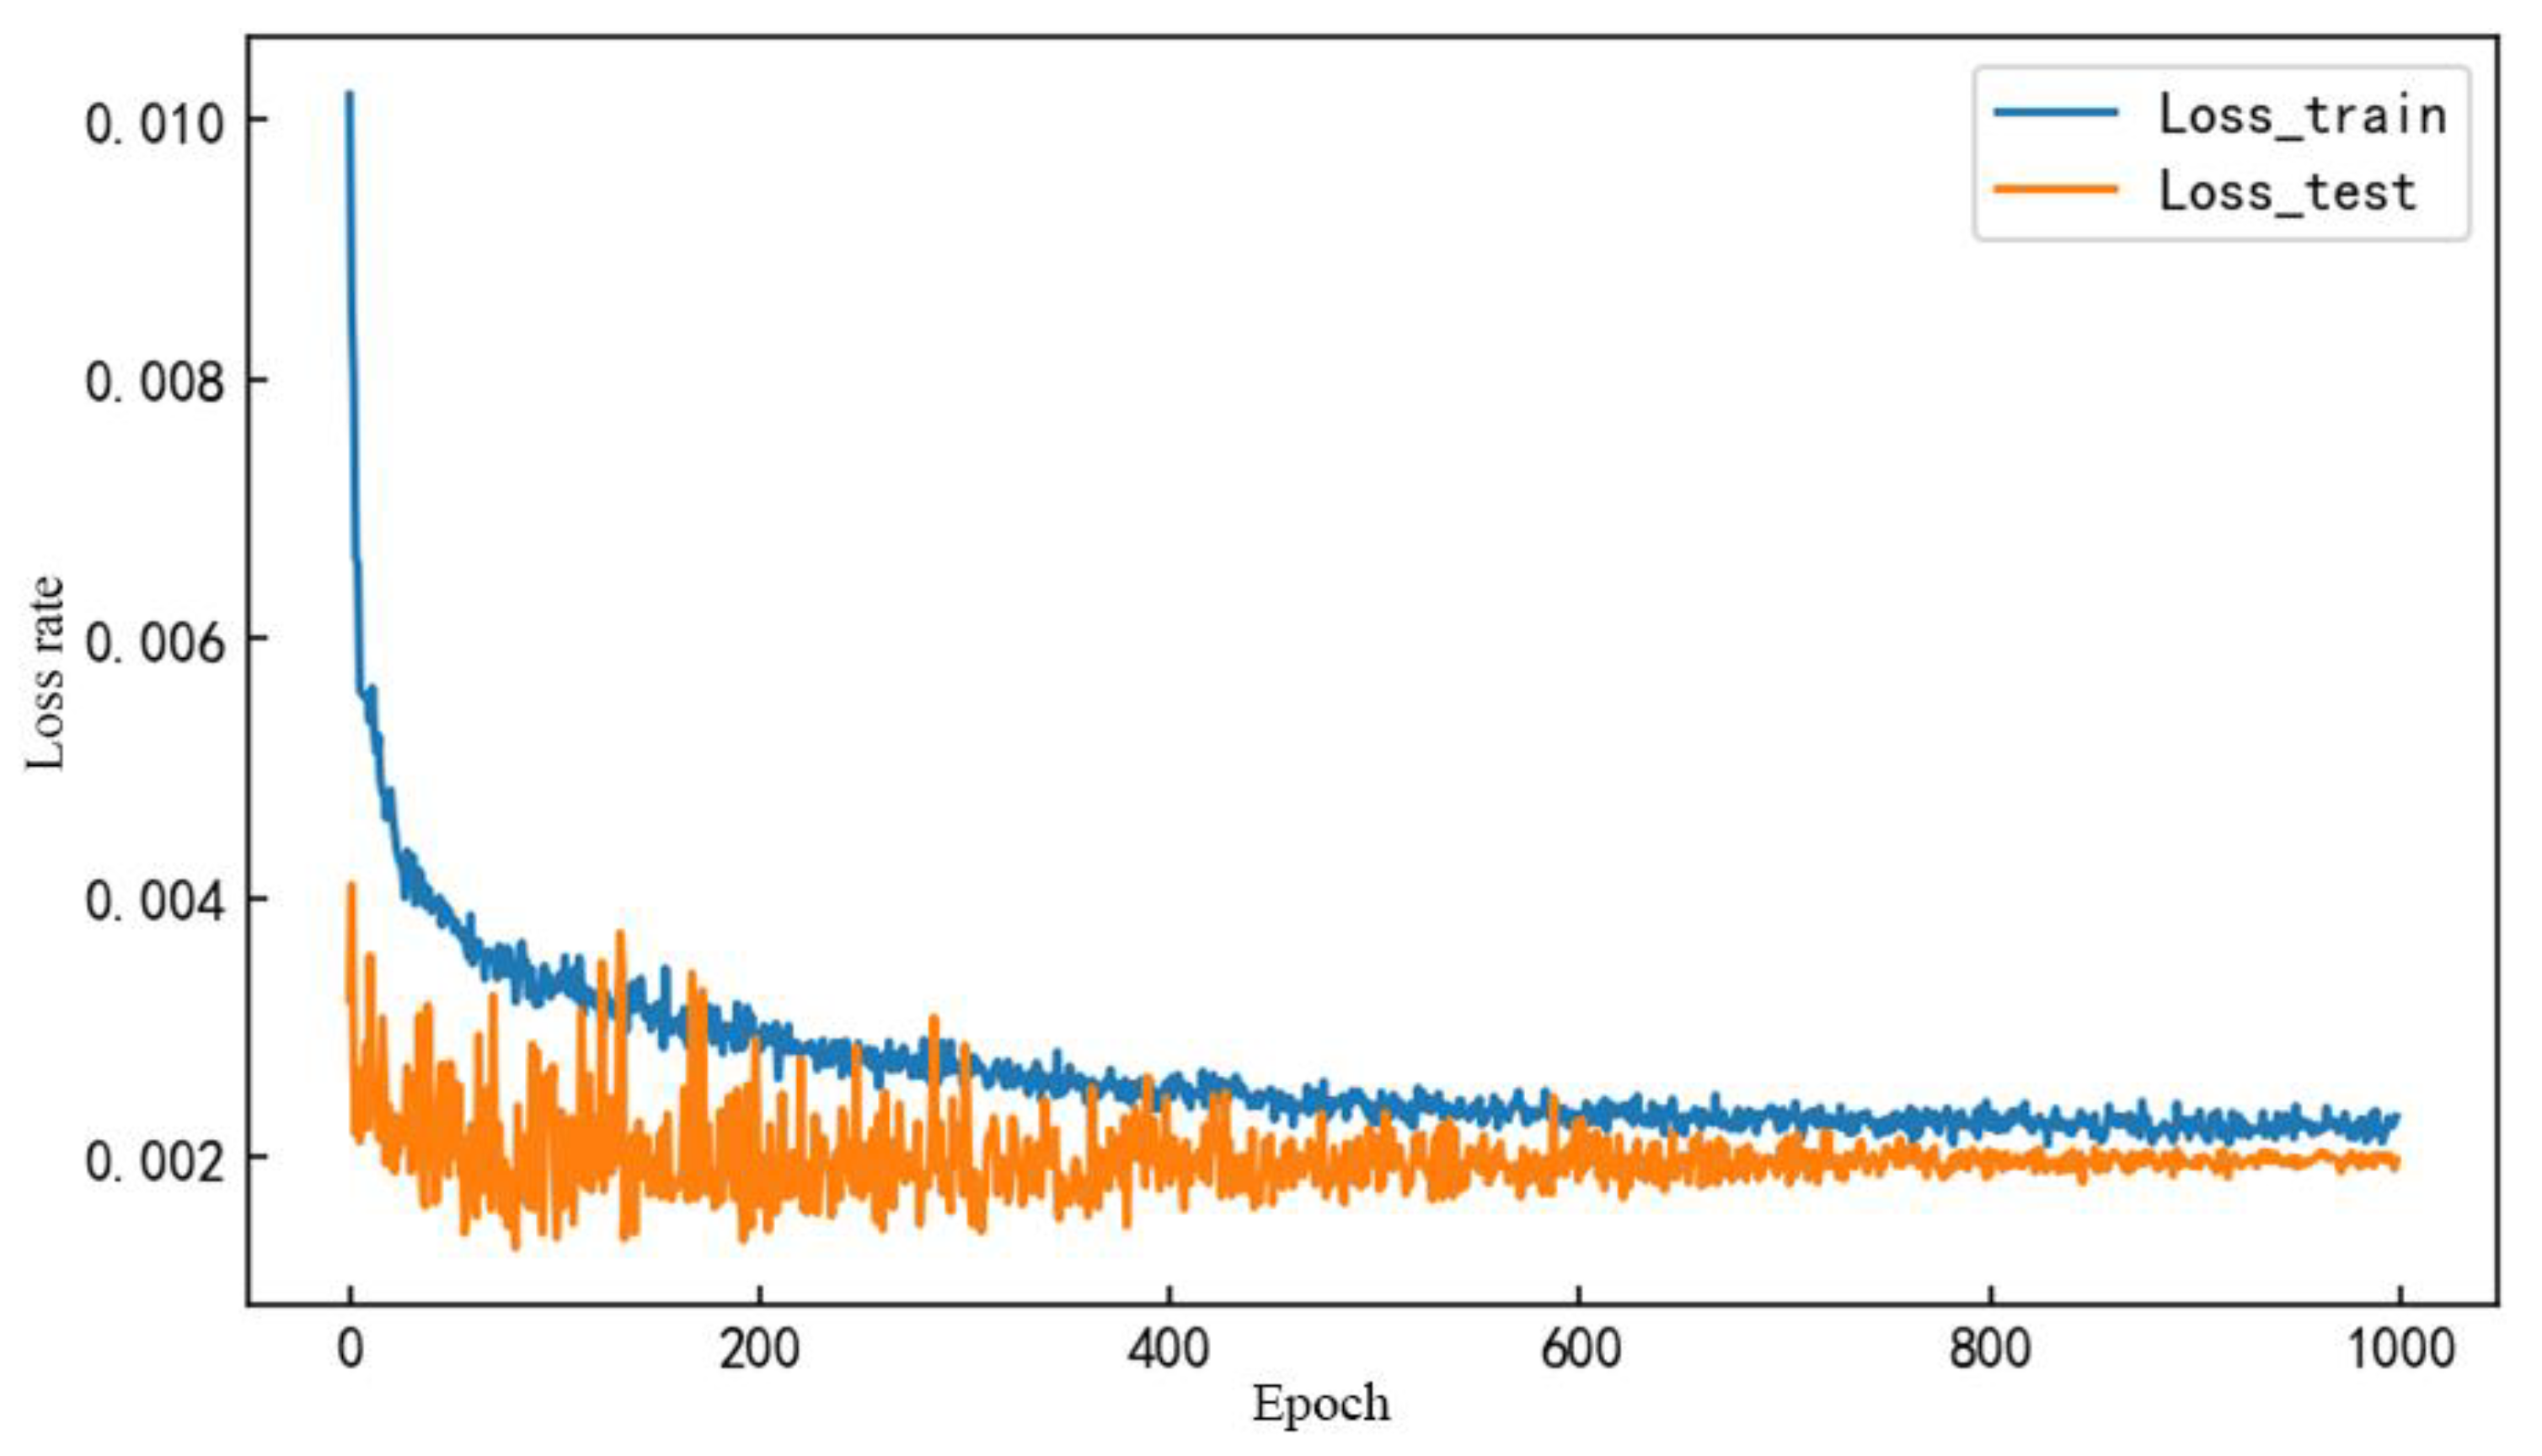
5.2.2. LSTM Model Training and Evaluation

This study conducted three repeated experiments using two sets of experimental parameters (1500 W, 10 mm/s; 2500 W, 10 mm/s), resulting in a total of 1800 data points. A total of 80% of the data were randomly selected as the training set, and the remaining 20% were used as the test set. The learning rate was set to 0.001, and the model was trained for 1000 iterations. The training process is shown in Figure 14. During the early stages, the test set loss exhibited fluctuations that gradually diminished as training continued. After 600 iterations, both test and training loss had stabilized and converged.
The evaluation results of the trained model are shown in Table 5. R2 is the coefficient of determination, MSE is the mean squared error, RMSE is the root mean squared error, MAE is the mean absolute error, and MAPE is the mean absolute percentage error. The R2 reflects the goodness of fit of the model with a value range of [0, 1]. MSE was calculated as the average of squared differences between predicted and observed values. RMSE is the square root of the MSE. RMSE represents the sample standard deviation of the differences between predicted values and true values. MAE measures the average of the absolute differences between the predicted and true values. When the predicted values exactly match the true values, MSE, RMS, and MAE equal 0. MAPE is an improvement on MAE, which calculates the percentage error between the true and predicted values, avoiding the influence of the data range. The value range of MAPE is from 0% to infinity. A MAPE of 0% indicates a perfect model, while a MAPE greater than 100% indicates a poor model.
From the results in Table 5, the trained LSTM model demonstrates excellent predictive performance.

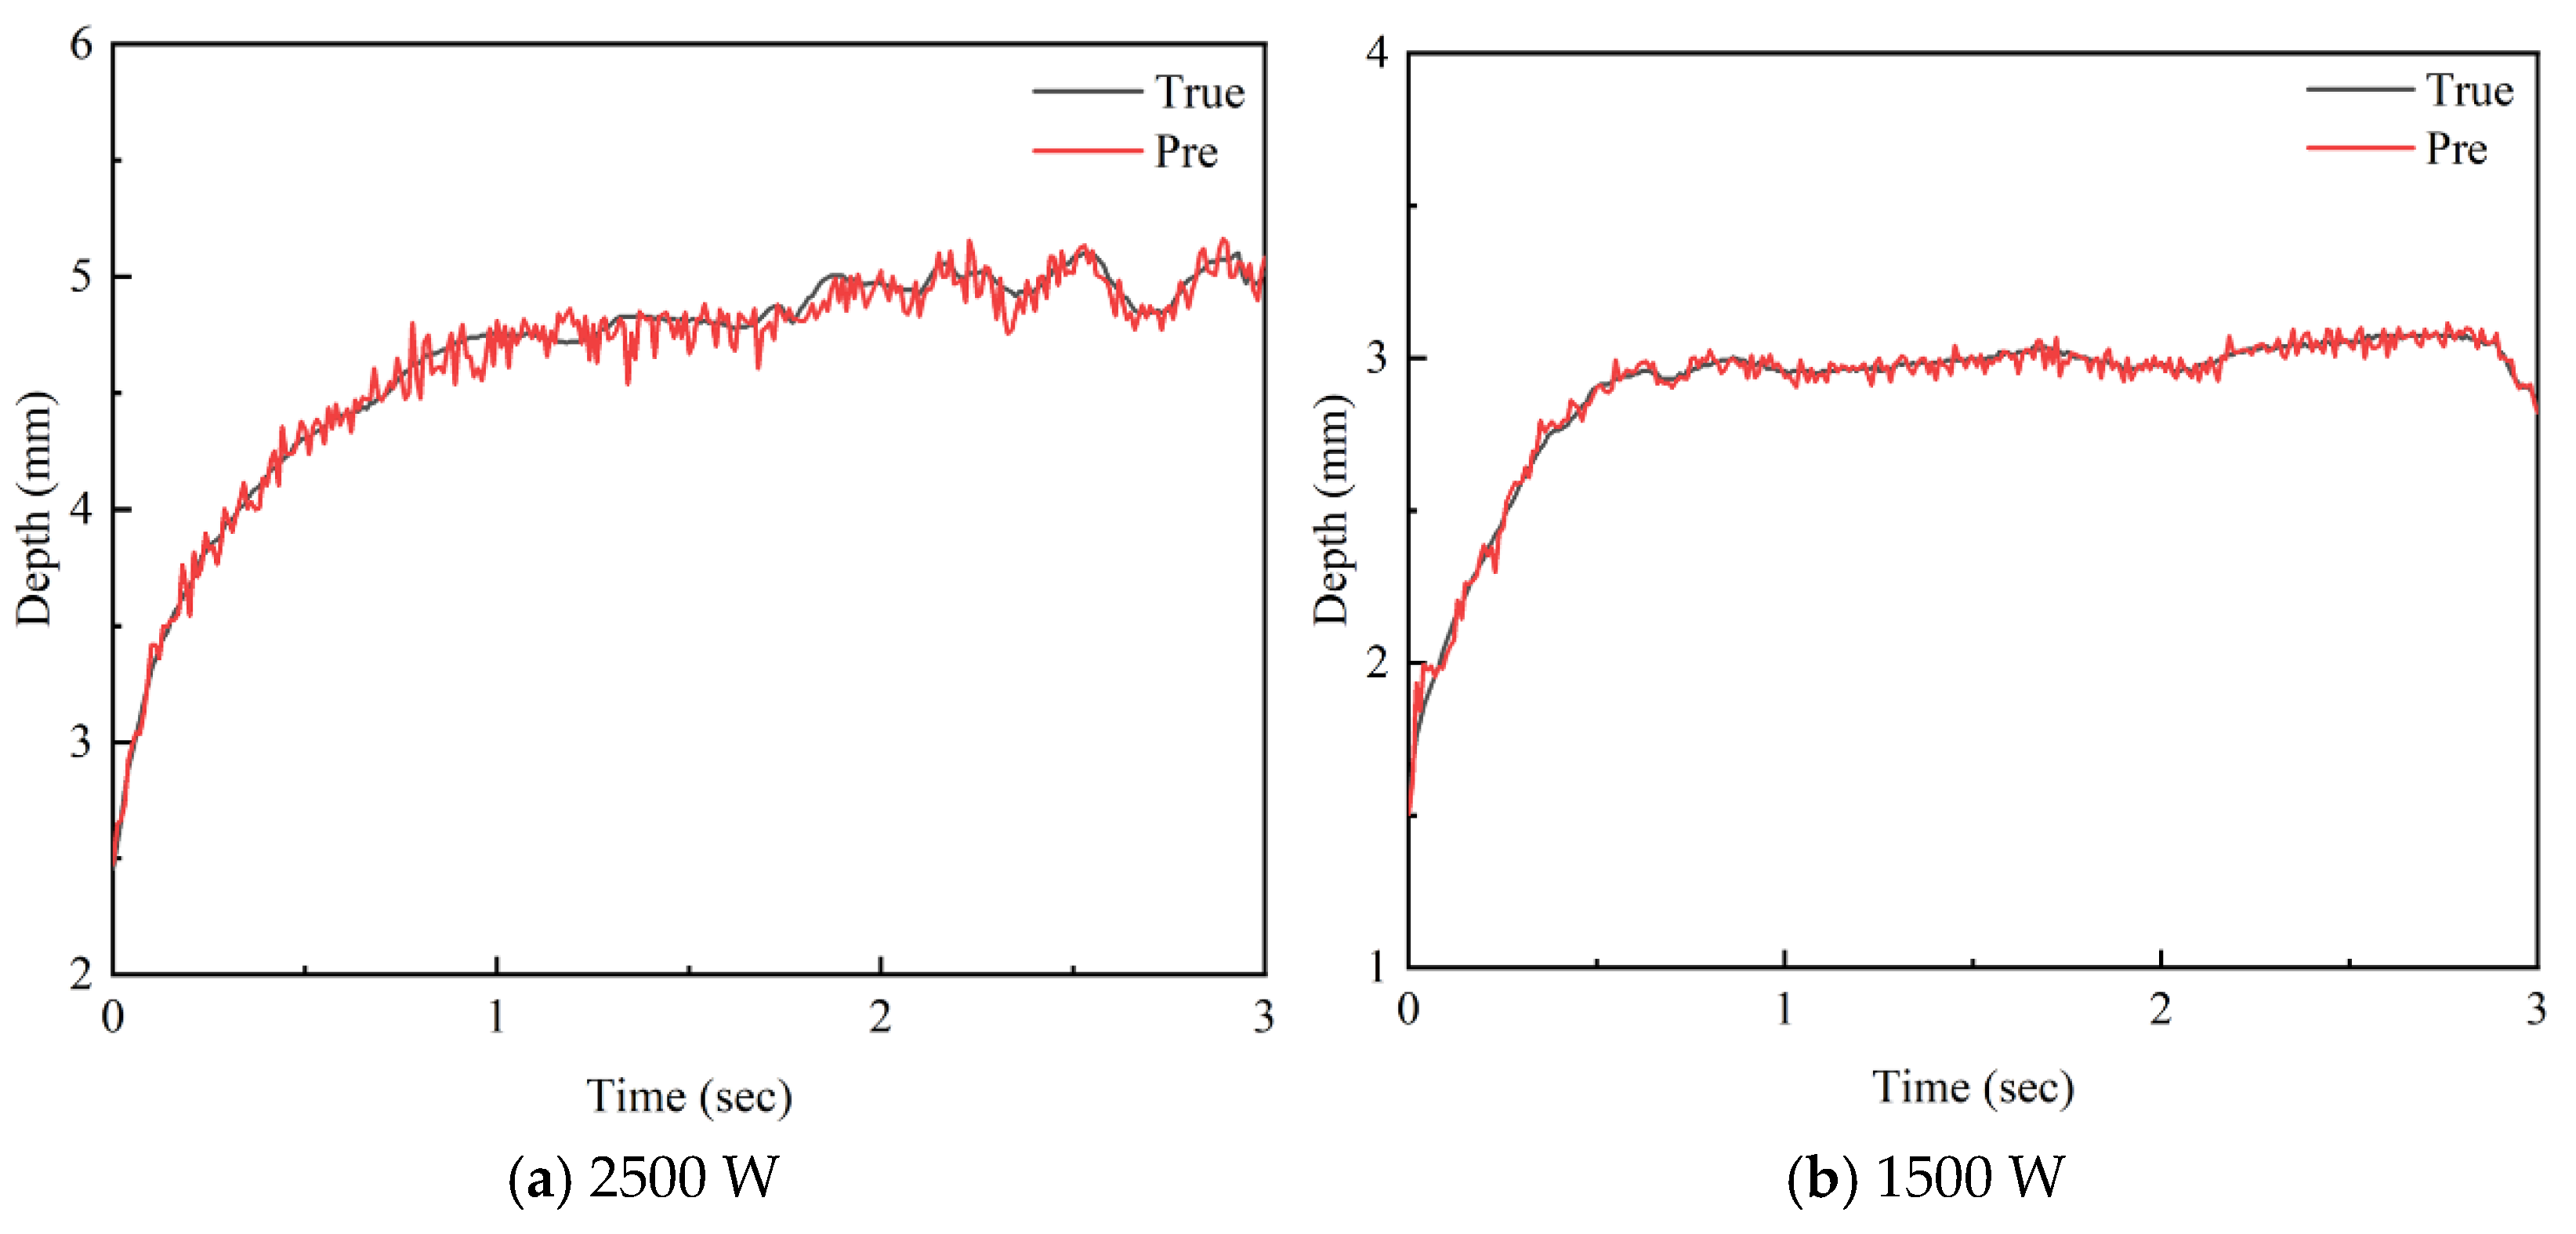
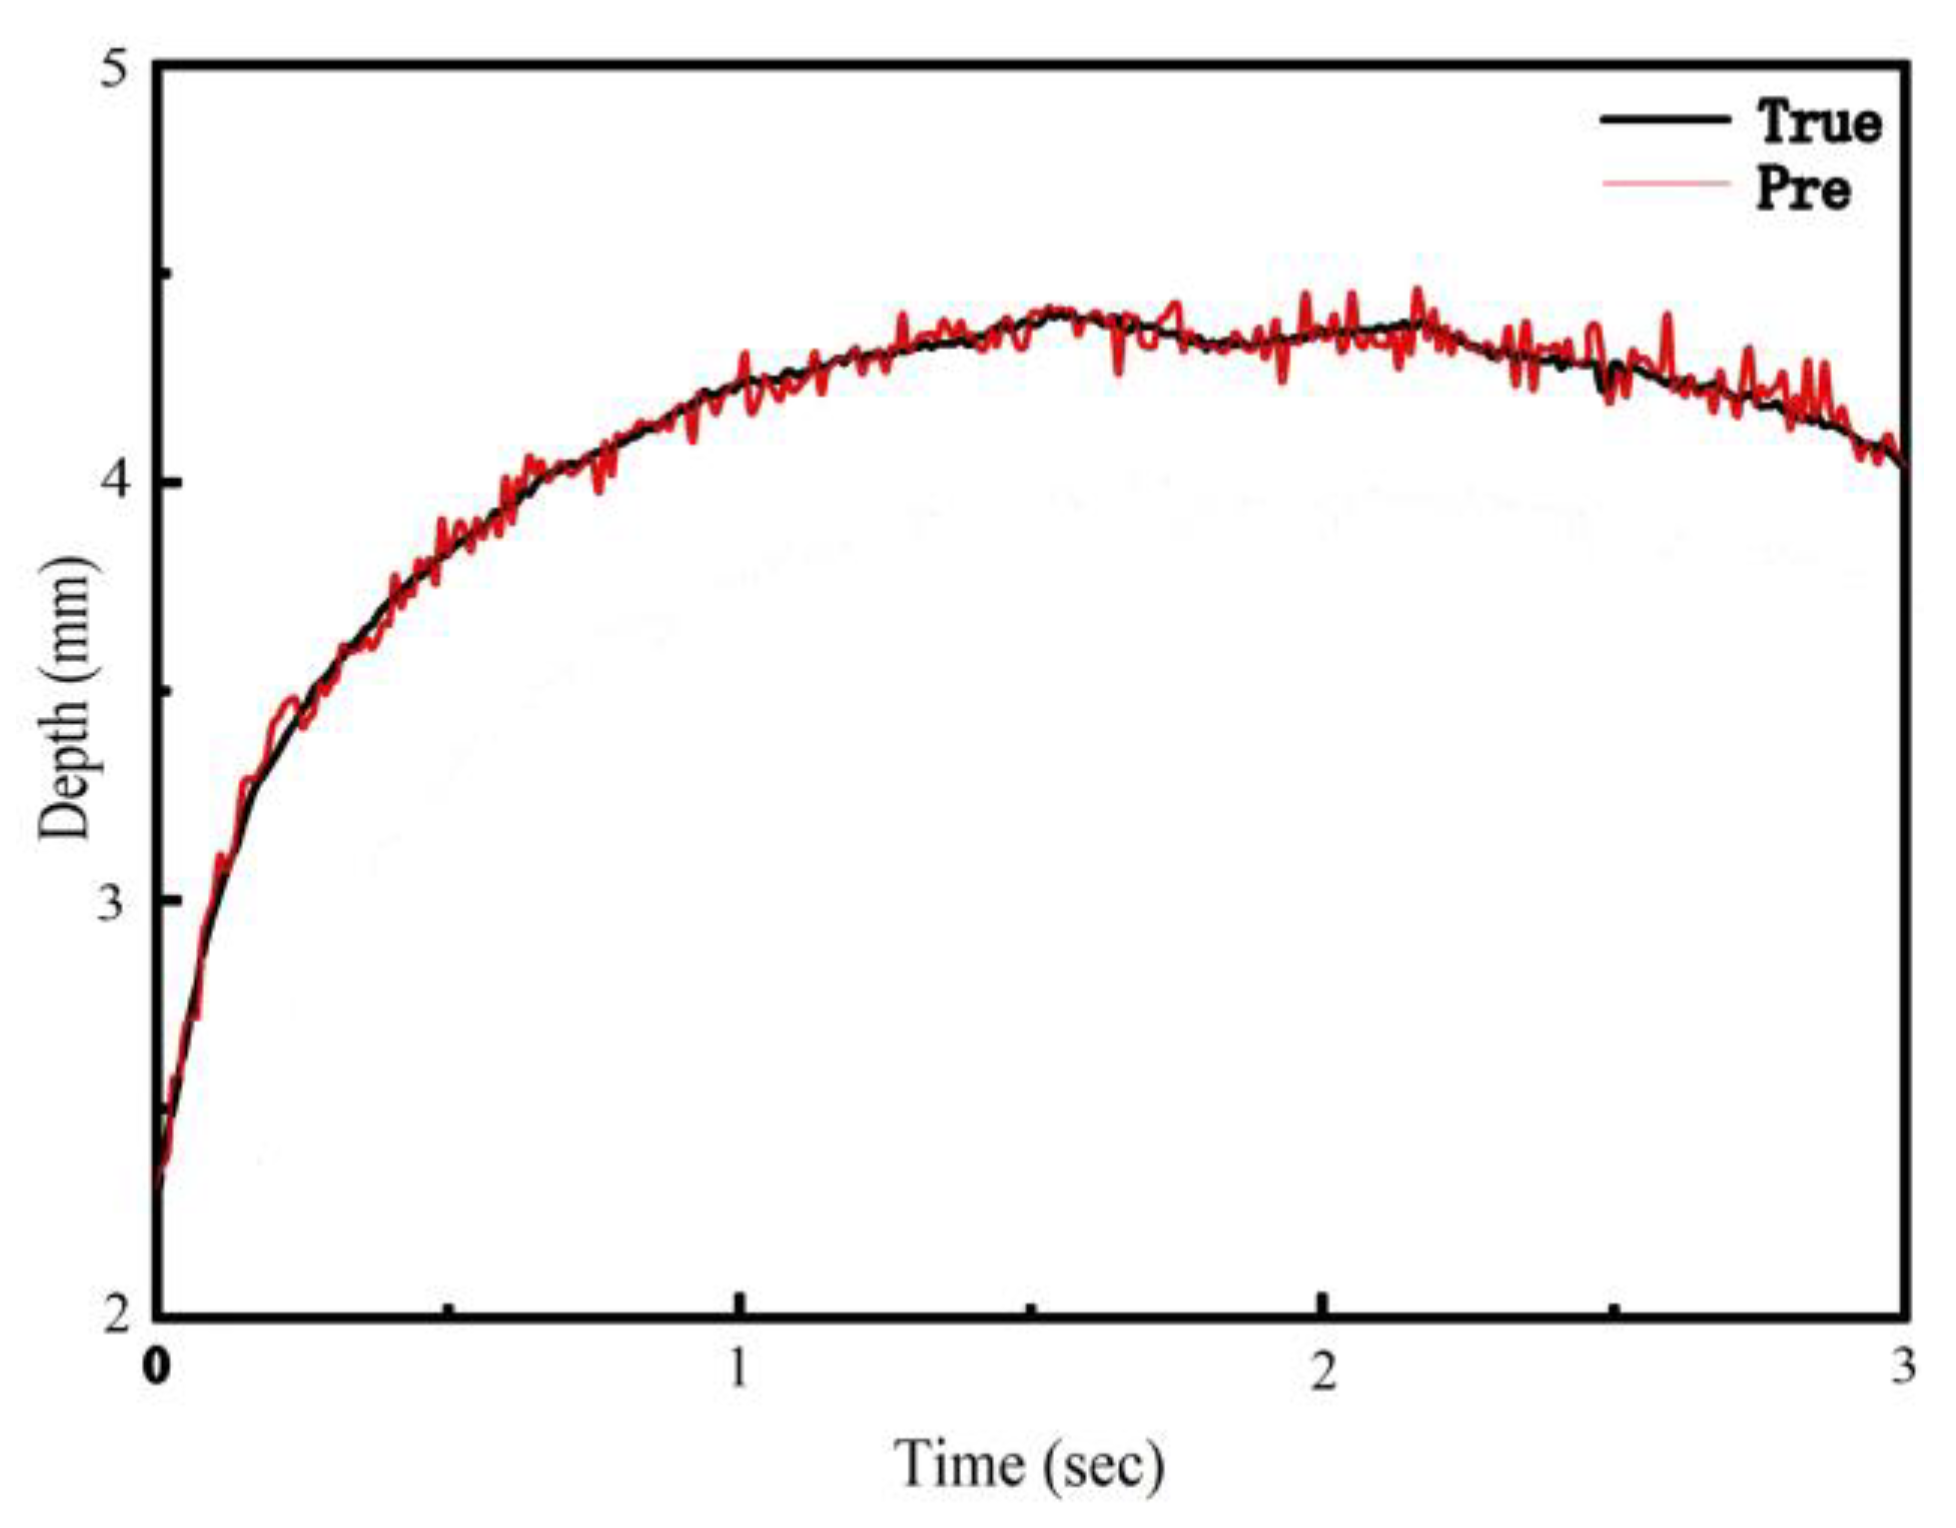
5.2.3. Prediction Results Analysis

When plasma spectral data with a laser power of 2000 W were put into the model, the corresponding hole depth prediction values were obtained. As shown in Figure 15, we present the predicted results of the training data using 1500 W and 2500 W laser power. It is evident that within the first 0.5 s, the predicted curve closely matches the actual observed curve. However, as the welding process progresses, the predicted curve begins to oscillate. The oscillation intensity of the curve increases significantly with the increase in laser power.
To further verify the model’s predictive ability, the data at 2000 W were used to predict the keyhole depth. As shown in Figure 16, the predicted results for the keyhole depth under 2000 W plasma spectroscopy are presented. From the figure, it is obvious that the predicted keyhole depth is very close to the actual value. During the initial welding stage, the predicted keyhole depth curve almost coincides with the actual depth. However, as the welding process continues, the predicted curve starts to show small, unstable fluctuations.
Table 6 presents the statistical results of keyhole depth prediction at different powers. The trained LSTM model effectively predicts the keyhole depth. For the 2000 W parameters, the prediction error between the predicted and actual values is 2.45%. However, as the power increases, the instability of the keyhole increases, which leads to an increase in prediction error.
In Table 6, comparing the average values of the actual keyhole depth and the predicted depth, the results show that the LSTM prediction model has an average prediction error of 2.31%. As the laser power increases, the prediction error using the LSTM model gradually increases.
In conclusion, the combination of coaxially acquired plasma spectral signals, Boltzmann-based plasma temperature analysis, and the LSTM time-series prediction model enables the highly accurate and robust prediction of keyhole depth during laser deep penetration welding. The proposed LSTM-based model leverages its capability to capture long-term dependencies in sequential data, enabling it to learn the temporal evolution of plasma temperature and its influence on keyhole depth. Compared to traditional machine learning methods or vision-based monitoring approaches used in prior studies, such as in Refs. [13,14,21], this method does not require expensive imaging systems or manual feature engineering, and it performs better under conditions of intense arc light and metal vapor interference. Moreover, the model achieves lower prediction error and better stability across different laser power levels, showing an average relative error of just 2.31%, which is a notable improvement in prediction accuracy.

6. Conclusions

This study proposes a keyhole depth prediction model based on LSTM networks using an in situ optical information coaxial acquisition system. The results of this study are of great significance for optimizing welding parameters and improving welding quality.
(1)
The LDD-600 coaxial CCD camera system was used to acquire the real-time optical information of the plasma. The analysis showed that the spectral characteristics of the plasma are closely related to changes in keyhole depth.
(2)
The relationship between plasma optical information and keyhole depth was used to train an LSTM-based prediction model. The model successfully predicted the weld penetration at 2000 W and 10 mm/s, with a prediction error of 2.45%. The average relative error between the predicted and actual values was 2.31%.
(3)
Several sources of uncertainty exist in the experimental process. Plasma spectral data may be affected by noise and environmental variation, though shielding and averaging were used to minimize this. The Boltzmann plot method introduces estimation uncertainty in plasma temperature, primarily due to line intensity fluctuation and fitting error. The metallographic measurements of keyhole depth may be affected by thresholding and image resolution. The LSTM model shows low prediction error (MAPE: 2.45%) but slight oscillations appear as laser power increases due to keyhole instability. Future work will explore advanced uncertainty quantification techniques to further enhance model robustness.

Author Contributions

Conceptualization, Y.G.; methodology, Y.L.; software, D.T.; validation, D.T.; data curation, H.P.; writing—original draft preparation, Y.L.; writing—review and editing, H.Z.; visualization, H.P.; supervision, H.Z.; project administration, Y.G. and H.Z.; funding acquisition, Y.G. All authors have read and agreed to the published version of the manuscript.

Funding

This work was supported by the National Key Research and Development Program of China (2024YFB4709401) and the Engineering Research Center of Micro–Nano and Intelligent Manufacturing, Ministry of Education (No. WZG-202512).

Data Availability Statement

The data presented in this study are available on request from the corresponding author (the data are not publicly available due to privacy or ethical restrictions).

Conflicts of Interest

Author Yunqian Li was employed by the School of Mechanical and Automotive Engineering, Shanghai University of Engineering Science. Author Yanfeng Gao was employed by the School of Mechanical and Automotive Engineering, Shanghai University of Engineering Science. Author Hao Pan was employed by the company Engineering Research Center of Micro-Nano and Intelligent Manufacturing, Ministry of Education. Author Donglin Tao was employed by the School of Mechanical and Automotive Engineering, Shanghai University of Engineering Science. Author Hua Zhang was employed by the School of Mechanical and Automotive Engineering, Shanghai University of Engineering Science. The remaining authors declare that the research was conducted in the absence of any commercial or financial relationships that could be construed as a potential conflict of interest.

References

  1. Quazi, M.; Ishak, M.; Fazal, M.; Arslan, A.; Rubaiee, S.; Qaban, A.; Aiman, M.; Sultan, T.; Ali, M.; Manladan, S. Current research and development status of dissimilar materials laser welding of titanium and its alloys. Opt. Laser Technol. 2020, 126, 106090. [Google Scholar] [CrossRef]
  2. Verma, J.; Taiwade, R.V. Effect of welding processes and conditions on the microstructure, mechanical properties and corrosion resistance of duplex stainless steel weldments—A review. J. Manuf. Process. 2017, 25, 134–152. [Google Scholar] [CrossRef]
  3. Auwal, S.; Ramesh, S.; Yusof, F.; Manladan, S.M. A review on laser beam welding of titanium alloys. Int. J. Adv. Manuf. Technol. 2018, 97, 1071–1098. [Google Scholar] [CrossRef]
  4. Paranthaman, V.; Dhinakaran, V.; Sai, M.S.; Devaraju, A. A systematic review of fatigue behaviour of laser welding titanium alloys. Mater. Today Proc. 2021, 39, 520–523. [Google Scholar] [CrossRef]
  5. Zou, S.; Wang, Z.; Hu, S.; Wang, W.; Cao, Y. Control of weld penetration depth using relative fluctuation coefficient as feedback. J. Intell. Manuf. 2020, 31, 1203–1213. [Google Scholar] [CrossRef]
  6. Ma, Z.-X.; Cheng, P.-X.; Ning, J.; Zhang, L.-J.; Na, S.-J. Innovations in monitoring, control and design of laser and laser-arc hybrid welding processes. Metals 2021, 11, 1910. [Google Scholar] [CrossRef]
  7. Zhang, Y.; Zhang, C.; Tan, L.; Li, S. Coaxial monitoring of the fibre laser lap welding of Zn-coated steel sheets using an auxiliary illuminant. Opt. Laser Technol. 2013, 50, 167–175. [Google Scholar] [CrossRef]
  8. Fabbro, R. Depth dependence and keyhole stability at threshold, for different laser welding regimes. Appl. Sci. 2020, 10, 1487. [Google Scholar] [CrossRef]
  9. Fabbro, R. Melt pool and keyhole behaviour analysis for deep penetration laser welding. J. Phys. D Appl. Phys. 2010, 43, 445501. [Google Scholar] [CrossRef]
  10. Kaufmann, F.; Forster, C.; Hummel, M.; Olowinsky, A.; Beckmann, F.; Moosmann, J.; Roth, S.; Schmidt, M. Characterization of vapor capillary geometry in laser beam welding of copper with 515 nm and 1030 nm laser beam sources by means of in situ synchrotron X-ray imaging. Metals 2023, 13, 135. [Google Scholar] [CrossRef]
  11. Fan, X.A.; Gao, X.; Liu, G.; Ma, N.; Zhang, Y. Research and prospect of welding monitoring technology based on machine vision. Int. J. Adv. Manuf. Technol. 2021, 115, 3365–3391. [Google Scholar] [CrossRef]
  12. Luo, M.; Shin, Y.C. Vision-based weld pool boundary extraction and width measurement during keyhole fiber laser welding. Opt. Lasers Eng. 2015, 64, 59–70. [Google Scholar] [CrossRef]
  13. Zhang, R.; Tang, X.; Xu, L.; Lu, F.; Cui, H. Study of molten pool dynamics and porosity formation mechanism in full penetration fiber laser welding of Al-alloy. Int. J. Heat Mass Transf. 2020, 148, 119089. [Google Scholar] [CrossRef]
  14. Sokolov, M.; Franciosa, P.; Sun, T.; Ceglarek, D.; Dimatteo, V.; Ascari, A.; Fortunato, A.; Nagel, F. Applying optical coherence tomography for weld depth monitoring in remote laser welding of automotive battery tab connectors. J. Laser Appl. 2021, 33, 012028. [Google Scholar] [CrossRef]
  15. Schmoeller, M.; Weiss, T.; Goetz, K.; Stadter, C.; Bernauer, C.; Zaeh, M.F. Inline weld depth evaluation and control based on OCT keyhole depth measurement and fuzzy control. Processes 2022, 10, 1422. [Google Scholar] [CrossRef]
  16. Patterson, T.; Panton, B.; Lippold, J. Analysis of the laser welding keyhole using inline coherent imaging. J. Manuf. Process. 2022, 82, 601–614. [Google Scholar] [CrossRef]
  17. You, D.; Gao, X.; Katayama, S. Review of laser welding monitoring. Sci. Technol. Weld. Join. 2014, 19, 181–201. [Google Scholar] [CrossRef]
  18. Liu, L.; Huang, R.; Song, G.; Hao, X. Behavior and spectrum analysis of welding arc in low-power YAG-laser–MAG hybrid-welding process. IEEE Trans. Plasma Sci. 2008, 36, 1937–1943. [Google Scholar] [CrossRef]
  19. She, K.; Li, D.; Yang, K.; Li, M.; Wu, B.; Yang, L.; Huang, Y. Online detection of laser welding penetration depth based on multi-sensor features. Materials 2024, 17, 1580. [Google Scholar] [CrossRef]
  20. Sibillano, T.; Ancona, A.; Berardi, V.; Lugara, P.M. Real-time monitoring of laser welding by correlation analysis: The case of AA5083. Opt. Lasers Eng. 2007, 45, 1005–1009. [Google Scholar] [CrossRef]
  21. Kong, F.; Ma, J.; Carlson, B.; Kovacevic, R. Real-time monitoring of laser welding of galvanized high strength steel in lap joint configuration. Opt. Laser Technol. 2012, 44, 2186–2196. [Google Scholar] [CrossRef]
  22. Garcia-Allende, P.; Mirapeix, J.; Conde, O.; Cobo, A.; López-Higuera, J. Spectral processing technique based on feature selection and artificial neural networks for arc-welding quality monitoring. Ndt E Int. 2009, 42, 56–63. [Google Scholar] [CrossRef]
  23. Schricker, K.; Schmidt, L.; Friedmann, H.; Diegel, C.; Seibold, M.; Hellwig, P.; Fröhlich, F.; Bergmann, J.P.; Nagel, F.; Kallage, P. Characterization of keyhole dynamics in laser welding of copper by means of high-speed synchrotron X-ray imaging. Procedia CIRP 2022, 111, 501–506. [Google Scholar] [CrossRef]
  24. Kohl, S.; Kaufmann, F.; Schmidt, M. Why color matters—Proposing a quantitative stability criterion for laser beam processing of metals based on their fundamental optical properties. Metals 2022, 12, 1118. [Google Scholar] [CrossRef]
  25. Cai, W.; Jiang, P.; Shu, L.; Geng, S.; Zhou, Q. Real-time monitoring of laser keyhole welding penetration state based on deep belief network. J. Manuf. Process. 2021, 72, 203–214. [Google Scholar] [CrossRef]
  26. Zhang, Y.; You, D.; Gao, X.; Zhang, N.; Gao, P.P. Welding defects detection based on deep learning with multiple optical sensors during disk laser welding of thick plates. J. Manuf. Syst. 2019, 51, 87–94. [Google Scholar] [CrossRef]
  27. Pandiyan, V.; Drissi-Daoudi, R.; Shevchik, S.; Masinelli, G.; Le-Quang, T.; Logé, R.; Wasmer, K. Semi-supervised Monitoring of Laser powder bed fusion process based on acoustic emissions. Virtual Phys. Prototyp. 2021, 16, 481–497. [Google Scholar] [CrossRef]
  28. Luo, Z.; Wu, D.; Zhang, P.; Ye, X.; Shi, H.; Cai, X.; Tian, Y. Laser welding penetration monitoring based on time-frequency characterization of acoustic emission and CNN-LSTM hybrid network. Materials 2023, 16, 1614. [Google Scholar] [CrossRef]
  29. Chokkalingham, S.; Chandrasekhar, N.; Vasudevan, M. Predicting the depth of penetration and weld bead width from the infra red thermal image of the weld pool using artificial neural network modeling. J. Intell. Manuf. 2012, 23, 1995–2001. [Google Scholar] [CrossRef]
  30. Go, B.-S.; Park, D.-M.; Bang, H.-S.; Bang, H.-S. Influence of process parameters on joint characteristics in friction stir welding of Al/Cu dissimilar materials for lithium-ion battery. Int. J. Adv. Manuf. Technol. 2024, 130, 1151–1164. [Google Scholar] [CrossRef]
  31. Kang, S.; Lee, K.; Kang, M.; Jang, Y.H.; Kim, C. Weld-penetration-depth estimation using deep learning models and multisensor signals in Al/Cu laser overlap welding. Opt. Laser Technol. 2023, 161, 109179. [Google Scholar] [CrossRef]
Figure 1. Laser keyhole welding plasma optical information coaxial acquisition system. (a) Coaxial acquisition system for optical information on plasma inside the keyhole; (b) Schematic diagram of acquisition system.
Metals 15 00527 g001
Figure 2. Raw photoelectric signal of plasma inside the keyhole under different laser power levels.
Metals 15 00527 g002
Figure 3. Plasma photoelectric signal Fourier transform results under different laser power levels.
Metals 15 00527 g003
Figure 4. Plasma photoelectric signal power spectral density under different laser power levels. (a) Plasma photoelectric signal power spectral density. (b) Locally enlarged view of the PSD characteristic peak of the photoelectric signal.
Metals 15 00527 g004
Figure 5. Plasma raw spectra inside the keyhole under different laser power levels.
Metals 15 00527 g005
Figure 6. First frame spectrum of plasma inside the keyhole.
Metals 15 00527 g006
Figure 7. Plasma intensity variation at 713 nm wavelength. (a) Temporal variation of plasma spectral intensity during the welding process. (b) Locally enlarged view of plasma intensity variation during stable phase.
Metals 15 00527 g007
Figure 8. Plasma temperature calculation steps.
Metals 15 00527 g008
Figure 9. Boltzmann plot of a single spectrum.
Metals 15 00527 g009
Figure 10. Plasma temperature variation inside the keyhole calculated using the Boltzmann plot.
Metals 15 00527 g010
Figure 11. Axial metallograph of welded joint.
Metals 15 00527 g011
Figure 12. Diagram of sectioning along the weld axis.
Metals 15 00527 g012
Figure 13. Flowchart of keyhole depth extraction.
Metals 15 00527 g013
Figure 14. Training loss curve.
Metals 15 00527 g014
Figure 15. Predicted results of the training data.
Metals 15 00527 g015
Figure 16. Predicted results of the test data.
Metals 15 00527 g016
Table 1. Experimental parameters.
Number123
Laser Power (W) 250020001500
Table 2. Chemical composition of Ti-6Al-4V titanium alloy.
MaterialsAlVCHOFeNTi
Ti-6Al-4V5.53.50.080.0150.200.400.0590.255
Table 3. Time–domain characteristics of plasma inside the keyhole.
Process ParametersAverage ValueVariance
1500 W0.610.026
2000 W0.780.030
2500 W1.010.038
Table 4. TiI spectral line parameters table.
λ
Wavelength (nm)
Ek
High Energy Level (eV)
Ei
Low Energy Level (eV)
A
Transition Probability (s−1)
gk Degeneracy
5023.320.856.43 × 10611
5194.512.123.79 × 10611
6263.421.448.36 × 1069
7141.443.184.80 × 1067
7772.500.901.40 × 1067
8440.842.311.29 × 1067
Table 5. LSTM model evaluation metrics.
Evaluation MetricsValue
R20.978
MSE0.017
RMSE0.131
MAE0.097
MAPE0.024
Table 6. Prediction results.
Process ParametersAverage True ValueAverage Predicted ValueErrorVariance of Predicted Value
1500 W2.902.931.08%0.071
2000 W4.094.192.45%0.162
2500 W4.644.803.40%0.244
Disclaimer/Publisher’s Note: The statements, opinions and data contained in all publications are solely those of the individual author(s) and contributor(s) and not of MDPI and/or the editor(s). MDPI and/or the editor(s) disclaim responsibility for any injury to people or property resulting from any ideas, methods, instructions or products referred to in the content.

