
Enhanced Corrosion Resistance of Carbon Steel Rebar in Chloride-Containing Water Solutions: The Role of Lotus Extract in Corrosion Inhibition

Abstract
1. Introduction
2. Materials and Methods
2.1. Materials
2.2. Analysis and Testing Methods
2.2.1. Composition, Structure, and Performance Analysis
2.2.2. Neutral Chloride Salt Corrosion System
2.2.3. Simulated Concrete Pore Solution Corrosion System
2.2.4. Electrochemical Testing
2.2.5. Mott–Schottky Test
3. Results
3.1. Structure and Composition Analysis of Lotus Leaf Extract
3.2. Anti-Corrosion Properties of LLE on Rebars in Neutral Chloride Salt Solutions
3.3. Anti-Corrosion Properties of LLE on Rebars in a Simulated Concrete Pore Solution
3.4. Anti-Corrosion Mechanism of LLE on Rebars in Neutral Chloride or Alkaline Chloride Solutions
4. Conclusions
- (1)
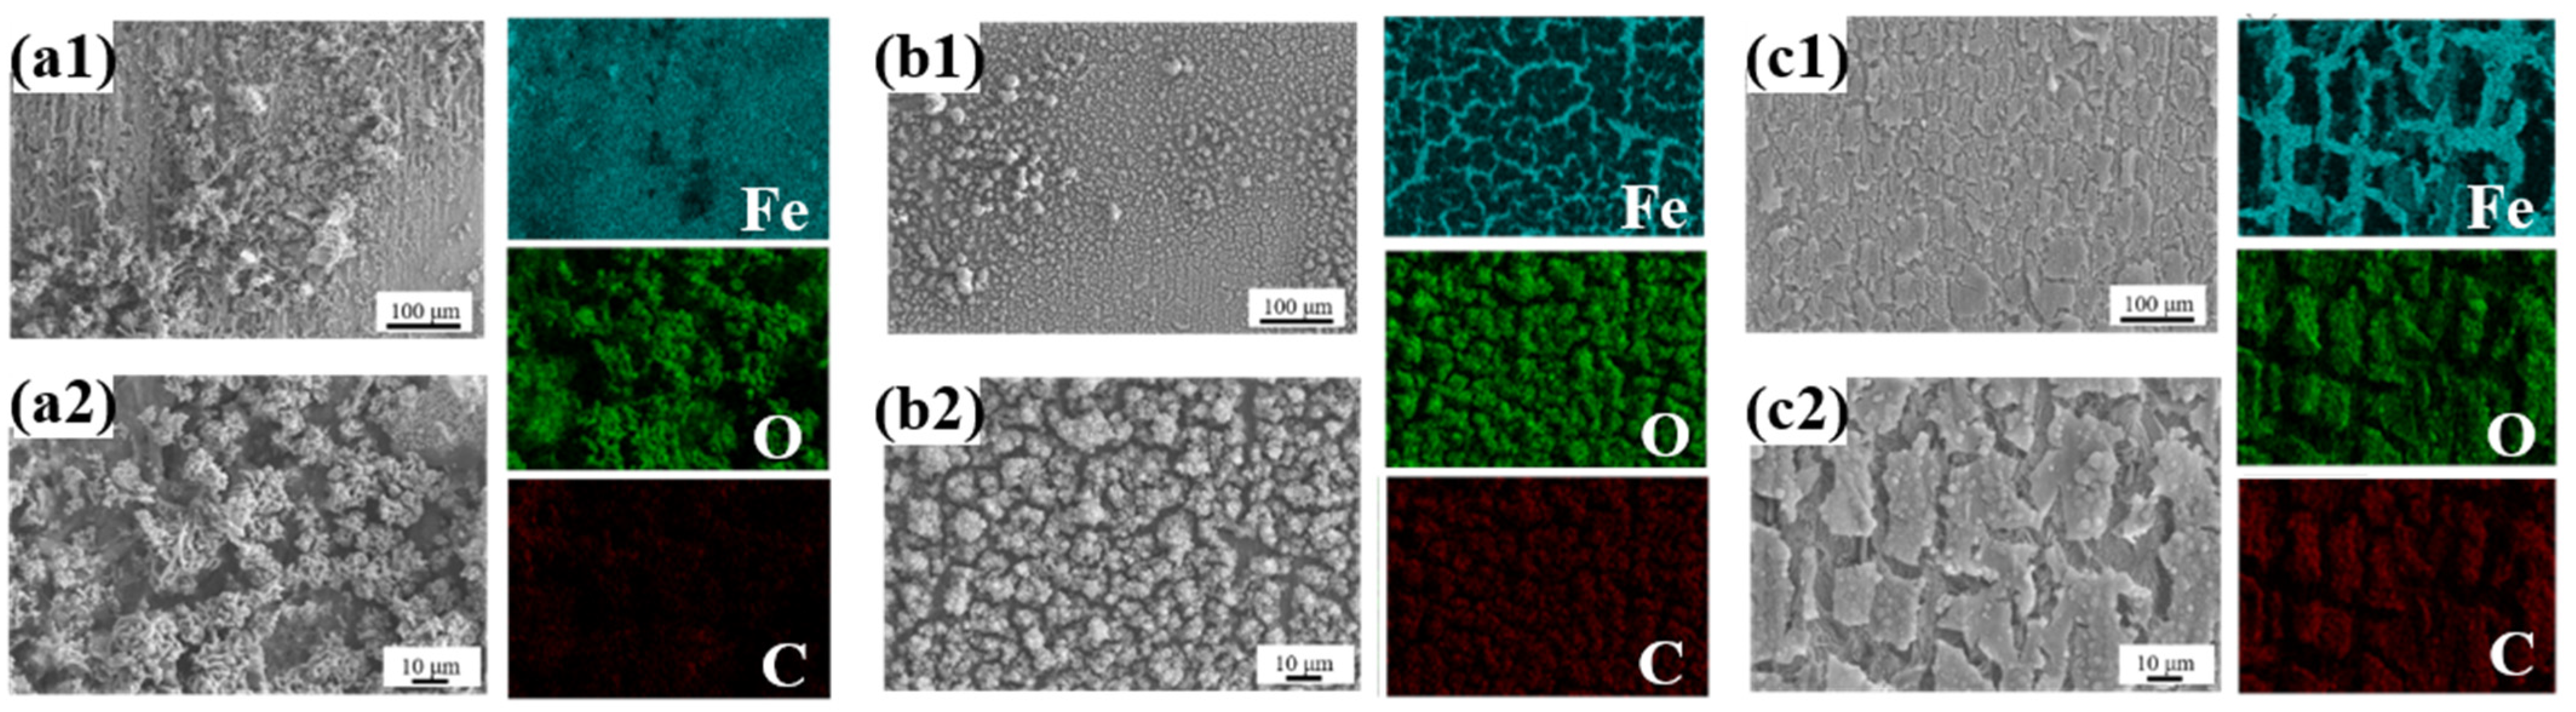
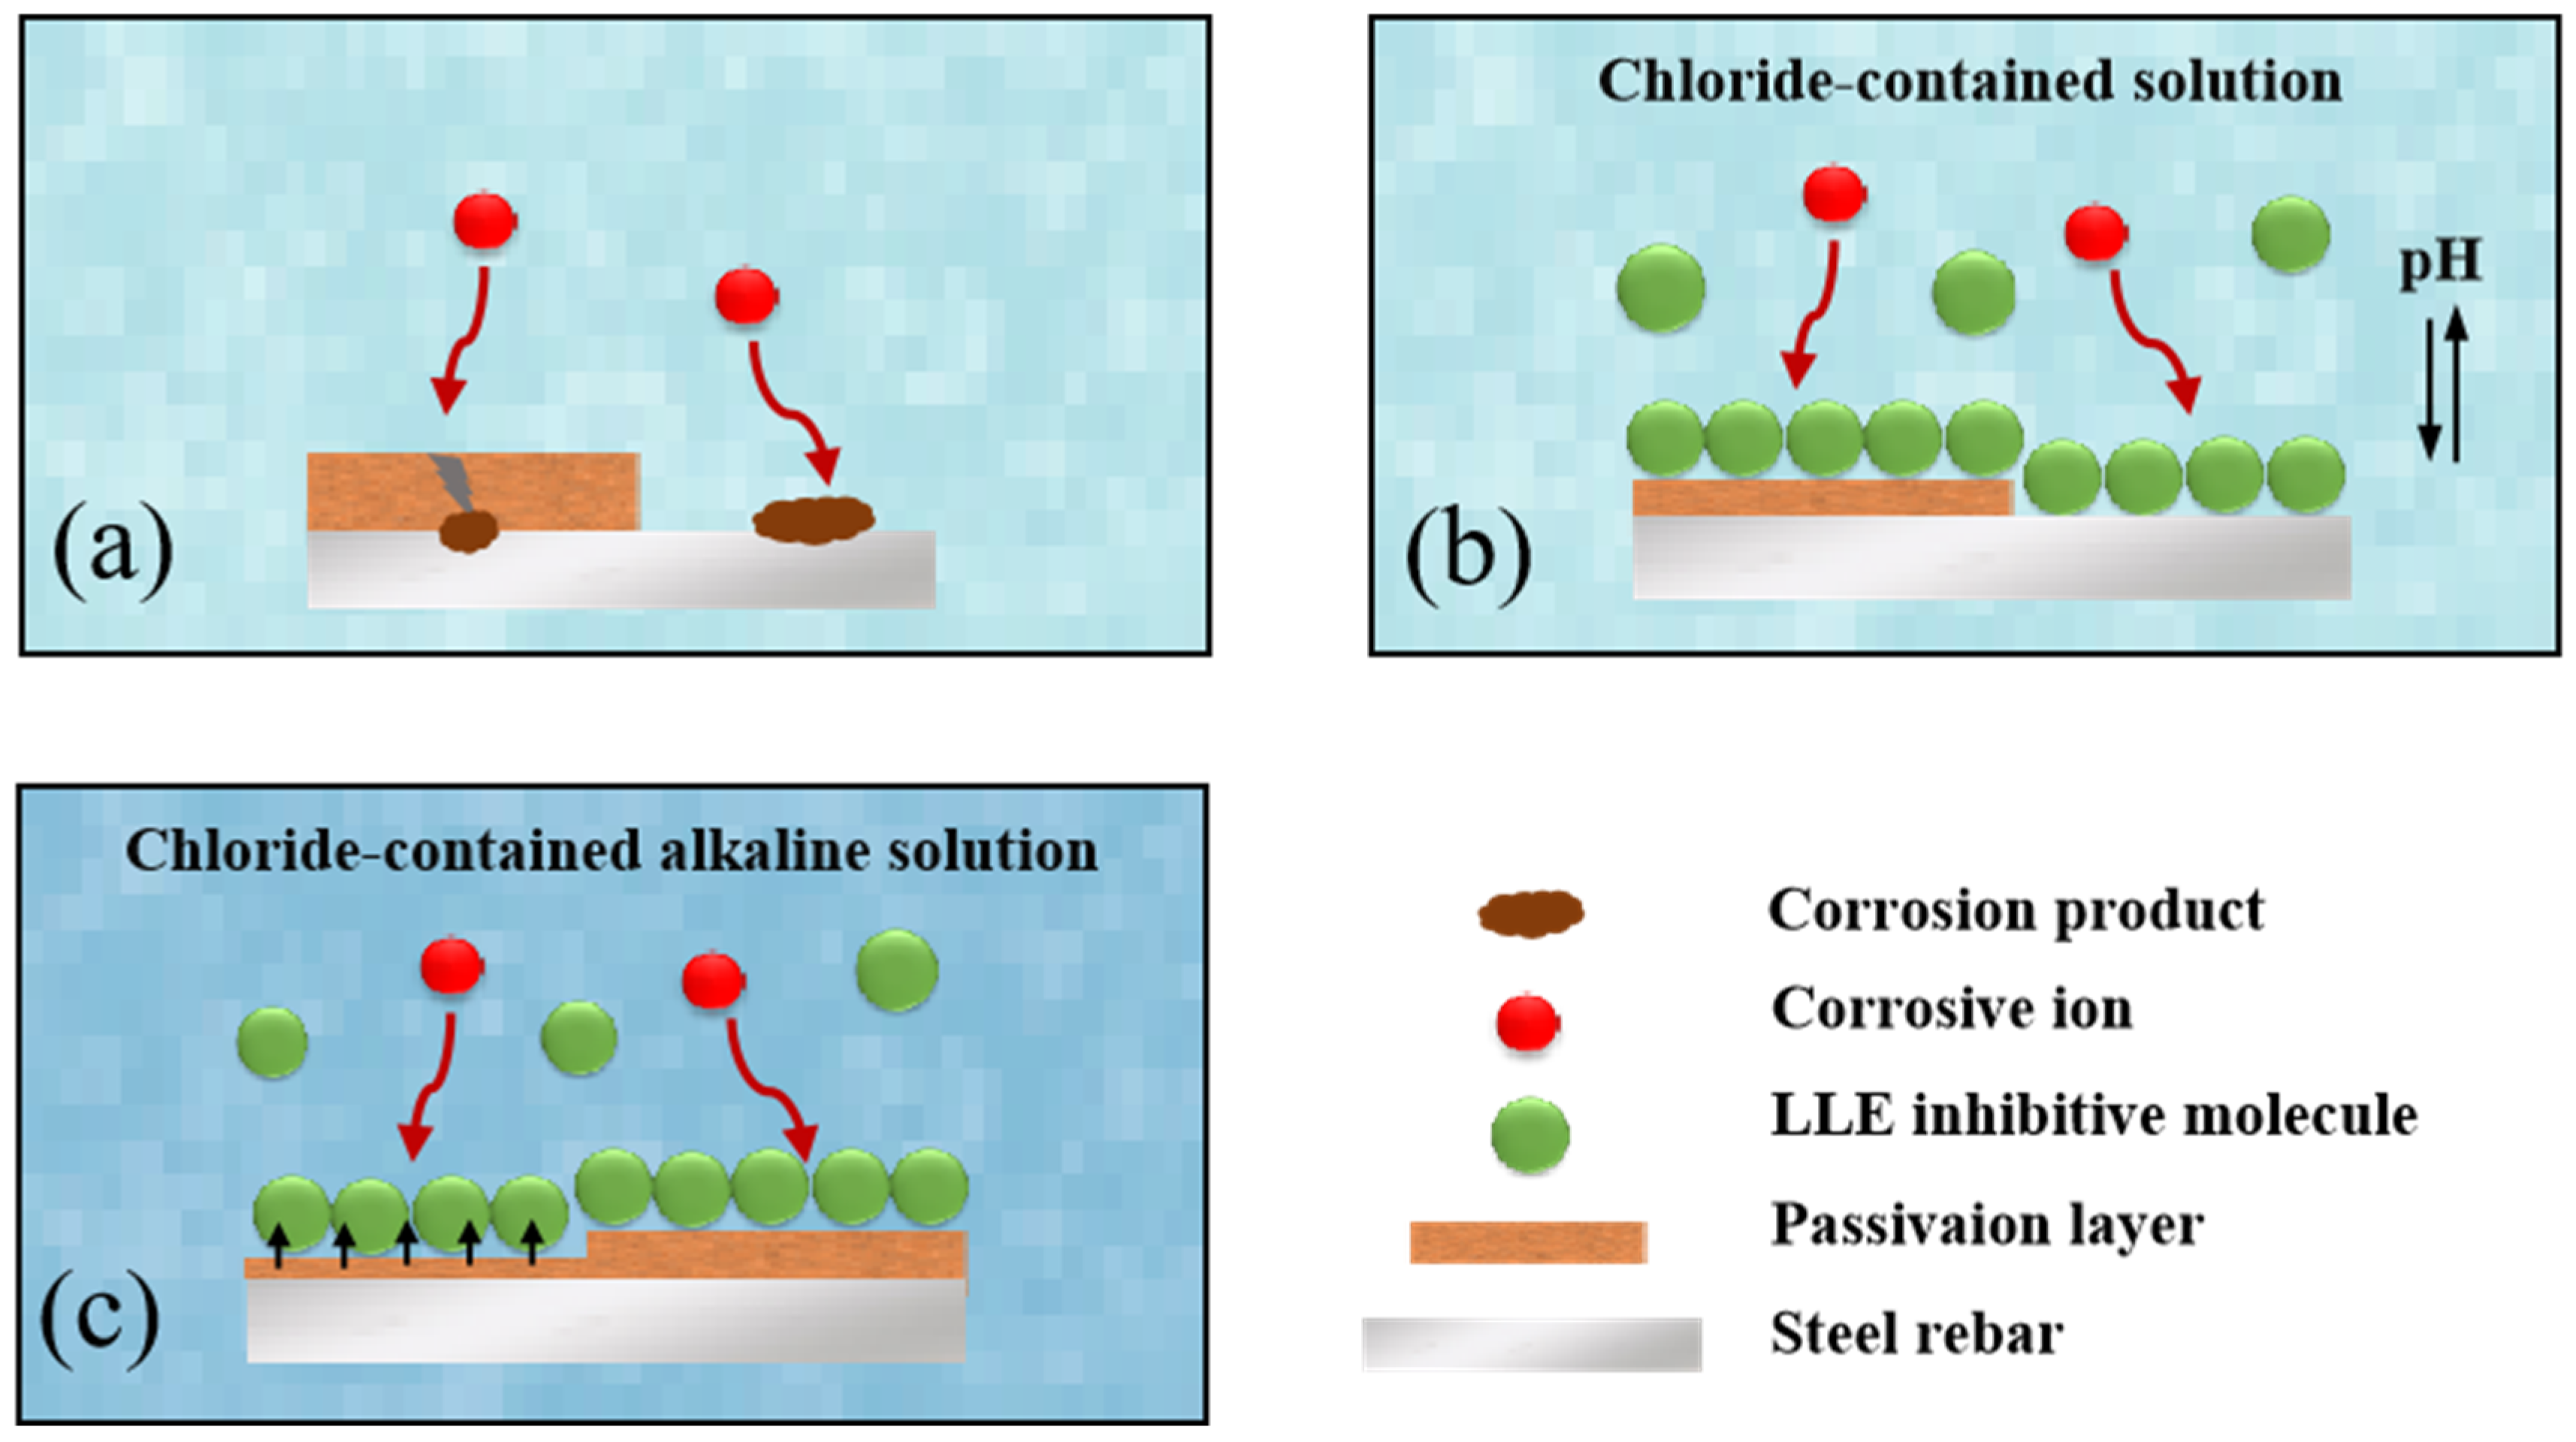
- Lotus leaf extract (LLE) is rich in polar functional groups (e.g., O-H, N-H, C=O) and heterocyclic structures, which form a protective film on the steel surface through physical adsorption and chemical chelation. Fourier-transform infrared spectroscopy (FTIR) and liquid chromatography–mass spectrometry (LC-MS) analyses revealed that LLE contains abundant alkaloids and flavonoids, which can coordinate with the 3D orbitals of iron atoms via lone pair electrons, forming a dense adsorption layer that hinders the penetration of corrosive agents (e.g., Cl−). Scanning electron microscopy (SEM) tests demonstrated that LLE forms an adsorption film on the steel surface, with higher concentrations resulting in more uniform and compact layers.
- (2)
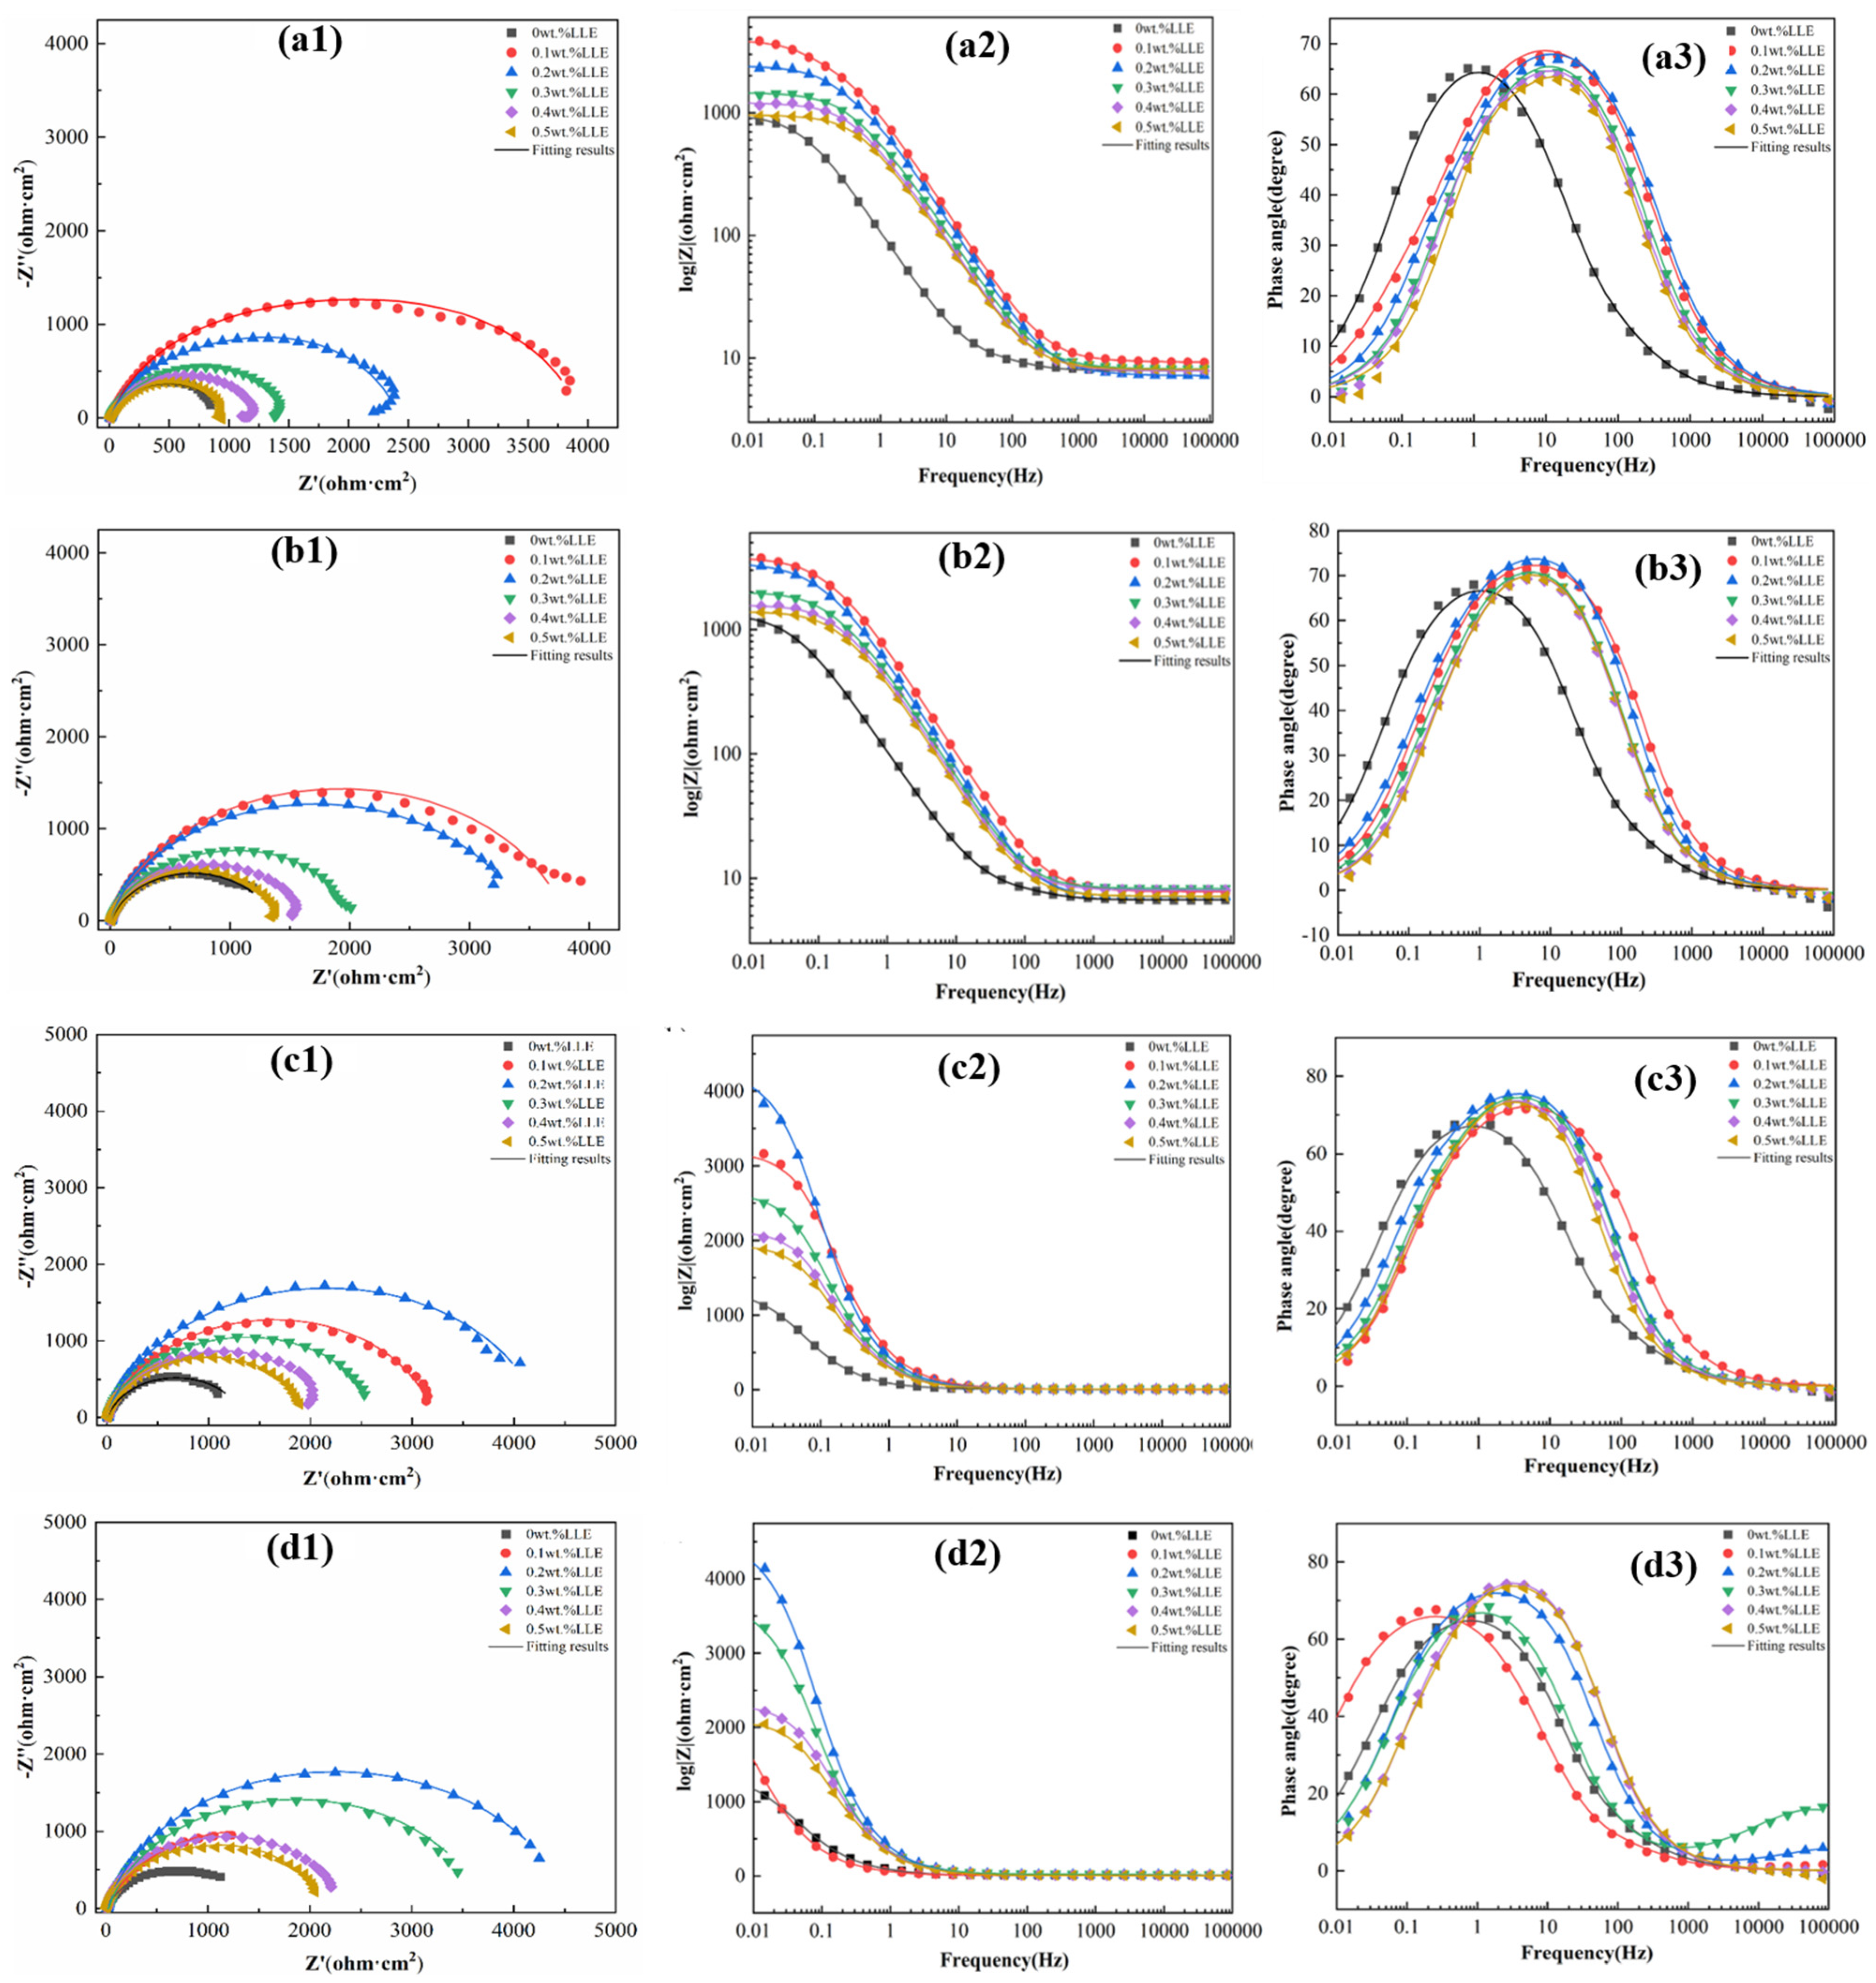
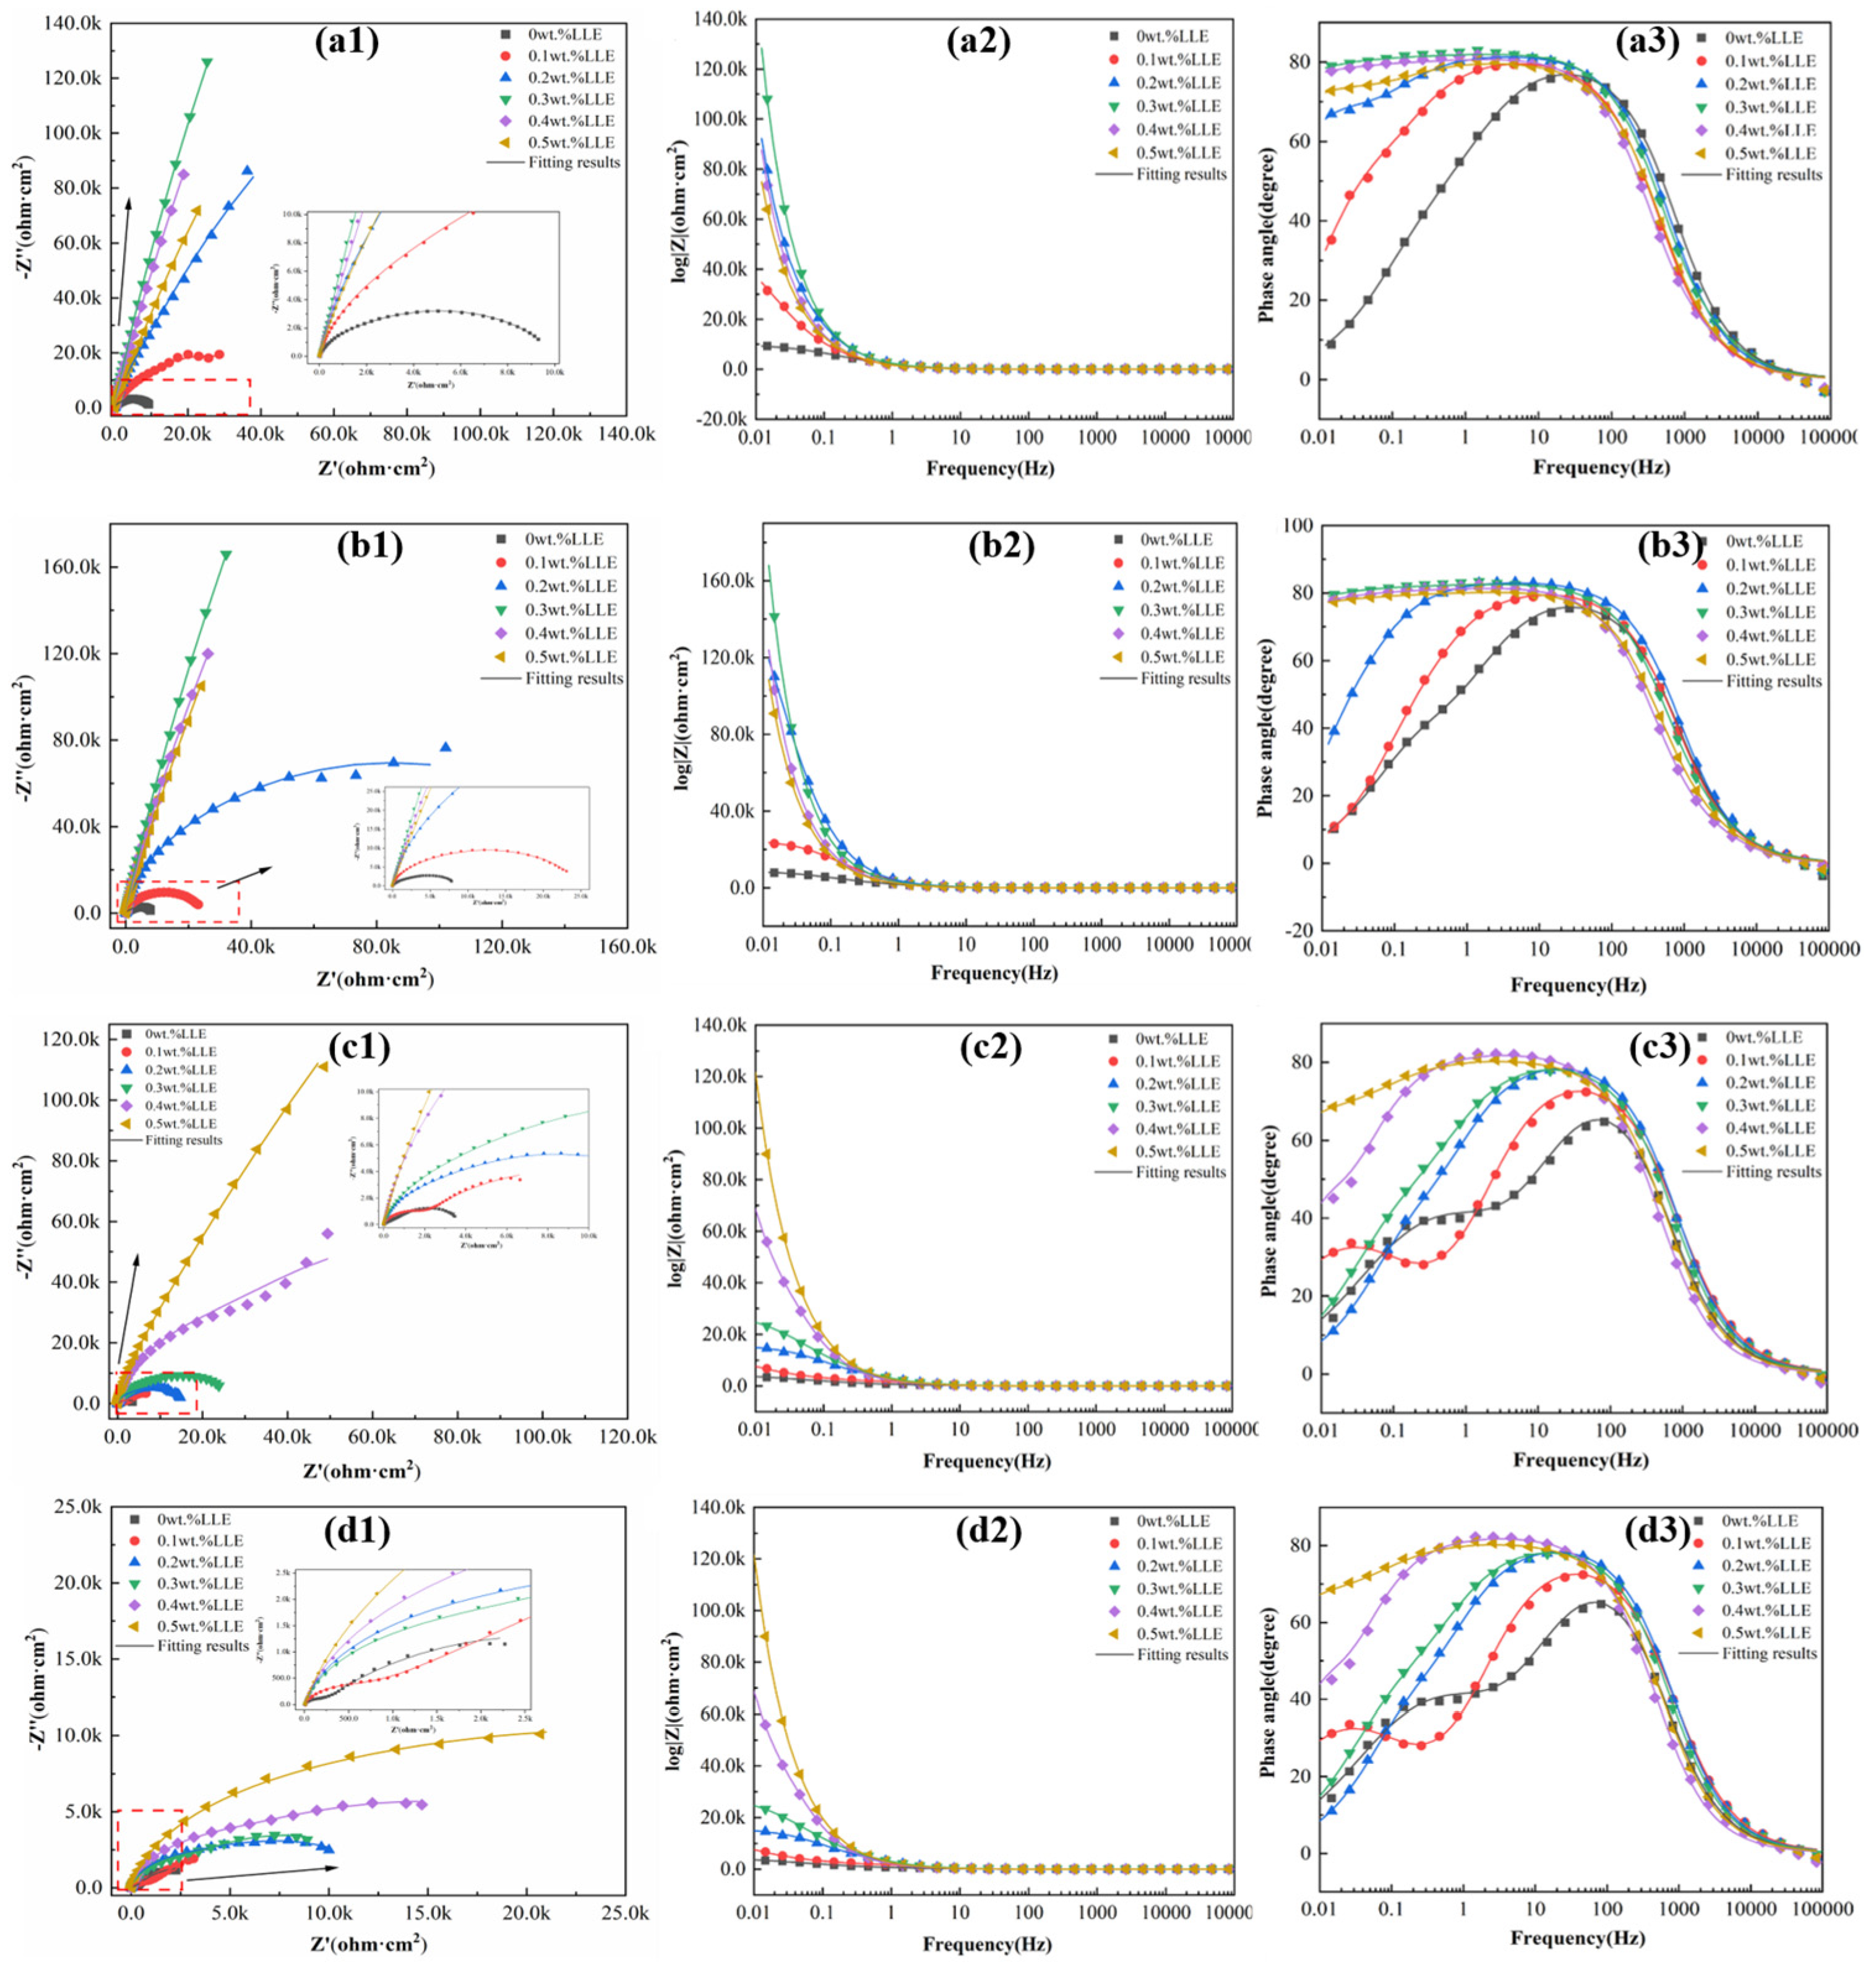
- Electrochemical impedance spectroscopy (EIS) measurements in a 3.5% NaCl solution confirmed that the adsorption film significantly increases charge transfer resistance (Rct). The corrosion inhibition performance of LLE exhibits concentration dependence, with 0.2 wt% being the optimal concentration. Although higher concentrations (e.g., 0.5 wt%) form more uniform films, the further reduction in solution pH (pH ≈ 5.04) weakens the corrosion inhibition effect, indicating that the efficiency in neutral environments is jointly regulated by pH and the quality of the adsorption film.
- (3)
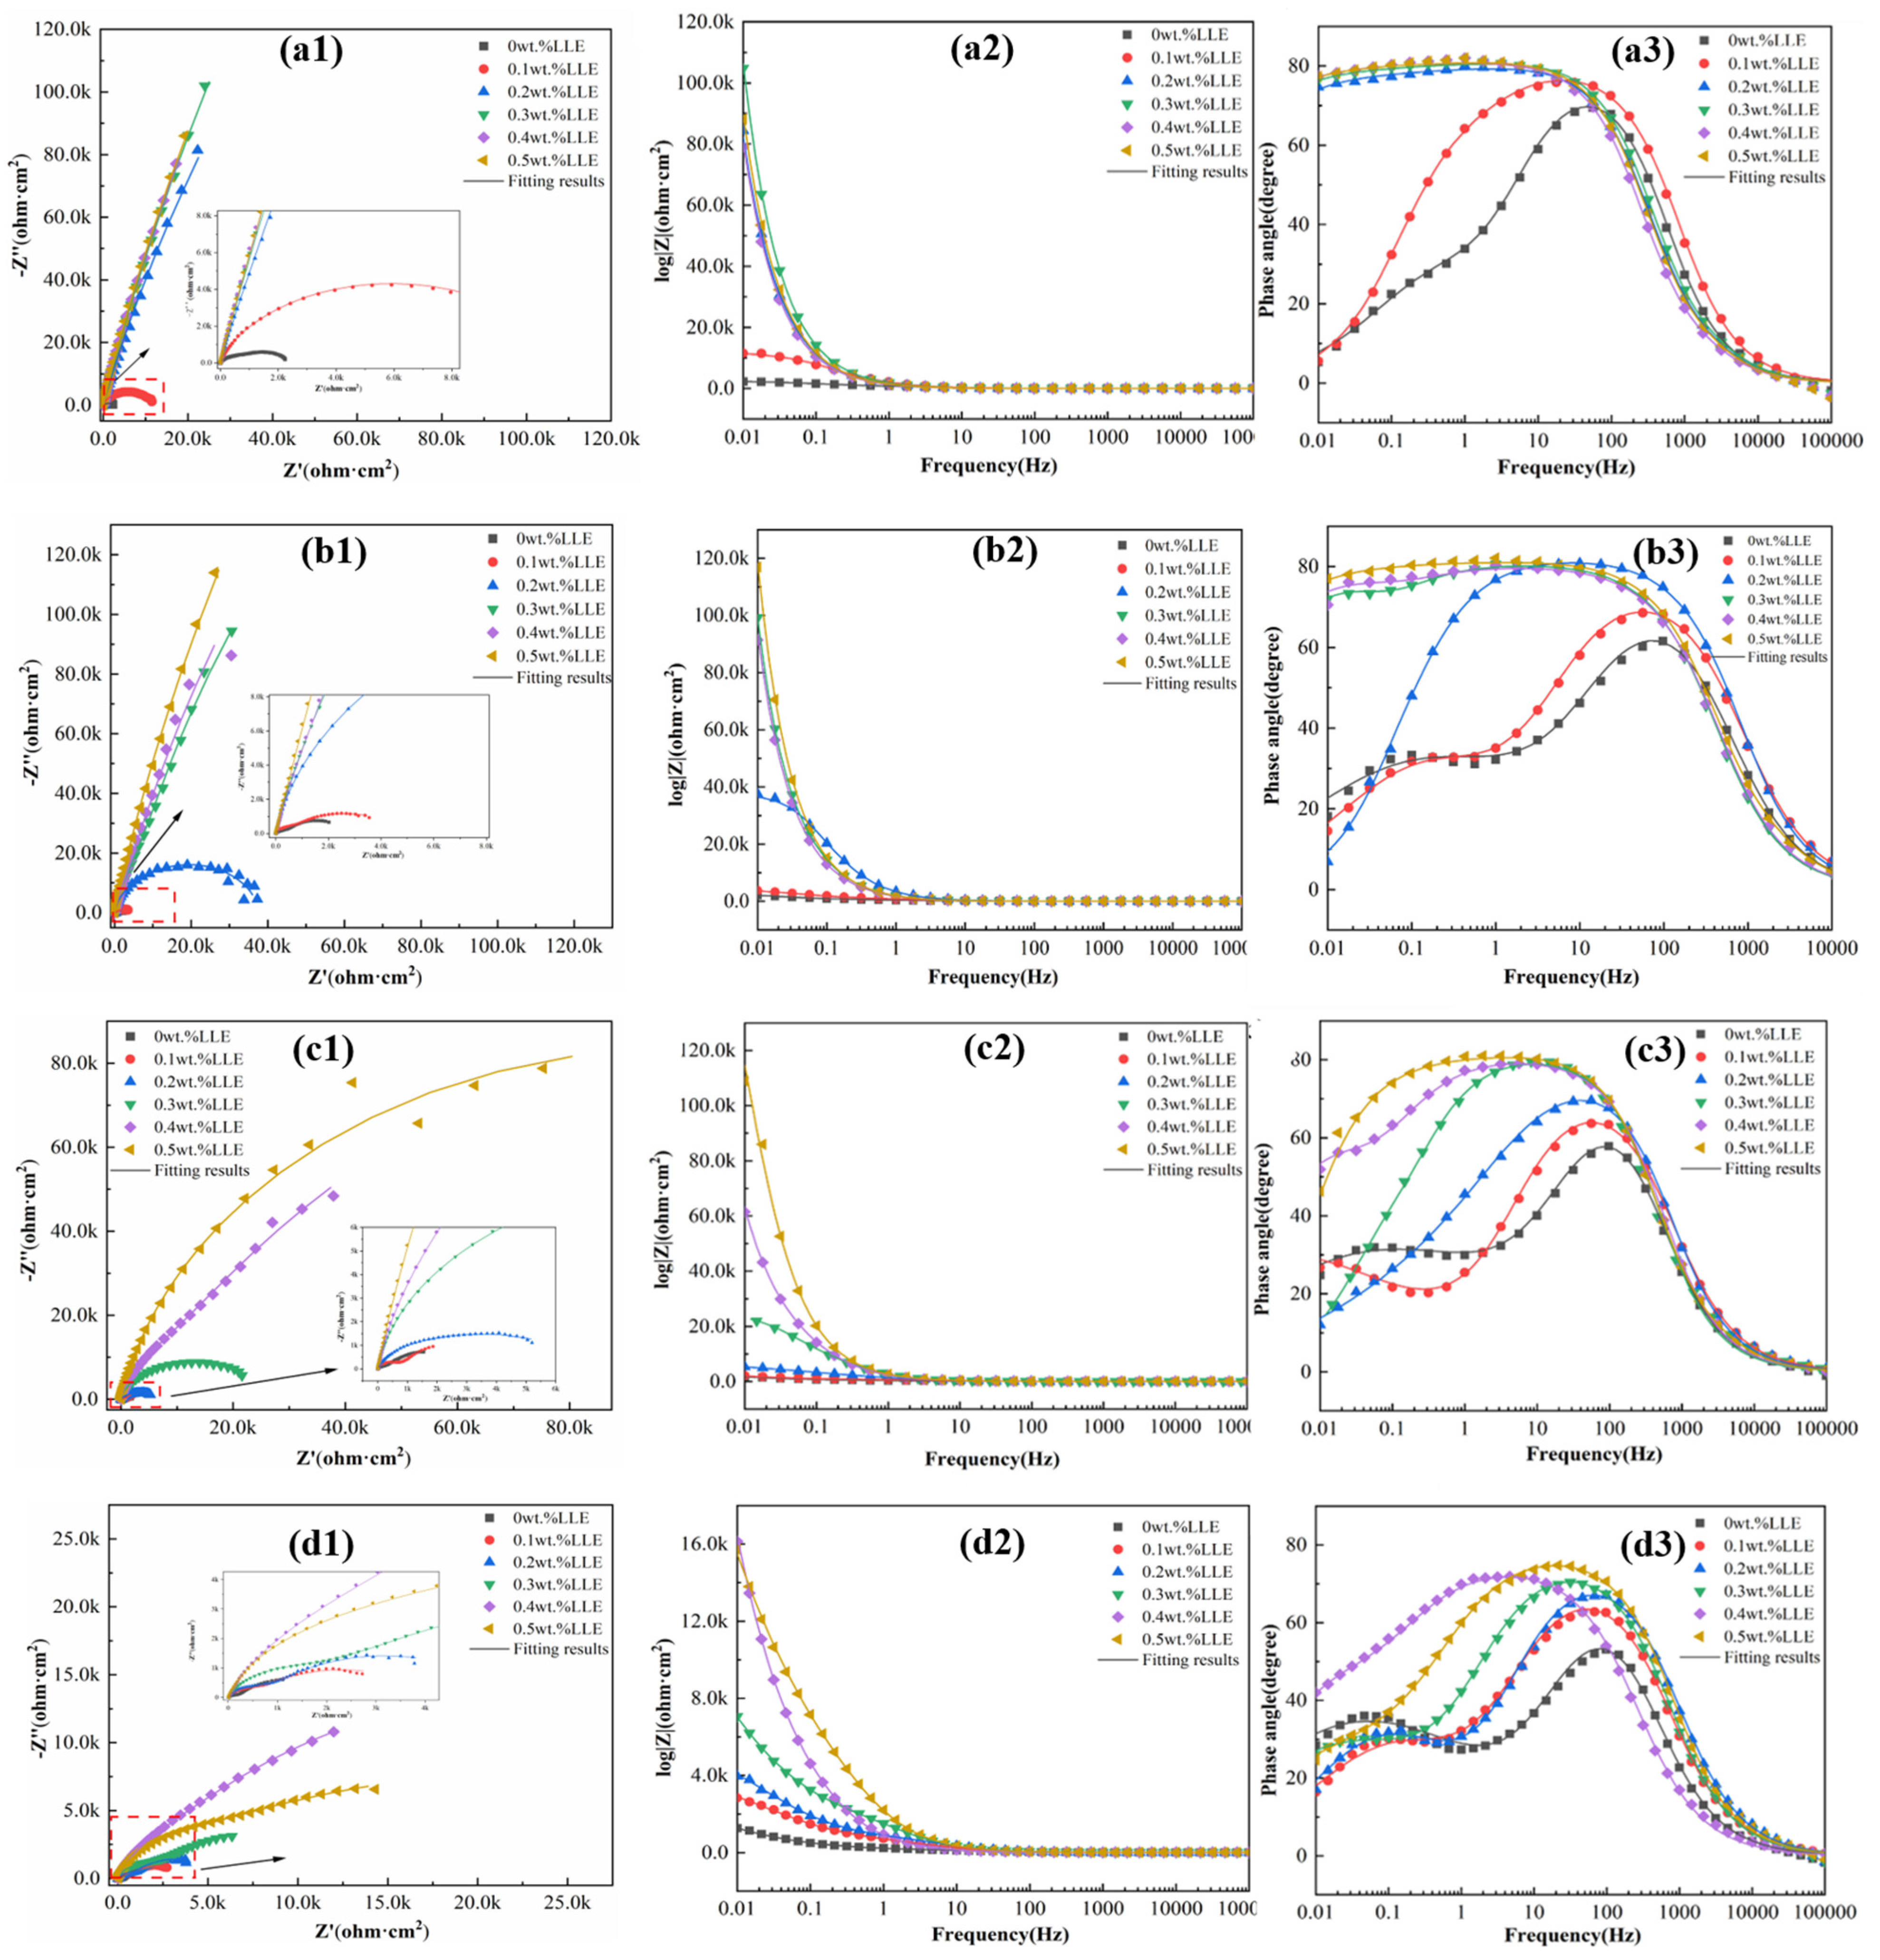
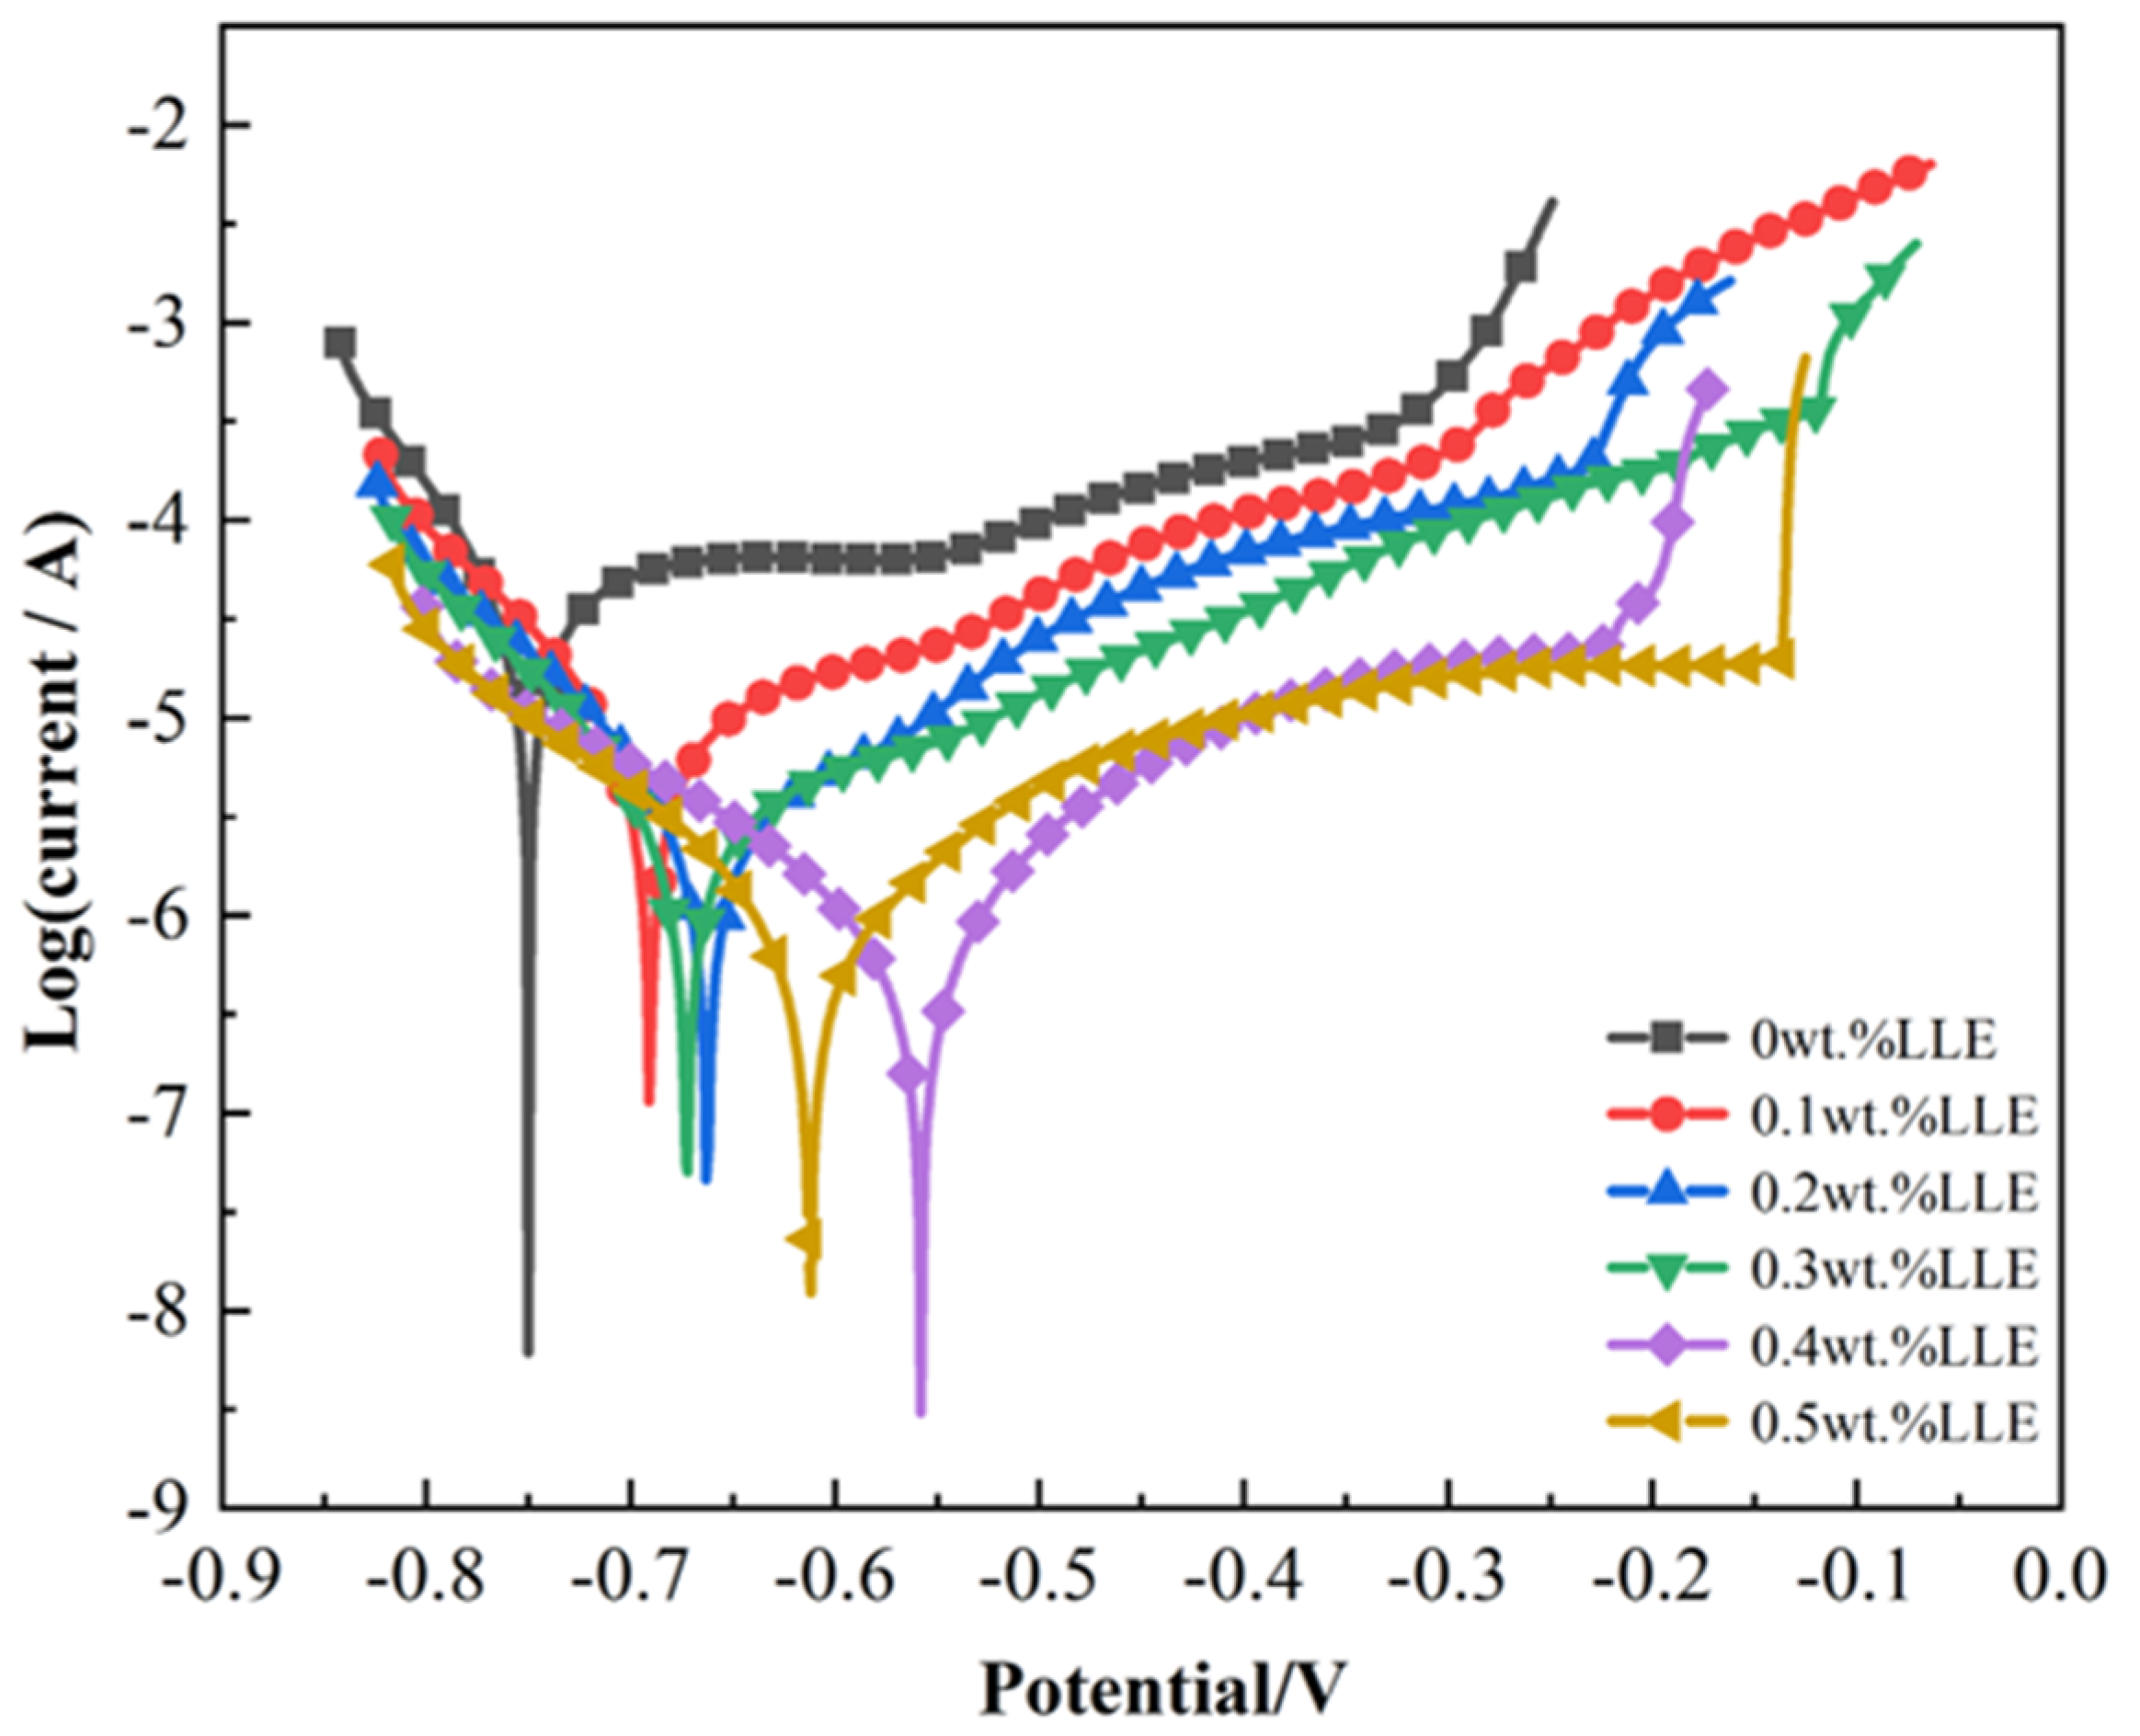
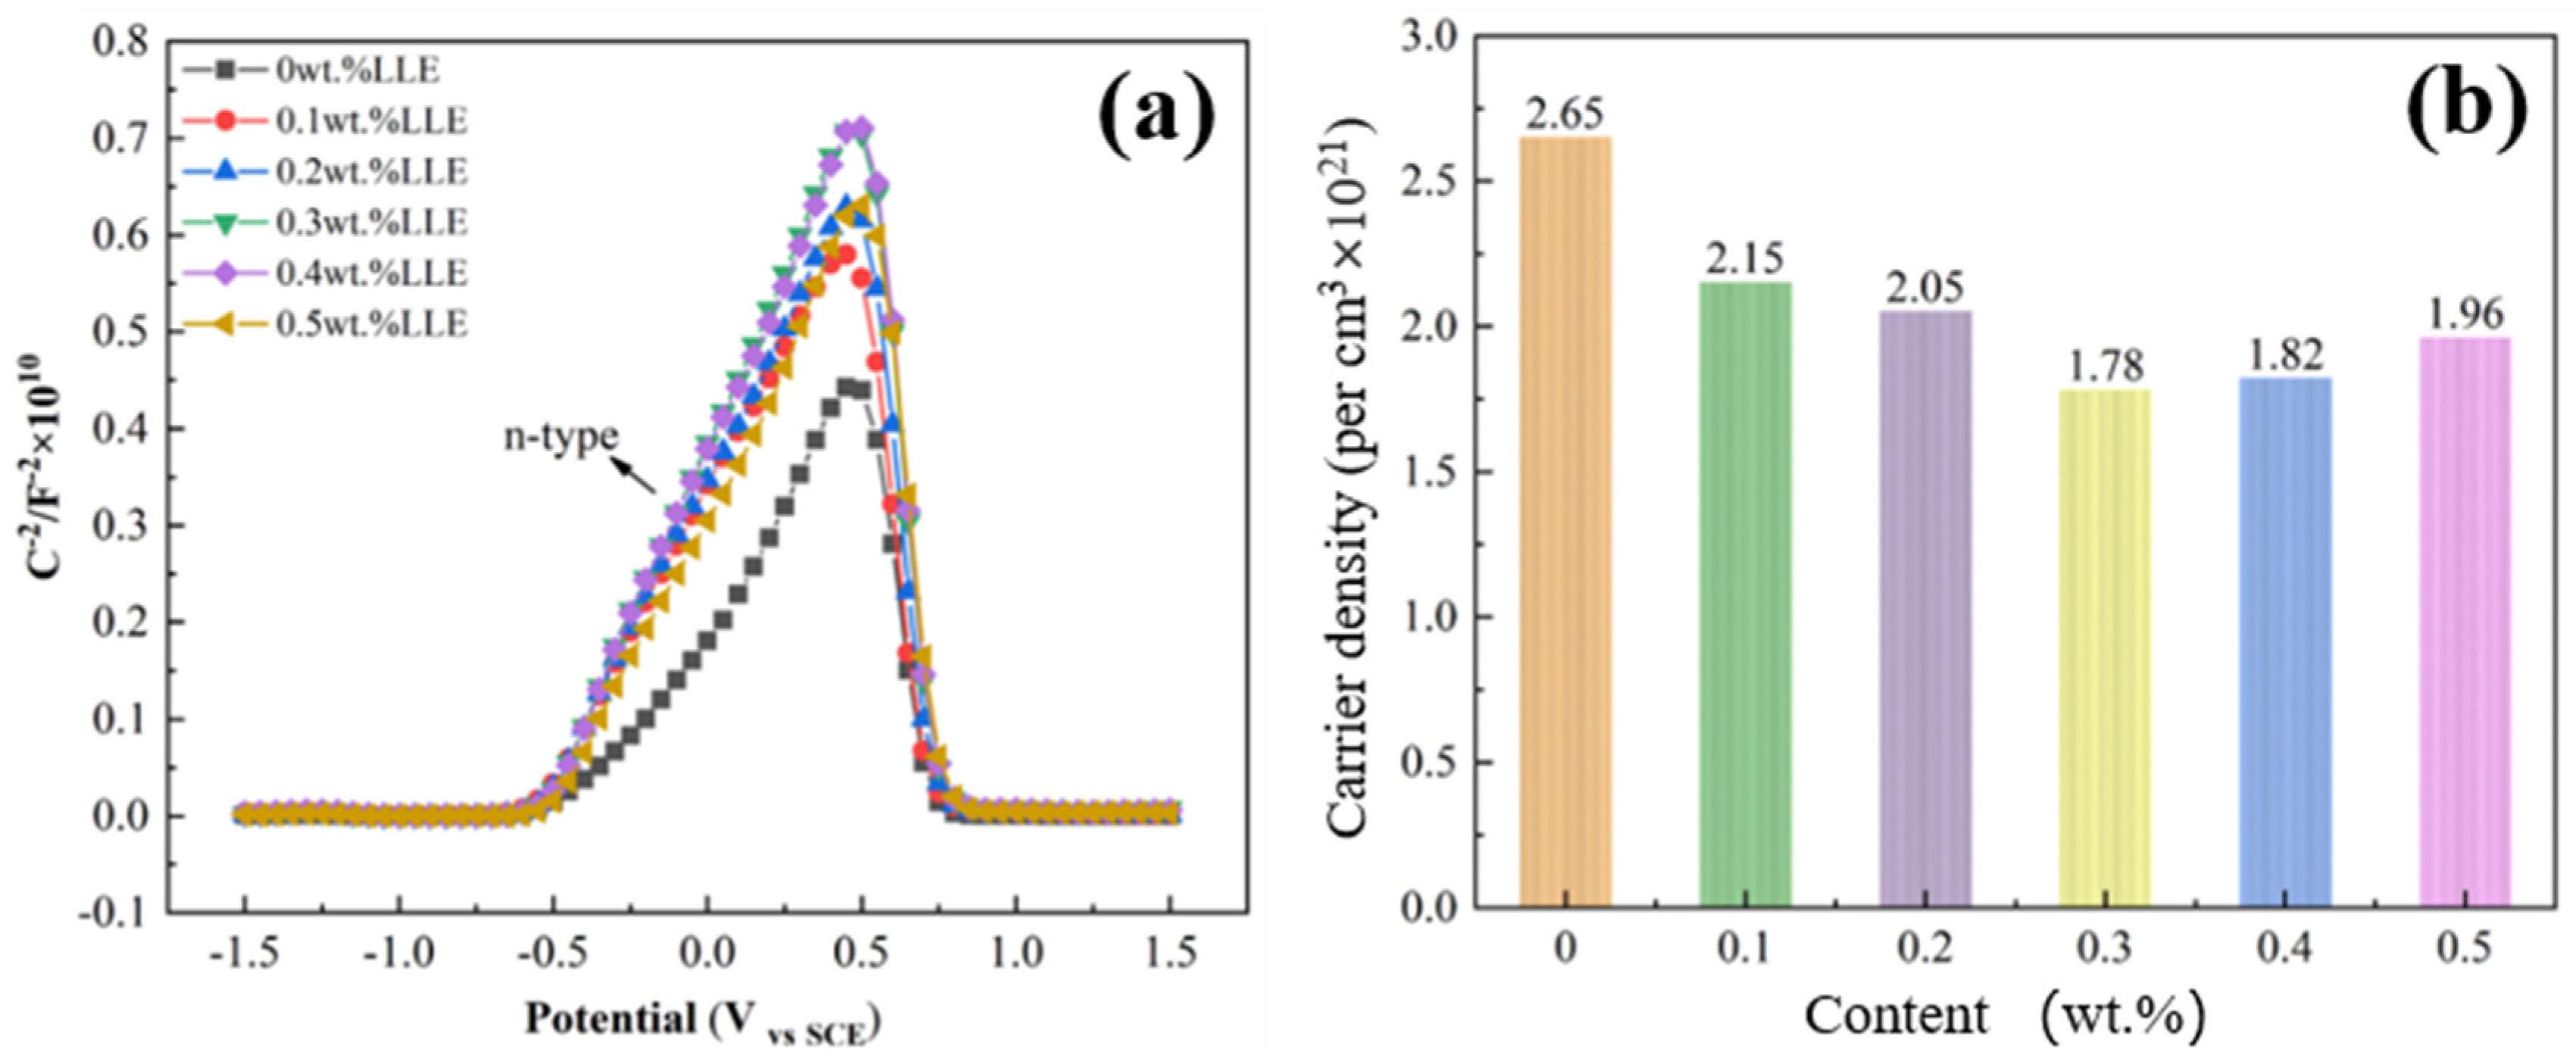
- In an alkaline environment (saturated Ca(OH)2 + 3.5% NaCl), LLE inhibits corrosion by promoting passive film formation and suppressing Cl− attack. In the unprepassivated rebar system, 0.4 wt% LLE exhibited the best performance, achieving an Rct of 3.9 × 10⁴ Ω·cm2 and reducing icorr to 0.99 × 10⁻³ μA/cm2. Mott–Schottky (M-S) tests showed that LLE reduces the carrier density of the passive film, enhancing its n-type semiconductor properties and delaying film breakdown. In the pre-passivated system, 0.5 wt% LLE achieved the highest Rct (4.34 × 10⁴ Ω·cm2), demonstrating its long-term protective effect on the passive film. X-ray photoelectron spectroscopy (XPS) confirmed that 0.5 wt% LLE treatment led to the formation of an Fe2O3/FeO passive film and an organic layer containing C-O bonds, significantly improving corrosion resistance.
Author Contributions
Funding
Data Availability Statement
Conflicts of Interest
References
- Xu, G.; He, C.; Yang, Q.; Wang, B. Progressive failure process of secondary lining of a tunnel under creep effect of surrounding rock. Tunn. Undergr. Space Technol. 2019, 90, 76–98. [Google Scholar] [CrossRef]
- Samanta, R.; Alessandro, T.; Jelke, D.; Ignasi, F.; Karin, L. A closer look at corrosion of rebar bars in concrete using 3D neutron and X-ray computed tomography. Cem. Concr. Res. 2021, 144, 106439. [Google Scholar]
- Köliö, A.; Honkanen, M.; Lahdensivu, J.; Vippola, M.; Pentti, M. Corrosion products of carbonation induced corrosion in existing reinforced concrete facades. Cem. Concr. Res. 2015, 78, 200–207. [Google Scholar] [CrossRef]
- Zhou, Y.; Gencturk, B.; Willam, K.; Attar, A. Carbonation-induced and chloride-induced corrosion in reinforced concrete structures. J. Mater. Civ. Eng. 2015, 27, 1–10. [Google Scholar] [CrossRef]
- Dugarte, M.J.; Sagüés, A.A. Sacrificial point anodes for cathodic prevention of reinforcing steel in concrete repairs-part 2: Performance modeling. Corrosion 2014, 70, 414–429. [Google Scholar] [CrossRef]
- Jeong, J.-A.; Jin, C.-K.; Chung, W.-S. Tidal water effect on the hybrid cathodic protection systems for marine concrete structures. J. Adv. Concr. Technol. 2012, 10, 389–394. [Google Scholar] [CrossRef]
- Duarte, R.G.; Castela, A.S.; Neves, R.; Freire, L.; Montemor, M.F. Corrosion behavior of stainless steel rebars embedded in concrete: An electrochemical impedance spectroscopy study. Electrochim. Acta 2014, 124, 218–224. [Google Scholar] [CrossRef]
- Liu, M.; Cheng, X.; Li, X.; Zhou, C.; Tan, H. Effect of carbonation on the electrochemical behavior of corrosion resistance low alloy steel rebars in cement extract solution. Constr. Build. Mater. 2017, 130, 193–201. [Google Scholar] [CrossRef]
- Nmai, C.K. Multi-functional organic rust inhibitor. Cem. Concr. Compos. 2004, 26, 199–207. [Google Scholar] [CrossRef]
- Verbruggen, H.; Terryn, H.; Graeve, I.D. Inhibitor evaluation in different simulated concrete pore solution for the protection of steel rebars. Constr. Build. Mater. 2016, 124, 887–896. [Google Scholar] [CrossRef]
- Almusallam, A.A.; Khan, F.M.; Dulaijan, S.U.; Al-Amoudi, O.S.B. Effectiveness of surface coatings in improving concrete durability. Cem. Concr. Compos. 2003, 25, 473–481. [Google Scholar] [CrossRef]
- Hu, J.M.; Zhang, J.Q.; Cao, C.N. Determination of water uptake and diffusion of Cl− ion in epoxy primer on aluminum alloys in NaCl solution by electrochemical impedance spectroscopy. Prog. Org. Coat. 2003, 46, 273–279. [Google Scholar] [CrossRef]
- Deb, B.K.; Chakraborti, P. Experimental study of the impacts of sustainable corrosion inhibitor on aluminum in diesel biodiesel ethanol blends. Biofuels 2025, 16, 406–417. [Google Scholar] [CrossRef]
- Casanova, L.; Ceriani, F.; Messinese, E.; Paterlini, L.; Beretta, S.; Bolzoni, F.M.; Brenna, A.; Diamanti, M.V.; Ormellese, M.; Pedeferri, M. Recent advances in the use of green rust inhibitors to prevent chloride-induced corrosion in reinforced concrete. Materials 2023, 16, 7462. [Google Scholar] [CrossRef] [PubMed]
- Söylev, T.A.; Richardson, M.G. Rust inhibitors for steel in concrete: State-of-the-art report. Constr. Build. Mater. 2006, 22, 609–622. [Google Scholar] [CrossRef]
- Anitha, R.; Chitra, S.; Hemapriya, V.; Chung, I.-M.; Kim, S.-H.; Prabakaran, M. Implications of eco-addition inhibitor to mitigate corrosion in reinforced steel embedded in concrete. Constr. Build. Mater. 2019, 213, 246–256. [Google Scholar] [CrossRef]
- Nazari, M.H.; Shihab, M.S.; Cao, L.; Havens, E.A.; Shi, X. A peony-leaves-derived liquid rust inhibitor: Protecting carbon steel from NaCl. Green Chem. Lett. Rev. 2017, 10, 359–379. [Google Scholar] [CrossRef]
- Okeniyi, J.O.; Loto, C.A.; Popoola, A.P.I. Effects of Phyllanthus muellerianus leaf-extract on steel-reinforcement corrosion in 3.5% NaCl-immersed concrete. Metals 2016, 6, 255. [Google Scholar] [CrossRef]
- Asipita, S.A.; Ismail, M.; Majid, M.Z.A.; Majid, Z.A.; Abdullah, C.; Mirza, J. Green bambusa arundinacea leaves extract as a sustainable rust inhibitor in steel reinforced concrete. J. Clean. Prod. 2014, 67, 139–146. [Google Scholar] [CrossRef]
- Palanisamy, S.P.; Maheswaran, G.; Kamal, C.; Venkatesh, G. Prosopis juliflora-A green rust inhibitor for reinforced steel in concrete. Res. Chem. Intermed. 2016, 42, 7823–7840. [Google Scholar] [CrossRef]
- Naderi, R.; Bautista, A.; Velasco, F.; Soleimani, M.; Pourfath, M. Use of licorice plant extract for controlling corrosion of steel rebar in chloride-polluted concrete pore solution. J. Mol. Liq. 2022, 346, 117856. [Google Scholar] [CrossRef]
- Songsong, C. Inhibition effect of Ilex kudingcha C.J. Tseng (Kudingcha) extract on J55 steel in 3.5wt% NaCl solution saturated with CO2. Int. J. Electrochem. Sci. 2017, 12, 782–796. [Google Scholar]
- Pradipta, I.; Kong, D.; Tan, J.B.L. Natural organic antioxidants from green tea inhibit corrosion of steel reinforcing bars embedded in mortar. Constr. Build. Mater. 2019, 227, 117058. [Google Scholar] [CrossRef]
- Pradipta, I.; Kong, D.; Tan, J.B.L. Natural organic antioxidants from green tea form a protective layer to inhibit corrosion of steel reinforcing bars embedded in mortar. Constr. Build. Mater. 2019, 221, 351–362. [Google Scholar] [CrossRef]
- Harb, M.B.; Abubshait, S.; Etteyeb, N.; Kamoun, M.; Dhouib, A. Olive leaf extract as a green rust inhibitor of reinforced concrete contaminated with seawater. Arab. J. Chem. 2020, 13, 4846–4856. [Google Scholar] [CrossRef]
- Khedoudja, B.N.; Rachid, C.; Abdelillah, B.; Latefa, S.; Abdelkarim, A.M. Effectiveness of henna leaves extract and its derivatives as green rust inhibitors of reinforcement steel exposed to chlorides. Eur. J. Environ. Civ. Eng. 2022, 26, 5912–5930. [Google Scholar]
- Liu, Q.; Song, Z.; Han, H.; Donkor, S.; Jiang, L.; Wang, W.; Chu, H. A novel green reinforcement rust inhibitor extracted from waste platanus acerifolia leaves. Constr. Build. Mater. 2020, 260, 119695. [Google Scholar] [CrossRef]
- Zhang, Z.; Ba, H.; Wu, Z. Sustainable rust inhibitor for steel in simulated concrete pore solution by maize gluten meal extract: Electrochemical and adsorption behavior studies. Constr. Build. Mater. 2019, 227, 117080. [Google Scholar] [CrossRef]
- Lee, K.-S.; Kwon, Y.-J.; Lee, K.-Y. Analysis of Chemical Composition, Vitamin, Mineral and antioxidative effect of the lotus leaf. J. Korean Soc. Food Sci. Nutr. 2008, 37, 1622–1626. [Google Scholar] [CrossRef]
- Yoshiki, K.; Akihiro, A.; Yasumasa, I.; Yuh-Pan, C.; Hiroshi, F.; Masataka, I.; Toshihiro, F.; Kunihide, M.; Mark, C.L.; Susan, L.M.; et al. Anti-HIV benzylisoquinoline alkaloids and flavonoids from the leaves of nelumbo nucifera, and structure-activity correlations with related alkaloids. Bioorganic Med. Chem. 2005, 13, 443–448. [Google Scholar]
- Luo, W.; Luo, X.; Shi, Y.; Wang, X.; Zhang, S.; Gao, F.; Li, H. Preparation and corrosion inhibition of super hydrophobic adsorption film of lotus leaf extract on mild Steel. J. Chin. Soc. Corros. Prot. 2022, 42, 903–912. [Google Scholar]
- Qin, Y.; Liu, X.; Cao, J.; Xiang, Q.; Bai, X. Theory study about inhibition of alkaloids in lotus leaf extraction. Guangzhou Chem. Ind. 2011, 39, 21–24. [Google Scholar]
- Vinit, K.; Gopal, J. Lotus leaves coating on copper substrates and their corrosion performances in sodium chloride solutions. Mater. Today Proc. 2023, 80, 116–121. [Google Scholar]
- Vinit, K.; Subhajit, J.; Shweta, P.; Gopal, J.; Rajiv, P. Thin-Film Coating of the Hydrophobic Lotus Leaf on Copper by the Floating Film Transfer Method and Investigation on the Corrosion Behavior of Coated Copper in Saline Water. Ind. Eng. Chem. Res. 2022, 62, 85–95. [Google Scholar]
- Liu, X.; Yang, L.; Cao, J.; Xiang, Q.; Chen, F. Theory study about inhibition of organic acids and alcohols in lotus leaf extract. Guangzhou Chem. Ind. 2011, 39, 24–26. [Google Scholar]
- Nouhaila, F.; Moussa, O.; Hammadi, E.; Mohammed, C.; Mounia, B. Investigation of the inhibition behavior of an octacalcium phosphate as a green corrosion inhibitor against carbon steel in 3% NaCl medium. Inorg. Chem. Commun. 2023, 157, 111343. [Google Scholar]
- Liu, C.; Liu, Y.; Zhao, H.; Wang, Z.; Wu, B. Coconut coir dust extract as a novel green corrosion inhibitor for carbon steel in the chloride-contaminated concrete pore solution. J. Build. Eng. 2024, 82, 108194. [Google Scholar] [CrossRef]
- Naderi, R.; Bautista, A.; Velasco, F.; Soleimani, M.; Pourfath, M. Green corrosion inhibition for carbon steel reinforcement in chloride-polluted simulated concrete pore solution using Urtica Dioica extract. J. Build. Eng. 2022, 58, 105055. [Google Scholar] [CrossRef]


| Chemical Composition | Fe | C | Si | Mn | S | P | Carbon Equivalent |
|---|---|---|---|---|---|---|---|
| HRB400 | Balance | 0.25 | 0.80 | 1.60 | 0.045 | 0.045 | 0.54 |
| LLE Concentrations | Rs /(Ω·cm2) | Yf × 10−3 /(Ω−1·sn·cm−2) | n1 | Rf /(Ω·cm2) | Ydl × 10−3 /(Ω−1·sn·cm−2) | n2 | Rct /(Ω·cm2) |
|---|---|---|---|---|---|---|---|
| 0 wt% | 7.49 | 2.33 | 0.78 | 11.24 | 0.40 | 0.94 | 1379 |
| 0.1 wt% | 9.33 | 1.88 | 0.81 | 3.86 | 2.15 | 0.80 | 2757 |
| 0.2 wt% | 9.26 | 0.07 | 0.59 | 4.76 | 0.46 | 0.89 | 4603 |
| 0.3 wt% | 8.35 | 0.05 | 0.59 | 17.75 | 0.60 | 0.85 | 3720 |
| 0.4 wt% | 7.96 | 0.55 | 0.91 | 1626 | 1.37 | 0.84 | 681.9 |
| 0.5 wt% | 7.38 | 0.60 | 0.90 | 1600 | 2.91 | 0.98 | 481.1 |
| LLE Concentrations | Rp/(Ω·cm2) | ηEIS/(%) | RSD |
|---|---|---|---|
| 0 wt% | 1390.24 | -- | -- |
| 0.1 wt% | 2760.86 | 49.64 | 2.0 |
| 0.2 wt% | 4607.76 | 69.83 | 2.3 |
| 0.3 wt% | 3737.75 | 62.81 | 2.2 |
| 0.4 wt% | 2307.90 | 39.76 | 1.9 |
| 0.5 wt% | 2081.10 | 33.20 | 1.9 |
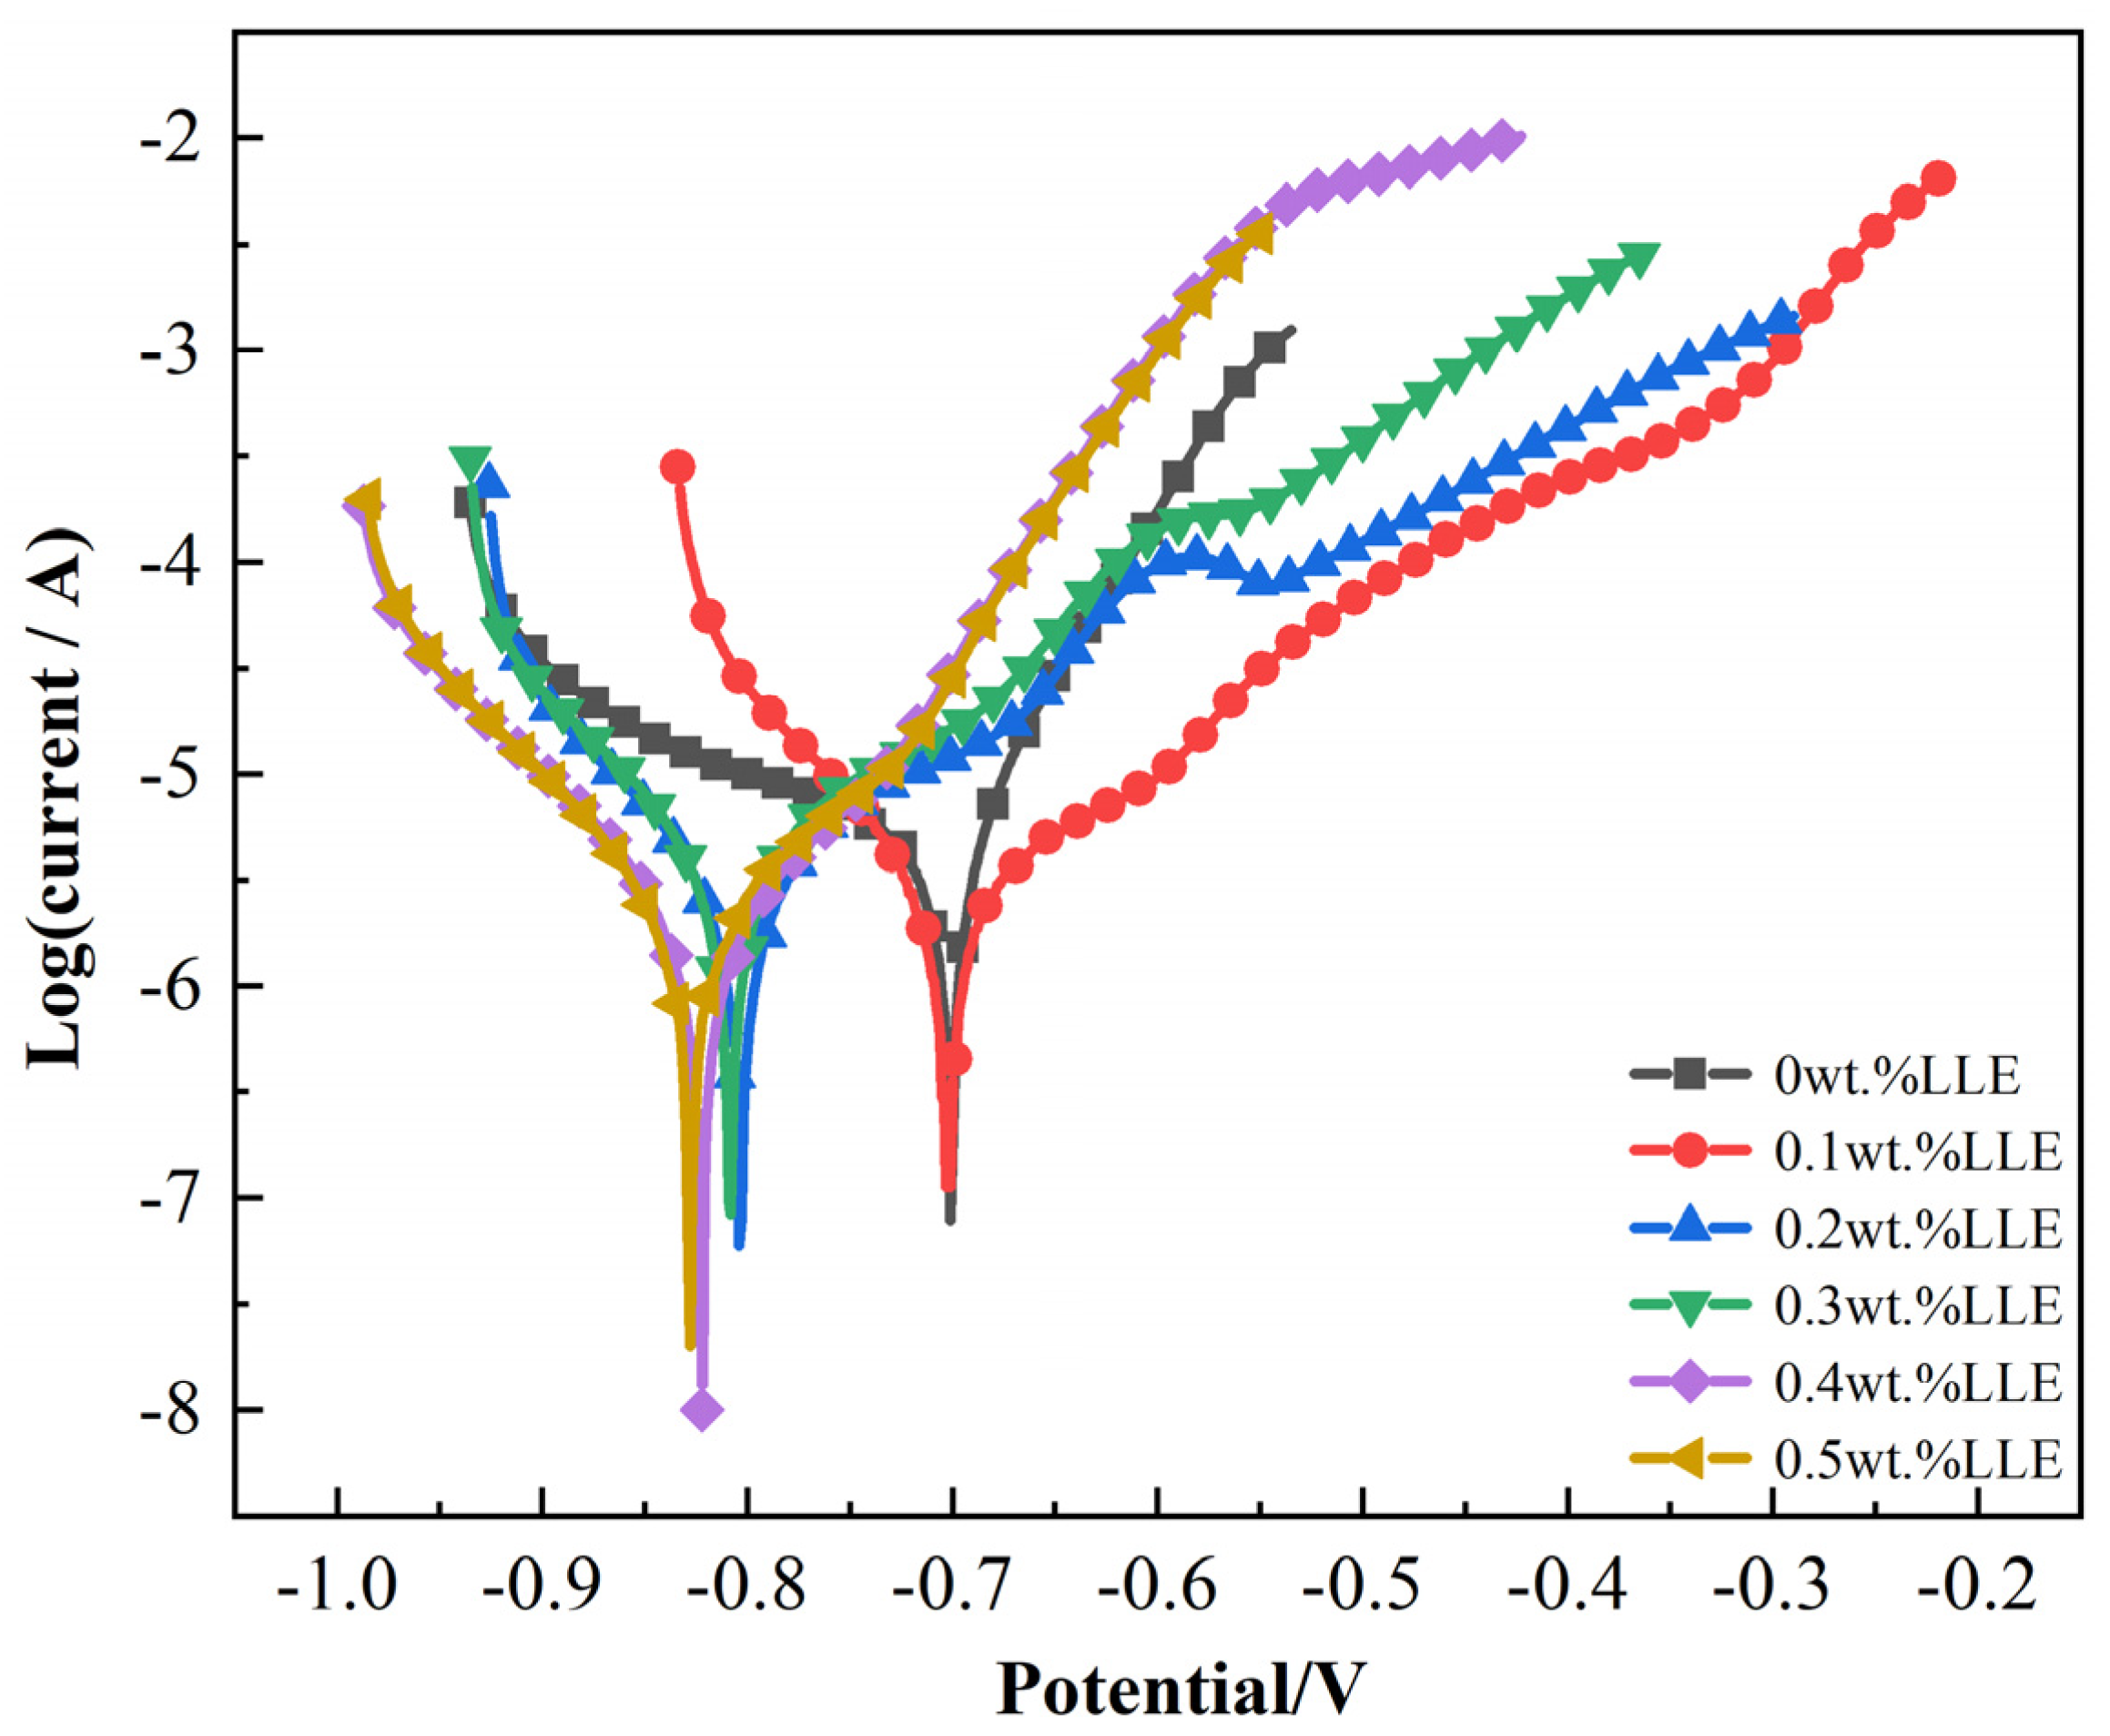
| LLE concentrations | Ecorr /(V) | icorr × 10−3 /(μA/cm2) | IE/(%) | RSD |
|---|---|---|---|---|
| 0 wt% | −0.70 | 5.76 | -- | -- |
| 0.1 wt% | −0.70 | 2.88 | 50.00 | 2.2 |
| 0.2 wt% | −0.80 | 2.00 | 65.28 | 2.1 |
| 0.3 wt% | −0.81 | 3.52 | 38.89 | 2.3 |
| 0.4 wt% | −0.82 | 1.55 | 73.09 | 2.4 |
| 0.5 wt% | −0.83 | 2.36 | 59.03 | 2.2 |
| LLE Concentrations | Rs /(Ω·cm2) | Yf × 10−3 /(Ω−1·sn·cm−2) | n1 | Rf /(Ω·cm2) | Ydl × 10−3 /(Ω−1·sn·cm−2) | n2 | Rct /(Ω·cm2) |
|---|---|---|---|---|---|---|---|
| 0 wt% | 7.80 | 0.14 | 0.86 | 132 | 2.81 | 0.53 | 3805 |
| 0.1 wt% | 8.42 | 0.10 | 0.84 | 630 | 0.98 | 0.58 | 3560 |
| 0.2 wt% | 7.89 | 0.07 | 0.86 | 845 | 0.82 | 0.64 | 4886 |
| 0.3 wt% | 8.70 | 0.08 | 0.86 | 1925 | 0.59 | 0.55 | 15,360 |
| 0.4 wt% | 8.80 | 0.23 | 0.84 | 8035 | 0.28 | 0.65 | 39,000 |
| 0.5 wt% | 7.23 | 0.07 | 0.88 | 4888 | 0.23 | 0.49 | 33,640 |
| LLE Concentrations | Rp/(Ω·cm2) | ηEIS/(%) | RSD |
|---|---|---|---|
| 0 wt% | 3937 | -- | -- |
| 0.1 wt% | 4190 | 6.04 | 2.2 |
| 0.2 wt% | 5731 | 31.31 | 2.5 |
| 0.3 wt% | 17,285 | 77.22 | 2.4 |
| 0.4 wt% | 47,035 | 91.63 | 2.6 |
| 0.5 wt% | 38,528 | 89.78 | 2.7 |
| LLE Concentrations | Ecorr /(V) | icorr × 10−3 /(μA/cm2) | IE/(%) | RSD |
|---|---|---|---|---|
| 0 wt% | −0.75 | 32.49 | -- | -- |
| 0.1 wt% | −0.69 | 10.02 | 69.16 | 2.5 |
| 0.2 wt% | −0.66 | 3.67 | 88.71 | 2.4 |
| 0.3 wt% | −0.67 | 3.89 | 88.02 | 2.6 |
| 0.4 wt% | −0.56 | 0.99 | 96.96 | 2.7 |
| 0.5 wt% | −0.61 | 1.04 | 96.80 | 2.6 |
| LLE Concentrations | Rs /(Ω·cm2) | Yf × 10−5 /(Ω−1·sn·cm−2) | n1 | Rf /(Ω·cm2) | Ydl × 10−3 /(Ω−1·sn·cm−2) | n2 | Rct × 104 /(Ω·cm2) |
|---|---|---|---|---|---|---|---|
| 0 wt% | 8.04 | 7.99 | 0.89 | 219 | 1.42 | 0.60 | 0.51 |
| 0.1 wt% | 8.20 | 0.89 | 0.85 | 645 | 1.07 | 0.45 | 0.80 |
| 0.2 wt% | 7.19 | 5.81 | 0.90 | 3488 | 0.28 | 0.56 | 1.03 |
| 0.3 wt% | 6.88 | 8.96 | 0.89 | 3073 | 0.41 | 0.62 | 1.11 |
| 0.4 wt% | 8.23 | 5.90 | 0.89 | 5411 | 0.23 | 0.52 | 2.23 |
| 0.5 wt% | 8.64 | 6.93 | 0.88 | 9093 | 0.13 | 0.47 | 4.34 |
| LLE Concentrations | Rp/(Ω·cm2) | ηEIS/(%) | RSD |
|---|---|---|---|
| 0 wt% | 5324 | -- | -- |
| 0.1 wt% | 8666 | 38.56 | 2.3 |
| 0.2 wt% | 13,828 | 61.50 | 2.5 |
| 0.3 wt% | 14,133 | 62.33 | 2.7 |
| 0.4 wt% | 27,701 | 80.78 | 2.8 |
| 0.5 wt% | 52,443 | 89.85 | 3.1 |
| LLE Concentrations | Ecorr /(V) | icorr × 10−3 /(μA/cm2) | IE/(%) | RSD |
|---|---|---|---|---|
| 0 wt% | −0.71 | 5.65 | -- | -- |
| 0.1 wt% | −0.74 | 6.32 | -- | -- |
| 0.2 wt% | −0.70 | 3.76 | 33.45 | 2.7 |
| 0.3 wt% | −0.67 | 1.64 | 70.97 | 2.9 |
| 0.4 wt% | −0.68 | 1.47 | 73.98 | 3.2 |
| 0.5 wt% | −0.63 | 0.55 | 90.27 | 3.1 |
| Plant Extract Source | Corrosive Medium | ηEIS/(%) | IE/(%) | Reference |
|---|---|---|---|---|
| Urtica dioica leaf | 0.3 M KOH + 0.1 M NaOH in saturated Ca(OH)2 solution containing 1 wt% NaCl | 77.00% | - | [38] |
| Phragmites australis leaf | Concrete specimens immersed in 3% NaCl electrolyte | - | 76.98% | [27] |
| Damask rose leaf | 0.5 M Ca(OH)2 + 0.5 M KOH + 0.1 M NaOH + 0.5 M NaCl | 81.90% | 81.60% | [16] |
| lotus leaf | 3.5% NaCl electrolyte | 69.83% | 73.09% | This paper |
| lotus leaf | Non-passivated steel rebar in saturated Ca(OH)2 solution | 91.63% | 96.96% | This paper |
| lotus leaf | Pre-passivated steel rebar in saturated Ca(OH)2 solution | 89.85% | 90.27% | This paper |
Disclaimer/Publisher’s Note: The statements, opinions and data contained in all publications are solely those of the individual author(s) and contributor(s) and not of MDPI and/or the editor(s). MDPI and/or the editor(s) disclaim responsibility for any injury to people or property resulting from any ideas, methods, instructions or products referred to in the content. |
© 2025 by the authors. Licensee MDPI, Basel, Switzerland. This article is an open access article distributed under the terms and conditions of the Creative Commons Attribution (CC BY) license (https://creativecommons.org/licenses/by/4.0/).
Share and Cite
Song, D.; Wang, J.; Guan, H.; Zhang, S.; Zhou, Z.; Zhang, S. Enhanced Corrosion Resistance of Carbon Steel Rebar in Chloride-Containing Water Solutions: The Role of Lotus Extract in Corrosion Inhibition. Metals 2025, 15, 510. https://doi.org/10.3390/met15050510
Song D, Wang J, Guan H, Zhang S, Zhou Z, Zhang S. Enhanced Corrosion Resistance of Carbon Steel Rebar in Chloride-Containing Water Solutions: The Role of Lotus Extract in Corrosion Inhibition. Metals. 2025; 15(5):510. https://doi.org/10.3390/met15050510
Chicago/Turabian StyleSong, Dan, Juhang Wang, Hao Guan, Sijie Zhang, Zhou Zhou, and Shuguang Zhang. 2025. "Enhanced Corrosion Resistance of Carbon Steel Rebar in Chloride-Containing Water Solutions: The Role of Lotus Extract in Corrosion Inhibition" Metals 15, no. 5: 510. https://doi.org/10.3390/met15050510
APA StyleSong, D., Wang, J., Guan, H., Zhang, S., Zhou, Z., & Zhang, S. (2025). Enhanced Corrosion Resistance of Carbon Steel Rebar in Chloride-Containing Water Solutions: The Role of Lotus Extract in Corrosion Inhibition. Metals, 15(5), 510. https://doi.org/10.3390/met15050510