Article

Study of the Behavior and Mechanism of Sponge Iron Oxidation

1
School of Materials Science and Engineering, Shanghai Dianji University, Shanghai 201306, China
2
State Key Laboratory of Advanced Special Steel, Shanghai University, Shanghai 200072, China
*
Authors to whom correspondence should be addressed.
Metals 2025, 15(5), 508; https://doi.org/10.3390/met15050508
Submission received: 27 March 2025 / Revised: 25 April 2025 / Accepted: 28 April 2025 / Published: 30 April 2025
(This article belongs to the Section Extractive Metallurgy)

Abstract

:
This paper investigates the kinetic characteristics of sponge iron powder reoxidation under two different oxidation atmospheres by examining the reoxidation process from thermodynamic, microstructural, and kinetic perspectives. It reveals the changes in the surface microstructure and oxide content of sponge iron under different oxidation conditions. The results indicate that the thermodynamic conditions for the formation of Fe2O3 were more relaxed than those for Fe3O4. As the oxidation time increased, the surface microstructure of the sponge iron transitioned from a porous granular form (Fe) to a dense blocky structure (Fe3O4), eventually forming a rod-like product (Fe2O3). Under an atmosphere of O2/Ar = 21/79, the oxide content was significantly higher compared to an atmosphere of O2/Ar = 11/89. Under an atmosphere of O2/Ar = 11/89, the oxidation rate index (n) remained at 0.68 throughout all stages, indicating a consistently higher oxidation rate. Conversely, under an atmosphere of O2/Ar = 21/79, the initial oxidation rate index (n1) was 1.17, reflecting a slower initial oxidation rate, while in the final stage, the oxidation rate index (n2) dripped to 0.33, indicating a substantial increase in the oxidation rate. The research results provide basic research ideas and references for an in-depth study of the antioxidant storage of sponge iron.

1. Introduction

Sponge iron is a porous iron material prepared through the direct reduction process. The direct reduction (DR) process is a solid-state reaction using coal, hydrogen, or reformed natural gas as a reducing agent to remove oxygen from iron ore at temperatures below the melting point of the ore [1,2,3]. Sponge iron can be used as an enrichment agent in blast furnaces (BFs) [4,5], a coolant in refining furnaces/basic oxygen furnaces (LDs/BOFs) [6], and as a charge material in electric arc furnaces/induction melting furnaces (EAFs/IMFs) [7,8]. Due to the removal of oxygen, the porous honeycomb structure of sponge iron gives it a large specific surface area, making it prone to reoxidation [9]. The heat generated by the oxidation reaction increases the sensitivity of oxidation, potentially leading to the spontaneous combustion of sponge iron [10]. Therefore, the storage and handling of sponge iron are significant concerns. With the implementation of national “carbon peaking” and “carbon neutrality” policies, research on the reoxidation kinetics of sponge iron has become increasingly urgent.
Current research on the oxidation of sponge iron primarily focuses on factors such as powder particle size, compaction pressure, and oxidation temperature and their effects on the oxidation rate and oxidation products. Mello et al. [11] compacted and sintered iron powder under different pressures, finding that increased pressure led to decreased hardness and that the oxide layers were mainly composed of magnetite and hematite. However, Wang et al. [12] observed increased density and hardness with pressure. Daghagheleh et al. [13] investigated the oxidation behavior of hot-pressed iron blocks under various climatic conditions, noting minimal reoxidation under ambient air. Saraireh et al. [14] examined the effects of oxidation temperature and film composition on the phase composition of porous iron, finding magnetite formation at 350–450 °C. Wei et al. [15] used a thermogravimetric analyzer to show that smaller iron powder particle sizes resulted in more complete reactions at the same temperature. Pasquale et al. [10] found slow weight increases at temperatures below 500 °C for iron particles reduced by pure hydrogen, with rapid reoxidation at higher temperatures.
Furthermore, studies on oxidation kinetics have been conducted. Bandopadhyay et al. [16] found that the oxidation rate of direct reduced iron is faster at 720 K but slows above 800 K. Bodas et al. [17] found that iron powder oxidation is related to particle size, fluidization time, and temperature. Diepen et al. [18] measured the properties of the oxide layer of iron powder, finding a transition from FeO at the metal/oxide interface to external Fe3O4 and γ-Fe2O3. Choisez et al. [19] observed the combustion process of pure iron powder in air- and propane-ignited flames, producing spherical hollow particles composed of wustite, magnetite, or hematite. AbdElmomen et al. [20] studied the oxidation behavior of directly reduced iron pellets in ambient air, finding the oxidation process controlled by a first-order reaction of oxygen, with apparent rate constants of 1.65 × 10⁻³ and 4.55 × 10⁻³ g/cm2/day.
Additionally, studies on the impact of ball milling on iron powder oxidation have also been reported. Lysenko et al. [21] analyzed the effect of ball milling on the oxidation kinetics of ultrafine iron powder. During grinding in a planetary mill, approximately 20 wt.% of FeO was generated from the oxidation of iron powder. Preliminary ball milling increased the initial thermal oxidation temperature of the iron powder by at least 200 °C [22]. Furthermore, kinetic thermogravimetric analysis of ultrafine iron powder to hematite at 800 °C showed increased reactivity with smaller particle sizes. The oxidation can proceed via two pathways: direct oxidation of Fe to α-Fe2O3 or oxidation to Fe3O4, which then further oxidizes to α-Fe2O3 at higher temperatures [23].
In general, current research on the reoxidation of sponge iron mainly focused on thermodynamics, with a lack of systematic studies on reoxidation kinetics. Therefore, investigating the oxidation behavior of sponge iron under high-temperature conditions was crucial for advancing low-carbon metallurgical processes. This paper used sponge iron as a raw material and adopted the oxidation sintering method to study the effects of two oxidizing atmospheres on the oxide formation mechanism, oxidation product evolution, and oxidation kinetics during sponge iron oxidation.

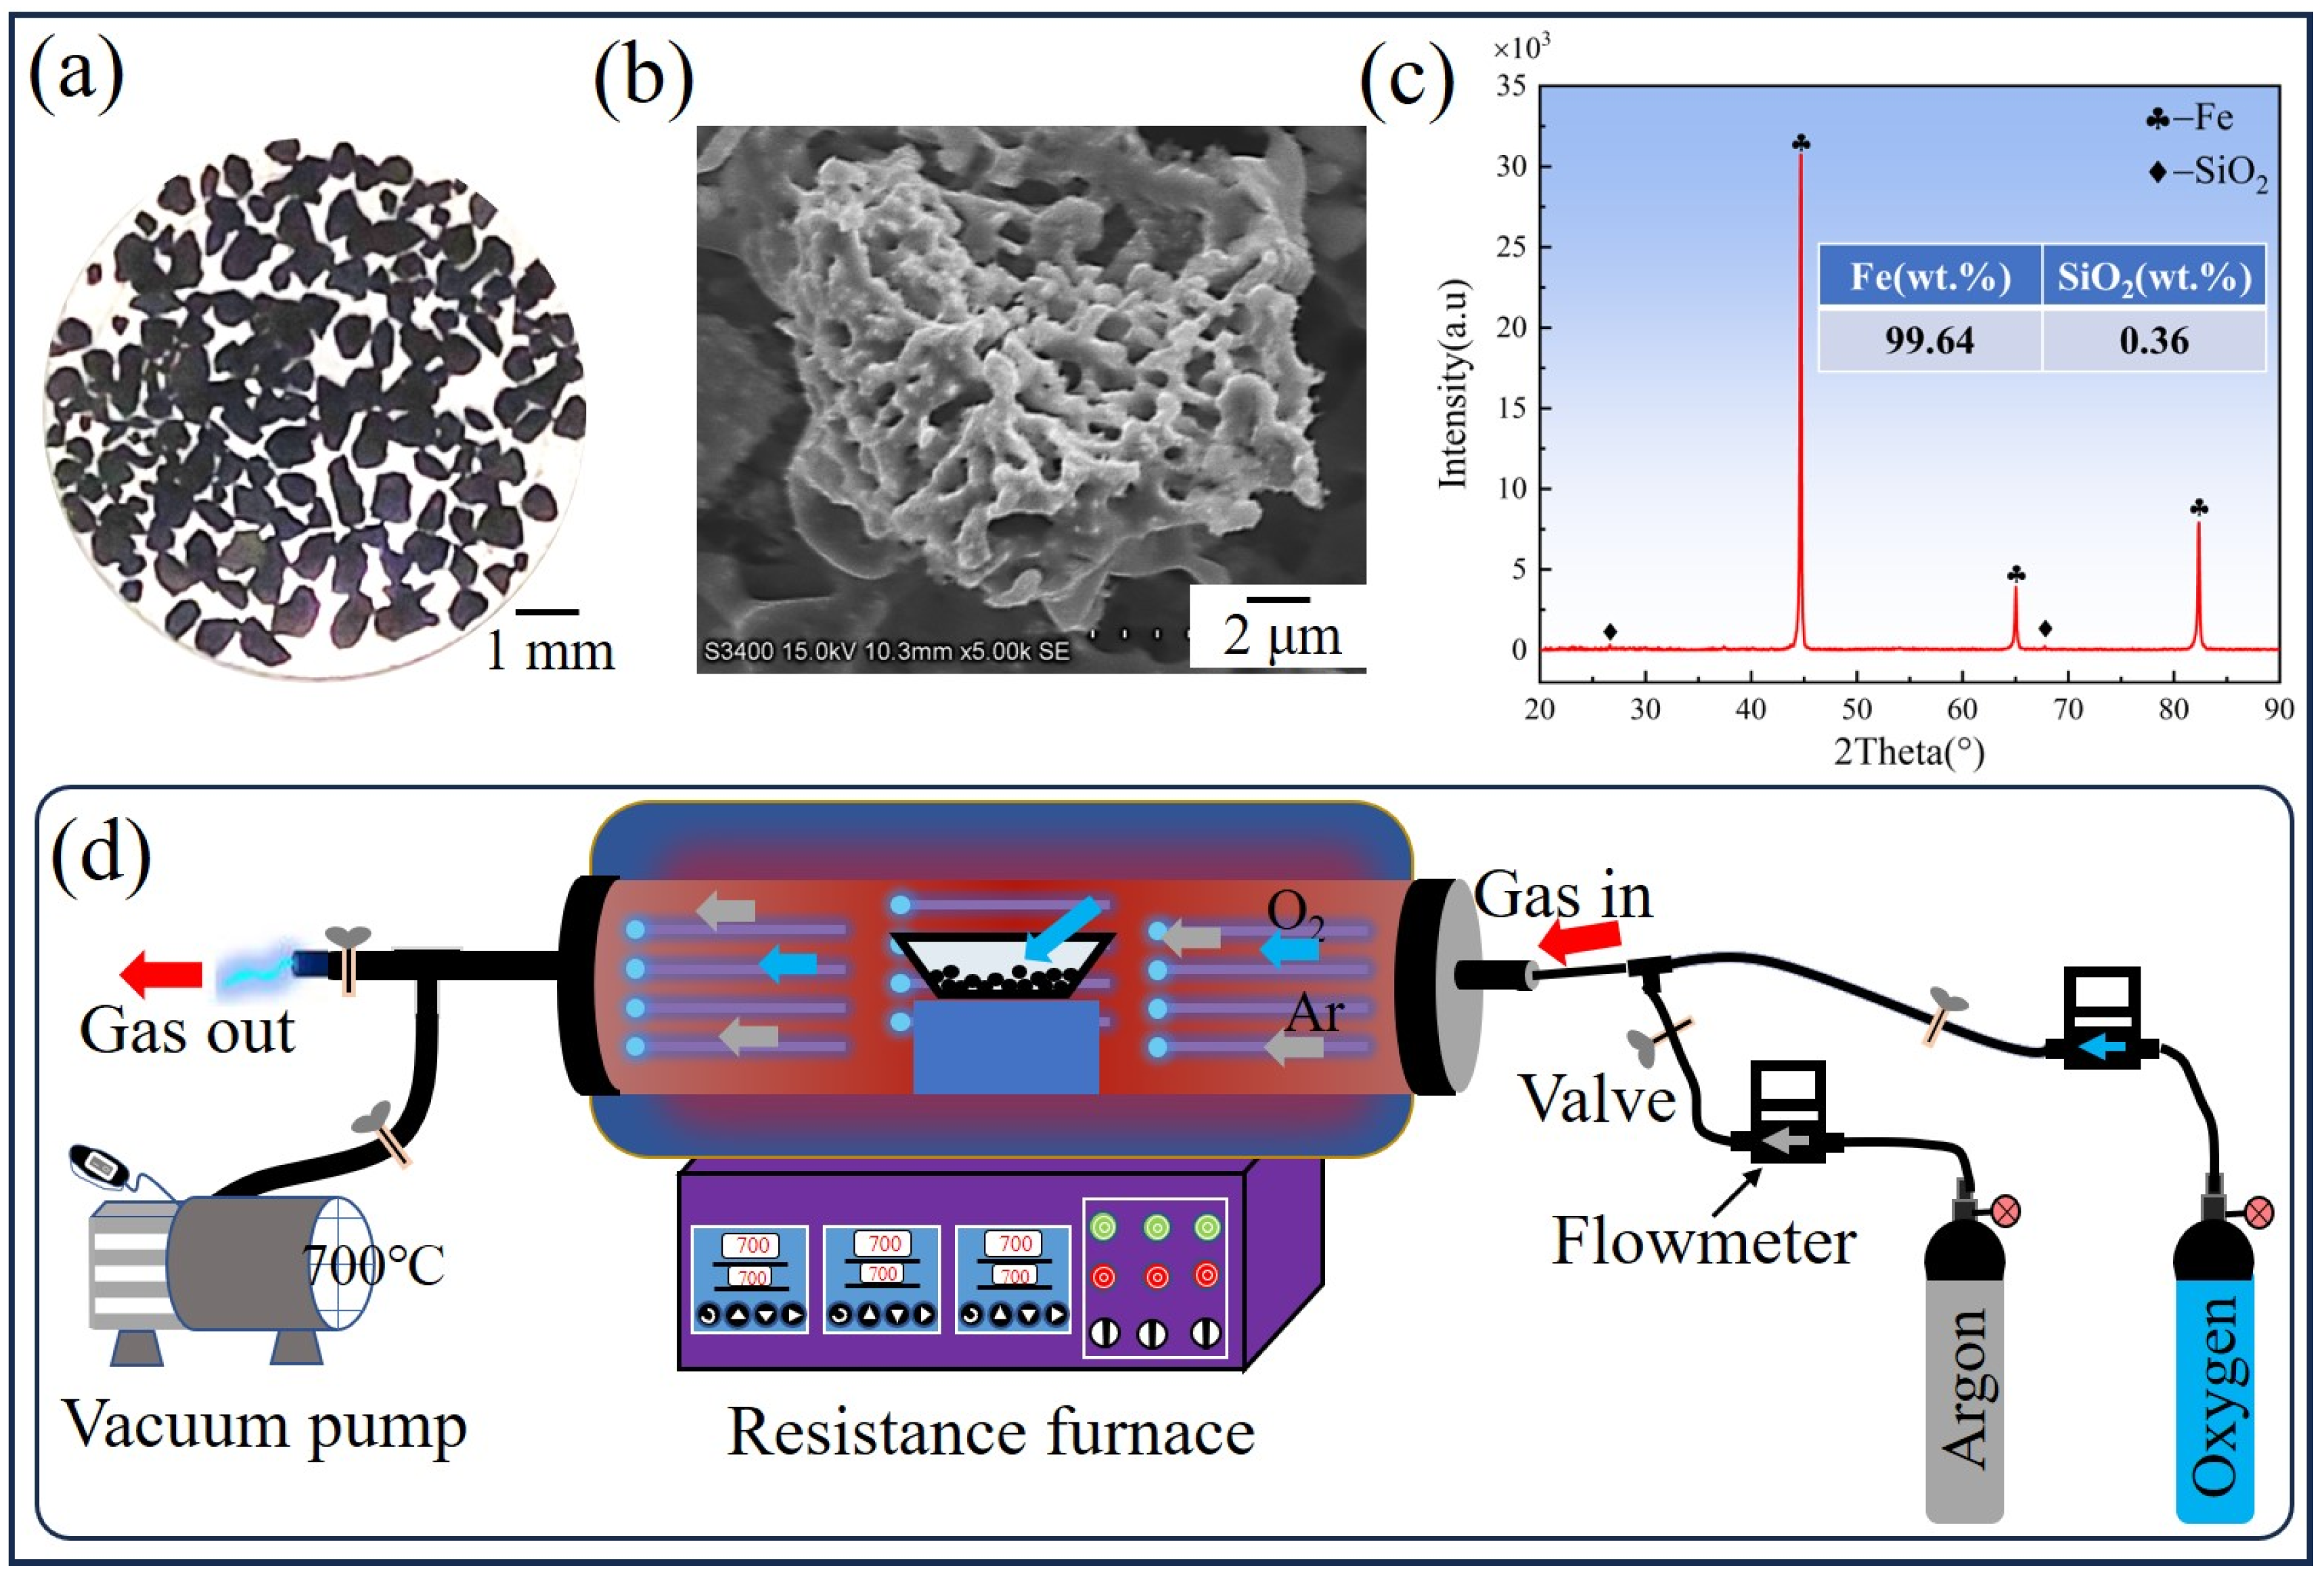
2. Materials and Methods

2.1. Experimental Materials and Methods

The sponge iron used in this study was prepared by hydrogen reduction of iron concentrate powder in the laboratory. The grain size sieving experiment analysis shows that the particle size range of its sponge iron particles is 0.5–1.5 mm. The morphology and phase composition of the sponge iron are shown in Figure 1a–c. The oxidation experiments were conducted using a horizontal resistance furnace (GSL-1600X-S60, Shanghai Precision Instrument Co., Ltd., Shanghai, China), with the reaction setup shown in Figure 1d. First, a certain mass of sponge iron particles was weighed and placed in an alumina crucible, which was then positioned in the resistance furnace. After the evacuation of the furnace, argon gas was introduced, and the temperature was increased at a rate of 5 °C/s. When the temperature reached 700 °C, a specified amount of mixed gas consisting of oxygen and argon was introduced for isothermal oxidation. The oxygen-to-argon ratios were set at 11/89 and 21/79 to create different atmospheric environments. The ratio of O2/Ar = 21/79 was chosen to simulate an atmosphere similar to air, while the ratio of O2/Ar = 11/89 was selected to create a low-oxygen atmosphere for comparison experiments. The specific atmospheric and reaction time parameters are listed in Table 1. After the predetermined reaction time, the oxygen was turned off, and the sample was allowed to cool to room temperature under argon.

2.2. Characterization Methods

The oxidized sponge iron samples were first subjected to surface phase analysis using X-ray diffraction (XRD, Bruker, Billerica, MA, USA, D8 Advance). Subsequently, the oxidized samples were embedded, ground, and polished to prepare cross-sectional samples. Scanning electron microscopy (SEM, Hitachi, Tokyo, Japan, S-3400N) coupled with energy dispersive X-ray spectroscopy (EDS, AMETEK Inc., Berwyn, PA, USA, Apollo, XP) was used for microstructure and elemental analysis of the surface and cross-section of the oxidized samples, with an operating voltage of 20 kV.

3. Experimental Results and Discussion

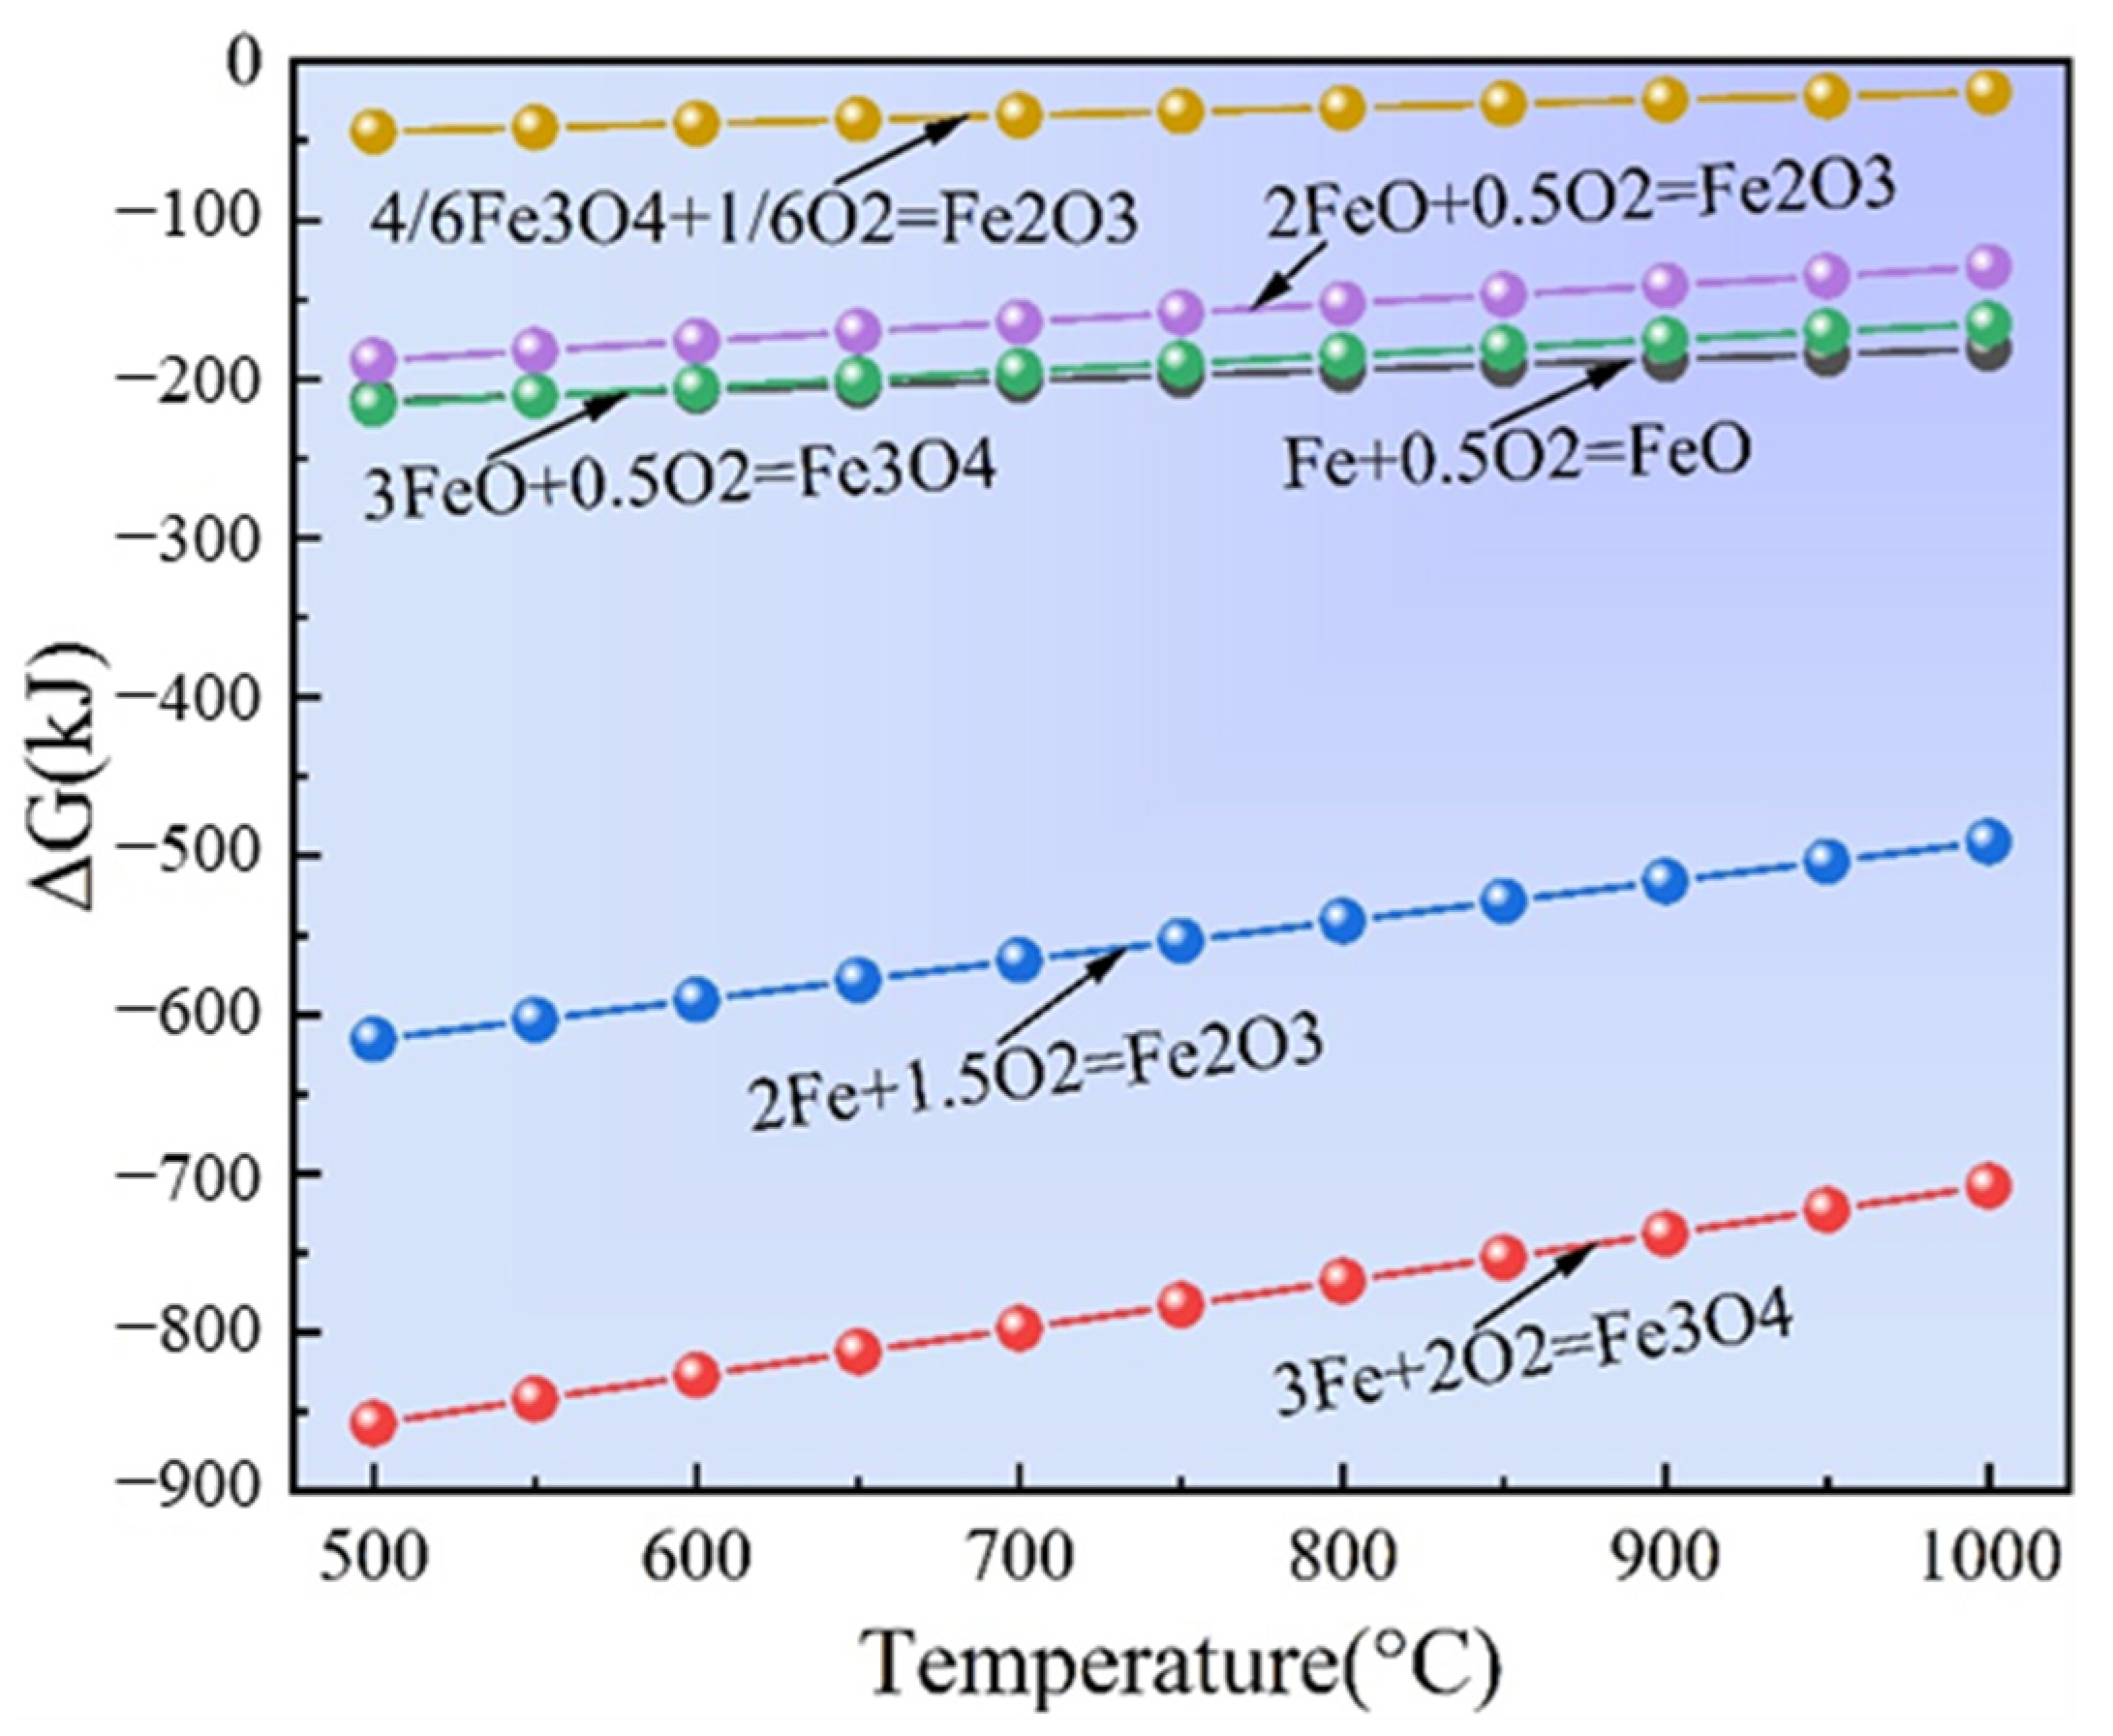
3.1. Thermodynamic Analysis of Oxidation

The standard Gibbs free energy change of iron oxidation reactions at different temperatures was calculated by HSC 6.0 thermodynamic software. As shown in Figure 2, the results indicate that among all iron oxidation reactions, the formation of Fe3O4 was the most favorable, followed by Fe2O3, while the formation of FeO was the most difficult. Additionally, among the further oxidation reactions of intermediate oxides, the reaction of FeO forming Fe3O4 was the most favorable, followed by FeO forming Fe2O3, and the formation of Fe2O3 from Fe3O4 was the most difficult. From a thermodynamic perspective, lower temperatures were more favorable for oxidation reactions. However, when selecting the oxidation temperature, both the possibility of the reaction and the reaction rate should be considered. According to the literature reports [24], reoxidation temperatures typically range from 600 to 800 °C; hence, this study selected an intermediate temperature of 700 °C for the oxidation reaction.

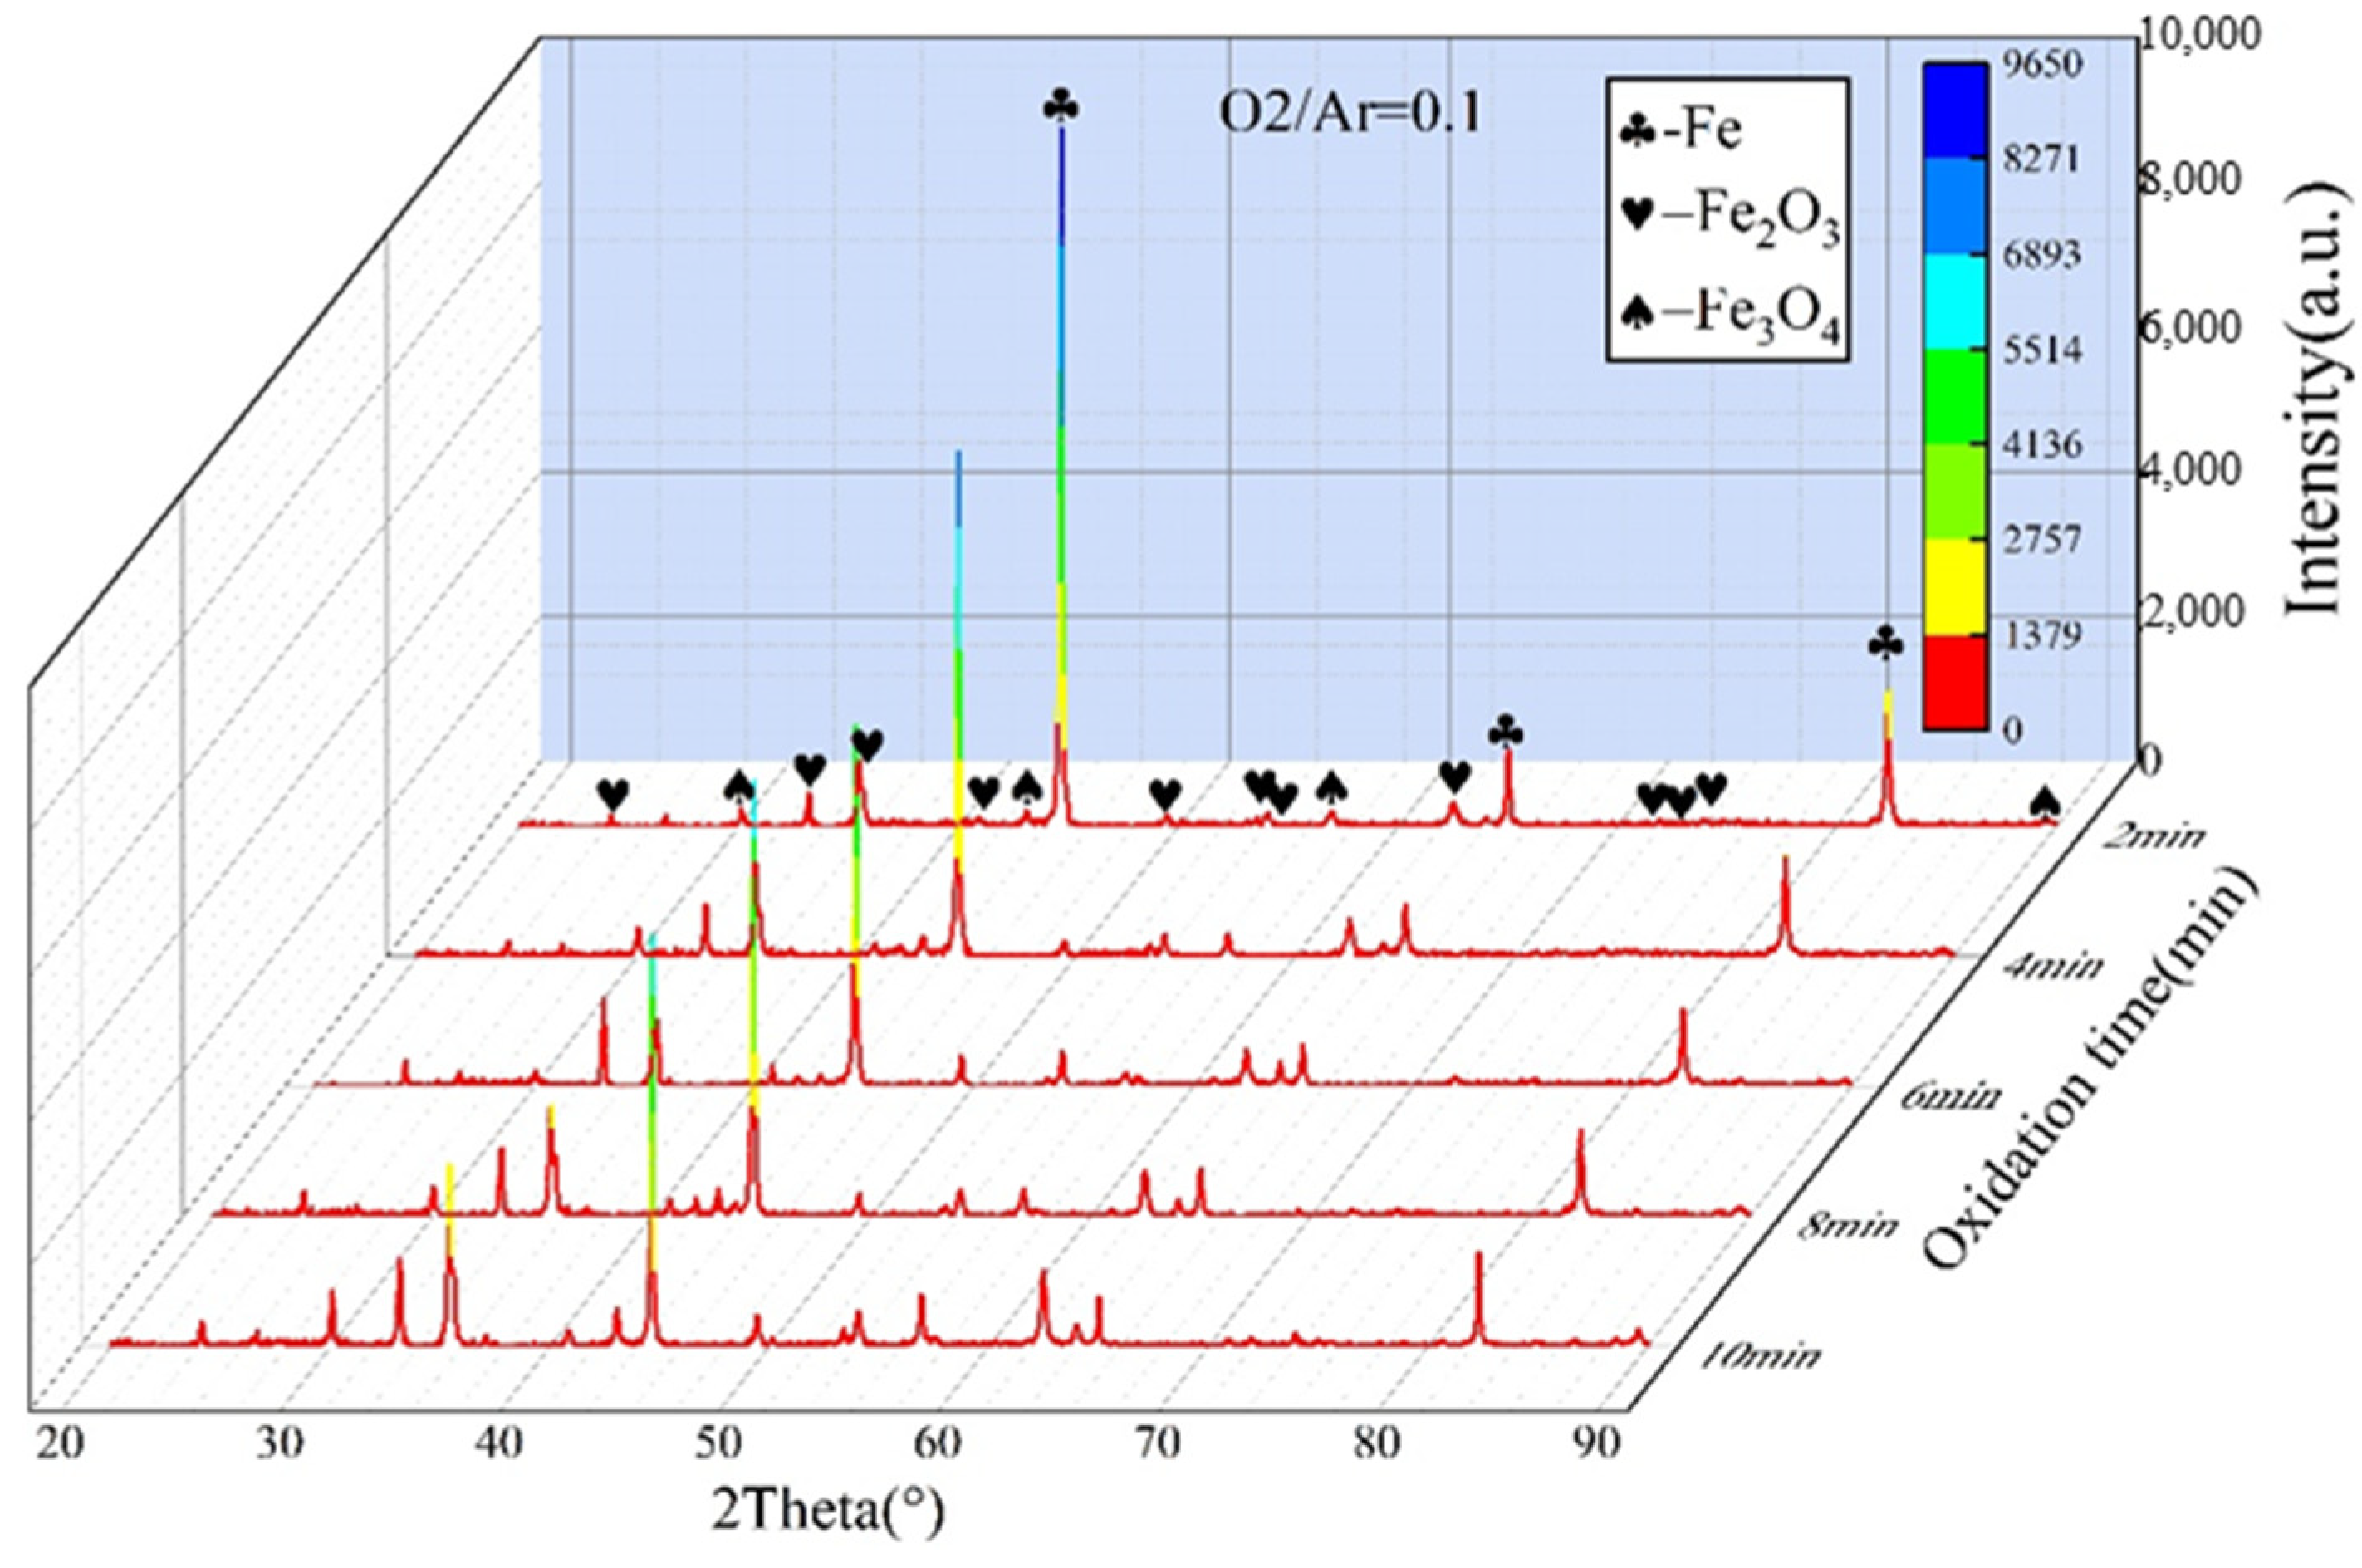
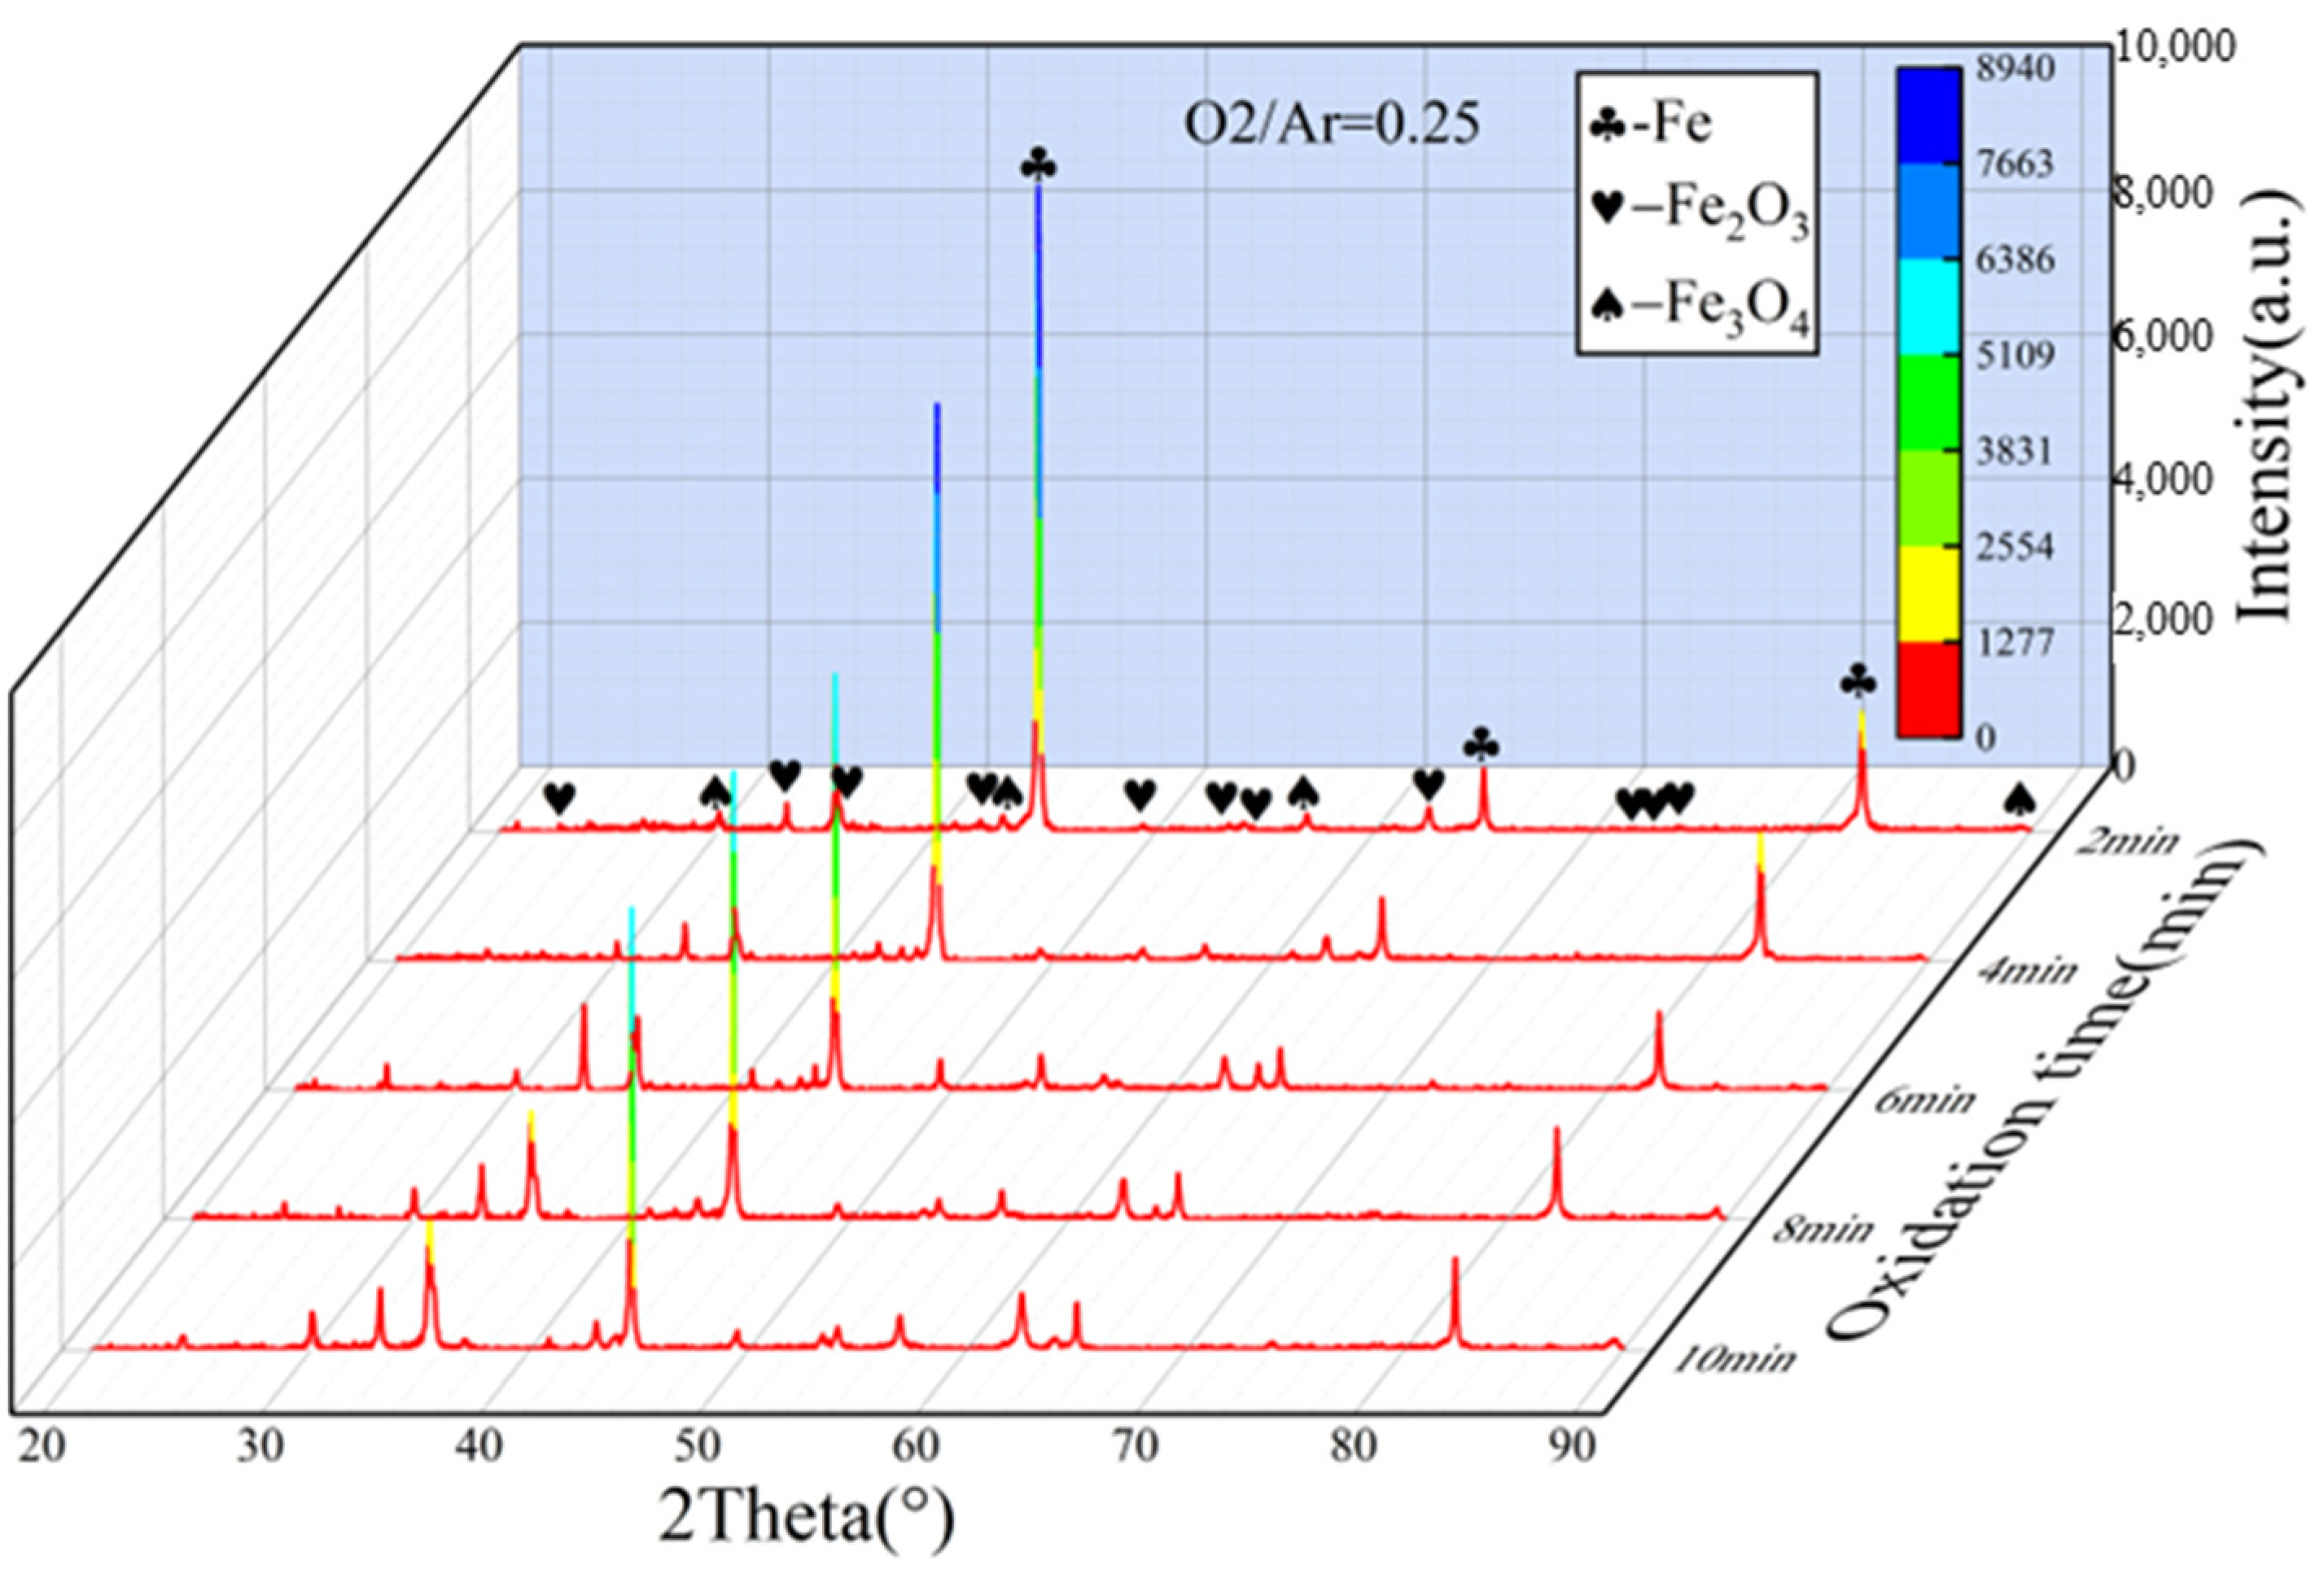
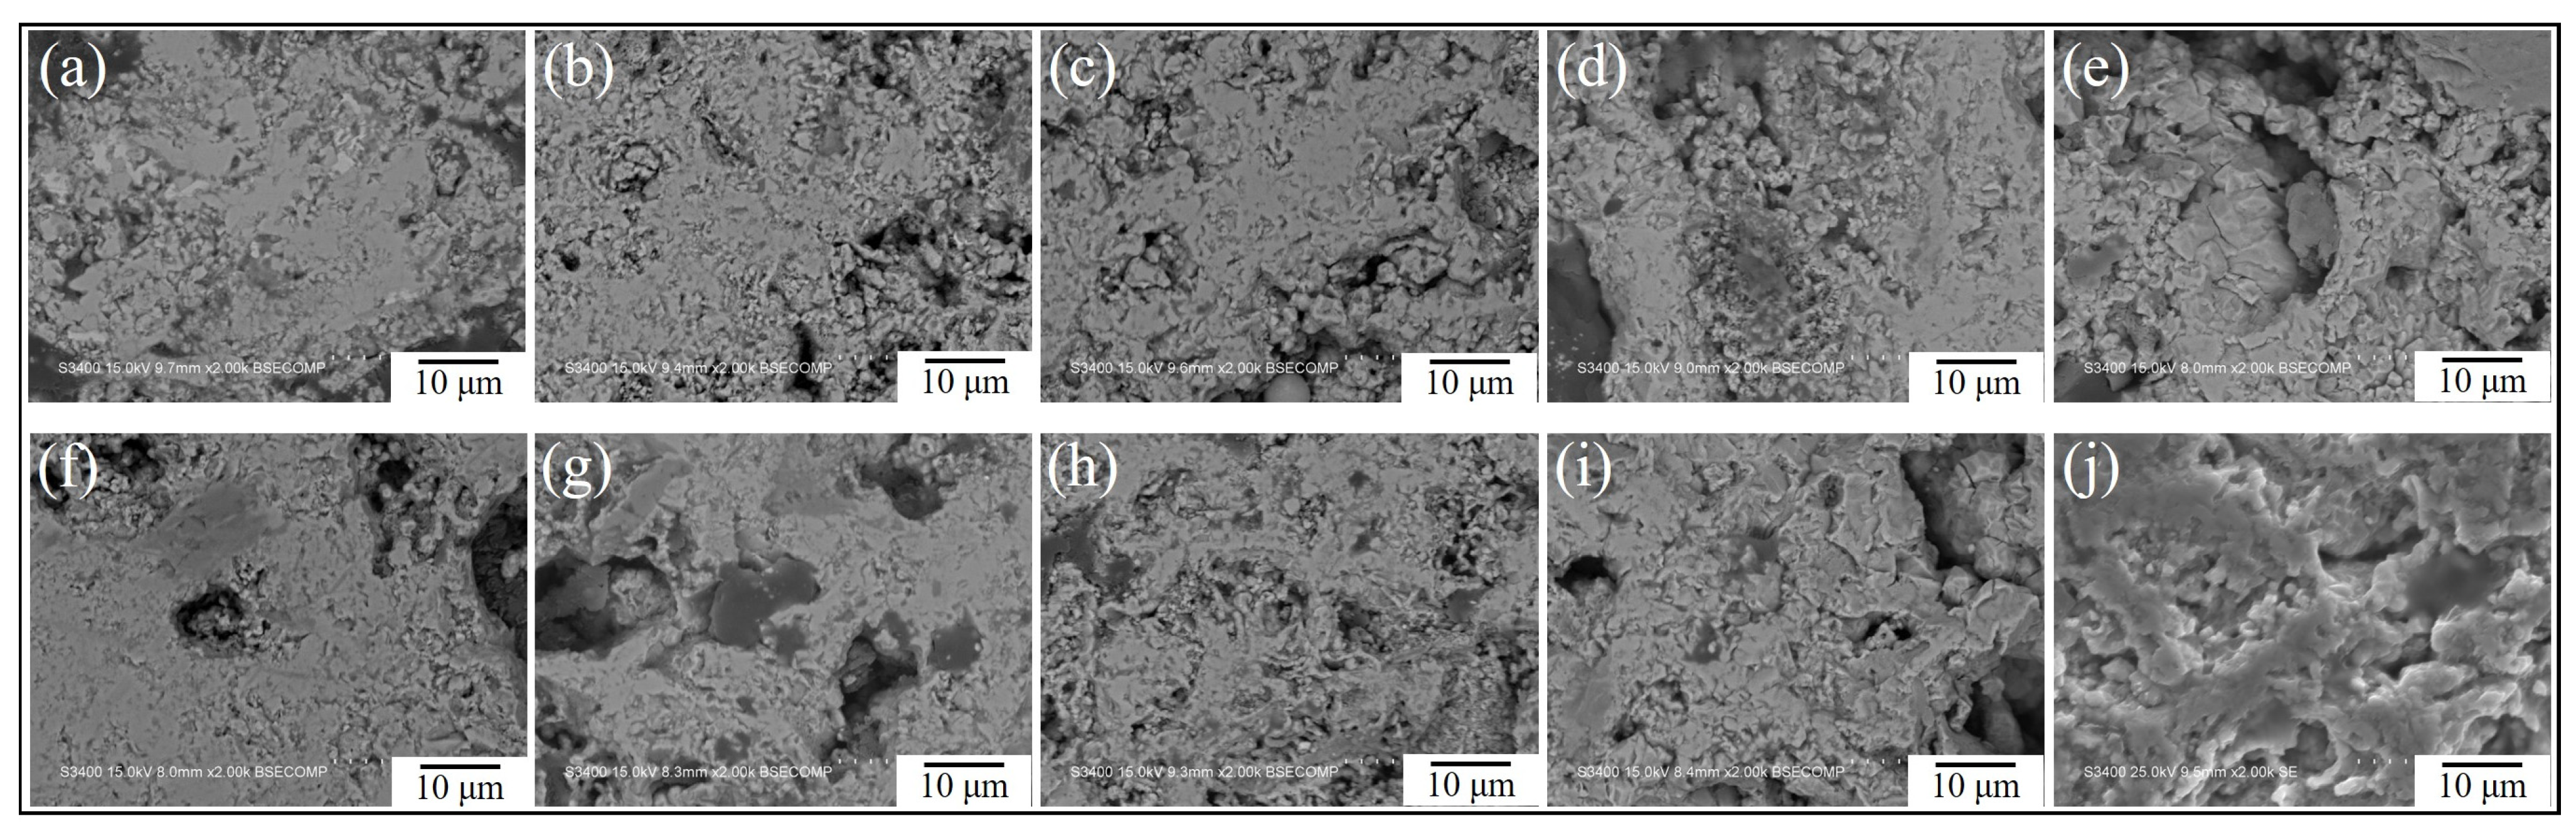
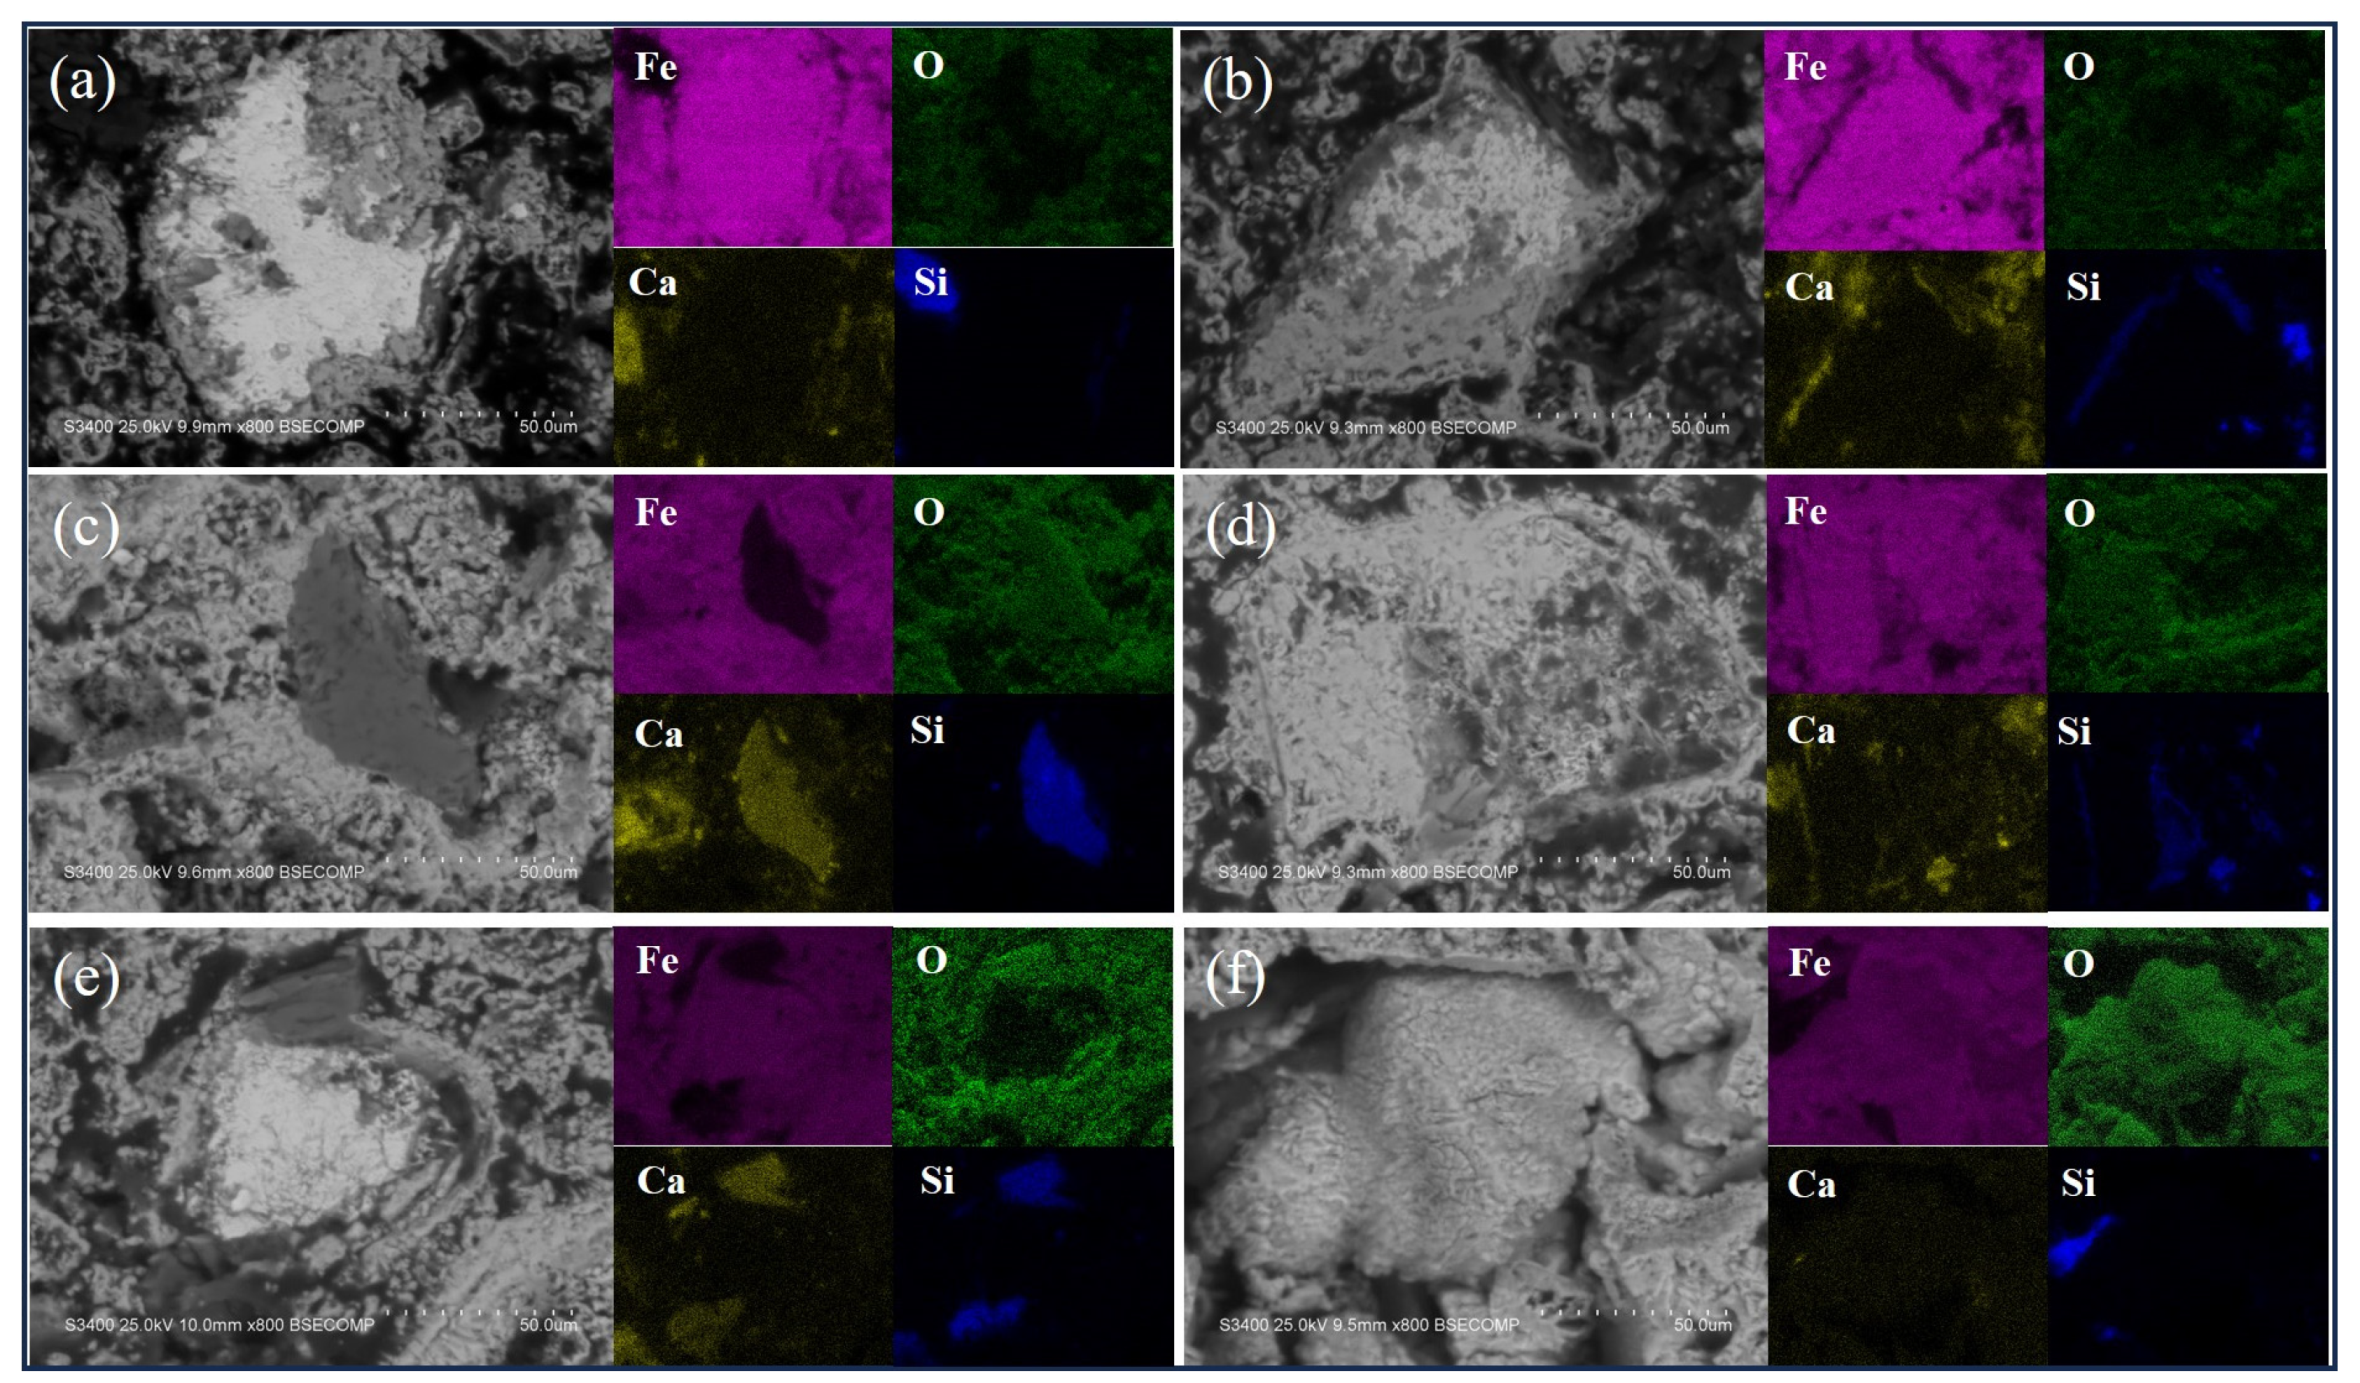
3.2. Analysis of Oxidation Behavior

To investigate the influence of oxidation times and atmospheres on the microstructure of sponge iron, surface microstructure observation was first conducted on the oxidized sponge iron. Figure 3a–j depict the surface microstructure of the oxidized sponge iron under the oxidation atmospheres of O2/Ar = 11/89 and O2/Ar = 21/79. It can be observed that with increasing oxidation time, the surface of the sponge iron under both atmospheres’ transitions from porous granular to dense blocky, eventually forming rod products. Notably, the rod-like products formed under the atmosphere of O2/Ar = 21/79 were larger in size compared to those under O2/Ar = 11/89.
Figure 4 shows the elemental content obtained from the corresponding regions in Figure 3 by the EDAX method. As the oxidation time increased, the oxygen content on the sample surface gradually increased. When the oxidation time was less than 4 min, the atomic ratio of Fe and O in regions 1, 2, 6, and 7 was significantly lower than the stoichiometric ratio of FeO. When the oxidation time reached 6 min, the atomic ratio of Fe and O in regions 3 and 8 approached the stoichiometric ratio of FeO, suggesting that regions 3 and 8 were FeO. When the oxidation time was extended to 8 min, the atomic ratio of Fe and O in regions 4 and 9 approached the stoichiometric ratio of Fe3O4, suggesting that regions 4 and 9 were Fe3O4. When the oxidation sintering time was 10 min, the atomic ratio of Fe and O in regions 5 and 10 approached the stoichiometric ratio of Fe2O3, suggesting that regions 5 and 10 were Fe2O3.
To determine the surface phases of the oxidized sponge iron, a surface phase analysis of the oxidized sponge iron was conducted. Figure 5 shows the surface phase analysis of sponge iron oxidized in an atmosphere of O2/Ar = 11/89. The analysis indicates that the oxidized sponge iron was mainly composed of Fe, Fe3O4, and Fe2O3. The absence of FeO was speculated to be due to its low content, which could not be detected by the X-ray diffraction instrument. Additionally, changes in peak intensity corresponding to the 45° position indicate that with increasing oxidation time, the peak intensity gradually decreased, suggesting a reduction in Fe content in the sample, while the content of Fe3O4 and Fe2O3 increased. Figure 6 presents the surface phase analysis of sponge iron oxidized in an atmosphere of O2/Ar = 21/79. Similar to the O2/Ar = 11/89 atmosphere, the oxidized sample consists of Fe, Fe3O4, and Fe2O3.
To analyze the internal microstructure of the samples, the cross-sections of the oxidized samples were observed. Figure 7a–j depict the cross-sections of the samples oxidized under O2/Ar = 11/89 and O2/Ar = 21/79 atmospheres. With increasing oxidation time, the flatness of the sample cross-section gradually decreased. This is most obvious at an oxidation time of 10 min, possibly due to the rod-like product on the surface of the oxidized sample, which was more fragile and porous compared to other times (as shown in Figure 3e,j), making it prone to detachment during polishing and significantly reducing the surface flatness.
Elemental distribution was performed on the cross-sectioned samples. Figure 8a,c,e show samples oxidized for 2, 4, and 6 min under the O2/Ar = 11/89 atmosphere, respectively, while Figure 8b,d,f show samples oxidized for 2, 4, and 6 min under the O2/Ar = 21/79 atmosphere, respectively. With increasing oxidation time, the Fe content decreased gradually, while the O content increased. Additionally, at 2 min of oxidation time, the O content on the outer side of the sample was significantly lower than that in the interior, indicating that the oxidation reaction proceeds from the outside to the inside. Under the O2/Ar = 21/79 atmosphere, when the sample was oxidized for 6 min, the positions of Fe and O overlapped, indicating that O had diffused into the interior of the sample and reacted.
Based on the X-ray diffraction analysis from Figure 5 and Figure 6, the proportion of Fe2O3 and Fe3O4 in the oxidized samples was analyzed. The results are shown in Figure 9a,b, indicating that with increasing oxidation time, the content of Fe2O3 and Fe3O4 gradually increased, with higher contents of Fe2O3 and Fe3O4 observed under the O2/Ar = 21/79 atmosphere. Thermogravimetric–mass analysis experiments were used to analyze the weight gain of the samples and oxidation rates were calculated from the weight gain data as shown in Figure 9c,d. With increasing oxidation time, both the weight gain rate and oxidation rate of sponge iron gradually increased, with a more obvious trend observed under the O2/Ar = 21/79 atmosphere.

3.3. Oxidation Kinetics Analysis

The oxidation weight gain of sponge iron follows a power function relationship with oxidation time [25], as shown in Equation (1):
ΔMn = knt
where ΔM is the oxidation weight gain; n is the power exponent, serving as the oxidation rate index, which determines the shape of the kinetic curve and the oxidation mechanism of sponge iron; kn is the oxidation rate constant and determinant of the rate of reaction; and t is the oxidation time.
When n is 1, it indicates that the oxidation weight gain of sponge iron is directly proportional to time, showing a linear pattern. This type of oxide film does not have antioxidative properties. When n is 2, it indicates that the square of the oxidation weight gain of sponge iron is directly proportional to time, showing a parabolic pattern, and this type of oxide film has good antioxidative properties. When n is greater than 3, the nth power of the oxidation weight gain is directly proportional to time, and the oxide film on the surface of the sponge iron exhibits better antioxidative properties. To analyze the oxidation kinetics of sponge iron, the logarithm of both sides of Equation (1) was taken:
ln(ΔM) = 1/nlnkn + 1/nlnt
The data in Figure 9c are logarithmically transformed, and the results are shown in Figure 10a,b. By fitting with piecewise linear regression, the oxidation rate index (n) values of sponge iron at different stages can be obtained, as shown in Table 2. The results showed that the oxidation rate index values of sponge iron differ under different atmospheres. Under the O2/Ar = 11/89 atmosphere, the n value for the entire oxidation stage is 0.68, indicating a relatively rapid oxidation rate of sponge iron, which hinders the formation of a stable, protective oxide layer and may lead to a continuous oxidation process. Conversely, under the O2/Ar = 21/79 atmosphere, the initial oxidation stage exhibits an n value of 1.17, suggesting a slower oxidation rate of sponge iron that facilitates the formation of a protective oxide film. However, after exceeding 6 min of oxidation time, the n value drops to 0.33, signifying an increased oxidation rate where the surface of sponge iron fails to maintain a continuous protective oxide film, thus allowing further oxidation. The oxidation behavior of sponge iron significantly deviates from the unreacted core model due to differences in physical structure and chemical reaction kinetics; the porous structure of sponge iron accelerates and intensifies oxidation reactions, whereas the dense structure and surface oxide film formation in the unreacted core model impede oxidation kinetics.

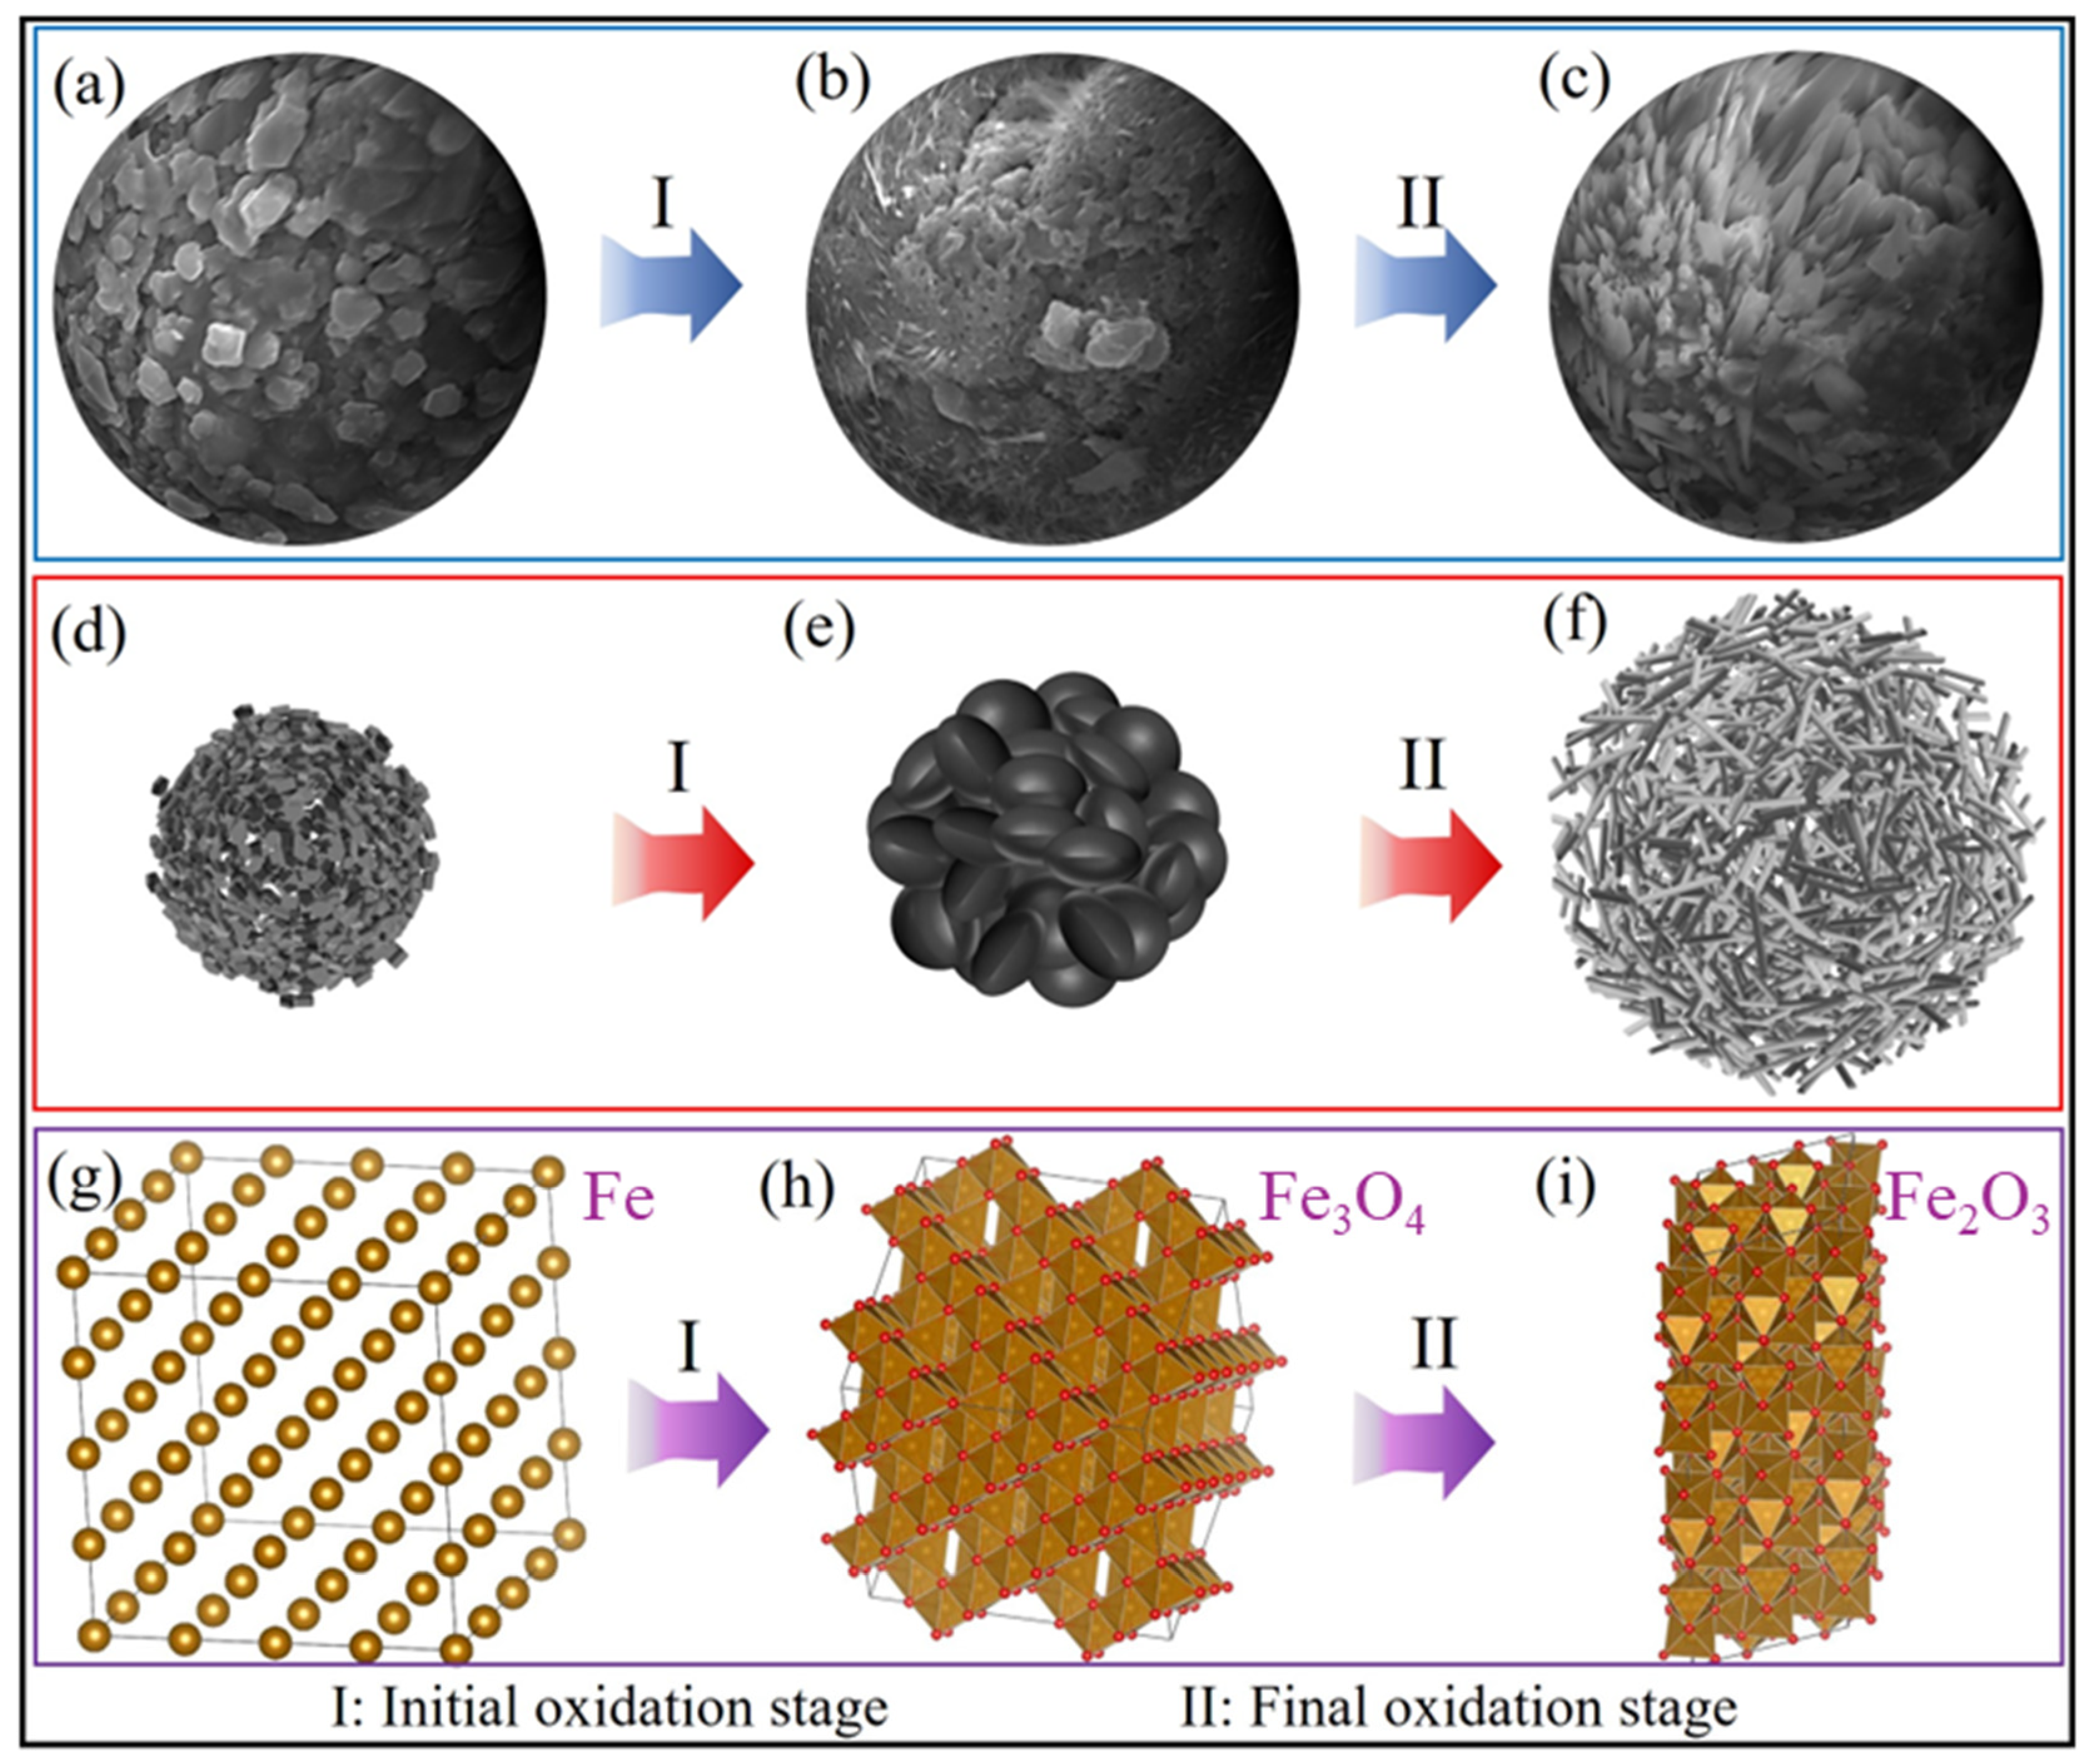
3.4. Analysis of Oxidation Mechanism

This study elucidated the oxidation mechanism of sponge iron based on the results of previous experiments, and a schematic diagram illustrating this mechanism is presented in Figure 11. Before oxidation, the surface of sponge iron exhibited a granular porous structure with a bcc Fe crystal structure. During the initial oxidation stage, the surface of the sample changed to a dense bulk structure with an Fe3O4 crystal structure. In the final oxidation stage, the surface of the sample transitions to a rod structure with an Fe2O3 crystal structure.

4. Conclusions

This study explored the impact of two different atmospheres on the reoxidation kinetics of sponge iron, elucidated the sequence of sponge iron oxidation reactions, clarified the mechanism of oxide formation, and analyzed the kinetic characteristics of sponge iron oxidation. The main conclusions are as follows:
(1)
The oxidation products of sponge iron predominantly comprise Fe2O3 and Fe3O4, and compared with Fe3O4, Fe2O3 is the most difficult to form.
(2)
With the extension of oxidation time, the surface of sponge iron changed from a granular porous structure (Fe) to a dense bulk structure (Fe3O4) and was finalized as a rod structure (Fe2O3).
(3)
In an O2/Ar = 21/79 atmosphere, the oxide content was higher than that in an O2/Ar = 11/89 atmosphere, and the content of oxidation products gradually increased with the extension of oxidation time.
(4)
In an O2/Ar = 11/89 atmosphere, the n value for the entire stage was 0.68, indicating that the oxidation rate of sponge iron was relatively fast in this process.

Author Contributions

P.J.: Conceptualization, Methodology, Supervision, Writing—Review and Editing. C.Z.: Data Curation, Formal Analysis. X.L.: Methodology, Supervision. W.P.: Investigation, Methodology, Conceptualization, Funding Acquisition, Writing—Review and Editing. All authors have read and agreed to the published version of the manuscript.

Funding

This work was supported by the Open Project of the State Key Laboratory of Advanced Special Steel, Shanghai Key Laboratory of Advanced Ferrometallurgy, Shanghai University (SKLASS 2023-13), and the Science and Technology Commission of Shanghai Municipality (No. 19DZ2270200). Thanks to Bin-nan Liu, Wei Zhang, and Yibo Jiang for their help in completing this manuscript.

Data Availability Statement

The original contributions presented in this study are included in the article. Further inquiries can be directed to the corresponding authors.

Conflicts of Interest

The authors declare that they have no known competing financial interests or personal relationships that could have appeared to influence the work reported in this paper.

References

  1. Ghadi, A.Z.; Radfar, N.; Valipour, M.S.; Sohn, H.Y. A Review on the Modeling of Direct Reduction of Iron Oxides in Gas-Based Shaft Furnaces. Steel Res. Int. 2023, 94, 2200742. [Google Scholar] [CrossRef]
  2. Cavaliere, P.; Perrone, A.; Marsano, D.; Primavera, V. Hydrogen-Based Direct Reduction of Iron Oxides Pellets Modeling. Steel Res. Int. 2023, 94, 2200791. [Google Scholar] [CrossRef]
  3. Cavaliere, P.; Perrone, A.; Marsano, D. Effect of reducing atmosphere on the direct reduction of iron oxides pellets. Powder Technol. 2023, 426, 118650. [Google Scholar] [CrossRef]
  4. Kaushik, P.; Fruehan, R.J.; Kaushik, P.; Fruehan, R.J. Behavior of direct reduced iron and hot briquetted iron in the upper blast furnace shaft: Part I. Fundamentals of kinetics and mechanism of oxidation. Metall. Mater. Trans. B 2006, 37, 715–725. [Google Scholar] [CrossRef]
  5. Kaushik, P.; Fruehan, R.J. Behavior of direct reduced iron and hot briquetted iron in the upper blast furnace shaft: Part II. A model of oxidation. Metall. Mater. Trans. B 2006, 37, 727–732. [Google Scholar] [CrossRef]
  6. Dutta, S.K.; Chokshi, Y.B. Basic Concepts of Iron and Steel Making; Springer Nature: Berlin/Heidelberg, Germany, 2020. [Google Scholar]
  7. Hajidavalloo, E.; Alagheband, A. Thermal analysis of sponge iron preheating using waste energy of EAF. J. Mater. Process. Tech. 2008, 208, 336–341. [Google Scholar] [CrossRef]
  8. Karami, M.; Koohestani, H.; Gholami, H. Investigation of the effect of geometrical shape of sponge iron on the operating parameters of the induction furnace. Can. Metall. Quart. 2023, 62, 356–361. [Google Scholar] [CrossRef]
  9. Fradet, Q.; Ali, M.L.; Riedel, U. Development of a porous solid model for the direct reduction of iron ore pellets. Steel Res. Int. 2022, 93, 2200042. [Google Scholar] [CrossRef]
  10. Cavaliere, P.; Dijon, L.; Laska, A.; Koszelow, D. Hydrogen direct reduction and reoxidation behaviour of high-grade pellets. Int. J. Hydrogen Energy 2024, 49, 1235–1254. [Google Scholar] [CrossRef]
  11. De Mello, J.D.B.; Binder, R.; Klein, A.N.; Hutchings, I.M. Effect of compaction pressure and powder grade on microstructure and hardness of steam oxidised sintered iron. Powder Metall. 2001, 44, 53–61. [Google Scholar] [CrossRef]
  12. Wang, W.F. Effect of powder type and compaction pressure on the density, hardness and oxidation resistance of sintered and steam-treated steels. J. Mater. Eng. Perform. 2007, 16, 533–538. [Google Scholar] [CrossRef]
  13. Daghagheleh, O.; Schenk, J.; Zheng, H.; Taferner, B.; Forstner, A.; Rosenfellner, G. Long-Term Reoxidation of Hot Briquetted Iron in Various Prepared Climatic Conditions. Steel Res. Int. 2023, 94, 2200535. [Google Scholar] [CrossRef]
  14. Al-Saraireh, F.M. Experimental Investigation of Thermofriction’s Impact on Surface Hardness of Steel Products’. Manuf. Technol. 2023, 23, 319–325. [Google Scholar] [CrossRef]
  15. Wei, X.Y.; Qian, Y. Experimental study on the low to medium temperature oxidation characteristics and kinetics of micro-size iron powder. CIESC J. 2023, 74, 2624. [Google Scholar]
  16. Bandopadhyay, A.; Ganguly, A.; Gupta, K.N.; Ra, H.S. Investigations on the anomalous oxidation behaviour of high-carbon gas-based direct reduced iron (DRI). Thermochim. Acta 1996, 276, 199–207. [Google Scholar] [CrossRef]
  17. Bodas, M.G.; Dash, D.R.; Sivaramakrishnan, C.S. Oxidation of iron powder in a fluidized bed reactor. Mater. Design 1996, 17, 167–172. [Google Scholar] [CrossRef]
  18. Van Diepen, A.M.; Vledder, H.J.; Langereis, C. The nature of the passivating oxide layer on iron powder. Appl. Phys. 1978, 15, 163–166. [Google Scholar] [CrossRef]
  19. Choisez, L.; Rooij, N.E.V.; Hessels, C.J.M.; Silva, A.K.D.; Souza Filho, I.R.; Ma, Y.; Goey, P.D.; Springer, H.; Raab, D. Phase transformations and microstructure evolution during combustion of iron powder. Acta Mater. 2022, 239, 118261. [Google Scholar] [CrossRef]
  20. AbdElmomen, S.S. Reoxidation of direct reduced iron in ambient air. Ironmak. Steelmak. 2014, 41, 107–111. [Google Scholar] [CrossRef]
  21. Lysenko, E.N.; Nikolaev, E.V.; Vlasov, V.A.; Zhuravko, S.P. Investigation of oxidation process of mechanically activated ultrafine iron powders. IOP Conf. Ser. Mater. Sci. Eng. 2016, 110, 012093. [Google Scholar] [CrossRef]
  22. Lysenko, E.N.; Vlasov, V.A.; Surzhikov, A.P.; Kupchishin, A.I. Kinetic Study of Lithium–Zinc Ferrite Synthesis Under Electron Beam Heating Conditions. Inorg. Mater. Appl. Res. 2022, 13, 494. [Google Scholar] [CrossRef]
  23. Lysenko, E.N.; Surzhikov, A.P.; Nikolaev, E.V.; Vlasov, V.A.; Zhuravkov, S.P.J. The oxidation kinetics study of ultrafine iron powders by thermogravimetric analysis. Therm. Anal. Calorim. 2014, 115, 1447–1452. [Google Scholar] [CrossRef]
  24. Yuan, Z.; Sohn, H.Y. Re-oxidation kinetics of flash reduced iron particles in O2–N2 gas mixtures relevant to a novel flash ironmaking process. ISIJ Int. 2014, 54, 1235–1243. [Google Scholar] [CrossRef]
  25. Agustianingrum, M.P.; Latief, F.H.; Park, N.; Lee, U. Thermal oxidation characteristics of Fex (CoCrMnNi) 100-x medium and high-entropy alloys. Intermetallics 2020, 120, 106757. [Google Scholar] [CrossRef]
Figure 1. Schematic diagram of raw materials and equipment: (a) morphology of sponge iron, (b) microstructure of sponge iron, (c) phase composition of sponge iron, (d) equipment.
Metals 15 00508 g001
Figure 2. Gibbs free energy change of iron oxidation reaction at different temperatures.
Metals 15 00508 g002
Figure 3. Surface microstructure of sponge iron after oxidation: (ae) O2/Ar = 11/89, oxidized for 2, 4, 6, 8, and 10 min, respectively; (fj) O2/Ar = 21/79, oxidized for 2, 4, 6, 8, and 10 min, respectively.
Metals 15 00508 g003
Figure 4. Elemental analysis results of corresponding regions in Figure 3.
Metals 15 00508 g004
Figure 5. Surface phase analysis of oxidized sponge iron in O2/Ar = 11/89 atmosphere.
Metals 15 00508 g005
Figure 6. Surface phase analysis of oxidized sponge iron in O2/Ar = 21/79 atmosphere.
Metals 15 00508 g006
Figure 7. Cross-section microstructure of sponge iron after oxidation: (ae) O2/Ar = 11/89, oxidized for 2, 4, 6, 8, and 10 min, respectively; (fj) O2/Ar = 21/79, oxidized for 2, 4, 6, 8, and 10 min, respectively.
Metals 15 00508 g007
Figure 8. Element distribution: (a,c,e) O2/Ar = 11/89, oxidized for 2, 4, and 6 min, respectively; (b,d,f) O2/Ar = 21/79, oxidized for 2, 4, and 6 min, respectively.
Metals 15 00508 g008
Figure 9. (a,b) The content of Fe2O3 and Fe3O4 in oxidized sponge iron and (c,d) the weight gain rate and oxidation rate, respectively.
Metals 15 00508 g009
Figure 10. Kinetic characteristic curve of sponge iron oxidation: (a) O2/Ar = 11/89, (b) O2/Ar = 21/79.
Metals 15 00508 g010
Figure 11. Schematic diagram of sponge iron oxidation mechanism: (ac) microstructure transformation during sponge iron oxidation, (df) microstructure evolution during sponge iron oxidation, and (gi) phase evolution of sponge iron during sponge iron oxidation.
Metals 15 00508 g011
Table 1. Oxidation experiment parameters of sponge iron.
Atmosphere2 min4 min6 min8 min10 min
O2/Ar = 11/89
O2/Ar = 21/79
Table 2. Oxidation rate index of sponge iron under different atmospheres.
Oxidation Time (min)O2/Ar = 0.1O2/Ar = 0.25
2–6n1 = 0.68n1 = 1.17
6–10n2 = 0.68n2 = 0.33
Disclaimer/Publisher’s Note: The statements, opinions and data contained in all publications are solely those of the individual author(s) and contributor(s) and not of MDPI and/or the editor(s). MDPI and/or the editor(s) disclaim responsibility for any injury to people or property resulting from any ideas, methods, instructions or products referred to in the content.

