Article

Composites Cu–Ti3SiC2 Obtained via Extrusion-Based Additive Manufacturing: Structure and Tribological Properties

Institute of Strength Physics and Materials Science SB RAS, Tomsk 634055, Russia
*
Author to whom correspondence should be addressed.
Metals 2025, 15(5), 493; https://doi.org/10.3390/met15050493
Submission received: 28 March 2025 / Revised: 22 April 2025 / Accepted: 26 April 2025 / Published: 28 April 2025

Abstract

:
In the present study, composites Cu–Ti3SiC2 were obtained via extrusion-based additive manufacturing technology. The composite was characterized in terms of its structure, mechanical properties, and tribological properties. The use of a low-energy additive manufacturing technique allows for the avoidance of the decomposition of the MAX phase while obtaining bulk samples. The optimal composition of 50 vol.% of Ti3SiC2 and 50 vol.% of Cu was selected based on the flow rate of feedstock melt and the density of the samples. The resulting composite exhibited a dense copper matrix with Ti3SiC2 and TiC inclusions, achieving 97% density and 62% IACS electrical conductivity. Tribological tests under varying loads, speeds, and temperatures demonstrated that increasing the load and speed increased the coefficient of friction and the wear rate, while higher temperatures reduced friction due to surface oxidation.

Graphical Abstract

1. Introduction

MAX phases represent a unique class of layered carbides and nitrides that combine the properties of both ceramics and metals [1,2]. One of the most studied MAX phases is Ti3SiC2, which attracts attention due to its high thermal resistance, self-healing surface capability, good electrical conductivity, and oxidation resistance [3,4,5]. These materials exhibit high strength and plasticity, making them promising for applications in extreme conditions such as aerospace, energy, and electronics. However, despite its advantages, Ti3SiC2 also has drawbacks, including relatively low hardness and limited resistance to cyclic loading, which stimulates research into creating composites based on it.
One promising direction is the development of Cu–Ti3SiC2 composites, where copper, with its high thermal and electrical conductivity, is combined with the thermal resistance and strength of the MAX phase. Such materials could find applications in electronics, heat exchangers, and other fields requiring high thermal or electrical conductivity and mechanical stability. Inclusions of Ti3SiC2 increase wear resistance and reduce the friction coefficient of the copper-based composite compared to pure copper without a critical loss of conductivity [6,7,8]. The effect of self-lubrication of Ti3SiC2 is also useful for improving the wear behavior of Cu/Ti3SiC2 composites along with graphite [9] and other materials [8,10,11].
In recent years, additive manufacturing methods, such as selective laser melting (SLM), have been actively explored to create composites with enhanced properties [12,13,14]. However, a challenge in applying these technologies to Ti3SiC2 composites is the high energy input, which leads to the decomposition of MAX phases if it is not in situ synthesized [15,16,17]. Therefore, additive technologies with low energy input are more promising for producing MAX phase composites. These include binder jetting [18], laminated object manufacturing [19], cold spray [20], and others. One of the most promising low-temperature additive manufacturing technologies is the extrusion of granulated material known as the fused granulate fabrication (FGF) technique [21,22,23,24]. In this technology, the powder of the desired material is introduced into a polymer, and the resulting granules (pellets) are shaped using a 3D printer (similar to FDM technology). In the next stage, the polymer is removed in solvent or at a temperature, and then the powder is sintered using powder metallurgy techniques.
In this study, a Cu-Ti3SiC2 composite produced via extrusion-based additive manufacturing is investigated. The structure, mechanical properties, and tribological properties of the composite material are investigated and described. The selection of the optimal composition in terms of the formation of the correct structure and properties is described. The structure of the composite is investigated using different techniques, with special attention to changes in phase composition during composite processing. The tribological behavior of the composite was studied under different speeds, loads, and temperatures.

2. Materials and Methods

This study used commercial Ti3SiC2 powder produced in Wuhan Golden Wing Industry (Wuhan, China) with a purity of 98% and d50 = 10 µm, d90 = 20 µm (Figure 1a), and copper (PCEP, Ekaterinburg, Russia) with a purity of 99.9% and d50 = 60 µm, d90 = 100 µm (Figure 1b). A commercial polymer binder, MC-2162 (Emery Oleochemicals, Germany), consisting of several components, was used for the feedstock. The feedstock had a Ti3SiC2:Cu ratio of 50:50 (vol.%), and a powder:polymer ratio of 60:40.
The powder mixtures were prepared in a turbulent mixer (Turbula S2.0, Vibrotechnik JSC, Saint Petersburg, Russia) at a rotation frequency of 40 Hz without grinding bodies for 240 min. The polymer was then added to the powder and mixed for an additional 30 min. The resulting dry mixture was mixed in a sigma-Z-shaped mixer Brabender (Anton Paar, Graz, Austria) at 140 °C for 15 min. The billets obtained were passed through a single screw extruder with different nozzles. The diameter of the nozzle was reduced after each pass. Nozzles with diameters of 5, 1, 0.8, and 0.6 mm were used. After passing through the 0.6 mm nozzle, the material was cut into 3–4 mm long granules in a specialized cutter, forming the final feedstock. The melt flow rate (MFR) of the feedstock was measured according to ISO 1133 [25] at 140 °C with a 5 kg load.
Additive manufacturing of the samples was performed on a Sovol SV08 setup with a print head designed for granulated material (Greenboy3D Pellet Extruder, Greenboy3D, Schloß Holte-Stukenbrock, Germany). Samples were printed in the form of rectangular blocks with dimensions of 25 × 5 × 5 mm3 (Figure 2). To achieve the highest sample density, the following printer parameters were used: nozzle diameter of 0.8 mm, nozzle temperature of 140 °C, layer thickness of 200 µm, print speed of 60 mm/s, extrusion ratio of 1.4, and mandatory cooling of the printing area. The infill pattern was rectilinear. The extrusion setting, which affects the extrusion speed relative to the print speed, was varied in the experiments. The optimal setting was the one that provided the highest reference density of the samples. Low values resulted in pores within the sample, reducing density, while high values caused over-extrusion, reducing the sample quality and shape stability.
After obtaining the samples, the polymer binder was removed (debinding process) in acetone at room temperature for 150 h. After the debinding, the samples were dried in a muffle furnace at 60 °C for 24 h, then sintered in a vacuum furnace (Nabertherm GmbH, Lilienthal, Germany) at 1050 °C with an isothermal hold for 240 min. The heating rate was 5 K/min.
The microstructure and fracture surfaces of the obtained samples were examined using a LEO EVO 50 (Carl Zeiss, Jena, Germany) scanning electron microscope (SEM) with secondary electrons (SEs) and backscattered electron detectors (BSDs). An energy-dispersive X-ray spectroscopy (EDX) attachment (Oxford Instruments, Abingdon, UK) was used to investigate the elemental composition of the samples. The density was determined by Archimedes’ method in kerosene. The phase composition was analyzed using X-ray diffraction (XRD) on a Shimadzu XRD-7000 (Shimadzu, Kyoto, Japan). Vickers hardness was measured using a Duramin-500 (Struers, Copenhagen, Denmark) hardness tester at a 500 gf load and 10 s dwell time. Mechanical properties were determined using a three-point bending test (ASTM E290) [26] on a Gotech Al-7000M (Gotech Testing Machines Inc., Zhengzhou, China) test machine. A series of five samples was used in mechanical testing.
The electrical conductivity of the samples and their comparison with the international annealed copper sample (IACS) was carried out using a 34410A multimeter (Keysight Technologies, Santa Rosa, CA, USA), verified in January 2025. Segments 6 mm in diameter and 10 mm long were cut by the EDM method from cylindrical pressed samples. To verify the measuring method, measurements were taken on a copper wire 6 mm in diameter and 10 mm long, showing 99% IACS conductivity.
Samples for tribological testing were prepared from additively manufactured samples. After cutting on an electrical discharge machine, the samples had the following dimensions: height—13 ± 0.1 mm; width and thickness—1.2 ± 0.1 mm. Surface preparation of the samples was conducted by mechanical grinding on abrasive paper. Counterparts made of 100Cr6 steel were mechanically ground on abrasive paper. Tribological tests were conducted on a TRIBOtechnic tribometer using a “pin-on-disk” scheme with three variable parameters: load ( F n , N), speed (V, m/s), and temperature (T, °C). The duration of each test was 1 h. Table 1 shows the test parameters for the studied samples.
The wear surfaces of the samples were examined using an Olympus LEXT OLS4100 laser confocal microscope (Tokyo, Japan) and a Tescan Vega 3 scanning electron microscope (Brno, Czechia). Surface roughness (Ra) was measured using the Olympus LEXT OLS4100 (ver. 3.1.5) microscope software. Wear was determined by the change in sample mass using SARTORIUS LV210-A analytical scales (SARTORIUS, Göttingen, Germany).

3. Results and Discussion
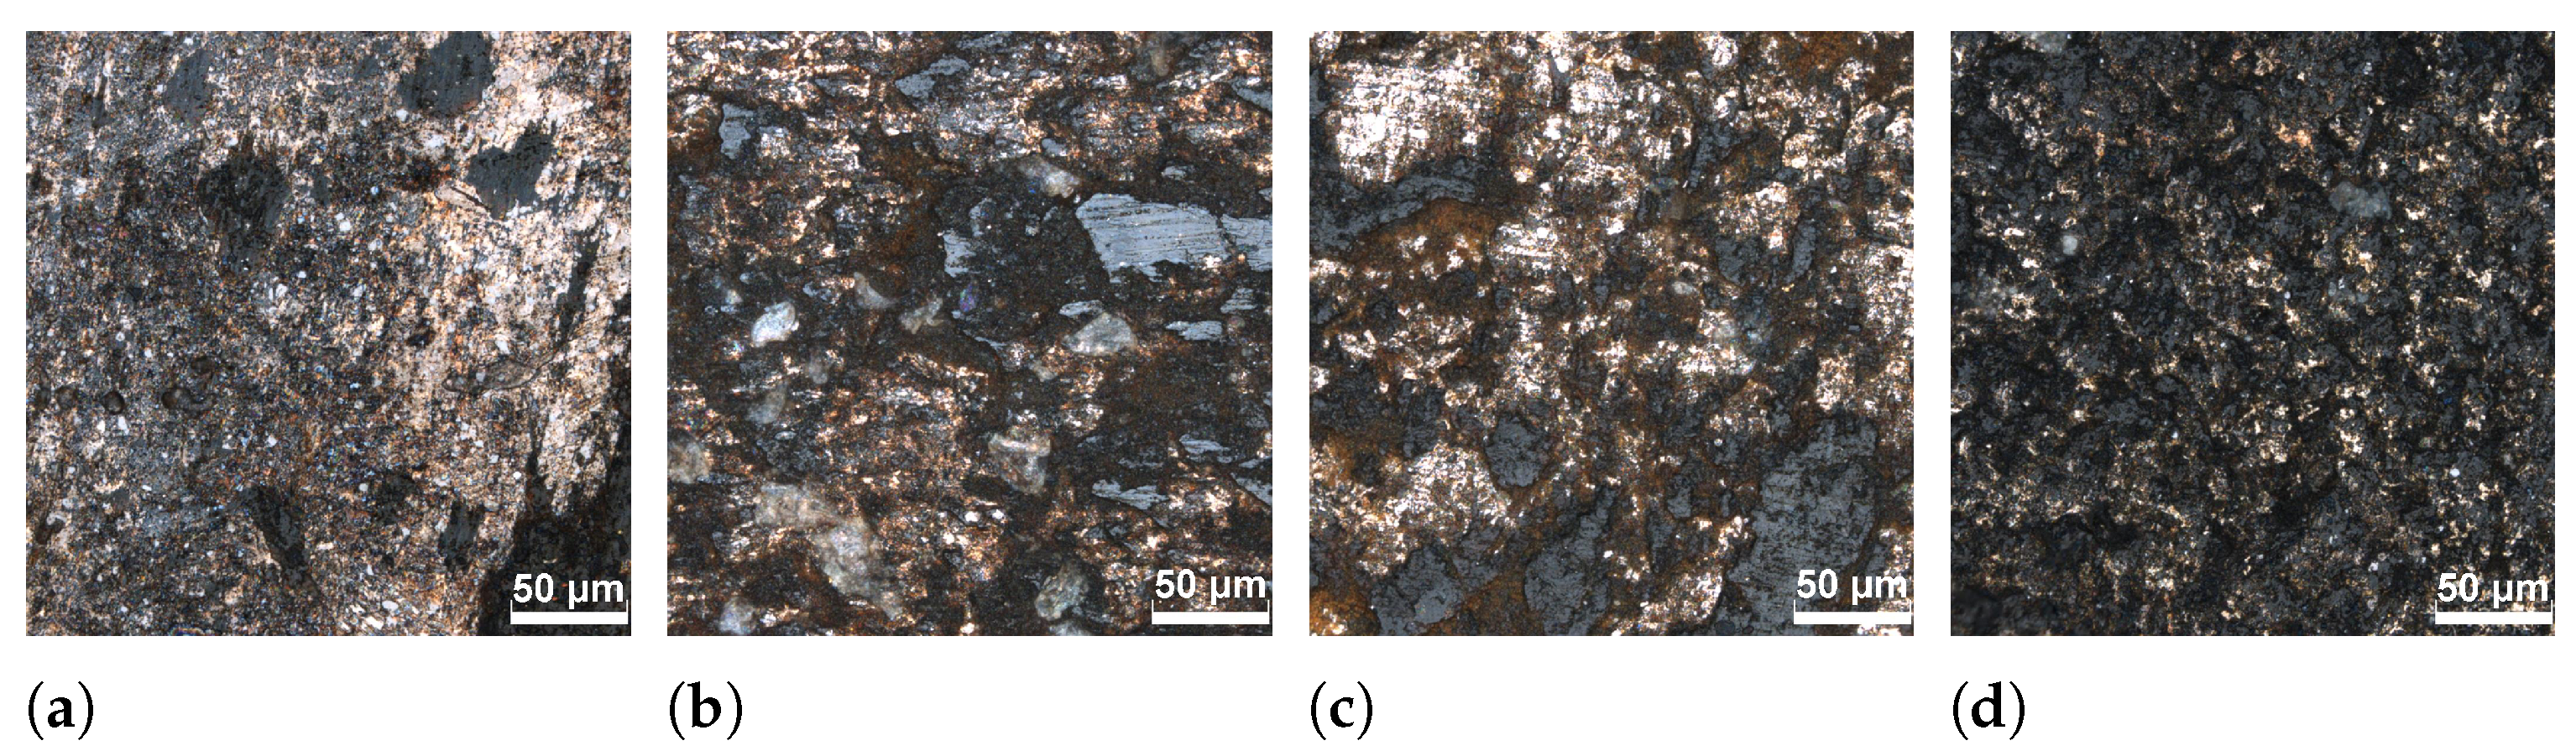
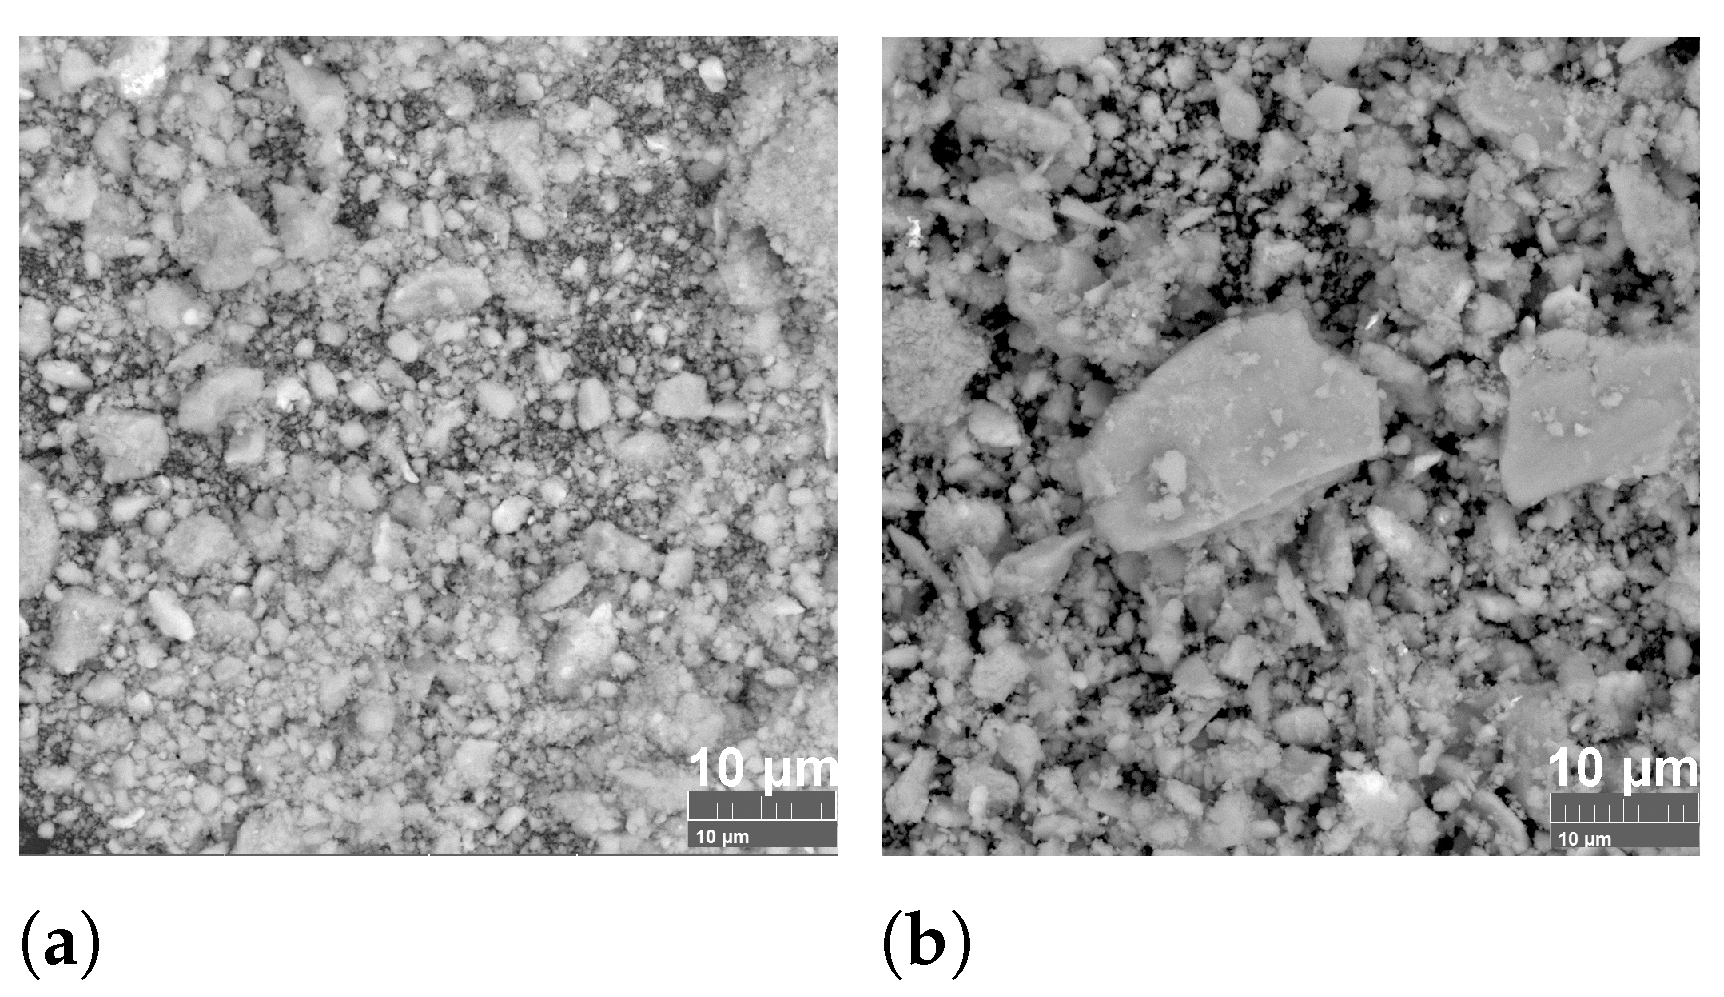
3.1. Structure

The goal was to obtain the densest samples with the highest copper content. The highest copper content is necessary to ensure the best electrical properties of the materials. High sample density is achieved with the highest density of the printed green samples. In turn, green samples with the highest density can only be obtained with good feedstock flowability—the MFR (melt flow rate) of the material must be at least 15 g/10 min. When using a feedstock with a lower MFR, the printing process is unstable, which leads to the appearance of a large number of macro defects. The flowability of the feedstock was measured depending on the Cu:Ti3SiC2 ratio in the samples (Figure 3). It was found that as the copper content in the mixture increases, the MFR monotonically decreases, and after reaching a 50:50 ratio, the MFR drops sharply. Feedstock with pure copper has zero flowability. The main reason for the low flowability of pure copper is the complex particle shape and the presence of particle agglomerates. A composition with a 50:50 ratio and an MFR of 21.7 ± 1.2 g/10 s was chosen for sample production.
The samples were sintered at 1050 °C for 4 h, similar to previously studied Cu-Ti3AiC2 samples [27]. All bulk samples investigated were obtained using MEAM AM. The main mechanism of strength formation in both systems is the formation of a copper matrix through copper sintering. The temperature is optimal for forming a strong copper matrix without liquid phase formation (which could lead to mass loss due to leakage) and intense decomposition of the MAX phase.
The decomposition of the MAX phase was studied using in situ XRD, where diffraction patterns were taken during heating, and changes in the phase composition were recorded (Figure 4). The initial phase composition consisted mainly of Cu and Ti3SiC2, with additional Ti-C, Si-C, and Ti-Si compounds as impurities in the original Ti3SiC2.
The analysis was performed on powder (Figure 4a) and bulk (Figure 4c) samples. During heating, the peaks shift towards smaller angles for all samples (Figure 4b). The shift occurs due to a change in the lattice parameters of the material during heating. This shift was taken into account when interpreting the XRD patterns. The phase composition of the powders after sintering shows (Figure 4d) the content of the Cu-Pt phases (the result of the interaction of copper with the platinum heating table), as well as Cu-Si (the result of the interaction of copper with silicon—the decomposition product of the MAX phase).
For powder samples, it was found that there is an active decrease in the intensity of the copper reflex after a temperature of 1000 °C, and by the time the sintering temperature of 1050 °C is reached, pure copper is completely absent from the powder structure. At the same time, bulk samples show that the decrease in the copper content at 1050 °C is only in the initial stage, and pure copper is still present in the sample in sufficient quantities. In this case, both powder and bulk samples contain the MAX phase at all temperatures. The decrease in copper content is explained by the formation of solid solutions, which is partly related to the kinetics of decomposition of the MAX phase at high temperatures.
The main reaction of the MAX phase decomposition at temperatures up to 1500–1800 °C is its decomposition into titanium carbide and silicon (1):
T i 3 S i C 2 3 T i C 0.67 + S i ( g )
In the presence of excess carbon, reaction (2) can occur, but it is described as the main reaction at temperatures above 1300 °C [28]:
T i 3 S i C 2 + C 3 T i C + S i ( g )
In general, the MAX phase of Ti3SiC2 is noted as stable at temperatures up to 1800 °C, but it is important to consider the influence of some factors. The first factor is the pressure of the environment in which the sample is located. At higher pressure, decomposition occurs more actively [29]. The second factor is the presence of oxygen or CO, which can be contained in the gas environment or formed when using carbon heaters [30]. In this case, several reactions (3)–(5) are possible:
T i 3 S i C 2 + O 2 2 T i C + T i O + S i O
3 T i 3 S i C 2 + 0.5 O 2 4 T i C + T i 5 S i 3 C + C O
T i 5 S i 3 C + 4 C O 5 T i C + 3 S i O + 0.5 O 2
The third reason is the duration of existence at high temperatures—despite the stability at temperatures up to 1800 °C, being at a high temperature accelerates the decomposition process of the MAX phase [31]. The fourth reason is the presence of other compounds with which the MAX phase can interact; in our case, it is copper [32]. The reaction with copper proceeds with the formation of titanium carbide and the Cu-Si phase in the form of a solid solution or copper silicide (6).
T i 3 S i C 2 + C u 3 T i C 0.67 + C u ( S i )
In addition, copper interacts with a platinum heating substrate on which the in situ XRD process was carried out. According to the Cu-Pt phase diagram, various phases can form at the temperatures chosen in the study, but solid solutions can form [33]. The mechanism for the formation of solid solutions involves both the dissolution of copper in another substance and vice versa. For the Cu-Si system, there are many options for the formation of solid solutions, and a liquid phase can form at temperatures above 800 °C [34].
The difference in the phase composition of powder and bulk samples after heat treatment lies mainly in the different shapes of the samples. Firstly, a thinner layer is formed on the substrate in the powder filling, in which heating occurs faster and reactions are more active. In bulk samples, heating does not occur as quickly as in powder. Secondly, the mechanism of decomposition of the MAX phase implies primarily the formation of silicon in the gas phase [28], which subsequently reacts with the surrounding substance, thus, the reaction of Cu(Si) formation in the bulk sample is limited. Thirdly, the bulk sample has a smaller surface area, while the interaction with the platinum substrate is carried out from the surface. As a result, in the bulk sample, all mechanisms of phase composition change are slower compared to the powder material.
The complete phase composition of the powders after cooling (Figure 4e) demonstrates the presence of copper compounds with silicon, platinum, and titanium, as well as platinum silicide. The presence of such phases indicates active interaction of the decomposition products of the MAX phase with copper powder and the platinum substrate. Accurate quantitative calculation of the phase composition in this case is difficult due to the large number of phases. However, it is important to note that the intensity of copper reflexes is significantly higher than the intensity of its compounds with the same ratio of components. The dip in the range of 2 θ = 55–65° is associated with a technical feature of the high-temperature attachment and is observed in all the samples studied.
The bulk samples formed a structure with a copper matrix, Ti3SiC2, and TiC inclusions (Figure 5a). Titanium carbide is detected in the original Ti3SiC2 powders, but in situ XRD also shows an increase in TiC content due to partial decomposition of the MAX phase. Titanium carbide, as a decomposition product, is incorporated into the Ti3SiC2 particles, while the original TiC is located in the copper matrix separately from the Ti3SiC2 particles (Figure 5b).
Due to the monolithic copper matrix, the sample has relatively low porosity—3%. The pores are predominantly distributed near agglomerates of ceramic particles that were not filled with copper. Liquid phase sintering may be the solution to increase the density. Large printing defects are absent in the sample. The formation of the copper matrix also affects the composite’s electrical conductivity. The obtained composite has an electrical conductivity of 62% IACS (International Annealed Copper Standard).
The composite has a bending strength of 166 ± 8 MPa, a Young’s modulus of 21.7 ± 1.6 GPa, and a microhardness of HV 0.2/10 = 285 HV. Mechanical properties surpass those of pure copper samples produced via a similar extrusion-based method [35].

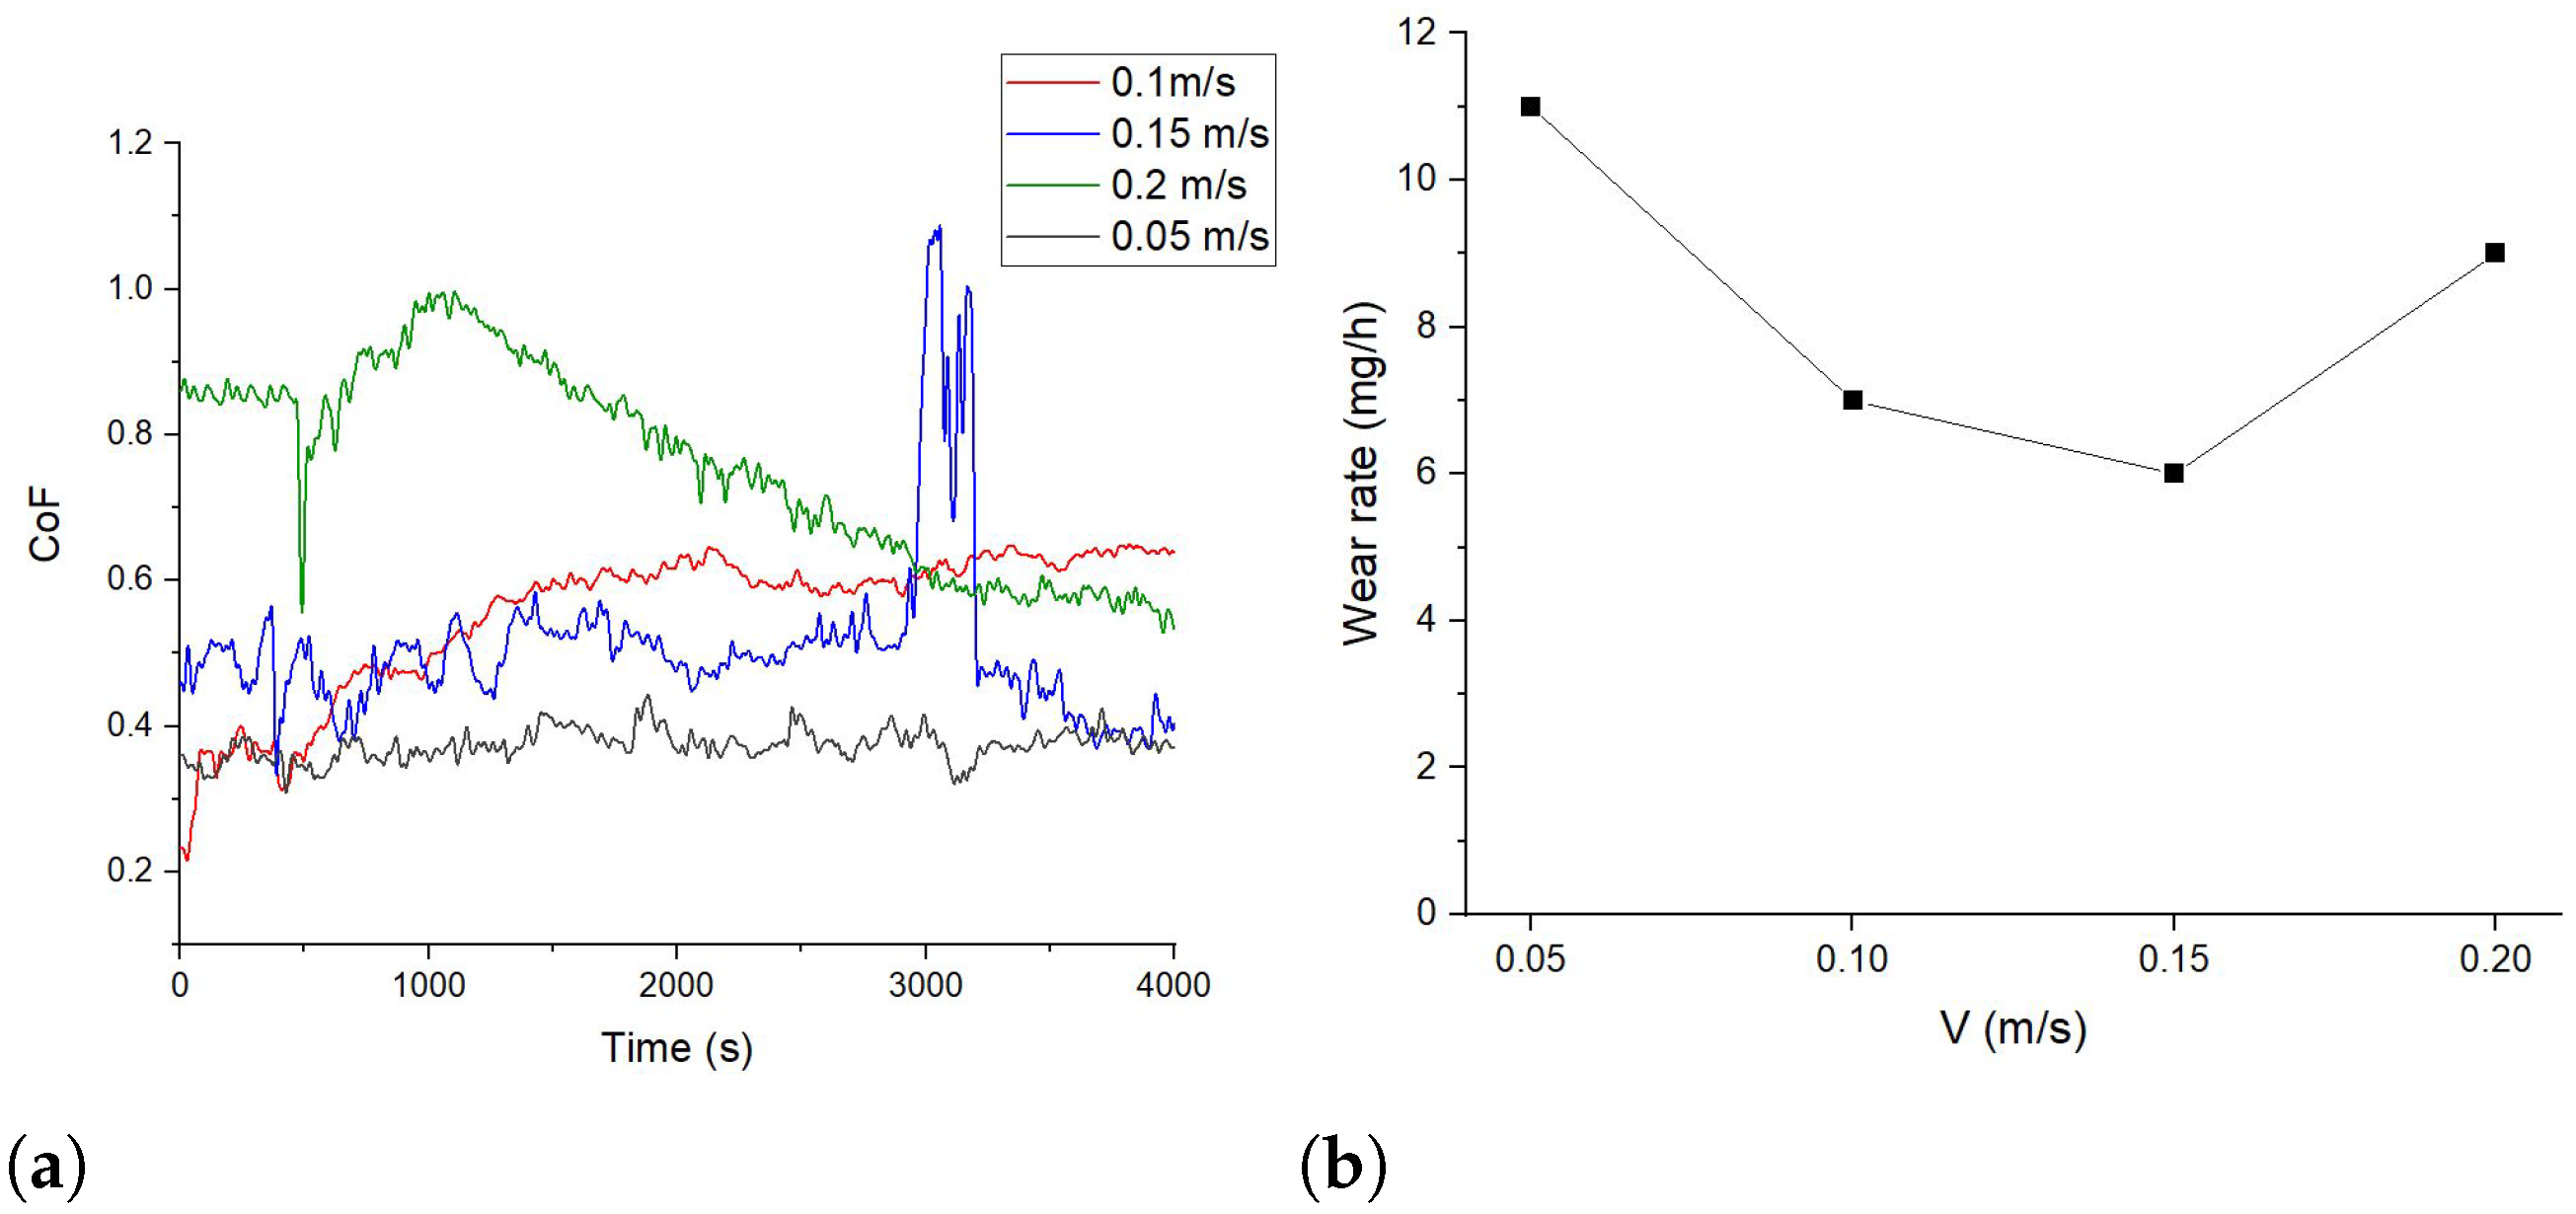
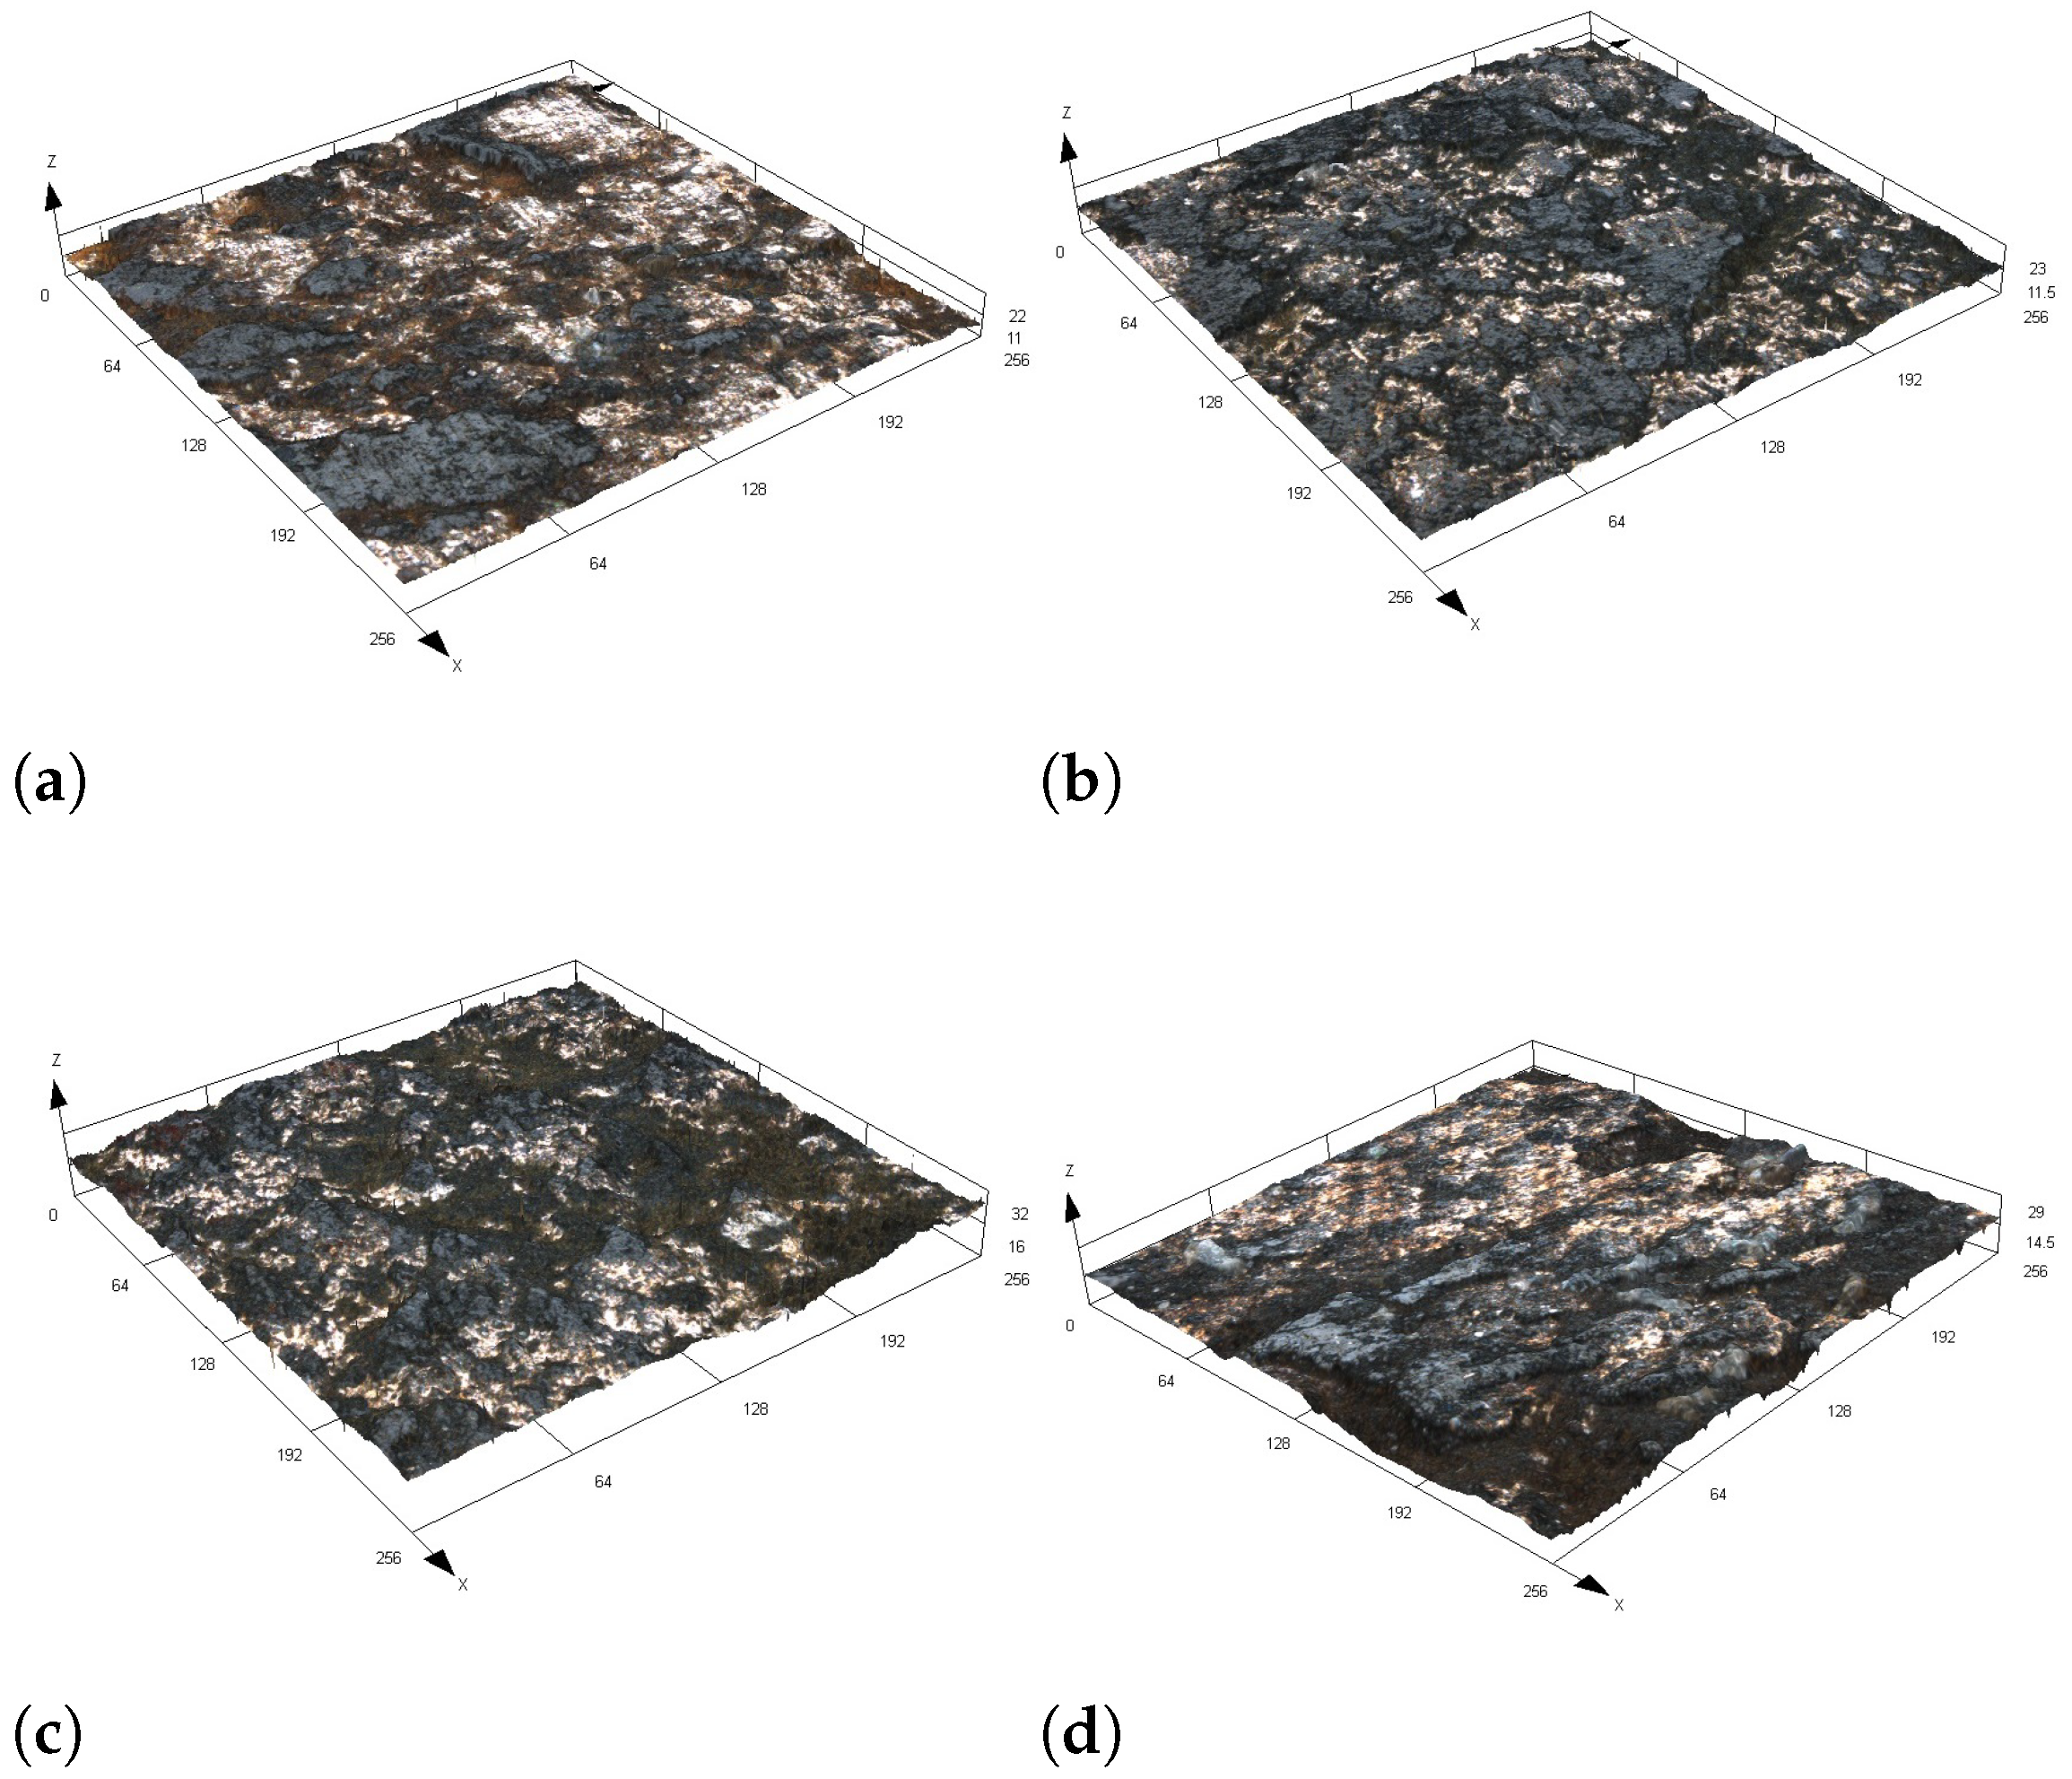
3.2. Tribological Properties

The coefficient of friction (CoF) (Figure 6a) and wear rate (Figure 6b) during sliding friction tests were studied under different loads. The results show that at room temperature (25 °C), increasing the load from 2 N to 6 N leads to an increase in the coefficient of friction from 0.29 to 0.37 (Figure 6a). The change in wear rate correlates with the coefficient of friction. As the CoF increases, the wear rate also increases. Further increasing the load to 10 N reduces the coefficient of friction to 0.17. This is likely due to reduced roughness and increased contact area, which lowers specific pressure and local overheating. The surface roughness R a at different loads was: 0.033 µm (2 N), 0.077 µm (4 N), 0.117 µm (8 N), and 0.063 µm (10 N). The wear surfaces under different loads are shown in Figure 7.
The coefficient of friction (Figure 8a) and wear rate (Figure 8b) during sliding friction tests at different sliding speeds were investigated. The graphs show that increasing the sliding speed leads to an increase in the coefficient of friction from 0.37 at V = 0.05 m/s to 0.76 at V = 0.2 m/s. Higher sliding speeds increase the possibility of the formation of microscopic welding bridges between the friction surfaces due to local overheating, which increases the coefficient of friction. The local spike in the curve in Figure 8a is presumably caused by this local sintering. The wear surfaces at different sliding speeds are shown in Figure 9. Additionally, higher sliding speeds cause vibrational effects, which also contribute to the increase in the coefficient of friction.
As the sliding speed increases, wear becomes more intense (Figure 8b). This is due to more intense deformation of the surface layer. The surface structure changes and thermal cracks form on the friction surface (Figure 9d), which alter the wear rate. The morphology of wear particles also changes with increasing speed. Figure 10 shows SEM images of wear particles at V = 0.05 m/s (Figure 10a) and V = 0.2 m/s (Figure 10b). These results indicate that at higher sliding speeds, the wear becomes more aggressive, with particles becoming angular, sharp, and coarse.
Experiments on the high-temperature friction were also conducted. The tribological test results show a decrease in the coefficient of friction with increasing temperature, from 0.55 at room temperature (25 °C) to 0.21 at 200°C (Figure 11a). Wear also decreases with increasing test temperature (Figure 11b). Further increasing the temperature to 300 °C raises the coefficient of friction to 0.31. This may be due to the material softening and melting at this temperature, increasing the contact area between the friction surfaces and, consequently, the coefficient of friction. The friction surface after high-temperature tribological testing was examined using laser confocal and scanning electron microscopy (SEM) in backscattered electrons (Figure 12). The results show that increasing the temperature of tribological testing significantly oxidizes the material surface.

4. Conclusions

Composites Cu—50 vol.% Ti3SiC2 were produced using extrusion-based additive manufacturing. This composition provides a high density (97%) and feedstock flowability (MFR = 21.7 ± 1.2 g/10 s) that is sufficient to form samples using extrusion-based additive manufacturing with the highest copper content. These composites form a structure with a copper matrix and inclusions of the Ti3SiC2 and TiC. Due to the formation of a bulk copper matrix, the samples exhibit high electrical conductivity (62% IACS).
Decomposition of the MAX phase occurs after sintering, and the interaction of copper with the decomposition products is evident in the structure and phase composition. In all the studied samples, it is possible to preserve the MAX phase after sintering. However, in the powder material, the reactions proceed more actively, and after sintering at 1050 °C, copper in its pure form is almost completely absent. In bulk materials, copper is preserved after sintering at 1050 °C. The complete phase composition of the powders after cooling demonstrates the presence of copper compounds with silicon, platinum, and titanium, as well as platinum silicide. The presence of such phases demonstrates the active interaction of the products of the decomposed MAX phase with copper powder and the platinum substrate for XRD analysis.
The wear surfaces were studied under dry sliding friction with three variable parameters: load ( F n ), speed (V), and temperature (T). Increasing the load during tribological testing at room temperature leads to a gradual decrease and stabilization of the coefficient of friction due to reduced roughness. Increasing the test speed increases the coefficient of friction due to the intense deformation of the surface layer and the formation of microcracks on the friction surface. Increasing the test temperature leads to the formation of oxides on the sample surfaces, significantly reducing the coefficient of friction and the wear rate.

Author Contributions

Conceptualization, M.K., E.R. and O.N.; methodology, M.K. and O.N.; validation, M.K.; formal analysis, M.K., E.R., G.K. and O.N.; investigation, M.K., E.R., G.K. and O.N.; resources, M.K.; writing—original draft preparation, M.K.; visualization, M.K., G.K. and O.N.; project administration, M.K. All authors have read and agreed to the published version of the manuscript.

Funding

The study was supported by the Russian Science Foundation, grant no. 24-79-10169, https://rscf.ru/project/24-79-10169/.

Data Availability Statement

The original contributions presented in this study are included in the article. Further inquiries can be directed to the corresponding author.

Conflicts of Interest

The authors declare no conflicts of interest.

References

  1. Radovic, M.; Barsoum, M.W. MAX phases: Bridging the gap between metals and ceramics. Am. Ceram. Soc. Bull. 2013, 92, 20–27. [Google Scholar]
  2. Barsoum, M.W.; El-Raghy, T. The MAX phases: Unique new carbide and nitride materials: Ternary ceramics turn out to be surprisingly soft and machinable, yet also heat-tolerant, strong and lightweight. Am. Sci. 2001, 89, 334–343. [Google Scholar] [CrossRef]
  3. Barsoum, M.; El-Raghy, T.; Rawn, C.; Porter, W.; Wang, H.; Payzant, E.; Hubbard, C. Thermal properties of Ti3SiC2. J. Phys. Chem. Solids 1999, 60, 429–439. [Google Scholar] [CrossRef]
  4. Perevislov, S.; Sokolova, T.; Stolyarova, V. The Ti3SiC2 max phases as promising materials for high temperature applications: Formation under various synthesis conditions. Mater. Chem. Phys. 2021, 267, 124625. [Google Scholar] [CrossRef]
  5. Gorai, S.; Bhattacharya, C. Structural and mechanical properties, phase stability and shock induced behaviour of Ti3SiC2 based on first principles. Phys. B Condens. Matter 2024, 673, 415444. [Google Scholar] [CrossRef]
  6. Zhang, Y.; Sun, Z.; Zhou, Y. Cu/Ti3SiC2 composite: A new electrofriction material. Mater. Res. Innov. 1999, 3, 80–84. [Google Scholar] [CrossRef]
  7. Lu, J.; Zhou, Y.; Zheng, Y.; Li, H.; Li, S. Interface structure and wetting behaviour of Cu/Ti3SiC2 system. Adv. Appl. Ceram. 2015, 114, 39–44. [Google Scholar] [CrossRef]
  8. Dang, W.; Ren, S.; Zhou, J.; Yu, Y.; Li, Z.; Wang, L. Influence of Cu on the mechanical and tribological properties of Ti3SiC2. Ceram. Int. 2016, 42, 9972–9980. [Google Scholar] [CrossRef]
  9. Wu, Z.; Jiang, X.; Li, Y.; Christian, P.; Sun, H.; Zhang, Y.; Fang, Y.; Shu, R. Microstructures and properties of graphene nanoplatelets reinforced Cu/Ti3SiC2/C nanocomposites with efficient dispersion and strengthening achieved by high-pressure torsion. Mater. Charact. 2022, 193, 112308. [Google Scholar] [CrossRef]
  10. Nai, X.; Chen, H.; Zhao, S.; Wang, Q.; Li, W. Designing a low-melting Sn6Ag7Ni4Co2Ti high entropy alloy filler to optimize microstructure and mechanical properties of Ti3SiC2/Cu joint. Mater. Charact. 2023, 196, 112573. [Google Scholar] [CrossRef]
  11. Zhang, R.; Liu, F.; Tulugan, K. Self-lubricating behavior caused by tribo-oxidation of Ti3SiC2/Cu composites in a wide temperature range. Ceram. Int. 2022, 48, 15504–15515. [Google Scholar] [CrossRef]
  12. Yap, C.Y.; Chua, C.K.; Dong, Z.L.; Liu, Z.H.; Zhang, D.Q.; Loh, L.E.; Sing, S.L. Review of selective laser melting: Materials and applications. Appl. Phys. Rev. 2015, 2, 041101. [Google Scholar] [CrossRef]
  13. Sefene, E.M. State-of-the-art of selective laser melting process: A comprehensive review. J. Manuf. Syst. 2022, 63, 250–274. [Google Scholar] [CrossRef]
  14. Gao, B.; Zhao, H.; Peng, L.; Sun, Z. A review of research progress in selective laser melting (SLM). Micromachines 2022, 14, 57. [Google Scholar] [CrossRef]
  15. Liu, W.; Song, J.; Li, W.; Ma, Z.; Liu, H.; Liu, B.; Xia, Y.; Wang, Z.; Huang, Y.; Liu, Y.; et al. Structure and properties study of in-situ TiC reinforced 316L materials prepared by laser melting deposition based on Ti3SiC2 decomposition. Ceram. Int. 2024, 50, 48448–48461. [Google Scholar] [CrossRef]
  16. Tan, Q.; Zhuang, W.; Attia, M.; Djugum, R.; Zhang, M. Recent progress in additive manufacturing of bulk MAX phase components: A review. J. Mater. Sci. Technol. 2022, 131, 30–47. [Google Scholar] [CrossRef]
  17. Gonzalez-Julian, J. Processing of MAX phases: From synthesis to applications. J. Am. Ceram. Soc. 2021, 104, 659–690. [Google Scholar] [CrossRef]
  18. Carrijo, M.M.; Caro, L.G.; Lorenz, H.; Greil, P.; Travitzky, N.; Rambo, C.R. Ti3SiC2-based inks for direct ink-jet printing technology. Ceram. Int. 2017, 43, 820–824. [Google Scholar] [CrossRef]
  19. Krinitcyn, M.; Fu, Z.; Harris, J.; Kostikov, K.; Pribytkov, G.A.; Greil, P.; Travitzky, N. Laminated Object Manufacturing of in-situ synthesized MAX-phase composites. Ceram. Int. 2017, 43, 9241–9245. [Google Scholar] [CrossRef]
  20. Nai, X.; Zhang, H.; Zhao, S.; Wang, P.; Chen, H.; Wang, P.; Vairis, A.; Li, W. Strengthening Ti3SiC2/Cu brazed joint assisted with cold spray additive manufacturing: Lower brazing temperature through interdiffusion and graded reinforcement for stress relaxation. J. Mater. Process. Technol. 2024, 331, 118530. [Google Scholar] [CrossRef]
  21. Eusébio, J.V.C. Additive Manufacturing for Metallic Materials Using Fused Filament Fabrication and Fused Granular Fabrication. Master’s Thesis, Faculdade de Engenharia da Universidade do Porto, Porto, Portugal, 2024. [Google Scholar]
  22. Arora, P.; Dehgahi, S.; Butt, S.U.; Nobes, D.S.; Qureshi, A.J. Fabrication of sacrificial wax pattern through large-scale fused granulated fabrication (FGF-AM) hybrid manufacturing system. Prog. Addit. Manuf. 2025, 10, 1325–1339. [Google Scholar] [CrossRef]
  23. Krinitcyn, M.; Kopytov, G.; Ryumin, E. Additive Manufacturing of Ti3AlC2/TiC and Ti3AlC2/SiC Ceramics Using the Fused Granules Fabrication Technique. J. Manuf. Mater. Process. 2024, 8, 123. [Google Scholar] [CrossRef]
  24. Eldho, A. Market and Application Review of large SCALE Additive Manufacturing. Master’s Thesis, Aalto University, Espoo, Finland, 2024. [Google Scholar]
  25. ISO 1133; Plastics—Determination of the Melt Mass-Flow Rate (MFR) and Melt Volume-Flow Rate (MVR) of Thermoplastics. ISO International Standart: Geneva, Switzerland, 2022.
  26. ASTM E290; Standard Test Methods for Bend Testing of Material for Ductility. ASTM International: West Conshohocken, PA, USA, 2022.
  27. Krinitcyn, M.; Toropkov, N. Structure, Phase Composition, and Properties of Ti3AlC2—Nano-Cu Powder Composites. Coatings 2022, 12, 1928. [Google Scholar] [CrossRef]
  28. El-Raghy, T.; Barsoum, M.W. Diffusion kinetics of the carburization and silicidation of Ti3SiC2. J. Appl. Phys. 1998, 83, 112–119. [Google Scholar] [CrossRef]
  29. Qin, J.; He, D. Phase stability of Ti3SiC2 at high pressure and high temperature. Ceram. Int. 2013, 39, 9361–9367. [Google Scholar] [CrossRef]
  30. Oo, Z.; Low, I.; O’Connor, B. Dynamic study of the thermal stability of impure Ti3SiC2 in argon and air by neutron diffraction. Phys. B Condens. Matter 2006, 385, 499–501. [Google Scholar] [CrossRef]
  31. Pang, W.K.; Oo, Z.; Peterson, V.K.; Low, I.M. Phase and thermal stability in Ti3SiC2 and Ti3SiC2/TiC/TiSi2 systems. In Advances in Science and Technology of Mn+ 1axn Phases; Elsevier: Amsterdam, The Netherlands, 2012; pp. 389–413. [Google Scholar]
  32. Zhou, Y.; Gu, W. Chemical reaction and stability of Ti3SiC2 in Cu during high-temperature processing of Cu/Ti3SiC2 composites. Int. J. Mater. Res. 2021, 95, 50–56. [Google Scholar]
  33. Kulagina, V.; Chaplygina, A.; Popova, L.; Starostenkov, M.; Potekaev, A.; Klopotov, A. Structural phase transformations in alloys of the Cu–Pt system during ordering. Russ. Phys. J. 2012, 55, 814–824. [Google Scholar] [CrossRef]
  34. Olesinski, R.; Abbaschian, G. The Cu- Si (copper-silicon) system. Bull. Alloy Phase Diagrams 1986, 7, 170–178. [Google Scholar] [CrossRef]
  35. Gonzalez-Gutierrez, J.; Cano, S.; Ecker, J.V.; Kitzmantel, M.; Arbeiter, F.; Kukla, C.; Holzer, C. Bending properties of lightweight copper specimens with different infill patterns produced by material extrusion additive manufacturing, solvent debinding and sintering. Appl. Sci. 2021, 11, 7262. [Google Scholar] [CrossRef]
Figure 1. Morphology of the initial Ti3SiC2 (a) and Cu (b) powder.
Metals 15 00493 g001
Figure 2. The appearance of the Cu-Ti3SiC2 sample in the ‘green’ state after the additive manufacturing process.
Metals 15 00493 g002
Figure 3. MFR of the feedstock with different Cu:Ti3SiC2 ratios.
Metals 15 00493 g003
Figure 4. XRD analysis of Cu:Ti3SiC2 composite powder (a,b,d,e) and bulk samples (c) with in situ (a,c) and conventional (b,d,e) XRD. Full XRD patterns are captured at 1050 °C (d) for MEAM and powder samples and at room temperature (e) before and after sintering.
Metals 15 00493 g004
Figure 5. SEM images of a cross-section of Cu:Ti3SiC2 composite with the coarse Ti3SiC2 particles without (a) and with (b) incorporated TiC particles.
Metals 15 00493 g005
Figure 6. Change in the coefficient of friction during testing (a) and wear rate depending on the load (b).
Metals 15 00493 g006
Figure 7. Wear surface images after tribological testing at 2 N (a), 4 N (b), 6 N (c), and 10 N (d).
Metals 15 00493 g007
Figure 8. Change in the coefficient of friction during testing (a) and wear rate (b) depending on speed.
Metals 15 00493 g008
Figure 9. The 3D images of wear surfaces after tribological testing at speeds of 0.05 m/s (a), 0.1 m/s (b), 0.15 m/s (c), and 0.2 m/s (d).
Metals 15 00493 g009
Figure 10. Morphology of wear particles at sliding speeds of V = 0.05 m/s (a) and V = 0.2 m/s (b).
Metals 15 00493 g010
Figure 11. Change in the coefficient of friction during testing (a) and wear rate (b) depending on temperature.
Metals 15 00493 g011
Figure 12. SEM and confocal images of wear surfaces after tribological testing at 25 °C (a,e), 100 °C (b,f), 200 °C (c,g), and 300 °C (d,h).
Metals 15 00493 g012
Table 1. Parameters of tribological testing.
Series 1Series 2Series 3
V = 0.05 m/s, T = 25 °C F n = 8 N, T = 25 °CV = 0.1 m/s, F n = 8 N
F n , N2468V, m/s0.050.10.150.2T, °C25100200300
Disclaimer/Publisher’s Note: The statements, opinions and data contained in all publications are solely those of the individual author(s) and contributor(s) and not of MDPI and/or the editor(s). MDPI and/or the editor(s) disclaim responsibility for any injury to people or property resulting from any ideas, methods, instructions or products referred to in the content.

