Article

Solid-State Welding of Thin Aluminum Sheets: A Case Study of Friction Stir Welding Alloys 1050 and 5754

by
Georgios Patsalias
,
Konstantinos Sofias
and
Achilles Vairis
*
Department of Mechanical Engineering, University of West Attica, 12241 Egaleo, Greece
*
Author to whom correspondence should be addressed.
Metals 2025, 15(4), 463; https://doi.org/10.3390/met15040463
Submission received: 7 March 2025 / Revised: 13 April 2025 / Accepted: 15 April 2025 / Published: 20 April 2025
(This article belongs to the Special Issue New Welding Materials and Green Joint Technology—2nd Edition)

Abstract

:
This study explores the friction stir welding (FSW) of thin aluminum sheets, focusing on alloys 1050 and 5754. FSW, a solid-state joining technique, offers advantages like minimal deformation and high joint strength, but optimizing welding parameters is crucial for sound welds. In order to investigate the optimum welding parameters, the Taguchi method was employed, in which key parameters such as rotational and welding speed were optimized to enhance tensile strength and weld quality. The tensile testing of the welded specimens revealed that the optimal combination—1000 RPM rotational speed and 250 mm/min welding speed—produced the highest tensile strength and weld quality. The results highlight the importance of parameter optimization in ensuring strong, stable welds, with rotational speed having the most significant influence. Additionally, excessive rotational speeds were found to weaken welds due to excessive heat input, while a slower welding speed contributed to greater weld stability.

1. Introduction

Friction stir welding (FSW) is a renowned solid-state joining technique widely used for aluminum alloys due to its ability to produce sound, defect-free joints. Developed since 1991 by The Welding Institute [1], FSW can create high-quality welds without melting the base materials, thus avoiding common fusion welding problems such as porosity, cracking, and distortion [2,3]. The joints produced have anisotropic mechanical behavior due to the microstructure produced [4], but these different local deformation characteristics can be altered by the careful selection of process parameters [5,6]. In addition, FSW is closely associated with sustainable practices since it is energy-efficient, has limited environmental impact with reduced emissions, is material-efficient, and cost-effective, as it does not require filler materials or shielding gas [7,8].
The FSW process establishes a metallurgical bond by softening the workpiece with a non-consumable, rotating, and translating tool that typically features a pin—shorter than the weld depth—and a shoulder that generates frictional heat [9]. When the tool is inserted into the joint, the frictional forces produce sufficient heat to soften the material without melting and produce yielding conditions in a limited volume of the material. This leads to the formation of a plasticized zone where material mixing and grain refinement occur, resulting in a sound weld [10]. Its ability as a solid-state welding technique [11] to join materials such as aluminum and other non-ferrous alloys has made FSW particularly valuable in the aerospace, marine, and automotive industries, where it provides enhanced strength with minimal deformation compared to conventional fusion welding techniques [12,13]. Even though it is a solid-state joining process, it has distinct heat generation and plastic material behavior compared to other solid-state joining processes [14].
A critical element for achieving optimal weld quality is the design of the FSW tool. Various tool geometries—including standard pin tools, retractable pin tools, and threaded pins—are used to suit different welding requirements. The choice of tool profile, rotation direction, and speed is essential for controlling penetration depth and ensuring effective material mixing, thereby improving joint quality [15,16,17].
Recent research has extensively examined aluminum alloys to gain insights into the metallurgical behavior, material flow, and mechanics of the FSW process [18]. For instance, ref. [19] demonstrated that tool geometry in welding AA1050 significantly affects the process, identifying the optimum combination of pin length, pin diameter, and the angle of the pin, as well as its shape. For the same material, ref. [20] demonstrated that joints of 3 mm thickness could be produced, showing no kissing bond defects, while hardness was not affected in the weld. Furthermore, Akbari, Asadi, and Sadowski [21] employed a 3D finite element model to investigate FSW weldability and concluded that frictional heat—primarily generated by the tool shoulder (which contributes around 90% of the total heat)—is the key factor in raising the temperature during welding.
Other studies have further explored these process parameters. Kwon, Shim, and Park [22] achieved defect-free welds across a range of tool rotation speeds, noting that lower speeds produced an “onion ring” structure in the stir zone and that finer grain sizes and higher hardness were typically observed in this zone compared to the base metal. Similarly, research on friction-stir-welded aluminum alloy AA6082T6 indicated that while tensile strength increased with higher welding speeds, the weld region—particularly the heat-affected zone on the advancing side—exhibited reduced hardness, aligning with the locations of failure during tensile strength tests [23]. A further advantage of the process compared to fusion welding processes is the ability to produce dissimilar material joints, which increases its appeal due to cost and performance benefits [24,25]. Moreover, application is beginning to expand to polymers as well as composites [26].
Haribalaji et al. [27] identified the optimal process parameters for maximizing tensile strength and minimizing corrosion in the FSW of AA7075 and AA2014 alloys through statistical analysis, finding that moderate tool rotational speeds provided the best balance between strength and corrosion resistance. In another investigation, process parameters were investigated for various grades of aluminum alloys of the 1XXX, 2XXX, and 7XXX series. Macrostructure analyses were used to define the empirical relationships between the material properties and rotational and welding speeds [28].
The optimization of welding parameters is a common theme for research, and various decision-making strategies using entropy have been investigated [29] regarding the best performance response in terms of UTS, hardness, and surface roughness. Statistical analysis tools like the Taguchi method have been used extensively by Shinde, Sapre, and Jatti [30] in order to optimize parameters for welding HE 30 and HE 9 aluminum alloys. It was found that both spindle speed and welding speed are significant factors affecting ultimate tensile strength and hardness. Similarly, Ugrasen et al. [31] applied an L9 orthogonal array to optimize the FSW parameters for AA6061 and AAl7075 alloys. While previous studies highlighted spindle and welding speeds as key, this study found that rotational speed was the most influential factor, contributing 63% to the ultimate tensile strength. The Taguchi DOE technique and grey relational analysis were used [32] to assess the combined effects of process variables on 6 mm thick plates of AA5754, showing that the rotational speed of 100 RPM had the greatest effect on joints. Tensile strength is widely used as a criterion for process optimization [33] for AA2099, and the Taguchi L9 orthogonal array is also employed, encompassing rotational speed, welding speed, tool profile, and welding condition as the input process parameters for analysis. These findings underscore the effectiveness and versatility of the Taguchi method in optimizing FSW parameters across different alloy systems.
The current study focuses on applying FSW to thin (2 mm) aluminum sheets—specifically, alloys AA1050 and AA5754—which show excellent corrosion resistance, with the 5xxx series alloy providing higher strength. This makes it appropriate for structural applications compared to the 1xxx series alloy, which is more formable. Both alloys are weldable and are commonly utilized across various industrial applications in the process, automotive, and marine industries, as well as in architectural and pressure vessels. One reason for selecting these particular alloys was their broad range of applications, while the other was the thickness of the sheets. Thin (2 mm) aluminum AA6060 sheets have been welded with FSW [34] to identify the interaction between welding parameters and mechanical properties using a pinless tool, which alters the frictional heat generated. AA1050 has been studied to a limited extent in thicker plates of 5 mm. The findings show that the final joint shows smoother surface ripples, with no discernible interface between the stir zone and the thermomechanically affected zone (TMAZ), allowing for a narrow effective range of welding parameters; meanwhile, this range is wider for AA6061 [35]. One of the main challenges when welding thin aluminum sheets is controlling the heat input to ensure a consistent weld and prevent part distortion. Maintaining uniform heat distribution is critical, as even minor variations in welding conditions can lead to defects. Consequently, this research examines the influence of welding speed and rotational speed—two key FSW parameters—on the mechanical properties of the welds of thin sheets. The Taguchi method is employed to systematically determine the optimal conditions for maximizing tensile strength in these thin-sheet welds. The anticipated outcome is the provision of a framework that enhances industrial welding practices by enabling the production of superior welds in thin corrosion-resistant aluminum sheets.

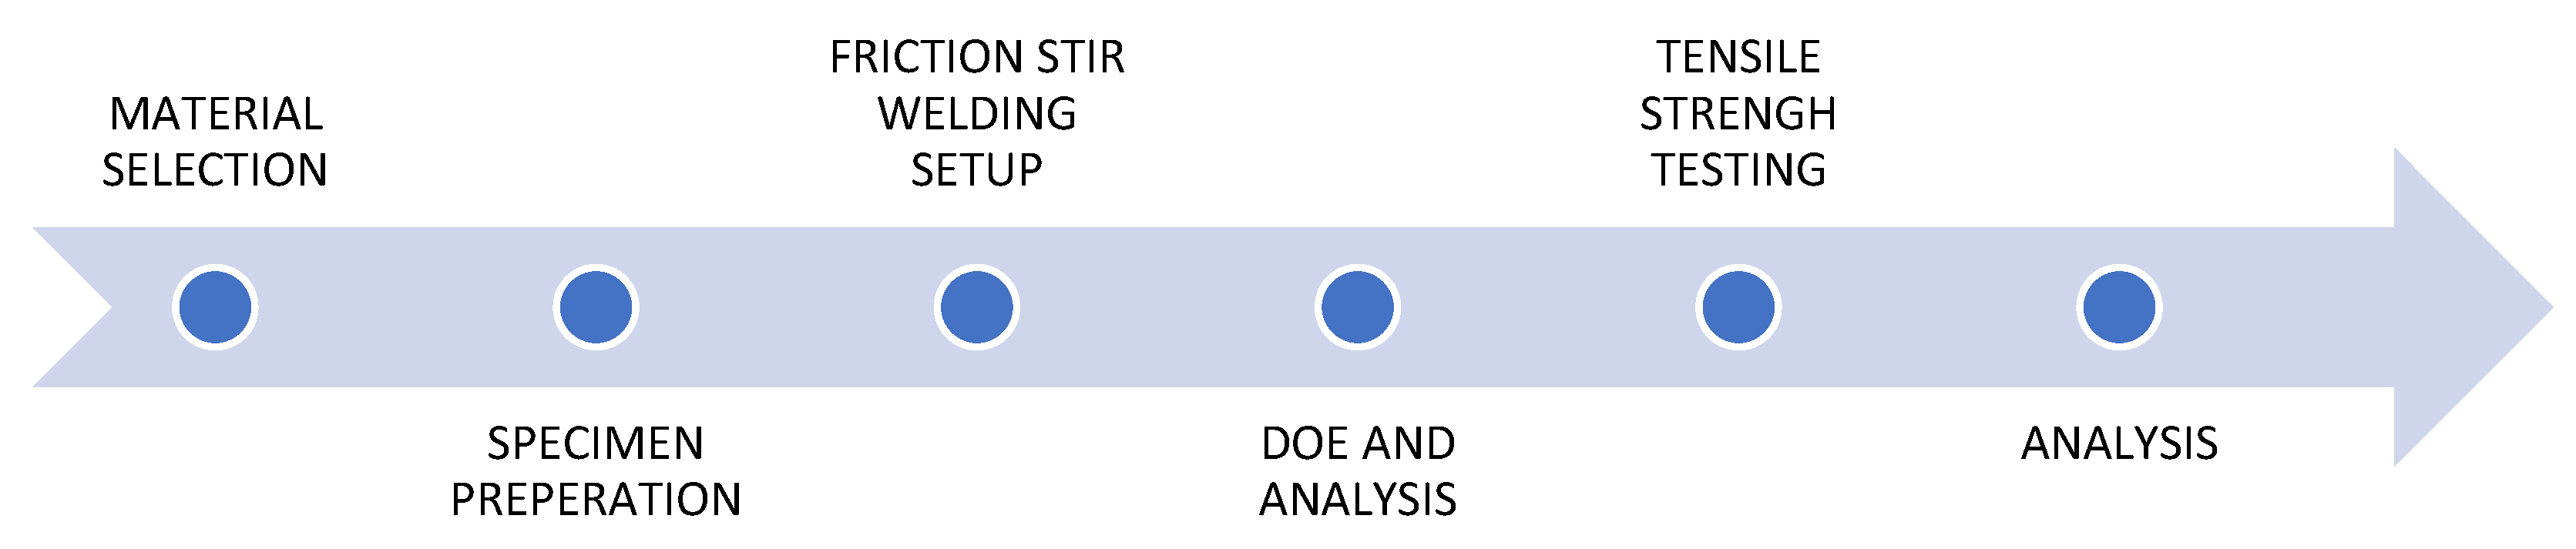
2. Materials and Methods

In this study, friction stir welding was employed to join aluminum sheets of 2 mm thickness using the AA1050 and AA5754 alloys. This section aims to describe the methodological approach that the authors used in order to design the experiments and obtain robust results. As shown in Figure 1, the materials were selected, followed by specimen preparation. Friction stir welding setup and DOE are two inextricably linked steps, as the design of the experiments is dependent on the setup. In the end, tensile strength measurements were taken and an analysis of the results was produced to reach an insightful conclusion of the study.

2.1. Material Selection

For this study, two aluminum alloys with high aluminum content were selected: AA1050 and AA5754. These are lightweight and corrosion-resistant, especially in atmospheric and marine environments. They also exhibit good electrical and thermal conductivity, and both alloys are easily weldable using conventional welding methods. In addition, they have good formability, making them suitable for deep drawing and bending applications. The differences between them are that the 1xxx series has excellent conductivity but low strength, and the 5xxx series is an Al-Mg alloy (about 3.1% Mg), offering higher strength and better mechanical properties. The solid-state welding parameters were adjusted based on the Taguchi design of experiments technique to achieve optimal joint quality and mechanical performance. Table 1 presents the material composition and mechanical properties of the selected aluminum alloys.
The aluminum sheets had a thickness of 2 mm, and the specimens were cut into 70 mm (width) × 100 mm (length) pieces. After cutting, they were cleaned with acetone to remove surface contaminants. The studied materials were used in their as-received condition without any prior heat treatment. The only heat input came from the friction stir welding process itself, which is a solid-state joining method that does not involve melting or conventional heat treatment.

2.2. Friction Stir Welding Setup
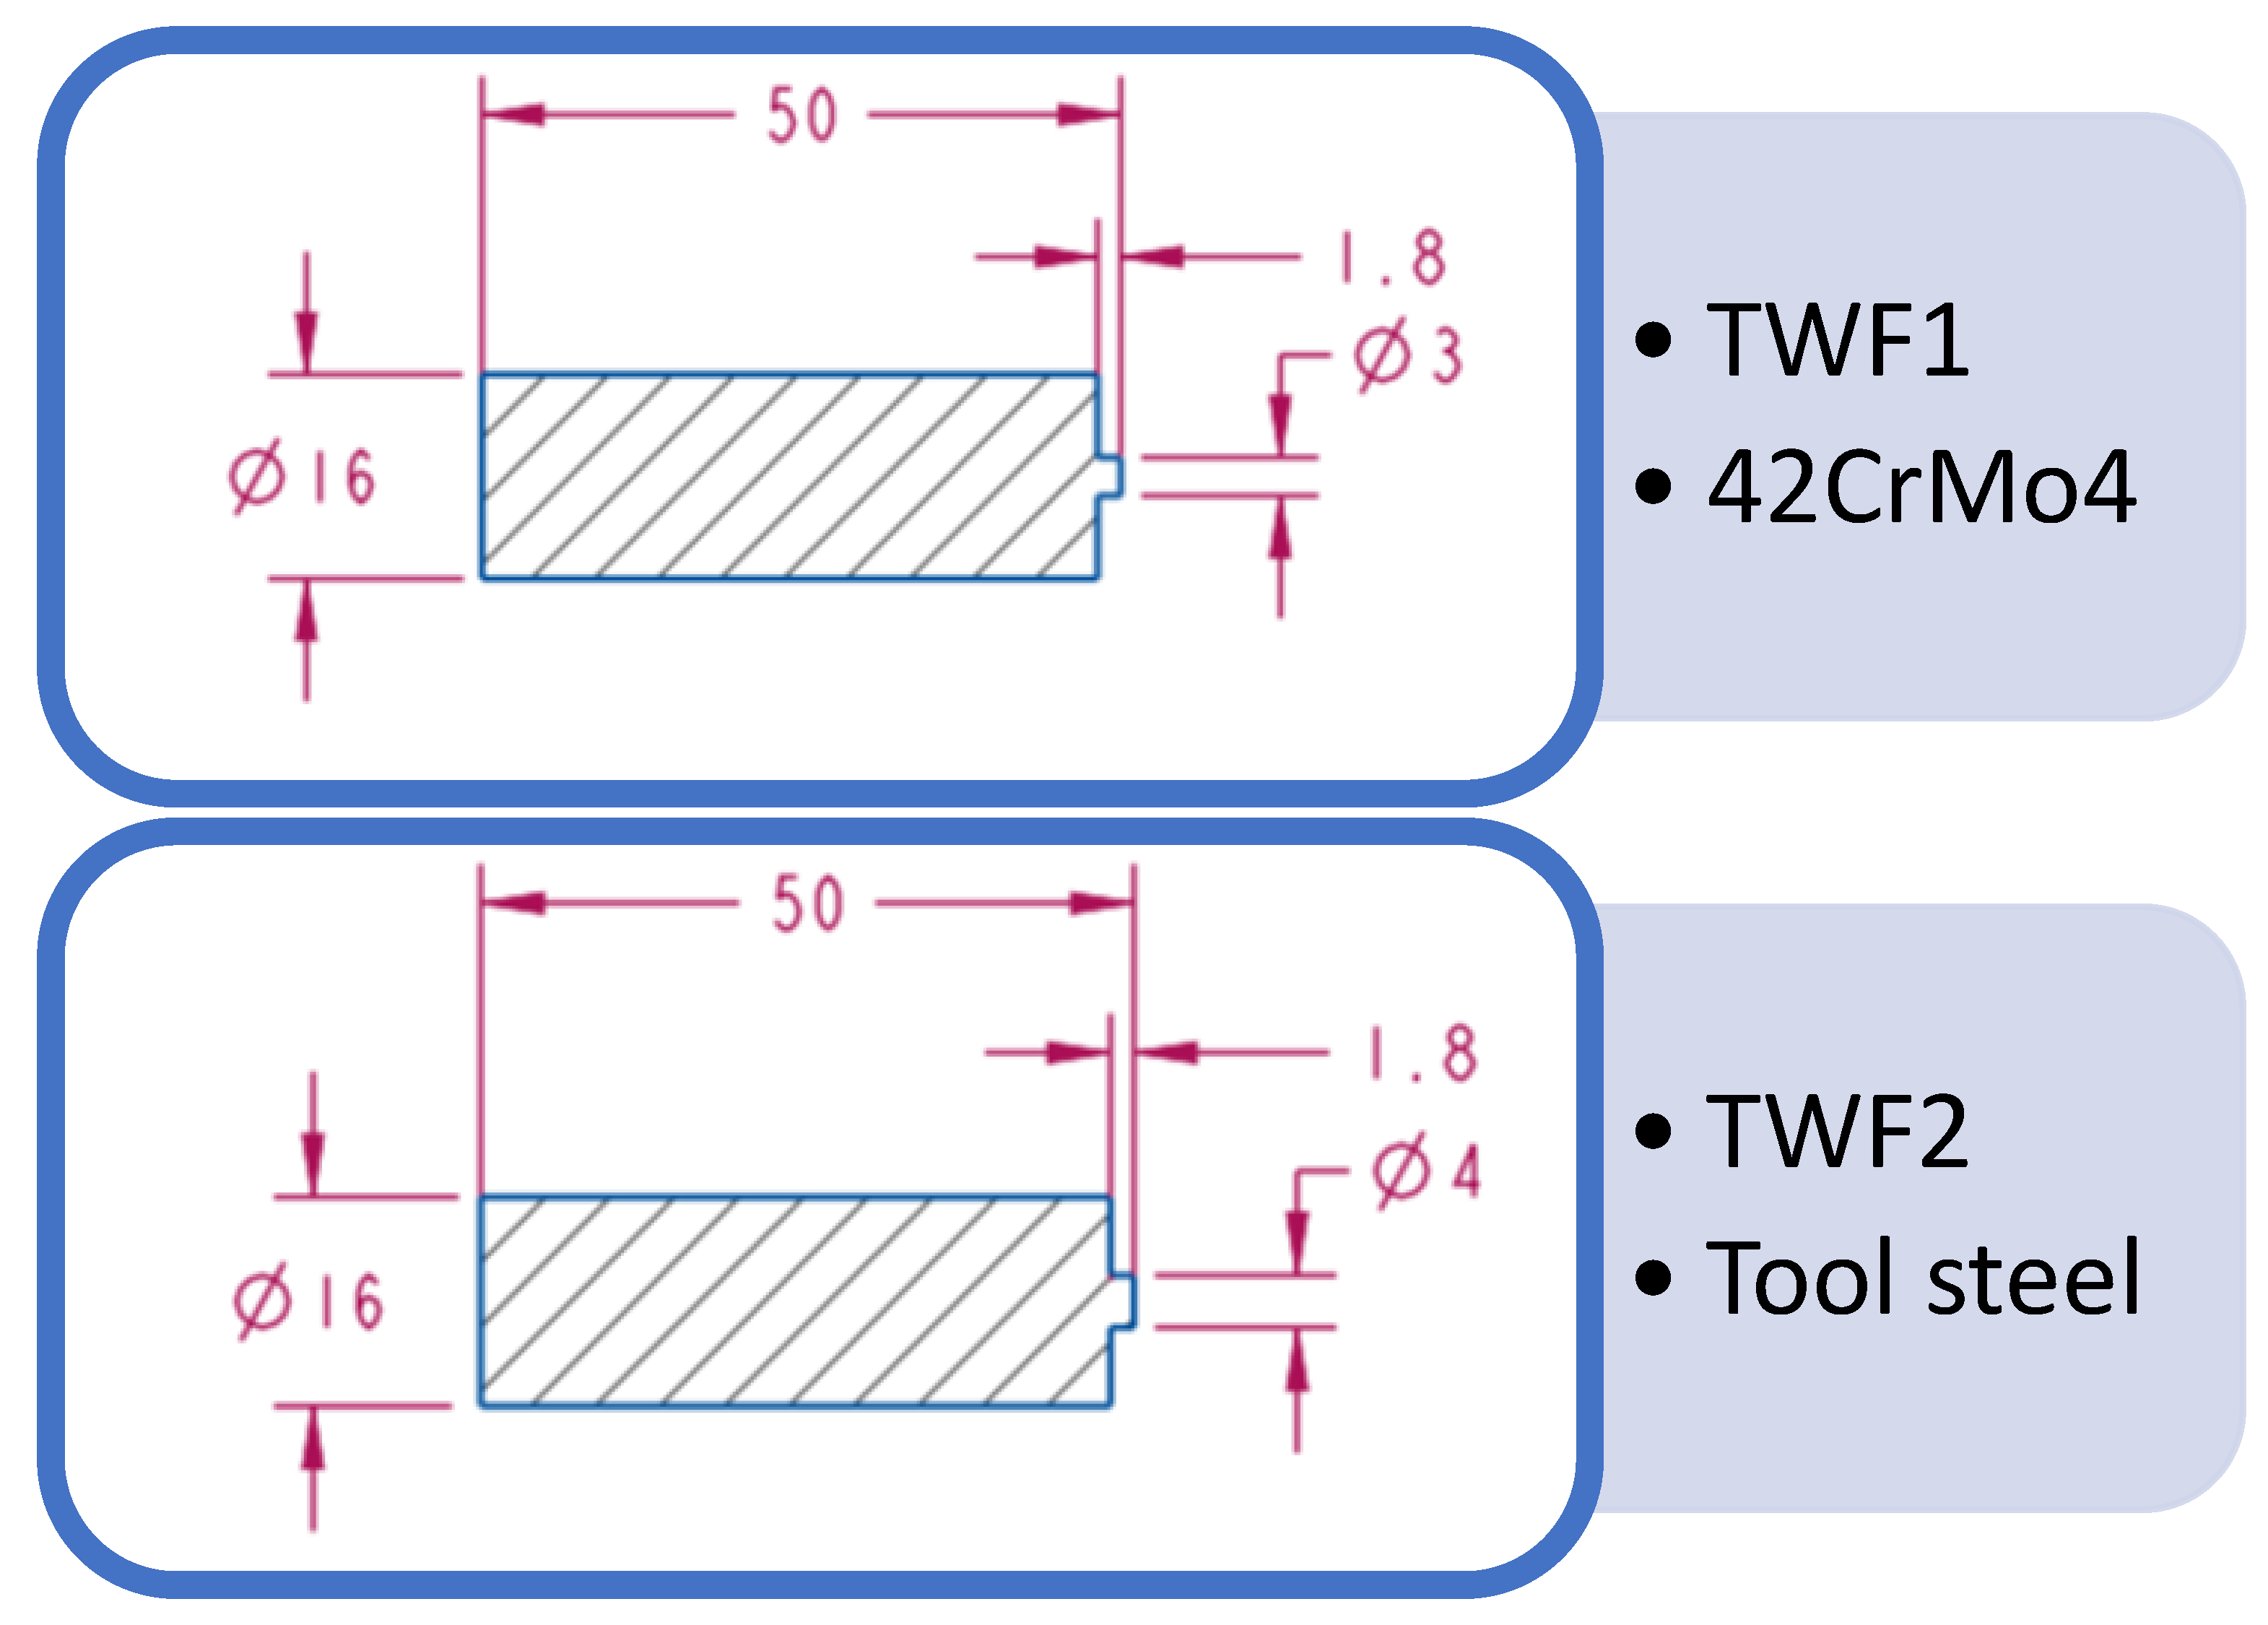
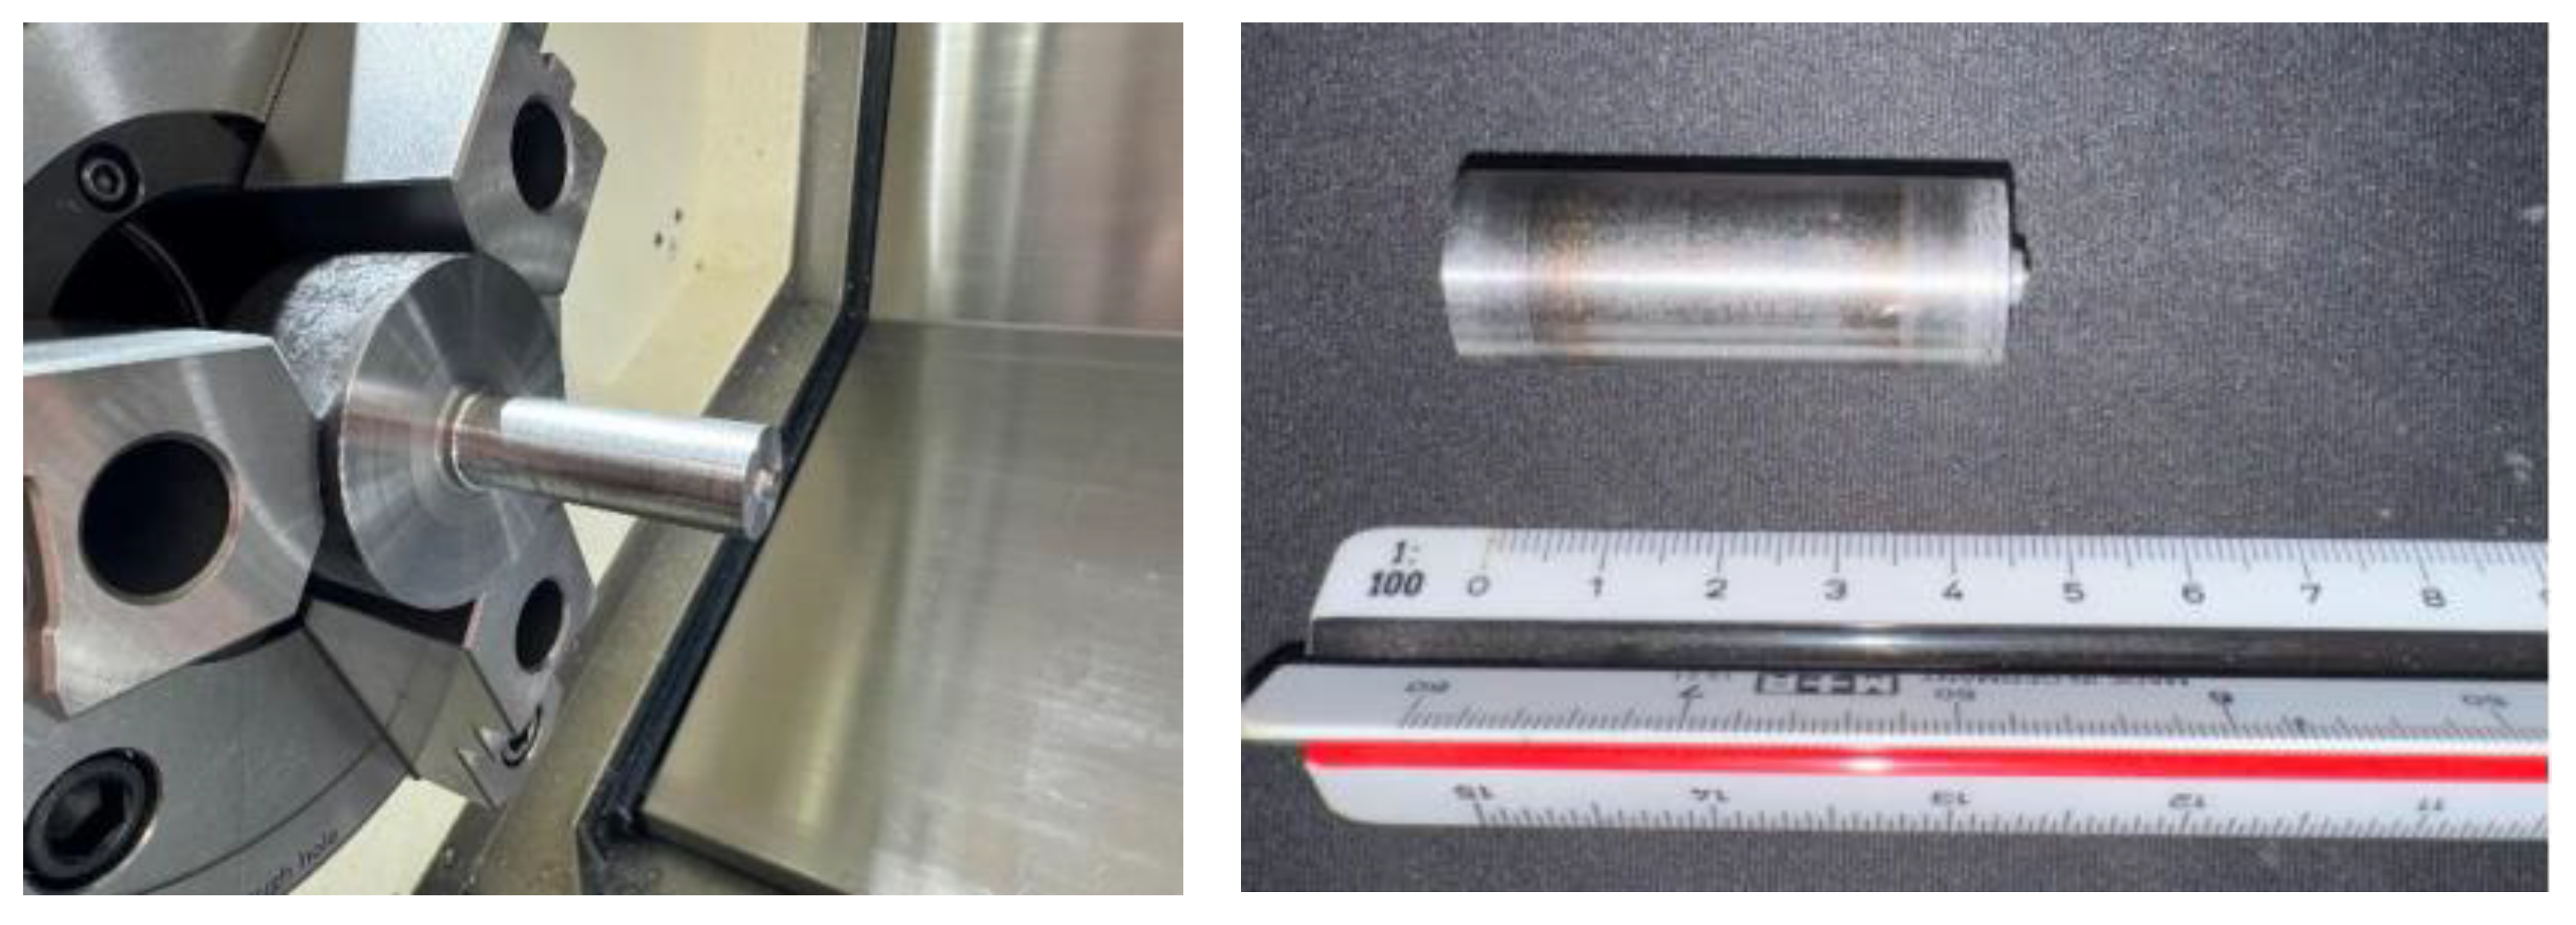
2.2.1. Tool Design

Two different tools were produced—TFW1 and TFW2 (see Figure 2 and Figure 3)—with a cylindrical main body of 16 mm in diameter and a total length of 50 mm, with different pin geometry (see following section for details). The tools were designed to match the thickness of the aluminum sheets, with inexpensive geometry that is straightforward to manufacture. This tool geometry was carefully chosen to effectively stir and consolidate the material of the thin sheets while avoiding excessive heat input or deformation. The tool depth and path were carefully set to maximize material penetration and alignment.
Computer-Aided Design (CAD) software (AUTOCAD FUSION 360) was utilized to develop the 3D geometric model of the FSW tool and the Computer-Aided Manufacturing (CAM) platform (CELOS X) was used to generate tool paths and create the G-code required for the computer numerically controlled (CNC) machining of the tools. The tools were manufactured using an NLX 2500/700 CNC lathe (DMG MORI, Tokyo, Japan).

2.2.2. Process Parameters

The primary parameters in FSW for a sound weld are rotational speed and welding speed. Utilizing the Taguchi design of experiments (DOE) with an L9 orthogonal array, a range of feed and speed combinations was established for the experimental design (see Table 2, Table 3 and Table 4). Based on prior knowledge obtained in [37], the FSW process parameters were initially selected. The milling machine used for the experiments imposed certain limitations, particularly concerning the available range of rotational speeds for the FSW tool. In order to accommodate for these constraints, a series of preliminary trials were conducted to identify a feasible and reliable set of process parameters. The results of these preliminary tests showed that a rotational speed of over 2000 RPM produced an error regarding the spindle load, while a rotational speed of less than 500 RPM did not produce a weld at all.
Based on these preliminary runs, it was determined that the selected three levels for each factor—rotational speed and welding speed—would be sufficient to identify the key process behavior within the operational limits of the equipment. So, the Taguchi L9 orthogonal array was selected for the experimental design. While the L9 array requires nine experimental runs—identical in number to a full factorial design with two factors at three levels—it offers a more structured and orthogonal configuration. This not only reduces the influence of experimental noise, but also facilitates the use of signal-to-noise (S/N) ratio analysis, which is a core advantage of the Taguchi methodology [38,39] in terms of enhancing robustness and quality in process optimization. Additional parameters, including plunge rate, feed rate, and dwell time, were selected based on the experience of the group.

2.3. Welding

At the beginning of the experiment, specimens were produced to set dimensions and cleaned with alcohol. Joining trials were conducted on a Deckel Maho MH800 five-axis CNC vertical milling machine (Munich, Germany). The aluminum specimens were secured onto a 155 mm × 200 mm heavy steel plate, ensuring alignment and tight clamping at 40 Nm. The tool was aligned along the joint line, rotated at the predetermined speed, and pressed into the material. The friction generated between the tool and the aluminum produced sufficient heat to soften the metal without melting it, allowing the material to be stirred and mechanically mixed to form a solid-state weld between the AA1050 and AA5754 sheets. Initially, multiple tests were performed to refine the clamping system. These tests revealed that the TFW1 tool was unsuitable for FSW due to its material composition and geometry. After all experiments were completed, nearly all specimens were successfully welded except for specimen 57541, which failed to join. Visual assessments indicated that the best appearances were achieved with specimens 10504, 10505, 10506, 10507, 10508, and 10509 from the AA1050 series, and specimens 57547, 57548, and 57549 from the AA5754 series.

2.4. Tensile Strength Testing

Important mechanical properties, including ultimate tensile strength (UTS), yield strength, and elongation at fracture, were measured using tensile strength testing. Specimens were loaded until failure, providing insights into weld ductility and strength. The effectiveness of the selected welding parameters in optimizing mechanical performance was assessed through tensile strength test data.
To ensure precise and reliable tensile strength testing, the joints of AA1050 and AA5754 were sectioned into standardized test specimens (10 mm width × 140 mm length × 2 mm thickness) (see Figure 4). Each specimen was then divided into five equal width pieces, each 10 mm wide, for tensile strength testing. Surface imperfections were removed by polishing the edges, ensuring consistency across all specimens. This step was critical for obtaining accurate mechanical property measurements. Residual debris from cutting and polishing was removed. Notably, specimens with a sound weld fractured in the center, while those with a poor weld fractured at the weld edge. This difference occurs because the material in the weld zone undergoes metallurgical changes due to friction-induced heating, which alters its hardness by lowering it. The specimen gauge length was measured at 92.38 mm. A GALDABINI QUASAR 100 tensile testing machine (Cardano al Campo, Italy) was used, with tests performed at a crosshead speed of 5 mm/min at room temperature. Stress–strain curves were generated for all specimens, and mechanical properties such as strain, stress, and ultimate tensile strength were experimentally determined.
For each set of welding parameters studied three specimens were tested. In addition, three specimens from the same aluminum sheets were cut and tested under identical conditions. These specimens are marked as 1050 BM and 5754 BM. Their mechanical properties were compared to those of the FSW specimens, and the results are detailed in the following section.

3. Results

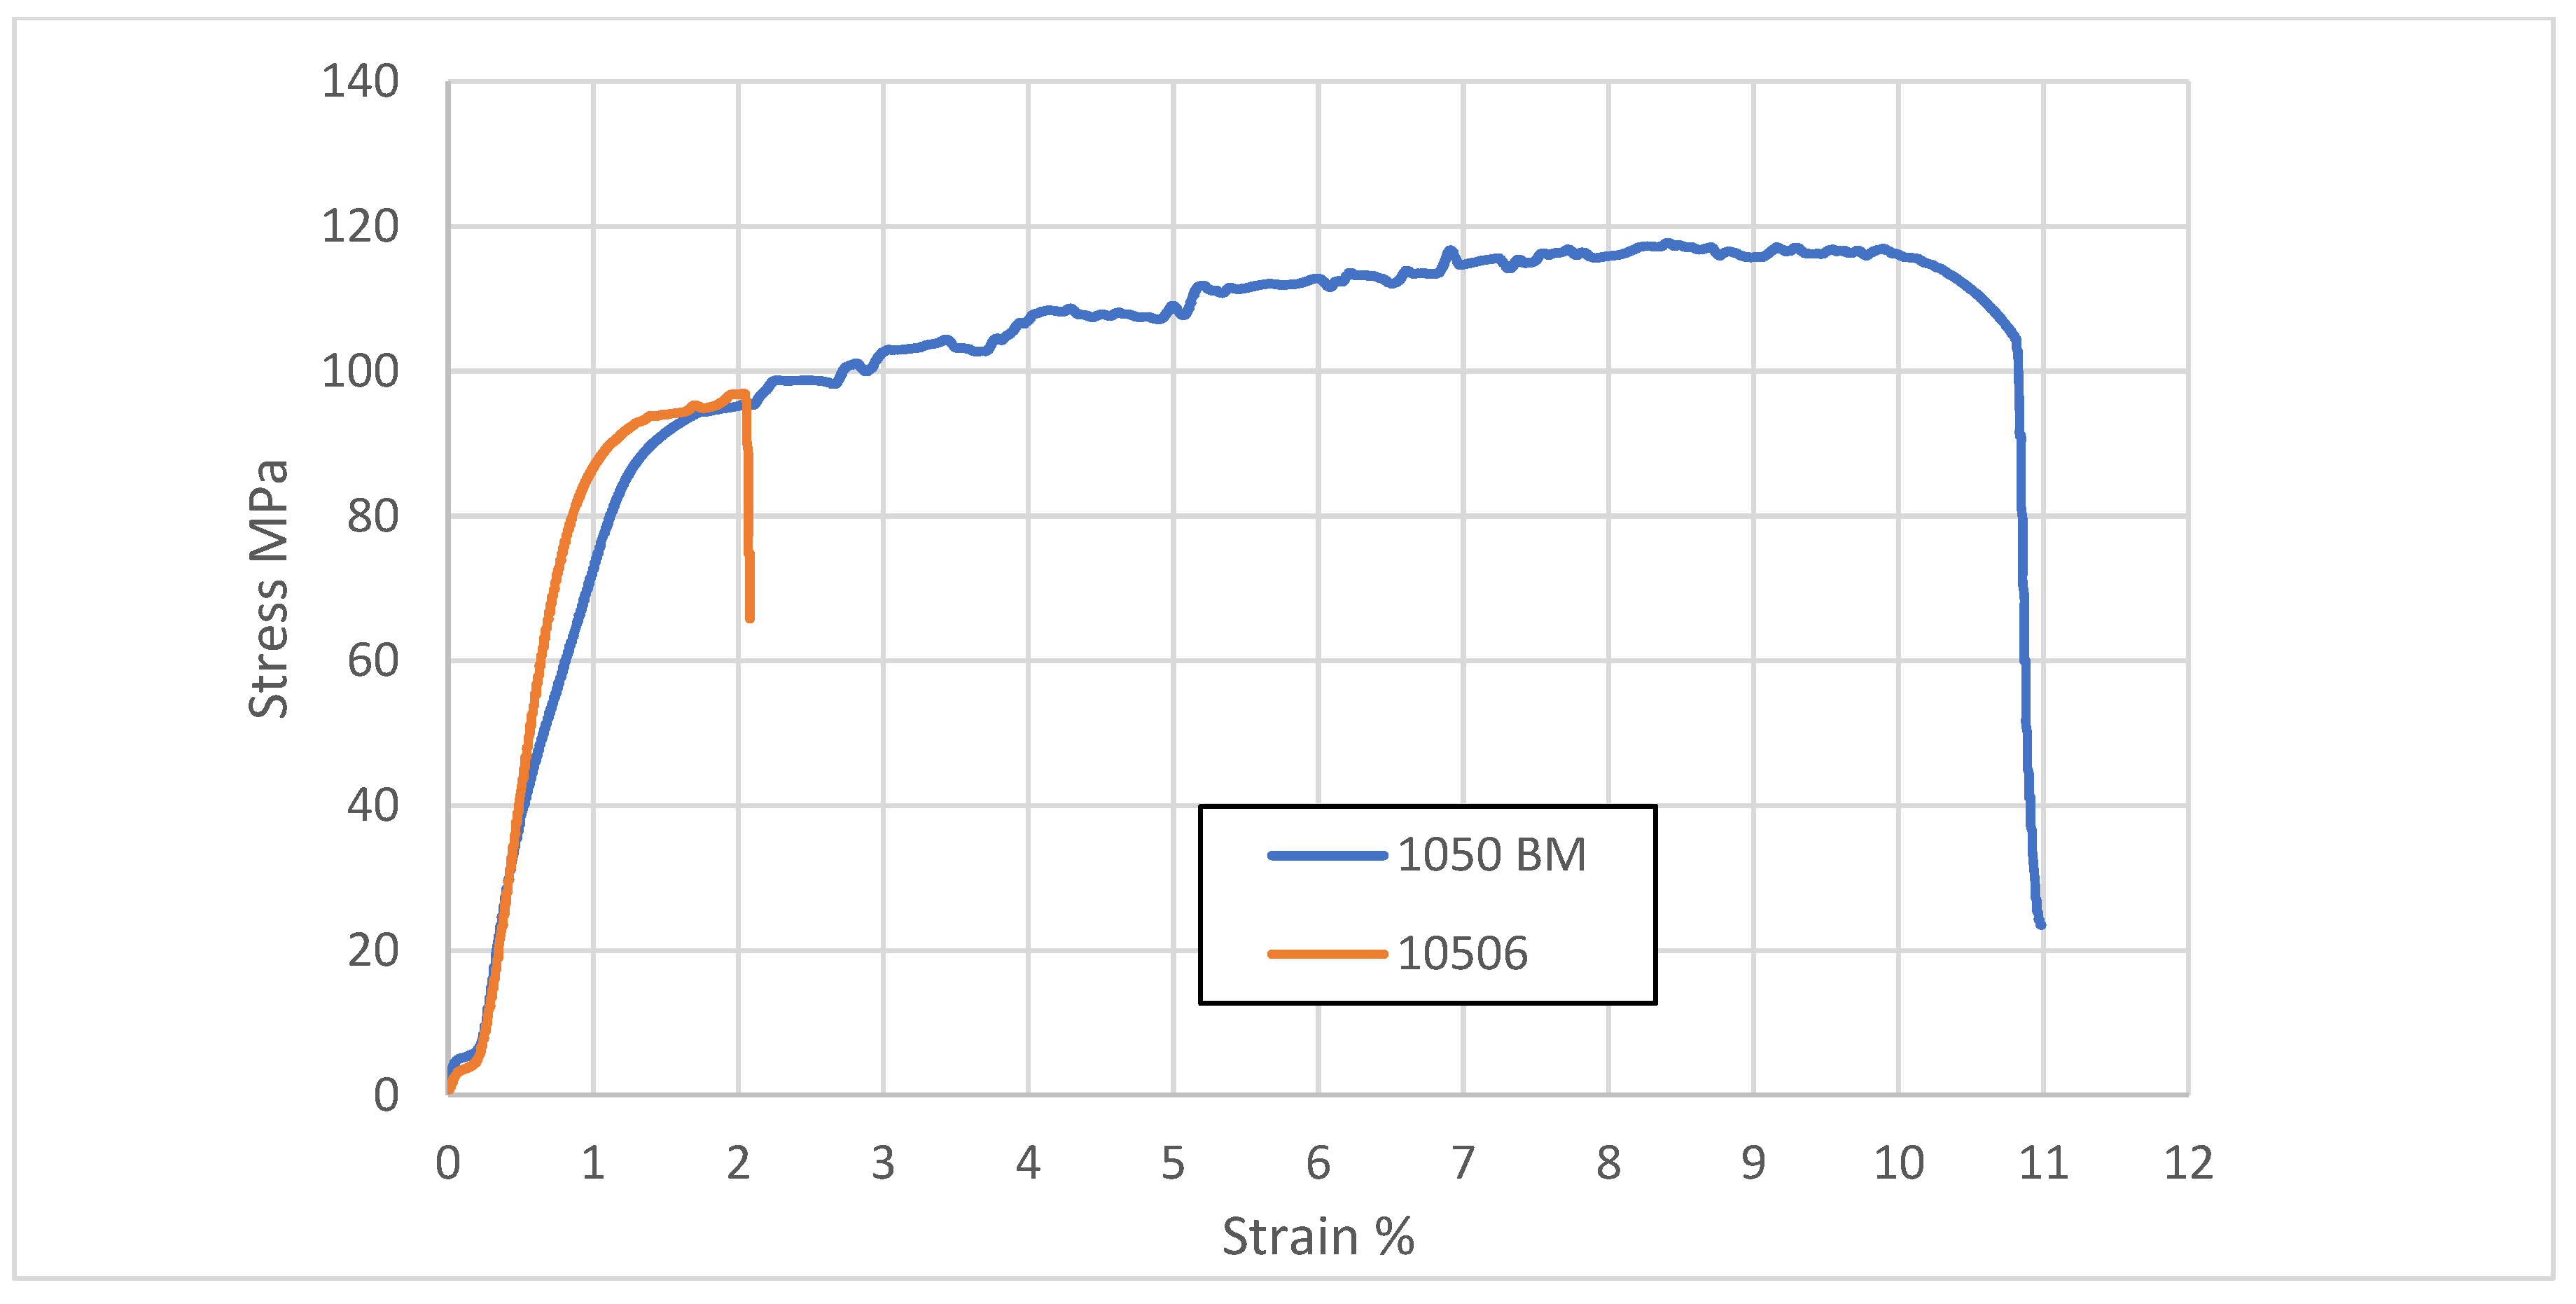
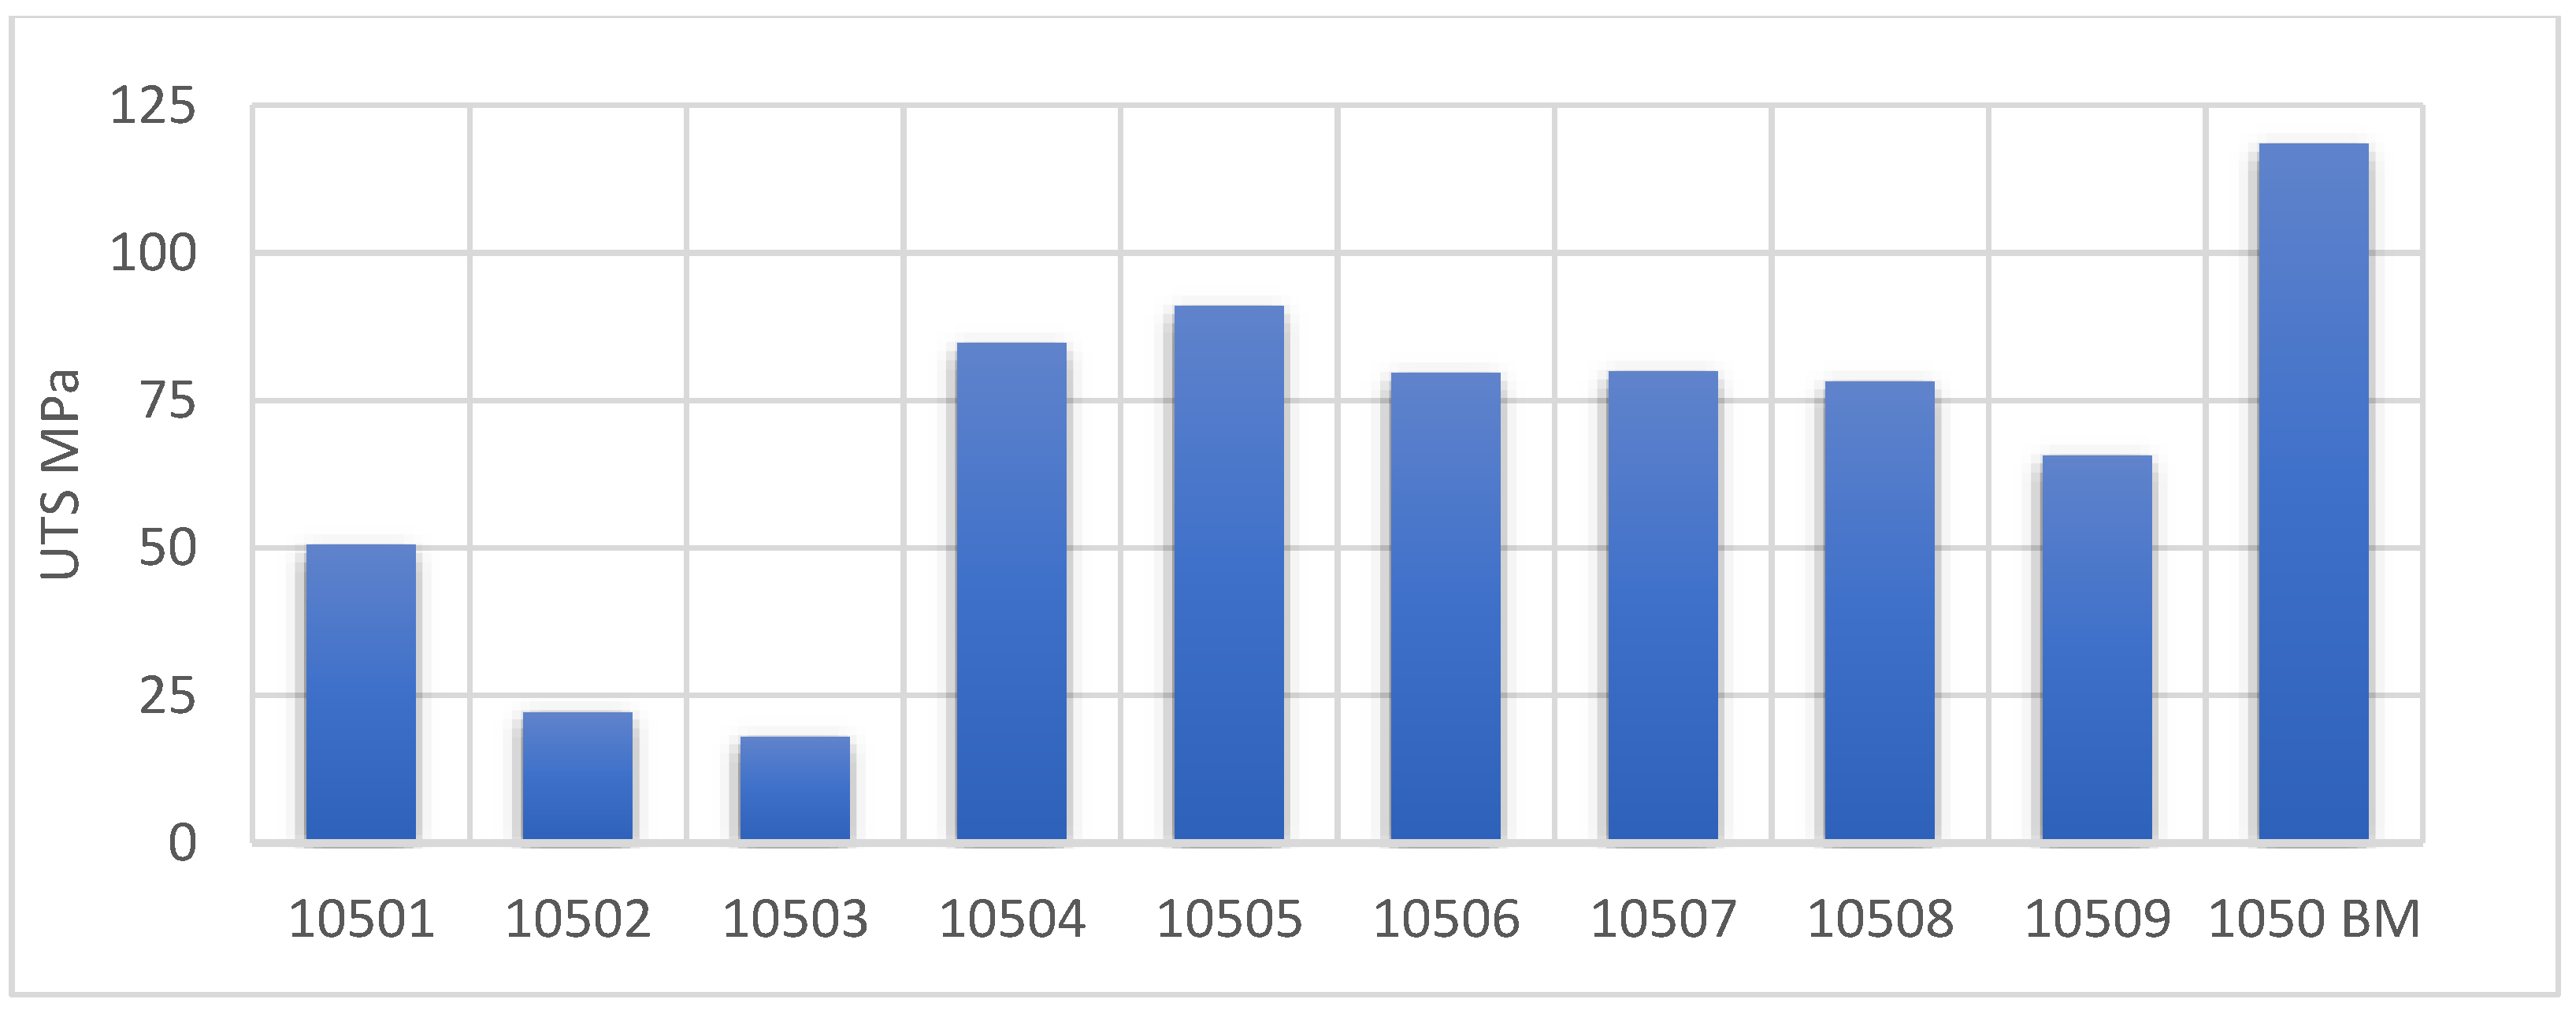
3.1. Friction Stir Welding AA1050

All AA1050 specimens were successfully friction-stir-welded. It was noted that an increase in rotational speed corresponds to an enhanced consolidation of the welds, particularly in contrast to the earlier, less robust welds produced at lower rotational speeds. The characterization of the mechanical strength of the joints is presented in Table 5, alongside the base material specimen.
Table 5 presents the mean values of the measured mechanical properties for all specimens: the ultimate tensile strength (UTS in MPa) and elongation (ε% in percentage). The table shows the base material AA1050 BM and specimen 10506, which exhibits the highest tensile strength among the welded specimens. Regarding the ultimate tensile strength (MPa), the base material 1050 BM exhibits the highest UTS of 118 Pa, succeeded by specimen 10506 at 95 MPa. Conversely, specimen 10503 possesses the lowest UTS value of 18 MPa. The measured elongation is indicative of ductility, reflecting the material’s capacity to deform prior to rupture. The base material (1050 BM) indeed displays the highest elongation at 8.5%, as expected. Specimen 10506, while exhibiting a relatively elevated UTS, shows a low value of elongation of 2% for a weld that is strong yet less ductile. Other specimens, specifically 10507 (3.8%) and 10504 (6.1%), show enhanced elongation but at a reduced UTS when compared to 10506.
The measured stress–strain curves for the two specimens, 1050 BM and 10506, are shown in Figure 5. The base material AA1050 BM demonstrates considerable tensile strength, reaching approximately 118 MPa, with strain approaching 10%, indicative of excellent ductility. The stress–strain curve within the plastic region reveals a relatively stable stress level (related to the strain hardening effect) across an extensive range of strain, as the material is capable of enduring significant deformation without sudden failure. In contrast, specimen 10506 exhibits a lower maximum stress, nearing 95 MPa, which is markedly inferior to that of the base material. The maximum strain for this specimen is substantially diminished at 2%, reflecting a decrease in ductility compared to 1050 BM.
The ultimate tensile strength (UTS) values for various specimens, expressed in MPa, are shown in Figure 6 alongside the base material 1050REF for comparative analysis. The base material exhibits the maximum UTS at approximately 118 MPa, demonstrating its capacity to endure the highest stress prior to failure. Similar results have been reported in the literature [40] on this alloy. Other specimens, namely 10504 and 10505, present moderate UTS values of around 84 MPa and 90 MPa, respectively, indicating a reasonable strength that is, however, significantly lower than that of 10506 and the base material. The specimens with the least tensile strength include 10503 (approximately 18 MPa) and 10502 (approximately 22 MPa), both characterized by exceedingly low tensile strength.
In Figure 7, the elongation (ε%) of the welded and base material specimens is shown. The base specimen demonstrates the highest elongation (approximately 8.5%), signifying exceptional ductility, while specimens 10504 and 10505 exhibit moderate elongation at 6.1% and 5.6%, respectively, revealing greater ductility relative to 10506.

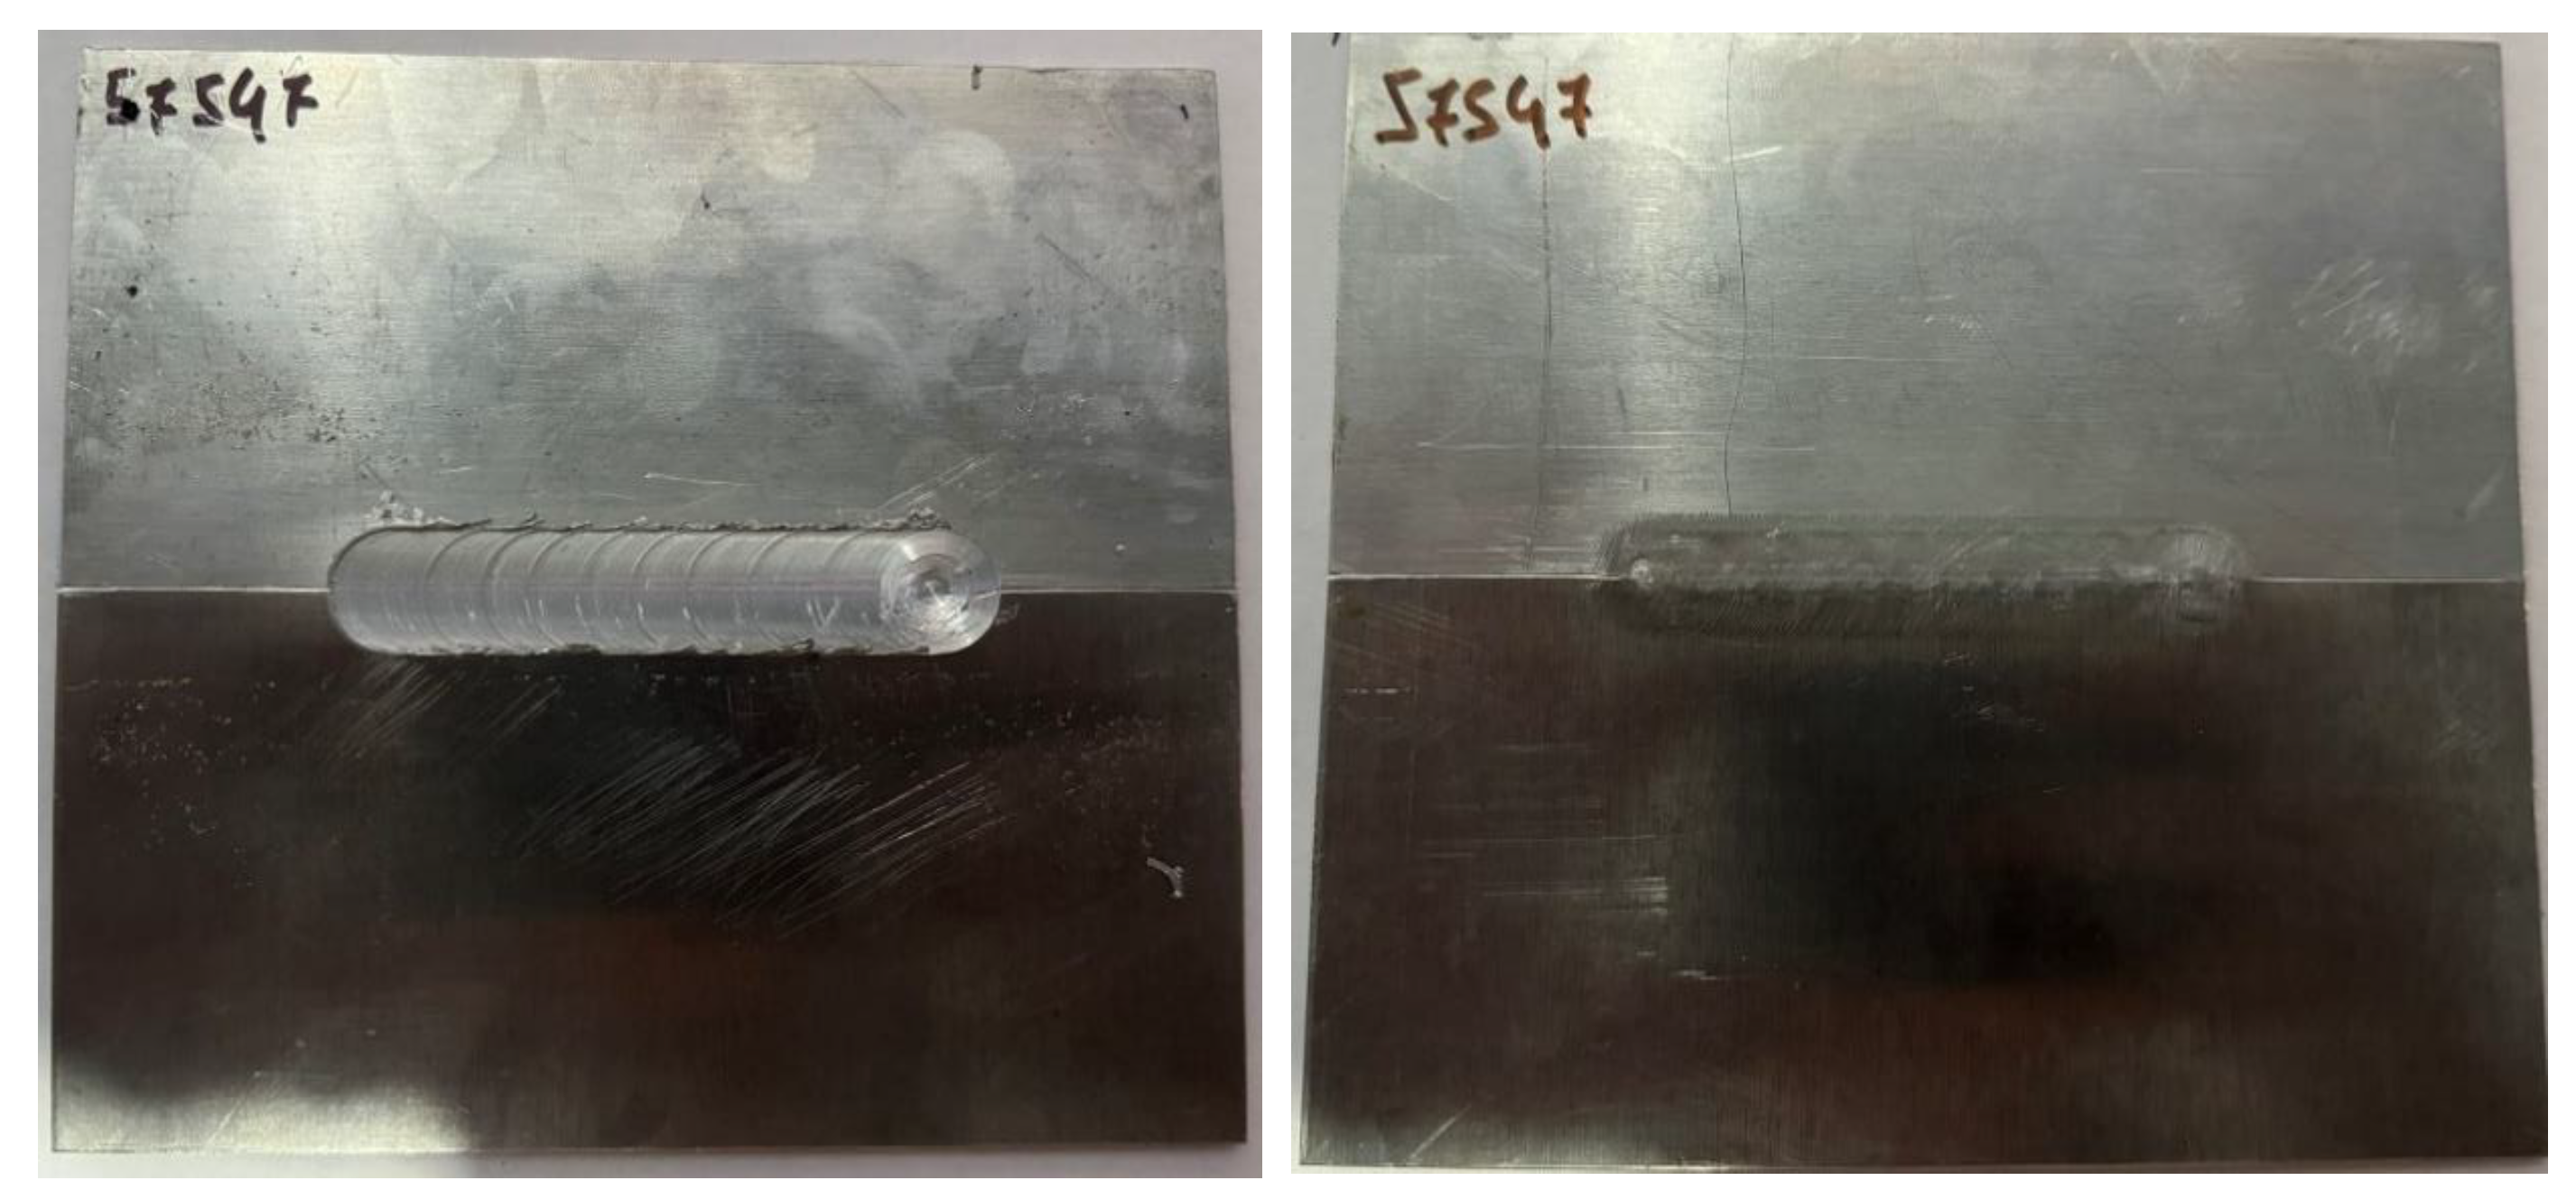
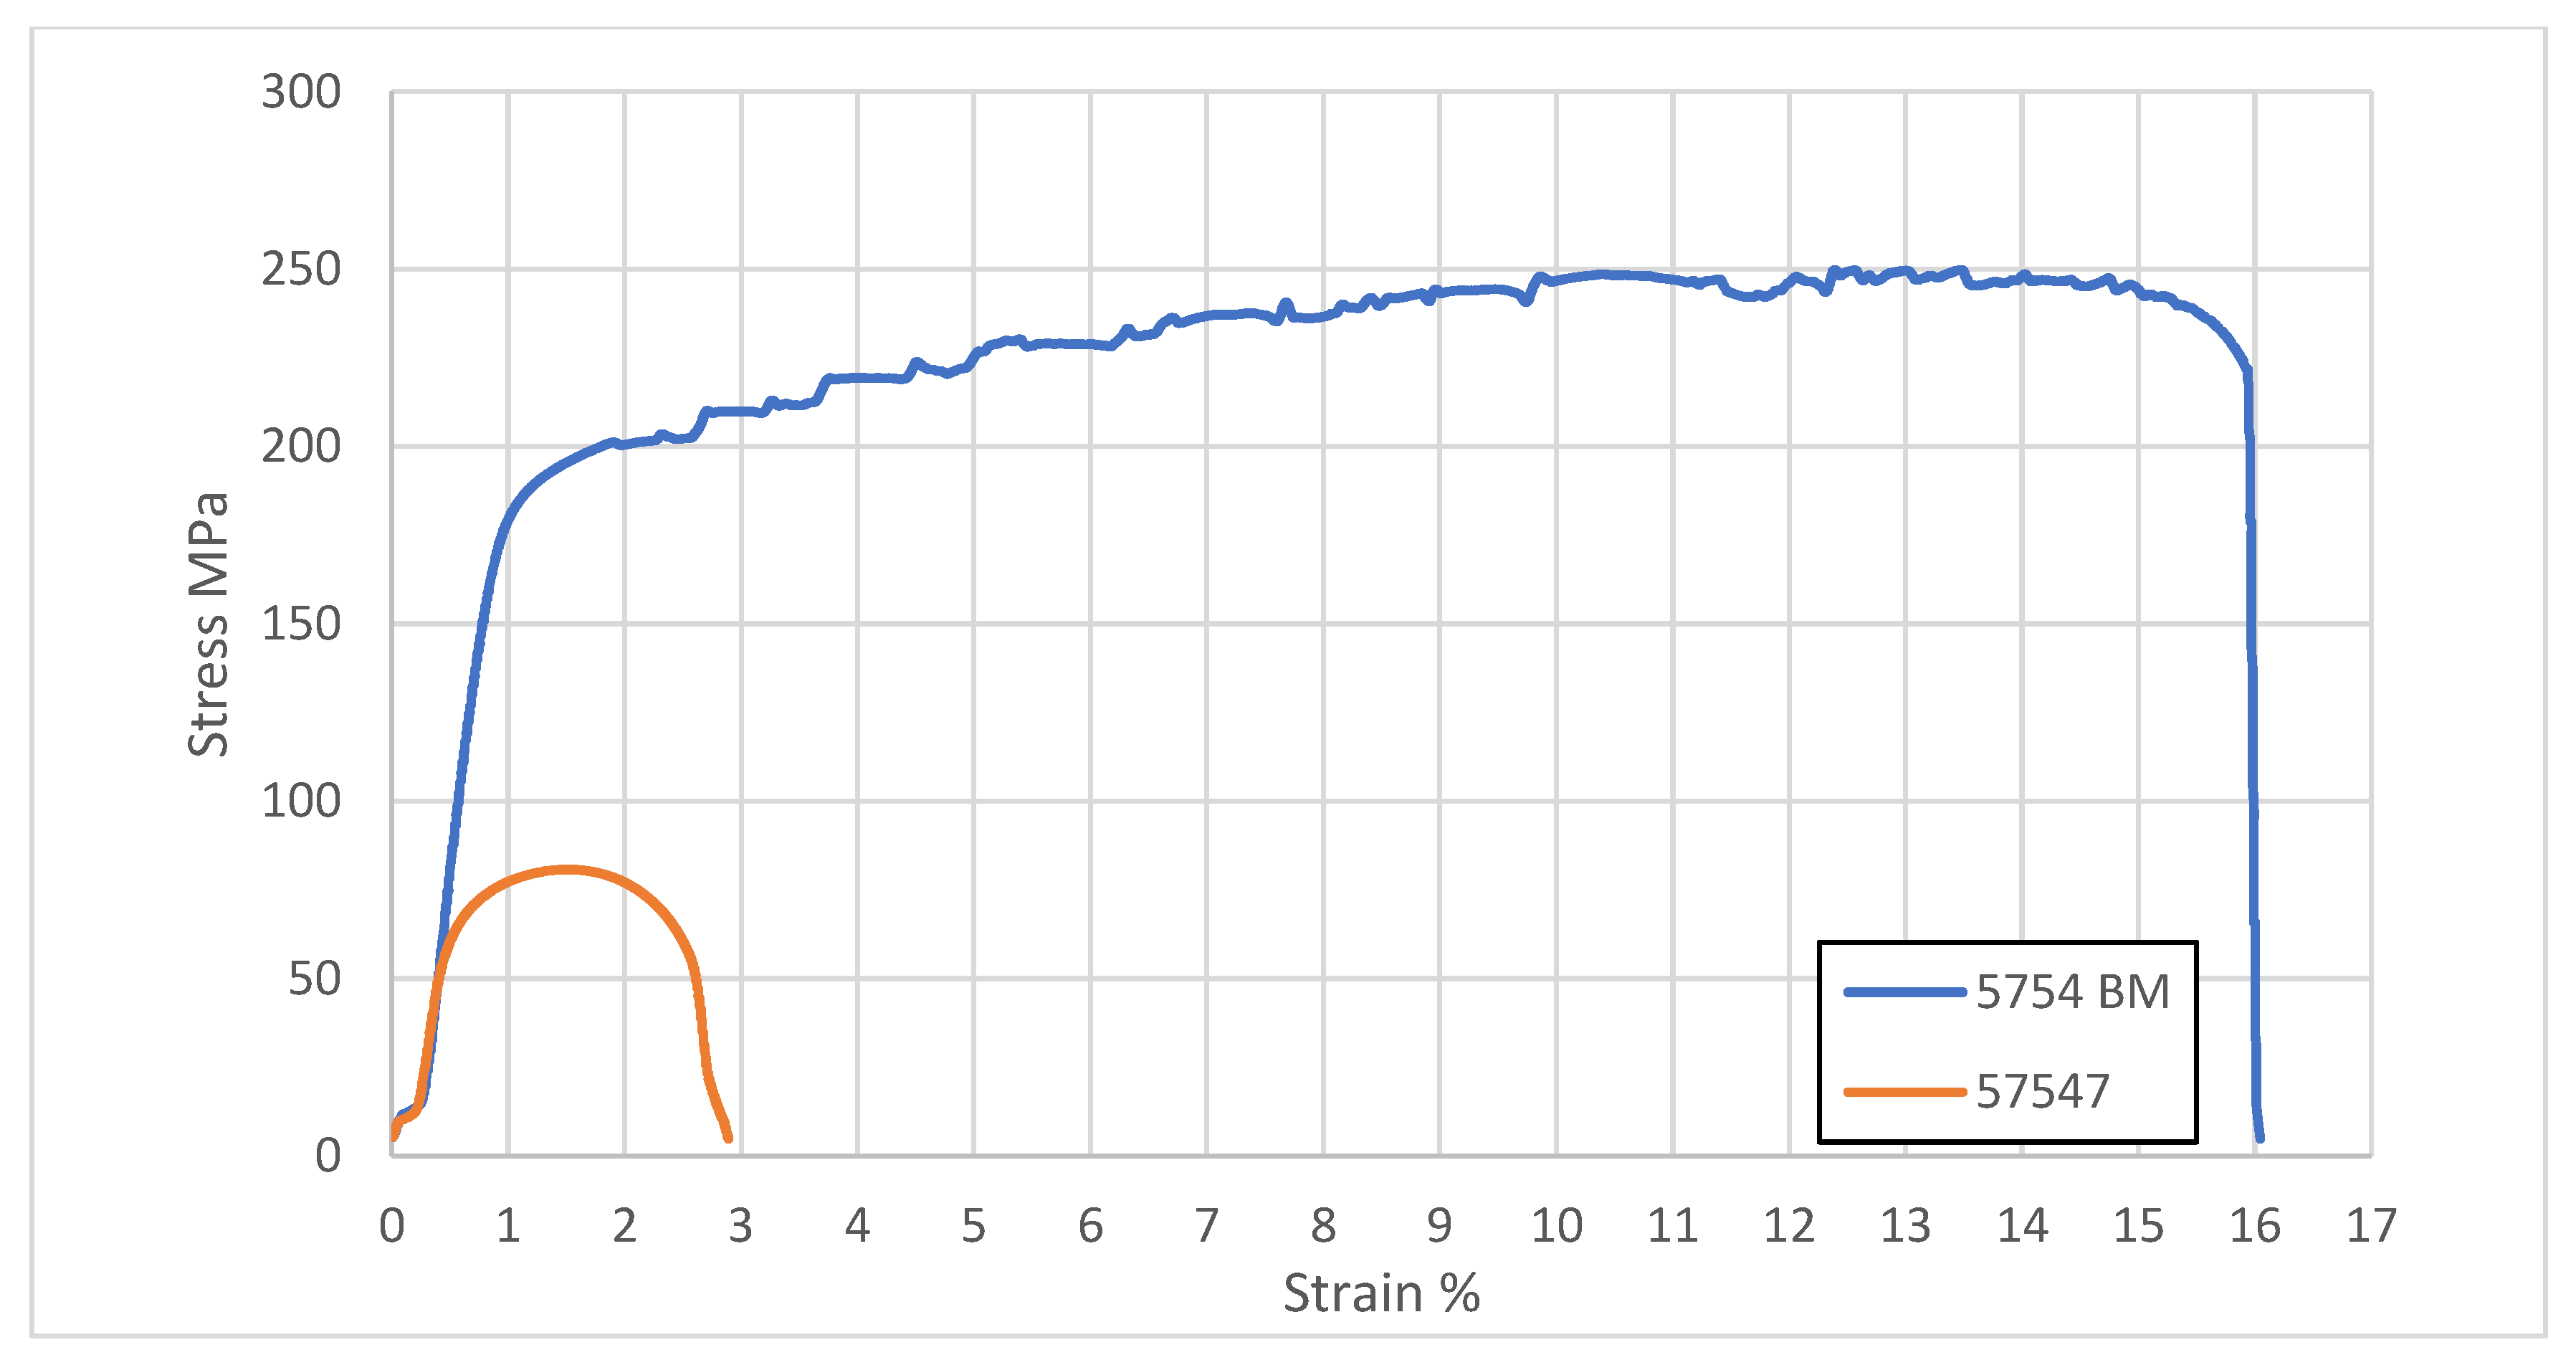
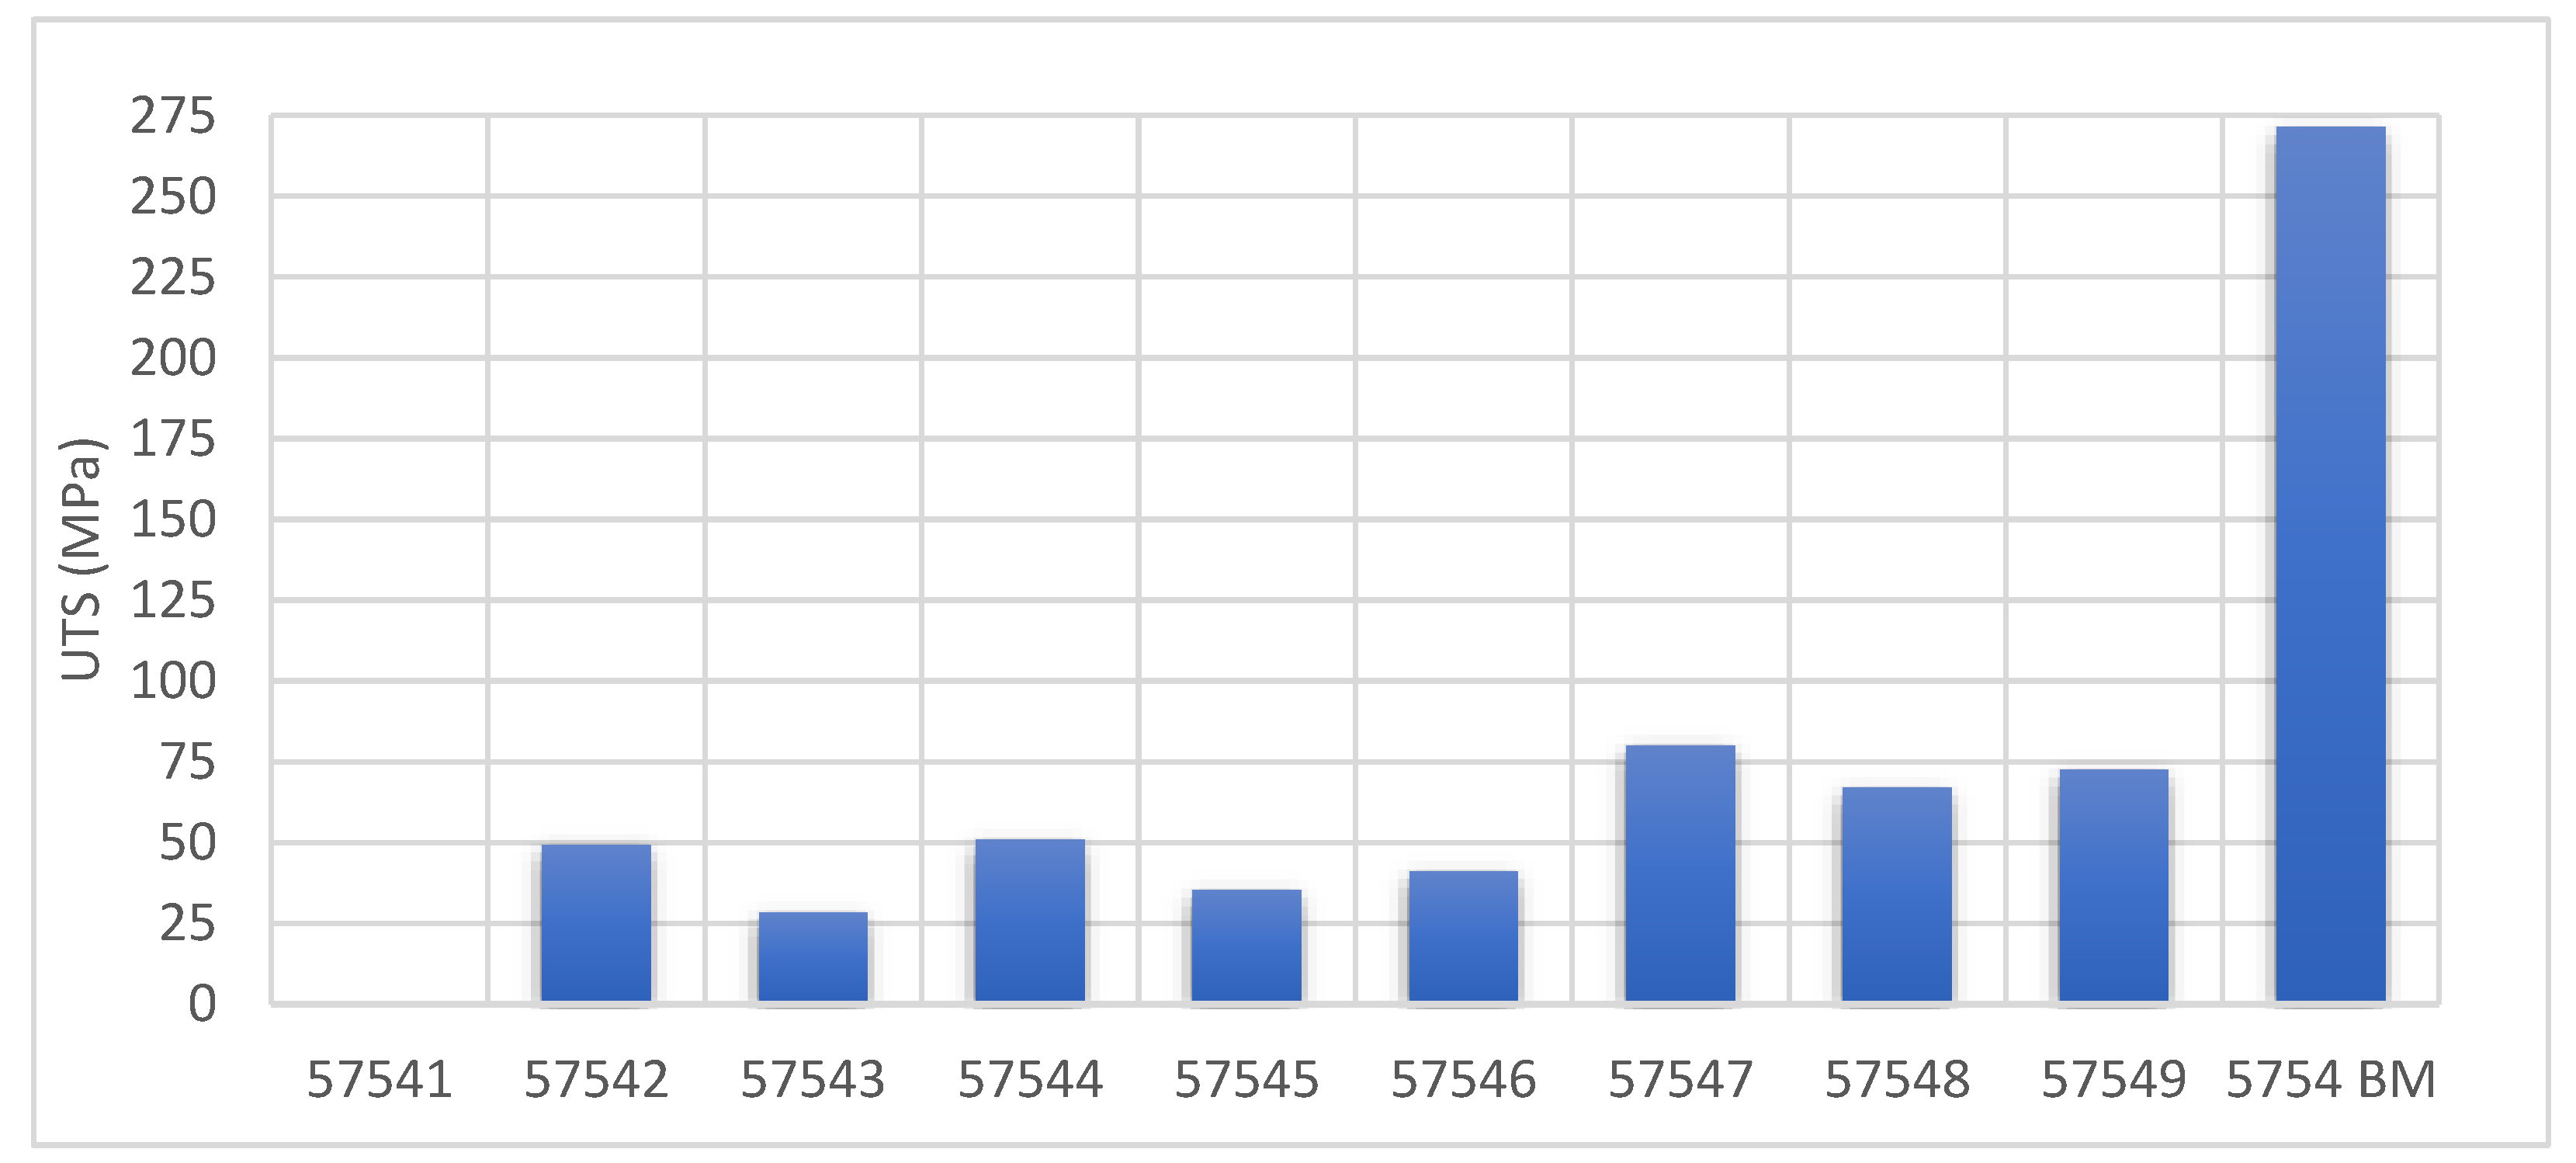
3.2. Friction Stir Welding AA5754

All AA5754 specimens were successfully welded with the sole exception of specimen 57541. This failure can be attributed exclusively to the rotational speed of the selected welding tool. Upon visual inspection, all remaining specimens appear to have been effectively welded; however, specimens 57547 (see Figure 8) and 57548 appear visually to be the best joints produced.
Table 6 presents the mean values of the measured mechanical properties for all specimens: the ultimate tensile strength (UTS in MPa) and elongation (ε% in percentage). The highlighted rows denote the base material AA5754 BM and specimen 57547, which exhibits the highest tensile strength among the welded specimens. The base material, 5754 BM, shows an ultimate tensile strength (UTS) of 271 MPa, which is markedly superior to that of all other specimens. Values close to the ones measured have previously been reported [41]. Additionally, it has the highest elongation (ε%) at 11.5%, signifying exceptional ductility, thereby permitting the material to elongate considerably prior to fracture.
Specimen 57547 is distinguished as possessing the highest UTS among the specimens, recorded at 80 MPa. Nevertheless, this value remains significantly inferior to the UTS of the base material. The elongation is measured at 1.5%, suggesting that 57547 is comparatively brittle in relation to the base material, implying a limited capacity for deformation before failure occurs.
The diagram presented in Figure 9 illustrates the stress–strain characteristics of two aluminum alloy specimens, namely 5754 BM (denoted by the blue curve) and 57547 (represented by the orange curve). The 5754 BM specimen reveals a significantly greater tensile strength, attaining a maximum stress value that approaches 250 MPa. The curve reaches a plateau within the plastic deformation region, where the material undergoes strain hardening, thereby sustaining a high stress level whilst continuing to deform. The material exhibits exceptional ductility, with strain extending to approximately 15%, which signifies its capability to endure significant deformation prior to failure.
In contrast, specimen 57547 manifests a notably lower maximum stress at approximately 80 MPa, attributable to its diminished strength relative to 5754 BM. The material experiences deformation up to around 3% strain before failure, thereby illustrating reduced ductility in comparison to the base material. This shows that 57547 is predisposed to brittle failure, exhibiting diminished capacity for elongation prior to rupture.
The bar chart depicted in Figure 10 illustrates the tensile strength (MPa) of the AA5754 specimens. The base material designated as 5754 BM shows the highest tensile strength, attaining an approximate value of 250 MPa. This observation underscores that the base material possesses the capacity to endure the greatest stress prior to failure, thereby categorizing it as the most robust specimen within this analysis.
The other specimens, including 57547, 57549, and 57544, demonstrate moderate tensile strength values, falling within the range of 50 MPa to 80 MPa. Specimen 57547 ranks the highest among these, achieving a tensile strength of approximately 80 MPa, thereby indicating superior performance in terms of tensile strength compared to all other specimens. Specimens 57542 and 57545 display even lower tensile strength, ranging from 30 MPa to 50 MPa, thereby rendering them considerably weaker than both 57547 and 5754 BM. Specimen 57541 reveals a tensile strength of 0 MPa, as it was not joined at the end.
The bar chart illustrated in Figure 11 provides a comparative analysis of elongation (ε%) of the 5754 specimens. The base material identified as 5754BM is distinguished by the highest elongation (ε%), reaching nearly 12%, which signifies exceptional ductility. This indicates that 5754 BM is capable of undergoing substantial deformation prior to fracture.
Specimen 57547 exhibits a notably lower elongation percentage (approximately 1.5%), indicating that it possesses significantly reduced ductility when compared to 5754 BM. Specimen 57549 showcases the second-highest elongation percentage (approximately 5%) subsequent to 5754 BM, rendering it more ductile than the other specimens. However, specimen 57544 shows an elongation percentage that is substantially low (1.6%), resulting in reduced ductility. The remaining specimens, such as 57542, 57543, and 57545, exhibit low elongation percentages, indicative of a deficiency in ductility.

4. Discussion

The primary objective of this investigation was to investigate the optimal combined effect of two parameters, namely rotational speed and welding speed, with the intention of maximizing the tensile strength of welded joints. The Taguchi methodology was employed utilizing an L9 (32) orthogonal array to systematically examine the influence of these parameters while concurrently minimizing the number of experimental trials.
Two distinct methodologies were employed—initially, through the calculation of means (average tensile strength values at each factor level), and subsequently through the assessment of signal-to-noise (S/N) ratios—to assess the robustness of the process. The response table for signal-to-noise (S/N) ratios encapsulates the performance metrics of the process at each factor level. The objective concerning S/N ratios is to optimize their values, as elevated figures, using the “Larger is Better” criterion, signify superior performance under fluctuating conditions (i.e., reduced noise). The response table for signal-to-noise (S/N) ratios offers valuable insight into the stability and reliability of the welding process under different conditions, and higher S/N ratios correspond to more consistent tensile strength performance with reduced sensitivity to external influences and noise.
This dual-faceted approach facilitated the identification not only of the optimal welding settings, but also of those that would yield the most consistent results under varying conditions.
In addition, the analysis of the response tables identifies the impact of each factor at their respective levels.
For each set of welding parameters studied three specimens were tested. Each specimen was then divided into five equal width pieces, each 10 mm wide, for tensile strength testing. Surface imperfections were removed by polishing the edges, ensuring consistency across all specimens.

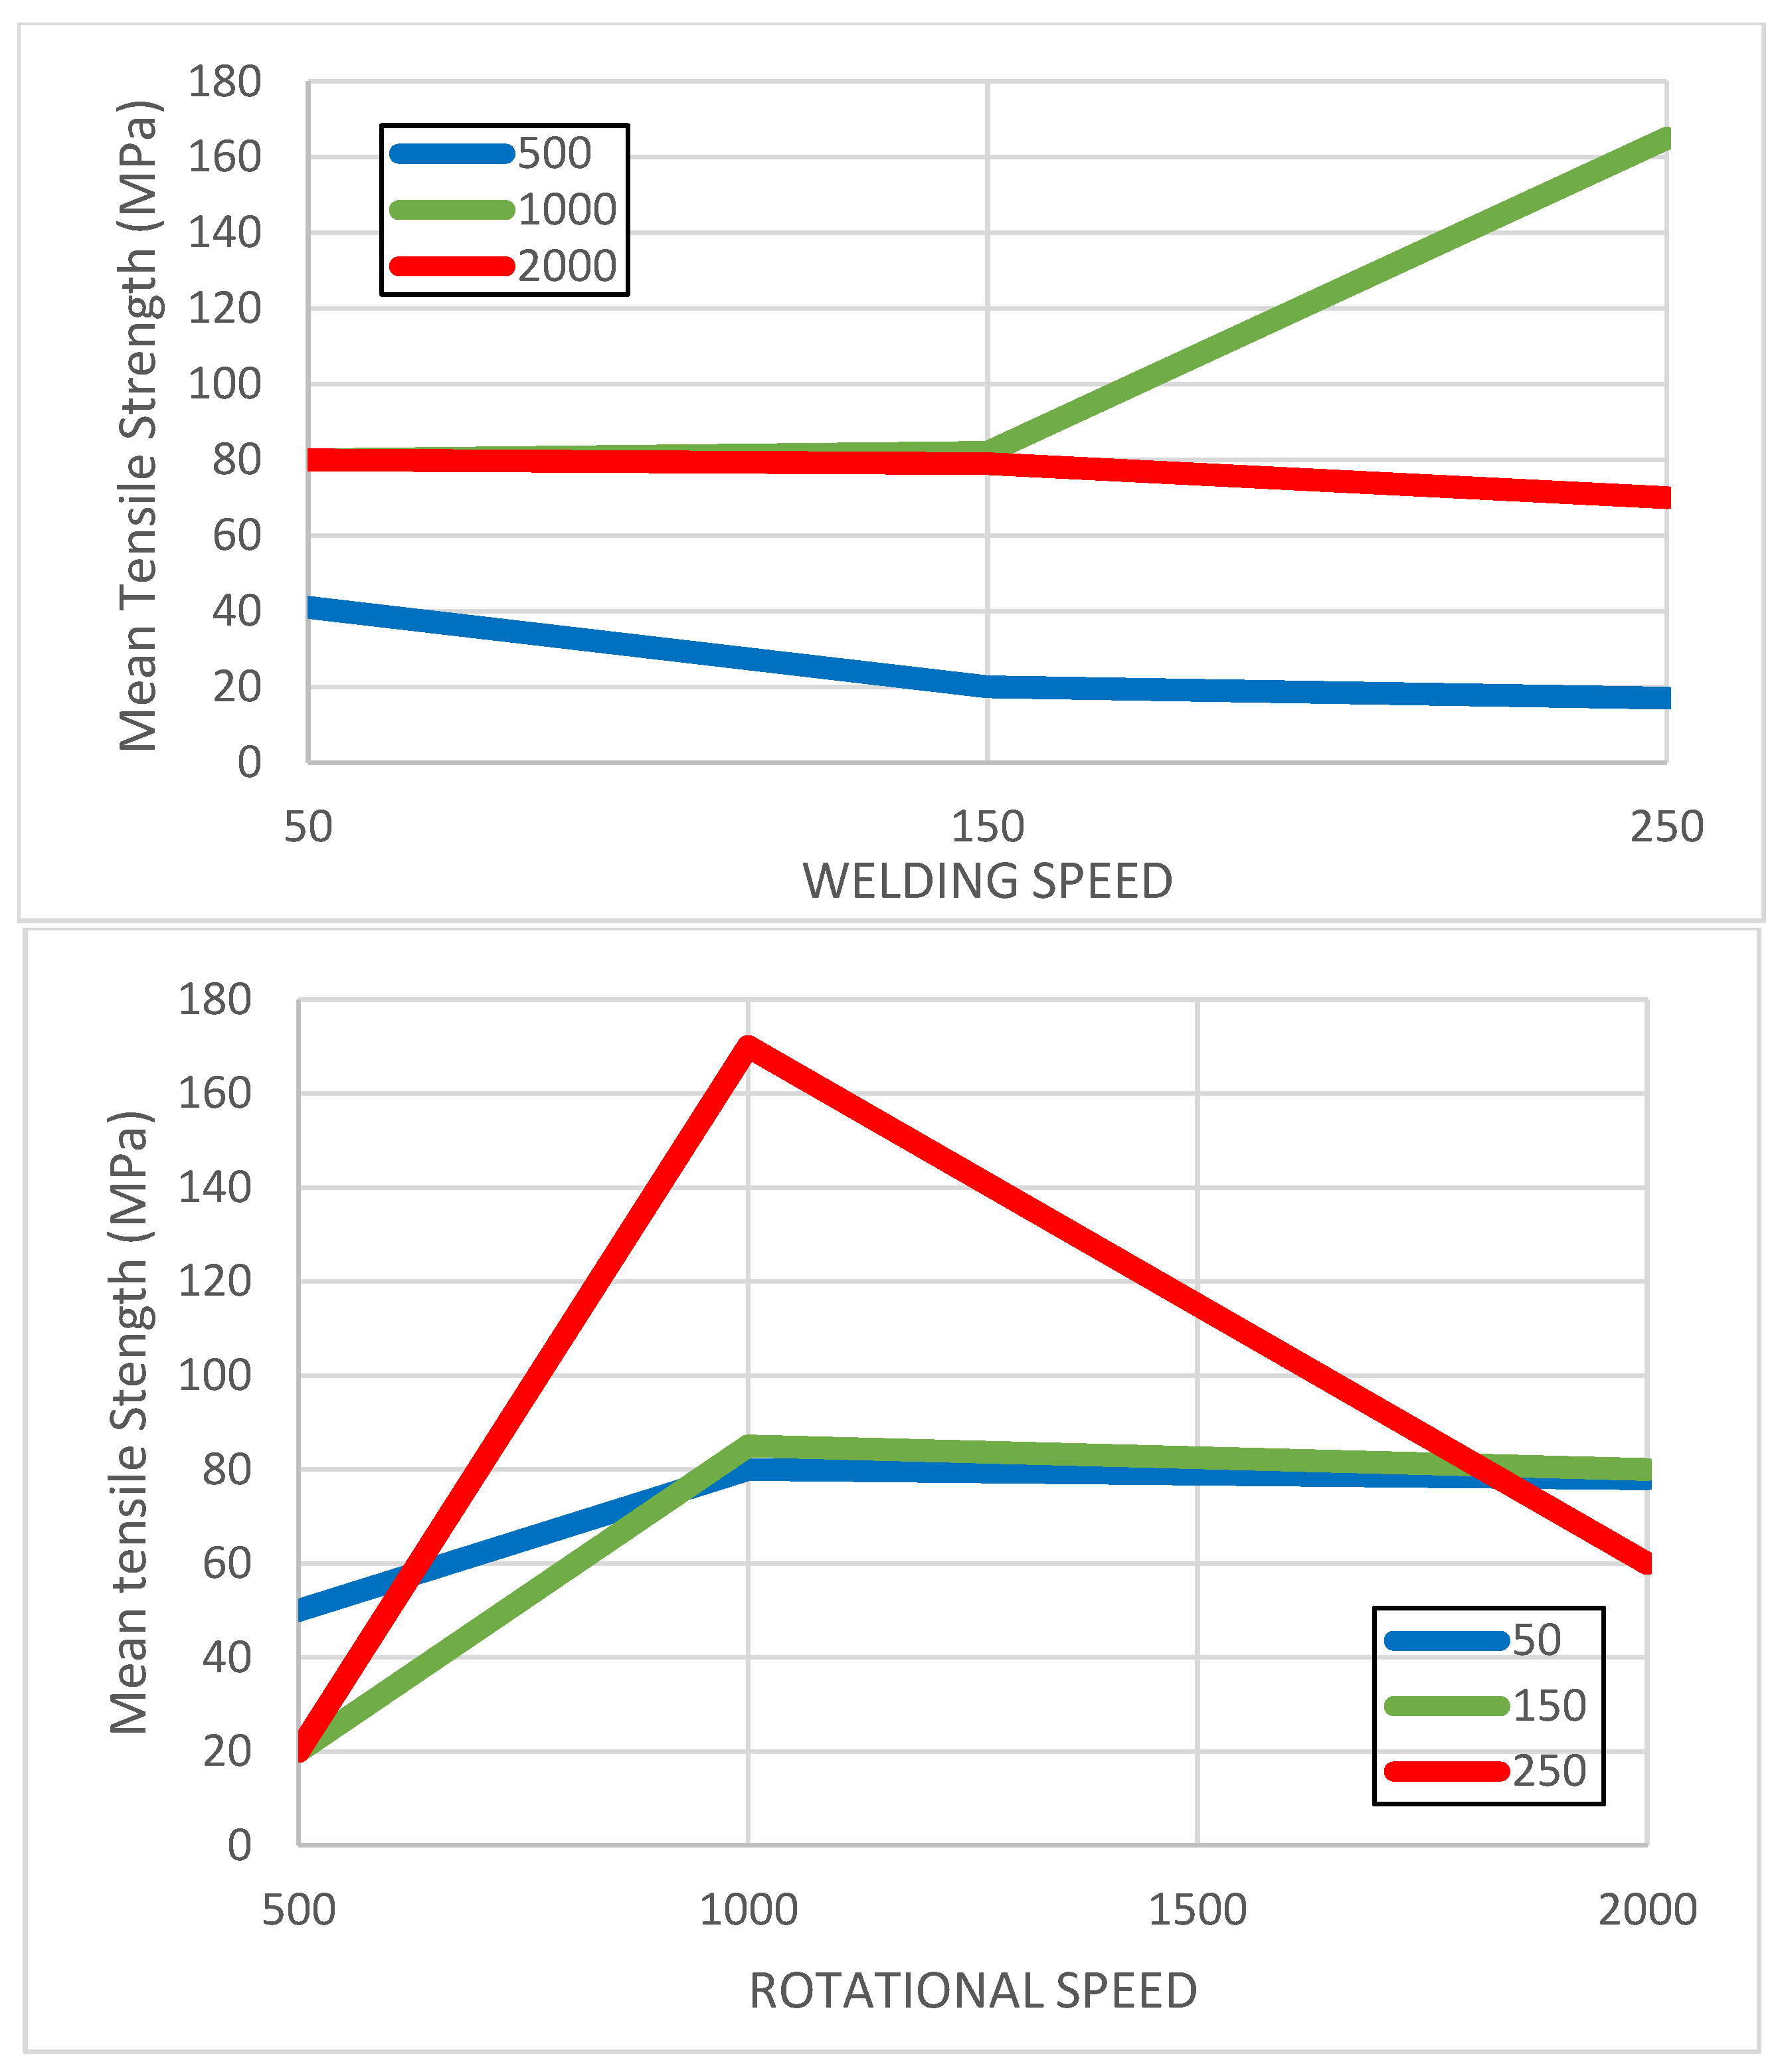
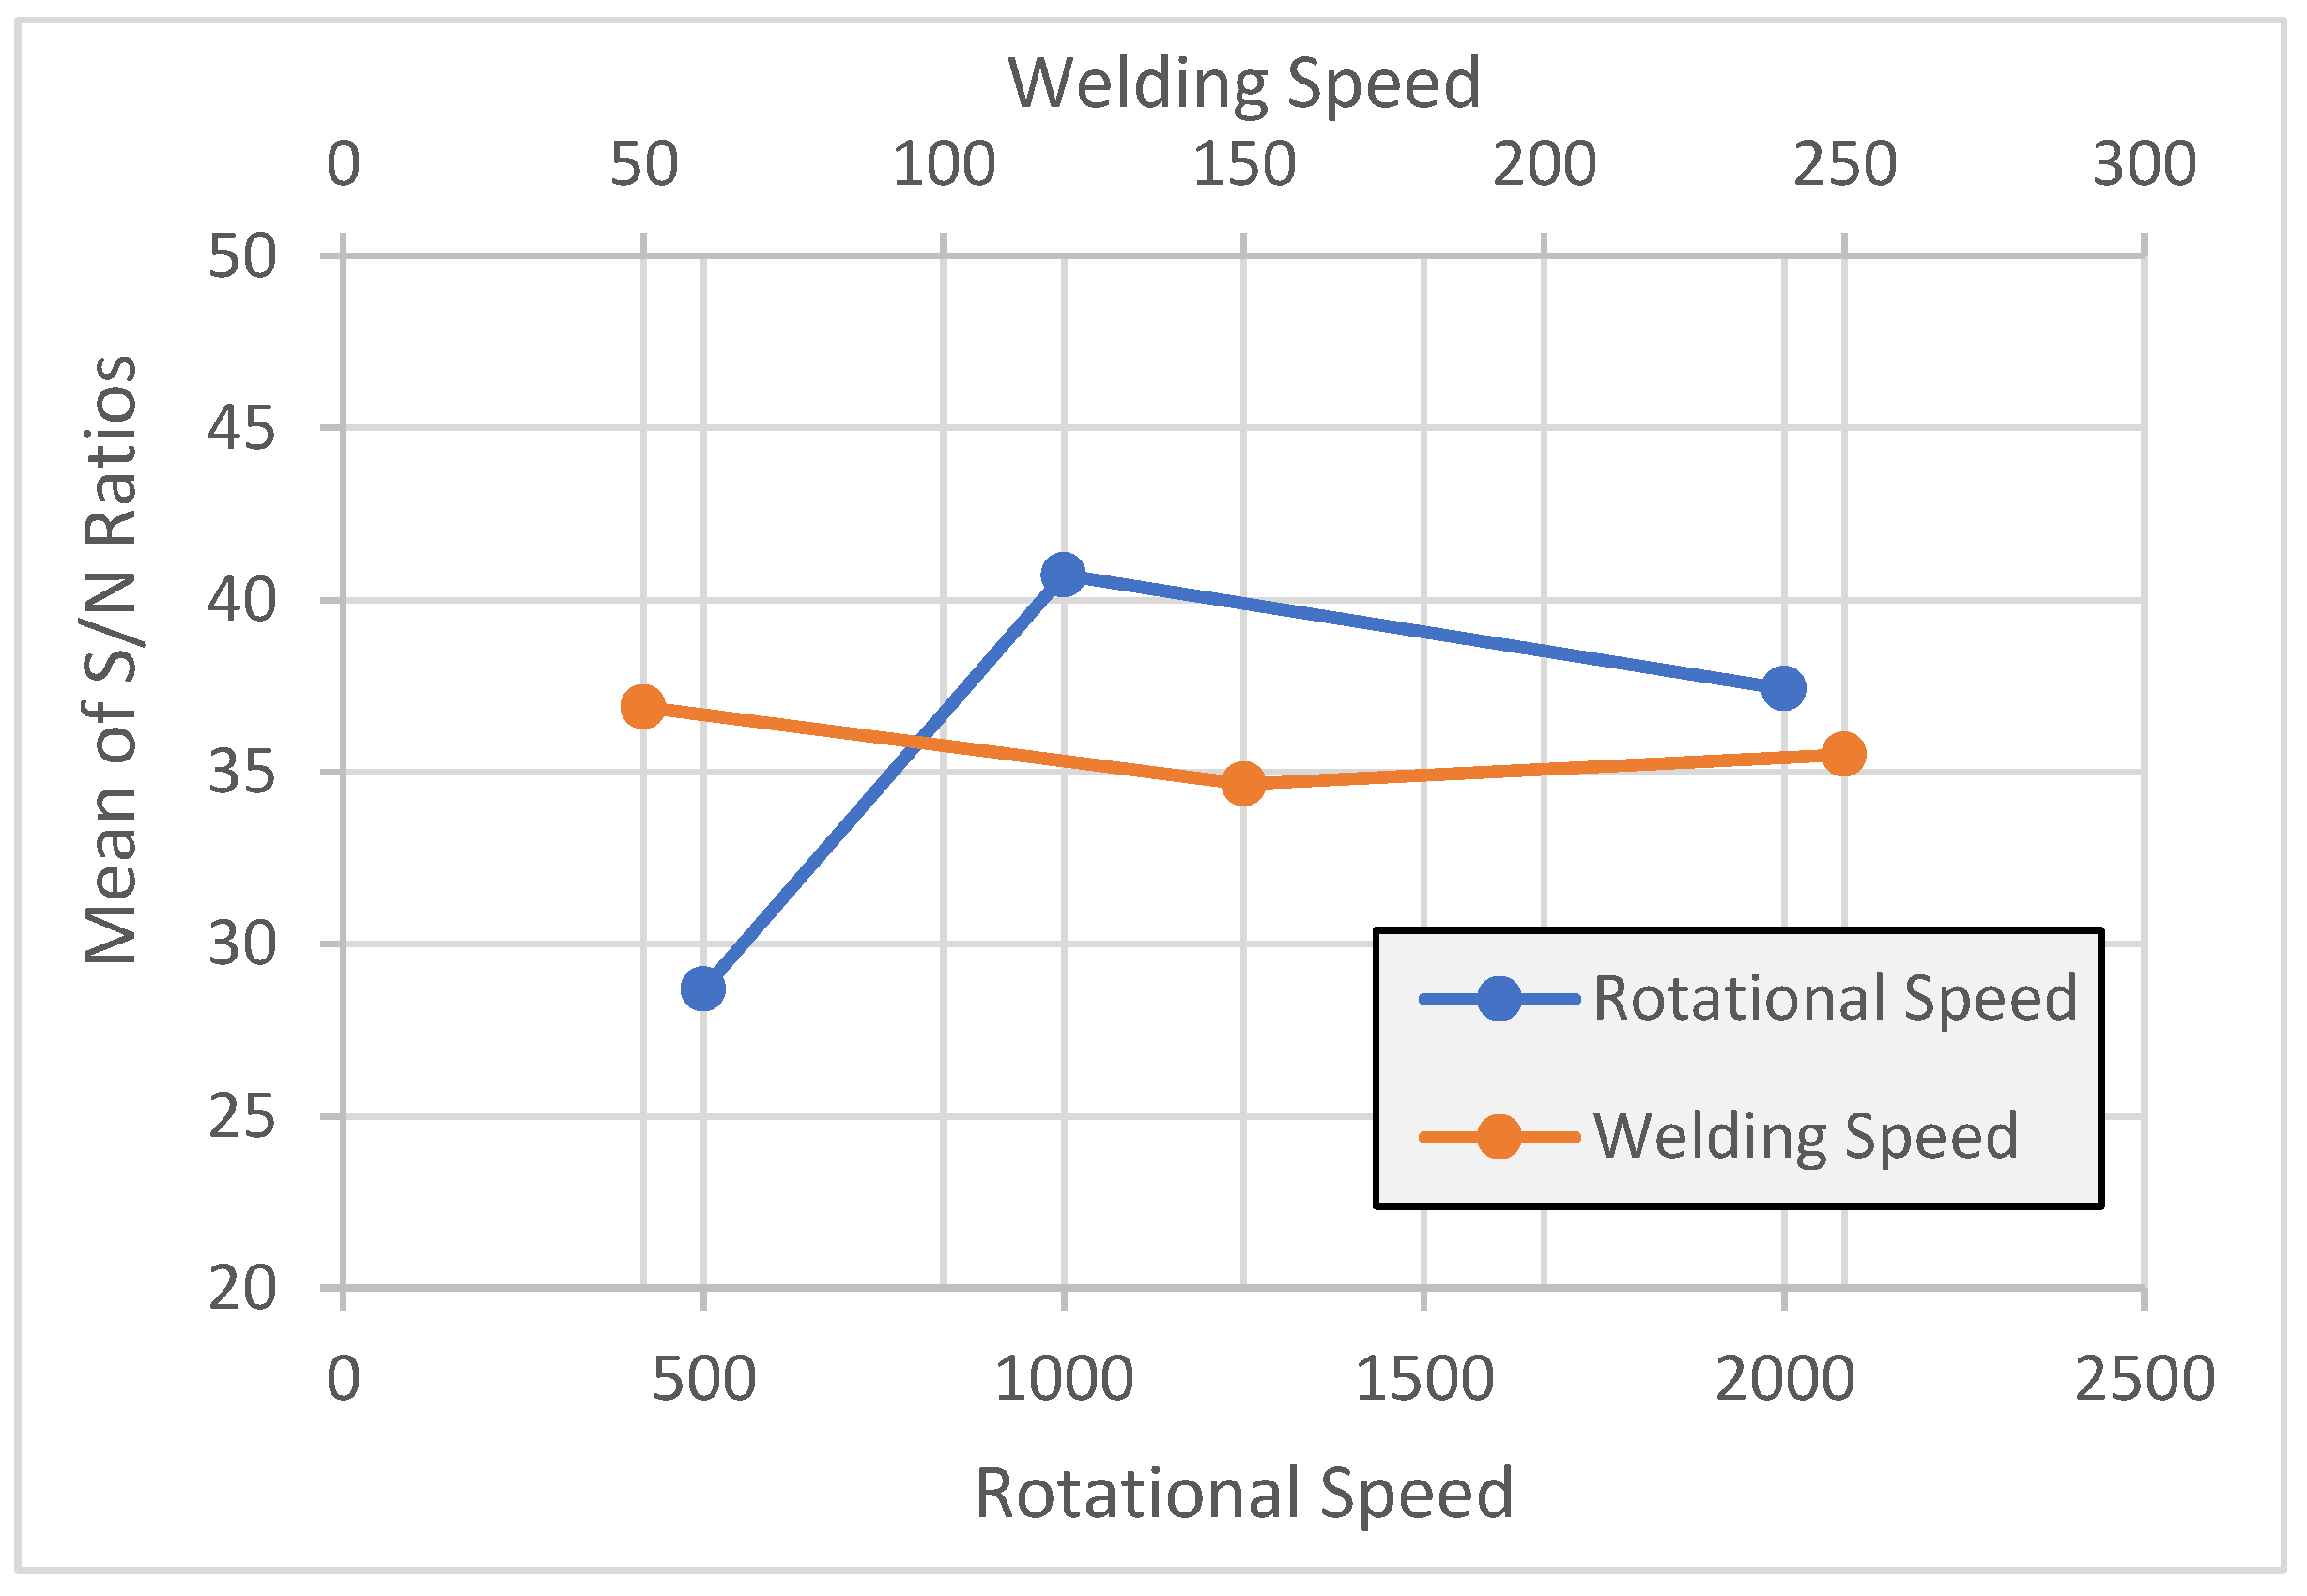
4.1. Enhancement and Evaluation of Welding Parameters for AA1050

The range of feed and speed combinations for the experimental design is shown in Table 2. With respect to rotational speed (see Table 7), the highest S/N ratio is recorded at Level 2 (40.73), indicating that a rotational speed of 1000 RPM brings the greatest robustness in terms of tensile strength. The Delta value of 12.04 is markedly higher than that associated with welding speed, thereby demonstrating that rotational speed is the more critical determinant for ensuring stable performance. In the context of welding speed, the maximum S/N ratio is observed at Level 1 (36.89), suggesting that the minimum welding speed of 50 mm/min affords a marginally greater robustness compared to higher welding speeds. Nevertheless, the Delta value is merely 2.24, suggesting that welding speed exerts a lesser influence on process stability in comparison to rotational speed. From this analysis, a rotational speed of 1000 RPM is the optimal selection for maximizing robustness, while a welding speed of 50 mm/min also contributes to sound joints, albeit with reduced significance.
The response table for mean tensile strength delineates the average tensile strength values corresponding to each factor level, with the objective being to amplify the mean values to realize the largest feasible tensile strength. Regarding rotational speed, the maximum mean tensile strength is recorded at Level 2 (114 MPa), substantiating that a rotational speed of 1000 RPM is indeed the optimal choice for attaining maximum tensile strength. The Delta value is considerably elevated at 84.06, which further corroborates that rotational speed exerts the most substantial influence on tensile strength. Concerning welding speed, the peak mean tensile strength is noted at Level 3 (84 MPa), indicating that the highest welding speed of 250 mm/min yields the most robust welds. The Delta value of 20 is lower in comparison to that of rotational speed, thereby reaffirming that welding speed, while still significant, has a comparatively lesser impact. So, a rotational speed of 1000 RPM and a welding speed of 250 mm/min together provide the highest tensile strength measured in this study.
The main effects plot for mean tensile strength (Figure 12) shows the effect of rotational speed and welding speed on tensile strength. This facilitates the empirical validation of the optimal levels of each variable from the mean tensile strength values. With increasing rotational speed, tensile strength exhibits a pronounced increase from 500 RPM to 1000 RPM, attaining its maximum at this point. With further increases in rotational speed over 1000 RPM, a marked decline in tensile strength is observed at 2000 RPM, as excessive rotational speed produces excessive heat in the material, adversely affecting the mechanical properties of the weld by altering grain structure and undermining the integrity of the material in the weld zone.
With respect to welding speed, tensile strength remains largely stable within the range of 50 mm/min to 150 mm/min, yet it experiences an increase at 250 mm/min. This observation indicates that elevated welding speeds may enhance material flow and heat dissipation, thereby contributing to superior weld quality. Therefore, the optimal parameter set, as drawn from this plot, consists of a rotational speed of 1000 RPM and a welding speed of 250 mm/min.
The interaction plot for mean tensile strength (Figure 13) offers a more profound understanding of the interconnection between rotational speed and welding speed, and their combined impact on tensile strength. This plot is pivotal for discerning any synergistic effects that may not be immediately evident when examining the factors in isolation. From the plot, several significant observations are made below.
Across all welding speeds, the tensile strength remains consistently suboptimal. This observation suggests that 500 RPM is inadequate for generating the frictional heat necessary for efficient solid-state welding, irrespective of the welding speed employed. The insufficiency of heat likely produces yielding of the aluminum to an inadequate extent and subpar material flow, resulting in compromised joint integrity. This behavior underscores the necessity of ensuring sufficient heat input in friction stir welding, particularly concerning rotational speed.
A notable enhancement in tensile strength is recorded, particularly at increased welding speeds. The 1000 RPM rotational speed appears to strike an optimal equilibrium between heat generation and material flow, facilitating the formation of sound welds. Specifically, the tensile strength reaches its maximum at 250 mm/min, where the synergy of adequate heat and effective material mixing produces optimal mechanical properties within the weld. This finding highlights the importance of ascertaining the optimal interaction between rotational and welding speeds, as deviations from ideal values for either parameter may adversely affect weld quality. At the parameters of 1000 RPM and 250 mm/min, the process achieves heat equilibrium, promoting a complete material joint without over- or underheating.
While the tensile strength at 2000 RPM demonstrates some enhancement with increased welding speeds, the overall performance remains inferior in comparison to that observed at 1000 RPM. The reduction in tensile strength at this elevated rotational speed may be attributed to excessive heat generation, potentially relating to negative effects such as grain coarsening or internal anomalies within the weld zone. Furthermore, the rapid rotation may induce turbulent plastic material flow, which disrupts the homogeneity of the weld and lowers its strength.
The interaction plot shows that a rotational speed of 1000 RPM is optimal, and when coupled with a welding speed of 250 mm/min, it results in the maximum tensile strength. This finding underscores the necessity for friction stir welding to achieve an exact equilibrium between heat input and material flow to guarantee the formation of strong and dependable welds.
The main effects plot for signal-to-noise (S/N) ratios (Figure 14) offers a comprehensive understanding of the process’s robustness. The S/N ratio serves as an indicator of the process’s sensitivity to variability, wherein elevated values signify that the process can sustain consistent performance. In essence, the S/N ratio assists in identifying the operational settings that not only enhance performance, but also mitigate the effects of external variables. From the plot, several significant deductions can be stated.
In the case of rotational speed, the S/N ratio peaks at 1000 RPM, thereby affirming that this rotational velocity provides the most resilient performance. This observation is particularly noteworthy as it signifies that the tensile strength remains comparatively stable across diverse conditions at this specific speed. Practically, this indicates that welding is less sensitive to disturbances such as minor fluctuations in tool alignment, slight variations in material characteristics, or minor differences in process parameters values. Conversely, at both 500 RPM and 2000 RPM, the S/N ratios are prominently lower, implying that these speeds exhibit greater susceptibility to variability. The low heat generation at 500 RPM likely results in insufficient plastic material flow and joint integrity, whereas the excessive heat generated at 2000 RPM leads to structural deficiencies within the weld zone.
Regarding the welding speed, the S/N ratios for welding speed demonstrate a more well-proportioned distribution across the three levels. Although 50 mm/min showcases the highest S/N ratio, the disparity relative to the other levels is not particularly pronounced. This indicates that the welding speed does not exert as significant an influence on process robustness as the rotational speed does. Nonetheless, the elevated welding speed of 250 mm/min still yields a competitive level of robustness, suggesting that increased welding speeds can be advantageous without compromising consistency.
A comparison of Figure 11 and Figure 13 reveals that the rotational speed predominantly influences the FSW process, as has been reported previously in the literature [31].
In summary, the 1000 RPM rotational speed emerges as the most robust parameter setting, capable of sustaining tensile strength under diverse conditions. The welding speed of 250 mm/min also proves effective, although its impact on process robustness is less significant in comparison to rotational speed.
The interaction plot for S/N ratios (Figure 15) further investigates how the relationship between rotational speed and welding speed affects the stability of the process. This analysis is particularly instrumental in comprehending the way the interaction of these two parameters influences the process’s capacity to endure variability.
At 500 RPM, the S/N ratio remains consistently low across all welding speeds, reflecting inadequate robustness. This observation suggests that 500 RPM is not only insufficient for generating the necessary heat, but is also highly sensitive to external disturbances, resulting in variable and unreliable outcomes. This reinforces the imperative for higher rotational speeds to attain a more stable welding process.
At 1000 RPM, the signal-to-noise (S/N) ratio shows significant improvement, particularly at higher welding speeds. The maximum S/N ratio is observed at 250 mm/min, indicating that this combination offers the best compromise between tensile strength and process stability. The steady performance at 1000 RPM suggests that this speed generates an optimal temperature field, ensuring adequate heating without excessive temperature buildup. Moreover, the enhanced material flow at 250 mm/min helps preserve the weld’s structural integrity, even in the presence of variations or external disturbances.
At 2000 RPM, while the S/N ratio improves slightly with increasing welding speed, it remains lower than at 1000 RPM. This suggests that the process becomes less stable at higher rotational speeds, likely due to excessive heat generation. Elevated temperatures can contribute to material degradation, porosity, and internal defects, which weaken the overall weld quality.
The interaction plot underscores the necessity of balancing rotational and welding speeds to achieve a reliable and robust welding process. The combination of 1000 RPM and 250 mm/min not only yields the highest tensile strength, but also ensures consistent and stable performance, making it the optimal parameter setting for this friction stir welding (FSW) application.
Based on a detailed evaluation of both mean tensile strength and S/N ratios, the ideal parameter combination for the FSW of thin corrosion-resistant aluminum sheets is identified as a rotational speed of 1000 RPM and a welding speed of 250 mm/min.
This combination maximizes tensile strength while ensuring process stability under varying conditions. The interaction analysis confirms that 1000 RPM provides the ideal heat input, facilitating efficient material flow and strong joint formation without inducing excessive thermal stress. Meanwhile, a welding speed of 250 mm/min supports smooth material mixing and uniform heat distribution, further improving the weld’s mechanical properties.
The high S/N ratios at these settings indicate that the process is not only optimized for performance, but also for consistency, minimizing the impact of external factors such as tool misalignment, material inconsistencies, or minor process deviations. This robustness is crucial for industrial applications where maintaining repeatable weld quality is essential for consistent structural integrity.
In summary, this study demonstrates that the careful optimization of rotational and welding speeds in FSW can significantly enhance both tensile strength and process stability. These findings provide valuable guidance for employing FSW in similar applications, potentially leading to improvements in weld quality and overall production efficiency.

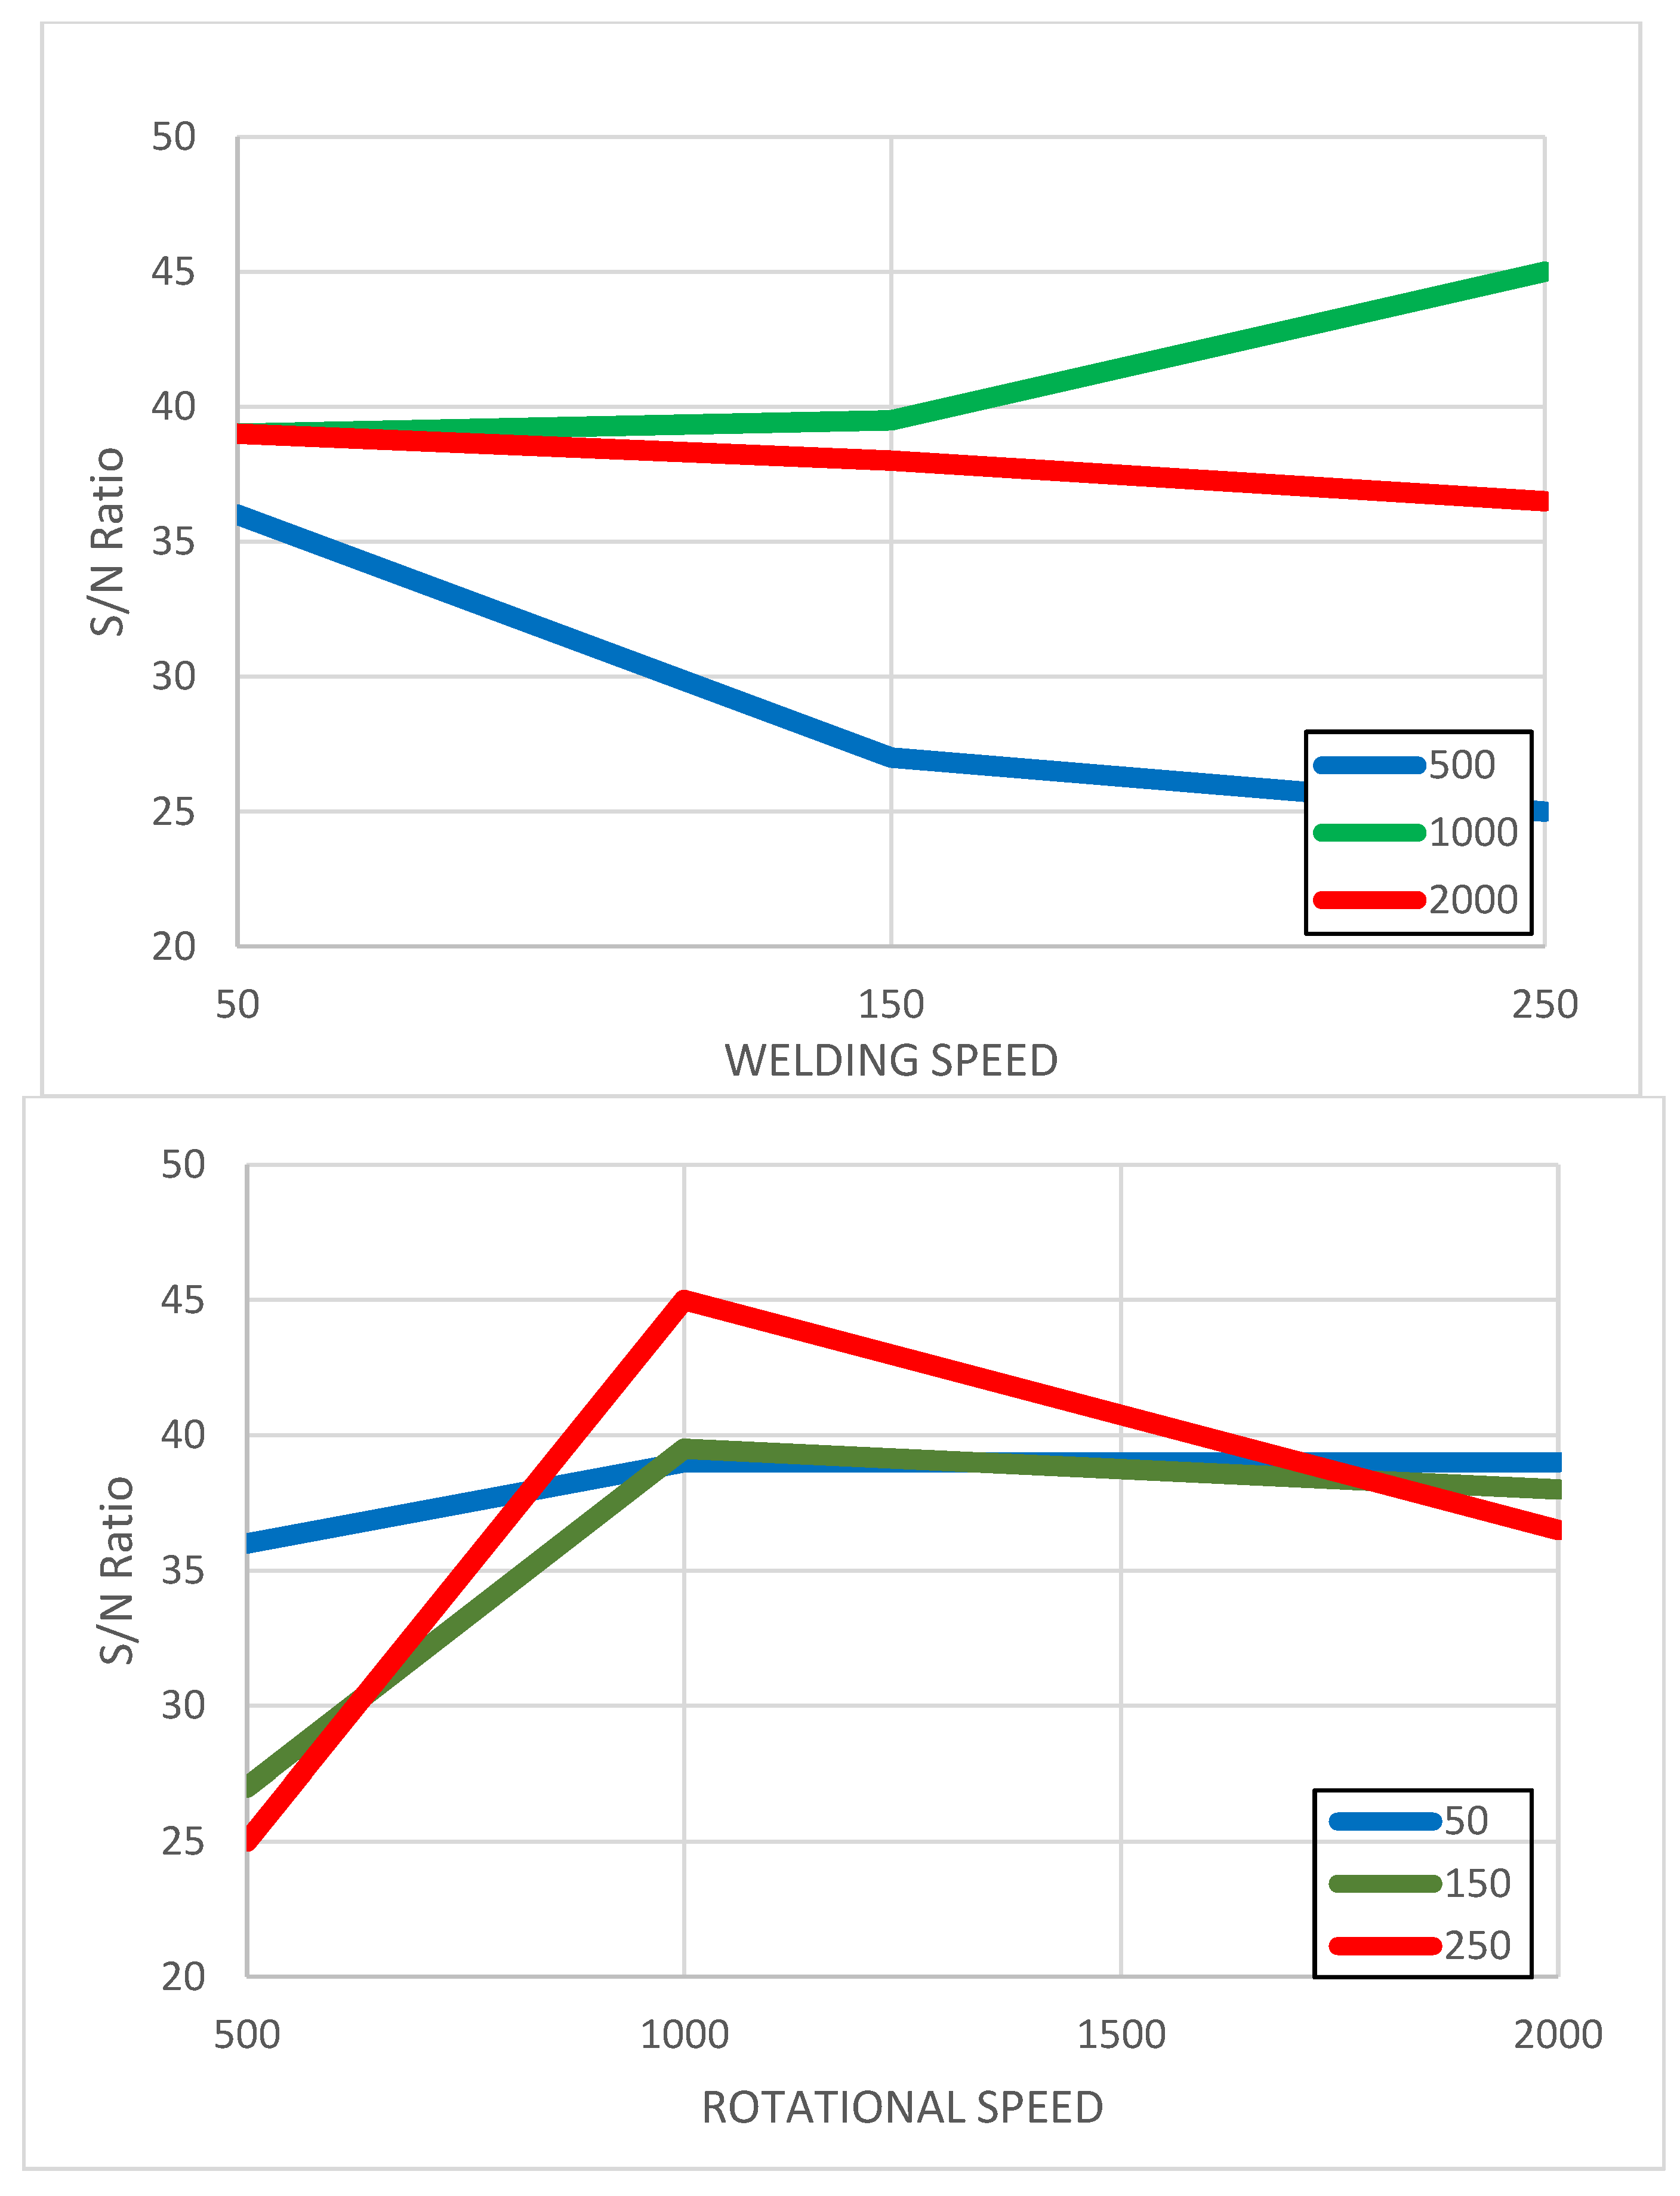
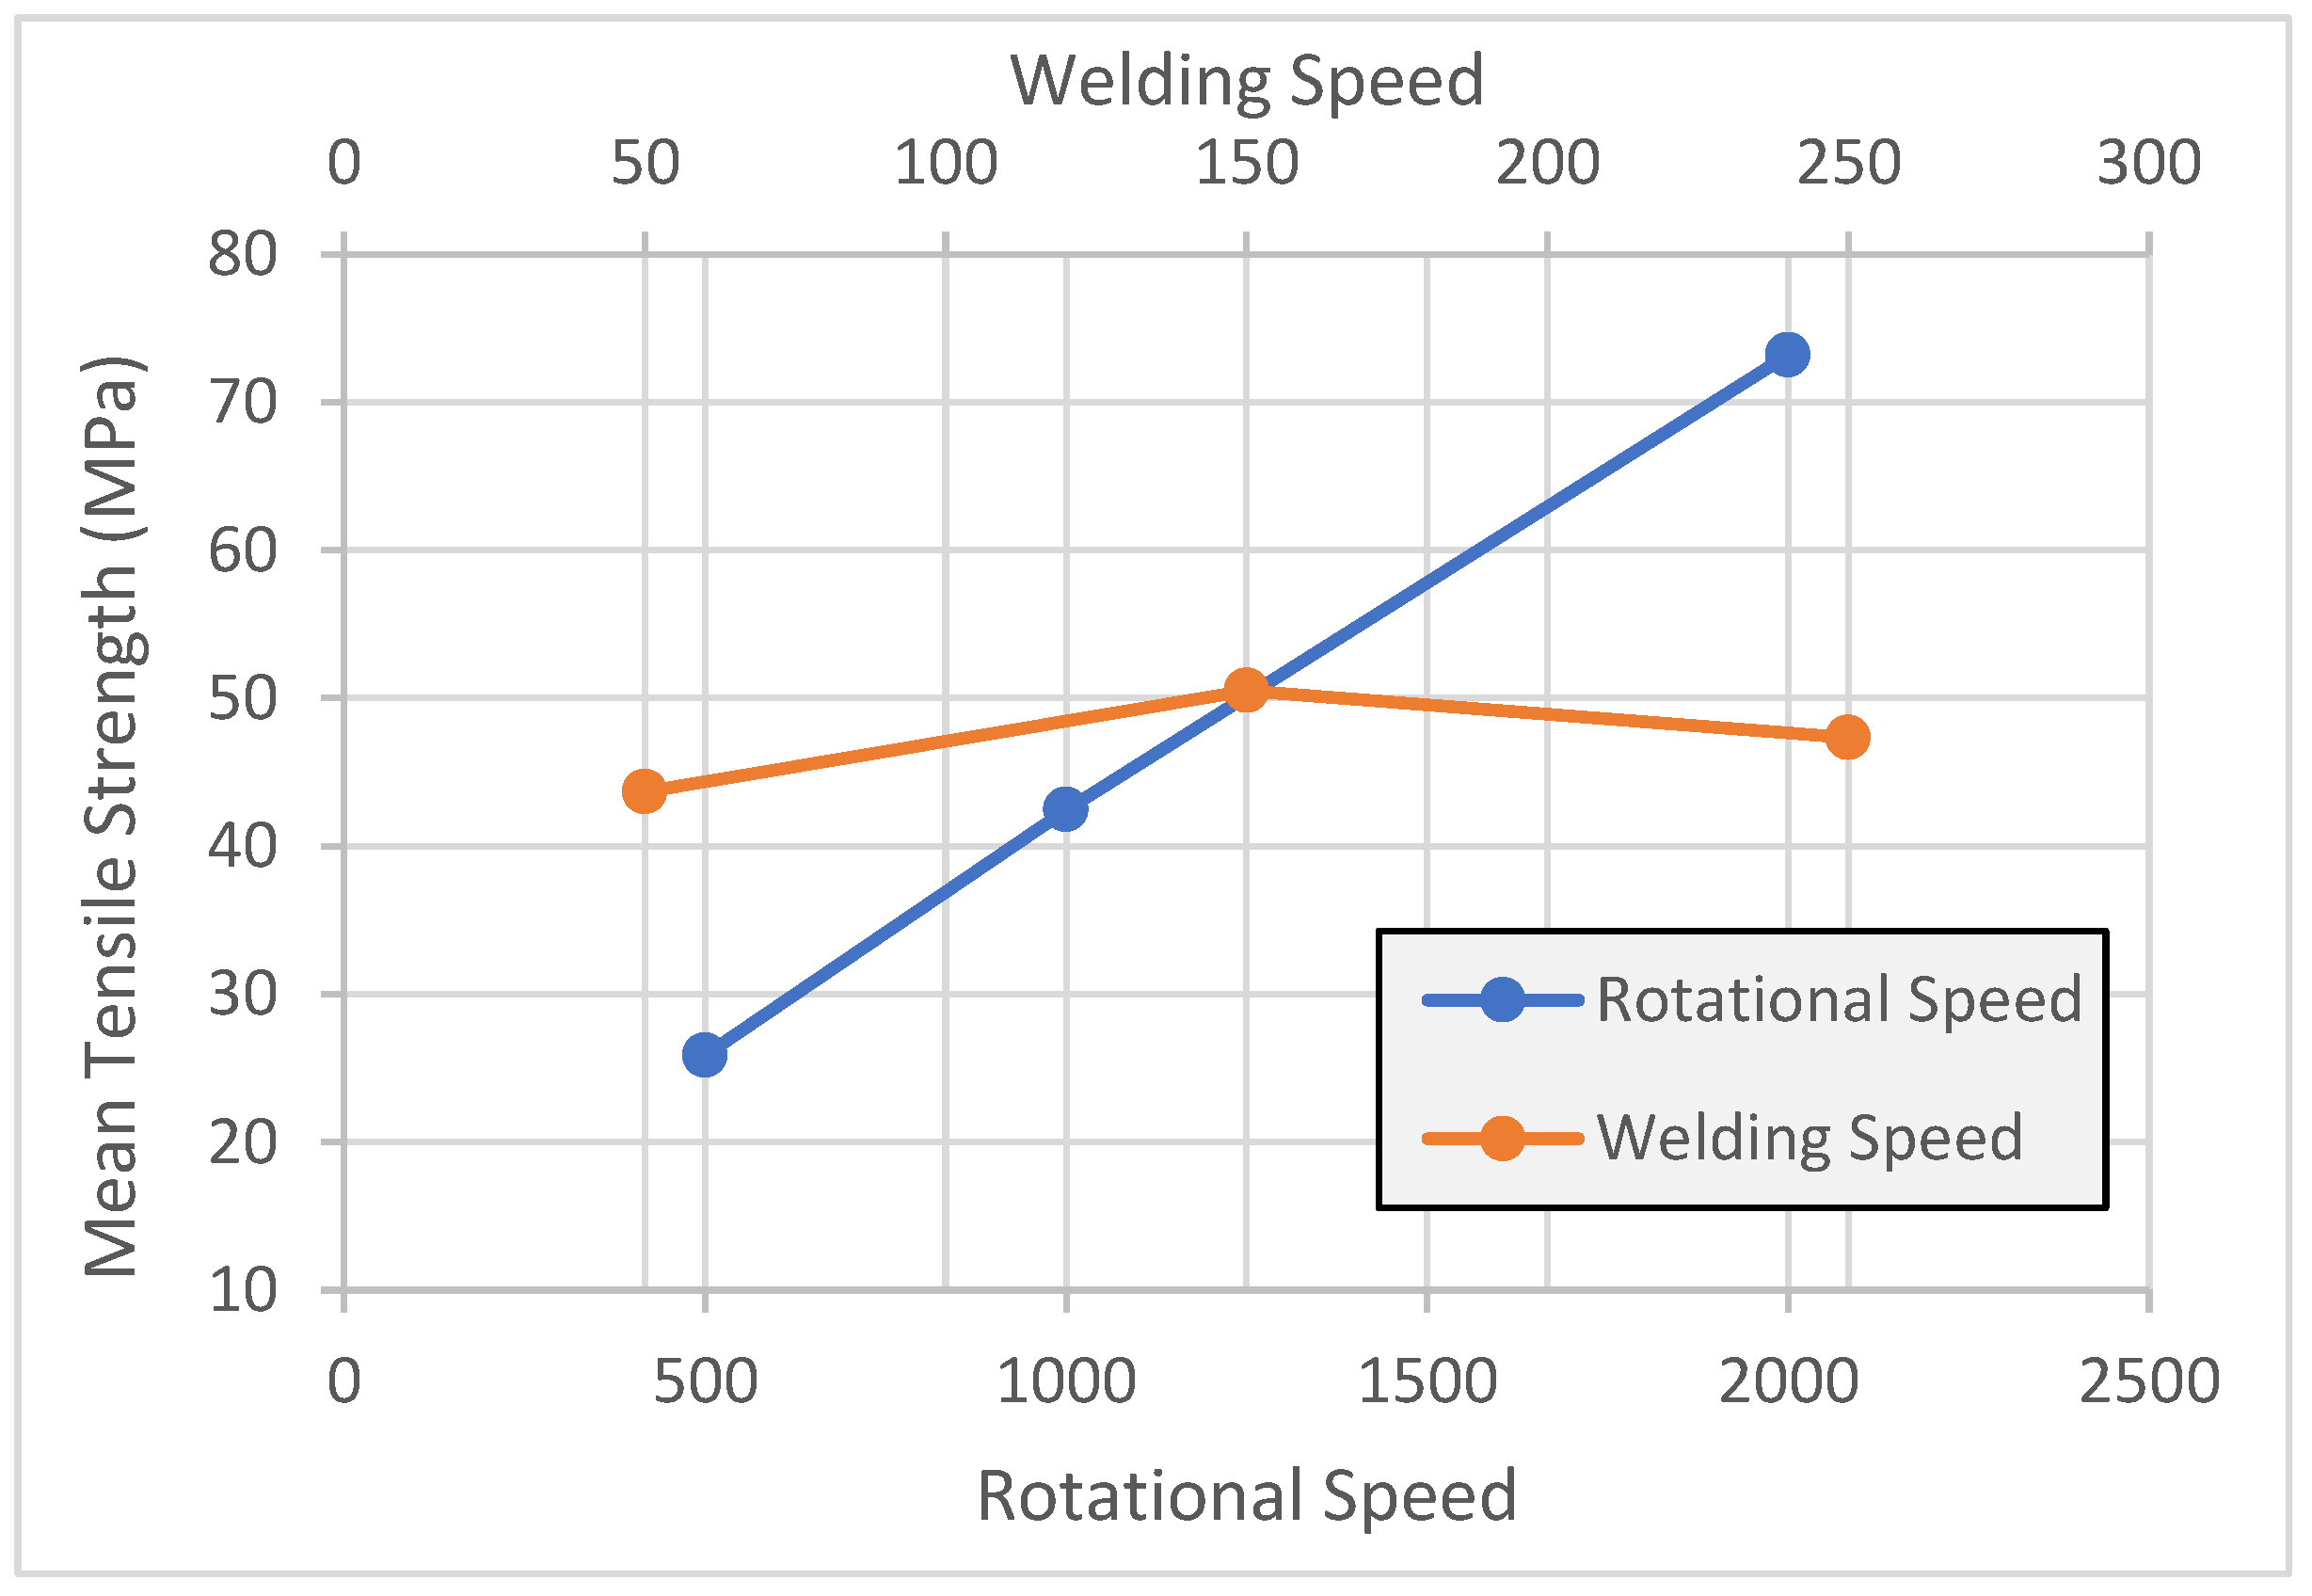
4.2. Enhancement and Evaluation of Welding Parameters for AA5754

For rotational speed, Level 3 (2000 RPM) exhibited the highest S/N ratio of 37.27, signifying the most stable and repeatable tensile strength results. The high heat generated at this speed ensures effective yielding and material mixing, leading to a reliable welding process. Conversely, Level 1 (500 RPM) recorded a significantly lower S/N ratio of 0.96, indicating an unstable process due to insufficient heat generation, which results in poor plastic material flow and inconsistent weld quality. The Delta value for rotational speed is 36.30, underscoring its substantial influence on process stability (Table 8).
Regarding welding speed, Level 1 (500 RPM) exhibits a significantly lower S/N ratio of 0.96, indicating high instability at this speed. The low rotational speed does not generate sufficient heat for proper material flow, leading to inconsistencies in weld quality and an increased risk of defects or failures. The low S/N ratio reflects a high degree of variability, highlighting poor process control at this speed.
The Delta value for rotational speed is 36.30, demonstrating a substantial influence on process stability. The significant variation in S/N ratios across different levels underscores the critical role of rotational speed in ensuring welding reliability. This high Delta value emphasizes the need to optimize rotational speed to achieve consistent and robust results.
For welding speed, Level 2 (150 mm/min) achieves the highest S/N ratio of 33.77, indicating the most stable and consistent tensile strength results. The lower welding speed allows for better heat input control, promoting improved material mixing and joint formation. At 150 mm/min, the material has adequate time to mix properly, ensuring sufficient heat distribution for a stable and reliable weld. Conversely, Level 3 (250 mm/min) has a lower S/N ratio of 32.85, suggesting that higher welding speeds introduce variability. Rapid tool movement may reduce heat conduction time, resulting in inconsistent material mixing and decreased stability in tensile strength outcomes.
The Delta value for welding speed is 29.70, which, while slightly lower than that for rotational speed, still indicates a significant effect on process stability. Welding speed influences heat generation and material flow, both of which are crucial for maintaining consistent tensile strength in welded joints. From the S/N ratio analysis, the optimal parameter combination for maximum stability and repeatability in the welding process is 2000 RPM for rotational speed and 150 mm/min for welding speed. This combination minimizes variability and ensures consistent tensile strength.
The response table for mean tensile strength provides insights into the average tensile strength for each parameter level. Level 3 (2000 RPM) for rotational speed delivered the highest mean tensile strength of 73 MPa, confirming its effectiveness in maximizing weld strength. The increased heat input enhances yielding and plastic material mixing, resulting in stronger weld joints. In contrast, Level 1 (500 RPM) yielded a much lower mean tensile strength of 26 MPa, reflecting inadequate heat generation and weak joints. The Delta value of 47.33 further confirms rotational speed as the dominant factor in determining weld strength.
For welding speed, Level 2 (150 mm/min) resulted in the highest mean tensile strength at 51 MPa, demonstrating that a lower speed allows for better heat transfer and material fusion. At Level 3 (250 mm/min), the mean tensile strength dropped to 47 MPa, indicating that higher speeds hinder sufficient heat input, leading to weaker welds. The Delta value for welding speed is 6.83, reinforcing that while it influences weld quality, rotational speed has a more dominant effect on overall tensile strength.
The main effects plot for mean tensile strength (see Figure 16) clearly shows how changes in rotational and welding speeds affect tensile strength. A significant increase in tensile strength is observed as rotational speed increases from 500 RPM to 2000 RPM, confirming the positive correlation between higher rotational speeds and weld strength. For welding speed, 50 mm/min results in the highest tensile strength, as slower speeds allow for better heat control and material fusion.
The combination of 2000 RPM rotational speed and 150 mm/min welding speed yields the highest tensile strength, with rotational speed playing a more dominant role in determining the strength of the weld.
The Interaction Plot for Mean Tensile Strength (see Figure 17) reveals how rotational, and welding speeds interact to impact tensile strength. At 500 RPM, tensile strength remains low regardless of welding speed, indicating that this rotational speed is insufficient for generating the required heat. Strength improves significantly above 1000 RPM, especially at 150 mm/min. However, the highest tensile strength is achieved at 2000 RPM and 150 mm/min, highlighting that this combination optimizes heat distribution and material mixing, producing the strongest welds.
For rotational speed, the S/N ratio (see Figure 18) increases significantly as the speed rises, reaching its highest value at 2000 RPM. This suggests that the process is most stable at this speed, with minimal variability in tensile strength results. The enhanced heat generation and material flow at 2000 RPM likely contribute to improved weld consistency.
Regarding welding speed, the highest S/N ratio is observed at 150 mm/min, indicating that this speed ensures the most stable results. The slower tool movement facilitates better heat control and material mixing, leading to more consistent tensile strength.
Overall, the most stable and reliable process is achieved with a rotational speed of 2000 RPM and a welding speed of 150 mm/min, as these parameters yield the highest S/N ratios. The interaction plot for S/N ratios highlights how the combination of rotational speed and welding speed influences process stability. This plot is essential for determining the optimal parameter combination that minimizes variability and ensures the most reliable tensile strength outcomes.
A comparison of Figure 16 and Figure 18 does not show the clearly identifiable effect of rotation speed on the FSW of AA5754, as was found for AA1050, possibly due to the range of process parameters selected.
At 500 RPM, the slow welding speed (see Figure 19) exhibits low S/N ratios, indicating significant unpredictability and poor process stability at this rotational speed. The S/N ratios improve at 1000 RPM for 150 mm/min, suggesting greater process stability with these parameters.
At 2000 RPM, the highest S/N ratio is observed at 150 mm/min, confirming that this combination provides the most stable and reliable results. The slower tool movement at 150 mm/min, combined with the high heat generation at 2000 RPM, ensures consistent material fusion and minimizes variations in tensile strength.
Based on the analysis of S/N ratios, mean tensile strength, and interaction plots, the optimal parameter combination for achieving maximum tensile strength and stability is a rotational speed of 2000 RPM and a welding speed of 150 mm/min.
This combination not only ensures the highest tensile strength, but also guarantees excellent stability and repeatability in welding. These parameters are ideal for friction stir welding thin aluminum sheets, as the high heat input and controlled material flow at these settings produce strong and sound welds.

5. Conclusions

The following conclusions can be drawn:
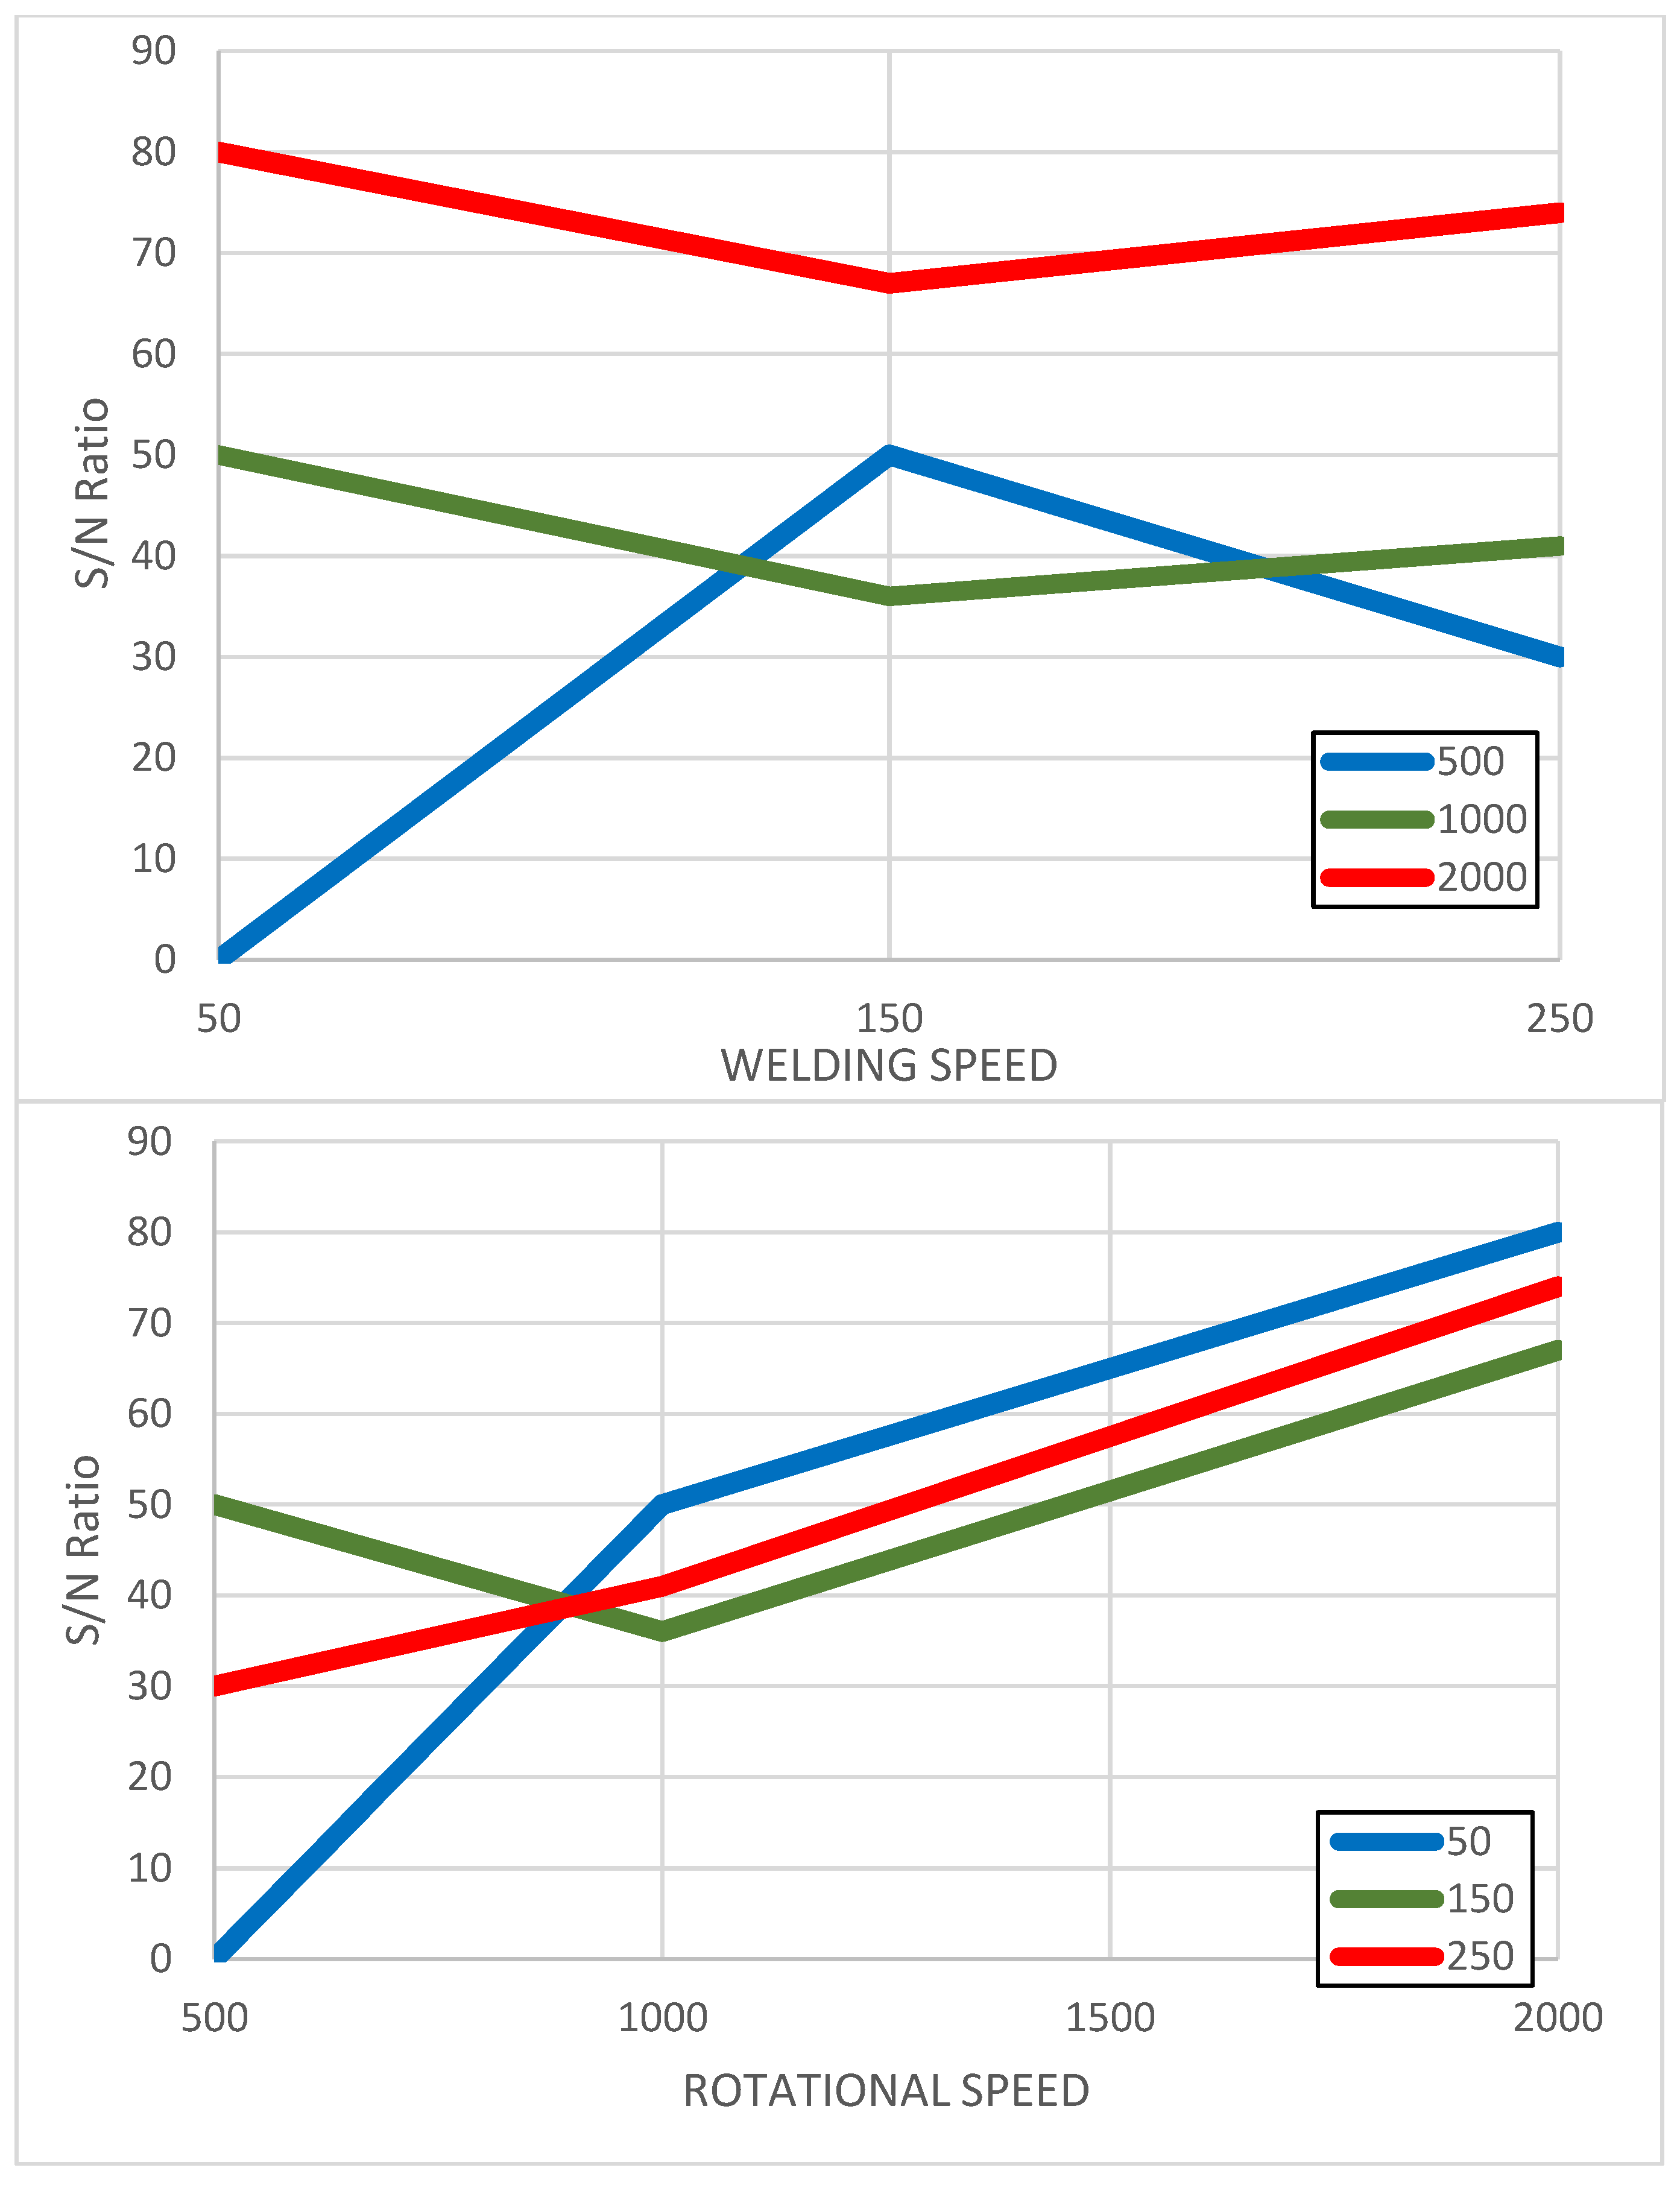
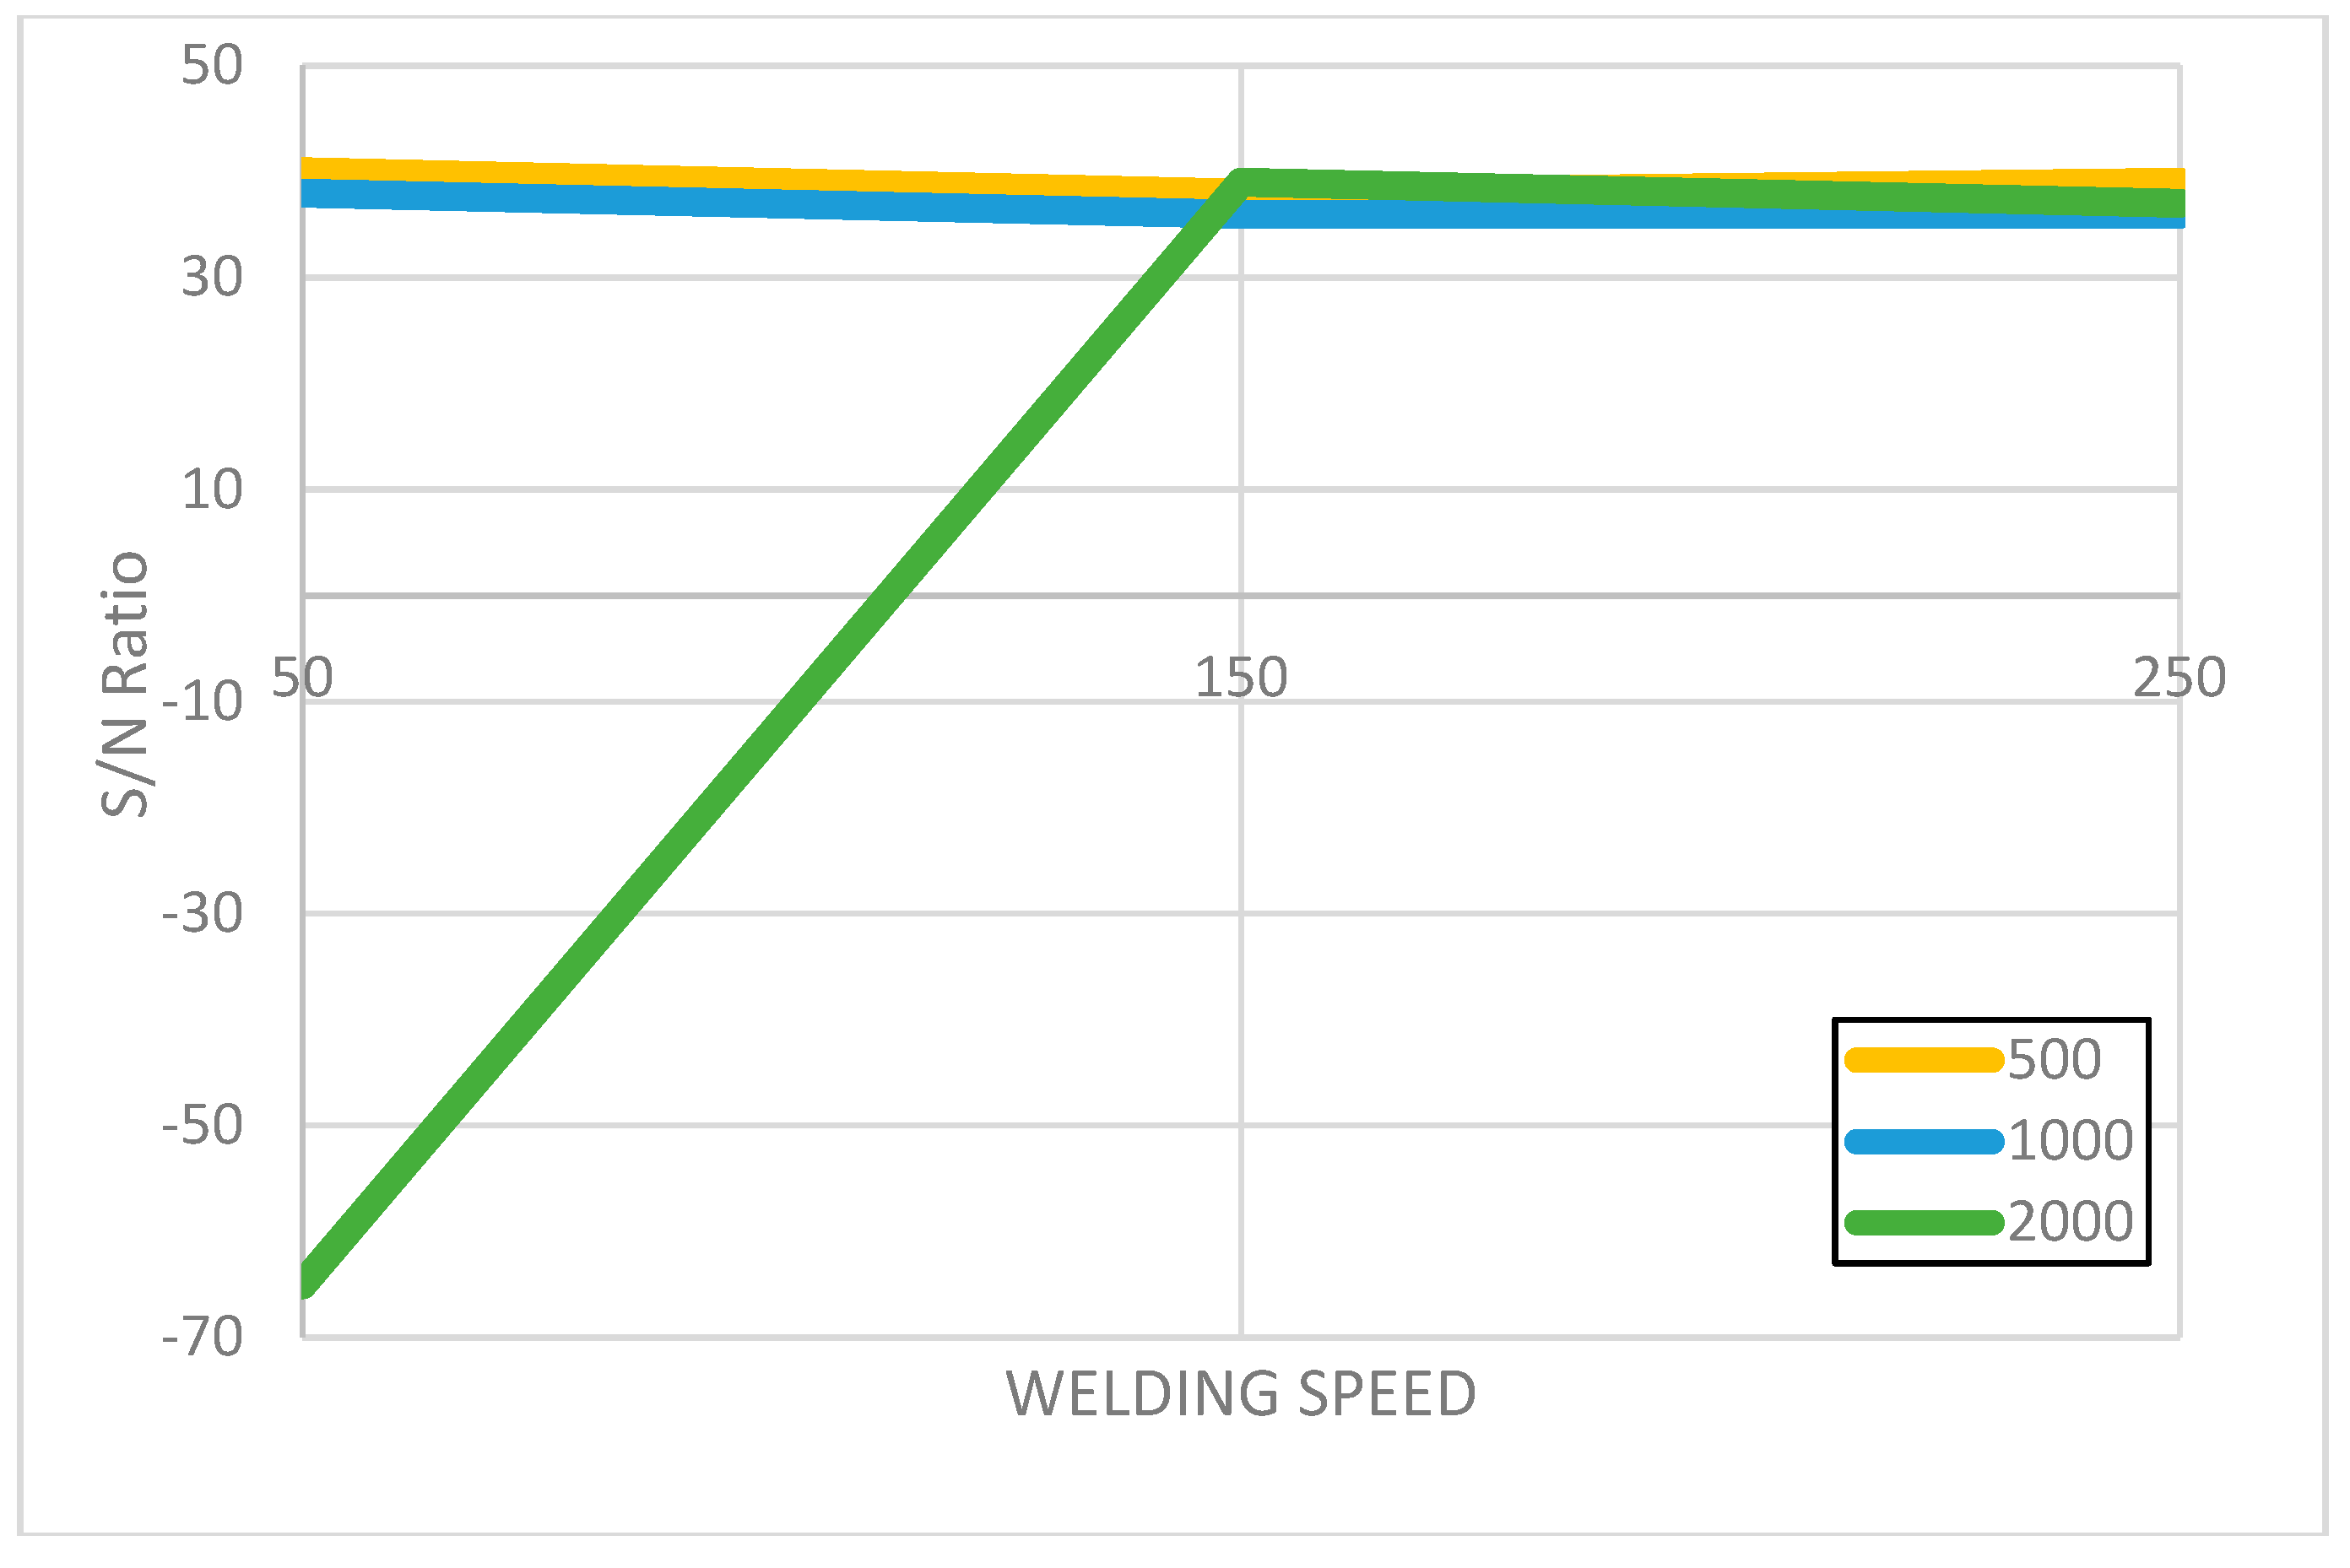
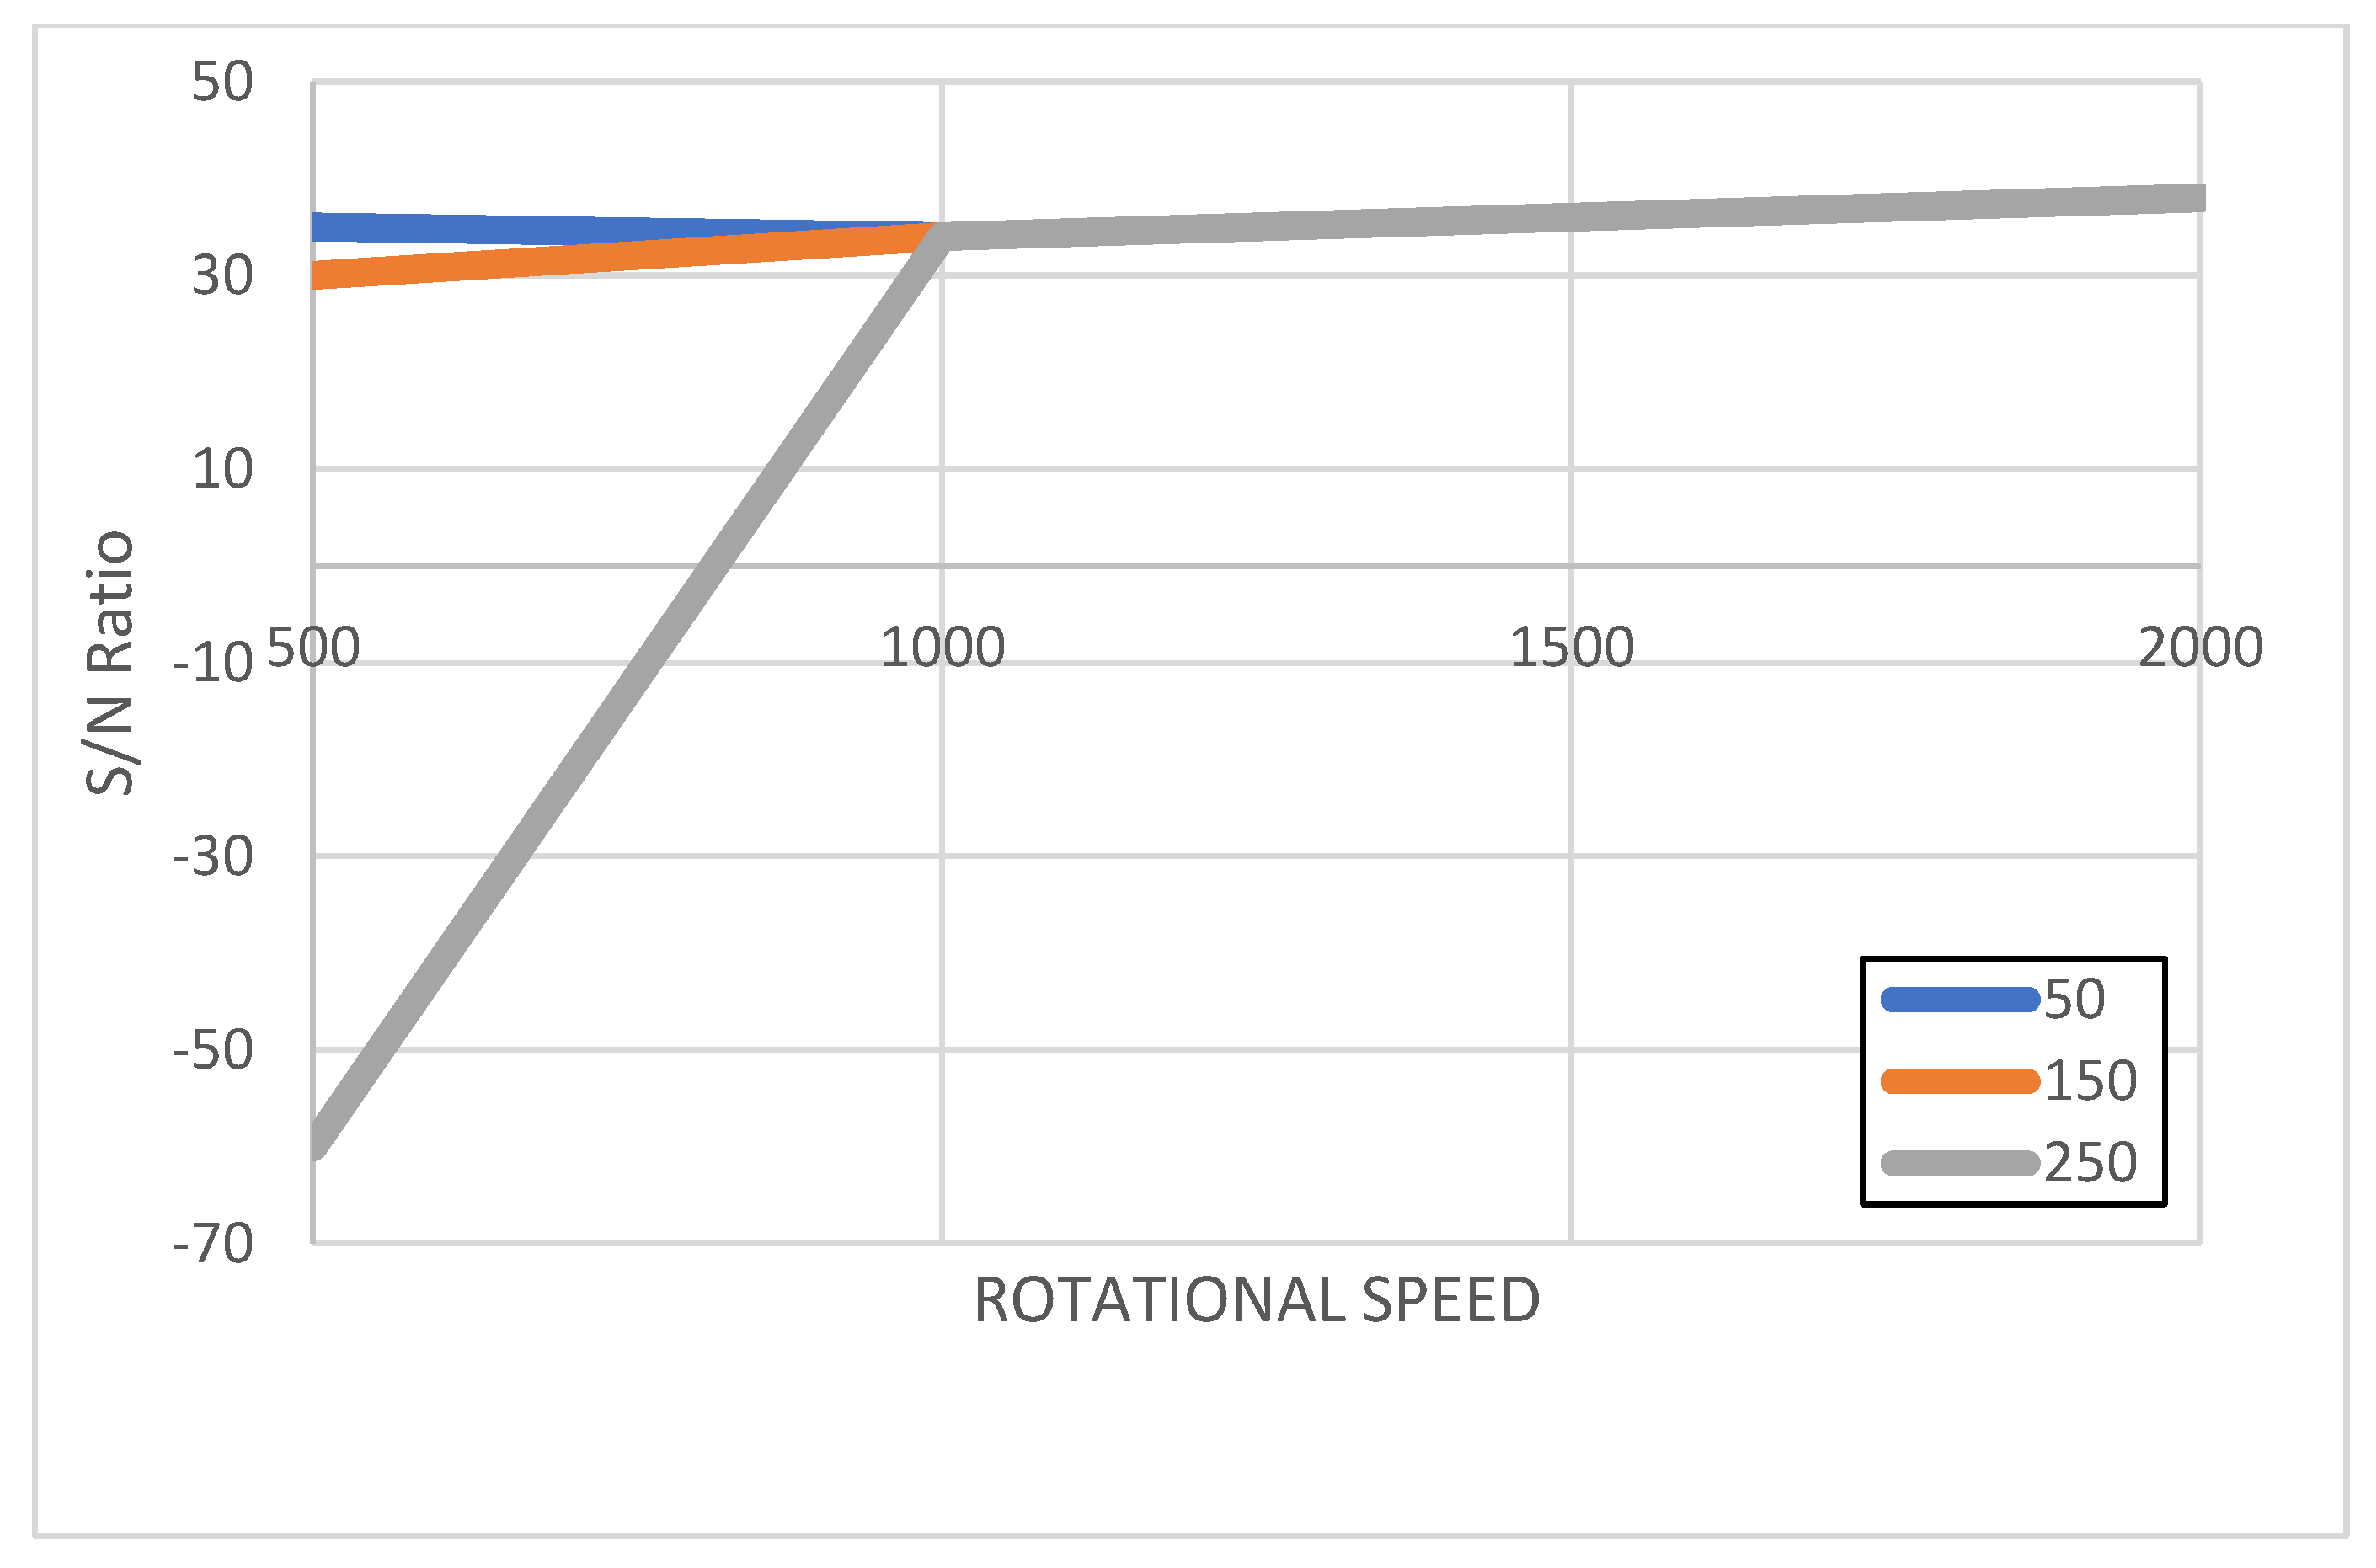
  • There is a critical effect of rotational speed on the mechanical properties of the weld. For alloy AA1050, the optimal rotational speed was approximately 1000 RPM, while for AA5754 it was around 2000 RPM. At lower rotational speeds, insufficient heat was generated, leading to poor material mixing and poor welds. Conversely, higher speeds often resulted in overheating, causing defects such as grain coarsening.
  • Welding speed, although having a less pronounced effect, also played a significant role in tensile strength. For AA1050, a welding speed of 250 mm/min yielded the best results, whereas AA5754 performed optimally at a slower speed of 150 mm/min. Faster speeds facilitated improved material flow in the AA1050 series, while slower speeds helped maintain better heat control and joint formation in AA5754.
  • The interaction between rotational and welding speeds was particularly evident. For instance, combining 1000 RPM with 250 mm/min for AAL1050 produced the highest tensile strength, whereas 2000 RPM paired with 150 mm/min resulted in the strongest welds for AA5754.
  • There were variations in mechanical properties for specimens 10506-1, 10506-2, and 10506-3, despite identical welding parameters. These are related to the inherent characteristics of the solid-state welding process. Even slight differences in temperature, microstructure, and residual stress can lead to variations in the mechanical properties of the weld, despite the use of identical welding parameters. Variations in heat distribution and solidification conditions create zones with differing mechanical properties, thereby explaining the discrepancies observed in the stress–strain curves.

Author Contributions

Conceptualization, A.V. and G.P.; methodology, G.P. and K.S. validation, G.P.; investigation, G.P.; resources, G.P. and K.S.; data curation, A.V.; writing—original draft preparation, A.V.; writing—review and editing, A.V., G.P. and K.S.; visualization, G.P. and K.S.; supervision, A.V.; project administration, A.V.; funding acquisition, A.V. All authors have read and agreed to the published version of the manuscript.

Funding

This research received no external funding.

Data Availability Statement

The data presented in this study are available on request from the corresponding author due to privacy.

Acknowledgments

This study expands upon research originally conducted as part of the master’s thesis of Georgios Patsalias at the University of West Attica in 2024. The thesis [42] provided the foundation for the present work, which includes additional analysis and findings. All authors would like to thank G. Papageorgiou for helping with the mechanical strength measurements. The authors G.P. and K.S. would like to extend their heartfelt appreciation to Z. Kanetaki for her inspiring work and mentorship, which played a crucial role in shaping our research approach.

Conflicts of Interest

The authors declare no conflicts of interest.

References

  1. Dawes, C.; Heedham, J.; Thomas, W.; Temple-Smith, P.; Nicholas, E.; Kallee, S. Friction Stir Welding Tool and Method. International Patent Application No: GB2306366, 7 May 1997. [Google Scholar]
  2. Schmidt, H.; Hattel, J. A Local Model for the Thermomechanical Conditions in Friction Stir Welding. Model. Simul. Mater. Sci. Eng. 2005, 13, 77–93. [Google Scholar] [CrossRef]
  3. Singh, R.; Rizvi, S.A.; Tewari, S.P. Effect of Friction Stir Welding on the Tensile Properties of AA6063 under Different Conditions. Int. J. Eng. 2017, 30, 597–603. [Google Scholar]
  4. Zhang, Z.; Li, W.; Li, J.; Chao, Y.J.; Vairis, A. Microstructure and Anisotropic Mechanical Behavior of Friction Stir Welded AA2024 Alloy Sheets. Mater. Charact. 2015, 107, 112–118. [Google Scholar] [CrossRef]
  5. Su, Y.; Li, W.; Shen, J.; Fu, B.; dos Santos, J.F.; Klusemann, B.; Vairis, A. Comparing the Local-Global Deformation Mechanism in Different Friction Stir Welding Sequences of Ti-4Al-0.005B Titanium Alloy T-Joints. Mater. Sci. Eng. A 2021, 823, 141698. [Google Scholar] [CrossRef]
  6. Patel, V.; Li, W.; Vairis, A.; Badheka, V. Recent Development in Friction Stir Processing as a Solid-State Grain Refinement Technique: Microstructural Evolution and Property Enhancement. Crit. Rev. Solid State Mater. Sci. 2019, 44, 378–426. [Google Scholar] [CrossRef]
  7. Gibson, B.T. Friction Stir Welding: Process, Automation, and Control. J. Manuf. Process. 2014, 16, 56–73. [Google Scholar] [CrossRef]
  8. Badheka, V.J.; Kulkarni, D.; Amirthalingam, M. Editorial. Weld. Int. 2025, 39, 163. [Google Scholar] [CrossRef]
  9. Gahlot, P. Mechanical Behavior of Friction Stir Welded Al-Alloy AA6063 + 5%SiCp. In Advances in Engineering Materials; Tyagi, R.K., Ed.; Springer Nature: Singapore, 2024; pp. 327–335. [Google Scholar]
  10. Rudrapati, R. Effects of Welding Process Conditions on Friction Stir Welding of Polymer Composites: A Review. Compos. Part C Open Access 2022, 8, 100269. [Google Scholar] [CrossRef]
  11. Baffari, D.; Buffa, G.; Campanella, D.; Fratini, L.; Micari, F. Friction Based Solid State Welding Techniques for Transportation Industry Applications. Procedia CIRP 2014, 18, 162–167. [Google Scholar] [CrossRef]
  12. Bharti, S. A Review of Recent Developments in Friction Stir Welding for Various Industrial Applications. J. Mar. Sci. Eng. 2023, 12, 71. [Google Scholar] [CrossRef]
  13. Haghshenas, M.; Gerlich, A.P. Joining of Automotive Sheet Materials by Friction-Based Welding Methods: A Review. Eng. Sci. Technol. Int. J. 2018, 21, 130–148. [Google Scholar] [CrossRef]
  14. Vairis, A.; Papazafeiropoulos, G.; Tsainis, A.-M. A Comparison between Friction Stir Welding, Linear Friction Welding and Rotary Friction Welding. Adv. Manuf. 2016, 4, 296–304. [Google Scholar] [CrossRef]
  15. Padmanaban, G.; Balasubramanian, V. Selection of FSW Tool Pin Profile, Shoulder Diameter and Material for Joining AZ31B Magnesium Alloy—An Experimental Approach. Mater. Des. 2009, 30, 2647–2656. [Google Scholar] [CrossRef]
  16. Quintana, K.J.; Silveira, J.L.L. Threaded Pin Effects Analysis on Forces in FSW. J. Braz. Soc. Mech. Sci. Eng. 2021, 43, 491. [Google Scholar] [CrossRef]
  17. Rana, H.; Patel, V.; Buffa, G.; Fratini, L.; Di Lorenzo, R. Influence of Distinct Tool Pin Geometries on Aluminum 8090 FSW Joint Properties. Sheet Metal 2023, 25, 195–202. [Google Scholar]
  18. Celik, S.; Cakir, R. Effect of Friction Stir Welding Parameters on the Mechanical and Microstructure Properties of the Al-Cu Butt Joint. Metals 2016, 6, 133. [Google Scholar] [CrossRef]
  19. Ahmed, W.H.; Kadhum, A.H. Optimization of Tool Pin Geometry Parameters to Improve the Performance of Friction Stir Welding of AA1050. In Studies in Systems, Decision and Control; Springer: Cham, Switzerland, 2024; Volume 564, pp. 117–136. [Google Scholar]
  20. Kayode, O.; Akinlabi, E.T. Microstructural and Mechanical Properties of Friction Stir Welding of AA1050. In Proceedings of the Advances in Material Science and Engineering; Awang, M., Emamian, S.S., Eds.; Springer: Singapore, 2021; pp. 72–78. [Google Scholar]
  21. Akbari, M.; Asadi, P.; Sadowski, T. A Review on Friction Stir Welding/Processing: Numerical Modeling. Materials 2023, 16, 5890. [Google Scholar] [CrossRef]
  22. Kwon, Y.-J.; Shim, S.-B.; Park, D.-H. Friction Stir Welding of 5052 Aluminum Alloy Plates. Trans. Nonferrous Met. Soc. China 2009, 19, 23–27. [Google Scholar] [CrossRef]
  23. Adamowski, J.; Szkodo, M. Friction Stir Welds (FSW) of Aluminium Alloy AW6082-T6. J. Achiev. Mater. Manuf. Eng. 2007, 20, 403–406. [Google Scholar]
  24. Patel, V.; Li, W.; Wang, G.; Wang, F.; Vairis, A.; Niu, P. Friction Stir Welding of Dissimilar Aluminum Alloy Combinations: State-of-the-Art. Metals 2019, 9, 270. [Google Scholar] [CrossRef]
  25. Wan, L.; Huang, Y. Friction Stir Welding of Dissimilar Aluminum Alloys and Steels: A Review. Int. J. Adv. Manuf. Technol. 2018, 99, 1781–1811. [Google Scholar] [CrossRef]
  26. Huang, Y.; Meng, X.; Xie, Y.; Wan, L.; Lv, Z.; Cao, J.; Feng, J. Friction Stir Welding/Processing of Polymers and Polymer Matrix Composites. Compos. Part A Appl. Sci. Manuf. 2018, 105, 235–257. [Google Scholar] [CrossRef]
  27. Haribalaji, V. Investigation on Corrosion and Tensile Characteristics: Friction Stir Welding of AA7075 and AA2014. Mater. Today Proc. 2022, 66, 743–748. [Google Scholar] [CrossRef]
  28. Balasubramanian, V. Relationship between Base Metal Properties and Friction Stir Welding Process Parameters. Mater. Sci. Eng. A 2008, 480, 397–403. [Google Scholar] [CrossRef]
  29. Sabry, I.; Mourad, A.-H.I.; Alkhedher, M.; Qazani, M.R.C.; El-Araby, A. A Comparative Study of Multiple-Criteria Decision-Making Methods for Selecting the Best Process Parameters for Friction Stir Welded Al 6061 Alloy. Weld. Int. 2023, 37, 626–642. [Google Scholar] [CrossRef]
  30. Shinde, V.R.; Sapre, M.; Jatti, S.V.K. Optimization of Friction Stir Welding Process Parameters Using Taguchi’s Method. Glob. J. Pure Appl. Math. 2015, 11, 777–787. [Google Scholar] [CrossRef]
  31. Ugrasen, G. Optimization of Process Parameters for Al6061-Al7075 Alloys in Friction Stir Welding Using Taguchi’s Technique. Mater. Today Proc. 2018, 5, 3027–3035. [Google Scholar] [CrossRef]
  32. Abdelhady, S.S.; Elbadawi, R.E.; Zoalfakar, S.H. Multi-Objective Optimization of FSW Variables on Joint Properties of AA5754 Aluminum Alloy Using Taguchi Approach and Grey Relational Analysis. Int. J. Adv. Manuf. Technol. 2024, 130, 4235–4250. [Google Scholar] [CrossRef]
  33. Alam, M.P.; Sinha, A.N. Optimization of Process Parameters of Friction Stir Welding Using Desirability Function Analysis. Weld. Int. 2022, 36, 129–143. [Google Scholar] [CrossRef]
  34. Brahami, A.; Kaid, M.; Zemri, M. Thermo-Mechanical Characterization of Pinless Friction Stir Welding in AA6060-T4 Thin Sheets. Weld. Int. 2024, 38, 650–659. [Google Scholar] [CrossRef]
  35. Liu, H.; Fujii, H.; Maeda, M.; Nogi, K. Friction Stir Weldabilities of AA1050-H24 and AA6061-T6 Aluminum Alloys. J. Mater. Sci. Technol. 2005, 21, 415–418. [Google Scholar]
  36. Baumeister, T.I.; Avalone, E. Marks’ Standard Handbook for Mechanical Engineers, 8th ed.; McGraw Hill: New York, NY, USA, 1978; ISBN 978-0-07-004123-3. [Google Scholar]
  37. Dimopoulos, A. On the Friction Stir Welding of Al 7075 Thin Sheets. Metals 2020, 11, 57. [Google Scholar] [CrossRef]
  38. Muzamil, M.; Wu, J.; Akhtar, M.; Azher, K.; Majeed, A.; Zhang, Z.; Shazad, A. Nanoparticle-Induced Control (MWCNTs–TiO2) on Grain Size and Tensile Strength Response and Multi-Response Optimization on TIG Welded Joints. Trans. Can. Soc. Mech. Eng. 2022, 46, 626–638. [Google Scholar] [CrossRef]
  39. Muzamil, M.; Siddiqui, N.A.; Kumar, K.; Hussain, G.; Alkahtani, M.; Sattar, M. Impact of Machining Parameters on Wire Arc Additively Manufactured Mild Steel Specimens of E6013 and E7018 Using an Electric Arc Heat Source. Crystals 2025, 15, 222. [Google Scholar] [CrossRef]
  40. Vidakis, N. Effect of the Tool Rotational Speed on the Mechanical Properties of Thin AA1050 Friction Stir Welded Sheets. J. Eng. Sci. Technol. Rev. 2016, 2016, 123–129. [Google Scholar] [CrossRef]
  41. Vural, M.; Ogur, A.; Cam, G.; Ozarpa, C. On the Friction Stir Welding of Aluminium Alloys EN AW 2024-0 and EN AW 5754-H22. Arch. Mater. Sci. Eng. 2007, 28, 49–54. [Google Scholar]
  42. Patsalias, G. Georgios Study of Friction Stir Welding for Thin Aluminum Sheets. Master’s Thesis, University of West Attica, Athens, Greece, 2024. [Google Scholar]
Figure 1. Methodological sequence.
Metals 15 00463 g001
Figure 2. FSW tool details.
Metals 15 00463 g002
Figure 3. FSW tool photos.
Metals 15 00463 g003
Figure 4. (a) Welded specimen with coupons for tensile strength test. (b) Standard coupons for measuring mechanical strength.
Metals 15 00463 g004
Figure 5. Diagram of stress–strain for 1050 BM (base material) and 10506 specimens.
Metals 15 00463 g005
Figure 6. Ultimate tensile strength (UTS) of AA1050 specimens.
Metals 15 00463 g006
Figure 7. Elongation (ε%) of AA1050 specimens.
Metals 15 00463 g007
Figure 8. Specimen 57547 (front and back of specimen).
Metals 15 00463 g008
Figure 9. Diagram of stress–strain from 5754 BM (base material) and 57547 specimens.
Metals 15 00463 g009
Figure 10. Ultimate tensile strength (UTS) of AA5754 specimens.
Metals 15 00463 g010
Figure 11. Elongation (ε%) of AA5754 specimens.
Metals 15 00463 g011
Figure 12. Main effects of mean tensile strength for AA1050.
Metals 15 00463 g012
Figure 13. Interaction plots of mean tensile strength for AA1050.
Metals 15 00463 g013
Figure 14. Main effect plot of S/N ratios of AA1050 (S/N: larger is better).
Metals 15 00463 g014
Figure 15. Interaction plot of S/N ratios of AA1050 (S/N: larger is better).
Metals 15 00463 g015
Figure 16. Main effects of mean tensile strength of AA5754.
Metals 15 00463 g016
Figure 17. Interaction plots of mean tensile strength of AA5754.
Metals 15 00463 g017
Figure 18. Main effect plot of S/N ratios of AA5754 (S/N: larger is better).
Metals 15 00463 g018
Figure 19. Interaction plot of S/N ratios of AA5754 (S/N: larger is better).
Metals 15 00463 g019aMetals 15 00463 g019b
Table 1. Material composition (weight percent wt.%) and mechanical properties of the selected aluminum alloys [36].
Aluminum AlloyAA1050AA5754
Composition (wt.%)
Cu0.050.10
Fe0.400.40
Mg0.052.60
Mn0.050.10
Si0.250.40
Zn0.050.20
Ti0.030.15
Al99.594.2
Cr-0.30
Mechanical properties
Ultimate Tensile Strength (MPa)70–100190–240
Yield Strength (MPa)25–3580–150
Elongation (%)25–3520–28
Hardness (HB)25–3540–80
Table 2. Range of process parameters for L9 orthogonal array.
LevelRotational Speed (RPM)Welding Speed (mm/min)
150050
21000150
32000250
Table 3. Process parameters for AA1050 and AA5754 specimens.
IDRotational Speed (RPM)Welding Speed (mm/min)
105015754150050
1050257542500150
1050357543500250
1050457544100050
10505575451000150
10506575461000250
1050757547200050
10508575482000150
10509575492000250
Table 4. Welding tool parameters.
DWELL TIME (S)4
OUT FEED RATE (mm/min)50
PLUNGE FEED RATE (mm/min)10
TILT ANGLE (DEG)0
Table 5. Mechanical properties of AA1050 specimens.
IDUTS (MPa)ε%
10501501.6
10502221.1
10503181.4
10504846.1
10505905.6
10506952.0
10507793.8
10508783.2
10509653.1
1050 BM1188.5
Table 6. Mechanical properties of AA5754 specimens.
IDRotational Speed (RPM)Welding Speed (mm/min)
5754100.0
57542491.7
57543281.1
57544511.7
57545351.4
57546411.6
57547801.5
57548674.2
57549735.2
5754 BM27111.5
Table 7. Response table for signal-to-noise ratios and mean tensile strength for AA1050.
LevelSignal-to-Noise Ratio:
“Larger is Better”
Mean Tensile Strength (MPa)
Rotational SpeedWelding SpeedRotational SpeedWelding Speed
128.6936.893072
240.7334.6511464
337.4235.317584
Delta12.042.2484.0620
Rank1212
Table 8. Response table for signal-to-noise ratios and mean tensile strength of AA5754.
LevelSignal-to-Noise Ratio:
“Larger is Better”
Mean Tensile Strength (MPa)
Rotational SpeedWelding SpeedRotational SpeedWelding Speed
10.964.072644
232.4633.774251
337.2732.857347
Delta36.3029.7047.336.83
Rank1212
Disclaimer/Publisher’s Note: The statements, opinions and data contained in all publications are solely those of the individual author(s) and contributor(s) and not of MDPI and/or the editor(s). MDPI and/or the editor(s) disclaim responsibility for any injury to people or property resulting from any ideas, methods, instructions or products referred to in the content.

