Modeling and Carbon Emission Assessment of Novel Low-Carbon Smelting Process for Vanadium–Titanium Magnetite
Abstract
1. Introduction
2. Research Method
2.1. Introduction of the Novel Low-Carbon Process
2.2. Modeling Approach of the Novel Low-Carbon Process
- (1)
- Energy–mass balance modeling of the pre-reduction furnace
- (2)
- The energy and mass balance model of melting furnace
- (3)
- The energy and mass balance model of melting furnace
3. Modeling Conditions
4. Results and Discussions
4.1. Energy and Mass Balance of Route 1
4.2. Energy and Mass Balance in Route 2
4.3. Influence of Pre-Reduction Furnace Reducing Gas Flow Rate on Route 2 in Melting Parameters and Carbon Emission
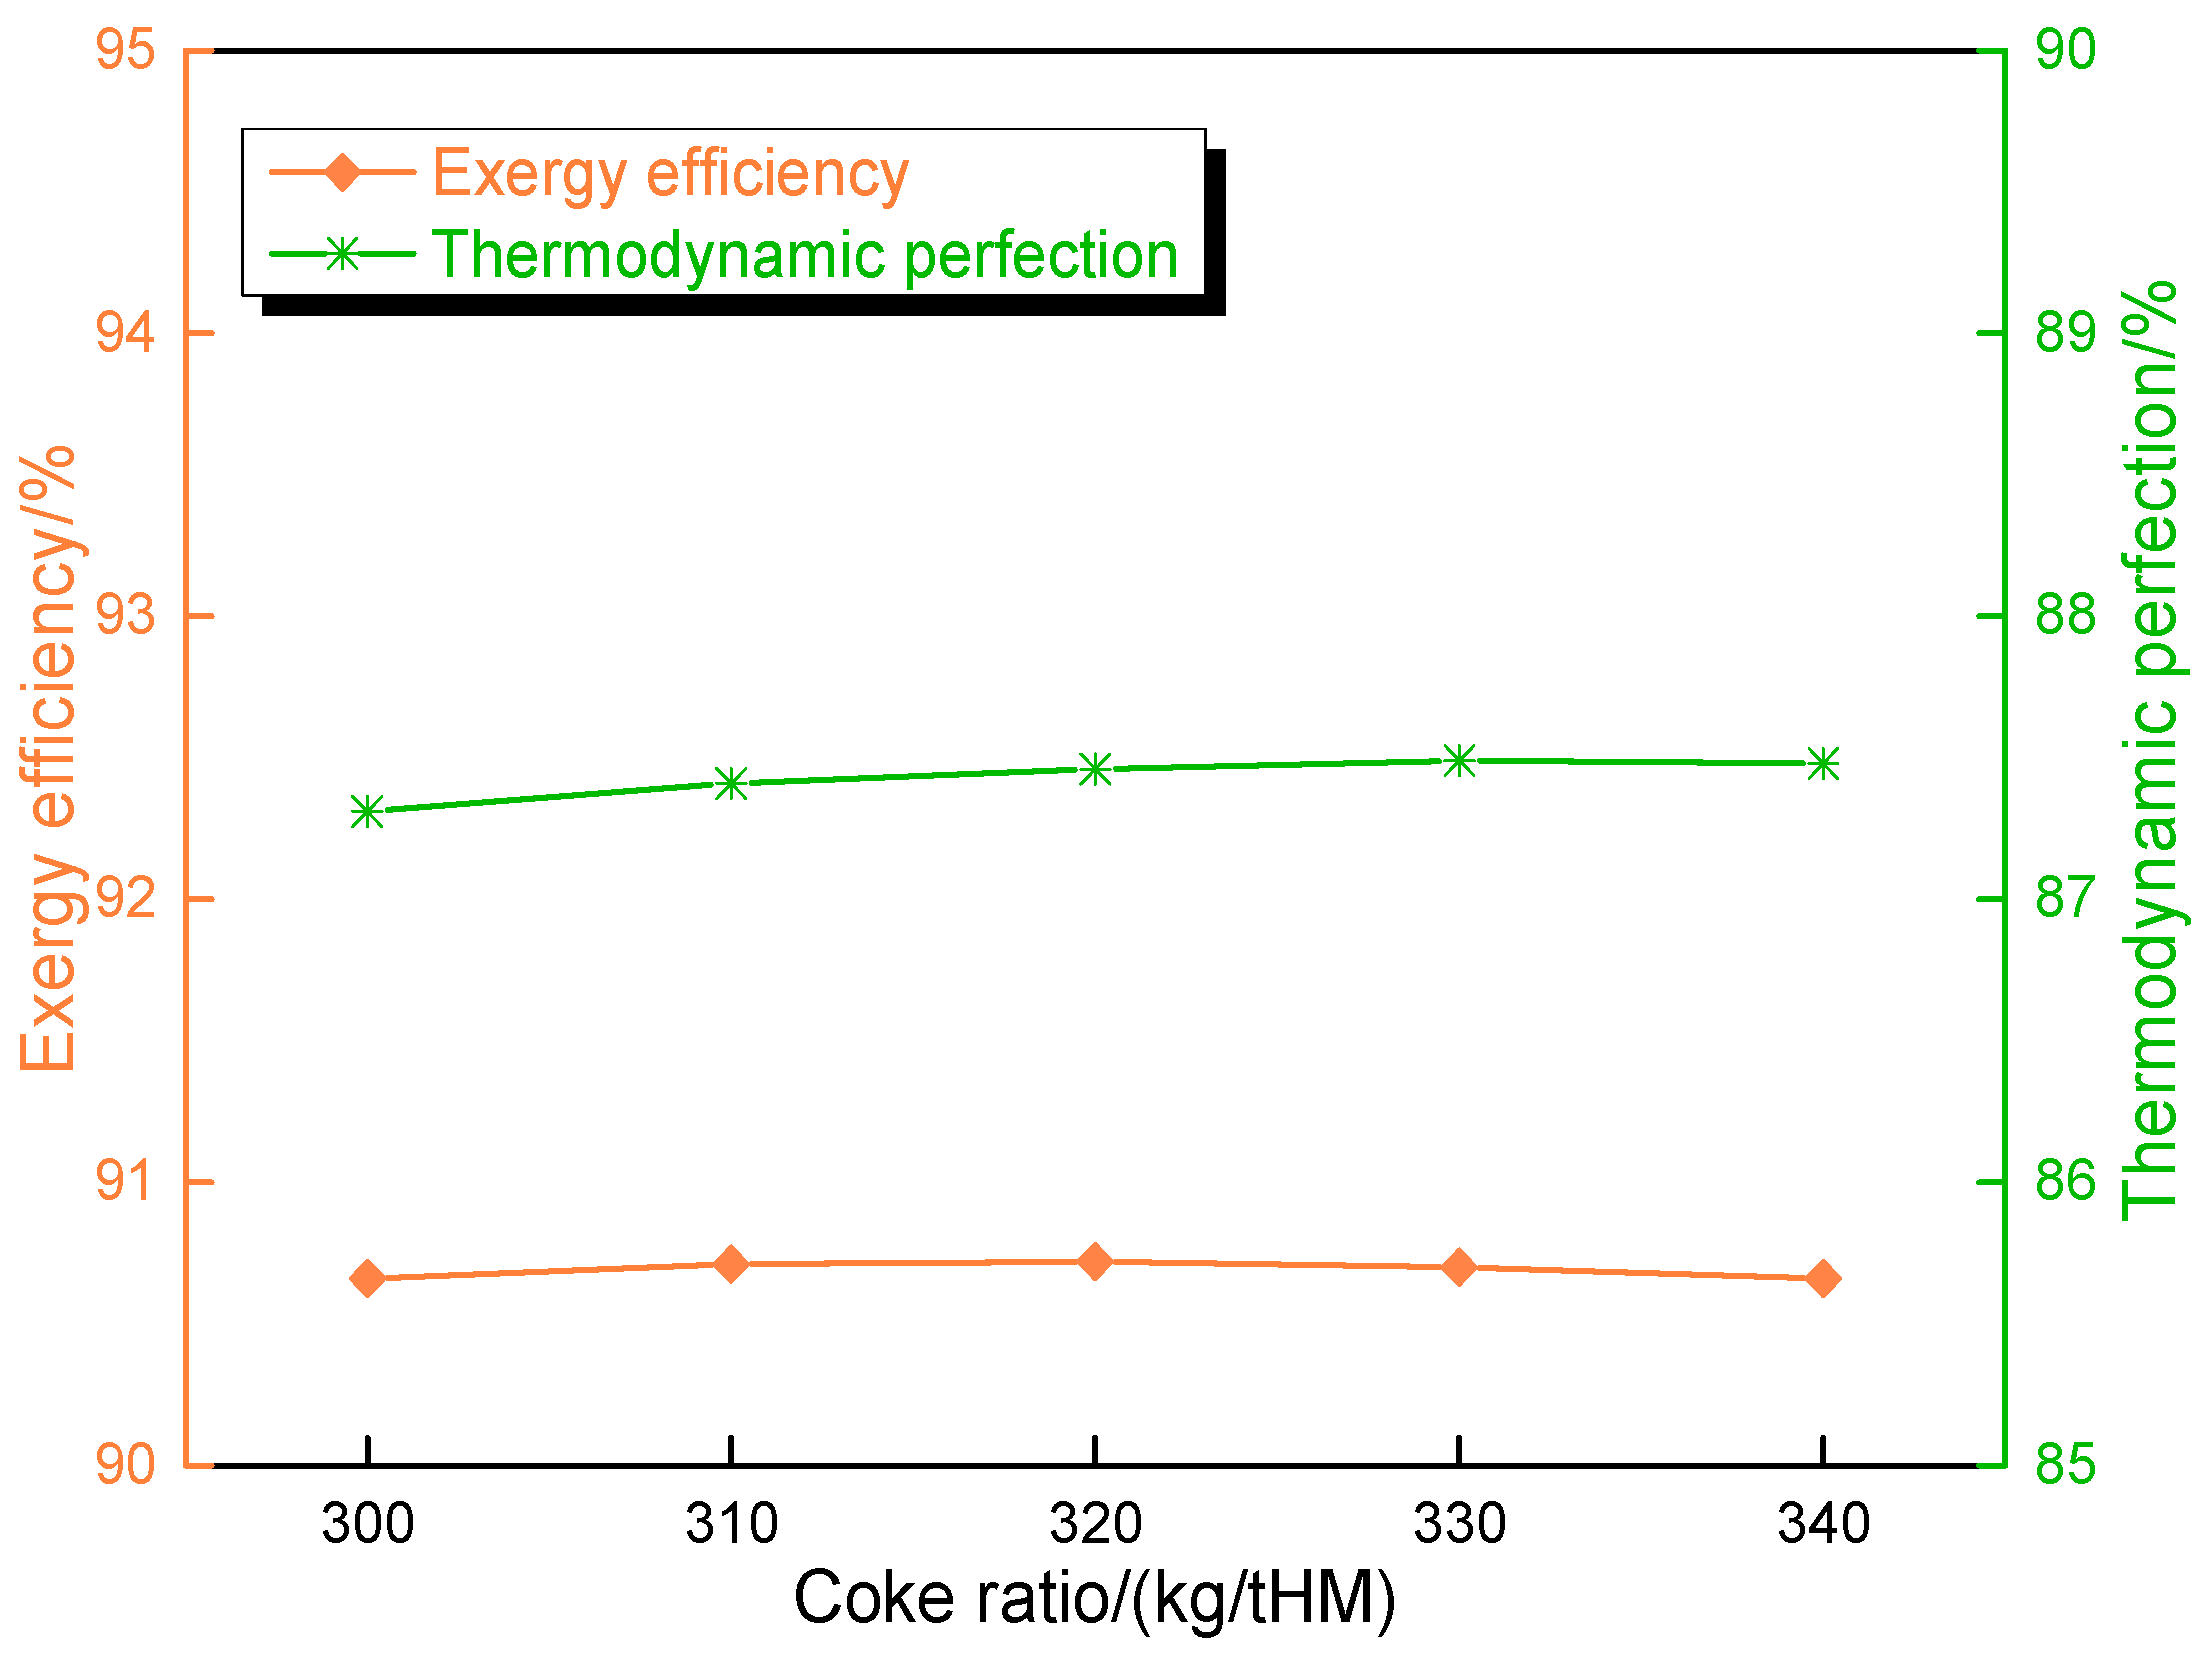
4.4. Influence of Melting Furnace Coke Ratio on Route 2 in Melting Parameters and Carbon Emission
4.5. Comparative Analysis of Different Low-Carbon Processes
5. Conclusions
- (1)
- Route 1 (base) operated under the elevated coke ratios (380 kg/tHM) and the suboptimal metallization rates (75%), utilizing a pre-reduction gas flow of 1600 Nm3/tHM (with pre-reducing gas temperature 1000 °C and recycling gas temperature 1200 °C). This configuration generated CO2 emissions of 472.59 Nm3/tHM, with the gas compositions dominated by CO (pre-reduction furnace top gas: 64.73% CO, 27.17% CO2). In contrast, Route 2 achieved a 56.8% reduction in CO2 emissions (204.20 Nm3/tHM) through the parameter optimization (coke ratio: 320 kg/tHM; metallization rate: 90%) and an increased pre-reduction gas flow (1800 Nm3/tHM) (with pre-reducing gas temperature 1000 °C and recycling gas temperature 1200 °C). These adjustments enabled the hydrogen-rich gas utilization (40.30% H2) and the near-elimination of CO2 in melting furnace top gas (1.05%).
- (2)
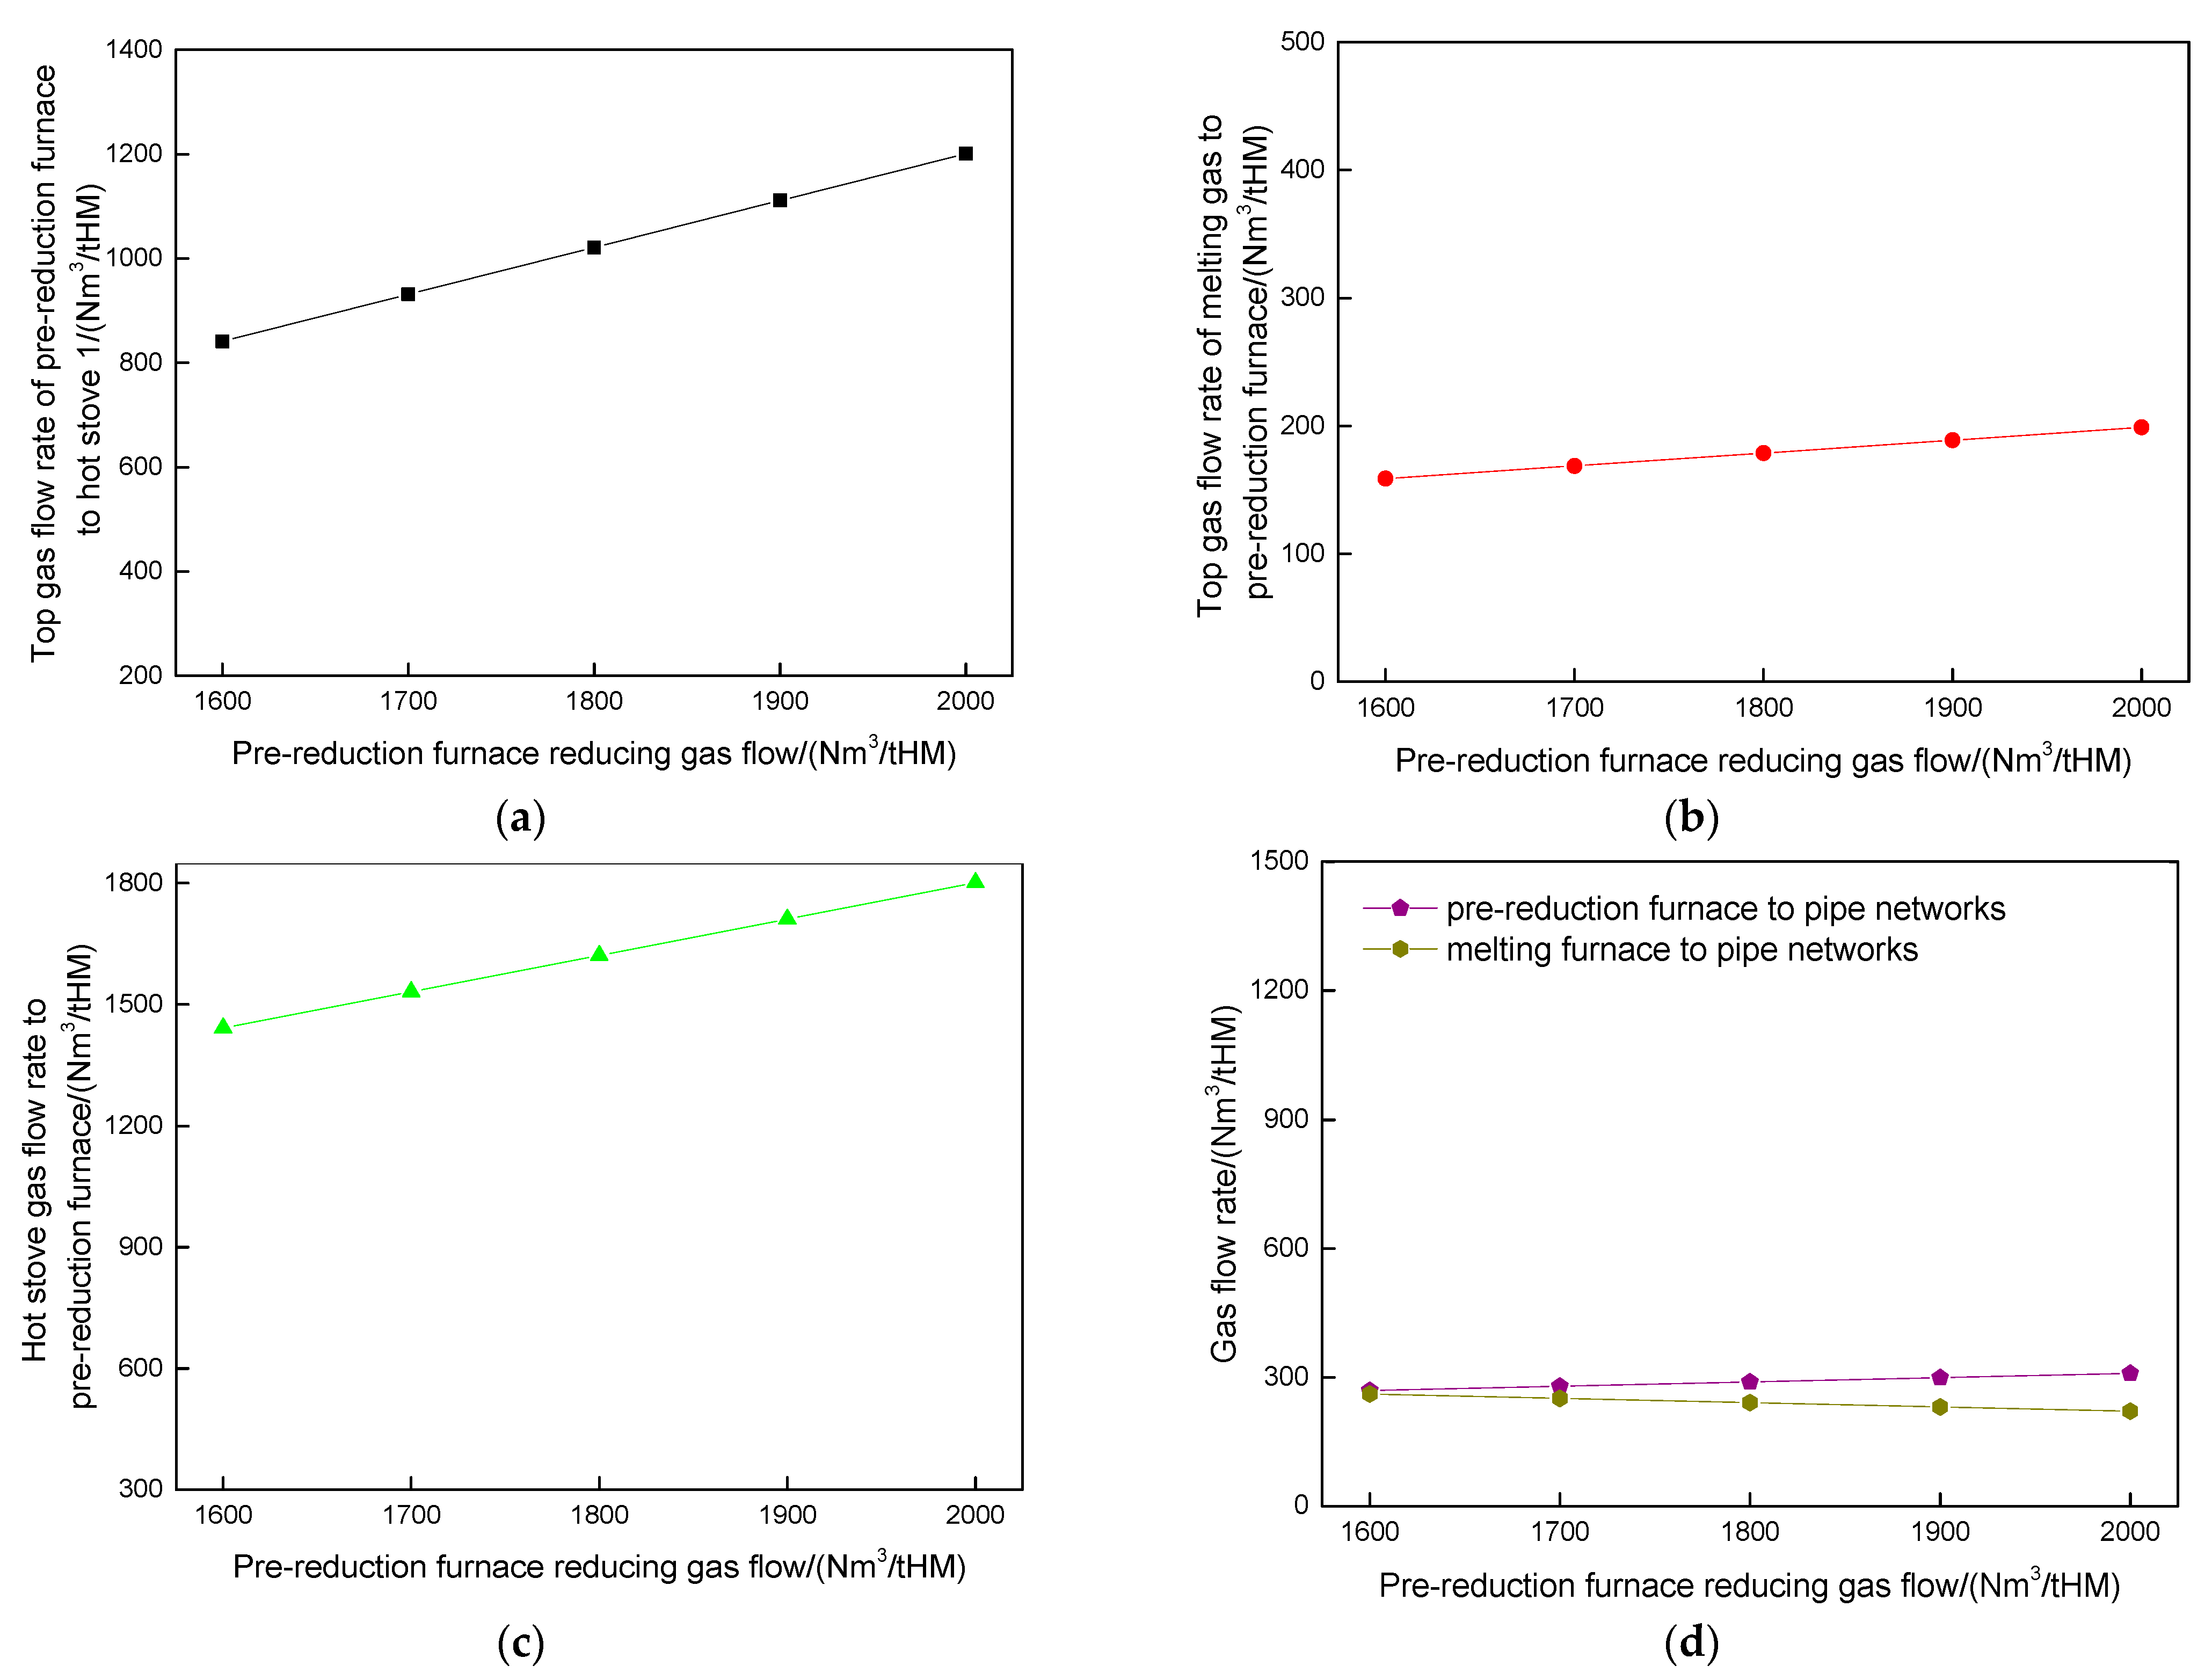
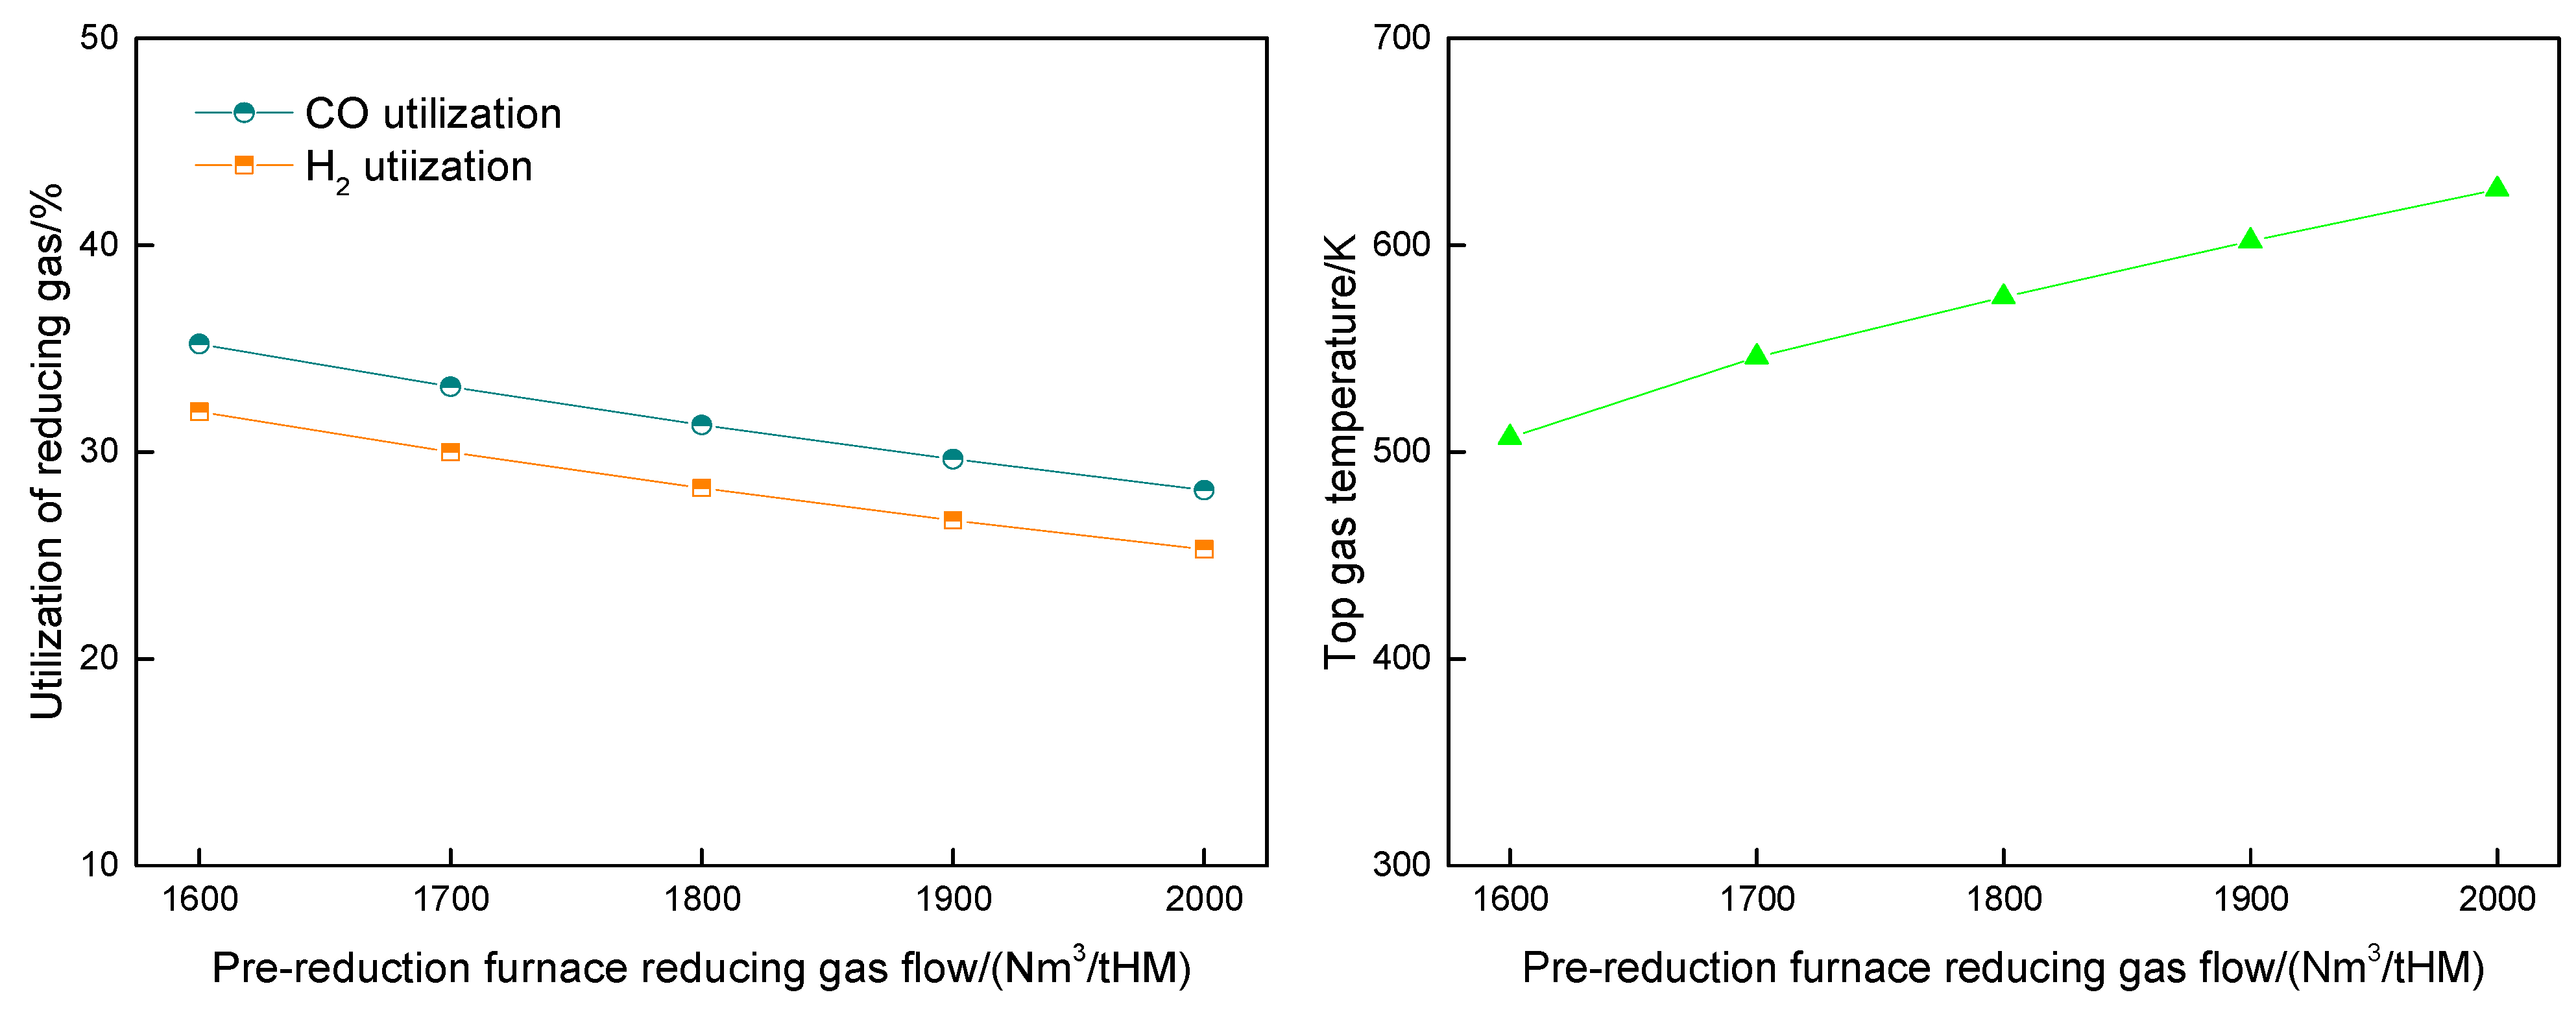
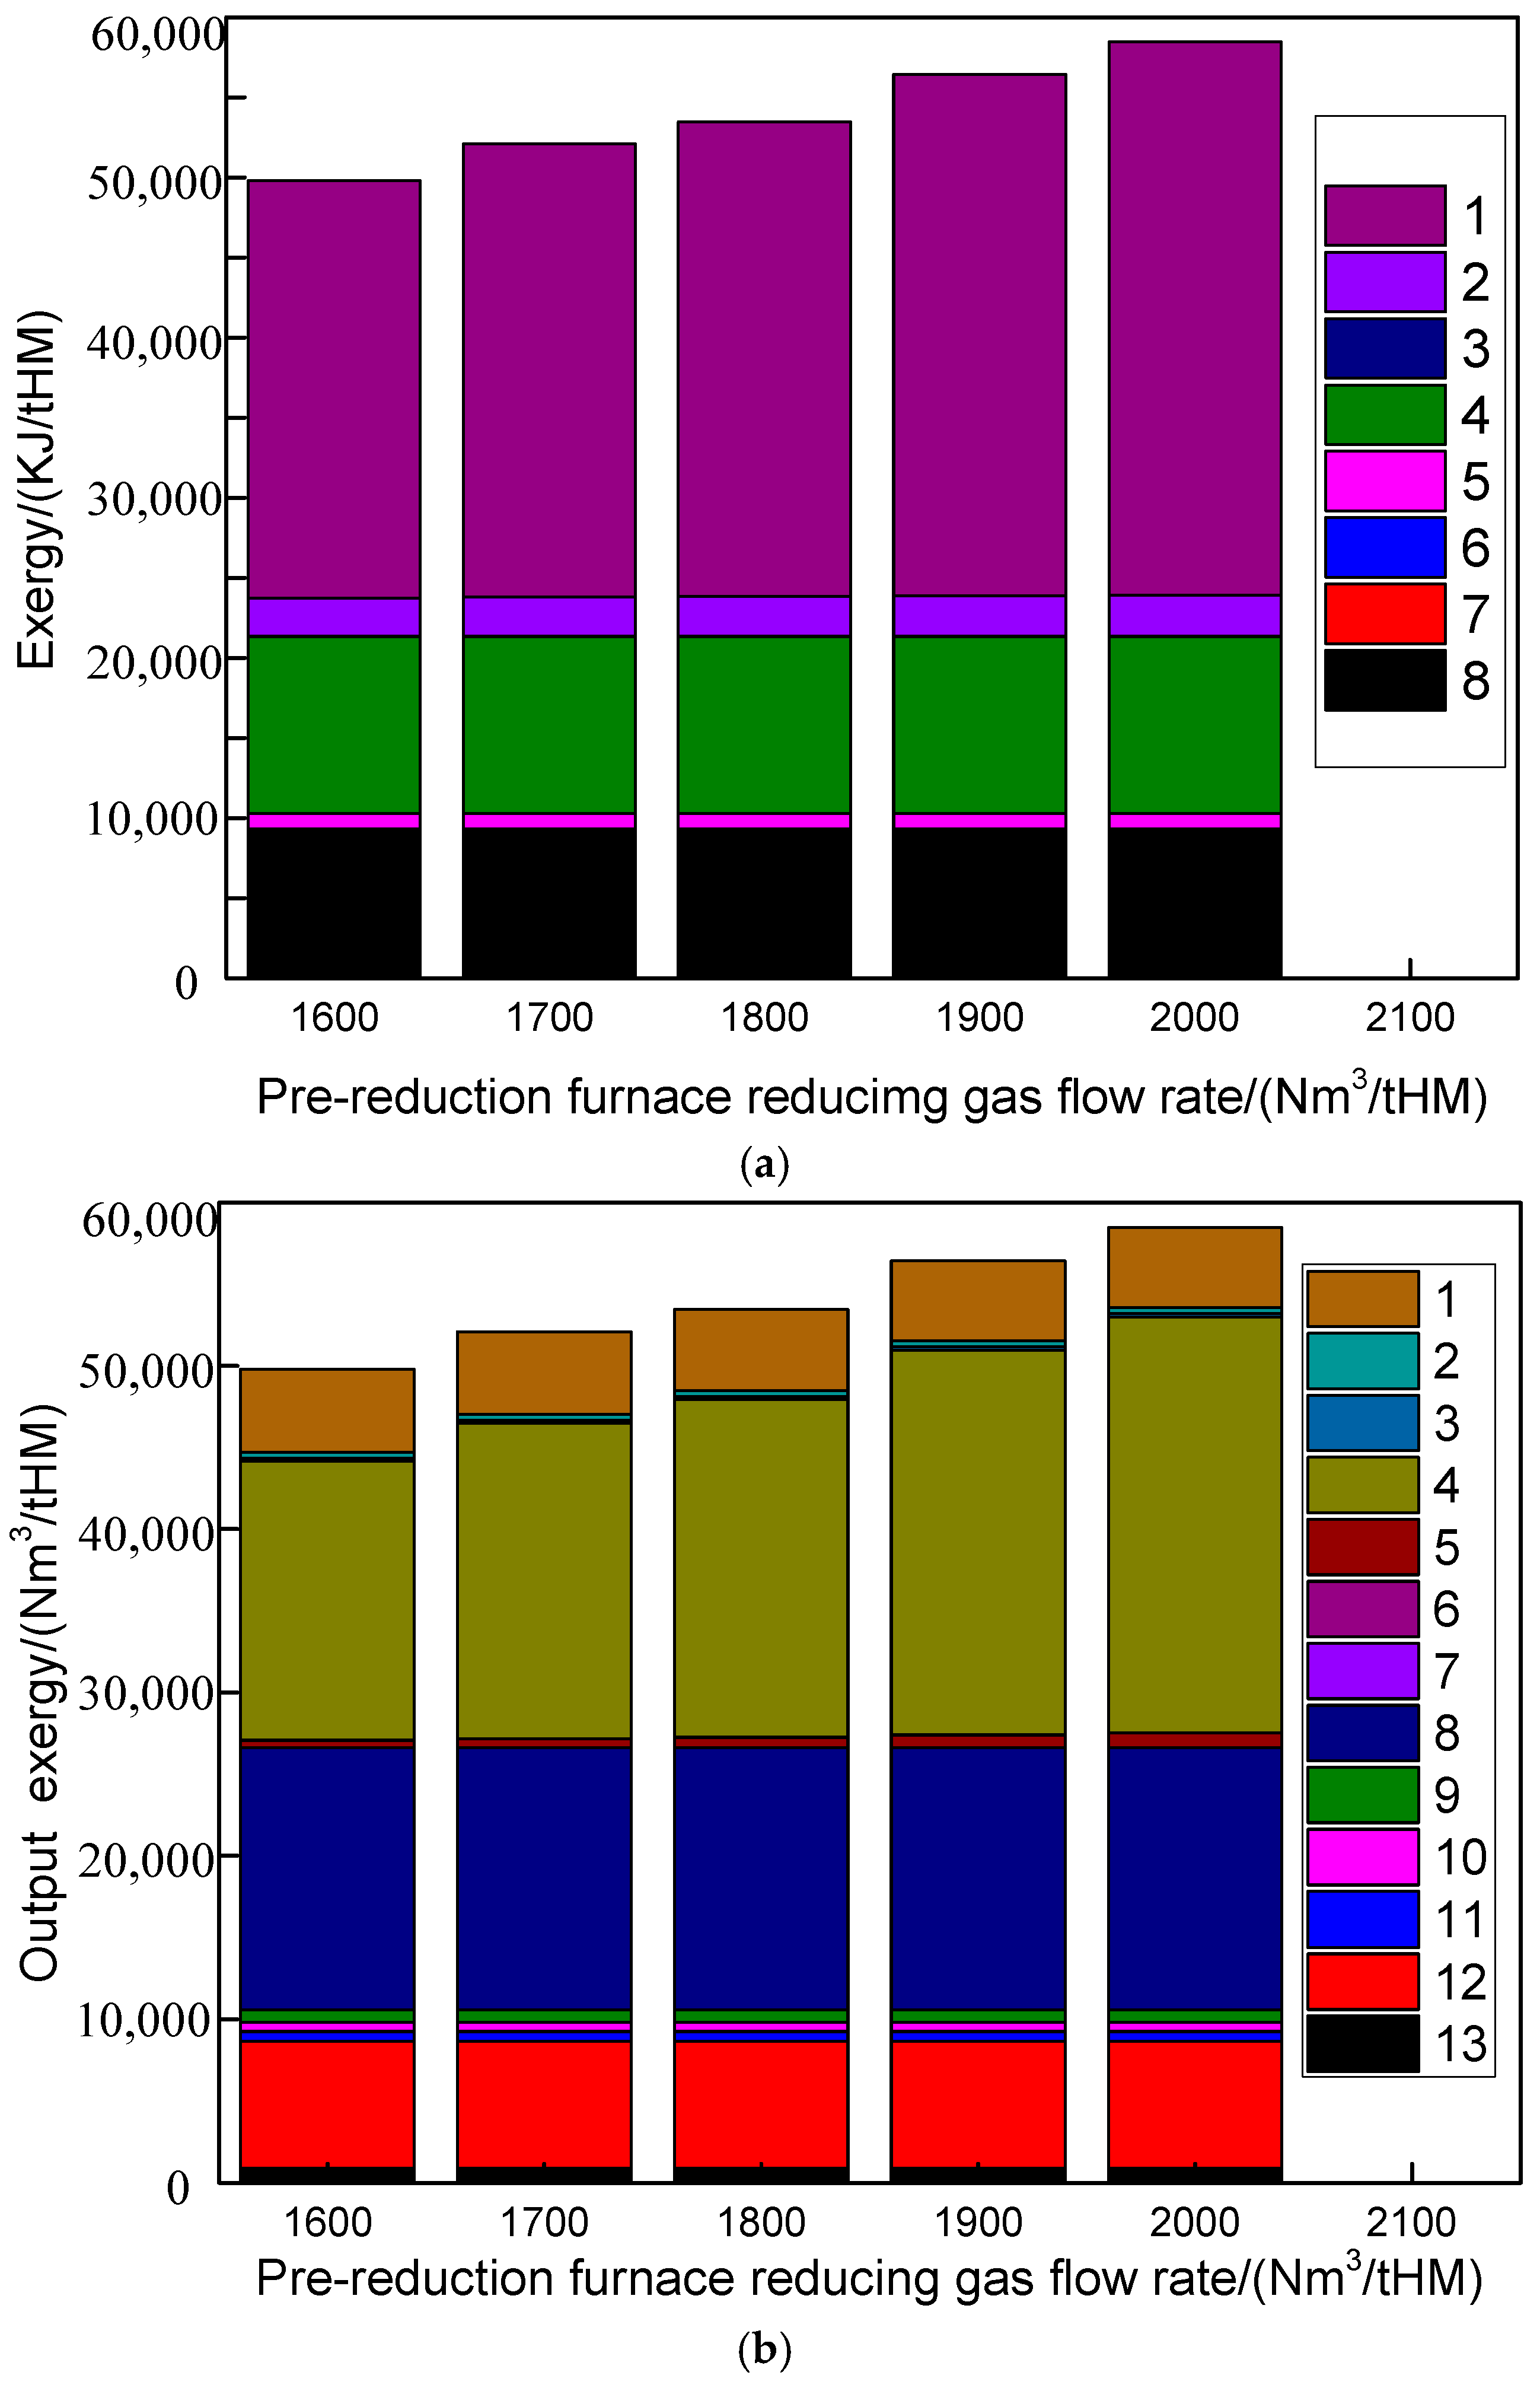
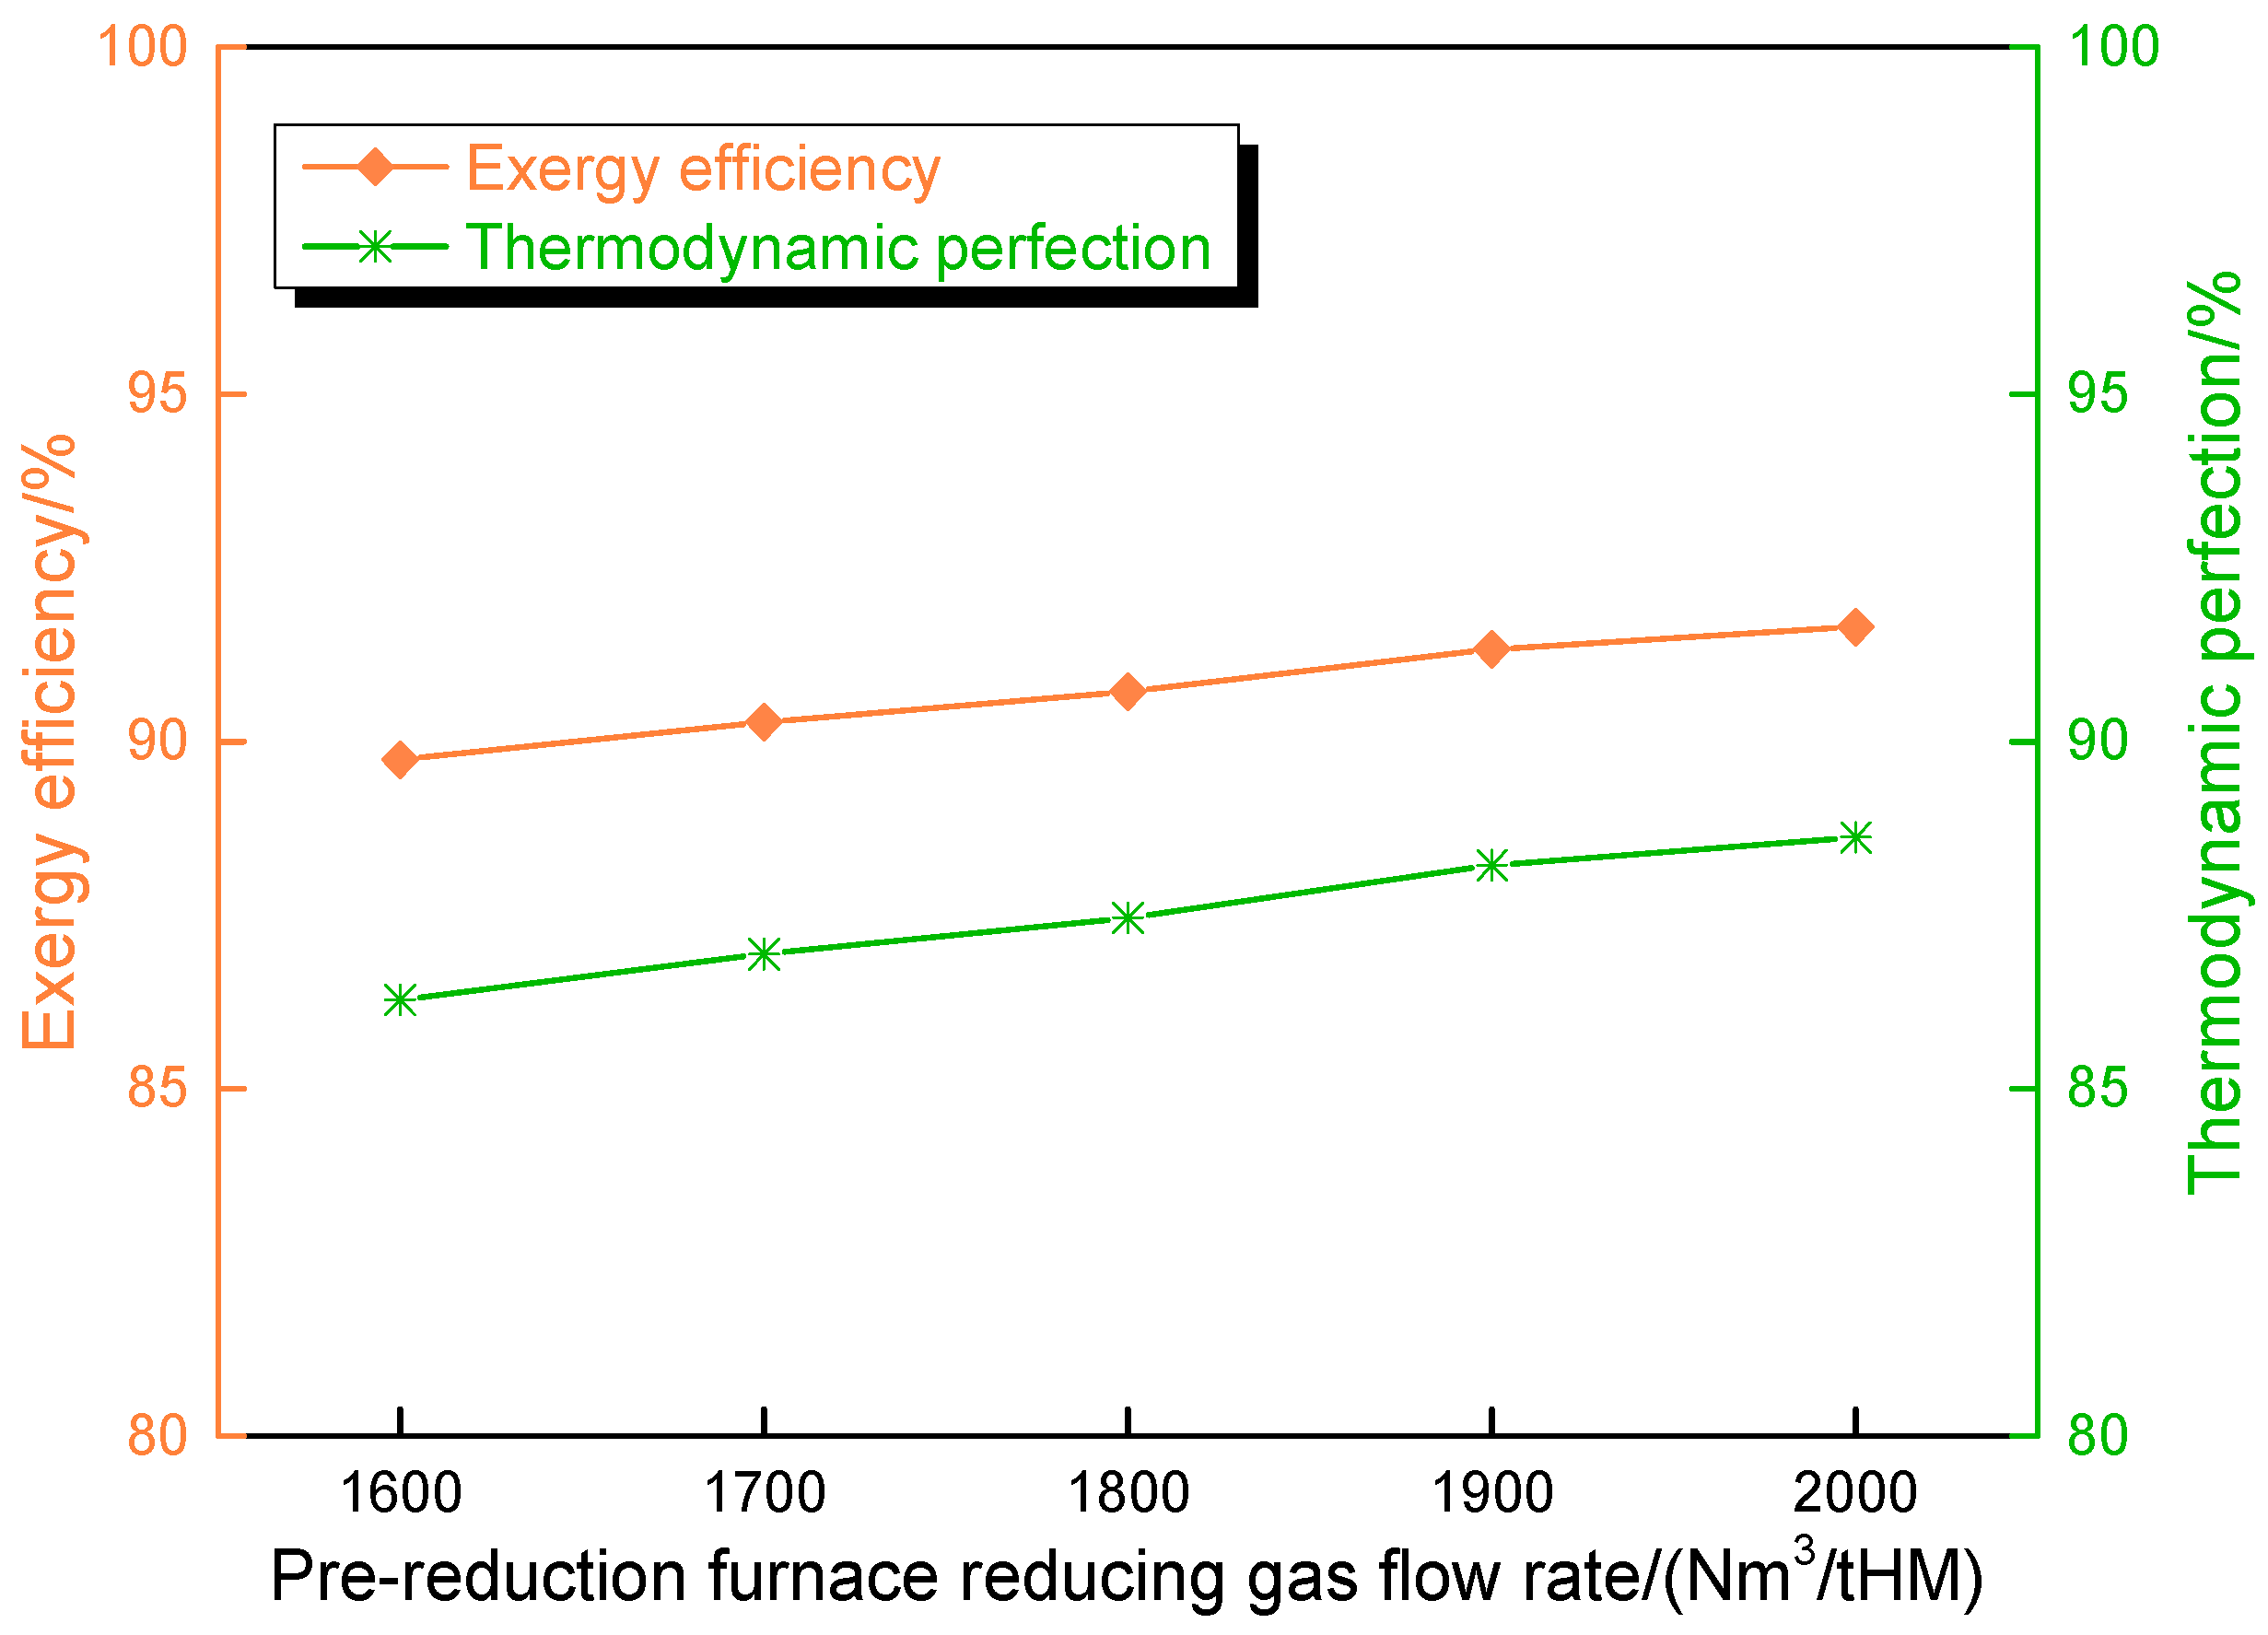
- Increasing the pre-reduction furnace reducing gas flow rate in Route 2 would elevate the CO concentrations in both the reducing gas (34.56% to 37.47%) and top gas (21.89% to 26.49%). Concurrently, the pre-reduction furnace top gas diverted to pipeline networks rose from 269 to 309 Nm3/tHM, while melting furnace top gas flows to pipelines decreased inversely from 261.03 to 221.93 Nm3/tHM.
- (3)
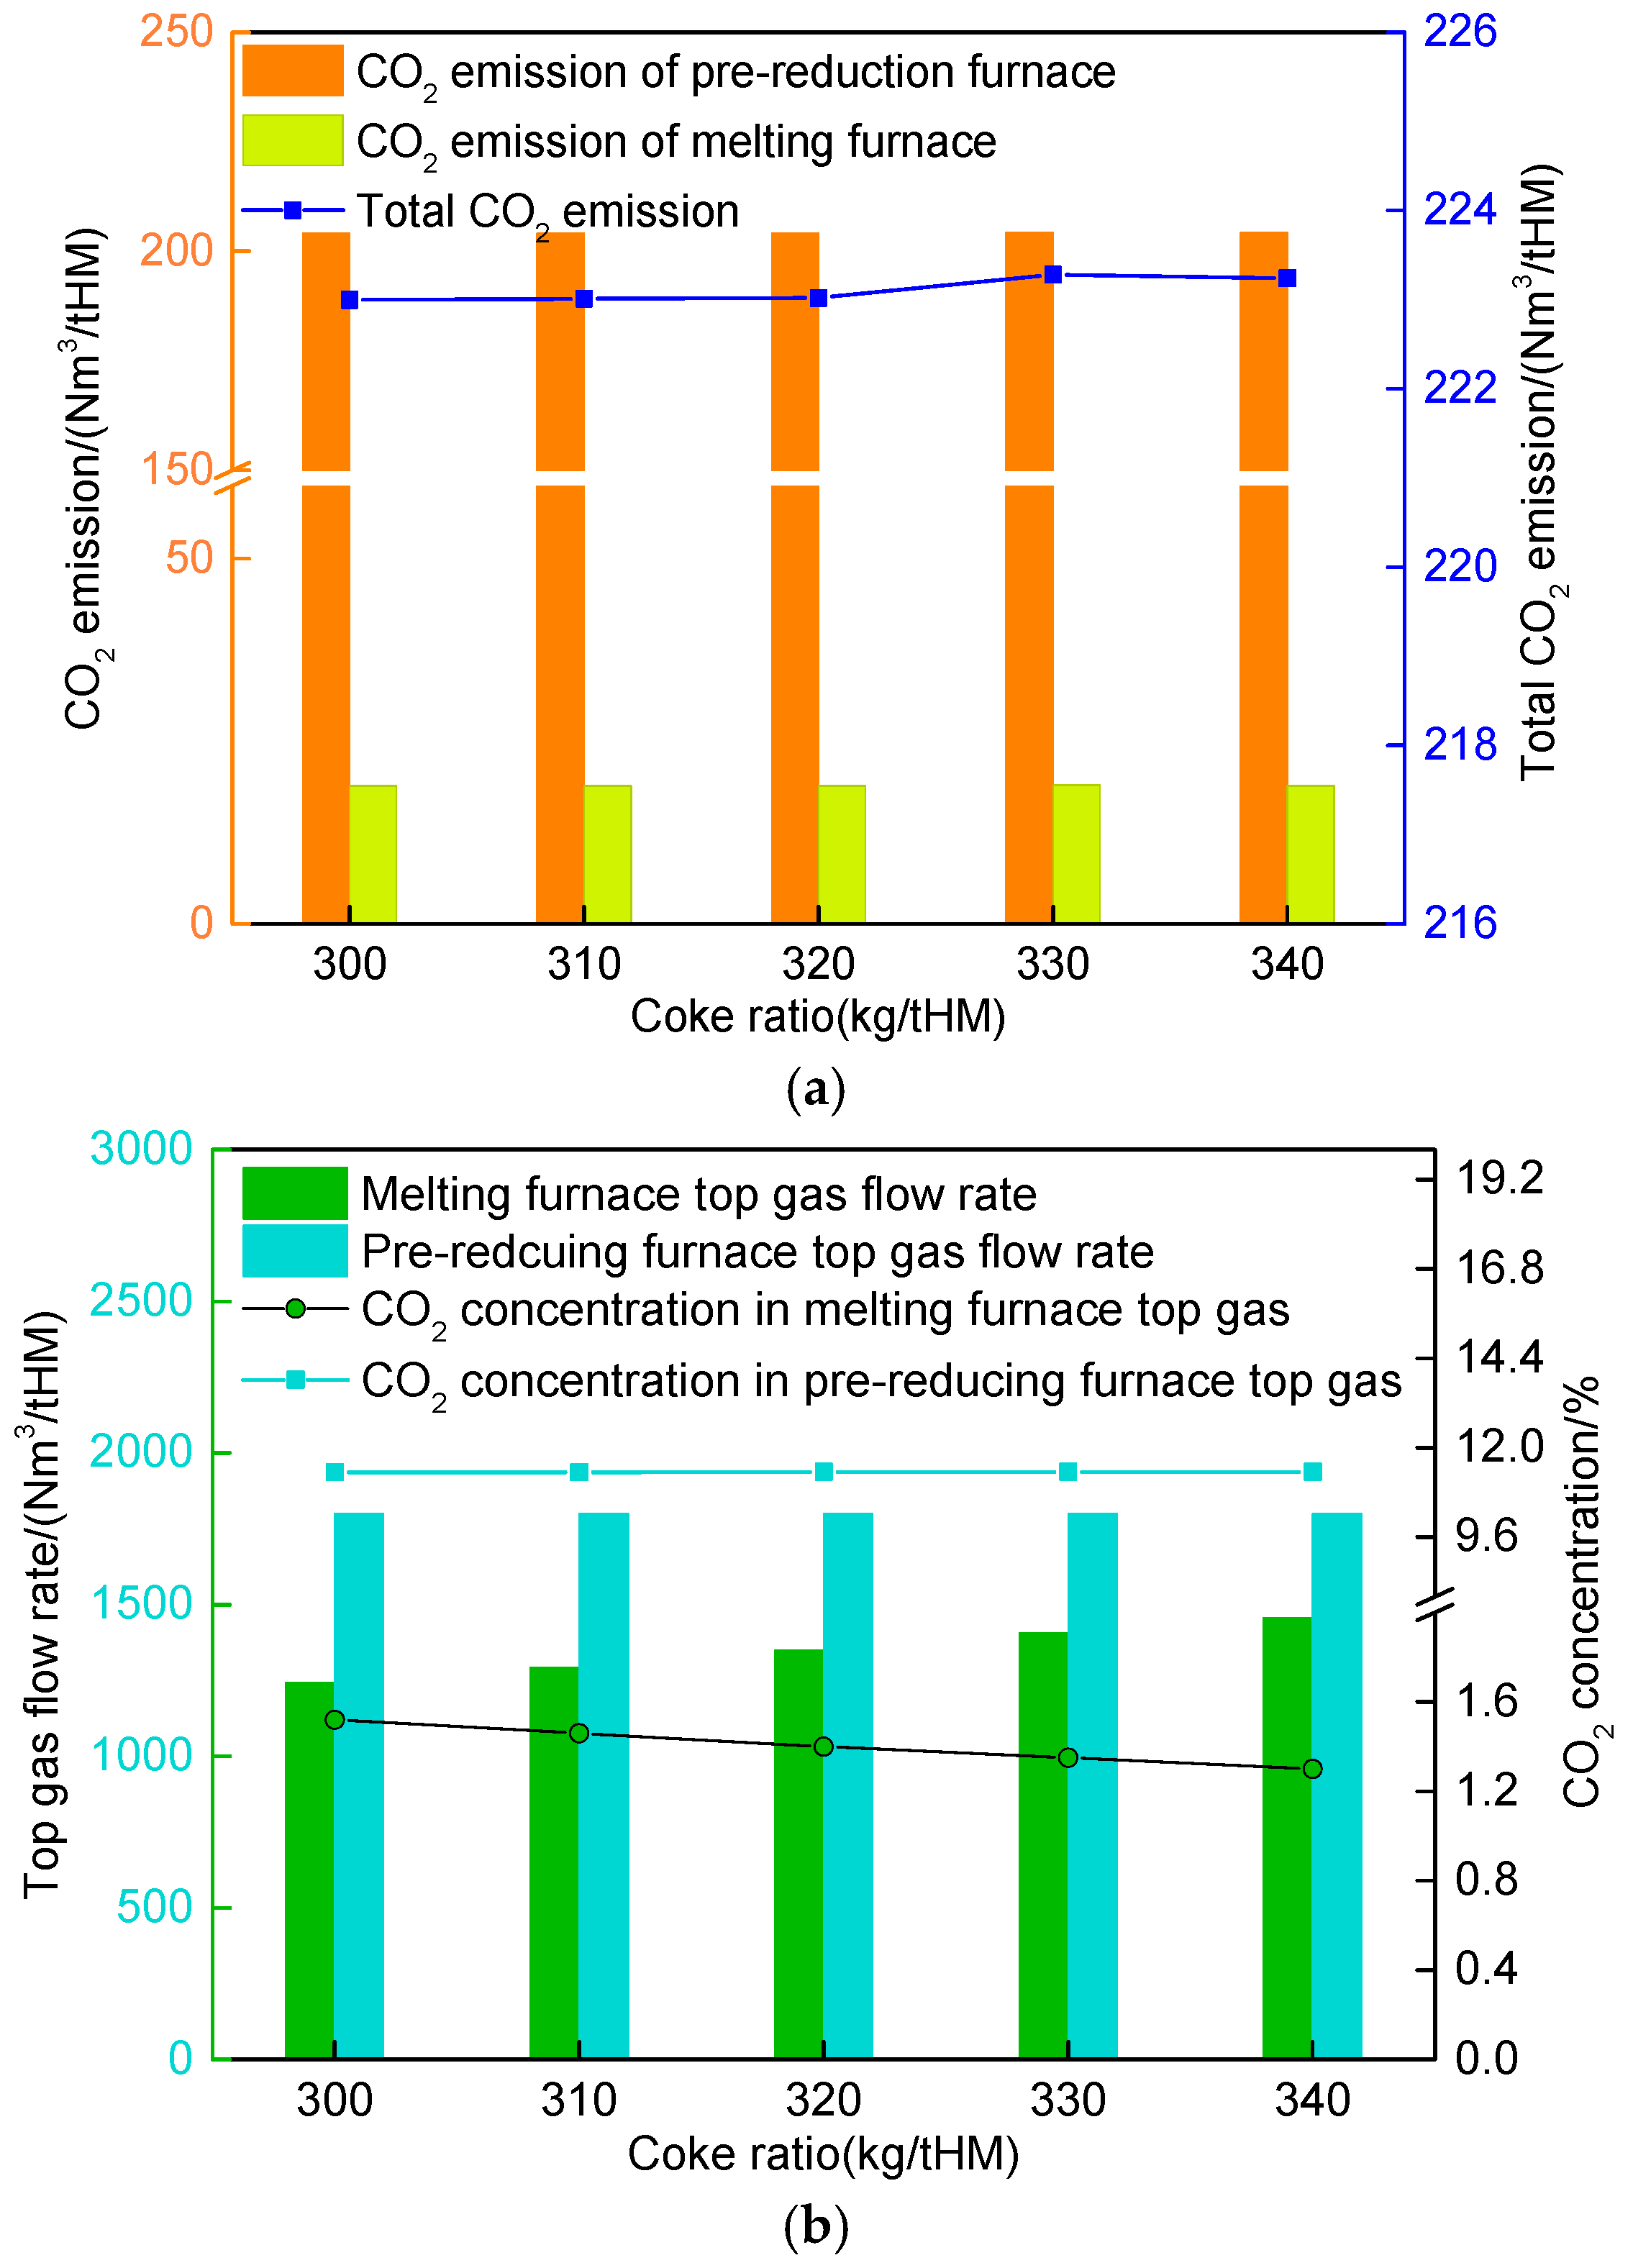
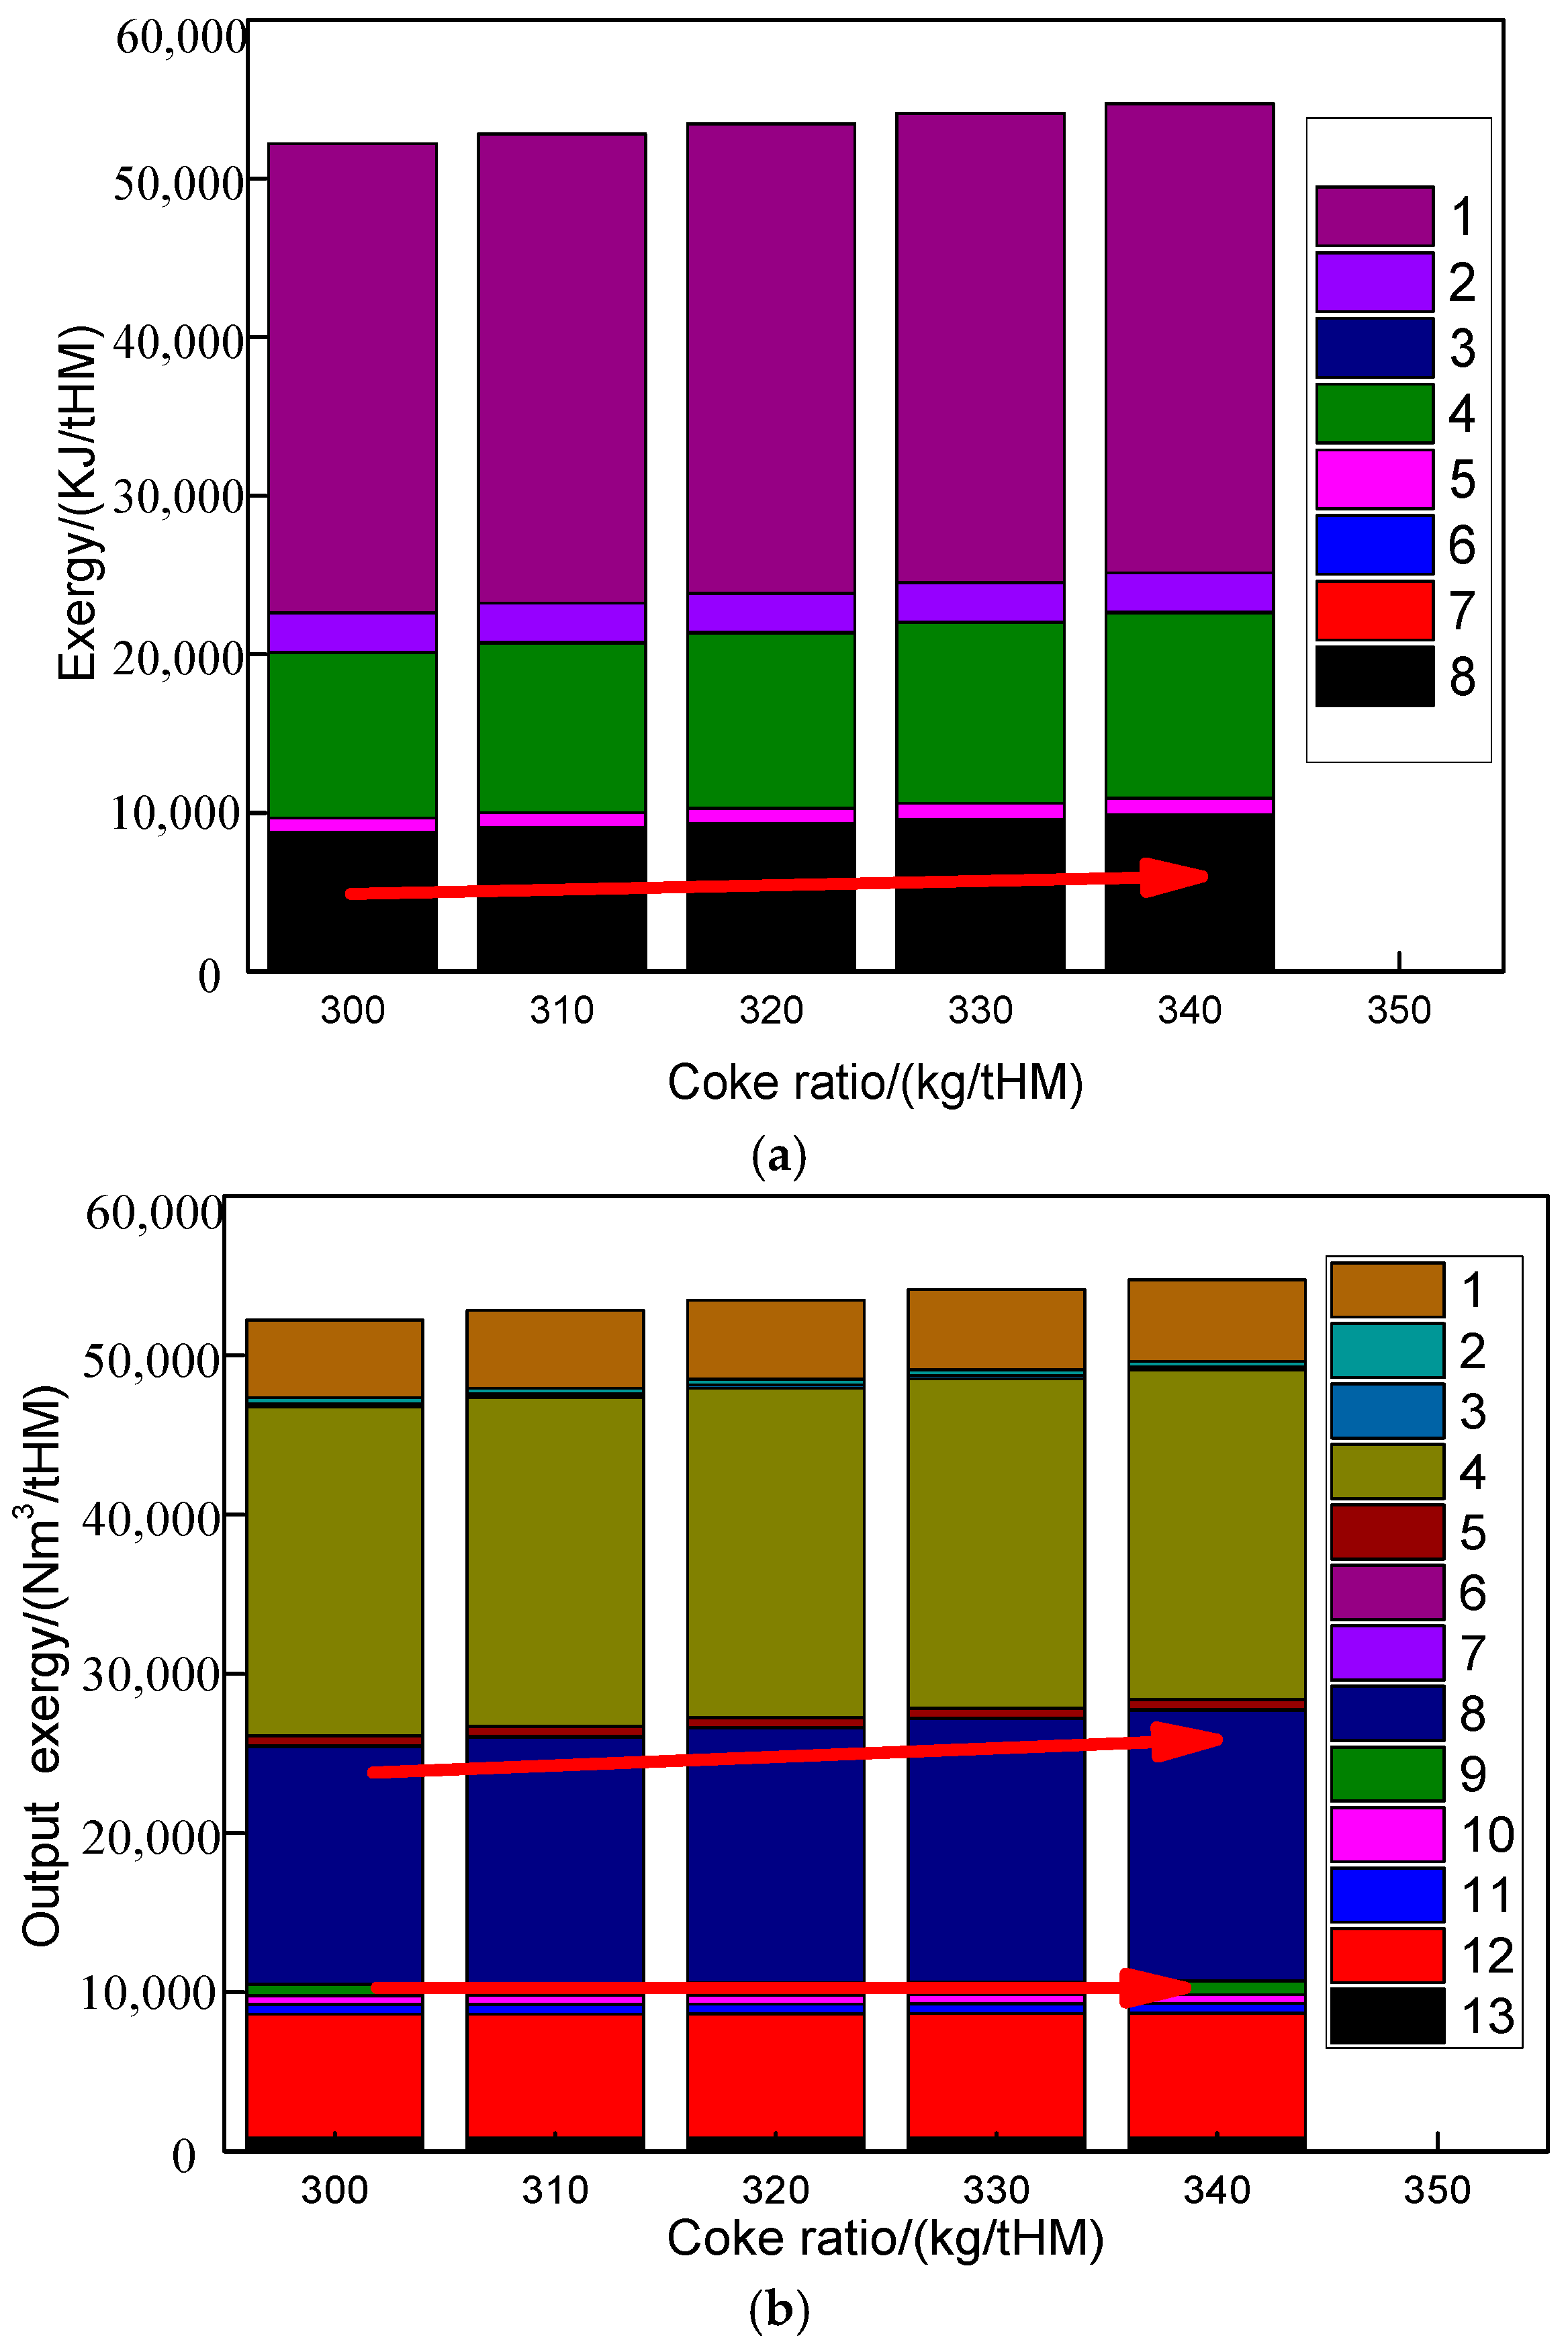
- The operational segregation between the pre-reduction and melting furnaces in Route 2 ensured minimal disruption to the pre-reduction subsystem despite adjustments to the melting furnace coke ratio (300–340 kg/tHM). The CO and H2 utilization rates remained stable at 31.31% and 28.26%, respectively, even as post-treatment CO content in melting furnace top gas increased marginally (98.86% to 99.02%).
- (4)
- Route 2 demonstrated the enhanced carbon mitigation and operational adaptability, facilitating hydrogen-rich gas integration without destabilizing the melting furnace. However, the industrial-scale validation and optimization of raw material specifications were identified as critical prerequisites for practical implementation. These findings underscore Route 2’s potential as a low-emission ironmaking pathway, though scalability and material compatibility require further investigation.
- (5)
- The comprehensive evaluation demonstrates that the PLCsmelt process achieves significant economic and environmental advantages over traditional blast furnace (TBF), HISMELT, and FINEX technologies, with hot metal costs reduced to 1973 yuan/tHM (Route 2) and carbon emissions lowered by 53.08% (729 kg CO2/tHM) compared to TBF. While the hydrogen-enriched shaft furnace (SF) process exhibits superior performance in cost (1244 yuan/tHM), emissions (451 kg CO2/tHM), and total environmental impact (5.53 × 10⁻¹¹), its industrial application is hindered by severe vanadium–titanium magnetite pulverization, which violates pellet quality requirements for stable furnace operation. In contrast, the PLCsmelt process ensuring technical feasibility while delivering a substantially reduced environmental footprint (1.27 × 10⁻¹⁰) and scalable decarbonization potential, positioning it as a viable low-carbon solution for the steel industry.
Author Contributions
Funding
Data Availability Statement
Conflicts of Interest
References
- Shi, Q.; Tang, J.; Chu, M.S. Process metallurgy and data-driven prediction and feedback of blast furnace heat indicators. Int. J. Miner. Metall. Mater. 2024, 31, 1228. [Google Scholar] [CrossRef]
- Kawashiri, Y.; Nouchi, T.; Matsuno, H. Effect of Nitrogen-less Reducing Atmosphere on Permeability of Cohesive Layer in Blast Furnace. ISIJ Int. 2020, 60, 1395. [Google Scholar] [CrossRef]
- Orth, A.; Anastasijevic, N.; Eichberger, H. Low CO2 Emission Technologies for Iron and Steelmaking as well as Titania Slag Production. Miner. Eng. 2007, 20, 854. [Google Scholar] [CrossRef]
- Xu, C.B.; Cang, D.C. A Brief Overview of Low CO2 Emission Technologies for Iron and Steel Making. J. Iron Steel Res. Int. 2010, 17, 1. [Google Scholar] [CrossRef]
- Chu, M.S.; Nogami, H.; Yagi, J. Numerical Analysis on Injection of Hydrogen Bearing Materials into Blast Furnace. ISIJ Int. 2004, 14, 801. [Google Scholar] [CrossRef]
- Tang, J.; Chu, M.S.; Li, F. Development and Progress on Hydrogen Metallurgy. Int. J. Miner. Metall. Mater. 2020, 27, 713. [Google Scholar] [CrossRef]
- Tang, J.; Chu, M.S.; Li, F. Mathematical Simulation and Life Cycle Assessment of Blast Furnace Operation with Hydrogen Injection Under Constant Pulverized Coal Injection. J. Clean. Prod. 2021, 78, 278. [Google Scholar] [CrossRef]
- Takahashi, K.; Nouchi, T.; Sato, M. Perspective on Progressive Development of Oxygen Blast Furnace for Energy Saving. ISIJ Int. 2015, 55, 1866. [Google Scholar] [CrossRef]
- Pan, Z.D.; Liu, X.W.; Li, J.W. Blast Furnace Ironmaking Process with Super High TiO2 in the Slag: High-Temperature Structure of the Slag. Metall. Mater. Trans. B 2020, 51, 2348. [Google Scholar]
- Cheng, G.J.; Liu, J.X.; Xue, X.X. Non-isothermal Reduction Mechanism and Kinetics of High Chromium Vanadium–titanium Magnetite Pellets. Ironmak. Steelmak. 2015, 42, 17. [Google Scholar] [CrossRef]
- Sui, Y.L.; Guo, Y.F.; Jiang, T. Separation and Recovery of Iron and Titanium from Oxidized Vanadium Titano-Magnetite by Gas-Based Reduction Roasting and Magnetic Separation. JMRT 2019, 8, 3036. [Google Scholar] [CrossRef]
- Guo, X.F.; Dai, S.J.; Wang, Q.Q. Influence of different comminution flowsheets on the separation of vanadium titano-magnetite. Miner. Eng. 2020, 149, 1. [Google Scholar] [CrossRef]
- Dmitriev, A.; Alektorov, R.; Vitkina, G.; Chesnokov, Y. Features of the Reducibility of Titanomagnetite Iron Ore Materials. Defect Diffus. Forum 2020, 400, 176. [Google Scholar] [CrossRef]
- Ostrovski, O.; Zhang, G.; Kononov, R.; Li, J. Carbothermal Solid State Reduction of Stable Metal Oxides. Steel Res. Int. 2010, 81, 841. [Google Scholar] [CrossRef]
- Zhao, W.; Chu, M.S.; Wang, H.T. Reduction Behavior of Vanadium-Titanium Magnetite Carbon Composite Hot Briquette in Blast Furnace Process. Powder Technol. 2019, 342, 214. [Google Scholar] [CrossRef]
- Chen, W.B.; Dong, Z.Q.; Jiao, Y. Preparation, Sintering Behavior and Consolidation Mechanism of Vanadium-Titanium Magnetite Pellets. Crystals 2021, 11, 188. [Google Scholar] [CrossRef]
- Gan, M.; Sun, Y.F.; Fan, X.H. Preparing High-Quality Vanadium Titano-Magnetite Pellets for Large-Scale Blast Furnaces as Ironmaking Burden. Ironmak. Steelmak. 2022, 47, 130. [Google Scholar] [CrossRef]
- Zhang, X.S.; Zou, Z.S.; Luo, Z.G. Numerical Simulation on Characteristics of COREX Shaft Furnace with Central Gas Distribution. J. Iron Steel Res. Int. 2019, 26, 567. [Google Scholar] [CrossRef]
- He, Y.N.; Pistorius, P.C. Laboratory Carburization of Direct-Reduced Iron in CH4-H2-N2 Gas Mixtures, and Comparison with Industrial Samples. Metall. Mater. Trans. B 2016, 47, 1538. [Google Scholar] [CrossRef]
- Cheraghi, A.; Yoozbashizadeh, H.; Ringdalen, E. Kinetics and Mechanism of Low-Grade Manganese Ore Reduction by Natural Gas. Metall. Mater. Trans. B 2019, 50, 1566. [Google Scholar] [CrossRef]
- Srishilan, C.; Shukla, A.K. Model of COREX Melter Gasifier Using FactSage™ and Macro Facility. Metall. Mater. Trans. B 2019, 50, 312. [Google Scholar] [CrossRef]
- Iwai, Y.; Ishiwata, N.; Murai, R. Shaft Furnace Simulation by Mathematical Model Considering Coke Gasification Rate in High Temperatur. Tetsu Hagane 2015, 101, 416. [Google Scholar] [CrossRef]
- Xu, K.; Bai, M.H. DEM simulation of particle descending velocity distribution in the reduction shaft furnace. Metall. Res. Technol. 2016, 113, 16. [Google Scholar] [CrossRef][Green Version]
- Liu, Z.J.; Liu, S.F.; Wang, Y.Z. Optimization of Hydrogen-Based Shaft Furnace Raw Material Parameters Based on Numerical Simulation and Rist Operation Diagram. Metall. Mater. Trans. B 2023, 54, 2135. [Google Scholar] [CrossRef]
- Shao, L.; Xu, J.; Saxen, H. A numerical study on process intensification of hydrogen reduction of iron oxide pellets in a shaft furnace. Fuel 2023, 348, 8. [Google Scholar] [CrossRef]
- Jiang, X.; Yu, J.X.; Wang, L. Distribution of reformed coke oven gas in a shaft furnace. J. Iron Steel Res. Int. 2020, 27, 1389. [Google Scholar] [CrossRef]
- Li, Z.Y.; Qi, Z.; Zhang, L.C. Numerical simulation of H2-intensive shaft furnace direct reduction process. J. Clean. Prod. 2023, 109, 2. [Google Scholar] [CrossRef]
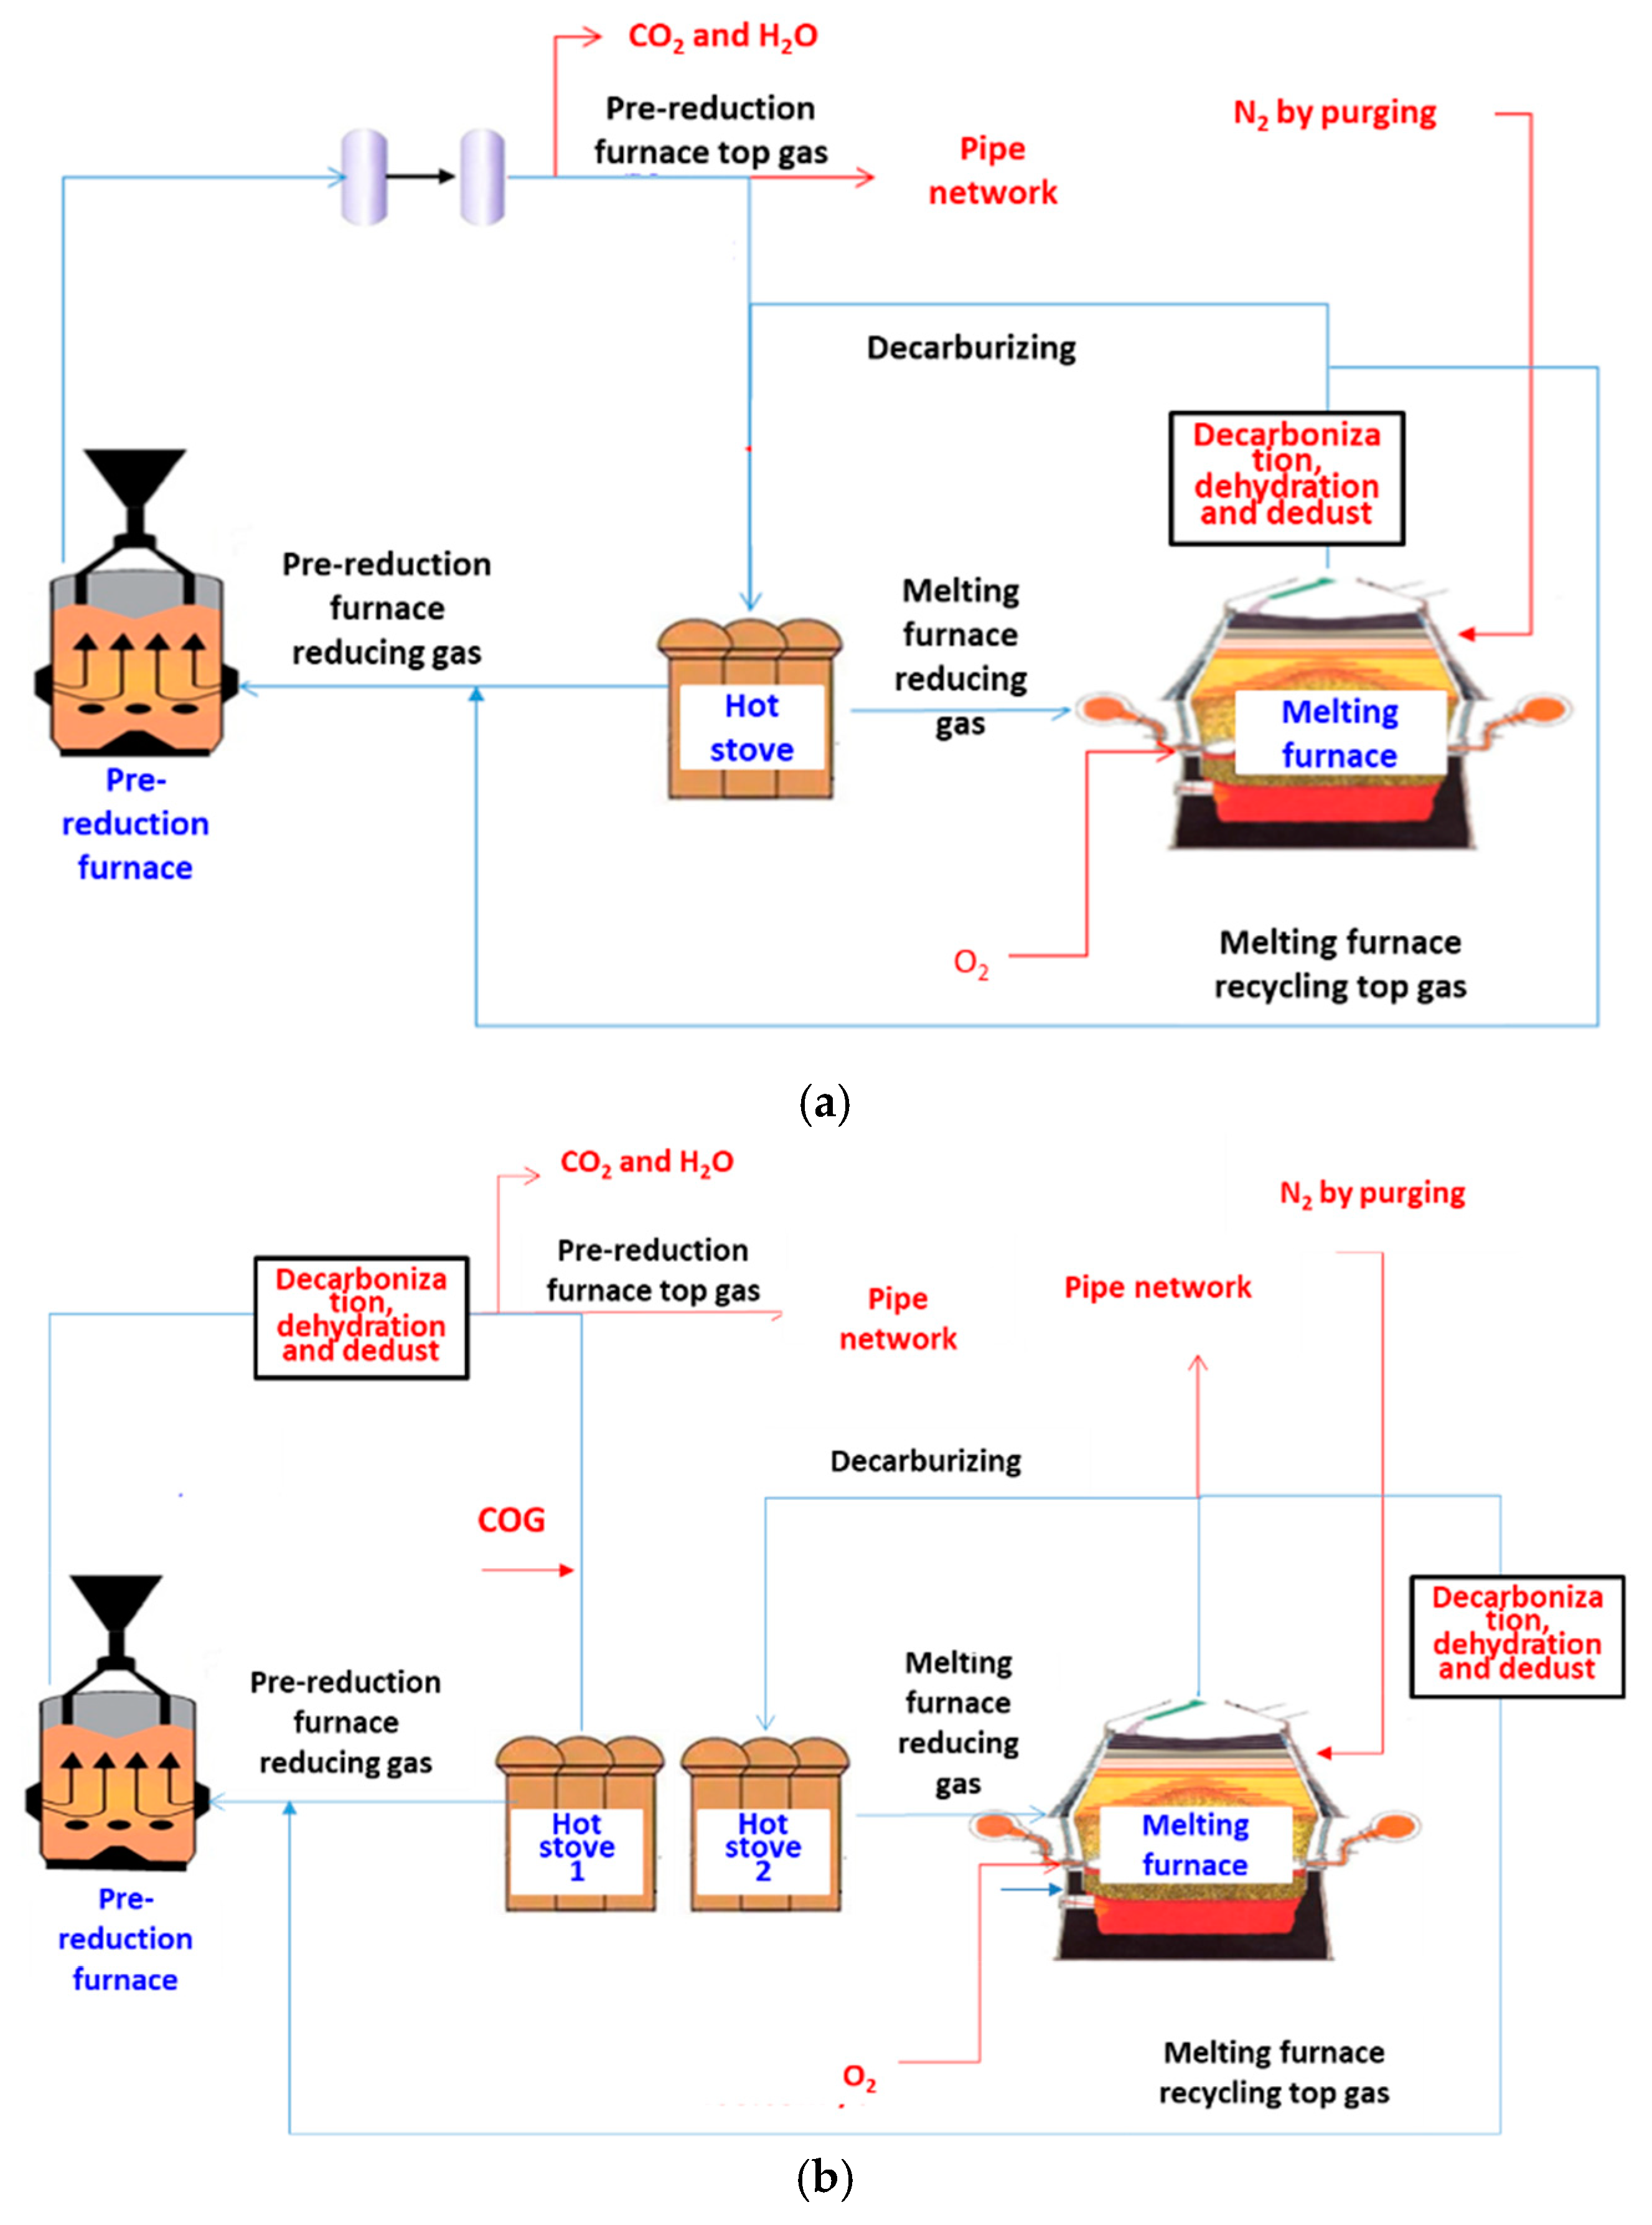

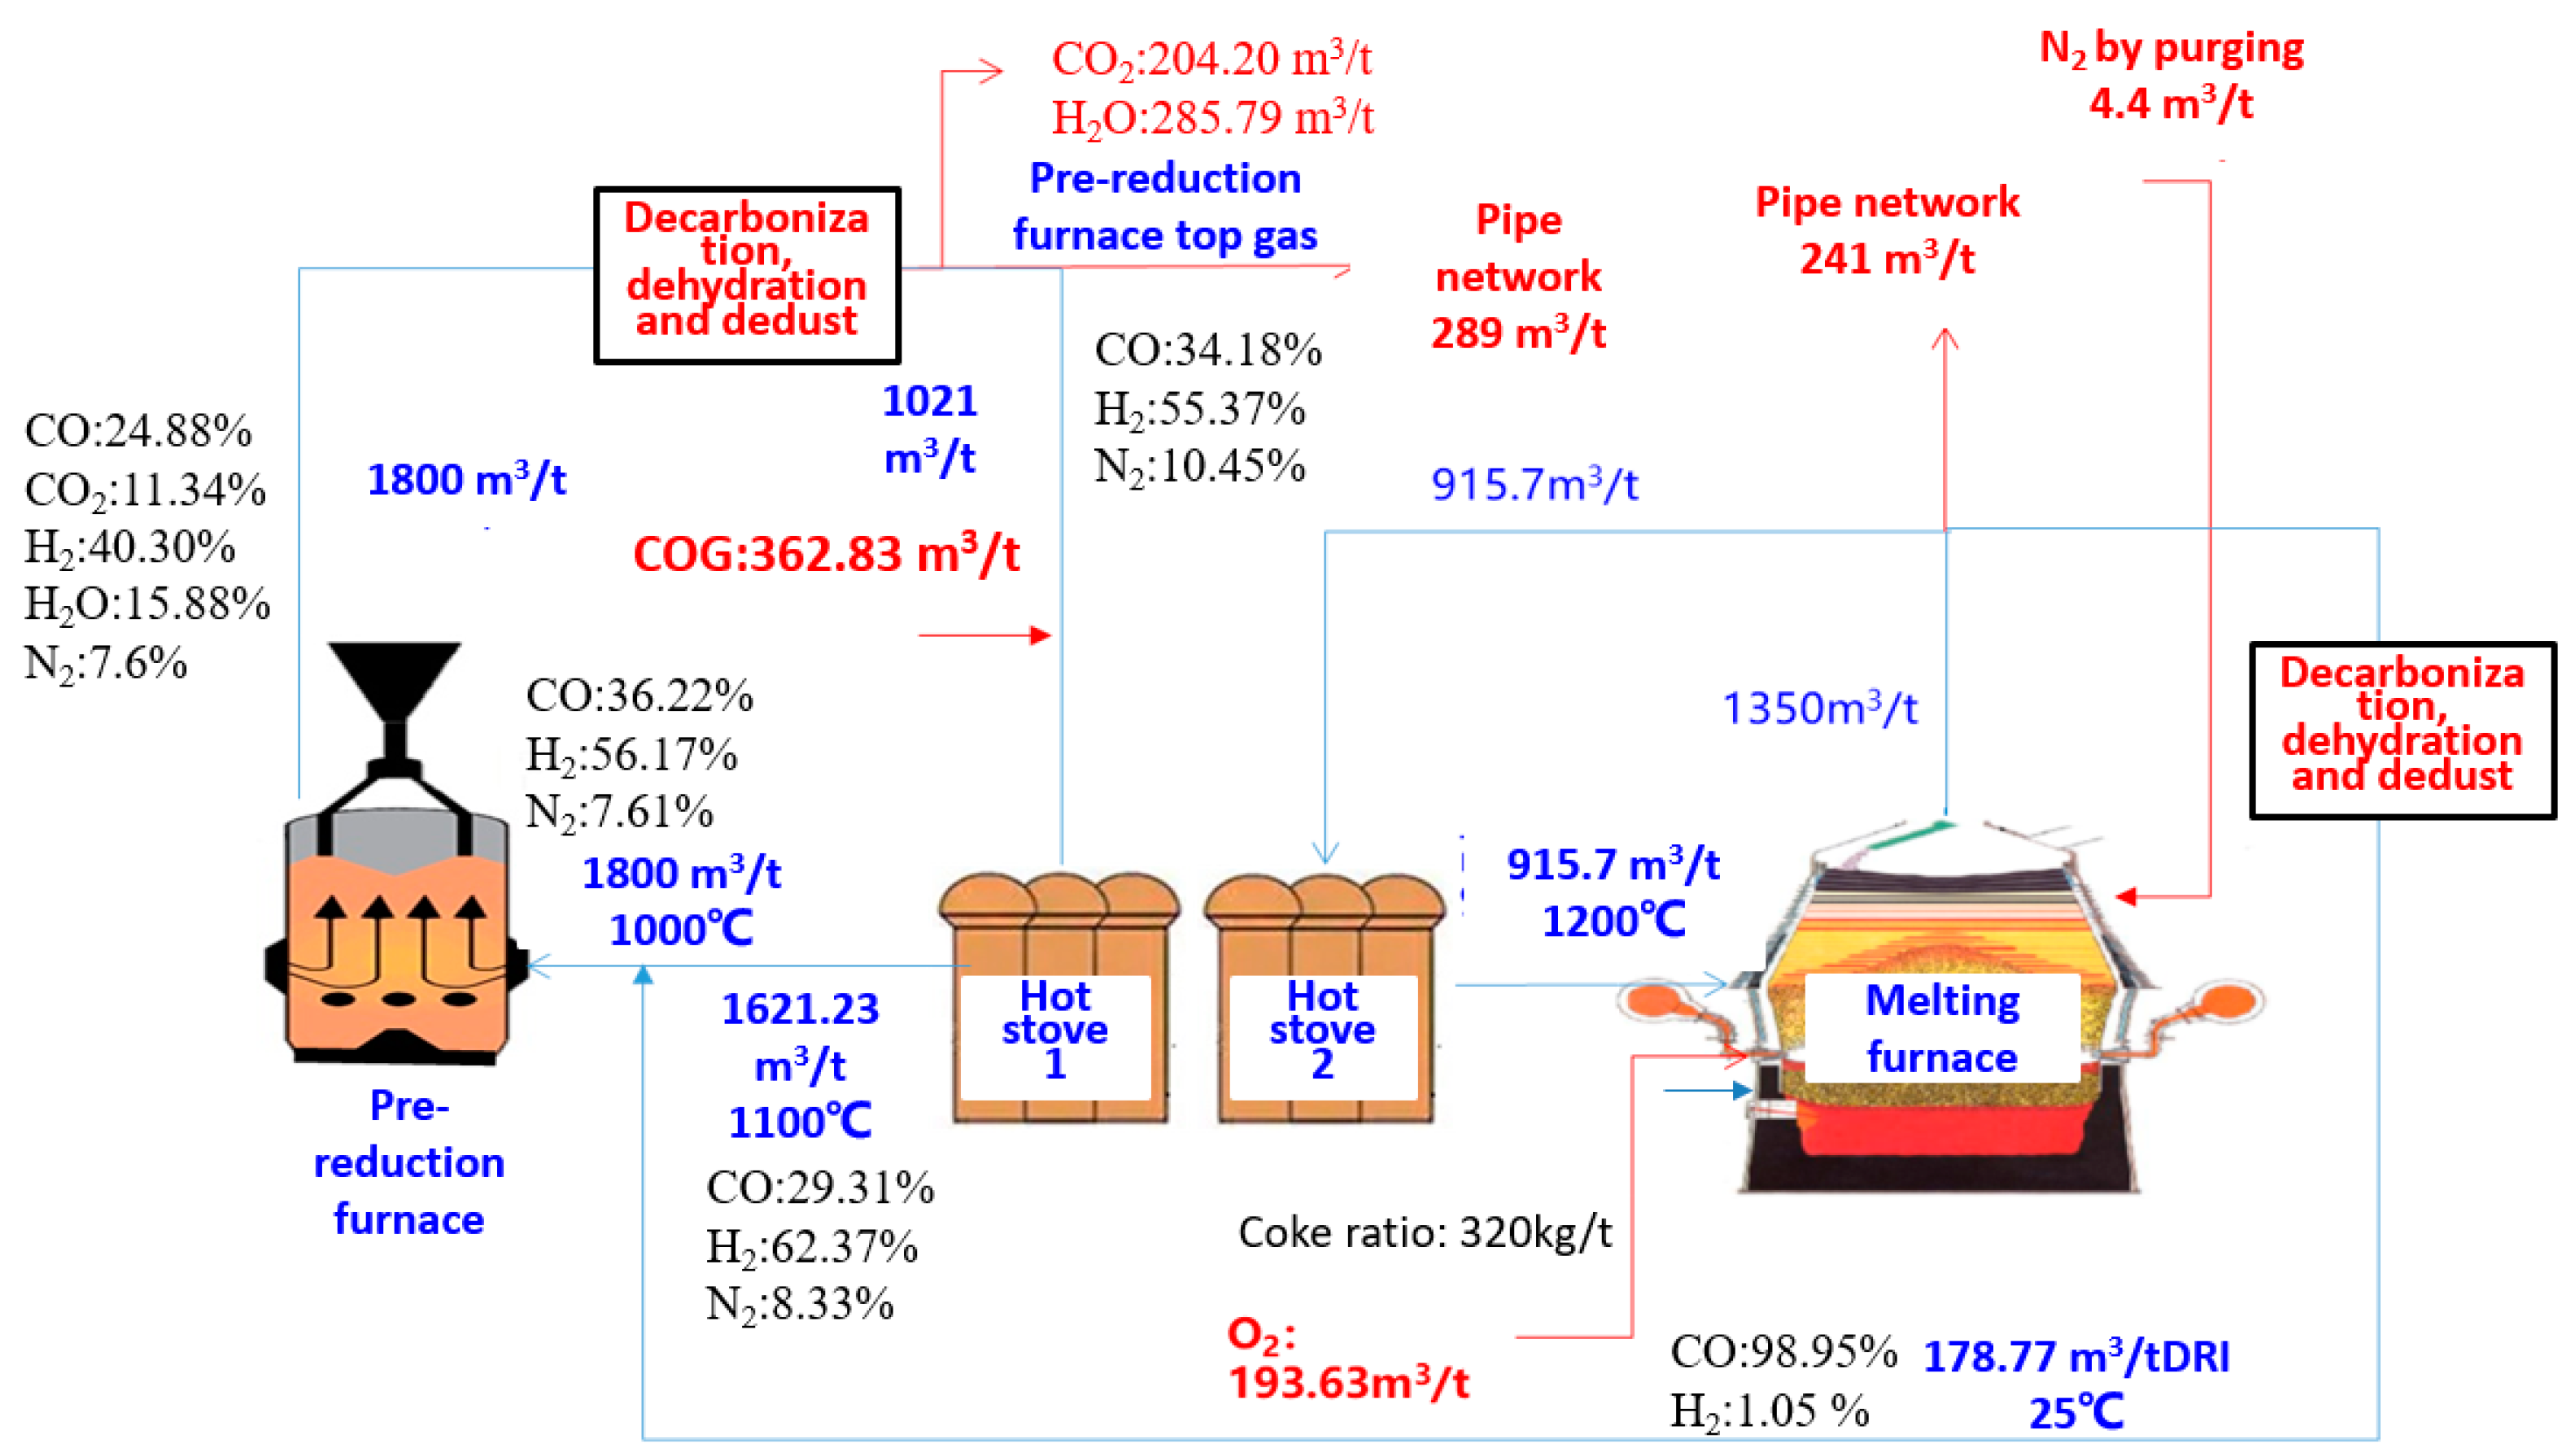




| 1 | 3Fe2O3 + CO = 2Fe3O4 + CO2 |
| 2 | Fe3O4 + CO=3FeO + CO2 |
| 3 | FeO + CO = Fe + CO2 |
| 4 | 3Fe2O3 + H2 = 2Fe3O4 + H2O |
| 5 | Fe3O4 + H2 = 3FeO + H2O |
| 6 | FeO + H2 = Fe + H2O |
| 7 | H2 + CO2 = H2O + CO |
| Project | Element Balance | |
|---|---|---|
| Input | Ore | |
| Pure oxygen | ||
| Coke | 8 | |
| Recycling gas | ||
| O input | ||
| Output | Top gas | |
| Slag | ||
| Hot metal | — | |
| O output |
| Project | Element Balance | |
|---|---|---|
| Input | Coke | |
| Recycling gas | ||
| C input | ||
| Output | Top gas | |
| Hot metal | ||
| C output |
| Project | Element Balance | |
|---|---|---|
| Recycling gas | ||
| H input | ||
| Output | Top gas | |
| H output |
| Component | TFe | FeO | SiO2 | Al2O3 | MgO | CaO | TiO2 | V2O5 |
|---|---|---|---|---|---|---|---|---|
| % | 55.95 | 0.00 | 2.89 | 3.33 | 2.98 | 3.33 | 10.35 | 0.40 |
| Component | C | CaO | SiO2 | MgO | Al2O3 | CaS |
|---|---|---|---|---|---|---|
| Route 1 | 83.50 | 0.61 | 7.91 | 2.82 | 4.38 | 0.78 |
| Route 2 | 86.77 | 0.64 | 6.56 | 2.08 | 3.13 | 0.82 |
| Project | Unit | Route 1 | Route 2 |
|---|---|---|---|
| Reducing gas temperature | °C | 1000 | 1000 |
| Metallization ratio | - | 0.75 | 0.90 |
| Pellet ratio | kg/tHM | 1824 | 1824 |
| DRI temperature | °C | 800 | 800 |
| Project | Unit | Route 1 | Route 2 |
|---|---|---|---|
| Coke ratio | kg/tHM | 380.00 | 320.00 |
| Hot metal temperature | °C | 1450 | 1450 |
| Slag temperaure | °C | 1500 | 1500 |
| DRI charging temperature | °C | 800 | 800 |
| Coke charging tempareture | °C | 25 | 25 |
| Oxygen blast temperature | °C | 25 | 25 |
| Recycling gas blast temperature | °C | 1200 | 1200 |
| Component of melting furnace top gas | ||||||
| CO | CO2 | H2 | H2O | N2 | Sum | |
| Nm3/tHM | 1331.21 | 0 | 0.01 | 0 | 85.31 | 1416.53 |
| % | 93.97 | 0 | 0.00 | 0 | 6.02 | 100 |
| Component of hot stove reducing gas | ||||||
| CO | CO2 | H2 | H2O | N2 | Sum | |
| Nm3/tHM | 2045.07 | 0 | 0.02 | 0 | 192.22 | 2237.31 |
| % | 91.41 | 0 | 0.00 | 0 | 8.59 | 100 |
| Component of pre-reduction furnace reducing gas | ||||||
| CO | CO2 | H2 | H2O | N2 | Sum | |
| Nm3/tHM | 1470.34 | 0 | 0.01 | 0 | 129.65 | 1600 |
| % | 91.90 | 0 | 0.00 | 0 | 8.10 | 100 |
| Component of pre-reduction furnace top gas | ||||||
| CO | CO2 | H2 | H2O | N2 | Sum | |
| Nm3/tHM | 1035.61 | 434.73 | 0.01 | 0 | 129.65 | 1600 |
| % | 64.73 | 27.17 | 0 | 0 | 8.1 | 100 |
| Component of pre-reduction furnace top gas with decarburization, dehydration, and dedust processes | ||||||
| CO | CO2 | H2 | H2O | N2 | Sum | |
| Nm3/tHM | 1035.61 | 0 | 0.00 | 0 | 129.65 | 1165.26 |
| % | 88.87 | 0 | 0.00 | 0 | 11.13 | 100 |
| Gas destination in PLCsmelt process | ||||||
| Sources | Destination | Flow Rate/(Nm3/tHM) | ||||
| 1 | Decarburized pre-reduction furnace top gas | Hot stove | 1125.59 | |||
| 2 | Decarburized melting furnace top gas | Hot stove | 1111.72 | |||
| 3 | Decarburized melting furnace top gas | Pre-reduction furnace | 304.40 | |||
| 4 | Hot stove | Pre-reduction furnace | 1295.60 | |||
| 5 | Hot stove | Melting furnace | 941 | |||
| 6 | Emission of decarburized pre-reduction furnace top gas | Pipe network | 40 | |||
| Melting parameters of melting furnace | ||||||
| Unit | Value | |||||
| Top gas temperature | °C | 727.39 | ||||
| Pure oxygen flow rate | Nm3/tHM | 221.58 | ||||
| Reducing gas flow rate | °C | 941 | ||||
| Utilization of CO | % | 2.77 | ||||
| Utilization of H2 | % | 0.00 | ||||
| CO2 emission | Nm3/tHM | 37.87 | ||||
| Melting parameters of pre-reduction furnace | ||||||
| Project | Unit | Value | ||||
| Top gas temperature | K | 720 | ||||
| Top gas flow rate | Nm3/tHM | 1600 | ||||
| Utilization of CO | % | 29.56 | ||||
| Utilization of H2 | % | 0 | ||||
| CO2 emission | Nm3/tHM | 434.72 | ||||
| Component of melting furnace top gas | ||||||
| CO | CO2 | H2 | H2O | N2 | Sum | |
| Nm3/tHM | 1321.51 | 18.9 | 0 | 0 | 9.59 | 1350.00 |
| % | 97.89 | 1.40 | 0.00 | 0.00 | 0.71 | 100.00 |
| Component of hot stove reducing gas | ||||||
| CO | CO2 | H2 | H2O | N2 | Sum | |
| Nm3/tHM | 475.12 | 0.00 | 1011.11 | 0.00 | 135.00 | 1621.23 |
| % | 29.31 | 0.00 | 62.37 | 0.00 | 8.33 | 100.00 |
| Component of pre-reduction furnace reducing gas | ||||||
| CO | CO2 | H2 | H2O | N2 | Sum | |
| Nm3/tHM | 652.02 | 0 | 1011.11 | 0 | 136.87 | 1800 |
| % | 36.22 | 0.00 | 56.17 | 0.00 | 7.60 | 100 |
| Component of pre-reduction furnace top gas | ||||||
| CO | CO2 | H2 | H2O | N2 | Sum | |
| Nm3/tHM | 447.81 | 204.21 | 725.32 | 285.79 | 136.87 | 1800 |
| % | 24.88 | 11.34 | 40.3 | 15.88 | 7.6 | 100 |
| Component of pre-reduction furnace top gas with decarburization, dehydration, and dedust processes | ||||||
| CO | CO2 | H2 | H2O | N2 | Sum | |
| Nm3/tHM | 447.81 | 0 | 725.32 | 0 | 136.87 | 1310 |
| % | 34.18 | 0 | 55.37 | 0 | 10.45 | 100 |
| Gas destination in PLCsmelt process | ||||||
| Sources | Destination | Flow Rate/(Nm3/tHM) | ||||
| 1 | Decarburized pre-reduction furnace top gas | Hot Stove 1 | 1021 | |||
| 2 | COG | Hot Stove 1 | 362.83 | |||
| 3 | Decarburized melting furnace top gas | Pre-reduction furnace | 178.77 | |||
| 4 | Hot Stove 1 | Pre-reduction furnace | 1621.23 | |||
| 5 | Hot Stove 2 | Melting furnace | 915 | |||
| 6 | Decarburized melting furnace top gas | Pipe network | 241 | |||
| 7 | Decarburized pre-reduction furnace top gas | Pipe network | 289 | |||
| Melting parameters of melting furnace | ||||||
| Project | Unit | Value | ||||
| Top gas temperature | °C | 784.93 | ||||
| Pure oxygen flow rate | Nm3/tHM | 193.63 | ||||
| Reducing gas flow rate | Nm3/tHM | 915 | ||||
| Utilization of CO | % | 1.41 | ||||
| Utilization of H2 | % | 0.00 | ||||
| CO2 emission | Nm3/tHM | 18.93 | ||||
| Melting parameters of pre-reduction furnace | ||||||
| Project | Unit | Value | ||||
| Top gas temperature | K | 575 | ||||
| Top gas flow rate | Nm3/tHM | 1800 | ||||
| Utilization of CO | % | 31.32 | ||||
| Utilization of H2 | % | 28.26 | ||||
| CO2 emission | Nm3/tHM | 204.20 | ||||
| Component of melting furnace top gas with decarburization, dehydration, and dedusting processes/% | |||||
| Reducing gas flow rate/(Nm3/tHM) | CO | CO2 | H2 | H2O | N2 |
| 1600 | 97.89 | 1.40 | 0.00 | 0.00 | 0.71 |
| 1700 | 97.89 | 1.40 | 0.00 | 0.00 | 0.71 |
| 1800 | 97.89 | 1.40 | 0.00 | 0.00 | 0.71 |
| 1900 | 97.89 | 1.40 | 0.00 | 0.00 | 0.71 |
| 2000 | 97.89 | 1.40 | 0.00 | 0.00 | 0.71 |
| Component of Hot Stove 1 reducing gas/% | |||||
| Reducing gas flow rate/(Nm3/tHM) | CO | CO2 | H2 | H2O | N2 |
| 1600 | 27.47 | 0.00 | 63.58 | 0.00 | 8.95 |
| 1700 | 28.28 | 0.00 | 62.85 | 0.00 | 8.87 |
| 1800 | 29.31 | 0.00 | 62.37 | 0.00 | 8.33 |
| 1900 | 29.89 | 0.00 | 61.45 | 0.00 | 8.67 |
| 2000 | 30.68 | 0.00 | 60.77 | 0.00 | 8.55 |
| Component of pre-reduction furnace reducing gas/% | |||||
| Reducing gas flow rate/(Nm3/tHM) | CO | CO2 | H2 | H2O | N2 |
| 1600 | 34.56 | 0.00 | 57.27 | 0.00 | 8.17 |
| 1700 | 35.30 | 0.00 | 56.61 | 0.00 | 8.09 |
| 1800 | 36.22 | 0.00 | 56.17 | 0.00 | 7.60 |
| 1900 | 36.75 | 0.00 | 55.34 | 0.00 | 7.91 |
| 2000 | 37.47 | 0.00 | 54.73 | 0.00 | 7.80 |
| Component of pre-reduction furnace top gas/% | |||||
| Reducing gas flow rate/(Nm3/tHM) | CO | CO2 | H2 | H2O | N2 |
| 1600 | 21.89 | 12.68 | 38.17 | 19.1 | 8.16 |
| 1700 | 23.11 | 11.95 | 38.89 | 17.72 | 8.09 |
| 1800 | 24.88 | 11.34 | 40.3 | 15.88 | 7.6 |
| 1900 | 25.41 | 10.88 | 40.93 | 15.41 | 7.37 |
| 2000 | 26.49 | 10.44 | 41.59 | 14.44 | 7.04 |
| Component of pre-reduction furnace top gas with decarburization, dehydration, and dedusting processes | |||||
| Reducing gas flow rate/(Nm3/tHM) | CO | CO2 | H2 | H2O | N2 |
| 1600 | 32.08 | 0 | 55.95 | 0 | 11.97 |
| 1700 | 32.97 | 0 | 55.48 | 0 | 11.55 |
| 1800 | 34.18 | 0 | 55.37 | 0 | 10.45 |
| 1900 | 34.68 | 0 | 54.51 | 0 | 10.81 |
| 2000 | 35.51 | 0 | 54.02 | 0 | 10.46 |
| Component of melting furnace top gas with decarburization, dehydration, and dedusting processes/% | |||||
| Coke ratio/(kg/tHM) | CO | CO2 | H2 | H2O | N2 |
| 300 | 97.71 | 1.52 | 0.00 | 0.00 | 0.77 |
| 310 | 97.80 | 1.46 | 0.00 | 0.00 | 0.74 |
| 320 | 97.89 | 1.40 | 0.00 | 0.00 | 0.71 |
| 330 | 97.97 | 1.35 | 0.00 | 0.00 | 0.69 |
| 340 | 98.04 | 1.30 | 0.00 | 0.00 | 0.66 |
| Component of Hot Stove 1 reducing gas/% | |||||
| Coke ratio/(kg/tHM) | CO | CO2 | H2 | H2O | N2 |
| 300 | 29.29 | 0.00 | 62.35 | 0.00 | 8.36 |
| 310 | 29.30 | 0.00 | 62.36 | 0.00 | 8.34 |
| 320 | 29.31 | 0.00 | 62.37 | 0.00 | 8.33 |
| 330 | 29.31 | 0.00 | 62.37 | 0.00 | 8.31 |
| 340 | 29.32 | 0.00 | 62.38 | 0.00 | 8.30 |
| Component of pre-reduction furnace reducing gas/% | |||||
| Coke ratio/(kg/tHM) | CO | CO2 | H2 | H2O | N2 |
| 300 | 36.20 | 0.00 | 56.16 | 0.00 | 7.64 |
| 310 | 36.21 | 0.00 | 56.17 | 0.00 | 7.62 |
| 320 | 36.22 | 0.00 | 56.17 | 0.00 | 7.60 |
| 330 | 36.23 | 0.00 | 56.18 | 0.00 | 7.59 |
| 340 | 36.25 | 0.00 | 56.18 | 0.00 | 7.57 |
| Component of pre-reduction furnace top gas/% | |||||
| Coke ratio/(kg/tHM) | CO | CO2 | H2 | H2O | N2 |
| 300 | 24.85 | 11.34 | 40.28 | 15.88 | 7.64 |
| 310 | 24.87 | 11.34 | 40.29 | 15.88 | 7.62 |
| 320 | 24.88 | 11.34 | 40.3 | 15.88 | 7.6 |
| 330 | 24.89 | 11.35 | 40.3 | 15.88 | 7.59 |
| 340 | 24.9 | 11.35 | 40.31 | 15.87 | 7.57 |
| Component of pre-reduction furnace top gas with decarburization, dehydration, and dedusting processes | |||||
| Coke ratio/(kg/tHM) | CO | CO2 | H2 | H2O | N2 |
| 300 | 34.15 | 0 | 55.35 | 0 | 10.50 |
| 310 | 34.17 | 0 | 55.36 | 0 | 10.47 |
| 320 | 34.18 | 0 | 55.37 | 0 | 10.45 |
| 330 | 34.20 | 0 | 55.38 | 0 | 10.42 |
| 340 | 34.21 | 0 | 55.39 | 0 | 10.40 |
| Project | Carbon Emission Factor |
|---|---|
| Energy consumption in pellet production | 2.69 |
| Energy consumption in sinter production | 2.69 |
| Energy consumption in coke production | 2.69 |
| Coke | 3.257 |
| Semi-coke | 2.70 |
| Coal | 2.87 |
| Electric | 0.581 |
| Coke oven gas | 0.635 |
| Hot metal | 0.16 |
| TRT electric recycling | 0.36 |
| Top gas of TBF | 0.357 |
| Top gas of PLC | 0.885 |
| DRI | 0.037 |
| Top gas of SF | 0.387 |
| Anthracite of HISMELT | 2.995 |
| Soft coal of HISMELT | 2.784 |
| Top gas of HISMELT | 0.223 |
| Hot metal of HISMELT | 0.147 |
| Coke of FINEX | 2.54 |
| Coal of FINEX | 2.784 |
| Top gas of FINEX | 0.409 |
Disclaimer/Publisher’s Note: The statements, opinions and data contained in all publications are solely those of the individual author(s) and contributor(s) and not of MDPI and/or the editor(s). MDPI and/or the editor(s) disclaim responsibility for any injury to people or property resulting from any ideas, methods, instructions or products referred to in the content. |
© 2025 by the authors. Licensee MDPI, Basel, Switzerland. This article is an open access article distributed under the terms and conditions of the Creative Commons Attribution (CC BY) license (https://creativecommons.org/licenses/by/4.0/).
Share and Cite
Huang, Y.; Tang, J.; Chu, M. Modeling and Carbon Emission Assessment of Novel Low-Carbon Smelting Process for Vanadium–Titanium Magnetite. Metals 2025, 15, 461. https://doi.org/10.3390/met15040461
Huang Y, Tang J, Chu M. Modeling and Carbon Emission Assessment of Novel Low-Carbon Smelting Process for Vanadium–Titanium Magnetite. Metals. 2025; 15(4):461. https://doi.org/10.3390/met15040461
Chicago/Turabian StyleHuang, Yun, Jue Tang, and Mansheng Chu. 2025. "Modeling and Carbon Emission Assessment of Novel Low-Carbon Smelting Process for Vanadium–Titanium Magnetite" Metals 15, no. 4: 461. https://doi.org/10.3390/met15040461
APA StyleHuang, Y., Tang, J., & Chu, M. (2025). Modeling and Carbon Emission Assessment of Novel Low-Carbon Smelting Process for Vanadium–Titanium Magnetite. Metals, 15(4), 461. https://doi.org/10.3390/met15040461


