Article

Modeling and Carbon Emission Assessment of Novel Low-Carbon Smelting Process for Vanadium–Titanium Magnetite

1
Pangang Group Xichang Steel Vanadium Co., Ltd., Xichang 615032, China
2
School of Metallurgy, Northeastern University, 3-11 Wenhua Road, Heping District, Shenyang 110819, China
3
Engineering Research Center of Frontier Technologies for Low-Carbon Steelmaking (Ministry of Education), Shenyang 110819, China
*
Author to whom correspondence should be addressed.
Metals 2025, 15(4), 461; https://doi.org/10.3390/met15040461
Submission received: 26 February 2025 / Revised: 8 April 2025 / Accepted: 17 April 2025 / Published: 19 April 2025
(This article belongs to the Special Issue Modern Techniques and Processes of Iron and Steel Making)

Abstract

The iron and steel industry, as a major energy consumer, was critically required to enhance operational efficiency and reduce CO2 emissions. Conventional blast furnace processing of vanadium–titanium magnetite (VTM) in China had been associated with persistent challenges, including suboptimal TiO2 recovery rates (<50%) and elevated carbon intensity (the optimal temperature range for TiO2 recovery lies within 1400–1500 °C). Shaft furnace technology has emerged as a low-carbon alternative, offering accelerated reduction kinetics, operational flexibility, and reduced environmental impact. This study evaluated the low-carbon PLCsmelt process for VTM smelting through energy–mass balance modeling, comparing two gas-recycling configurations. The process integrates a pre-reduction shaft furnace and a melting furnace, where oxidized pellets are initially reduced to direct reduced iron (DRI) before being smelted into hot metal. In Route 1, CO2 emissions of 472.59 Nm3/tHM were generated by pre-reduction gas (1600 Nm3/tHM, 64.73% CO, and 27.17% CO2) and melting furnace top gas (93.98% CO). Route 2 incorporated hydrogen-rich gas through the blending of coke oven gas with recycled streams, achieving a 56.8% reduction in CO2 emissions (204.20 Nm3/tHM) and altering the pre-reduction top gas composition to 24.88% CO and 40.30% H2. Elevating the pre-reduction gas flow in Route 2 resulted in increased CO concentrations in the reducing gas (34.56% to 37.47%) and top gas (21.89% to 26.49%), while gas distribution rebalancing reduced melting furnace top gas flow from 261.03 to 221.93 Nm3/tHM. The results demonstrated that the PLCsmelt process significantly lowered carbon emissions without compromising metallurgical efficiency (CO2 decreased about 74.48% compared with traditional blast furnace which was 800 Nm3/tHM), offering a viable pathway for sustainable VTM utilization.

1. Introduction

The critical role of carbon dioxide (CO2) in driving global warming has been widely acknowledged, with its impacts recognized as a major future threat posing significant challenges to human survival and societal development. In response, a reduction in CO2 emissions has become a central research priority for climate change mitigation. As one of the most energy-intensive industries, the improvement of productivity and energy efficiency at steel works has become a social obligation for the iron–steel-making industry [1,2]. Blast furnace (BF) operations, representing the most energy-intensive stage of steel production, account for approximately 69% of the industry’s total energy consumption and 73% of its CO2 emissions [3,4,5,6]. Consequently, decarbonizing BF operations has been identified as a critical pathway for achieving sustainable development in the iron and steel industry [7,8].
Vanadium–titanium magnetite (VTM) has been recognized as a strategically significant resource due to its abundant global reserves, with major deposits distributed across South Africa, Russia, China, Canada, and the United States [9,10,11,12]. Characterized by poor mineral liberation, fine grain size, and complex composition, VTM presents significant smelting challenges, resulting in historically underdeveloped resource utilization efficiency [13,14]. In China, the conventional blast furnace–basic oxygen furnace (BF–BOF) process has remained predominant for VTM processing. However, limitations such as low TiO2 recovery rates, suboptimal resource efficiency, and high carbon emissions associated with BF operations has become increasingly apparent during industrial implementation [15,16,17]. Consequently, the development of innovative smelting methodologies combining reduced carbon footprints with enhanced process efficiency has been identified as a critical industrial priority.
The shaft furnace has been recognized as an innovative low-carbon ironmaking process, distinguished by rapid reduction kinetics, uniform product quality, reduced environmental footprints, and operational flexibility [18,19,20,21]. In this system, the oxidized pellets were introduced into the furnace and reduced by high-temperature reducing gases. Numerous studies have been conducted to optimize shaft furnace performance. Yuki Iwai et al. developed a mathematical model to predict coke consumption rates by incorporating coke gasification kinetics under elevated temperatures [22]. The effects of gas flow patterns, furnace geometry (height, diameter, and bosh angle), and particle descent dynamics were investigated by Xu et al. using discrete element modeling. Their findings indicated that uniform particle velocity distributions were achieved by increasing furnace height or diameter, or by reducing the bosh angle [23]. Further optimization of gas flow rates and pellet sizing was performed by Liu et al. through computational fluid dynamics (CFD) simulations integrated with Rist operational line analysis [24]. Additional studies have corroborated the technical viability of shaft furnaces, highlighting their potential for industrial scalability [25,26,27]. Despite these advancements, systematic research on the application of shaft furnace technology to VTM smelting has remained critically underdeveloped, necessitating focused investigation to address unique compositional challenges.
A novel low-carbon VTM smelting process, termed PLCsmelt, was investigated through energy and mass balance modeling. Material and energy flows within the PLCsmelt system were quantified via material–energy balance modeling. Carbon emission pathways were systematically analyzed to assess smelting efficiency and carbon footprint under the proposed configuration with the pre-reducing gas temperature 800~1200 °C and melting furnace reducing gas temperature 1200 °C. Process parameters (such as reducing gas flow and melting furnace coke ratio) were optimized, with subsequent parametric analyses evaluating the influence of smelting furnace coke ratios and pre-reduction furnace gas flow rates on operational stability and emission profiles. An optimized process configuration was ultimately developed, achieving balanced metallurgical performance alongside minimized carbon emissions.

2. Research Method

2.1. Introduction of the Novel Low-Carbon Process

To advance the green and efficient smelting of VTM, a novel low-carbon methodology termed the PLCsmelt process was developed in this study. The system incorporated a pre-reduction furnace and a melting furnace as its core components. Within the PLCsmelt framework, oxidized pellets were charged into the pre-reduction furnace to produce direct reduced iron (DRI) with a targeted metallization rate. The DRI was subsequently subjected to deep reduction in the melting furnace, yielding molten iron. Partial top gases generated by the pre-reduction and melting furnaces were recycled following decarburization and dedusting treatments, while residual gases were diverted to a gas distribution network. Compared to conventional blast furnace operations, the PLCsmelt system demonstrated several advantages.
(1) Reduction in smelting furnace burden: The charge column height within the smelting furnace was reduced, diminishing skeletal load pressures on the furnace structure. This modification enabled the substitution of high-quality metallurgical coke with alternative carbonaceous materials, including formed coke, coke nuts, and lump coal. (2) Enhanced indirect reduction in the pre-reduction furnace: Indirect reduction of pellets was predominantly completed within the pre-reduction furnace, where gas composition was optimized through precise control mechanisms. Hydrogen-rich gas with elevated H2 ratios was prioritized to mitigate carbon emissions during this stage. (3) Optimized internal gas utilization: A self-sustaining gas network was established, wherein the primary reducing gas was supplied via internal recirculation. This strategy enabled the efficient reuse of smelting-derived top gas, significantly reducing direct emission-related environmental risks. (4) Comparison with the shaft furnace process: The PLCsmelt process ensures controlled metallization rates in pre-reduced pellets (achieved via the pre-reduction furnace), effectively avoiding pulverization issues caused by over-reduction. Additionally, its adjustable operational parameters provide enhanced flexibility for optimizing smelting performance under varying feedstock conditions.
The preliminary configuration of the PLCsmelt process (Route 1) was illustrated in Figure 1a. In this configuration, reducing gas was derived from a blend of pre-reduction and smelting furnace top gases. Following the thermal treatment, the gas was recirculated into both units. Prior to introduction into the pre-reduction furnace, minor quantities of smelting furnace top gas were blended with the reducing gas to modulate its thermal profile. However, this arrangement exhibited limited process adaptability between the two furnaces. Furthermore, the cyclical gas enrichment resulted in elevated carbon concentrations within the reducing gas, culminating in increased CO2 emissions (the reducing gas in Route 1 is composed almost entirely of carbon-based gases).
To address the carbon emissions associated with Route 1, an optimized configuration (Route 2) was developed as illustrated in Figure 1b. In Route 2, operational independence between the pre-reduction and smelting furnaces was enhanced. The reducing gas for the smelting furnace was supplied exclusively by its own top gas, which was thermally conditioned in a dedicated hot blast stove. Conversely, the pre-reduction furnace reducing gas was blended from its top gas, externally sourced coke oven gas, and a minor fraction of decarbonized smelting furnace top gas. The incorporation of coke oven gas substantially elevated the H2 concentration in the pre-reduction furnace gas, thereby mitigating CO2 emissions from this process stage, which represented the system’s primary emission source.

2.2. Modeling Approach of the Novel Low-Carbon Process

The PLCsmelt mathematical framework comprised three integrated components: pre-reduction furnace model, melting furnace model, and gas-recycling model. The computational model incorporates the following assumptions:
Pre-reduction Shaft Furnace: (1) The metallization rate is assumed as 75% for Route 1 and 90% for Route 2; (2) the initial reducing gas flow rate is determined based on industrial shaft furnace data (2000 Nm3/tHM for 95% metallization), with Route 1 set to 1600 Nm3/tHM and Route 2 to 1800 Nm3/tHM; (3) heat loss in the pre-reduction furnace is assumed to be 8% of total thermal input; (4) carburization by CO is assumed to occur exclusively in the cooling zone; thus, no carburization reactions are considered in the pre-reduction stage.
Melting Furnace: (1) Heat loss accounts for 12% of the total thermal energy input to the melting furnace; (2) direct reduction contributes two-thirds of iron reduction, while indirect reduction accounts for one-third; (3) metallized pellets enter the melting furnace at a temperature of 800 °C.
The methodological development of these subsystems proceeded as follows:
(1)
Energy–mass balance modeling of the pre-reduction furnace
A computational submodule was developed to quantify energy and mass balances within the pre-reduction furnace under thermodynamic equilibrium constraints. The primary chemical reactions occurring within the furnace were identified (Table 1), forming the basis for equilibrium calculations.
The mass of oxidized pellets required for the production of one metric ton of metallized iron was determined through Equation (1).
G DRI = ( G pellet G dust ) × [ ( T Fe % ) pellet × M + ( T Fe % ) pellet × 72 × ( 1 M ) 56 + ( 1 ( Fe 2 O 3 % ) pellet ( FeO % ) pellet ) ) ] + ( G C ) DRI
The furnace dust mass Gdust was quantified as 1% of the oxidized pellets’ total mass. Top gas compositions were determined through Equations (2)–(5).
V CO ( top ) = V CO ( in ) V CO ( water - gas ) V CO ( con )
V CO 2 ( top ) = V CO 2 + ( in ) V CO 2 + ( water - gas ) V CO 2 ( con )
V H 2 ( top ) = V H 2 ( in ) V H 2 ( water - gas ) V H 2 ( con )
V H 2 O ( top ) = V H 2 O + ( in ) V H 2 O + ( con ) V H 2 O ( water - gas )
CO consumption and CO2 production were quantified using Equation (6), while H2 consumption and H2O production were determined through Equation (7).
V CO ( con ) = V CO 2 ( pro ) = x CO ( in ) η CO η × [ 1 . 5 × ( MFe % ) DRI × 10 3 56 + 0 . 5 × ( FeO % ) DRI × 10 3 72 0 . 5 × 0.99 × ( FeO % ) pellet × G pellet 72 ] × 22 . 4
V H 2 ( con ) = V H 2 O ( pro ) = x H 2 ( in ) η H 2 η × [ 1 . 5 × ( MFe % ) DRI × 10 3 56 + 0 . 5 × ( FeO % ) DRI × 10 3 72 0 . 5 × 0.99 × ( FeO % ) pellet × G pellet 72 ] × 22 . 4
The consumption and production of reducing gas during the water–gas reaction were determined using Equations (8)–(10). Coupling Equations (2)–(10), the top gas components and volume could be calculated.
( x H 2 ( in ) Δ x water - gas ) ( x CO 2 ( in ) Δ x water - gas ) ( x H 2 O ( in ) + Δ x water - gas ) ( x CO ( in ) + Δ x water - gas ) = K water - gas
V H 2 = ( water - gas ) V H 2 O = ( water - gas ) Δ x water gas V in
V CO = ( water - gas ) V CO 2 = ( water - gas ) Δ x water - gas V in
The heat input to the pre-reduction furnace was derived from the thermal contributions of the reducing gas and oxidized pellets. For this study, the oxidized pellet input temperature was maintained at 298 K, resulting in negligible pellet thermal input (0 kJ), as defined by Equation (11). The reducing gas thermal contribution was calculated using Equation (12).
Q pellet = ( C i ) pellet × ( n i ) pellet × ( T pellet 298 ) = 0   kJ  
Q in = C in × V in 22.4 × ( T in 298 ) = V in 22.4 × C i ( T in ) × x i × ( in ) ( T in 298 )
The heat output of the pre-reduction furnace was composed of the thermal energy of the top gas, direct reduced iron (DRI), and furnace dust, alongside heat absorption from reduction reactions. The reduction-related heat absorption was attributed to CO and H2 reduction reactions and the water–gas reaction, as determined by Equations (13)–(15). The thermal energy contributions of the top gas, DRI, and dust were calculated using Equations (16)–(18).
Q con = n con × Δ H T θ = n con × ( Δ H 298 θ + [ m i ( H T θ H 298 θ ) i ] pro [ m i ( H T θ H 298 θ ) i ] con )
V H 2 ( Fe 2 O 3 - Fe ) = x H 2 ( in ) η H 2 η × [ 1 . 5 × ( MFe % ) DRI × 10 3 56 ] × 22 . 4
V CO ( Fe 2 O 3 - Fe ) = x CO ( in ) η CO η × [ 1 . 5 × ( MFe % ) DRI × 10 3 56 ] × 22 . 4
Q top = C top × V top 22.4 × ( T top 298 ) = V top 22.4 × C i ( T top ) × ( T top 298 )
Q DRI = ( C i ) DRI × ( n i ) DRI × ( T DRI 298 )  
Q dust = ( C i ) dust × ( n i ) dust × ( T top 298 )
(2)
The energy and mass balance model of melting furnace
A computational submodule was developed to quantify energy and mass balances within the melting furnace. The model was constructed based on elemental balances (O, N, H, and C). Inputs to the furnace consisted of ore, pure oxygen, coke, and recycled gas, while outputs included top gas, hot metal, and slag. The oxygen mass balance (Table 2) demonstrated that oxygen entered the system via ore, pure oxygen, coke, and recycled gas while being discharged via top gas and slag. The carbon mass balance was summarized in Table 3. Carbon was introduced into the melting furnace through coke and recycled gas, while being discharged via top gas and hot metal. The hydrogen mass balance was summarized in Table 4. Hydrogen was introduced into the melting furnace through recycled gas while being discharged via top gas.
The energy budget of the melting furnace was analyzed through a heat balance study. This methodological framework was founded on the principle of material–energy conservation, stipulating that total thermal inputs equal total heat consumption. Thermal inputs and outputs were computed based on furnace charge morphology and thermal effects associated with direct reduction, indirect reduction, and water–gas reactions. Using material balance results as the foundation, the energy budget was evaluated with a reference temperature of 25 °C. The heat balance was determined through Equations (19)–(27).
Q rec = C rec × V rec 22.4 × ( T rec 298 ) = V rec 22.4 × C i ( T rec ) × x i × ( rec ) ( T rec 298 )
Q DRI = ( C i ) DRI × ( n i ) DRI × ( T DRI 298 )
Q oxygen = ( C i ) oxygen × ( n i ) oxygen × ( T oxygen 298 )
Q coke = ( C i ) coke × ( n i ) coke × ( T coke 298 ) = 0
Q con = n con × Δ H T θ = n con × ( Δ H 298 θ + [ m i ( H T θ H 298 θ ) i ] pro [ m i ( H T θ H 298 θ ) i ] con )
Q top = C top × V top 22.4 × ( T top 298 ) = V top 22.4 × C i ( T top ) × ( T top 298 )
Q melt = ( C i ) melt × ( n i ) melt × ( T melt 298 )  
Q slag = ( C i ) slag × ( n i ) slag × ( T slag 298 )
Q loss = Q in × 0.08
(3)
The energy and mass balance model of melting furnace
The energy–mass balance model for the external gas network encompassed CO2 removal from pre-reduction and melting furnace top gases, reducing gas preheating, gas recirculation dynamics, and external supply equilibrium calculations. Within this framework, mass–energy equilibrium relationships were established for extra-furnace gas extraction, thermal conditioning, and distribution systems. Operational parameters, including circulating gas allocation between the pre-reduction and melting furnaces, as well as coke oven gas supplementation requirements, were determined. This subsystem served as the central integration node for the comprehensive process model, ensuring system-wide thermodynamic and material equilibrium.

3. Modeling Conditions

Given the extensive computational data generated by the energy–mass balance analyses, only key parameters were included for clarity. The vanadium–titanium magnetite composition was detailed in Table 5. Coke compositions for Routes 1 and 2 were provided in Table 6. Operational parameters for the pre-reduction and melting furnaces were summarized in Table 7 and Table 8, respectively.

4. Results and Discussions

The smelting parameters of the PLCsmelt process were determined using an energy–mass balance model under the input conditions of Routes 1 and 2. The process operated under dynamic equilibrium between the pre-reduction and melting furnaces. Steady-state conditions were achieved through iterative model refinement, with convergence defined by nitrogen equilibrium.

4.1. Energy and Mass Balance of Route 1

Route 1 calculation results were presented in Figure 2 and Table 9. The iterative modeling revealed that the reducing atmosphere in the pre-reduction and melting furnaces was predominantly composed of CO under steady-state conditions. Oxidized pellets were reduced to DRI at 800 °C, achieving a metallization ratio of 75%. The steady-state reducing gas in the pre-reduction furnace comprised 91.90% CO and 8.10% N2. CO utilization within the pre-reduction furnace was recorded at 29.56%, with the top gas exiting at 720 K. Following decarburization, dehydration, and dedusting treatments, 1125 Nm3/tHM of top gas was directed to the hot stove, with 40 Nm3/tHM diverted to the gas network.
DRI was introduced into the melting furnace at 800 °C and subsequently reduced to hot metal. A coke ratio of 380 kg/tHM was recorded, distributed as follows: 45.60 kg/tHM consumed in direct reduction, 45 kg/tHM dissolved into the hot metal, and 226.70 kg/tHM combusted in the hearth. Ash content from the coke (61.83 kg/tHM) contributed to slag formation. Melting furnace top gas exited at 1000.39 K, with post-treatment volumes measuring 1416.53 Nm3/tHM. Of this volume, 1111.72 Nm3/tHM was recycled to the hot stove, while 304.40 Nm3/tHM was blended with hot-stove-heated reducing gas.
The combined gas stream from both furnaces was thermally elevated to 1200 °C in the hot stove, with 941 Nm3/tHM injected into the melting furnace. The remaining 1295.69 Nm3/tHM was combined with 304.40 Nm3/tHM of melting furnace top gas to formulate the pre-reduction furnace’s reducing gas mixture.
According to Table 9, the CO2 emission of PLCsmelt process was 472.59 Nm3/tHM, which was higher than traditional BF (about 360 Nm3/tHM). To reduce the CO2 emission of PLCsmelt process, the smelting process should be optimized. Analyzing the trend of mass flow in Figure 2, the main source of CO2 was the emission of CO2 in the top gas of pre-reduction furnace. To reduce the CO2 emission of PLCsmelt, the components of pre-reduction furnace reducing gas was adjusted in Route 2.

4.2. Energy and Mass Balance in Route 2

As indicated in Table 9, the PLCsmelt process generated CO2 emissions of 472.59 Nm3/tHM, exceeding those of conventional blast furnaces (~360 Nm3/tHM). To mitigate this disparity, process optimizations were prioritized. Analysis of mass flow trends (Figure 2) revealed that the primary CO2 source originated from pre-reduction furnace top gas emissions. Consequently, the strategic adjustments to the pre-reduction furnace reducing gas composition were subsequently implemented in Route 2.
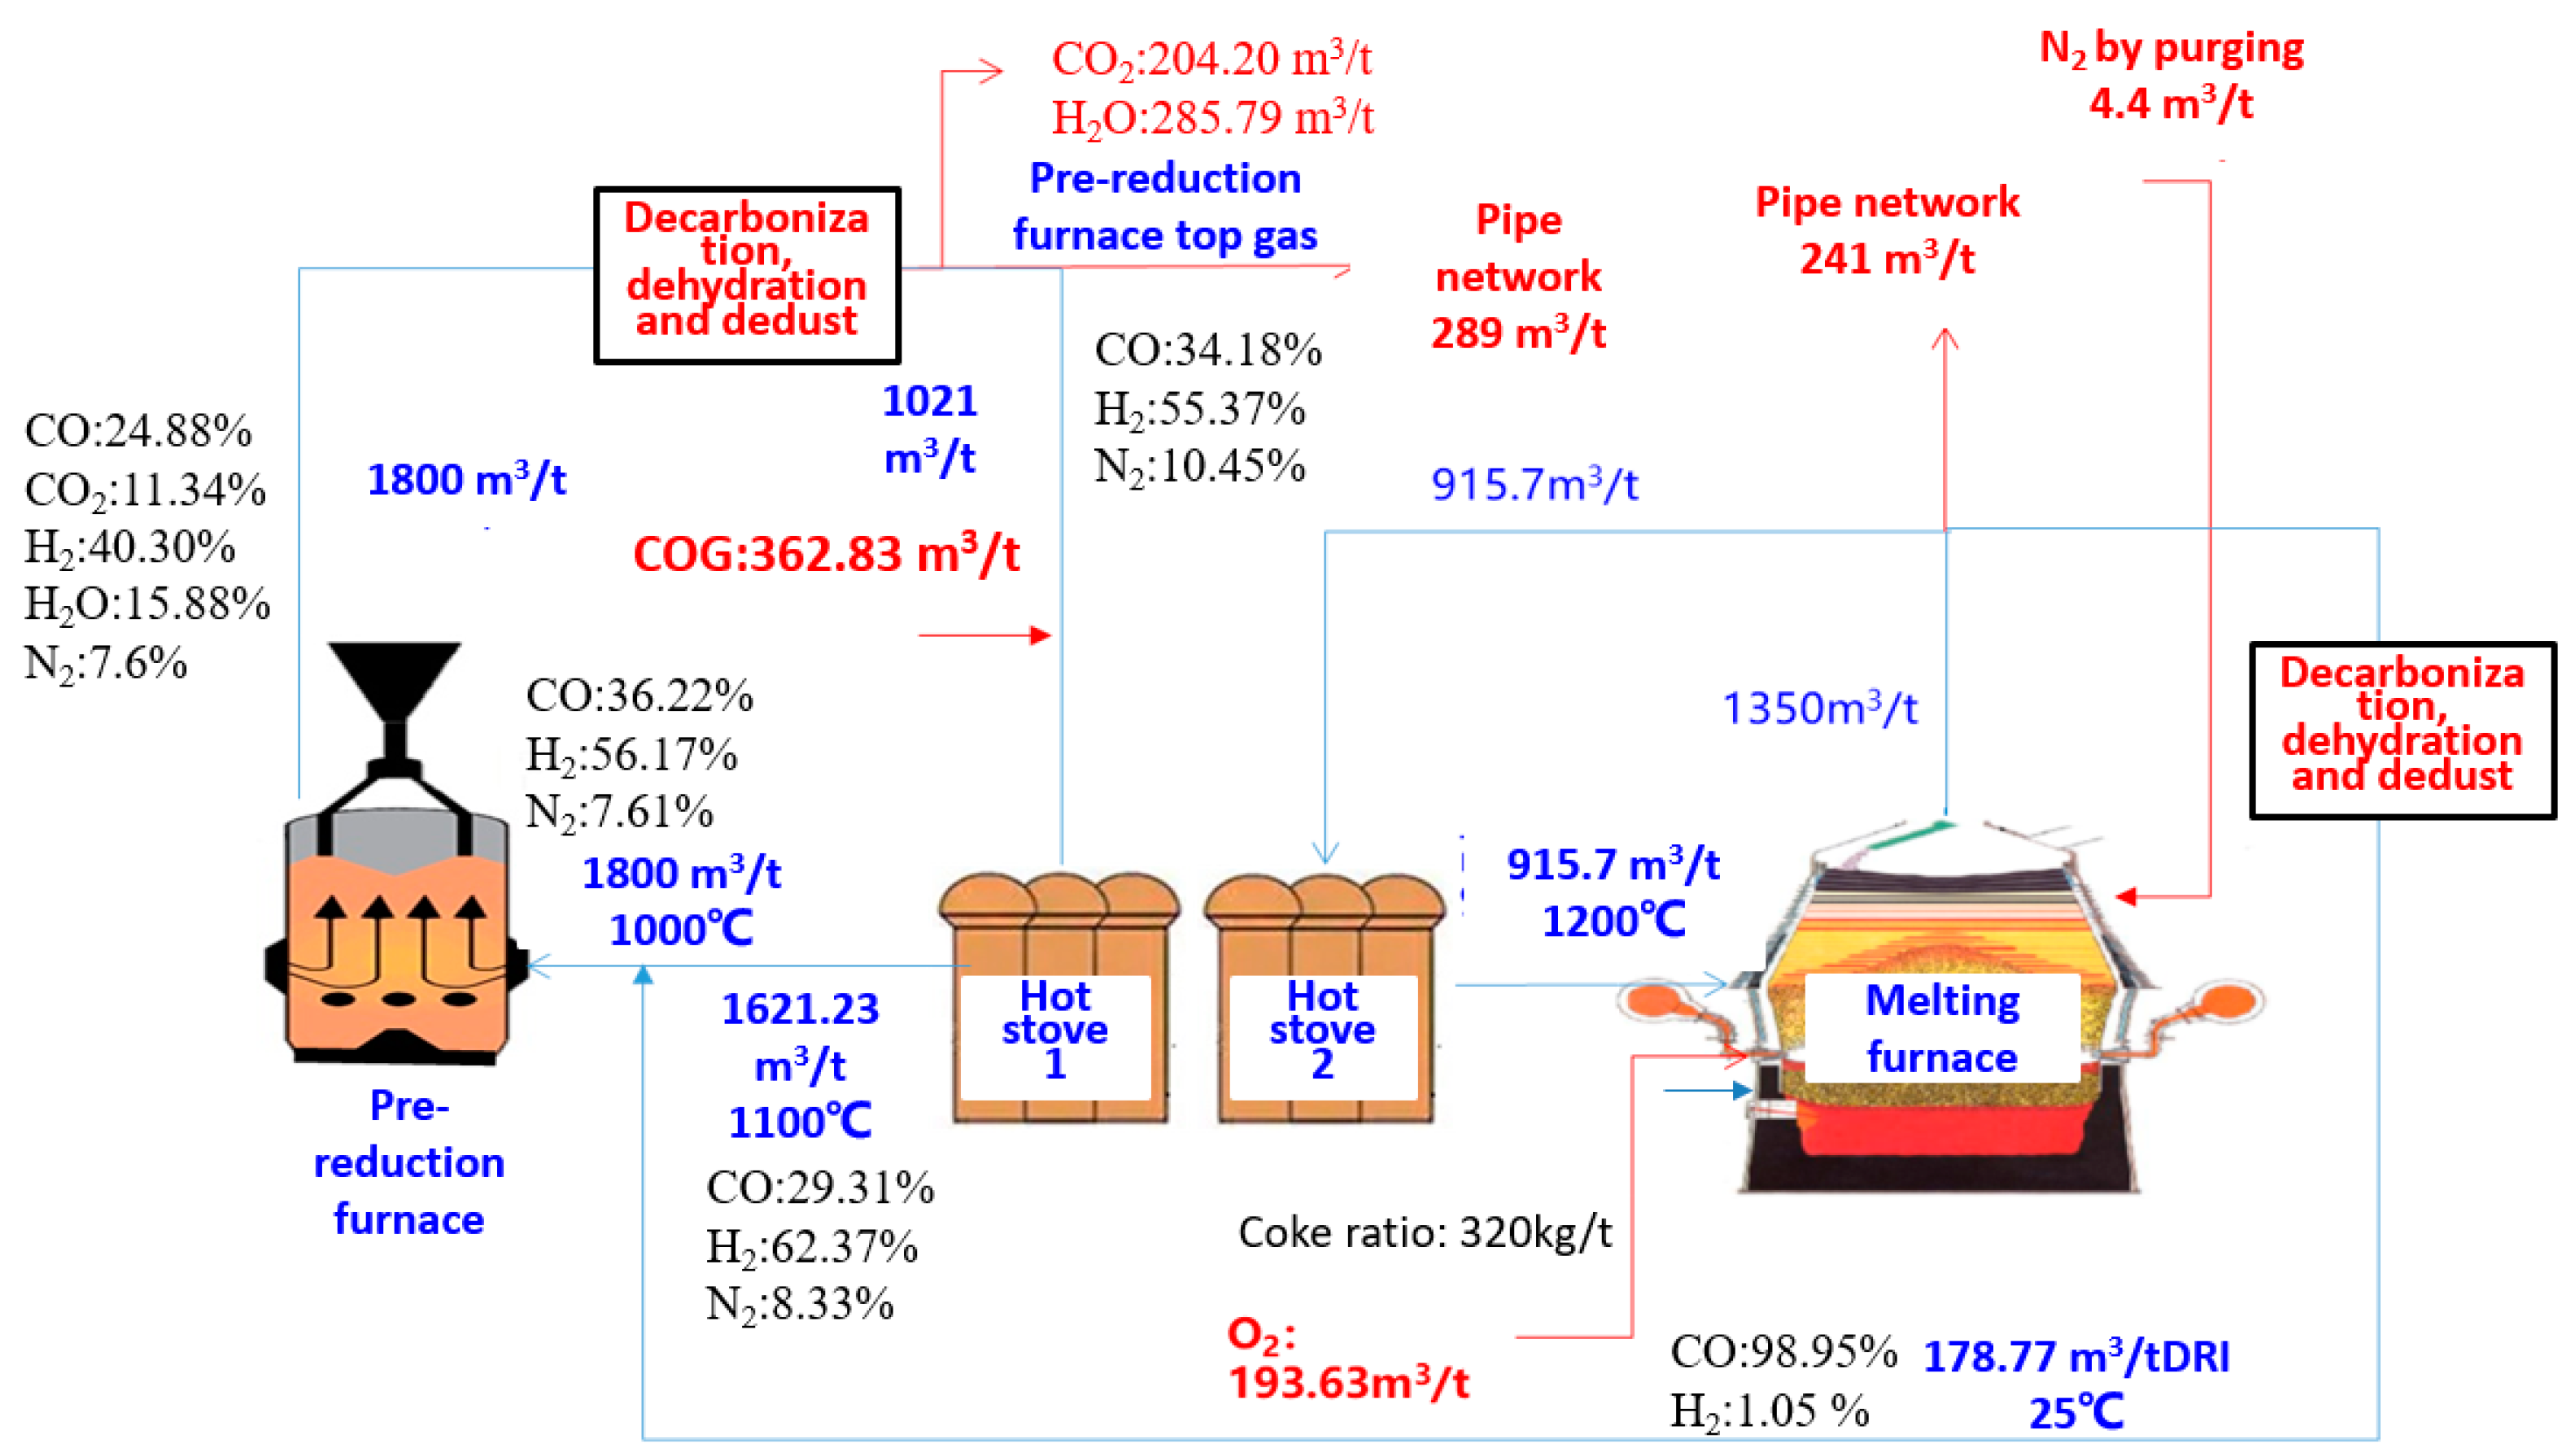
Route 2 modifications were illustrated in Figure 3, with steady-state results summarized in Table 10. To elevate hydrogen (H2) content in the pre-reduction furnace reducing gas, 362.63 Nm3/tHM of coke oven gas (COG) was injected into Hot Stove 1. This COG stream was blended with decarbonized, dehydrated, and dedusted pre-reduction furnace top gas and then thermally conditioned to 1100 °C. The heated gas was subsequently combined with treated melting furnace top gas to formulate the pre-reduction furnace’s reducing mixture.
Comparative analysis revealed that the reducing gas composition shifted markedly between Routes 1 and 2: CO content decreased from 91.90% to 36.22%, while H2 increased from 0% to 56.17%. Given the enhanced kinetics of H2-driven iron oxide reduction relative to CO, the oxidized pellet metallization ratio was elevated to 90%. CO and H2 utilization rates in the pre-reduction furnace were recorded at 31.32% and 28.26%, respectively, with top gas exiting at 575 K. During purification, 204.20 Nm3/tHM of CO2 and 285.79 Nm3/tHM of H2O were removed. Of the remaining gas, 260 Nm3/tHM was diverted to the pipeline network, while 1021 Nm3/tHM was recirculated via Hot Stove 1.
In the melting furnace, a reduced coke ratio of 320 kg/tHM—aligned with oxygen blast furnace benchmarks—was implemented. Coke allocation included 25.21 kg/tHM for direct reduction, 45 kg/tHM dissolved into hot metal, and 207.46 kg/tHM combusted in the hearth. Ash content (41.73 kg/tHM) contributed to slag formation. The melting furnace top gas exited at 784.93 °C (1350 Nm3/tHM), with 915.7 Nm3/tHM heated in Hot Stove 2 and recycled into the furnace. Residual gas (255.3 Nm3/tHM) was discharged to the pipeline network, while 178.77 Nm3/tHM was blended into the pre-reduction gas stream.
Route 2 demonstrated a significant reduction in CO2 emissions (223.13 Nm3/tHM) compared to Route 1, highlighting substantial decarbonization potential. This reduction was primarily attributed to the integration of hydrogen-rich reducing gas in the pre-reduction furnace. Firstly, the accelerated reduction kinetics of H2 relative to CO at elevated temperatures enhanced pre-reduction efficiency, simultaneously lowering CO concentrations in the top gas. Secondly, the elevated metallization ratio of pre-reduced pellets diminished direct reduction demands in the melting furnace, thereby reducing coke consumption associated with FeO reduction. Collectively, these methodological adjustments in Route 2 achieved dual benefits: a marked decrease in CO2 emissions and enhanced overall smelting efficiency.

4.3. Influence of Pre-Reduction Furnace Reducing Gas Flow Rate on Route 2 in Melting Parameters and Carbon Emission

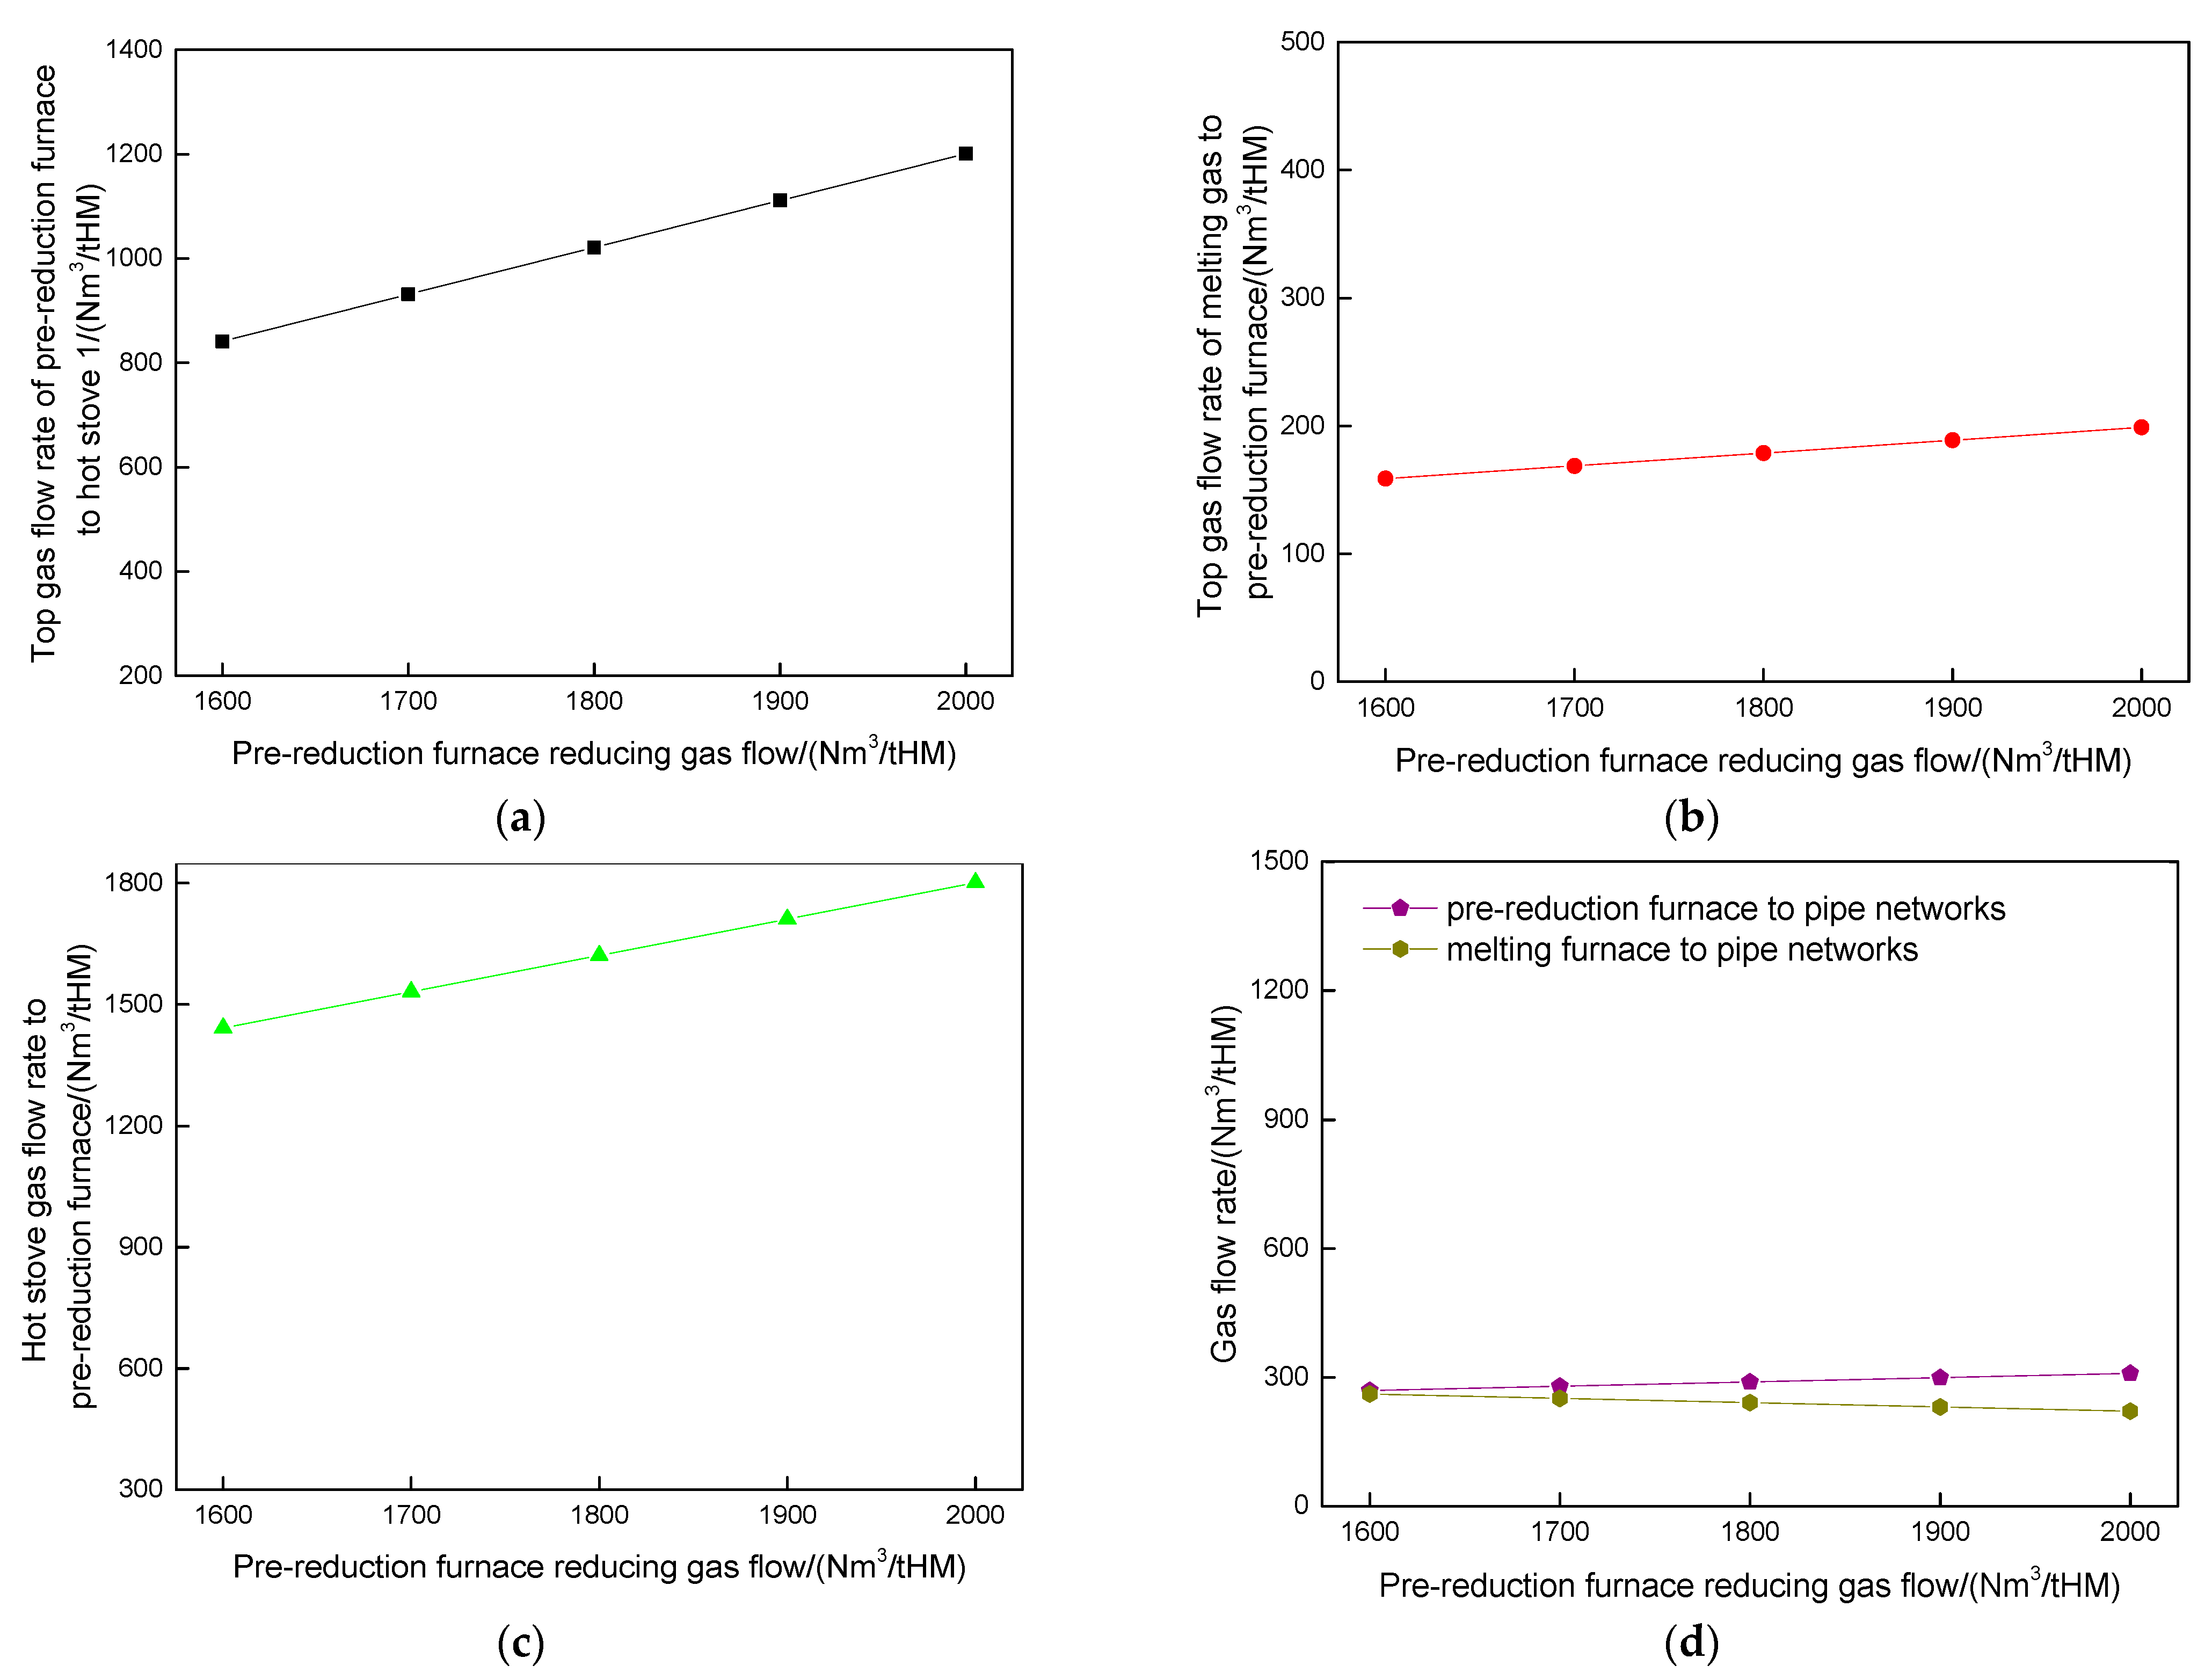
To further optimize the PLCsmelt process, the influence of the reducing gas flow rate in the pre-reduction furnace on Route 2 was investigated. Under the assumption of a constant metallization rate, the reducing gas flow rate was varied incrementally from 1600 to 1700, 1800, 1900, and 2000 Nm3/tHM. The temperature of the pre-reduction gas and recycling gas was the same as in Table 7 and Table 8. To examine the impact of parameter adjustments in Route 2, the gas recycling systems of the pre-reduction furnace and melting furnace were maintained as independent units. Consequently, variations in smelting parameters within the pre-reduction furnace were analyzed in detail. As summarized in Table 11, the gas composition profiles in the PLCsmelt process were evaluated under differing pre-reduction furnace reducing gas flow rates (1600–2000 Nm3/tHM). Figure 4 illustrated the corresponding gas distribution patterns. While gas components in the melting furnace exhibited minimal variation with increasing reducing gas flow rates, notable shifts were observed in the pre-reduction system. In Hot Stove 1, CO concentration rose from 27.47% to 30.68% as the reducing gas flow rate increased, accompanied by a proportional decline in H2 from 63.58% to 60.77%. Similarly, within the pre-reduction furnace itself, CO content increased from 34.56% to 37.47%, while H2 concentration decreased from 57.27% to 54.73% under equivalent conditions. These trends highlight the gas flow rate’s direct influence on compositional equilibria in the pre-reduction stage.
To assess the influence of varying reducing gas flow rates in the pre-reduction furnace, compositional shifts in the top gas were analyzed. As the reducing gas flow rate increased, CO concentration in the pre-reduction furnace top gas rose from 21.89% to 26.49%, while H2 levels decreased from 38.17% to 40.29%. This trend was attributed to the proportional enhancement of top gas recycling from the melting furnace to the pre-reduction furnace under elevated reducing gas flow conditions. To stabilize the pre-reduction furnace’s reducing gas temperature at 1000 °C, the cooling flow rate of recycled melting furnace top gas was systematically adjusted. Concurrently, the hot stove gas volume increased from 1441.22 to 1801.15 Nm3/tHM as the reducing gas flow rate rose, necessitating a corresponding escalation in cooling gas flow (158.78 to 198.85 Nm3/tHM) to maintain thermal equilibrium. Notably, the flow rate of pre-reduction furnace top gas directed to external pipeline networks—a primary pathway for N2 discharge—increased from 269 to 309 Nm3/tHM. This shift reduced nitrogen accumulation within the system, as evidenced by the decline in melting furnace top gas entering the networks from 261.03 to 221.93 Nm3/tHM. These adjustments collectively mitigated N2 enrichment across the PLCsmelt process under higher reducing gas flow regimes.
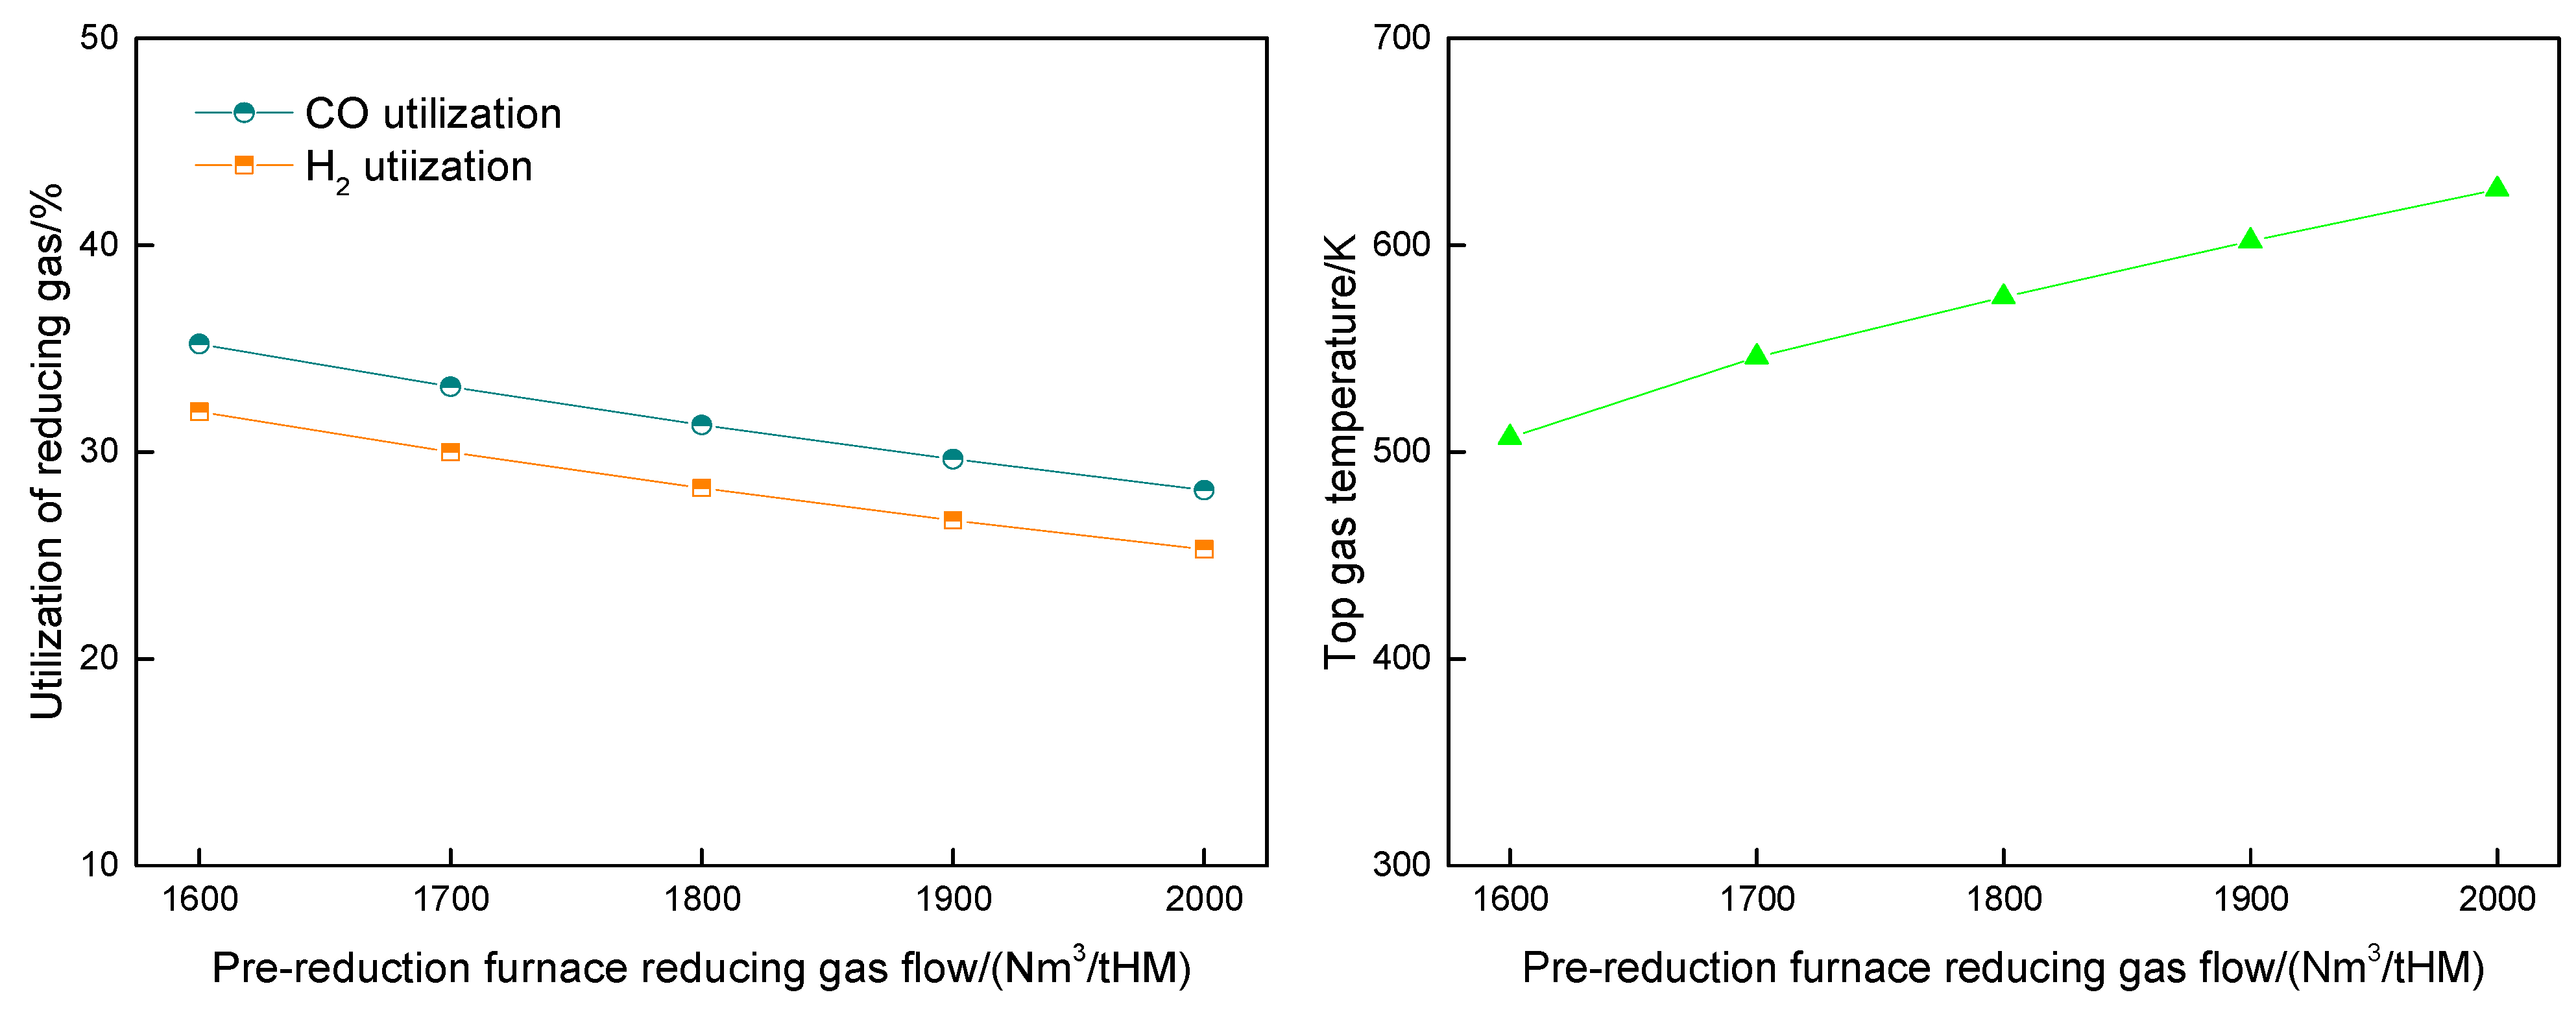
The relationship between pre-reduction furnace reducing gas flow rates and melting parameters was further analyzed, as illustrated in Figure 5. The elevated flow rates were observed to correlate with progressive declines in reducing gas utilization. Specifically, CO utilization decreased from 35.22% to 28.16%, while H2 utilization declined from 31.96% to 25.7% across the tested flow range (1600–2000 Nm3/tHM). Concurrently, the top gas temperature exhibited a steady rise from 507 K to 627 K. While the reduced flow rates were found to enhance gas utilization efficiency, this configuration resulted in a substantial thermal penalty, as evidenced by the marked temperature reduction in top gas emissions. Such the thermal deterioration suggested compromised heat retention within the furnace, a condition likely detrimental to reduction kinetics in operational settings. These findings underscore the necessity of balancing gas utilization optimization with thermal management when calibrating reducing gas flow rates as inadequate thermal conditions may adversely affect process stability and reaction efficiency.
The CO2 emission profiles of the pre-reduction furnace, melting furnace, and integrated PLCsmelt process were evaluated, as presented in Figure 6. A direct correlation was observed between the reducing gas flow rate in the pre-reduction furnace and its CO2 emissions. When the flow rate was elevated from 1600 to 2000 Nm3/tHM, emissions increased from 202.88 to 208.80 Nm3/tHM. Conversely, the melting furnace exhibited the negligible variation in carbon emissions under identical conditions. This stability was attributed to the distinct operational independence between the two units in Route 2, a configuration that enabled the application of targeted carbon mitigation strategies for each subsystem. The findings emphasized the critical role of process segregation in emission management as the pre-reduction furnace’s emissions demonstrated flow rate dependency, while the melting furnace’s emissions remained unaffected by such parametric adjustments.
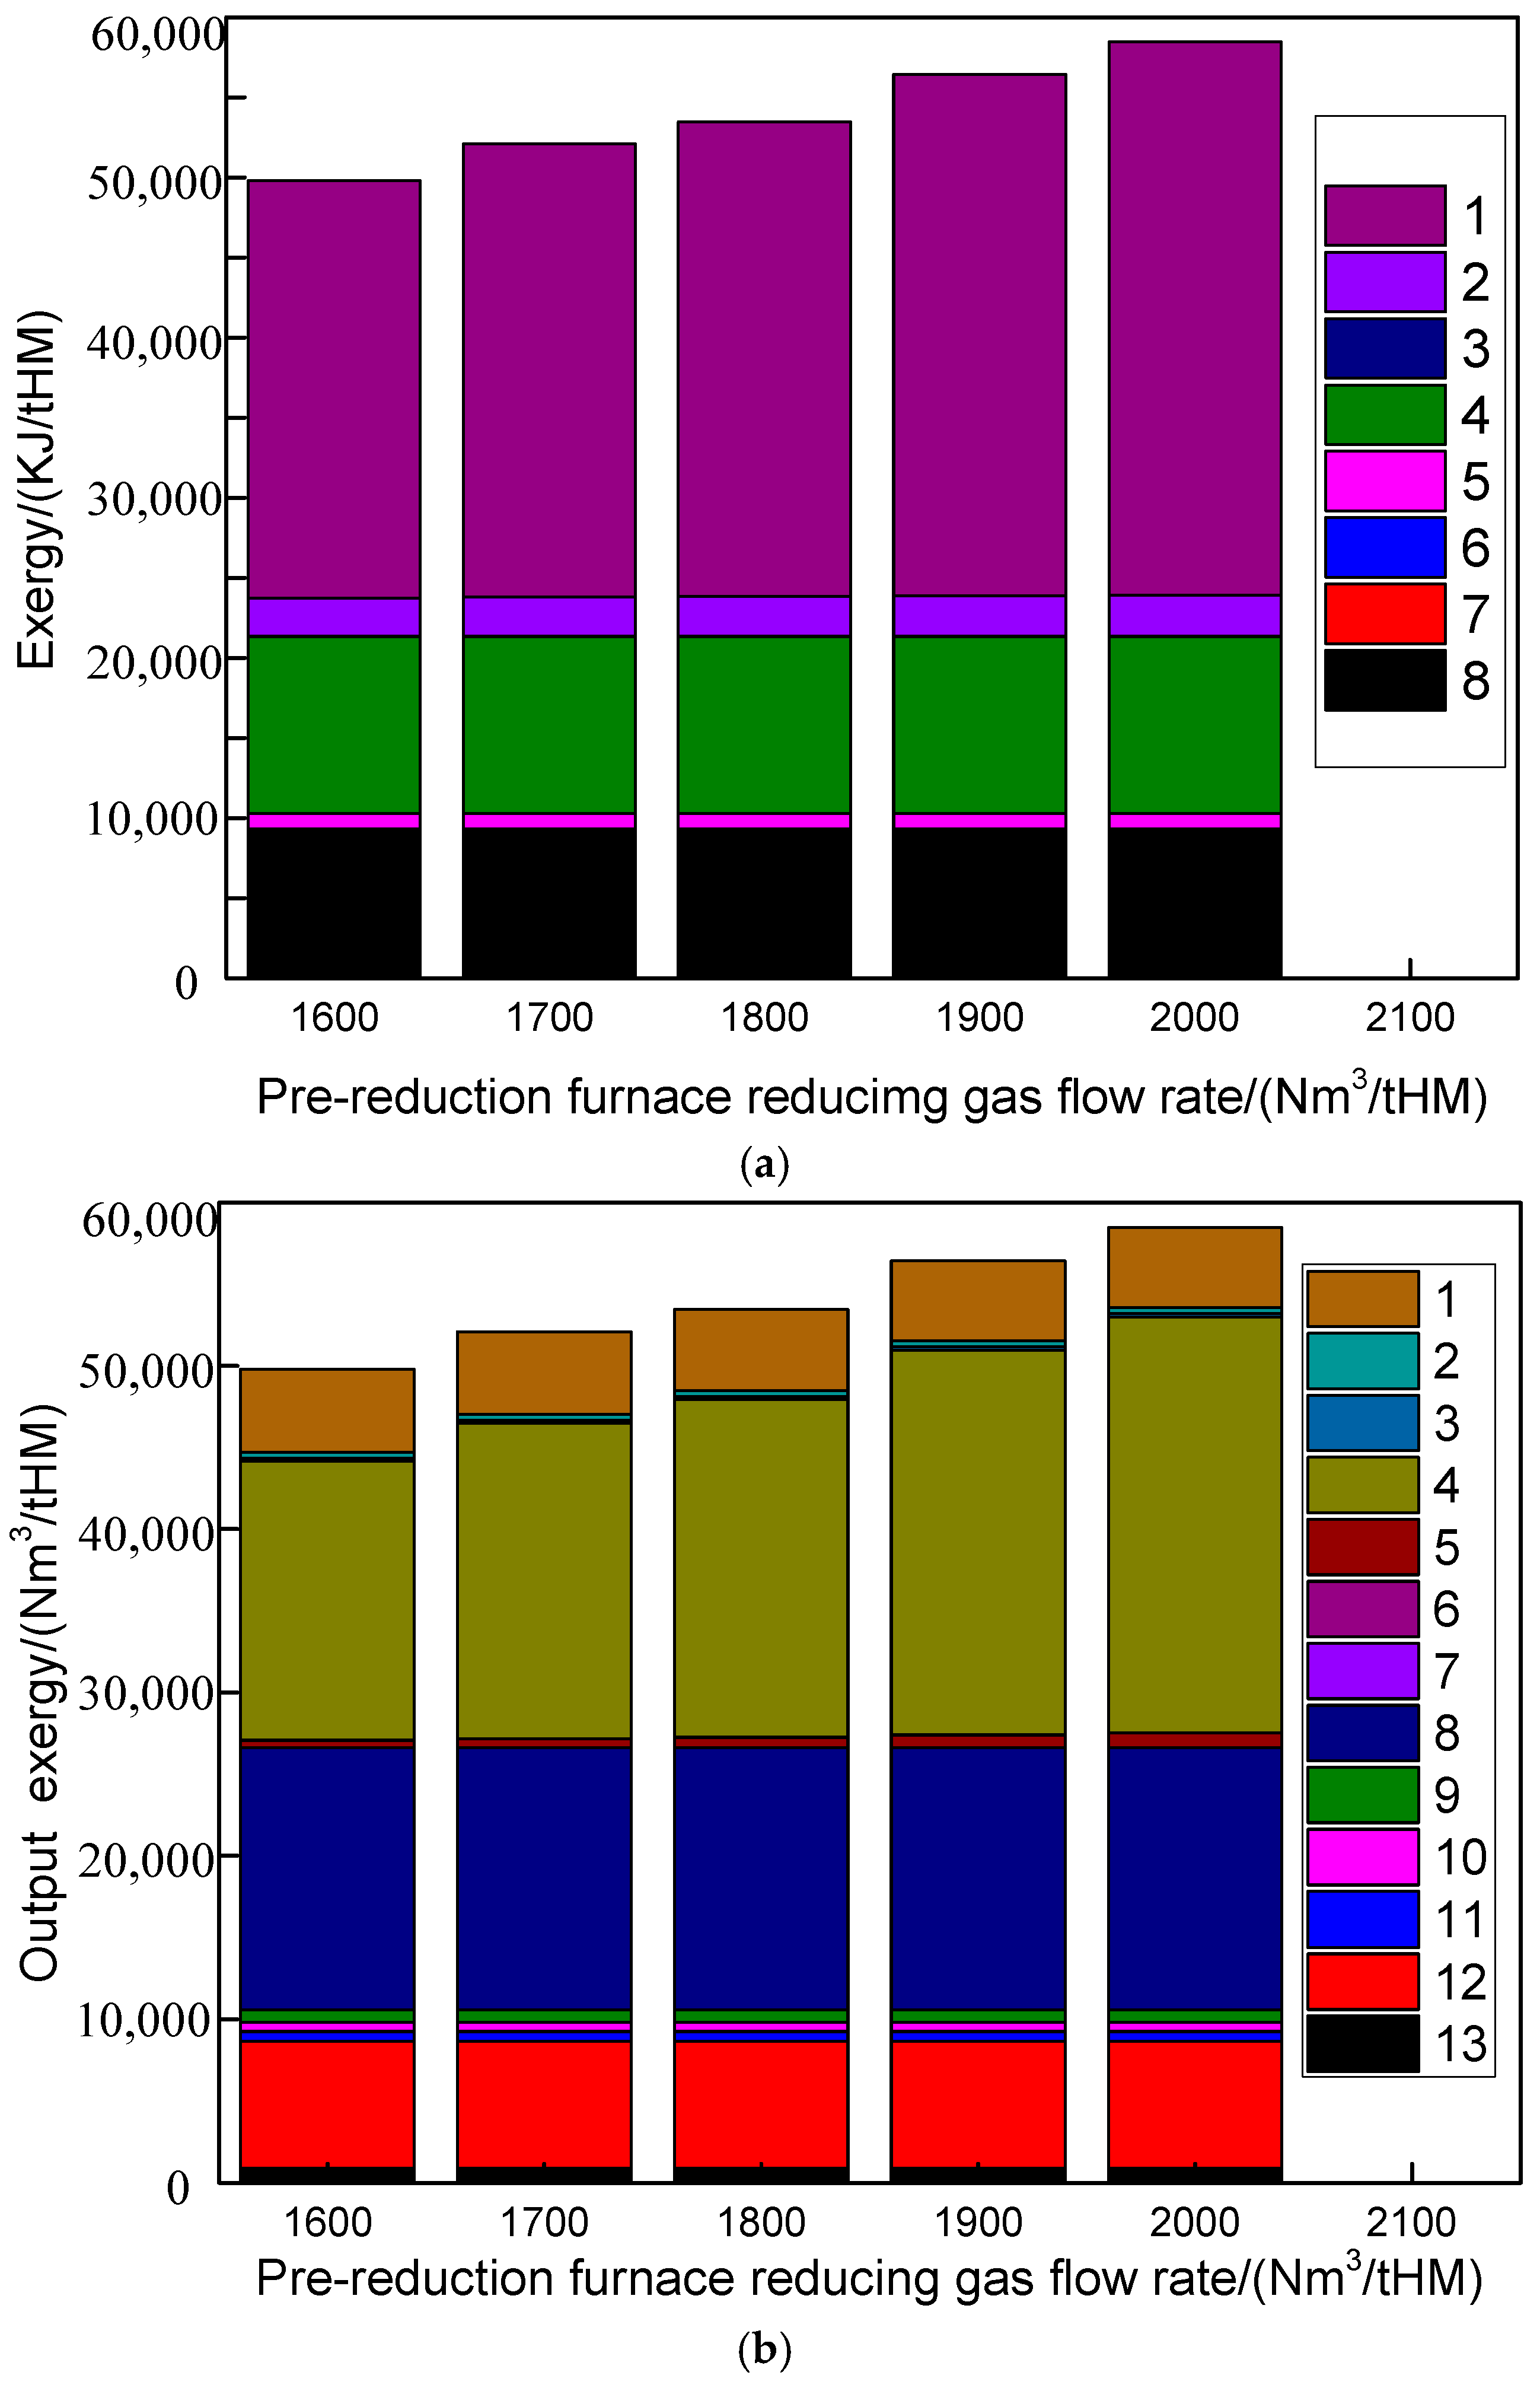
The exergy dynamics of the PLCsmelt process under varying pre-reduction gas flow rates were examined, as depicted in Figure 7. A progressive rise in the reducing gas flow rate was found to elevate the exergy input from the pre-reduction furnace, thereby enhancing the overall exergy efficiency of the system. Variations in the gas flow rate predominantly influenced the energy balance of the pre-reduction furnace subsystem. When the reducing gas flow rate was increased from 1600 to 2000 Nm3/tHM, the chemical exergy of the pre-reduction furnace reducing gas escalated from 26,076.71 to 34,550.29 MJ/tHM. This increase paralleled a significant rise in system exergy output, particularly in the pre-reduction furnace top gas. Over the same flow rate range, the chemical exergy of the top gas surged from 17,083.60 to 25,474.07 MJ/tHM. This trend was attributed to two factors: (1) the heightened volumetric flow rate of the top gas and (2) its elevated temperature, both of which amplified the exergy output. The findings underscore the interdependence between gas flow parameters and thermodynamic performance, emphasizing the need to optimize flow rates to maximize exergy recovery while maintaining process stability.
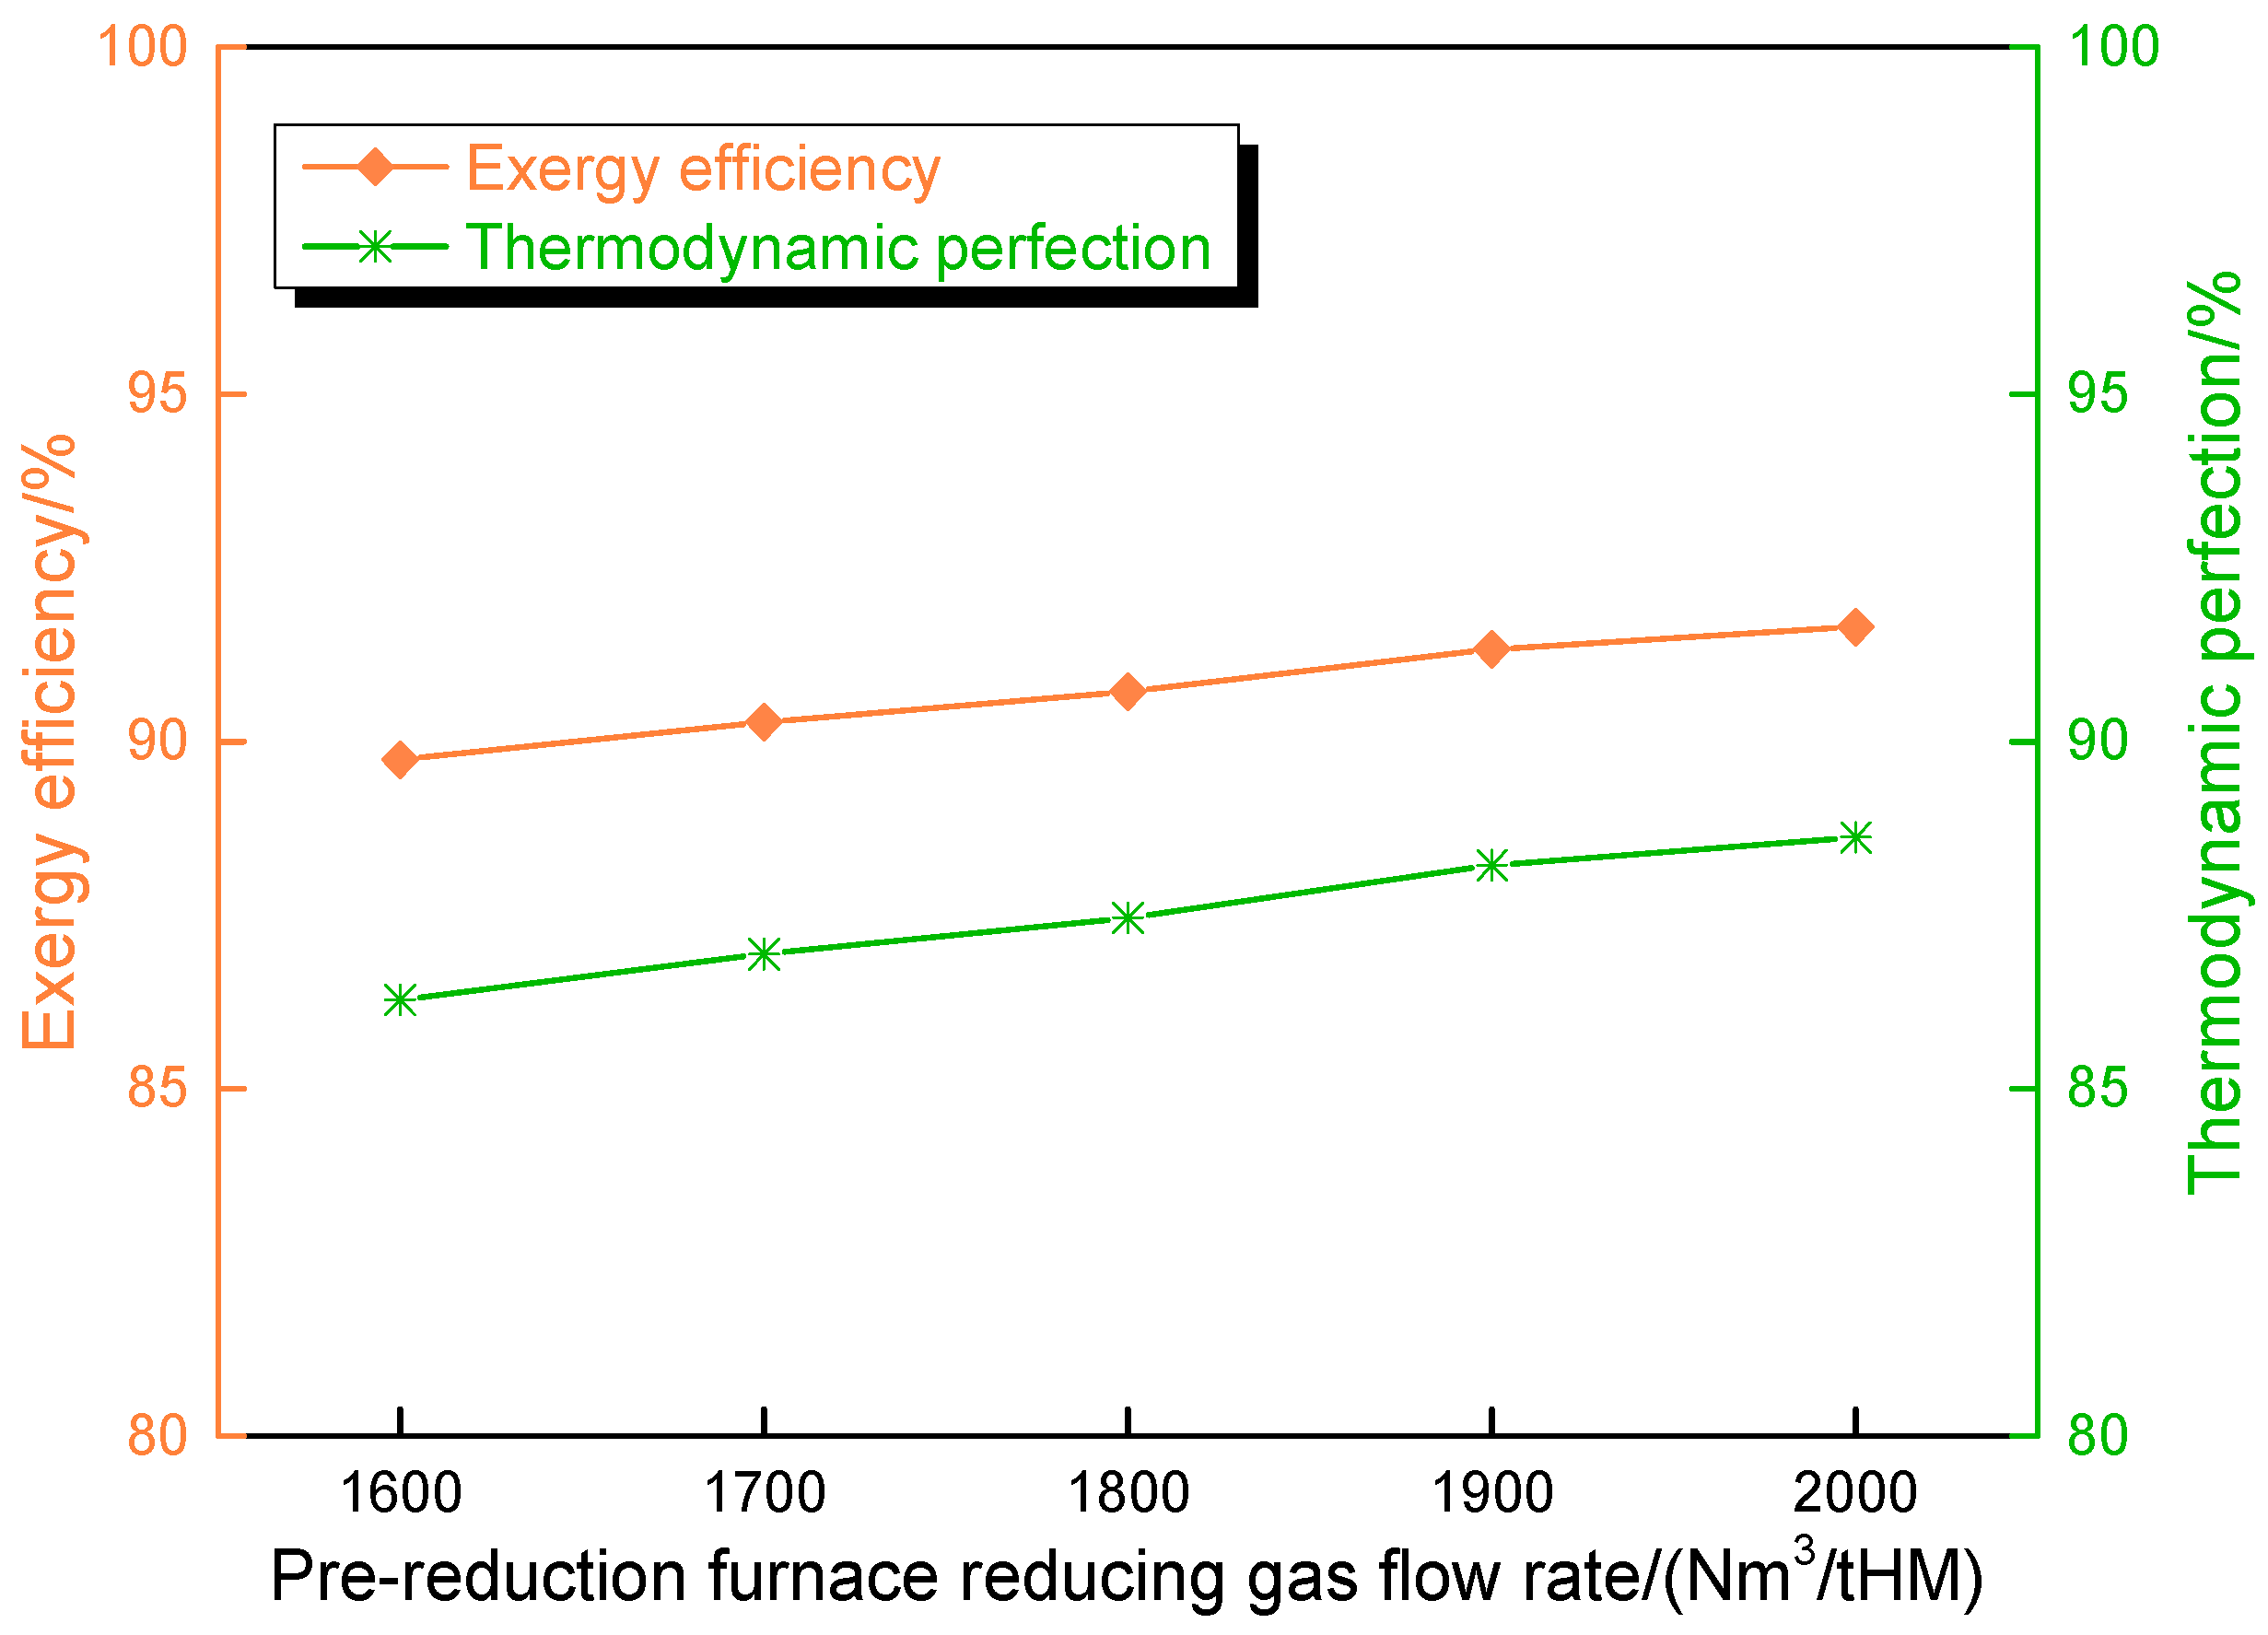
The energy utilization efficiency of the pre-reduction furnace under varying reducing gas flow rates was investigated, as shown in Figure 8, with top gas and molten iron identified as primary outputs. A positive correlation was observed between elevated reducing gas flow rates and enhancements in both exergy efficiency and thermodynamic perfection within the PLCsmelt process. When the reducing gas flow rate was increased from 1600 to 2000 Nm3/tHM, exergy efficiency improved from 89.74% to 91.65%, while thermodynamic perfection advanced from 86.28% to 88.62%. These metrics were governed predominantly by internal and external exergy losses, reflecting the system’s energy dissipation characteristics. The observed efficiency gains were attributed to optimized energy retention, underscoring the importance of flow rate adjustments in minimizing irreversible losses. These results emphasize the interdependence between operational parameters and thermodynamic performance, suggesting that careful calibration of reducing gas flow rates is critical to achieving a balance between energy efficiency and system stability.
The influence of varying reducing gas flow rates on energy utilization efficiency was primarily manifested through two counteracting mechanisms in the pre-reduction furnace. First, the elevated flow rates induced a rise in the pre-reduction furnace top gas temperature, elevating external exergy losses due to thermal dissipation. Second, internal exergy losses were reduced through decreased irreversibility of reactions within the system. These opposing effects were linked to enhanced exergy efficiency and thermodynamic perfection as the mitigation of process irreversibility outweighed the incremental thermal losses. Collectively, these adjustments underscored the dual role of gas flow rate optimization in balancing thermodynamic trade-offs to achieve net efficiency gains.

4.4. Influence of Melting Furnace Coke Ratio on Route 2 in Melting Parameters and Carbon Emission

The influence of varying coke ratios in the melting furnace on smelting parameters in PLCsmelt Route 2 was analyzed using the developed model. The temperature of the pre-reduction gas and recycling gas was the same as in Table 7 and Table 8. As summarized in Table 12, the gas composition profiles exhibited minimal variation despite incremental increases in the coke ratio from 300 to 340 kg/tHM. In the melting furnace top gas (post decarburization, dehydration, and dedusting processes), CO levels marginally rose from 98.86% to 99.02%. Similarly, in Hot Stove 1, CO concentration increased from 29.29% to 29.32%, while H2 levels rose from 62.35% to 62.38%, and N2 content declined from 8.36% to 8.30%. At a coke rate of 300 kg/tHM, the pre-reduction furnace top gas composition comprised 36.20% CO, 56.16% H2, and 7.64% N2. Increasing the coke rate to 304 kg/tHM resulted in minimal compositional changes (CO: 36.25%, H2: 56.18%, and N2: 7.57%). The marginal variations (ΔCO: +0.05%, ΔH2: +0.02%, and ΔN2: −0.07%) demonstrate that coke rate adjustments within this range exert negligible influence on gas composition, highlighting the limited sensitivity of the pre-reduction furnace’s gas equilibrium to incremental coke input. These subtle shifts in gas composition underscored the limited sensitivity of the system to coke ratio adjustments under the tested conditions, suggesting that the operational stability was maintained despite parametric modifications. The findings highlight the robustness of the process configuration in mitigating compositional fluctuations during coke ratio optimization.
The gas to pipe networks under varying melting furnace coke ratios were examined, as illustrated in Figure 9. The pre-reduction furnace gas flow directed to the pipeline networks remained stable at approximately 289 Nm3/tHM across all tested conditions. In contrast, gas flow from the melting furnace to the pipeline networks demonstrated a marked increase from 208.6 to 273.39 Nm3/tHM with rising coke ratios. This differential response was attributed to the operational independence between the pre-reduction and melting furnace subsystems in Route 2. The structural segregation of gas circuits enabled localized adjustments in the melting furnace without cascading effects on the pre-reduction system. The findings reinforce the advantage of modular process design in enabling targeted parametric optimizations while maintaining subsystem stability.
The relationship between melting furnace coke ratios and gas consumption parameters was examined, as illustrated in Figure 10. Elevated coke ratios were correlated with progressive increases in both pure oxygen and reducing gas flow rates. When the coke ratio was incrementally raised from 300 to 340 kg/tHM, the pure oxygen flow rate escalated from 177.44 to 209.81 Nm3/tHM, while the reducing gas flow rate increased from 840 to 990 Nm3/tHM. Under the constraint of a fixed theoretical combustion temperature, elevated coke ratios were found to necessitate higher coke consumption at the tuyere zone, driving increased oxygen enrichment demands and consequent rises in oxygen flow rates. However, oxygen enrichment inherently elevates the theoretical combustion temperature. To counteract this thermal effect and maintain equilibrium, compensatory increases in recycled gas injection volumes were required, ensuring stable reducing gas inputs to the hearth. This balancing mechanism highlights the interplay between coke ratio adjustments, oxygen enrichment, and gas recycling in preserving thermal stability under modified operating conditions.
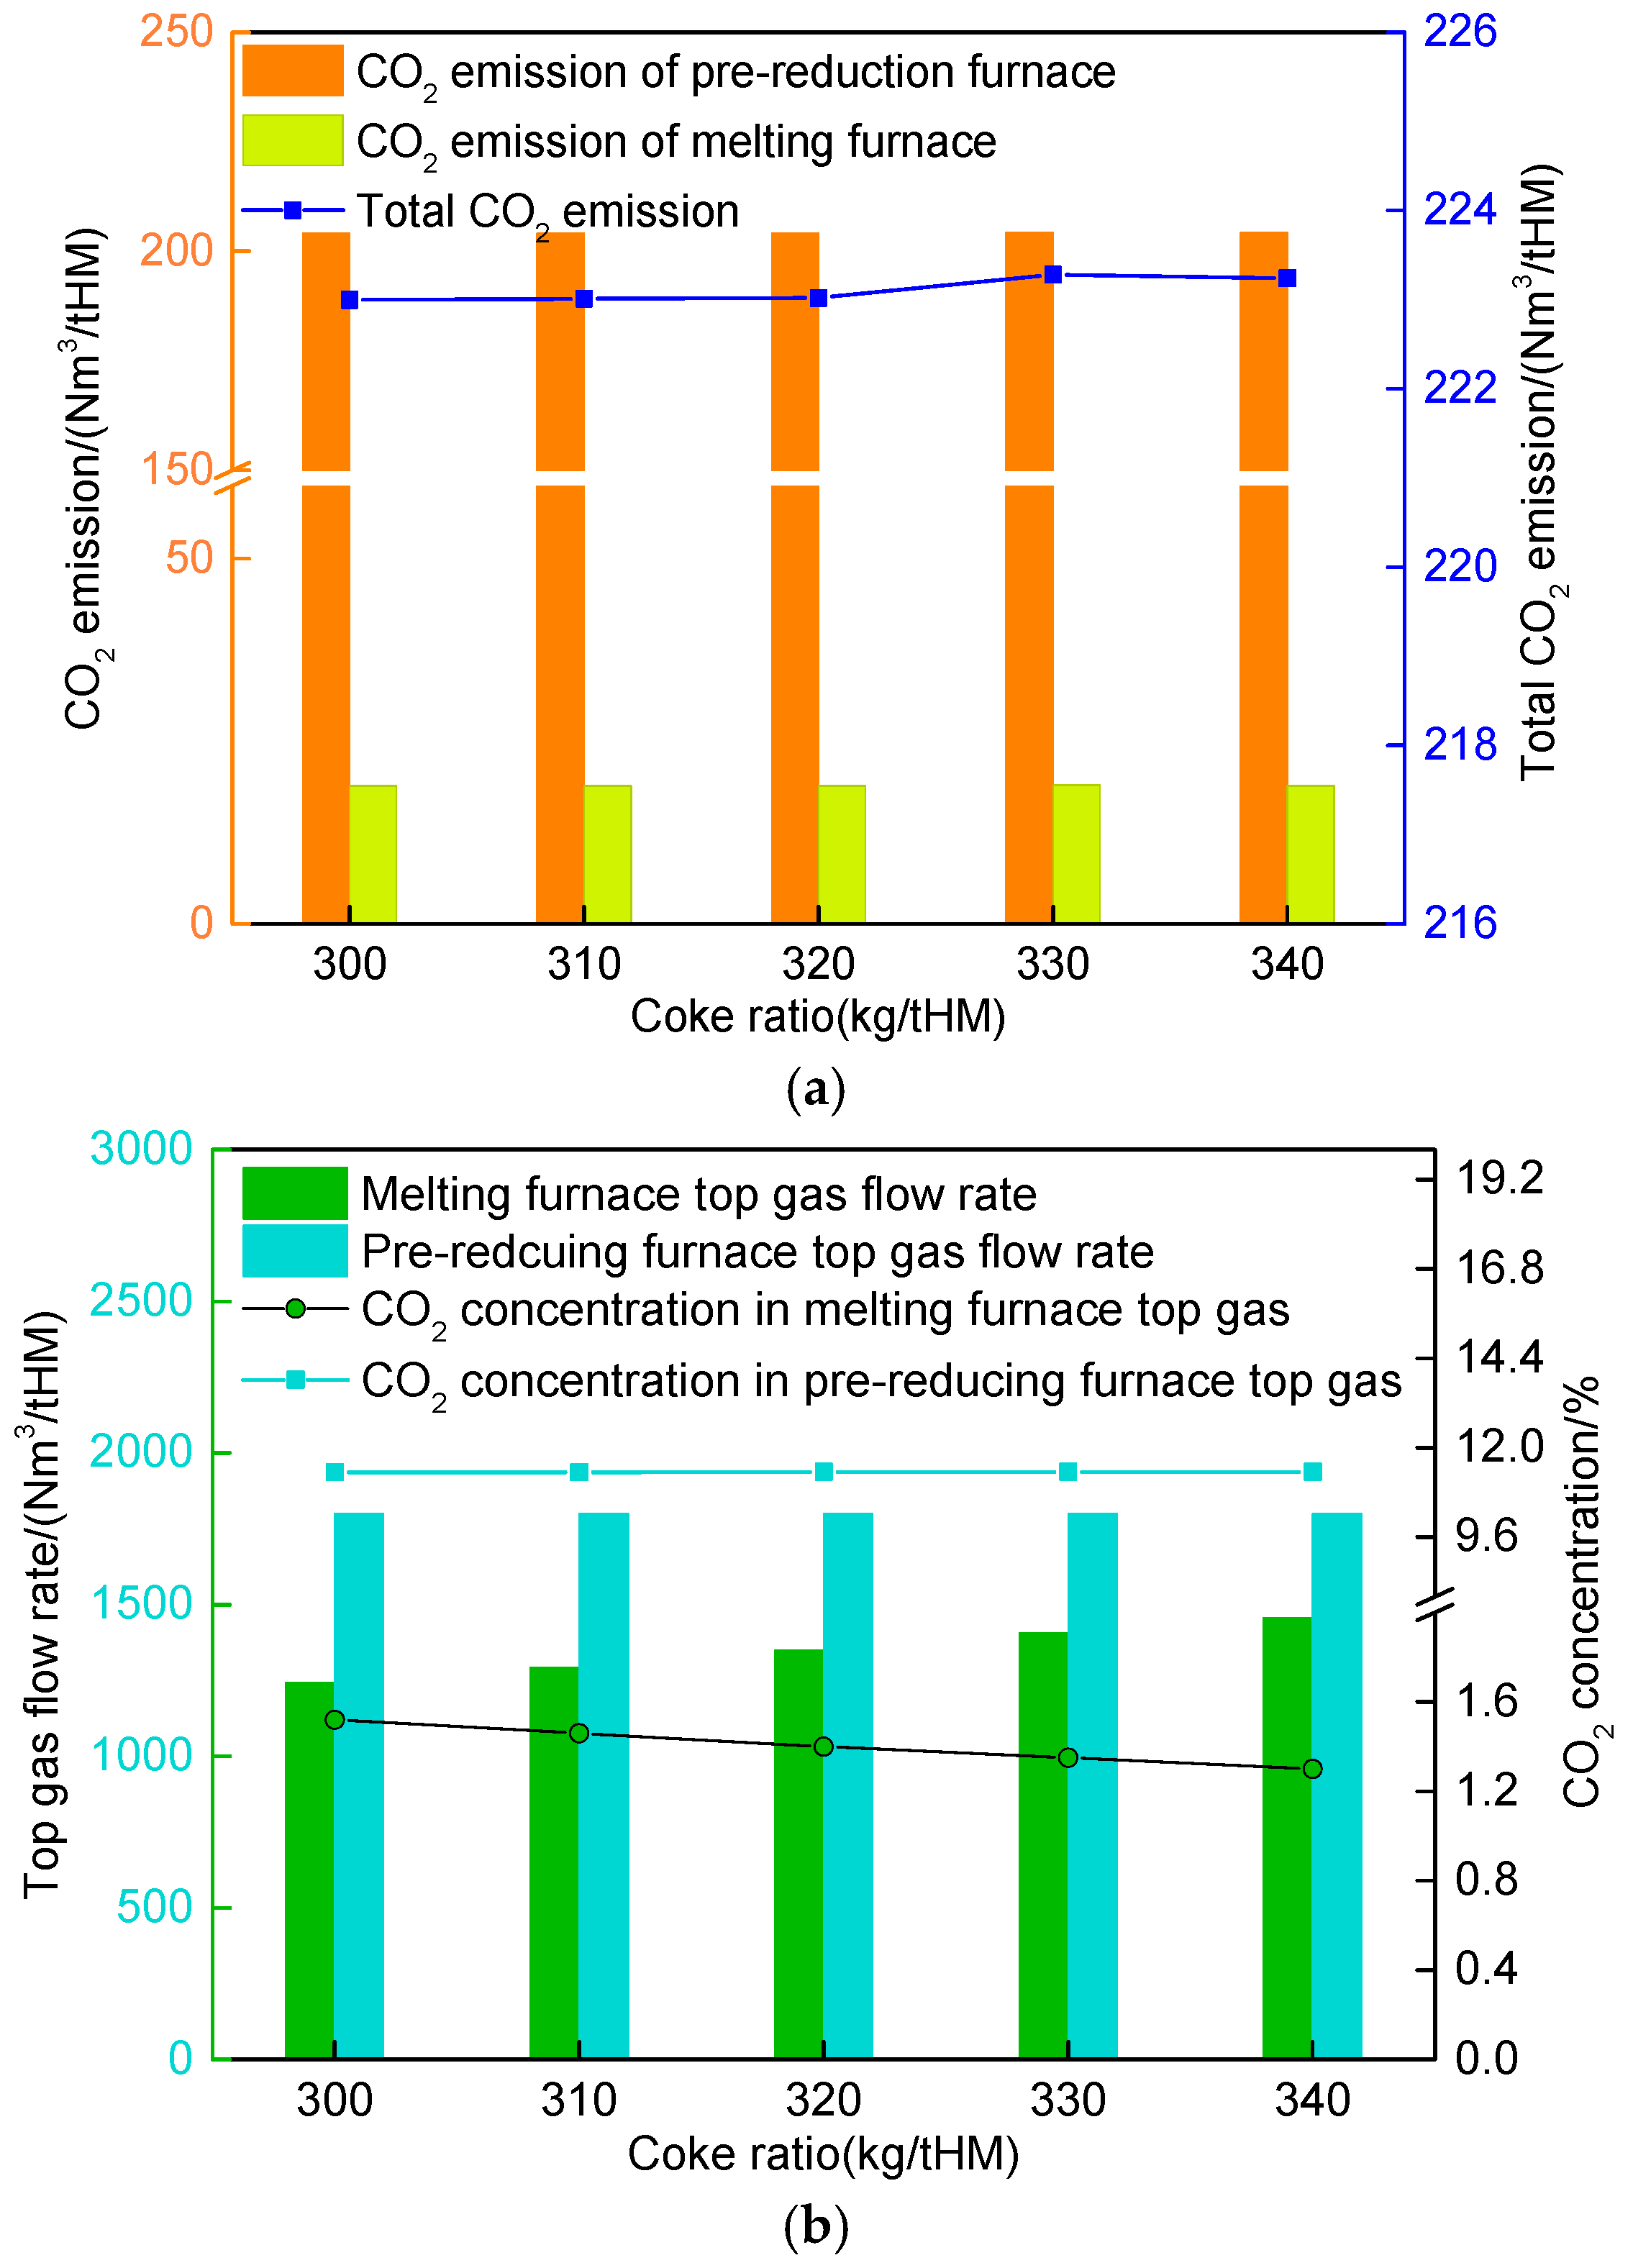
Figure 11 depicts the CO2 emissions of the PLCsmelt process under varying coke rates in the melting furnace. Figure 11a illustrates the CO2 emissions of the pre-reduction furnace, melting furnace, and total system, while Figure 11b displays the melting furnace top gas flow rate, pre-reduction furnace top gas flow rate, and CO2 concentration in the top gas. As observed, the total CO2 emissions of the PLCsmelt process remained approximately 223 Nm3/tHM despite increasing coke rates in the melting furnace. When the coke rate rose from 300 kg/tHM to 340 kg/tHM, the CO2 emissions exhibited minimal variation (from 223 Nm3/tHM to 223.24 Nm3/tHM). The primary CO2 sources in PLCsmelt originated from both the pre-reduction furnace and melting furnace. Figure 11b reveals that the top gas flow rate from the melting furnace increased significantly from 1242 Nm3/tHM to 1457 Nm3/tHM with higher coke rates. As demonstrated in Figure 10, this corresponded to an enhanced flow of recycled reducing gas from the melting furnace top gas to the furnace interior. The combined effect of increased gas generation and enhanced recycling led to constrained growth in actual discharged gas, with a 215 Nm3/tHM rise in top gas contrasting a mere 65 Nm3/tHM increase in exhaust gas. Concurrently, elevated coke consumption raised CO concentration while reducing CO2 content in the top gas. Specifically, when the coke rate increased from 300 kg/tHM to 340 kg/tHM, the discharged melting furnace gas increased from 208.60 Nm3/tHM to 273.39 Nm3/tHM, accompanied by a decline in CO2 concentration from 1.52% to 1.30%. Consequently, the net CO2 emissions from this source showed only marginal growth (3.17 Nm3/tHM to 3.55 Nm3/tHM). The pre-reduction furnace maintained constant CO2 emissions at 204 Nm3/tHM throughout the process as it operated independently from the melting furnace within the system configuration.
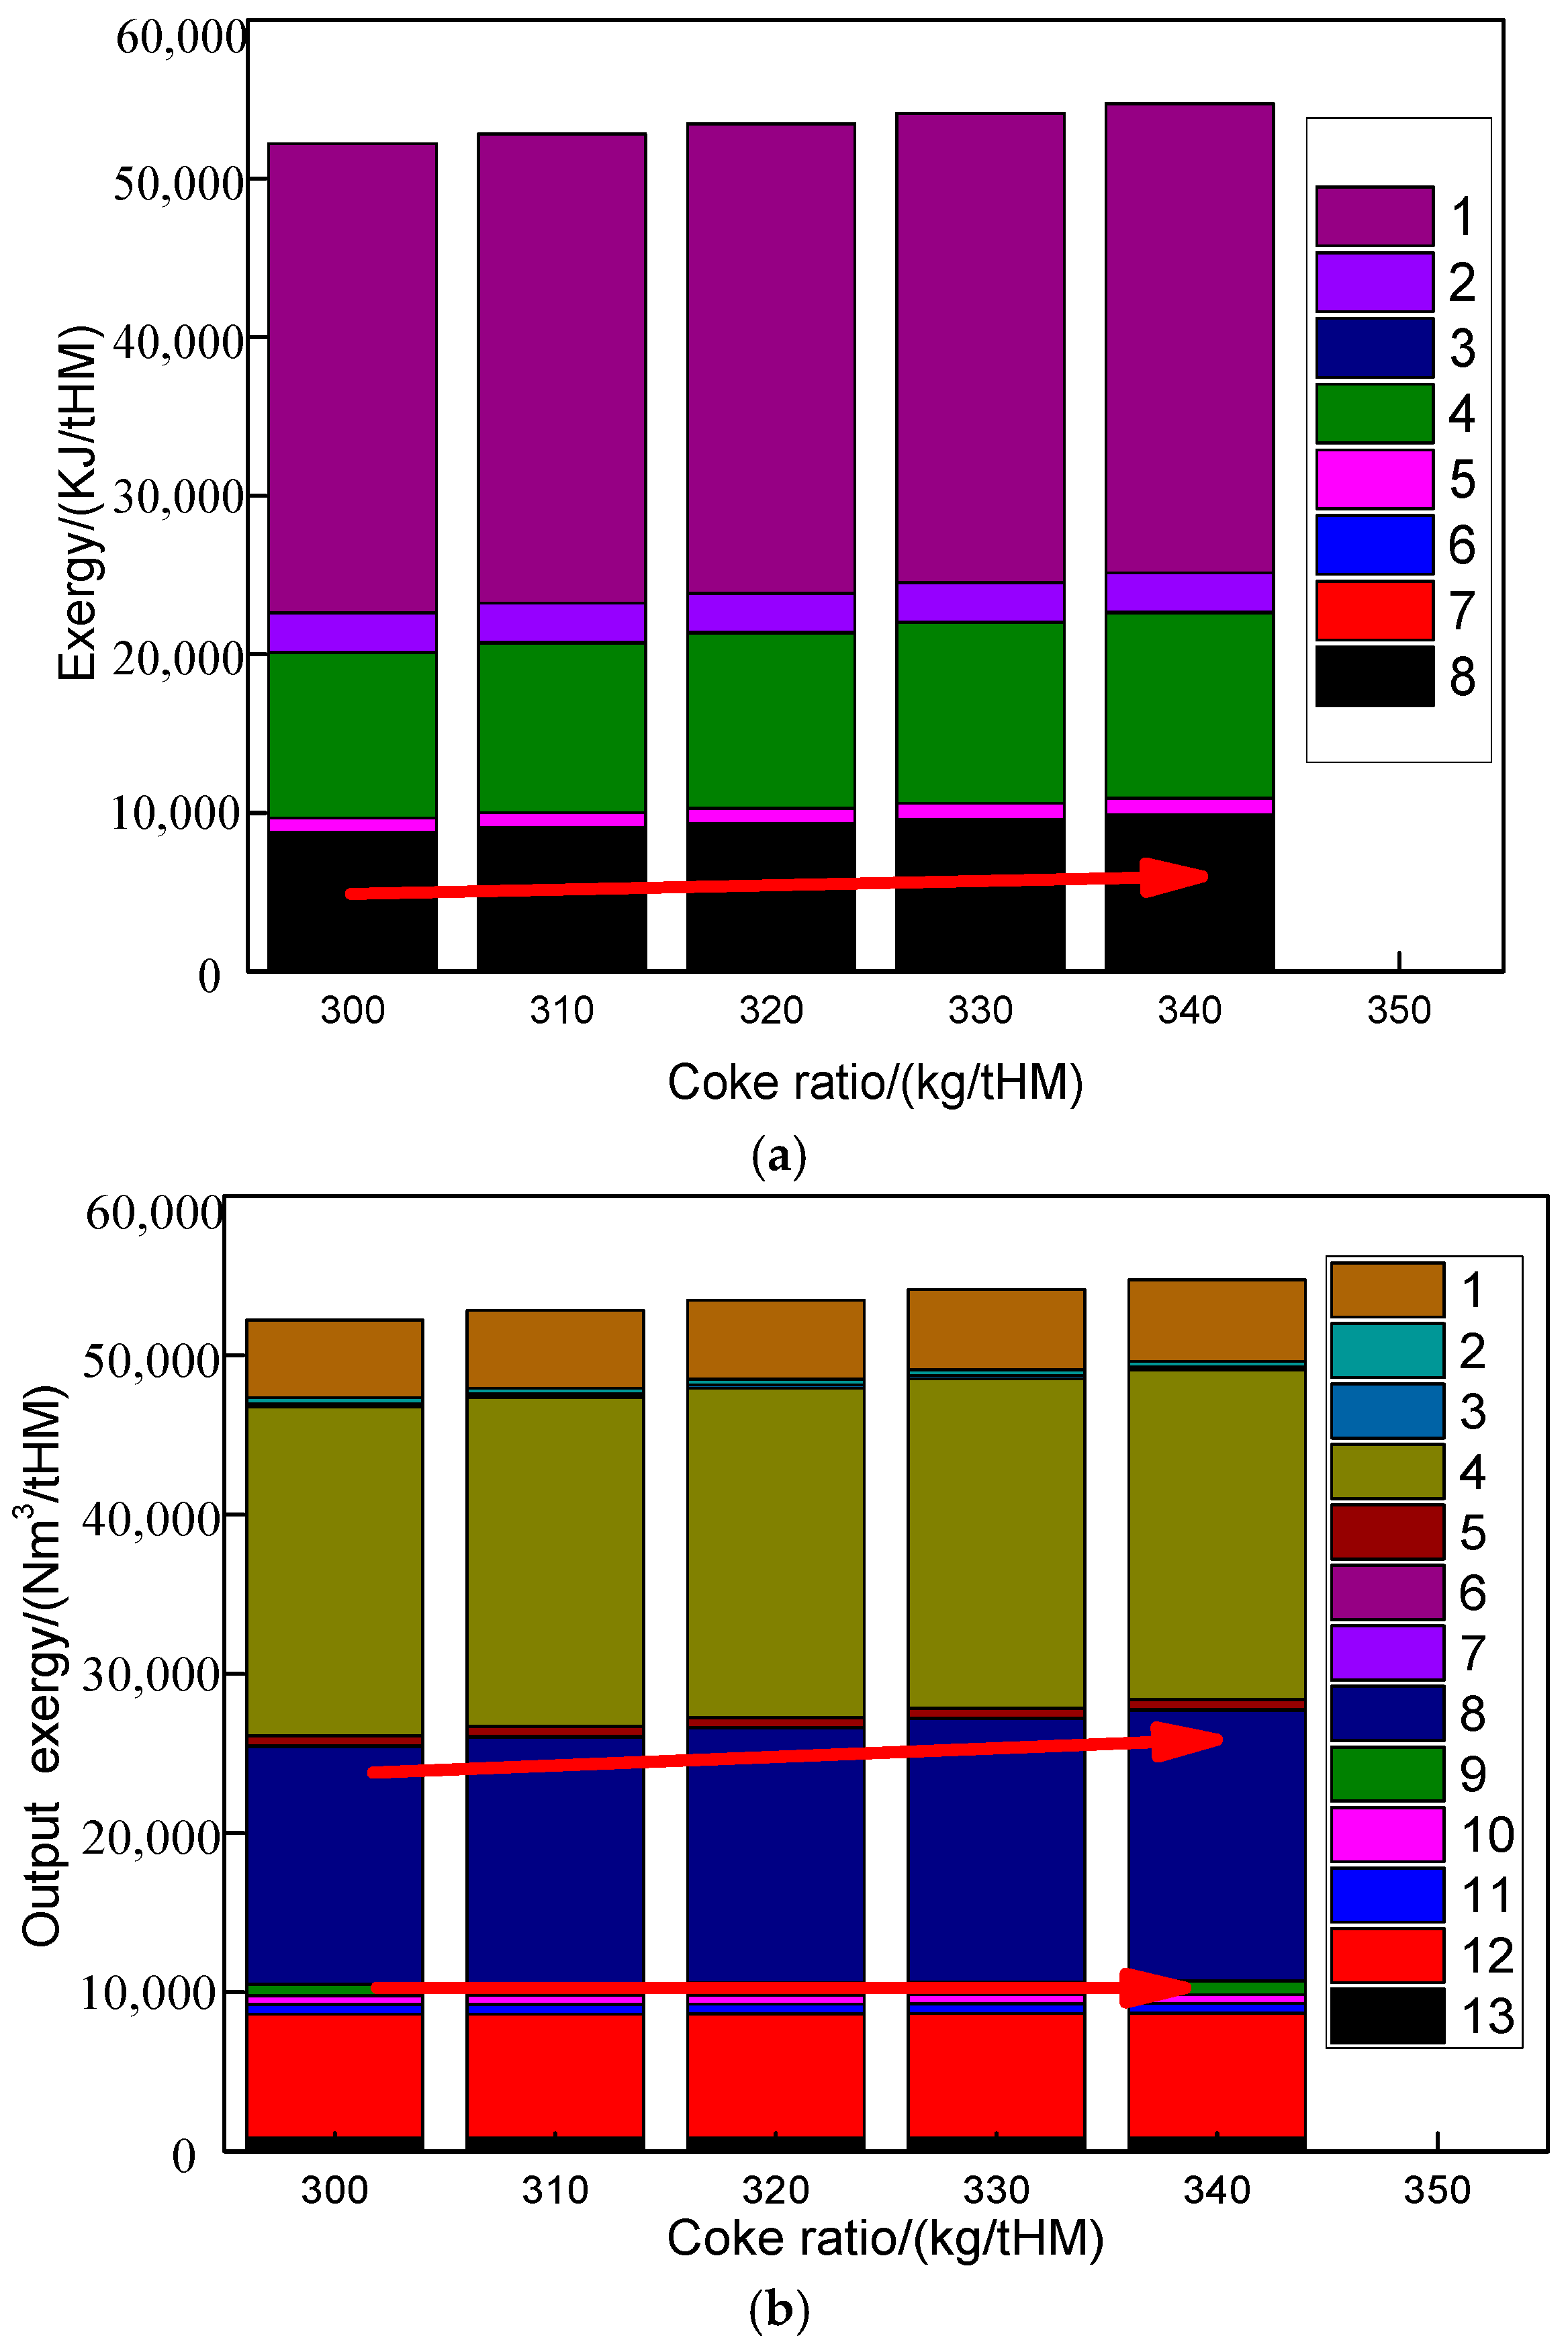
The exergy dynamics of the PLCsmelt process under varying coke ratios were examined, as depicted in Figure 12. Total exergy input and output exhibited gradual increases as the coke ratio was elevated. Notably, the chemical exergy of coke demonstrated the most pronounced variation, rising from 8704.96 to 9821.79 MJ/tHM as the coke ratio increased from 300 to 340 kg/tHM. Consequently, total exergy input escalated from 52,211.06 to 54,737.23 MJ/tHM over this range. Concurrently, exergy output showed proportional growth, with the chemical exergy of melting furnace top gas displaying the largest incremental shift—increasing from 14,951.29 to 17,013.87 MJ/tHM. This trend was attributed to the heightened carbon input and associated energy content at elevated coke ratios, which amplified both material and energy fluxes through the system. The findings underscore the direct relationship between coke ratio adjustments and thermodynamic performance, emphasizing the dual role of carbon input as both a chemical reductant and a carrier of process exergy.
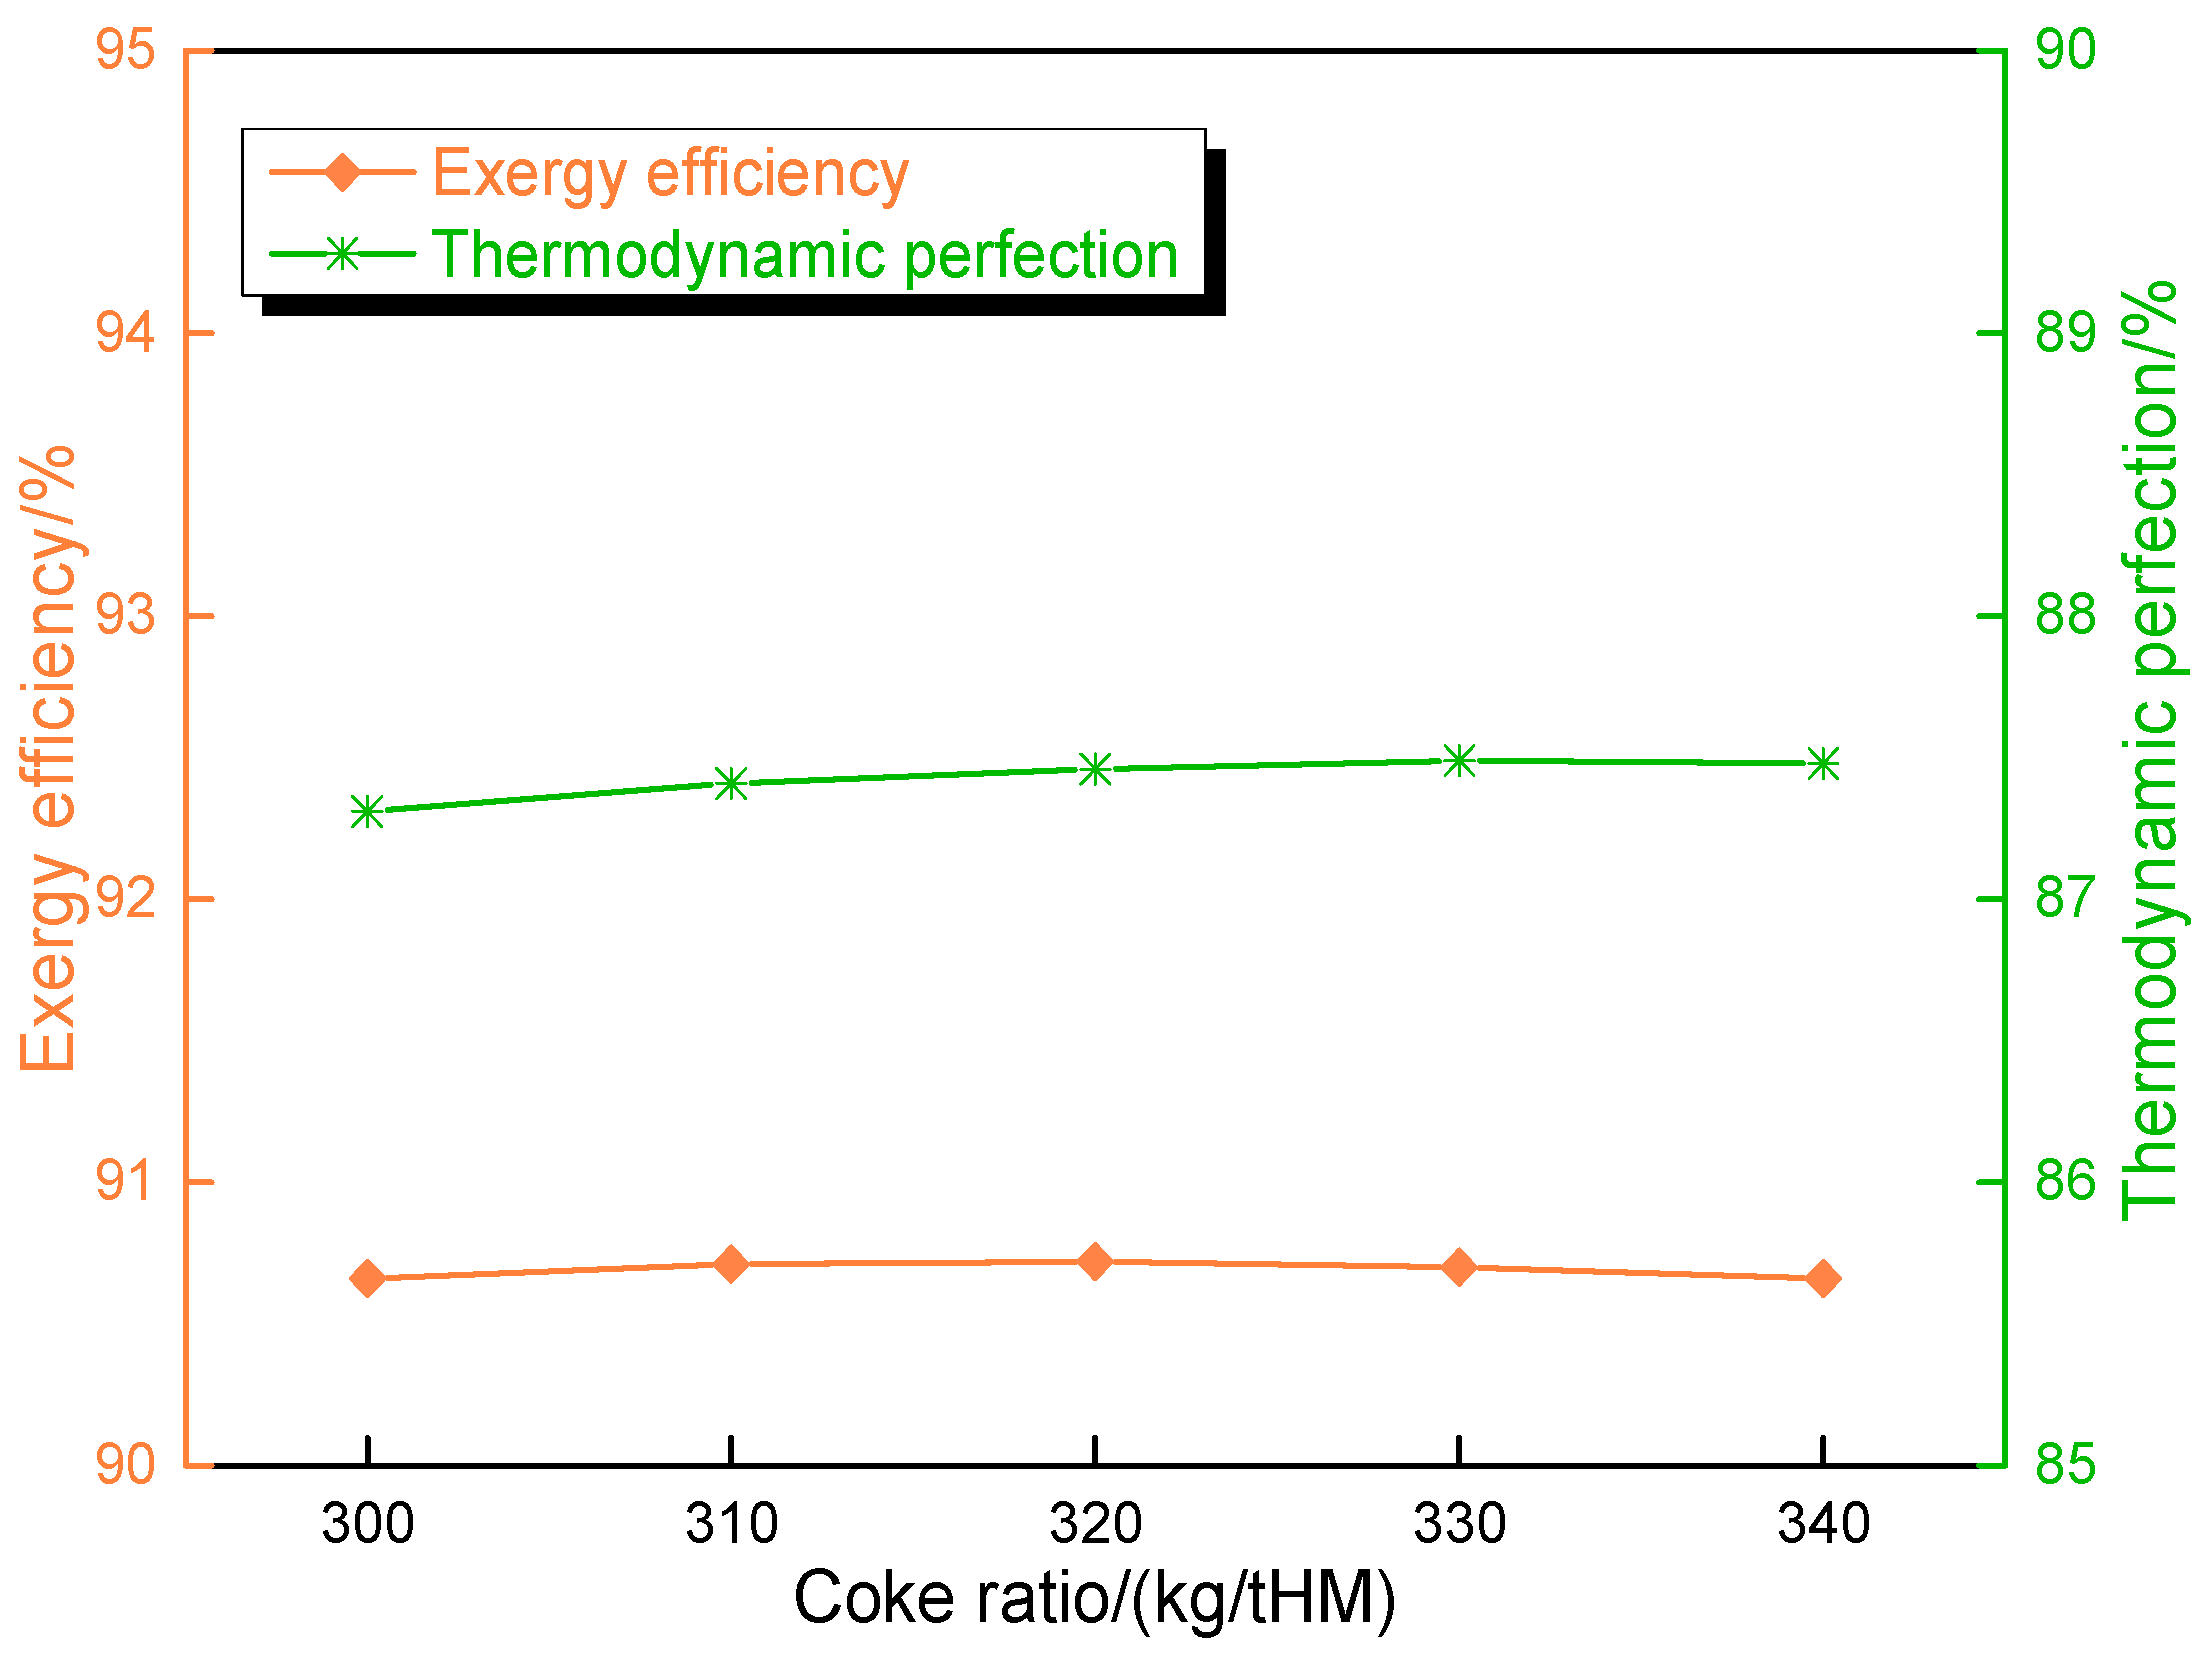
The energy utilization efficiency of the PLCsmelt process under varying coke ratios was evaluated, as illustrated in Figure 13. Empirical data indicated that adjustments to the coke ratio were found to exert negligible influence on energy efficiency metrics. This consistency with prior observations further underscored the functional decoupling between the melting furnace’s operational parameters and the broader thermodynamic performance of the system. The findings reinforced the robustness of the PLCsmelt configuration in maintaining stable energy utilization despite modifications to carbon input levels, aligning with earlier observations of subsystem independence. Such resilience highlights the process’s capacity to accommodate parametric adjustments without compromising thermodynamic equilibrium.

4.5. Comparative Analysis of Different Low-Carbon Processes

Based on the computational results of Route 2, a comparative analysis was conducted among the traditional blast furnace (TBF), PLCsmelt Route 1, Route 2, shaft furnace (SF), Midrex, and FINEX processes. Differences in economic performance, carbon emissions, and life cycle assessment (LCA) were evaluated for these processes, as shown in Figure 14. Data for the traditional blast furnace, hydrogen-enriched shaft furnace, Midrex, and FINEX processes were obtained from field investigations. Carbon emissions were calculated according to IPCC guidelines using normalization factors listed in Table 13. A life cycle assessment (LCA) was performed using Gabi software (version number 10.6.1.35), with the total environmental impact metric used for characterization.
Figure 14a shows the hot metal cost per ton under different low-carbon process routes. The HISMELT process has the highest cost at CNY 2453/tHM, while the shaft furnace (SF) process achieves the lowest cost at CNY 1244/tHM. The PLCsmelt process exhibits lower costs than the traditional blast furnace (TBF), HISMELT, and FINEX processes, with only the SF process being more economical. Specifically, Route 2 of PLCsmelt further reduces the cost to CNY 1973 /tHM compared to Route 1, demonstrating the economic advantages of the PLCsmelt technology.
Figure 14b presents the carbon emissions of various low-carbon processes calculated using emission factors based on IPCC guidelines. The HISMELT process generates the highest emissions (2131 kg CO2/tHM), followed by the TBF (1554 kg CO2/tHM). The SF process, utilizing hydrogen-rich gas, achieves the lowest emissions (451 kg CO2/tHM). The PLCsmelt Route 2 significantly reduces emissions to 729 kg CO2/tHM, 53.08% lower than the TBF.
Figure 14c illustrates the total environmental impact of each process, evaluated via a life cycle assessment (LCA). The SF process exhibits the lowest impact (5.53 × 10⁻¹¹), while the TBF has the highest impact (2.31 × 10⁻¹⁰). The PLCsmelt Route 2 achieves a substantially lower impact (1.27 × 10⁻¹⁰) compared to the TBF. The total environmental impact metric reflects the overall ecological burden, where higher values indicate greater harm. The SF process’s minimal impact results from hydrogen-based reduction, which drastically reduces greenhouse gas emissions.
Comprehensive analysis reveals that the PLCsmelt process offers superior economic performance, lower carbon emissions, and reduced environmental impact compared to the TBF. While the SF process outperforms PLCsmelt in cost, emissions, and environmental metrics, it faces critical limitations: the excessive pulverization of vanadium–titanium magnetite during processing, which fails to meet the pellet size requirements for shaft furnace operations. In contrast, the PLCsmelt process ensures stable pellet integrity, making it a technically viable and industrially scalable solution for low-carbon ironmaking.

5. Conclusions

(1)
Route 1 (base) operated under the elevated coke ratios (380 kg/tHM) and the suboptimal metallization rates (75%), utilizing a pre-reduction gas flow of 1600 Nm3/tHM (with pre-reducing gas temperature 1000 °C and recycling gas temperature 1200 °C). This configuration generated CO2 emissions of 472.59 Nm3/tHM, with the gas compositions dominated by CO (pre-reduction furnace top gas: 64.73% CO, 27.17% CO2). In contrast, Route 2 achieved a 56.8% reduction in CO2 emissions (204.20 Nm3/tHM) through the parameter optimization (coke ratio: 320 kg/tHM; metallization rate: 90%) and an increased pre-reduction gas flow (1800 Nm3/tHM) (with pre-reducing gas temperature 1000 °C and recycling gas temperature 1200 °C). These adjustments enabled the hydrogen-rich gas utilization (40.30% H2) and the near-elimination of CO2 in melting furnace top gas (1.05%).
(2)
Increasing the pre-reduction furnace reducing gas flow rate in Route 2 would elevate the CO concentrations in both the reducing gas (34.56% to 37.47%) and top gas (21.89% to 26.49%). Concurrently, the pre-reduction furnace top gas diverted to pipeline networks rose from 269 to 309 Nm3/tHM, while melting furnace top gas flows to pipelines decreased inversely from 261.03 to 221.93 Nm3/tHM.
(3)
The operational segregation between the pre-reduction and melting furnaces in Route 2 ensured minimal disruption to the pre-reduction subsystem despite adjustments to the melting furnace coke ratio (300–340 kg/tHM). The CO and H2 utilization rates remained stable at 31.31% and 28.26%, respectively, even as post-treatment CO content in melting furnace top gas increased marginally (98.86% to 99.02%).
(4)
Route 2 demonstrated the enhanced carbon mitigation and operational adaptability, facilitating hydrogen-rich gas integration without destabilizing the melting furnace. However, the industrial-scale validation and optimization of raw material specifications were identified as critical prerequisites for practical implementation. These findings underscore Route 2’s potential as a low-emission ironmaking pathway, though scalability and material compatibility require further investigation.
(5)
The comprehensive evaluation demonstrates that the PLCsmelt process achieves significant economic and environmental advantages over traditional blast furnace (TBF), HISMELT, and FINEX technologies, with hot metal costs reduced to 1973 yuan/tHM (Route 2) and carbon emissions lowered by 53.08% (729 kg CO2/tHM) compared to TBF. While the hydrogen-enriched shaft furnace (SF) process exhibits superior performance in cost (1244 yuan/tHM), emissions (451 kg CO2/tHM), and total environmental impact (5.53 × 10⁻¹¹), its industrial application is hindered by severe vanadium–titanium magnetite pulverization, which violates pellet quality requirements for stable furnace operation. In contrast, the PLCsmelt process ensuring technical feasibility while delivering a substantially reduced environmental footprint (1.27 × 10⁻¹⁰) and scalable decarbonization potential, positioning it as a viable low-carbon solution for the steel industry.

Author Contributions

Conceptualization, J.T. and Y.H.; methodology, J.T. and Y.H.; software, M.C.; validation, Y.H.; formal analysis, Y.H.; investigation, Y.H.; resources, J.T.; data curation, Y.H.; writing—original draft preparation, Y.H.; writing—review and editing, J.T.; visualization, Y.H.; supervision, M.C.; project administration, M.C.; funding acquisition, J.T. All authors have read and agreed to the published version of the manuscript.

Funding

This work was supported by the authors are especially grateful to the: Key Program of National Natural Science Foundation of China, grant number U23A20608; Liaoning Province Science and Technology Plan Joint Program (Key Research and Development Program Project), grant number 2023JH2/101800058; the National Natural Science Foundation of China, grant number 51904063; Fundamental Research Funds for the Central Universities, grant numbers N2025023 and N2225046; Science and Technology Plan Project of Liaoning Province, grant number 2022JH24/10200027; Science and Technology Plan Project of Hebei Province, grant number 23314601L; Science and Technology Program of Liaoning of China, grant number 2023JH2/101700304; the Project of Hydrogen-Based Shaft Furnace Reduction—Electric Furnace Melting and Separation Technology Research and Application for High-Titanium Magnetite Iron Ore, grant number HG2023239.

Data Availability Statement

The original contributions presented in this study are included in the article. Further inquiries can be directed to the corresponding author.

Conflicts of Interest

Author Yun Huang was employed by the company Pangang Group Xichang Steel Vanadium Co., Ltd. The remaining authors declare that the research was conducted in the absence of any commercial or financial relationships that could be construed as a potential conflict of interest.

References

  1. Shi, Q.; Tang, J.; Chu, M.S. Process metallurgy and data-driven prediction and feedback of blast furnace heat indicators. Int. J. Miner. Metall. Mater. 2024, 31, 1228. [Google Scholar] [CrossRef]
  2. Kawashiri, Y.; Nouchi, T.; Matsuno, H. Effect of Nitrogen-less Reducing Atmosphere on Permeability of Cohesive Layer in Blast Furnace. ISIJ Int. 2020, 60, 1395. [Google Scholar] [CrossRef]
  3. Orth, A.; Anastasijevic, N.; Eichberger, H. Low CO2 Emission Technologies for Iron and Steelmaking as well as Titania Slag Production. Miner. Eng. 2007, 20, 854. [Google Scholar] [CrossRef]
  4. Xu, C.B.; Cang, D.C. A Brief Overview of Low CO2 Emission Technologies for Iron and Steel Making. J. Iron Steel Res. Int. 2010, 17, 1. [Google Scholar] [CrossRef]
  5. Chu, M.S.; Nogami, H.; Yagi, J. Numerical Analysis on Injection of Hydrogen Bearing Materials into Blast Furnace. ISIJ Int. 2004, 14, 801. [Google Scholar] [CrossRef]
  6. Tang, J.; Chu, M.S.; Li, F. Development and Progress on Hydrogen Metallurgy. Int. J. Miner. Metall. Mater. 2020, 27, 713. [Google Scholar] [CrossRef]
  7. Tang, J.; Chu, M.S.; Li, F. Mathematical Simulation and Life Cycle Assessment of Blast Furnace Operation with Hydrogen Injection Under Constant Pulverized Coal Injection. J. Clean. Prod. 2021, 78, 278. [Google Scholar] [CrossRef]
  8. Takahashi, K.; Nouchi, T.; Sato, M. Perspective on Progressive Development of Oxygen Blast Furnace for Energy Saving. ISIJ Int. 2015, 55, 1866. [Google Scholar] [CrossRef]
  9. Pan, Z.D.; Liu, X.W.; Li, J.W. Blast Furnace Ironmaking Process with Super High TiO2 in the Slag: High-Temperature Structure of the Slag. Metall. Mater. Trans. B 2020, 51, 2348. [Google Scholar]
  10. Cheng, G.J.; Liu, J.X.; Xue, X.X. Non-isothermal Reduction Mechanism and Kinetics of High Chromium Vanadium–titanium Magnetite Pellets. Ironmak. Steelmak. 2015, 42, 17. [Google Scholar] [CrossRef]
  11. Sui, Y.L.; Guo, Y.F.; Jiang, T. Separation and Recovery of Iron and Titanium from Oxidized Vanadium Titano-Magnetite by Gas-Based Reduction Roasting and Magnetic Separation. JMRT 2019, 8, 3036. [Google Scholar] [CrossRef]
  12. Guo, X.F.; Dai, S.J.; Wang, Q.Q. Influence of different comminution flowsheets on the separation of vanadium titano-magnetite. Miner. Eng. 2020, 149, 1. [Google Scholar] [CrossRef]
  13. Dmitriev, A.; Alektorov, R.; Vitkina, G.; Chesnokov, Y. Features of the Reducibility of Titanomagnetite Iron Ore Materials. Defect Diffus. Forum 2020, 400, 176. [Google Scholar] [CrossRef]
  14. Ostrovski, O.; Zhang, G.; Kononov, R.; Li, J. Carbothermal Solid State Reduction of Stable Metal Oxides. Steel Res. Int. 2010, 81, 841. [Google Scholar] [CrossRef]
  15. Zhao, W.; Chu, M.S.; Wang, H.T. Reduction Behavior of Vanadium-Titanium Magnetite Carbon Composite Hot Briquette in Blast Furnace Process. Powder Technol. 2019, 342, 214. [Google Scholar] [CrossRef]
  16. Chen, W.B.; Dong, Z.Q.; Jiao, Y. Preparation, Sintering Behavior and Consolidation Mechanism of Vanadium-Titanium Magnetite Pellets. Crystals 2021, 11, 188. [Google Scholar] [CrossRef]
  17. Gan, M.; Sun, Y.F.; Fan, X.H. Preparing High-Quality Vanadium Titano-Magnetite Pellets for Large-Scale Blast Furnaces as Ironmaking Burden. Ironmak. Steelmak. 2022, 47, 130. [Google Scholar] [CrossRef]
  18. Zhang, X.S.; Zou, Z.S.; Luo, Z.G. Numerical Simulation on Characteristics of COREX Shaft Furnace with Central Gas Distribution. J. Iron Steel Res. Int. 2019, 26, 567. [Google Scholar] [CrossRef]
  19. He, Y.N.; Pistorius, P.C. Laboratory Carburization of Direct-Reduced Iron in CH4-H2-N2 Gas Mixtures, and Comparison with Industrial Samples. Metall. Mater. Trans. B 2016, 47, 1538. [Google Scholar] [CrossRef]
  20. Cheraghi, A.; Yoozbashizadeh, H.; Ringdalen, E. Kinetics and Mechanism of Low-Grade Manganese Ore Reduction by Natural Gas. Metall. Mater. Trans. B 2019, 50, 1566. [Google Scholar] [CrossRef]
  21. Srishilan, C.; Shukla, A.K. Model of COREX Melter Gasifier Using FactSage™ and Macro Facility. Metall. Mater. Trans. B 2019, 50, 312. [Google Scholar] [CrossRef]
  22. Iwai, Y.; Ishiwata, N.; Murai, R. Shaft Furnace Simulation by Mathematical Model Considering Coke Gasification Rate in High Temperatur. Tetsu Hagane 2015, 101, 416. [Google Scholar] [CrossRef]
  23. Xu, K.; Bai, M.H. DEM simulation of particle descending velocity distribution in the reduction shaft furnace. Metall. Res. Technol. 2016, 113, 16. [Google Scholar] [CrossRef]
  24. Liu, Z.J.; Liu, S.F.; Wang, Y.Z. Optimization of Hydrogen-Based Shaft Furnace Raw Material Parameters Based on Numerical Simulation and Rist Operation Diagram. Metall. Mater. Trans. B 2023, 54, 2135. [Google Scholar] [CrossRef]
  25. Shao, L.; Xu, J.; Saxen, H. A numerical study on process intensification of hydrogen reduction of iron oxide pellets in a shaft furnace. Fuel 2023, 348, 8. [Google Scholar] [CrossRef]
  26. Jiang, X.; Yu, J.X.; Wang, L. Distribution of reformed coke oven gas in a shaft furnace. J. Iron Steel Res. Int. 2020, 27, 1389. [Google Scholar] [CrossRef]
  27. Li, Z.Y.; Qi, Z.; Zhang, L.C. Numerical simulation of H2-intensive shaft furnace direct reduction process. J. Clean. Prod. 2023, 109, 2. [Google Scholar] [CrossRef]
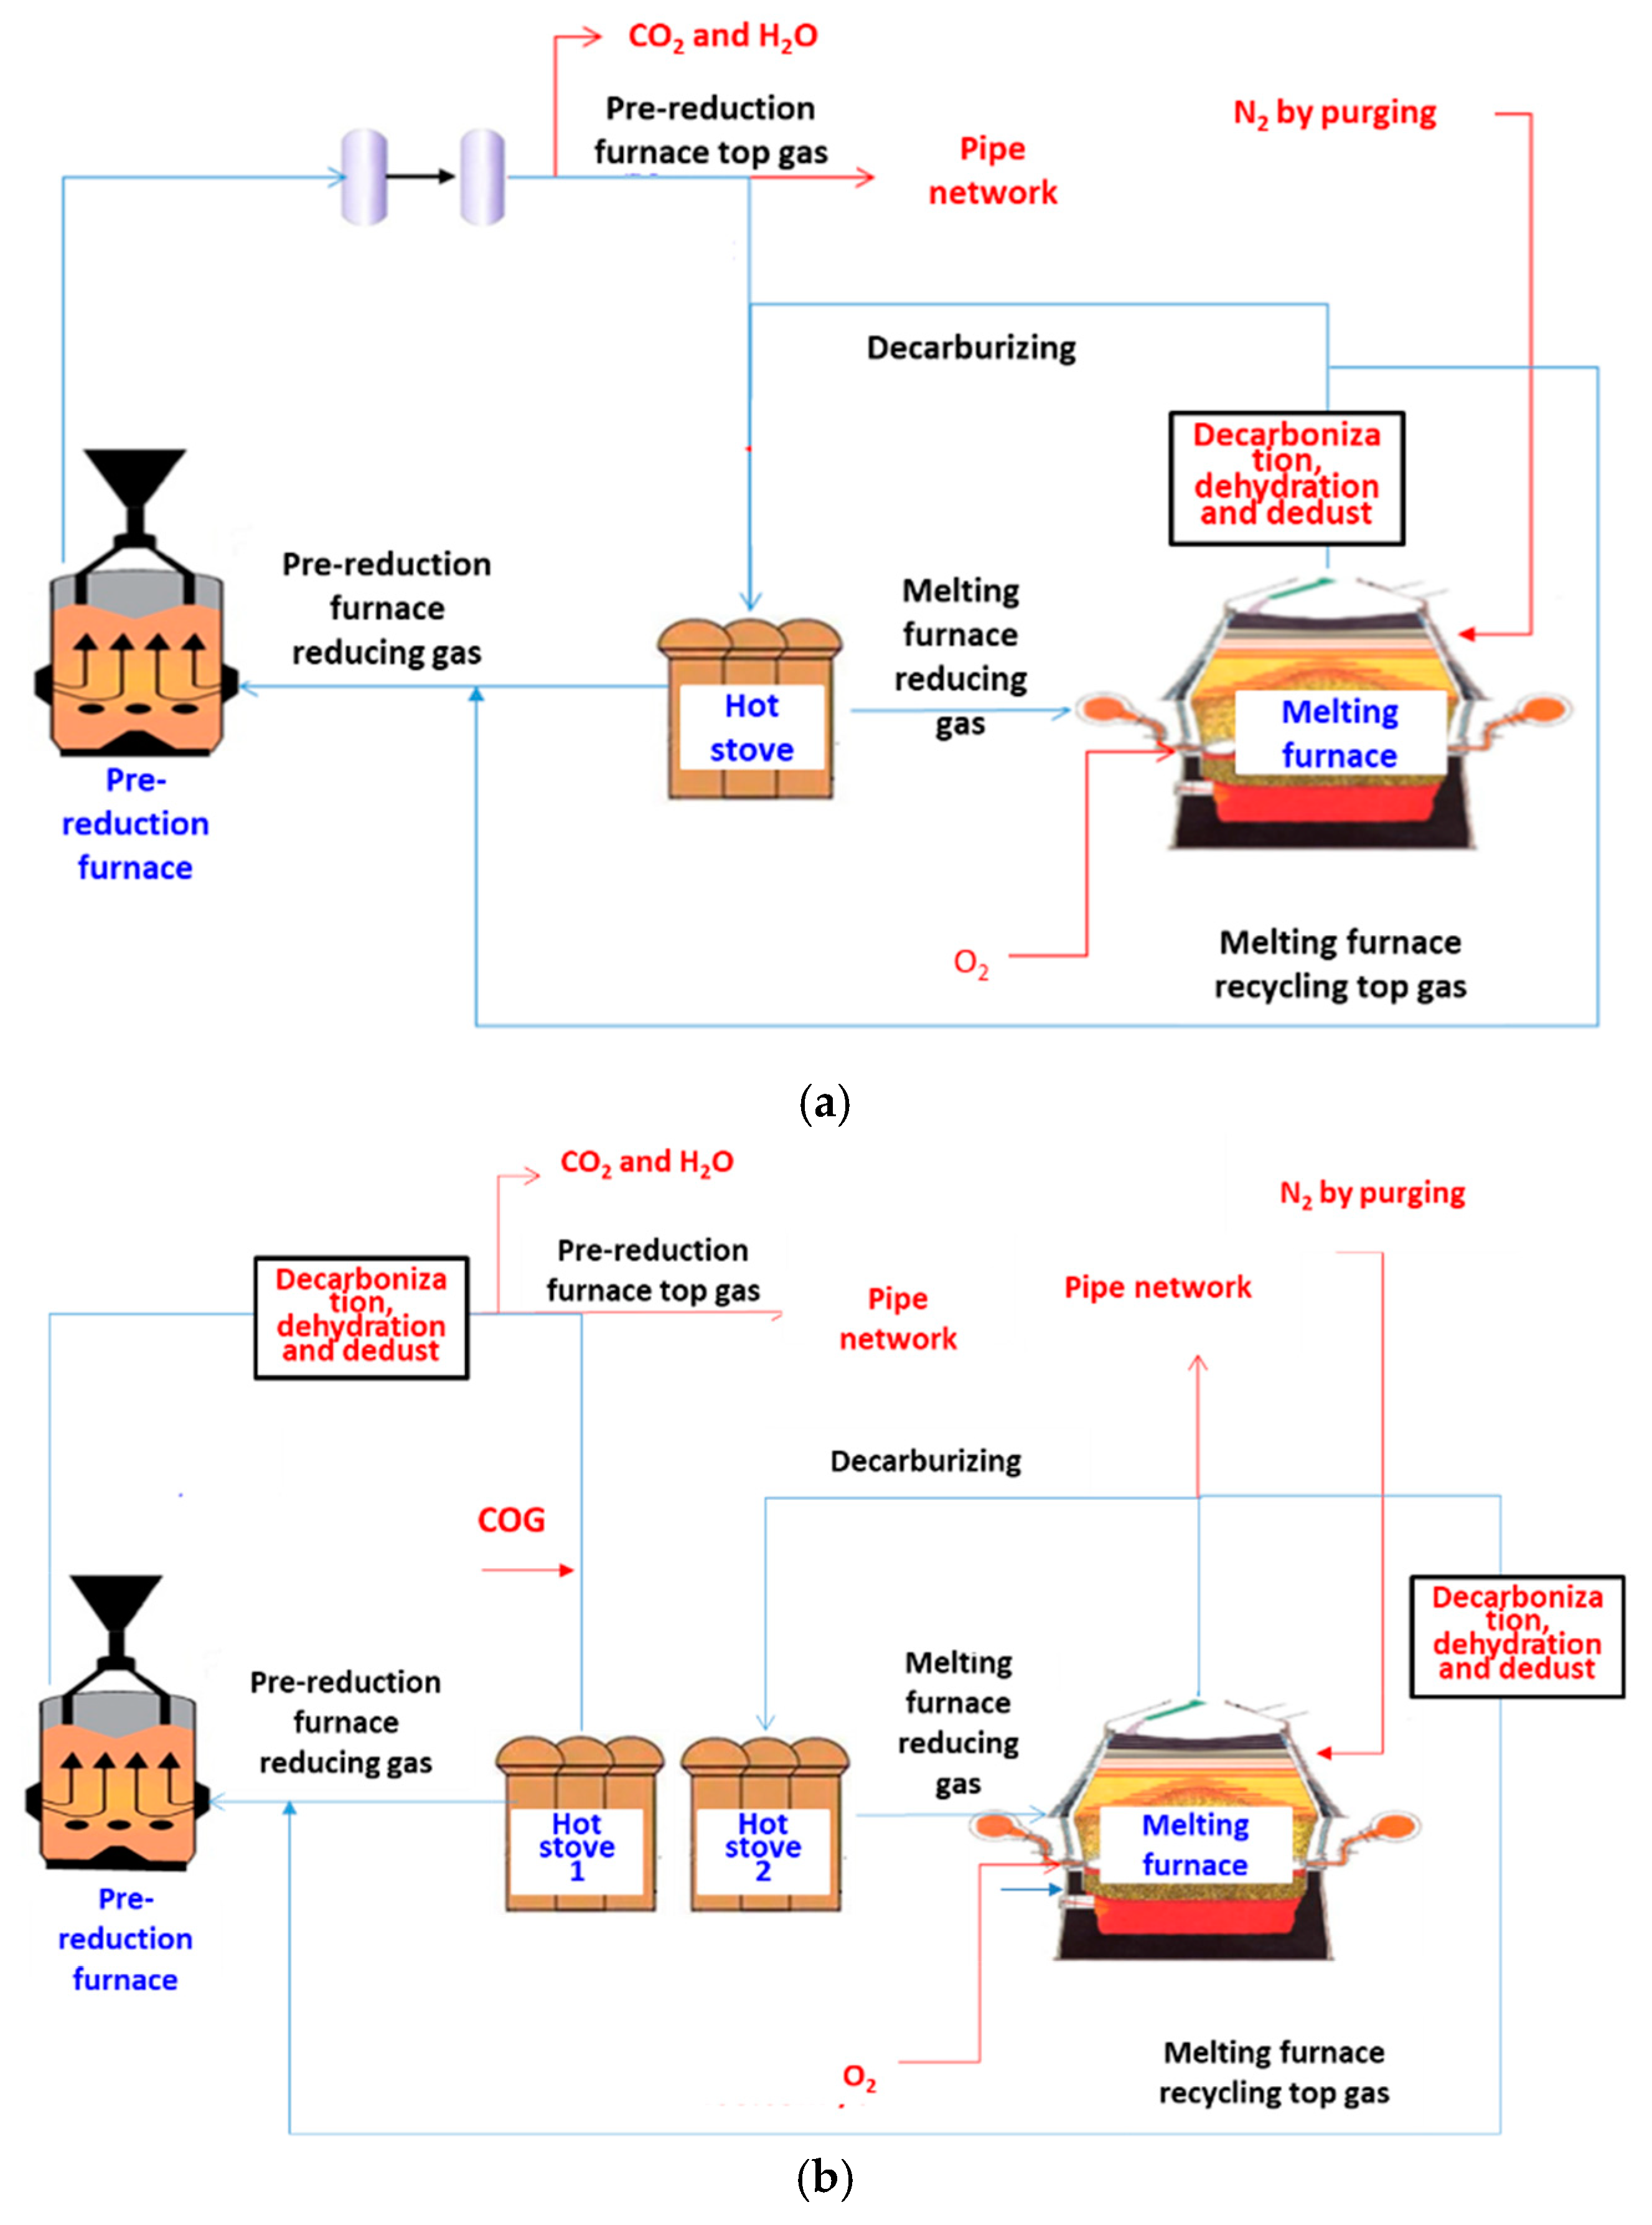
Figure 1. Process diagram of Route 1 and Route 2. (a) Route 1; (b) Route 2. The red arrows represent the exchange of substances outside the system, and the blue arrows represent the circulation of substances within the system.
Metals 15 00461 g001
Figure 2. Technological process of Route 1. The red arrows represent the exchange of substances outside the system, and the blue arrows represent the circulation of substances within the system.
Metals 15 00461 g002
Figure 3. Technological process of Route 2. (The red arrows represent the exchange of substances outside the system, and the blue arrows represent the circulation of substances within the system).
Metals 15 00461 g003
Figure 4. Gas destination with different pre-reduction reducing gas flow rates. (a) Pre-reduction furnace to hot stove; (b) melting furnace to pre-reduction furnace; (c) hot stove to pre-reduction furnace; (d) gas to pipe networks.
Metals 15 00461 g004
Figure 5. Key parameters of pre-reduction furnace with different reducing gas flow rates.
Metals 15 00461 g005
Figure 6. CO2 emission of pre-reduction furnace, melting furnace, and whole process with different pre-reduction reducing gas flow rates.
Metals 15 00461 g006
Figure 7. Input and output exergies of pre-reduction furnace with different pre-reduction reducing gas flow rates. (a) Input exergy of PLCsmelt process with different pre-reduction reducing gas flow rates (1—chemical exergy of pre-reduction furnace reducing gas; 2—physical exergy of pre-reduction furnace reducing gas; 3—chemical exergy of pellet; 4—chemical exergy of melting furnace reducing gas; 5—physical exergy of melting furnace reducing gas; 6—chemical exergy of pure oxygen; 7—physical exergy of pure oxygen; 8—chemical exergy of coke); (b) output exergy of PLCsmelt process with different pre-reduction reducing gas flow rates (1—internal exergy loss; 2—heat transfer exergy loss; 3—heat dissipation exergy loss; 4—chemical exergy of pre-reduction furnace top gas; 5—physical exergy of pre-reduction furnace top gas; 6—chemical exergy of dust; 7—physical exergy of dust; 8—chemical exergy of melting furnace top gas; 9—physical exergy of melting furnace top gas; 10—chemical exergy of slag; 11—physical exergy of slag; 9—physical exergy of melting furnace top gas; 12—chemical exergy of hot metal; 13—physical exergy of hot metal).
Metals 15 00461 g007
Figure 8. Energy utilization efficiency of pre-reduction furnace with different pre-reduction reducing gas flow rates.
Metals 15 00461 g008
Figure 9. Gas to pipe networks with different melting furnace coke ratios.
Metals 15 00461 g009
Figure 10. Melting furnace reducing gas flow rate and oxygen flow rate with different melting furnace coke ratios.
Metals 15 00461 g010
Figure 11. CO2 emission of pre-reduction furnace, melting furnace, and whole process with different coke ratios. (a) CO2 emissions of the pre-reduction furnace, melting furnace, and total system; (b) melting furnace top gas flow rate, pre-reduction furnace top gas flow rate, and CO2 concentration in the top gas.
Metals 15 00461 g011
Figure 12. Input and output exergies with different coke ratios. (a) Input exergy of PLCsmelt process with different coke ratios (1—chemical exergy of pre-reduction furnace reducing gas; 2—physical exergy of pre-reduction furnace reducing gas; 3—chemical exergy of pellet; 4—chemical exergy of melting furnace reducing gas; 5—physical exergy of melting furnace reducing gas; 6—chemical exergy of pure oxygen; 7—physical exergy of pure oxygen; 8—chemical exergy of coke); (b) output exergy of PLCsmelt process with different coke ratios (1—internal exergy loss; 2—heat transfer exergy loss; 3—heat dissipation exergy loss; 4—chemical exergy of pre-reduction furnace top gas; 5—physical exergy of pre-reduction furnace top gas; 6—chemical exergy of dust; 7—physical exergy of dust; 8—chemical exergy of melting furnace top gas; 9—physical exergy of melting furnace top gas; 10—chemical exergy of slag; 11—physical exergy of slag; 9—physical exergy of melting furnace top gas; 12—chemical exergy of hot metal; 13—physical exergy of hot metal).
Metals 15 00461 g012
Figure 13. Energy utilization efficiency of PLCsmelt process with different coke ratios.
Metals 15 00461 g013
Figure 14. Comparative analysis of different low-carbon processes. (a) Cost of hot metal; (b) carbon emission; (c) total environment impact.
Metals 15 00461 g014
Table 1. Main reactions in pre-reduction furnace.
13Fe2O3 + CO = 2Fe3O4 + CO2
2Fe3O4 + CO=3FeO + CO2
3FeO + CO = Fe + CO2
43Fe2O3 + H2 = 2Fe3O4 + H2O
5Fe3O4 + H2 = 3FeO + H2O
6FeO + H2 = Fe + H2O
7H2 + CO2 = H2O + CO
Table 2. Mass balance of O.
ProjectElement Balance
InputOre O ore = ω Fe 2 O 3 100 × M ore × 48 160 + ω FeO 100 × M ore × 16 72 + ω TiO 2 100 M ore × 32 80 + ω V 2 O 5 100 M ore × 80 182 + ω SiO 2 100 M ore × 32 60
Pure oxygen O blast = V O × 32 22.4
Coke8
Recycling gas O rec = V rec × φ CO 100 × 16 22.4
O input O in = O ore + O blast + O coke + O rec
OutputTop gas O g = V g × ( φ g , CO 100 × 16 22 . 4 + φ g , H 2 O 100 × 16 22 . 4 + φ g , CO 2 100 × 32 22 . 4 )
Slag   O slag = S × ω s , TiO 2 , i 100 × 32 80 + ω s , SiO 2 , i 100 × 32 60 + ω s , V 2 O 5 , i 100 × 80 182
Hot metal
O output O out = O g + O slag
Table 3. Mass balance of C.
ProjectElement Balance
InputCoke C coke = W × ω coke , C 100
Recycling gas C rec = V rec × φ CO 100 × 12 22.4
C input C in = C coke + C rec
OutputTop gas C g = V g × φ g , CO 100 × 12 22.4 + φ g , CO 2 100 × 12 22.4
Hot metal C m = 1000 × ω coke , m 100
C output C out = C g + C m
Table 4. Mass balance of H.
ProjectElement Balance
Recycling gas H rec = V rec × φ H 2 100 × 2 22.4 + φ H 2 O 100 × 2 22.4
H input H in = H rec
OutputTop gas H g = V g × φ g , H 2 100 × 2 22.4 + φ g , H 2 O 100 × 2 22.4
H output H out = H g
Table 5. Components of vanadium–titanium magnetite.
ComponentTFeFeOSiO2Al2O3MgOCaOTiO2V2O5
%55.950.002.893.332.983.3310.350.40
Table 6. Components of coke in Route 1 and Route 2.
ComponentCCaOSiO2MgOAl2O3CaS
Route 183.500.617.912.824.380.78
Route 286.77 0.64 6.56 2.08 3.13 0.82
Table 7. Calculation conditions of pre-reduction furnace in Route 1 and Route 2.
ProjectUnitRoute 1Route 2
Reducing gas temperature°C10001000
Metallization ratio-0.750.90
Pellet ratiokg/tHM18241824
DRI temperature°C800800
Table 8. Calculation conditions of melting furnace in Route 1 and Route 2.
ProjectUnitRoute 1Route 2
Coke ratiokg/tHM380.00320.00
Hot metal temperature°C14501450
Slag temperaure°C15001500
DRI charging temperature°C800800
Coke charging tempareture°C2525
Oxygen blast temperature°C2525
Recycling gas blast temperature°C12001200
Table 9. Calculation results of Route 1.
Component of melting furnace top gas
COCO2H2H2ON2Sum
Nm3/tHM1331.2100.01085.311416.53
%93.9700.0006.02100
Component of hot stove reducing gas
COCO2H2H2ON2Sum
Nm3/tHM2045.0700.020192.222237.31
%91.4100.0008.59100
Component of pre-reduction furnace reducing gas
COCO2H2H2ON2Sum
Nm3/tHM1470.3400.010129.651600
%91.9000.0008.10100
Component of pre-reduction furnace top gas
COCO2H2H2ON2Sum
Nm3/tHM1035.61434.730.010129.651600
%64.7327.17008.1100
Component of pre-reduction furnace top gas with decarburization, dehydration, and dedust processes
COCO2H2H2ON2Sum
Nm3/tHM1035.6100.000129.651165.26
%88.8700.00011.13100
Gas destination in PLCsmelt process
SourcesDestinationFlow Rate/(Nm3/tHM)
1Decarburized pre-reduction furnace top gasHot stove1125.59
2Decarburized melting furnace top gasHot stove1111.72
3Decarburized melting furnace top gasPre-reduction furnace304.40
4Hot stovePre-reduction furnace1295.60
5Hot stoveMelting furnace941
6Emission of decarburized pre-reduction furnace top gasPipe network40
Melting parameters of melting furnace
UnitValue
Top gas temperature°C727.39
Pure oxygen flow rateNm3/tHM221.58
Reducing gas flow rate°C941
Utilization of CO%2.77
Utilization of H2%0.00
CO2 emissionNm3/tHM37.87
Melting parameters of pre-reduction furnace
ProjectUnitValue
Top gas temperatureK720
Top gas flow rateNm3/tHM1600
Utilization of CO%29.56
Utilization of H2%0
CO2 emissionNm3/tHM434.72
Table 10. Calculation results of Route 2.
Component of melting furnace top gas
COCO2H2H2ON2Sum
Nm3/tHM1321.5118.9009.591350.00
%97.891.400.000.000.71100.00
Component of hot stove reducing gas
COCO2H2H2ON2Sum
Nm3/tHM475.120.001011.110.00135.001621.23
%29.310.0062.370.008.33100.00
Component of pre-reduction furnace reducing gas
COCO2H2H2ON2Sum
Nm3/tHM652.0201011.110136.871800
%36.220.0056.170.007.60100
Component of pre-reduction furnace top gas
COCO2H2H2ON2Sum
Nm3/tHM447.81204.21725.32285.79136.871800
%24.8811.3440.315.887.6100
Component of pre-reduction furnace top gas with decarburization, dehydration, and dedust processes
COCO2H2H2ON2Sum
Nm3/tHM447.810725.320136.871310
%34.18055.37010.45100
Gas destination in PLCsmelt process
SourcesDestinationFlow Rate/(Nm3/tHM)
1Decarburized pre-reduction furnace top gasHot Stove 11021
2COGHot Stove 1362.83
3Decarburized melting furnace top gasPre-reduction furnace178.77
4Hot Stove 1Pre-reduction furnace1621.23
5Hot Stove 2Melting furnace915
6Decarburized melting furnace top gasPipe network241
7Decarburized pre-reduction furnace top gasPipe network289
Melting parameters of melting furnace
ProjectUnitValue
Top gas temperature°C784.93
Pure oxygen flow rateNm3/tHM193.63
Reducing gas flow rateNm3/tHM915
Utilization of CO%1.41
Utilization of H2%0.00
CO2 emissionNm3/tHM18.93
Melting parameters of pre-reduction furnace
ProjectUnitValue
Top gas temperatureK575
Top gas flow rateNm3/tHM1800
Utilization of CO%31.32
Utilization of H2%28.26
CO2 emissionNm3/tHM204.20
Table 11. Modeling results.
Component of melting furnace top gas with decarburization, dehydration, and dedusting processes/%
Reducing gas flow rate/(Nm3/tHM)COCO2H2H2ON2
160097.89 1.40 0.00 0.00 0.71
170097.89 1.40 0.00 0.00 0.71
180097.89 1.40 0.00 0.00 0.71
190097.89 1.40 0.00 0.00 0.71
200097.89 1.40 0.00 0.00 0.71
Component of Hot Stove 1 reducing gas/%
Reducing gas flow rate/(Nm3/tHM)COCO2H2H2ON2
160027.470.0063.580.008.95
170028.280.0062.850.008.87
180029.310.0062.370.008.33
190029.890.0061.450.008.67
200030.680.0060.770.008.55
Component of pre-reduction furnace reducing gas/%
Reducing gas flow rate/(Nm3/tHM)COCO2H2H2ON2
160034.560.0057.270.008.17
170035.300.0056.610.008.09
180036.220.0056.170.007.60
190036.750.0055.340.007.91
200037.470.0054.730.007.80
Component of pre-reduction furnace top gas/%
Reducing gas flow rate/(Nm3/tHM)COCO2H2H2ON2
160021.8912.6838.1719.18.16
170023.1111.9538.8917.728.09
180024.8811.3440.315.887.6
190025.4110.8840.9315.417.37
200026.4910.4441.5914.447.04
Component of pre-reduction furnace top gas with decarburization, dehydration, and dedusting processes
Reducing gas flow rate/(Nm3/tHM)COCO2H2H2ON2
160032.08055.95011.97
170032.97055.48011.55
180034.18055.37010.45
190034.68054.51010.81
200035.51054.02010.46
Table 12. Calculation results.
Component of melting furnace top gas with decarburization, dehydration, and dedusting processes/%
Coke ratio/(kg/tHM)COCO2H2H2ON2
30097.711.520.000.000.77
31097.80 1.46 0.00 0.00 0.74
32097.89 1.40 0.00 0.00 0.71
33097.97 1.35 0.00 0.00 0.69
34098.04 1.30 0.00 0.00 0.66
Component of Hot Stove 1 reducing gas/%
Coke ratio/(kg/tHM)COCO2H2H2ON2
30029.290.0062.350.008.36
31029.300.0062.360.008.34
32029.310.0062.370.008.33
33029.310.0062.370.008.31
34029.320.0062.380.008.30
Component of pre-reduction furnace reducing gas/%
Coke ratio/(kg/tHM)COCO2H2H2ON2
30036.200.0056.160.007.64
31036.210.0056.170.007.62
32036.220.0056.170.007.60
33036.230.0056.180.007.59
34036.250.0056.180.007.57
Component of pre-reduction furnace top gas/%
Coke ratio/(kg/tHM)COCO2H2H2ON2
30024.8511.3440.2815.887.64
31024.8711.3440.2915.887.62
32024.8811.3440.315.887.6
33024.8911.3540.315.887.59
34024.911.3540.3115.877.57
Component of pre-reduction furnace top gas with decarburization, dehydration, and dedusting processes
Coke ratio/(kg/tHM)COCO2H2H2ON2
30034.15055.35010.50
31034.17055.36010.47
32034.18055.37010.45
33034.20055.38010.42
34034.21055.39010.40
Table 13. Normalization factors.
ProjectCarbon Emission Factor
Energy consumption in pellet production2.69
Energy consumption in sinter production2.69
Energy consumption in coke production2.69
Coke3.257
Semi-coke2.70
Coal2.87
Electric0.581
Coke oven gas0.635
Hot metal0.16
TRT electric recycling0.36
Top gas of TBF0.357
Top gas of PLC0.885
DRI0.037
Top gas of SF0.387
Anthracite of HISMELT2.995
Soft coal of HISMELT 2.784
Top gas of HISMELT 0.223
Hot metal of HISMELT0.147
Coke of FINEX2.54
Coal of FINEX 2.784
Top gas of FINEX 0.409
Disclaimer/Publisher’s Note: The statements, opinions and data contained in all publications are solely those of the individual author(s) and contributor(s) and not of MDPI and/or the editor(s). MDPI and/or the editor(s) disclaim responsibility for any injury to people or property resulting from any ideas, methods, instructions or products referred to in the content.