Article

Atomic-Scale Study on the Composition Optimization and Deformation Mechanism of FeNiAl Alloys

1
State Key Laboratory of Advanced Processing and Recycling of Non-Ferrous Metals, School of Materials Science and Engineering, Lanzhou University of Technology, Lanzhou 730050, China
2
Stainless Steel Research Institute, Gansu Jiu Steel Group Hongxing Iron & Steel Co., Ltd., Jiayuguan 735100, China
*
Authors to whom correspondence should be addressed.
The authors contributed equally to this work.
Metals 2025, 15(4), 460; https://doi.org/10.3390/met15040460
Submission received: 12 March 2025 / Revised: 3 April 2025 / Accepted: 14 April 2025 / Published: 18 April 2025

Abstract

The generalized stacking fault energy (GSFE) and shear modulus (G) are critical parameters in determining the strength and ductility balance of Fe-based alloys, playing a significant role in alloy design and performance optimization. This study focuses on FeNiAl alloys and proposes a composition optimization method based on molecular dynamics simulations. The results reveal that Fe90Ni9Al alloy exhibits the best synergy between strength and ductility, achieving a yield strength of up to 16.33 GPa and a yield strain of 10.4%. During tensile deformation, this alloy demonstrates a complex microstructural evolution, including dislocation slip, phase transformations, and deformation twinning. These mechanisms collectively contribute to the significant enhancement of its mechanical properties. This study not only elucidates the profound influence of GSFE and G on the micro-deformation mechanisms and macroscopic mechanical properties of FeNiAl alloys but also establishes an efficient composition design and screening system. This system provides theoretical support and practical guidance for the rapid development of novel alloy materials with balanced strength and ductility. The proposed method is broadly applicable to the design and optimization of high-performance structural materials, offering critical insights for advancing the application of lightweight and high-strength metallic materials in aerospace, automotive manufacturing, and other fields.

1. Introduction

Alloy materials based on Fe have become fundamental in fields such as construction, machinery, and transportation due to their excellent mechanical properties, cost-effectiveness, and extensive machinability [1,2,3]. In recent years, with the rapid advancement of technology, research on Fe-based alloys has made significant progress, particularly microstructural control [4], performance optimization [5], and the expansion of novel application fields. Microstructure is regarded as one of the key factors determining alloy performance. Researchers have significantly enhanced the strength and ductility of Fe-based alloys by doping with different elements, adjusting composition ratios, and optimizing heat treatment processes. For example, solution strengthening and the regulation of precipitates have substantially improved the strength and hardness of materials [6,7]. Additionally, specific heat treatment processes can effectively enhance the comprehensive properties of materials to meet the requirements of various engineering applications [8].
Although Fe-based alloys exhibit excellent performance, their complex phase transformation behavior and the regulation of mechanical stability still pose significant challenges [9]. Existing studies have shown that the microstructure and compositional ratios of alloys have a decisive impact on their mechanical properties [10]. By deeply investigating the intrinsic relationship between composition and microstructure, not only can material performance be enhanced, but its application scenarios can also be expanded. Currently, researchers are focusing on developing composition design methods to achieve an optimal balance between strength and ductility [11,12]. However, existing research still has limitations, particularly in addressing extreme service conditions and meeting the demands of high-end applications. Therefore, exploring new pathways for alloy composition design has become a critical direction in materials science. However, although significant advances have been made in alloy composition optimization and the understanding of deformation mechanisms in high- and medium-entropy alloys [13,14,15,16,17,18,19,20], several limitations remain. For instance, Wan et al. [13] and Cantor et al. [14] laid the foundational work on multicomponent alloys, while Han et al. [15] and Zhang et al. [16] demonstrated the trade-off between strength and plasticity through composition tuning. More recent efforts by Wang et al. [17] and Xu et al. [18] have focused on tailoring stacking fault energy to enhance mechanical properties. Yet, these strategies still face challenges in ensuring performance under extreme service environments. Laplanche et al. [19] and Schneider et al. [20] also reported difficulties in maintaining stability and ductility simultaneously across wide temperature ranges. These limitations highlight the necessity for a new paradigm in alloy design that systematically links composition, microstructure, and mechanical performance. Thus, our study aims to establish a novel composition screening method that not only optimizes strength and ductility but also offers robust performance under complex conditions, thereby advancing the field of high-performance structural materials.
In recent years, researchers have developed a series of novel alloy materials with excellent properties by optimizing the proportions of Fe, Ni, and Al. For example, Wu et al. [21] significantly improved the strength and wear resistance of CrFeNiAl alloys by adjusting the ratio of B2 and A2 phases in high-entropy alloys. Similarly, Gao et al. [22], through molecular dynamics simulations and thermodynamic calculations, identified optimal non-equiatomic NiCoMn alloy compositions with the best shear modulus and stacking fault energy. Their results demonstrated that precise adjustment of composition ratios enables accurate optimization of mechanical properties. In summary, by fine-tuning the composition ratios of alloys, researchers are making strides in developing new alloy materials with superior mechanical properties [23,24]. Therefore, exploring the relationship between the composition ratios and mechanical properties of FeNiAl alloys not only holds significant scientific value but also has profound implications for advancing related industries.
Recent studies have emphasized the core role of chemical composition in microstructure evolution and mechanical behavior regulation, which is helpful to regulate stacking fault energy (SFE), shear modulus, and phase stability, to improve strength and plasticity synergistically. Although the traditional experimental “trial and error method” has promoted the component design to a certain extent, it is difficult to meet the needs of rapid development of modern materials due to its low efficiency and high cost in the face of high-dimensional complex component space.
In response to the above problems, researchers have developed a multi-scale alloy design method that integrates molecular dynamics (MD) simulation, thermodynamic calculation, and machine learning. Among them, phase diagram calculation (such as the CALPHAD method) serves as both a key theoretical prediction tool and an important verification method, helping to confirm the phase stability and solidification behavior of the designed components. It can establish quantitative relationships among composition, phase stability, and solidification path, thereby providing a reliable basis for performance-oriented composition screening by identifying single-phase regions, metastable phase regions, and their evolution trends. This method has been successfully applied in high-performance Al alloys and high/medium-entropy alloys, which significantly improves the efficiency and scientificity of component screening and effectively reduces the cost of experimental development. Molecular dynamics (MD) simulations have emerged as a powerful tool for studying the atomic-scale mechanisms of deformation and phase transitions in metallic materials. For example, Borovikov et al. [25] and Branicio et al. [26] utilized MD simulations to explore twin nucleation and stacking fault behavior in Ni-based and InP-based systems, respectively. Jarlöv et al. [27] investigated the influence of stacking fault energy on the mechanical response of high-entropy alloys, while Yan et al. [28] and Liu et al. [29] studied dislocation evolution under nanoindentation and uniaxial tension. Similarly, Gao et al. [30] and Fang et al. [31] revealed the evolution of dislocations and phase transformations in high-entropy alloys using MD simulations. These studies provide valuable insights into deformation mechanisms and validate the use of MD in predicting mechanical properties. Building upon this foundation, our work employs MD to systematically evaluate the impact of composition variations on stacking fault energy and shear modulus in FeNiAl alloys, aiming to identify compositions with an optimal strength–ductility balance. Through this research, we strive to identify the FeNiAl alloy composition with the optimal combination of strength and ductility, providing theoretical support and practical guidance for developing Fe-based alloys. Specifically, starting with alloy composition design, molecular dynamics simulations will be employed to predict the shear modulus (G) [26] and stacking fault energy (γISF) [27] of alloys with various compositions, screening for promising candidate compositions. “The time step for all molecular dynamics simulations was set to 0.001 ps. Subsequently, these candidates will undergo tensile testing to analyze their mechanical properties and microstructural features. The composition that achieves the best synergy between strength and ductility will be selected as the optimal FeNiAl alloy. In addition to identifying the optimal FeNiAl alloy composition, we aim to establish a comprehensive methodology for alloy composition design and mechanical performance optimization. By precisely controlling the elemental ratios within the alloy, this approach is expected to enable accurate tuning of mechanical properties, thereby meeting the diverse requirements of various engineering applications.

2. Simulation Methods

2.1. Model

The Embedded Atom Method (EAM) potential is well-suited for describing interactions between metal atoms. In this study, LAMMPS software (https://www.lammps.org/#gsc.tab=0) [32] was used with the atomic potential for FeNiCrCoAl high-entropy alloys [33] to determine the lattice constants of 16 selected compositions, as shown in Table 1. Table 1 represents the initial design space rather than the final set of candidate alloys. Based on consistent criteria—shear modulus and stacking fault energy—alloy compositions with the potential for strength–ductility synergy were subsequently selected. Only these selected compositions were subjected to tensile simulations and deformation mechanism analysis.
Using FCC-Fe as the base element, a cubic model with dimensions of 18 Å × 18 Å × 18 Å was constructed, and Ni and Al atoms were substituted at specified concentrations to measure the lattice constants. Based on the measured lattice constants, new models were constructed [34]. These new models also used FCC-Fe as the base structure, with other atomic types substituted according to specifications while maintaining the same model size. Using linear elasticity theory, the elastic constants C11, C12, and C44 of the FeNiAl alloys were calculated. Subsequently, the bulk modulus (B), shear modulus (G), Young’s modulus (E), and Poisson’s ratio (v) were derived using the corresponding formulas. In our study, two models were employed for different purposes, each carefully chosen based on relevant literature and computational efficiency. The smaller model (18 Å × 18 Å × 18 Å) was explicitly used for calculating the generalized stacking fault energy (GSFE), where a compact and periodic atomic configuration is sufficient and widely adopted in previous studies (e.g., [26,27,34]). This size ensures accurate energy resolution while minimizing boundary effects. For evaluating the mechanical properties of the selected alloy compositions, a significantly larger model (200 Å × 180 Å × 210 Å) was constructed to capture dislocation evolution and phase transformation behaviors under tensile loading. This model size is consistent with prior MD studies that balance computational feasibility with physical accuracy (e.g., [30,31]).
As shown in Figure 1, the calculation schematic for Generalized Stacking Fault Energies (GSFEs) [35] illustrates the entire computational process. When performing GSFE calculations, the model dimensions are first determined based on the lattice constants corresponding to different alloy compositions. The orientations of the three-dimensional spatial coordinate axes x-, y-, and z- of the model are set as [11 2 ¯ ], [1 1 ¯ 0], and [111], respectively. Periodic boundary conditions are applied along the x- and y-axes to simulate an infinite model. In contrast, a free boundary condition is applied along the z-axis to allow for free expansion in the z-direction. The model is divided into two parts: the lower part remains fixed, while the upper part undergoes slip along the [11 2 ¯ ] direction on the (111) plane. The displacement of each slip corresponds to the length of a Burgers vector (bν), which is defined as a0/6<112>, where a0 is the lattice constant. Specifically, a displacement of one bν produces an intrinsic stacking fault (ISF), while a displacement of two bν results in an extrinsic stacking fault (ESF). To evaluate the effect of the slip deformation on the alloy, the stacking fault energy after defect formation is calculated using the formula Ε = Ε f Ε 0 A , where Ε f represents the system energy after the formation of the stacking fault, Ε 0 is the initial system energy, and A is the area of the slip plane. This calculation provides insight into the influence of the slip process on the properties of materials with different compositions, offering a theoretical basis for further optimization of alloy compositions.
Based on the calculated lattice constants and elastic moduli, compositions exhibiting elastic instability (mechanical instability of the crystal structure) were excluded. Compositions with high intrinsic stacking fault energy (ISF) were also eliminated based on GSFE results. The average values of G (shear modulus) and ISF were then computed for the remaining compositions. Compositions with G greater than the average value and ISF lower than the average value were selected. The intersection of these selected compositions was identified as the predicted final composition. Uniaxial tensile tests along the y-axis were conducted on the FeNiAl alloy with the final composition at a temperature of 300 K and a strain rate of 1 × 10⁹ S−1. The strain rate used in the simulation is significantly higher than that in actual experimental conditions; such high strain rates are a common setting in numerical simulations. The time step for all molecular dynamics simulations was set to 0.001 ps, a commonly used value that ensures numerical stability and accurate resolution of atomic interactions throughout the simulation process. The stress–strain curves obtained from the simulations were analyzed to evaluate the mechanical properties, to select the composition that achieves the best combination of strength and ductility.

2.2. Definition Criteria

Research has shown that dislocation slips [28], twinning-induced plastic deformation (TWIP) [29], and transformation-induced plasticity (TRIP) [36] are the primary deformation mechanisms in face-centered cubic (FCC) alloys. A reduction in stacking fault energy (SFE) typically leads to a transition in the deformation mechanism of FCC alloys from dislocation slip to TWIP or TRIP. This transition significantly enhances the alloy’s strength and ductility [37]. Recent studies have found that changes in alloy composition can lower the SFE, triggering either the TWIP or TRIP mechanism, thereby achieving a good combination of strength and plasticity. It is noteworthy that the yield strength is not directly related to the TWIP or TRIP mechanisms, as these mechanisms mainly occur during the plastic deformation stage. The elastic modulus is a key factor influencing the mechanical properties of materials, determining their stress–strain relationship in the elastic stage. Specifically, the shear modulus (G) is closely related to dislocation movement on the slip plane, and the Peierls–Nabarro stress required for dislocation slip [38] is proportional to the shear modulus (G), indicating that G is an essential parameter for evaluating the yield strength of alloys.
Therefore, a criterion can be defined where the size of the Generalized Stacking Fault Energy (GSFE) is used to characterize the plasticity of FeNiAl alloys, and the size of the shear modulus (G) is used to characterize their strength. The lower the GSFE and the higher the G, the better the combination of strength and plasticity, leading to superior alloy performance. To effectively select the composition of FeNiAl alloys with the optimal strength–plasticity combination and better understand the influence of composition on mechanical properties, this study will utilize G and GSFE to assess the alloy’s strength and plasticity.

2.3. Phase Diagram Validation

To further verify the thermodynamic stability of the optimized FeNiAl alloy composition, phase diagram calculations were carried out using Thermo-Calc thermodynamic software (v.2023a) in conjunction with the Fe-based database. This database has been widely applied to Fe-based alloy systems, including ternary and higher-order compositions, and is suitable for the alloy system studied in this work.

3. Results and Discussion

3.1. Lattice Parameters

Under the condition that the Fe content is more significant than 60%, the contents of Ni and Al elements were adjusted, resulting in 16 different compositions, with Fe: 0.6–0.9, Ni: 0.01–0.2, and Al: 0.01–0.39. The test results of the lattice constants for each composition [39] are shown in Figure 2. The x-axis “Type” corresponds to the composition numbers listed in Table 1.
As the Fe content increases, the lattice constant generally exhibits a downward trend. This trend is mainly due to the increase in Fe content, which reduces lattice distortion and makes the lattice structure closer to that of the matrix (pure Fe). For a fixed Fe content, as the Ni content increases, the lattice constant also shows a downward trend. The smallest lattice constant is 3.56 Å for Fe90Ni9Al, while the largest is 3.76 Å for Fe60Ni10Al30, Fe60Ni5Al35, and Fe70NiAl29. The difference between the maximum and minimum values is 0.2 Å, indicating that the addition of Ni and Al elements causes significant lattice distortion [40], which in turn affects the material’s mechanical properties. Figure 2 not only illustrates the variation of lattice constants with composition but also serves as essential support for demonstrating the accuracy and reliability of the model construction.

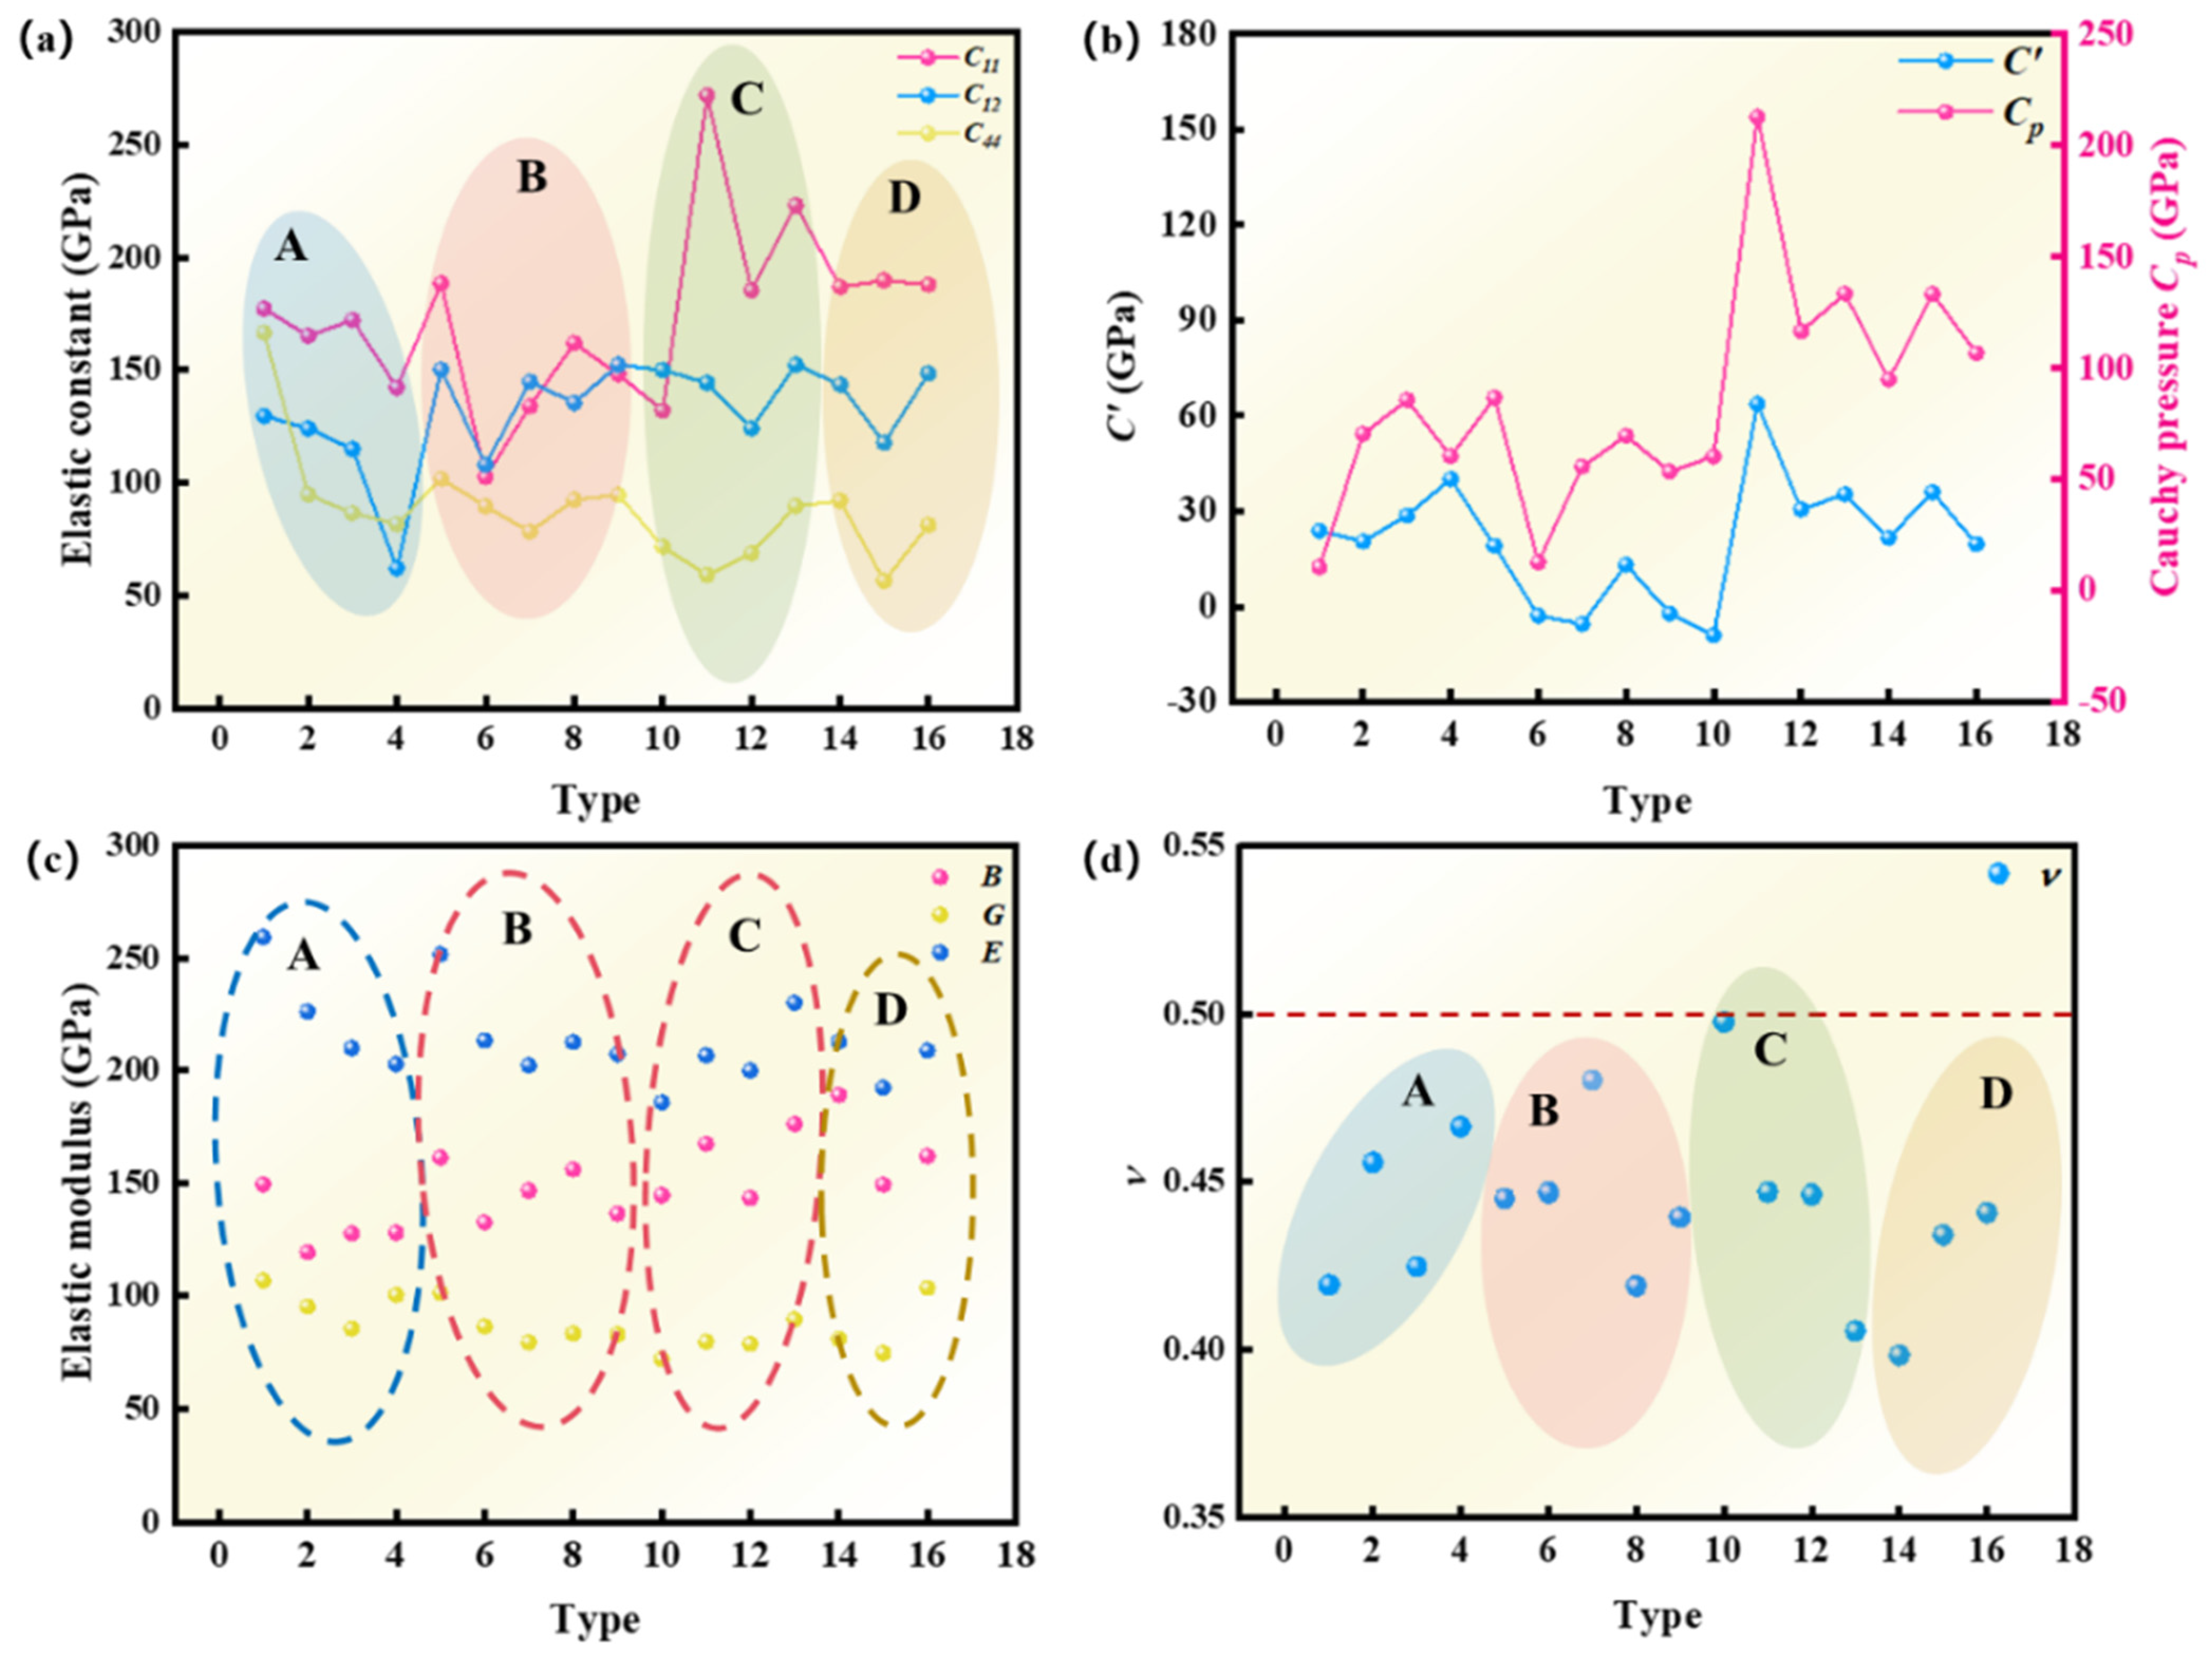
3.2. Mechanical Properties

The bulk modulus (B) describes a material’s resistance to volume changes under uniform pressure. Young’s modulus (E) represents the material’s stiffness under axial tension or compression, indicating how easily the material deforms along the direction of the applied force. The shear modulus (G) is a key parameter for measuring a material’s resistance to shear deformation, reflecting the material’s ability to resist shear deformation under shear stress. Poisson’s ratio (v) [41] describes the relative relationship between lateral and longitudinal deformations when a material is subjected to axial stress, with the parameter typically ranging from 0.26 to 0.5. An appropriate Poisson ratio ensures that the material maintains reasonable deformation behavior under stress, thereby avoiding excessive expansion or contraction.
The numerical values of these key parameters were obtained by calculating the elastic constants C11, C12, and C44, and these values are detailed in Table 2. To gain a more comprehensive understanding of the material’s mechanical behavior, we approximated the bulk modulus (B), shear modulus (G), Young’s modulus (E), and Poisson’s ratio (v) using the Voigt–Reuss–Hill (VRH) average method [42]. The specific formulas are shown in Equations (1)–(6), and the calculation results are presented in Figure 3.
Β = C 11 + 2 C 12 / 3
G V = C 11 C 12 + 3 C 44 / 5
G R = 5 C 11 C 12 C 44 / 3 C 11 C 12 + 4 C 44
G = C V C R / 2
E = 9 B G / ( 3 B + G )
v = 3 B 2 G / 6 B + 2 G
Based on the elastic constants C11, C12, and C44 obtained above, we can further calculate the material’s C and Cauchy pressure C P . C is used to characterize the mechanical stability, while the Cauchy pressure C P reflects the material’s compressive strength under different loading conditions. The calculation results are detailed in Figure 3b. The specific calculation process and formulas are described as follows:
C = C 11 C 12 / 2
C P = C 11 C 44
Here, C is used to characterize the mechanical stability [43]. C P represents the balance between covalent bonds and metallic bonds in the material. When C P > 0, metallic bonds dominate, leading to increased plasticity. Conversely, when C P < 0, covalent bonds dominate, resulting in higher strength and hardness.
Figure 3 presents the elastic properties of each composition. As shown in Figure 3a, the variations of the elastic constants C11, C12, and C44 for the 16 compositions are displayed, where the Fe contents of Groups A, B, C, and D are 60%, 70%, 80%, and 90%, respectively. In Group A, as the Ni content increases, both C11 and C12 show a monotonically decreasing trend. In Groups B, C, and D, as the Ni content increases, C11 and C12 exhibit fluctuating trends. Specifically, C11 shows a sudden decrease in Composition 6 (Fe70Ni5Al25) and a sudden increase in Composition 10 (Fe80Ni5Al15); C12 shows a sudden decline in Composition 4 (Fe60Ni20Al20) and a sudden increase in Composition 5 (Fe70NiAl29); C44 in Groups B, C, and D generally shows a decreasing trend followed by an increase. Figure 3b displays the C and C P values for each composition. In this figure, the C values for Compositions 6 (Fe70Ni5Al25), 7 (Fe70Ni10Al20), 9 (Fe70Ni20Al10), and 10 (Fe80Ni5Al15) are negative, indicating mechanical instability for these compositions. In contrast, the C P values for all compositions are positive, suggesting that all 16 selected compositions possess excellent plasticity. Figure 3c shows the calculated results for B, E, and G for the 16 compositions. Overall, as the Fe content increases, B fluctuates, while G and E decrease monotonically. Notably, in Groups A and B, as the Ni content increases, G decreases by 5% and 20%, respectively. In Groups C and D, as the Ni content increases, G increases by 28% and 31%, respectively. E decreases in Groups A and B, increases in Group C, and shows a decreasing trend followed by an increase in Group D. Figure 3d presents the Poisson’s ratio (v) for each composition. From the figure, it can be seen that Composition 10 (Fe80NiAl19) has a value exceeding 0.5. In contrast, the values for other compositions range from 0.26 to 0.5, indicating that the mechanical properties of Composition 10 (Fe80NiAl19) are unstable. In conclusion, the increase in Fe and Ni content significantly affects the values of B, G, and E for the alloys.

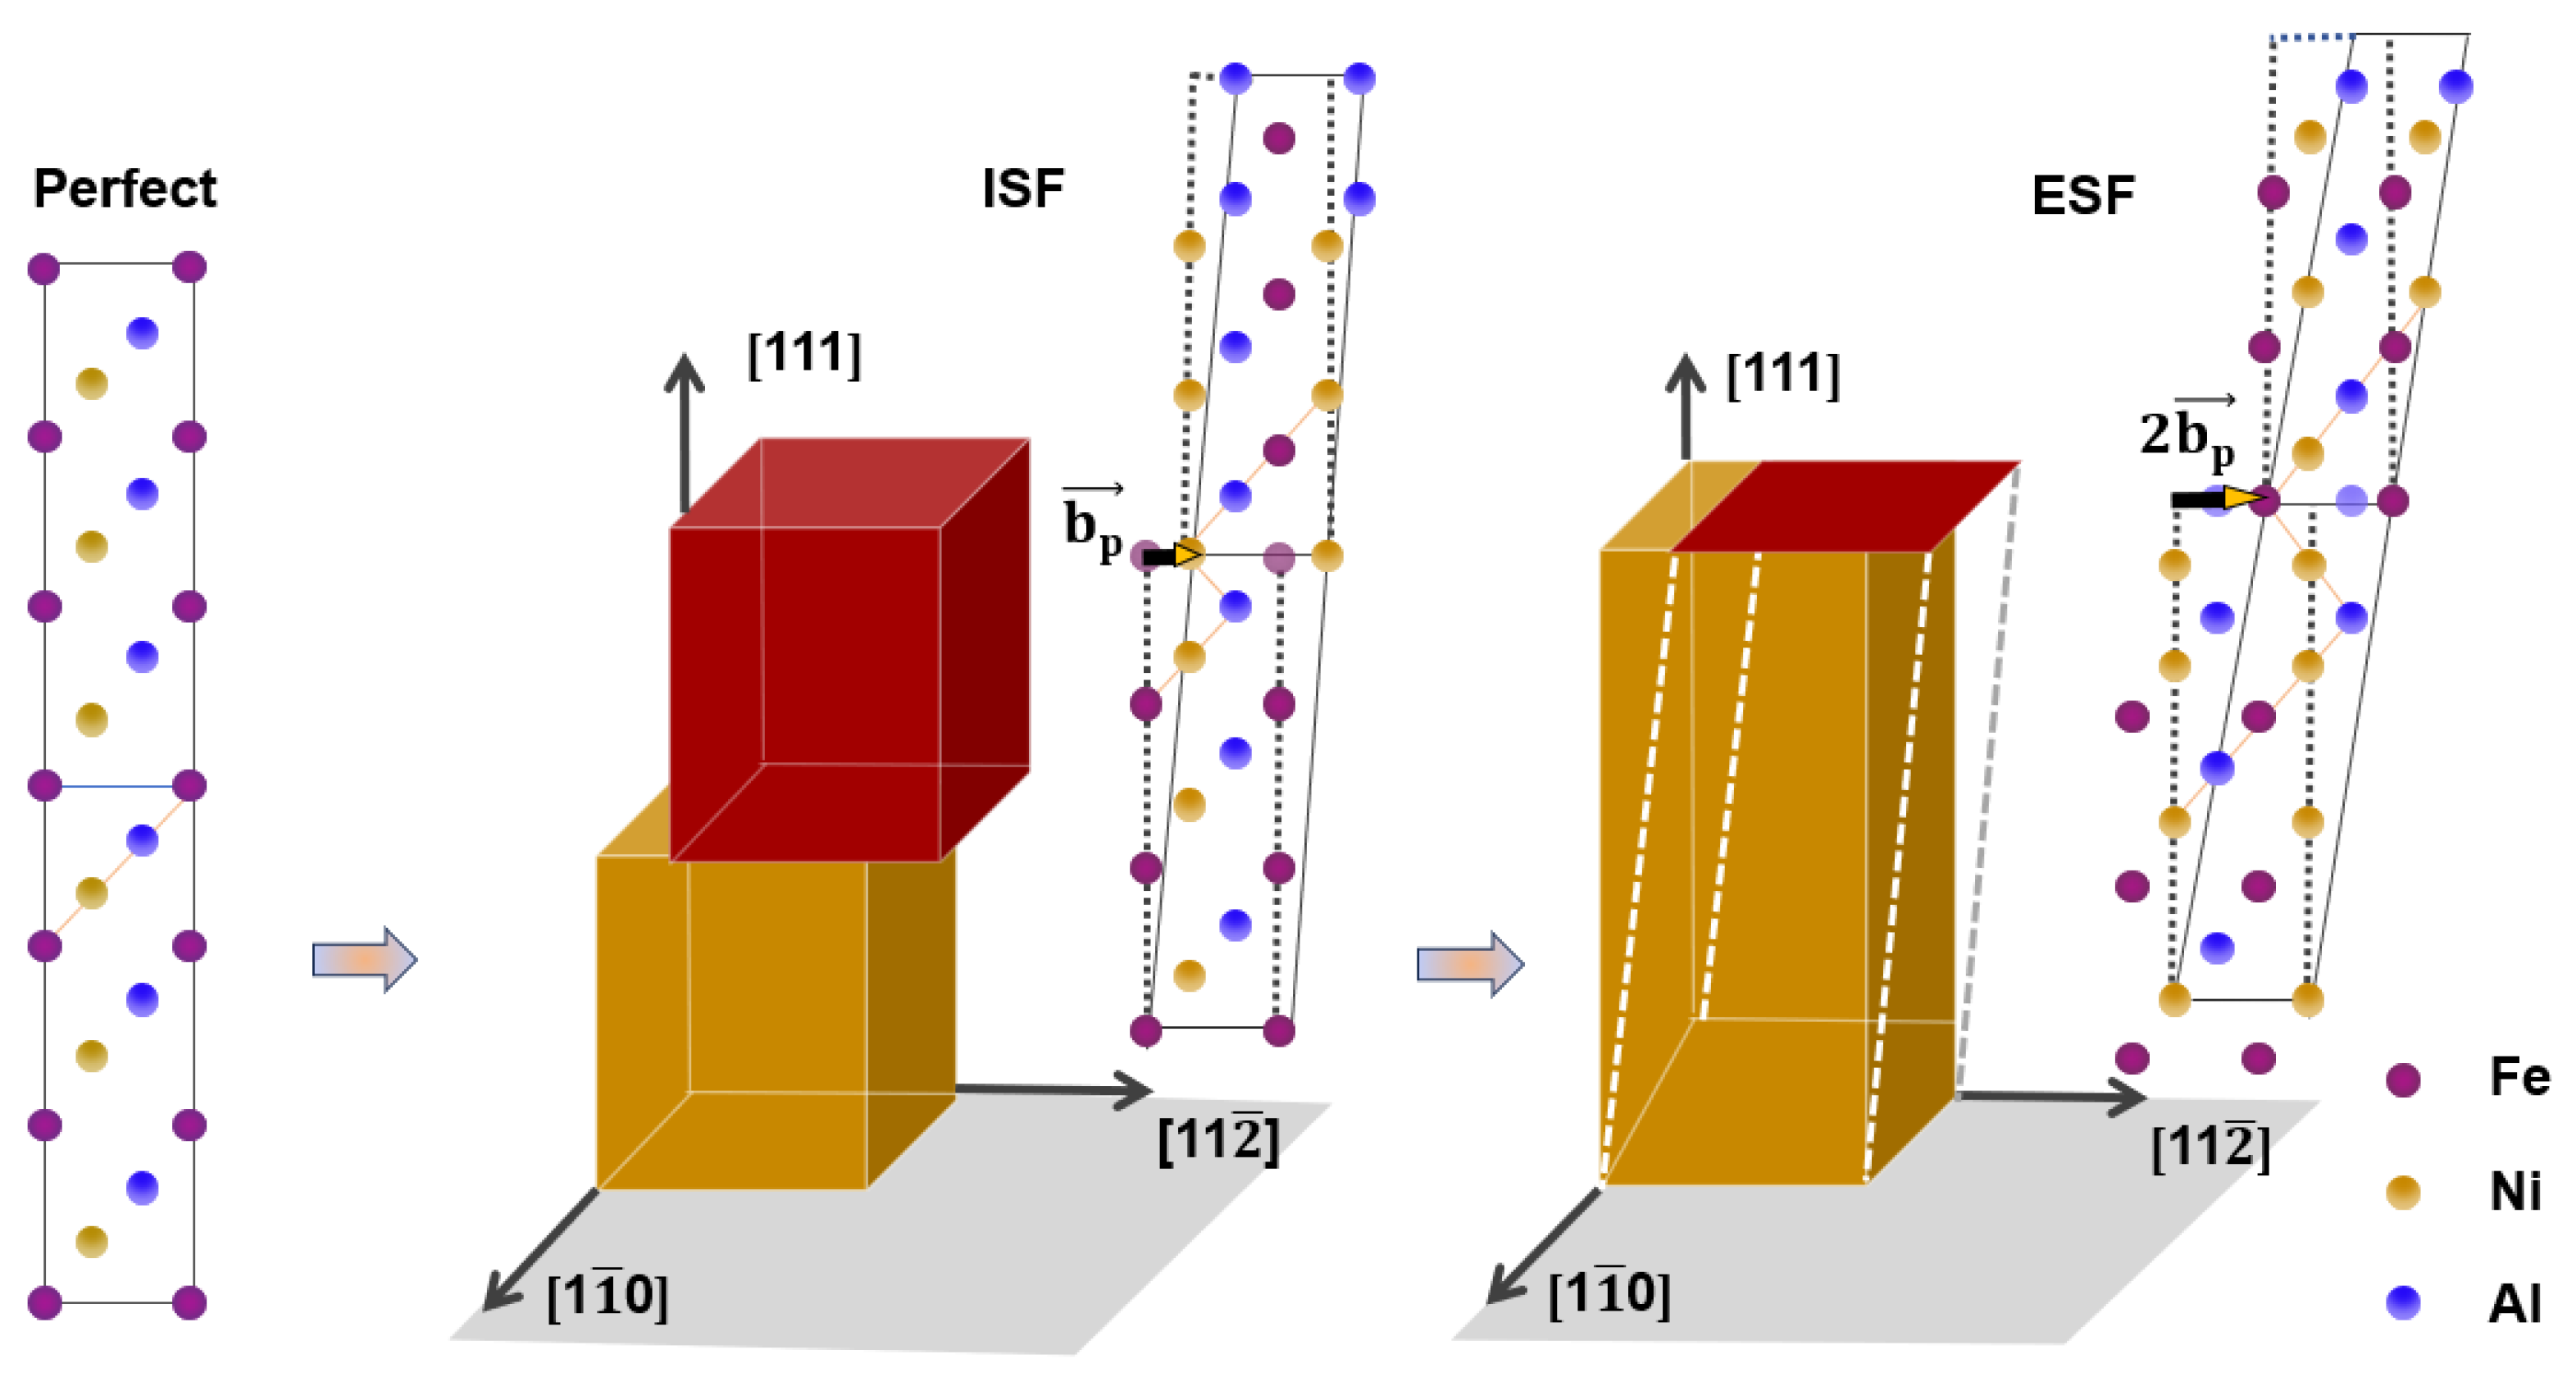
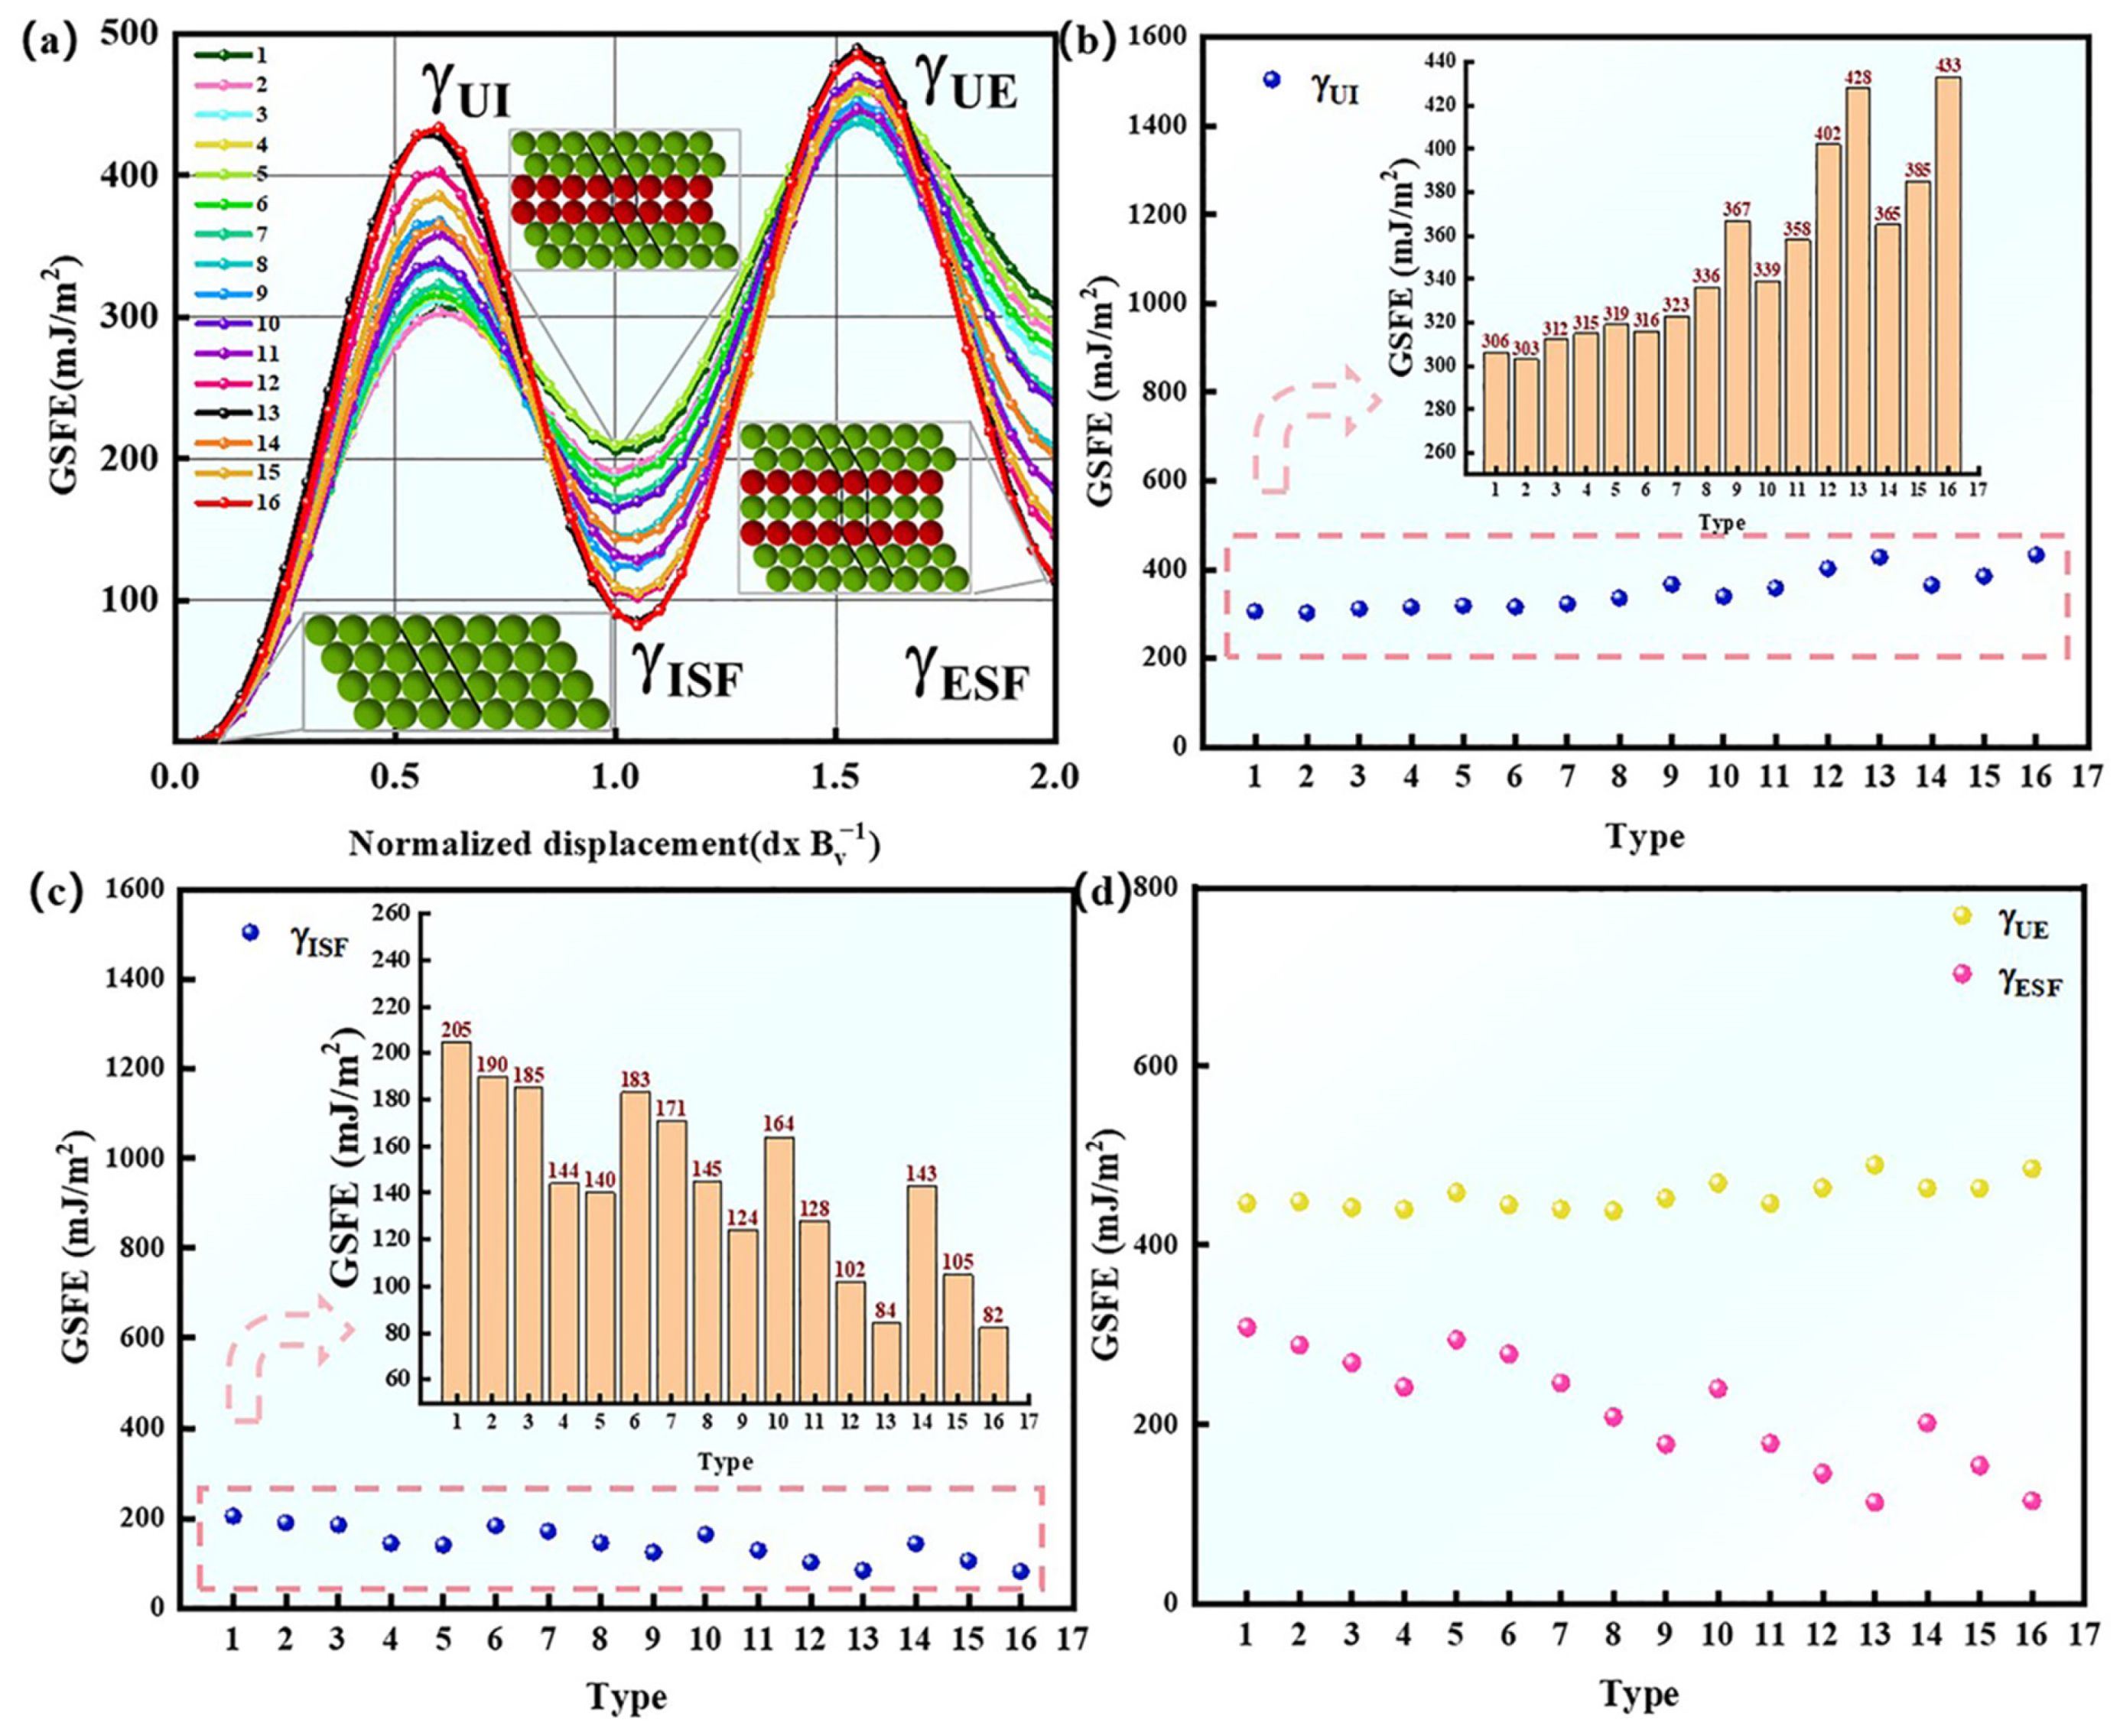
3.3. SFE and Deformation Mechanisms

Figure 4 shows the GSFE (Generalized Stacking Fault Energy) obtained by atomic displacements in the [11 2 ¯ ] direction. Figure 4a displays the GSFE curves for the 16 compositions, where green atoms represent the FCC structure and red atoms represent the HCP structure. Deformation starts with the intrinsic stacking fault (ISF), followed by the extrinsic stacking fault (ESF). Upon examining the curves, the maximum values correspond to the dislocation critical nucleation energy γUI and the energy required for pre-existing stacking fault slip γUE. In contrast, the minimum values correspond to the energy required to form the intrinsic stacking fault γISF and the energy required to form the extrinsic stacking fault γESF. Figure 4b,c represent γUI and γISF for the 16 compositions, respectively. As shown in the figures, with the increase in Fe and Ni content and the decrease in Al content, γUI generally shows a monotonic increase, whereas γISF shows a monotonic decrease, indicating that as Fe content increases and Al content decreases, more energy is required to form the ISF. Figure 4d shows γUE and γESF for the 16 compositions. It can be observed that with the increase in Fe and Ni content and the decrease in Al content, γUE exhibits a fluctuating trend, while γESF shows a monotonic decrease. The results in Figure 4 suggest that SFE can serve as a criterion for evaluating the effect of chemical composition on the deformation mechanisms of FCC alloys.

3.4. Optimal Ingredient Selection

An analysis of the elastic constants and mechanical stability for the 16 compositions was conducted, excluding the mechanically unstable compositions 6 (Fe70Ni5Al25), 7 (Fe70Ni10Al20), 9 (Fe70Ni20Al10), and 10 (Fe80Ni5Al15). For the remaining compositions, the average values of G and γISF were calculated, and compositions with a G value greater than the average G value and a γISF value smaller than the average γISF value were selected. Figure 5a shows the G values for the remaining compositions, where the red region represents the average G value, and the blue region represents the G values of the remaining compositions. Based on the criteria, compositions with a G value greater than the average G value were selected, namely compositions 1 (Fe60Ni5Al35), 2 (Fe60Ni10Al30), 4 (Fe60Ni20Al20), 5 (Fe70NiAl29), 13 (Fe80Ni19Al), and 16 (Fe90Ni9Al). Figure 5b shows the γISF values for the remaining compositions. According to the criteria, compositions with a γISF value smaller than the average γISF value were selected, namely compositions 4 (Fe60Ni20Al20), 5 (Fe70NiAl29), 8 (Fe70Ni15Al15), 11 (Fe80Ni10Al10), 12 (Fe80Ni15Al5), 13 (Fe80Ni19Al), 14 (Fe90NiAl19), 15 (Fe90Ni5Al5), and 16 (Fe90Ni9Al). Therefore, compositions 4 (Fe60Ni20Al20), 5 (Fe70NiAl29), 13 (Fe80Ni19Al), and 16 (Fe90Ni9Al) were selected, as they meet both criteria. These four compositions simultaneously satisfy the selection standards.

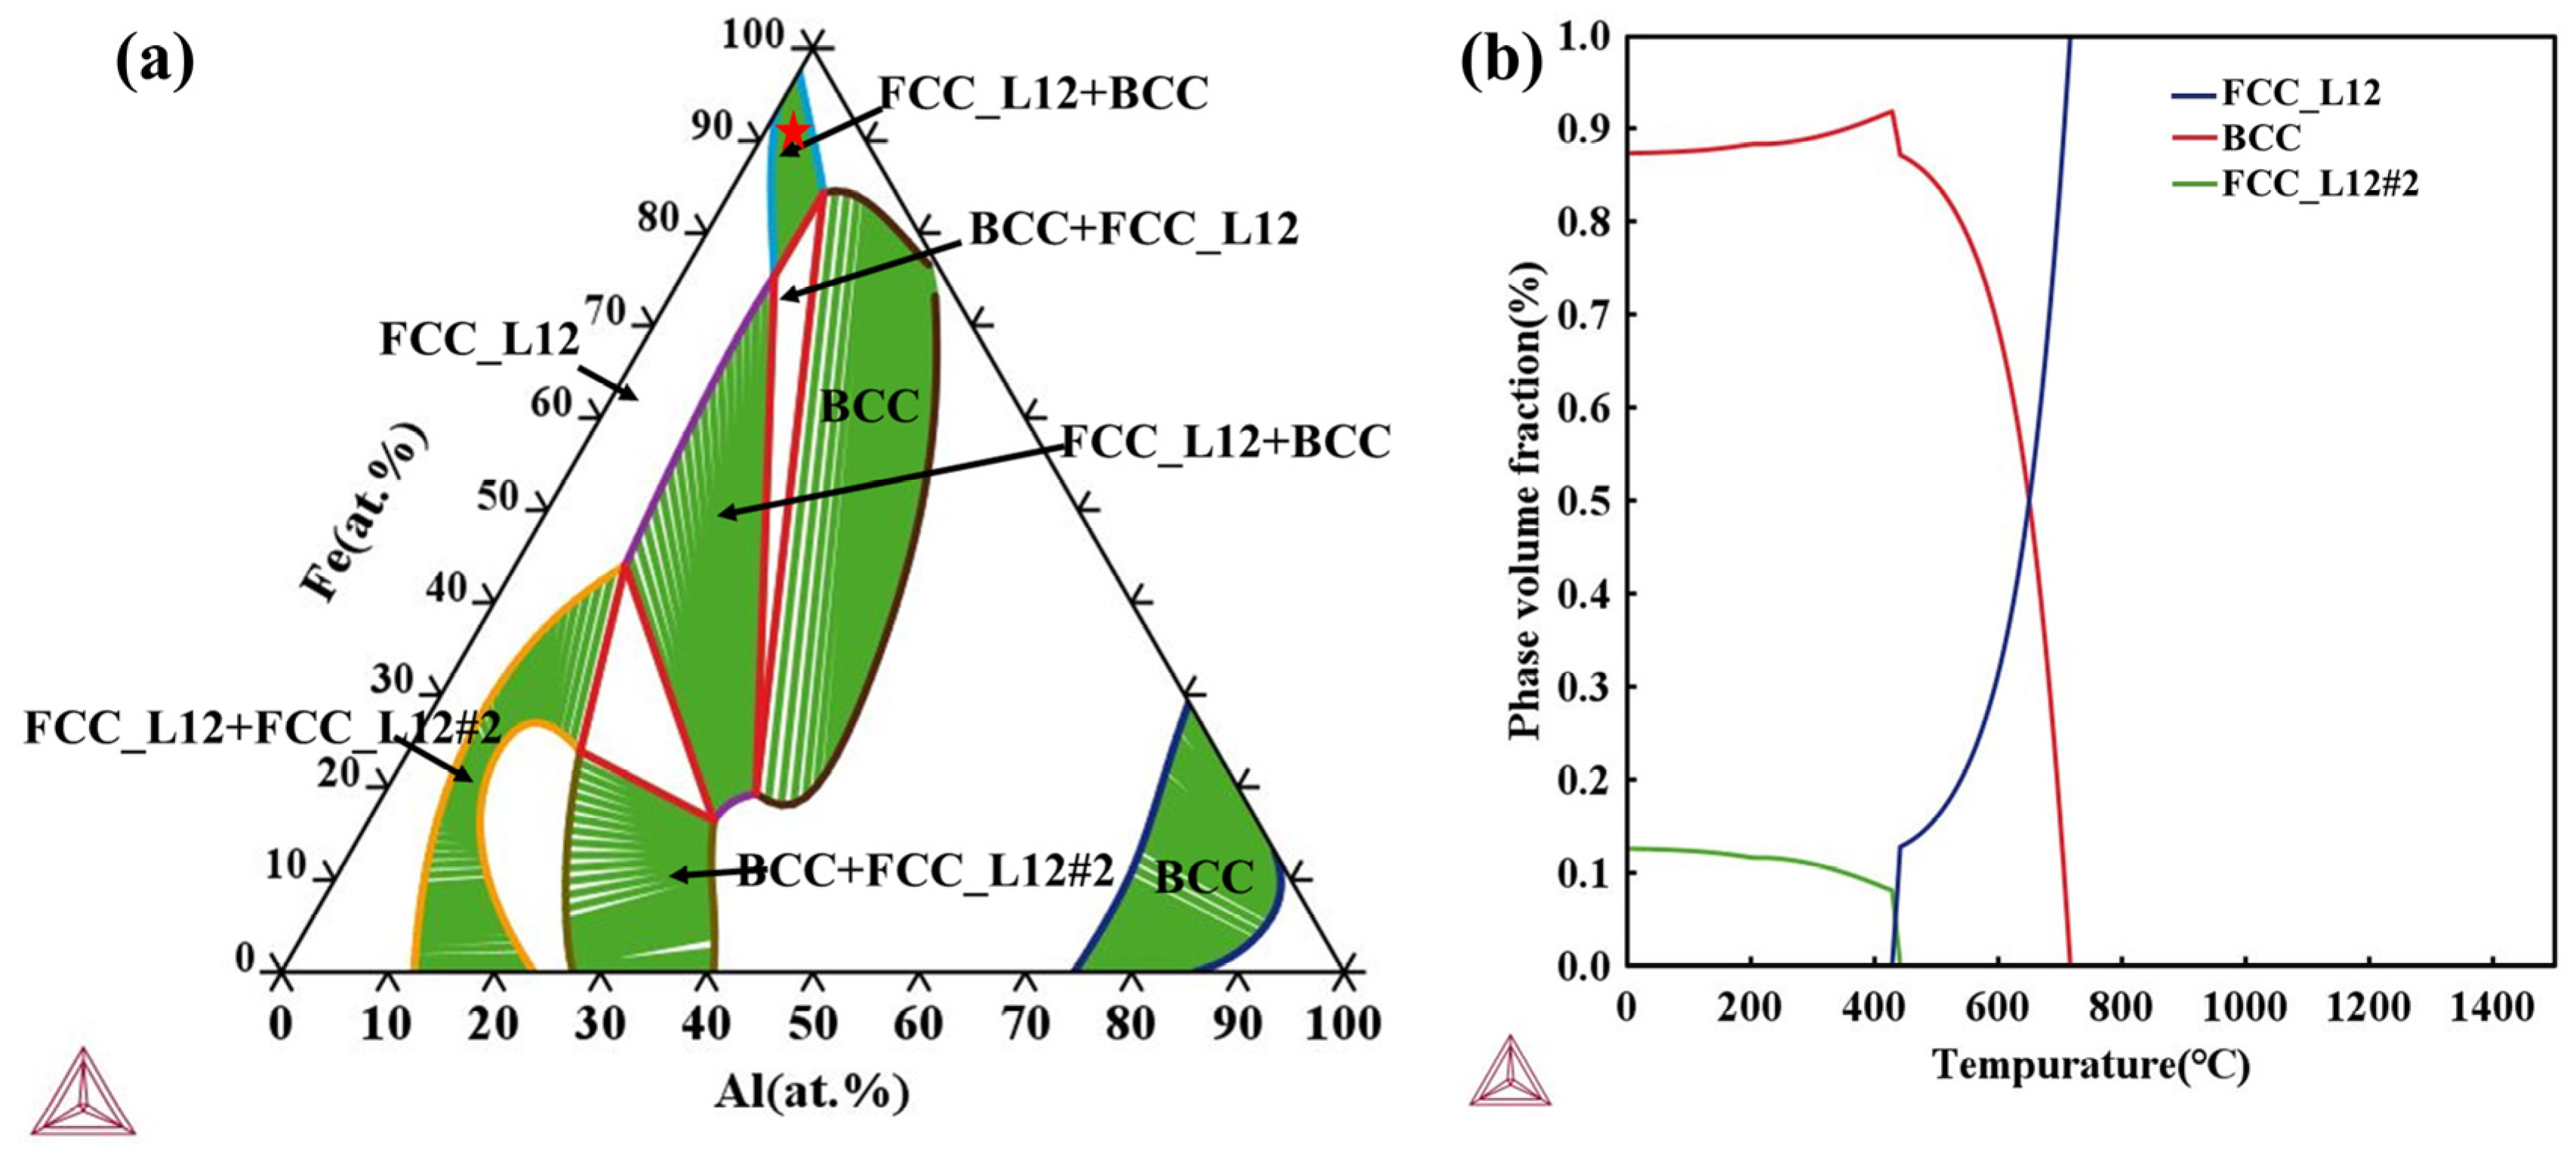
3.5. Equilibrium Phase Diagram Analysis

As shown in Figure 6a, the ternary equilibrium phase diagram calculation confirms that the optimal composition selected by molecular dynamics falls within the fcc + bcc dual-phase region, as indicated by the red pentagram. Subsequently, a uniaxial phase diagram for the Fe90Ni9Al1 alloy was calculated, as illustrated in Figure 6b. The corresponding phase fraction versus temperature diagram reveals that within the temperature range of 0–1500 K, the primary phases are fcc and bcc, with a minor fraction of the L12 phase appearing at lower temperatures. The phase fraction varies with annealing or solidification temperatures, providing theoretical guidance for selecting appropriate heat treatment conditions in experimental studies.

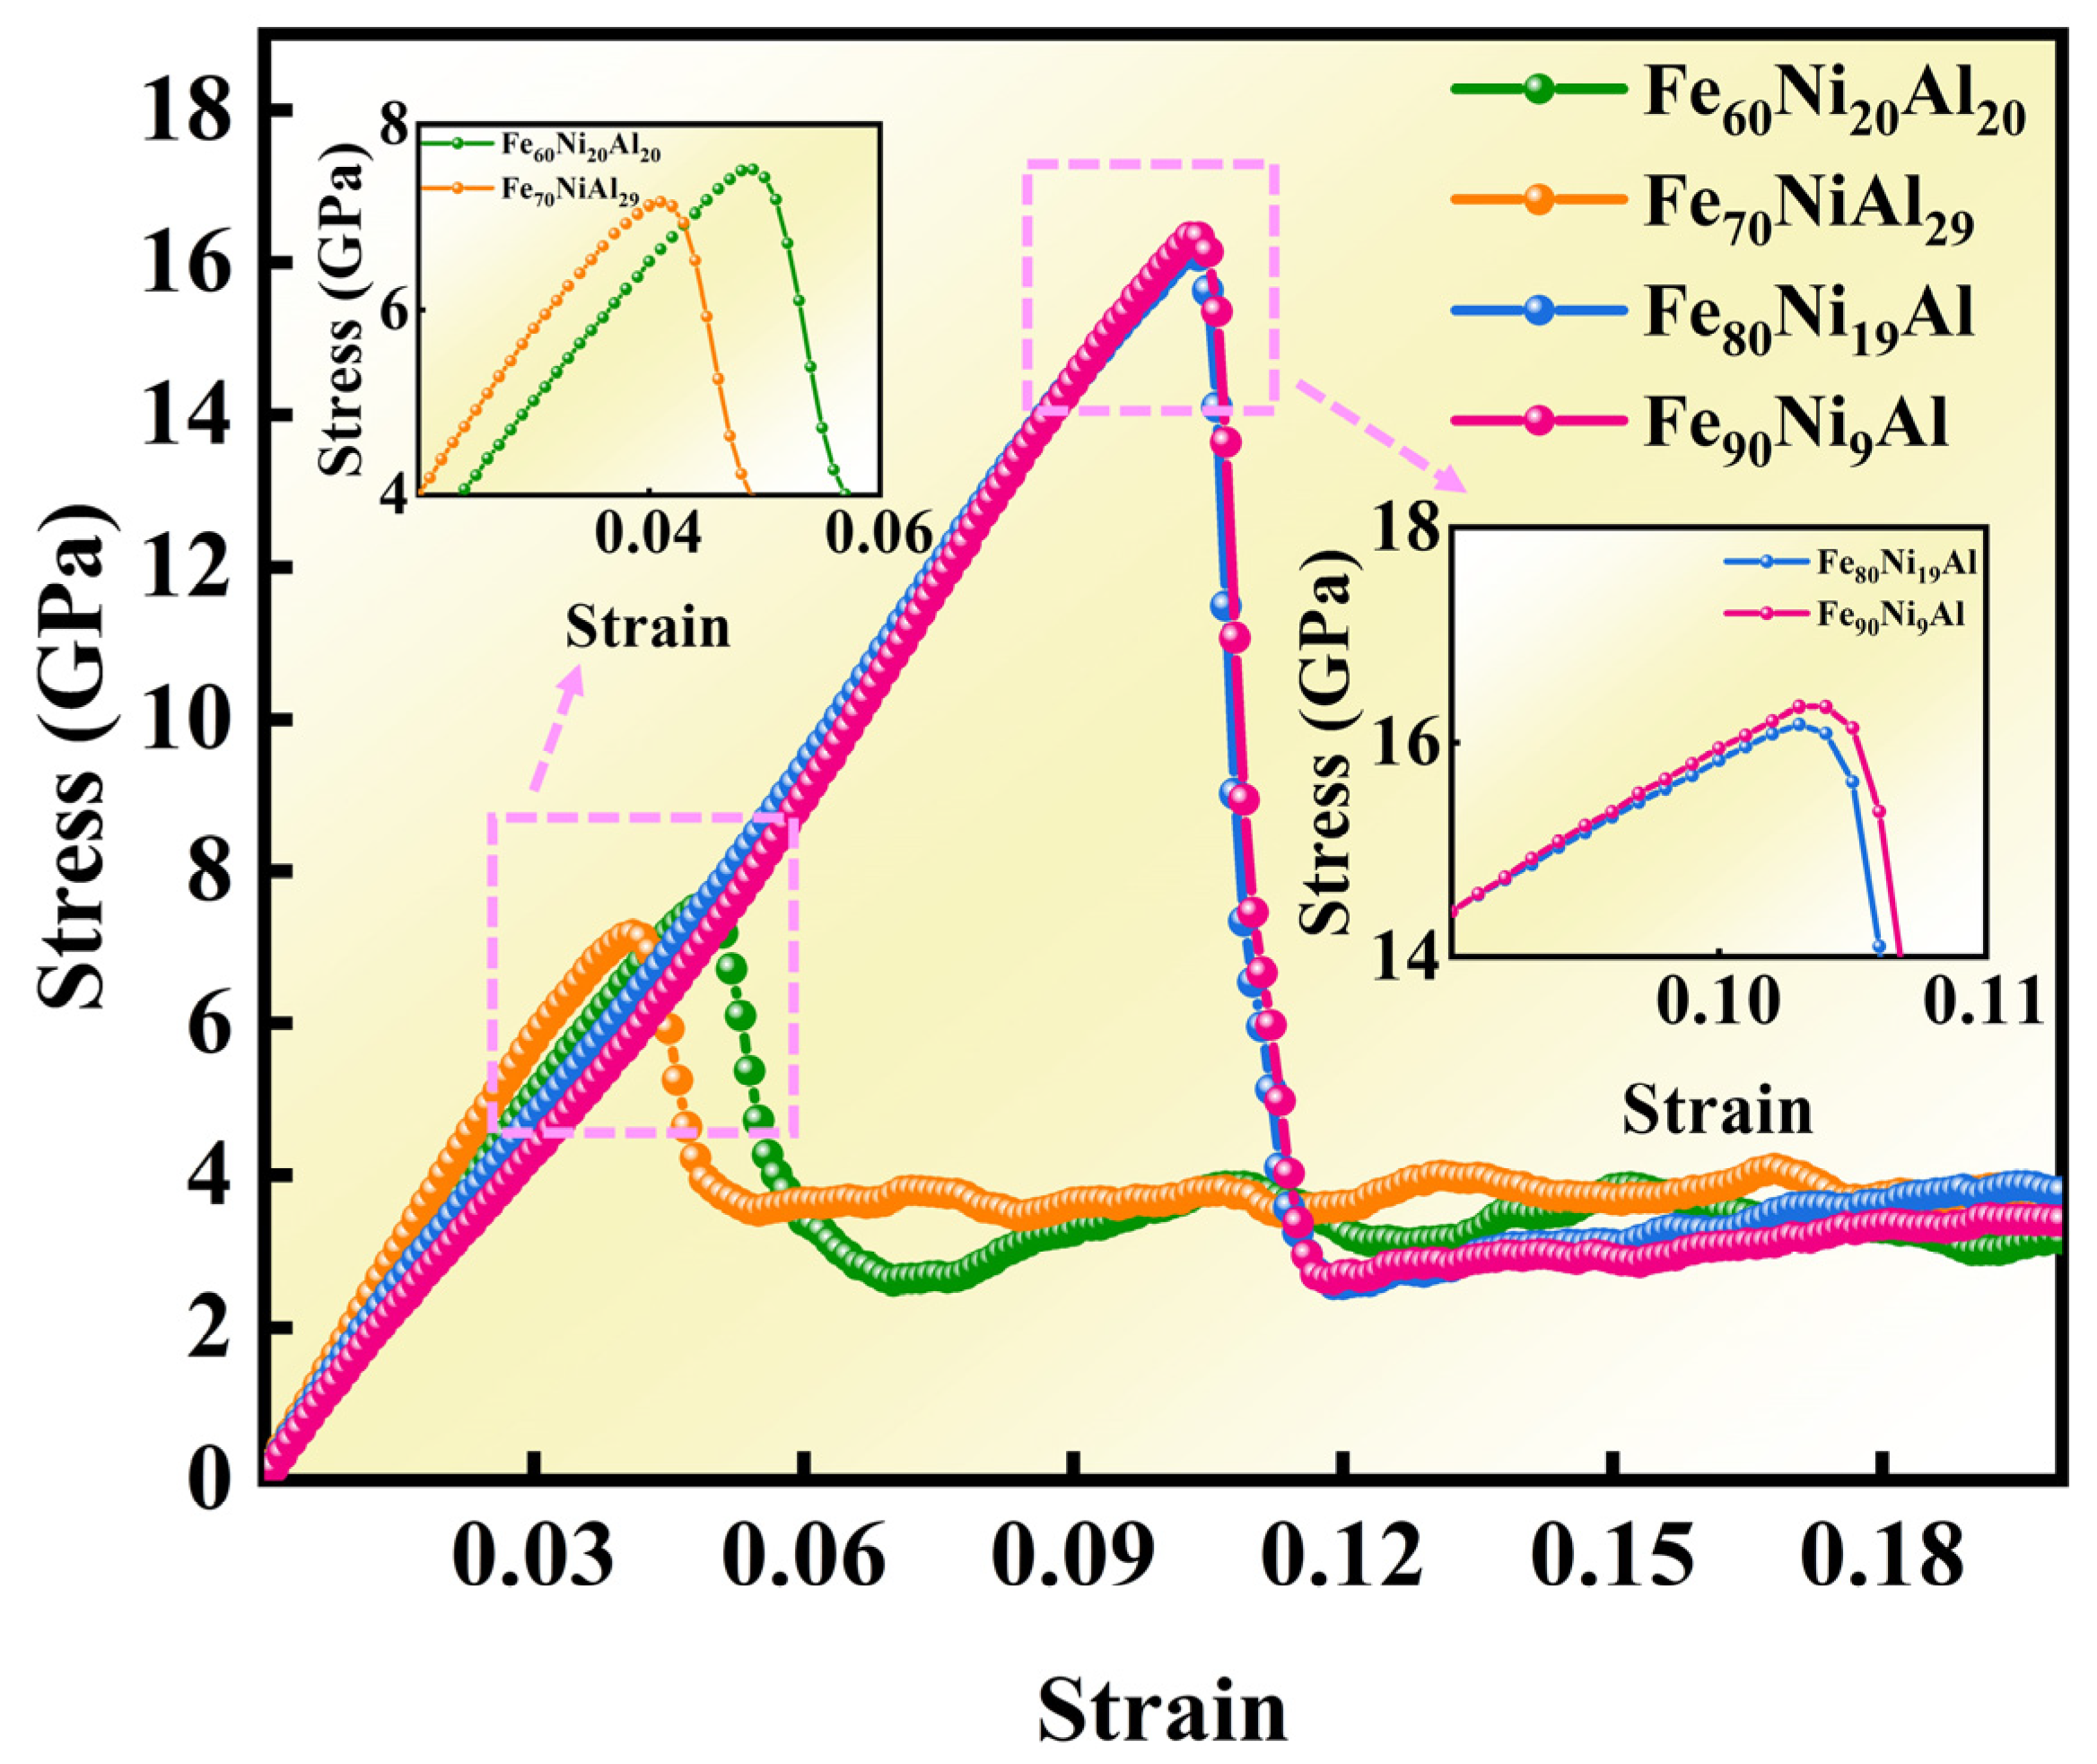
3.6. Tensile Properties and Dislocation Evolution

The plastic deformation mechanisms during the tensile process are studied through stress–strain curves, with a detailed analysis of dislocation movement, stacking fault transitions, and their interactions at different strains, explaining the reasons for stress changes [30]. When studying the tensile properties of each composition, the tensile parameters are kept consistent to ensure the accuracy of the tensile performance for each composition and to better understand the impact of key factors on deformation behavior. To determine the composition with the best performance and verify the selection criteria, tensile tests are conducted on the four selected compositions, identifying the composition with the best performance. The model dimensions are set to 200 Å × 180 Å × 210 Å, with a tensile temperature of 300 K and a tensile rate of 1 × 10⁹ s1. The simulations are performed by stretching the four composition models along the z-direction, and the stress–strain curves for the four compositions are shown in Figure 7.
An analysis of Figure 7 reveals that the stress–curves for the four selected compositions exhibit a similar trend. Specifically, in the early stage, there is a proportional relationship between stress and strain; as strain increases, stress also increases. When the curve reaches its peak, it indicates that the material has entered the plastic deformation stage, and the stress sharply drops as dislocations begin to nucleate and move. Moreover, the highest point on the curve corresponds to the material’s yield stress, and the strain at this point is referred to as the yield strain. To more clearly demonstrate this finding, Table 3 lists the yield strength (σ) and yield strain (ε) for the four compositions. Comparative analysis shows that Composition 16 (Fe90Ni9Al) stands out among the four compositions, as it not only has the highest yield strength (16.33 GPa) but also the highest yield strain (10.4%). Through CNA analysis, it is found that two distinct TRIP mechanisms exist in Composition 16 (Fe90Ni9Al): (1) the transformation from the FCC structure to the HCP structure and (2) the transformation from the FCC structure to the BCC structure. These two transformation mechanisms play a crucial role during the tensile process. To more accurately assess this TRIP tendency, we measure the proportions of the HCP and BCC phases during the tensile process [44]. Additionally, a deeper study of dislocation movement, particularly the Shockley dislocation length, is conducted to provide more detailed information on stacking fault variations.
As strain continues to increase, the plastic deformation mechanism transitions from dislocation slip to TRIP. Observing the changes in the HCP structure and Shockley partial dislocation length for these four compositions reveals a close relationship between Shockley partial dislocations and the HCP structure. As shown in Figure 8a, the HCP phase content for the four compositions initially shows an upward trend. Combined with the analysis in Figure 8b, the increase in HCP phase content is associated with the motion of Shockley partial dislocations. When the HCP phase content increases, the Shockley partial dislocation length also starts to rise, which is attributed to the increased stacking faults (HCP structures) caused by the movement of Shockley partial dislocations. From Figure 8c, it can be observed that as the stress–strain curve reaches its peak, the FCC phase content decreases while the HCP phase content increases. With further increases in strain, the HCP phase content starts to decline. Notably, when the strain reaches 12%, the HCP content begins to decrease, and the BCC content increases. At this point, the HCP phase is a precursor for the FCC → BCC transformation, indicating a trend of FCC → BCC transformation at this strain level. From Figure 8d, it can be observed that in Composition 16 (Fe90Ni9Al), when the strain reaches 11%, the length of the Shockley partial dislocation lines decreases. However, at this stage, the HCP structure still accounts for 15% of the material, indicating that under this strain, the HCP structure is no longer caused by stacking faults due to Shockley partial dislocations but instead results from the FCC → HCP phase transformation. In summary, Composition 16 (Fe90Ni9Al) exhibits the highest yield strength and yield strain, demonstrating delayed dislocation nucleation and higher strength. The phase transformation also occurs earlier, contributing to better plasticity. Therefore, Composition 16 (Fe90Ni9Al) is identified as the optimal composition, possessing high strength and plasticity [31].

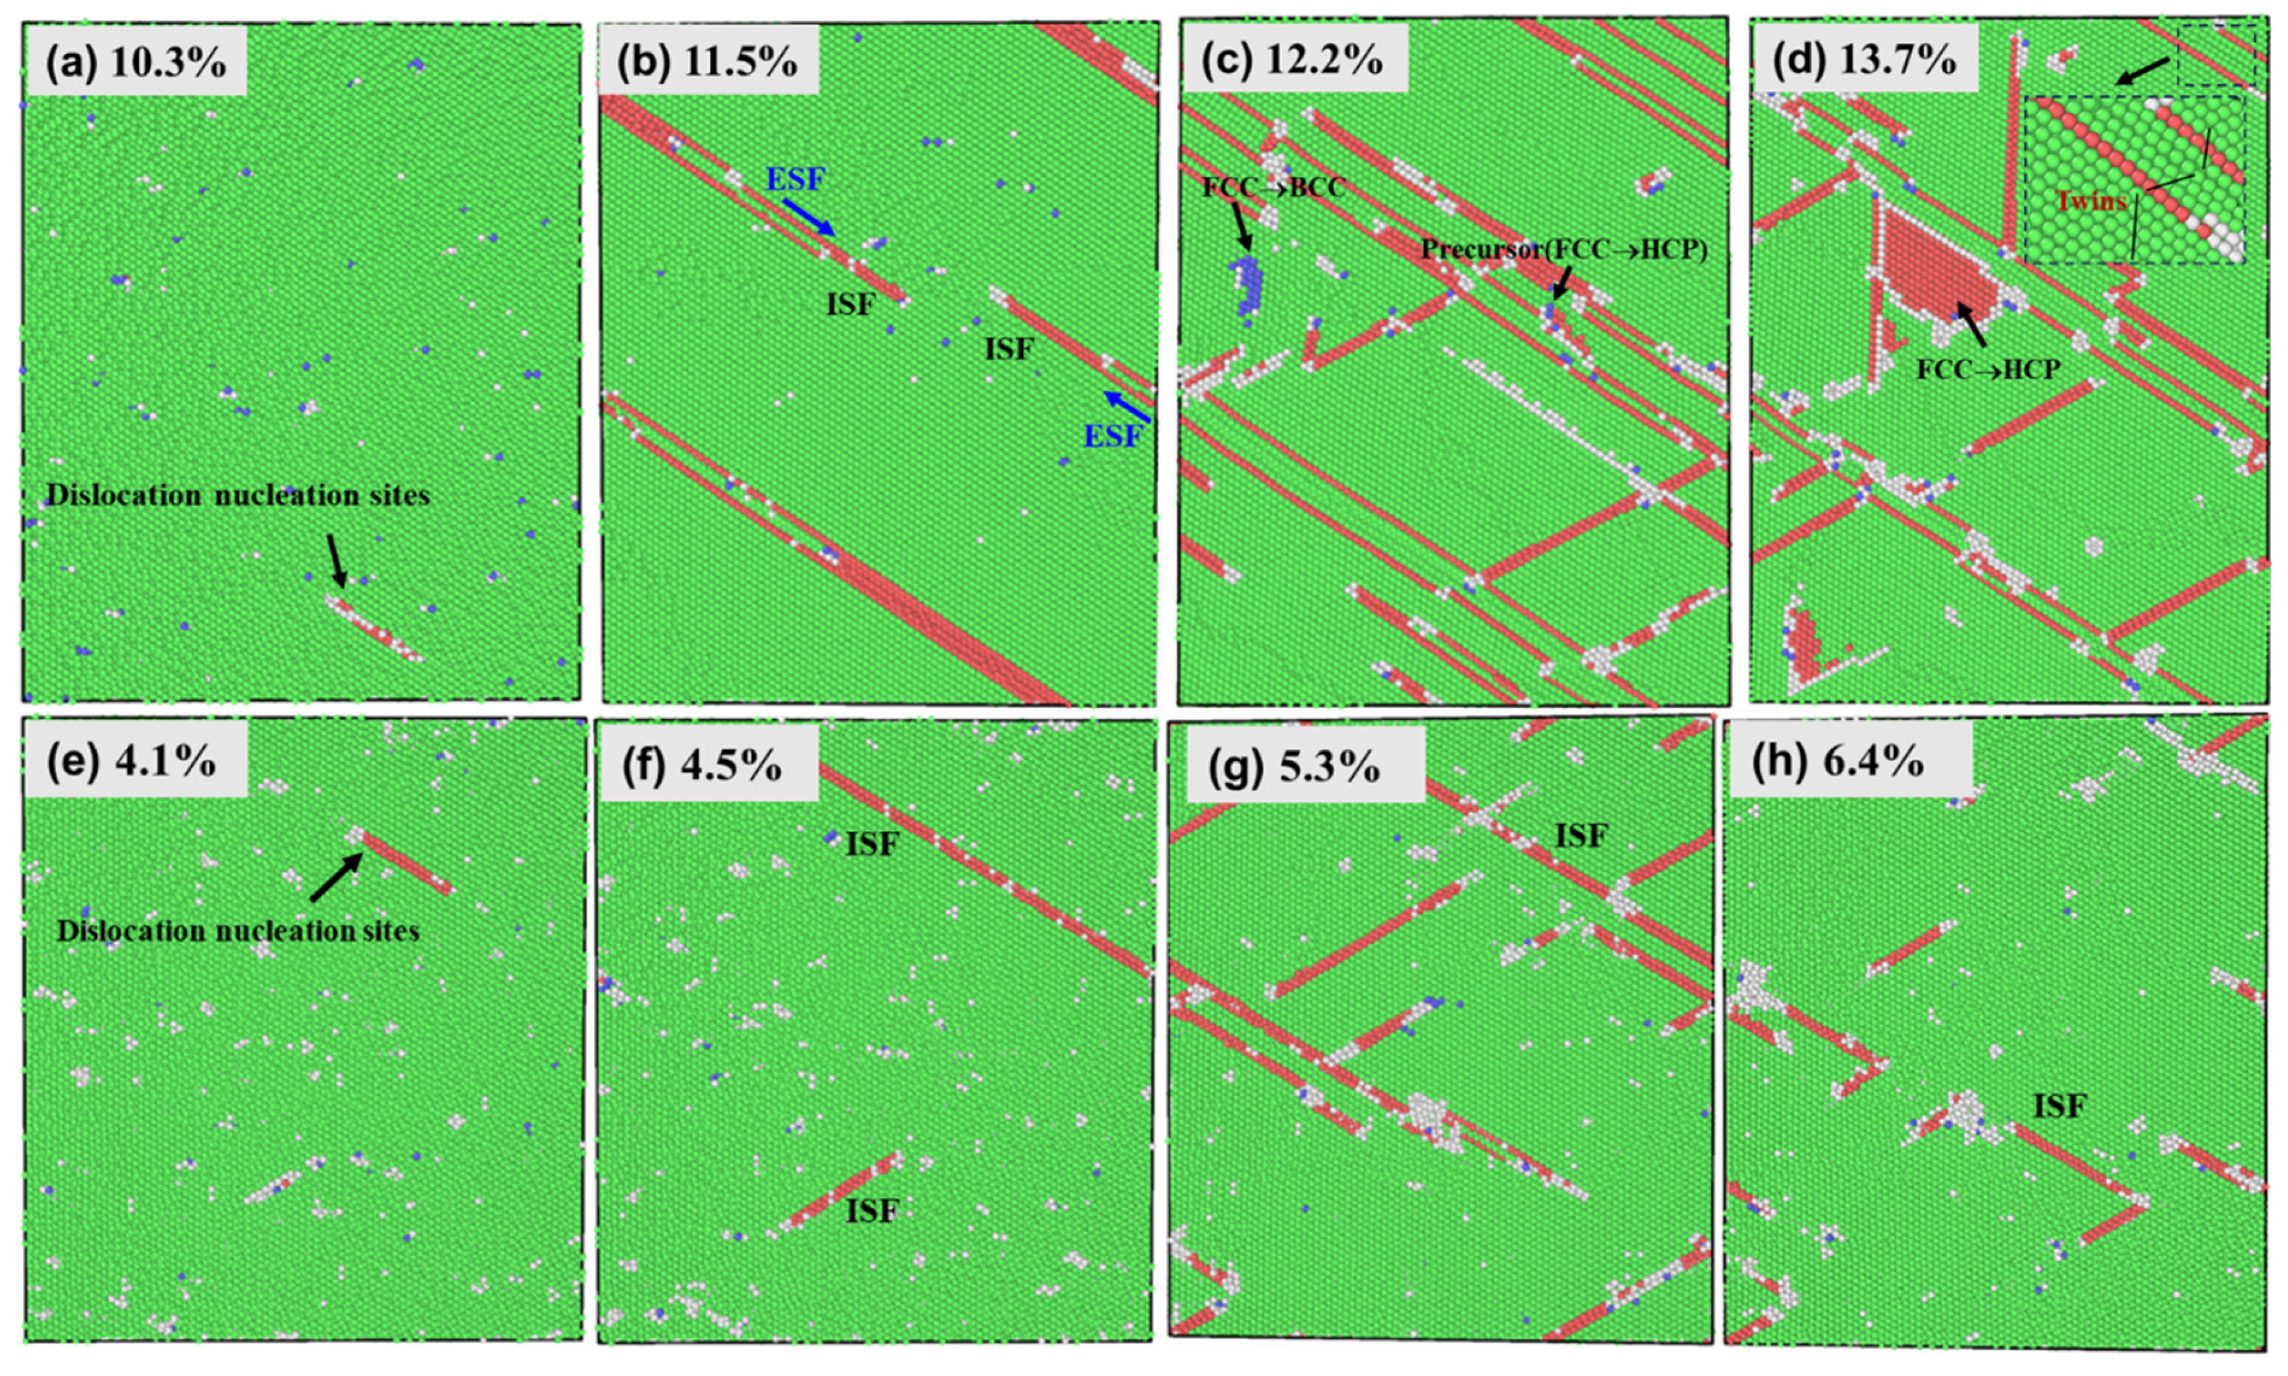
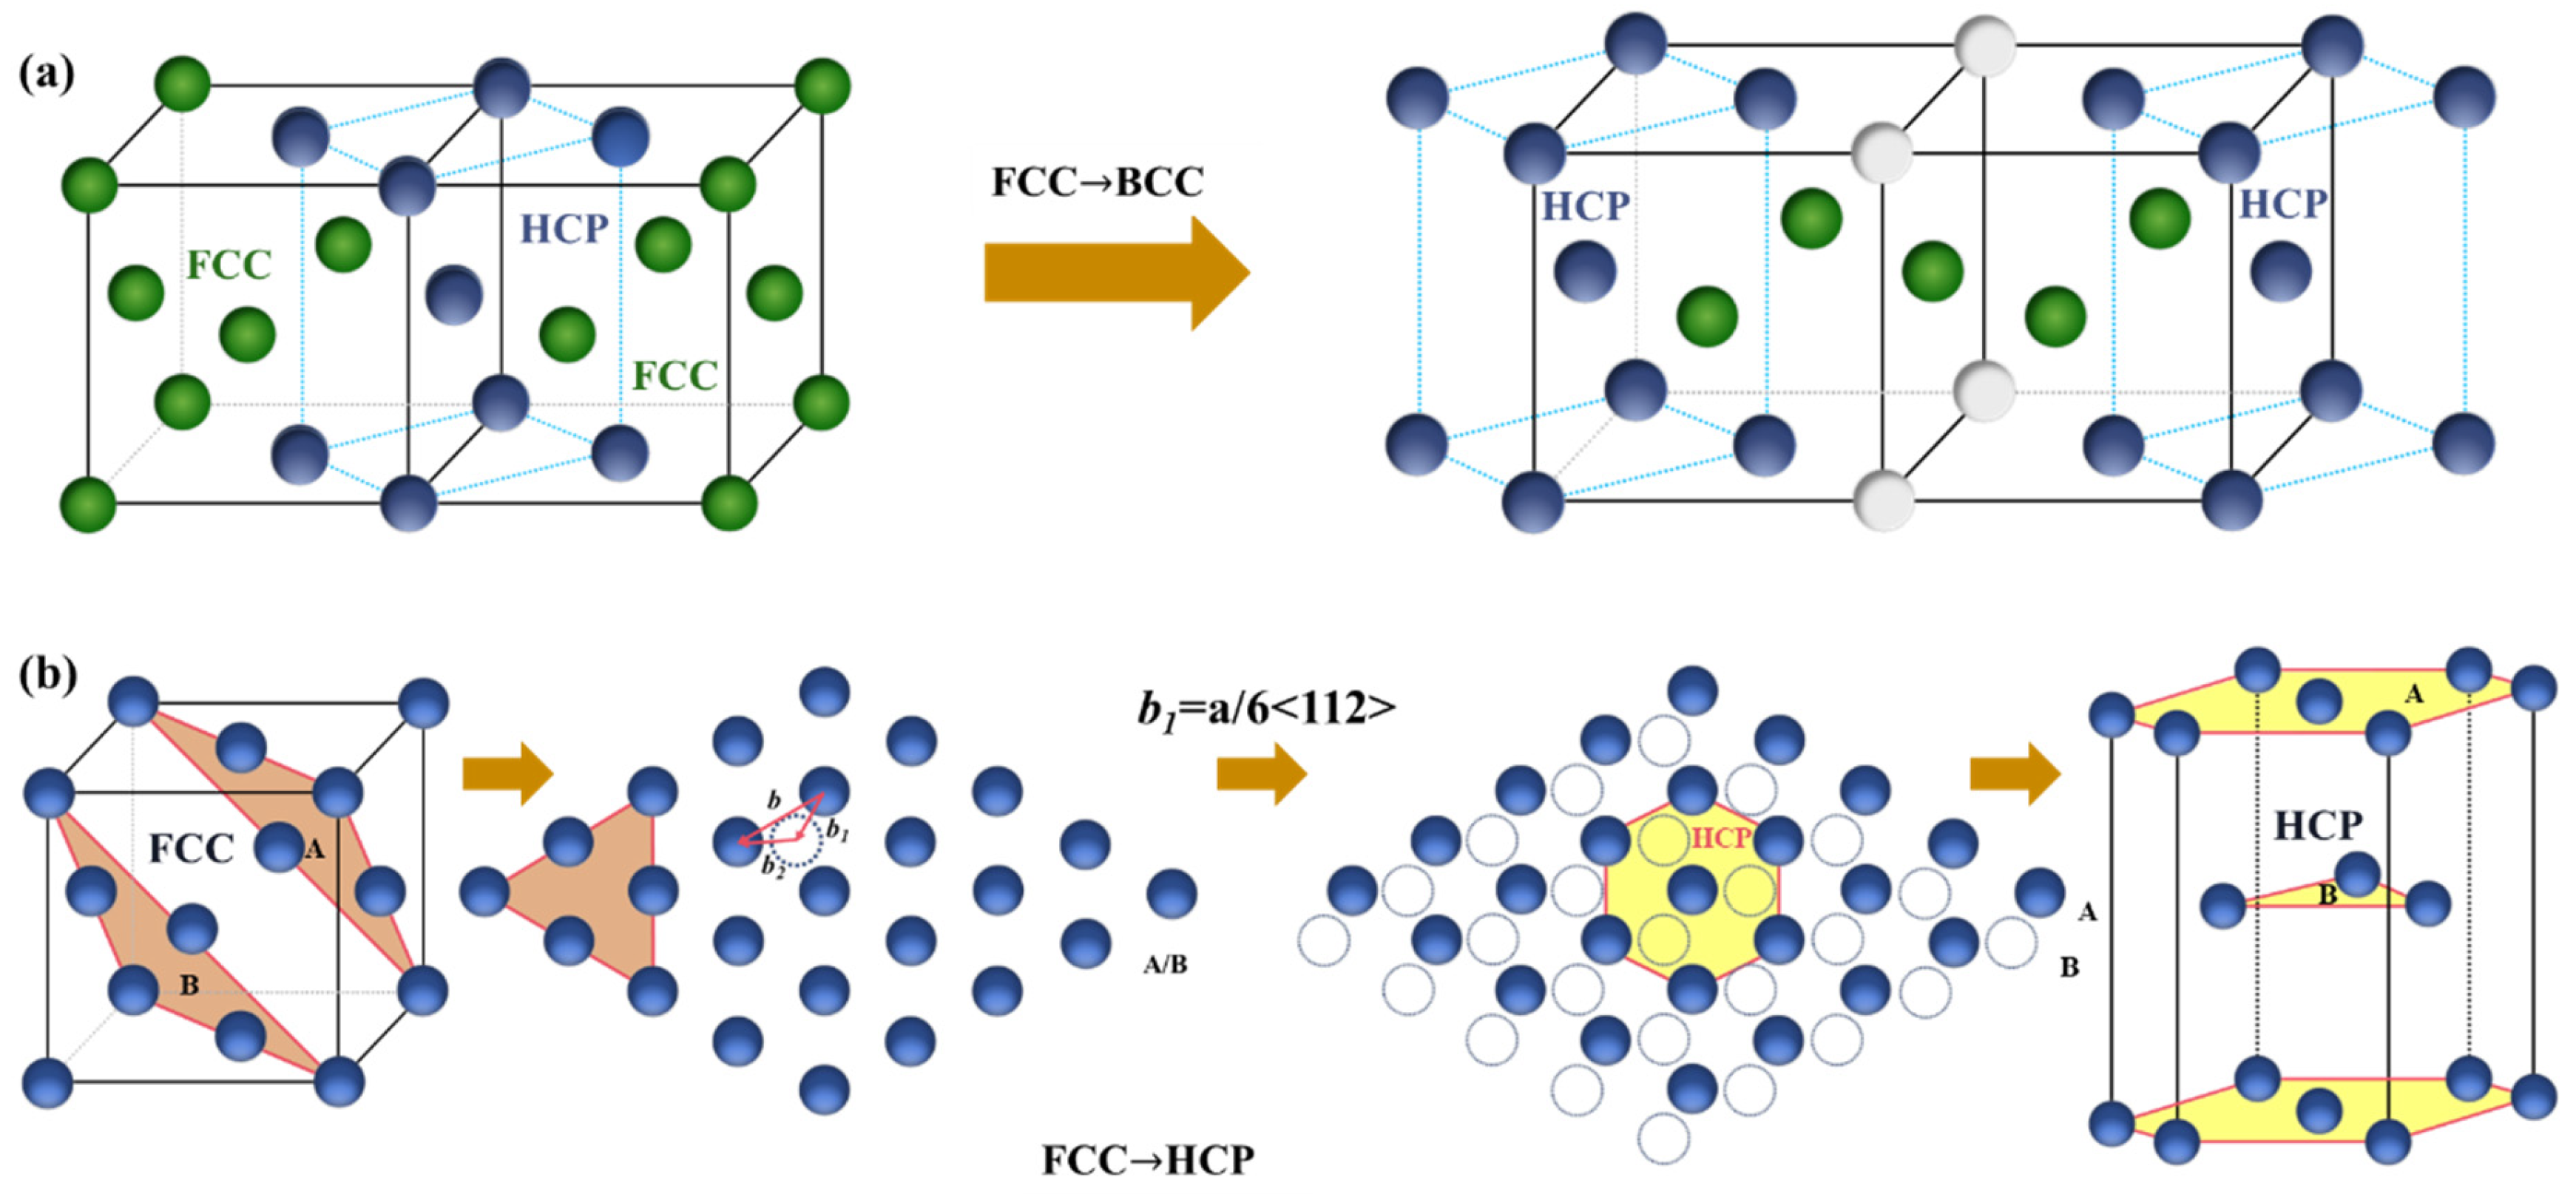
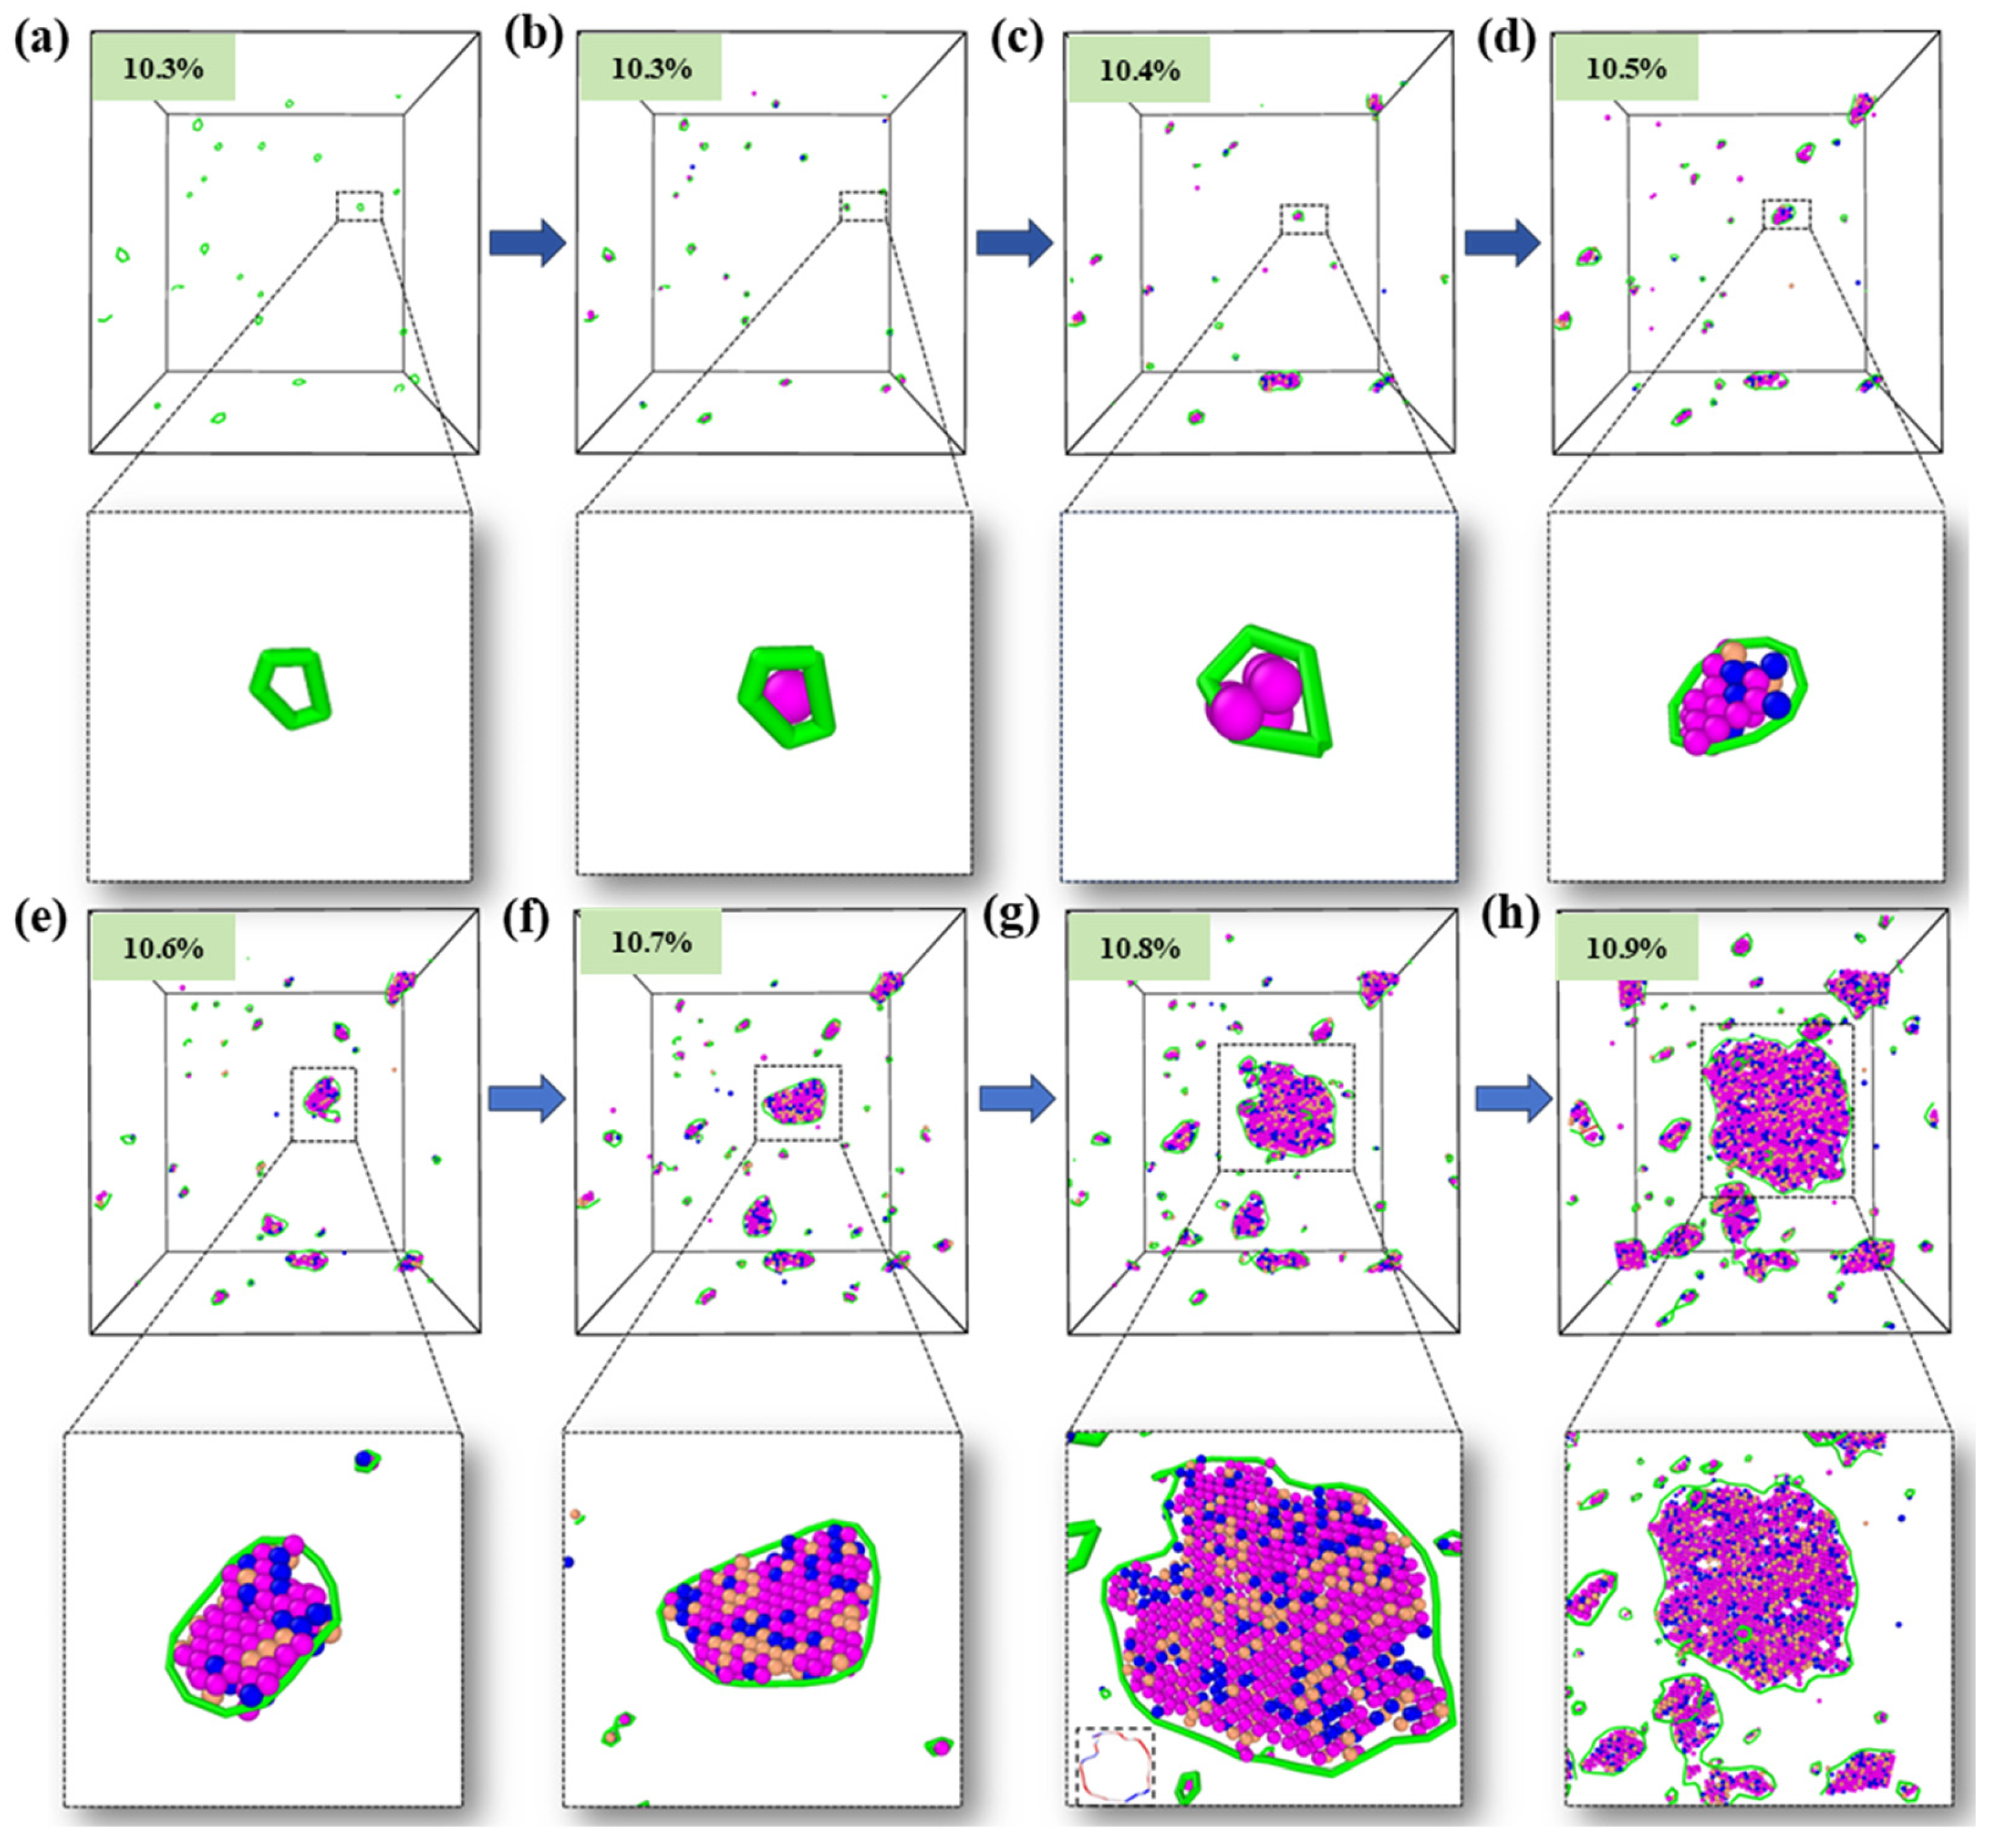
3.7. Deformation Mechanism Evolution

Next, the focus will be on exploring the microstructural evolution of the Fe90Ni9Al alloy. The microstructural evolution of the Fe90Ni9Al alloy involves multiple complex mechanisms, including the formation of ISF and ESF, FCC → HCP and FCC → BCC phase transformations, deformation twinning [45,46], and the formation of Lomer–Cottrell dislocation locks [47]. During the tensile process, the nucleation and migration of dislocations are the primary deformation mechanisms, and interactions between dislocations lead to the formation of Lomer–Cottrell dislocation locks. The sliding of Shockley partial dislocations results in the formation of ISF and ESF, which subsequently trigger phase transformations and the appearance of deformation twins.
As shown in Figure 9a, the initial nucleation of Shockley partial dislocations was observed in the Fe90Ni9Al composition at a strain of 10.3%, leading to the formation of ISFs. When the strain increased to 11.5%, based on the generation of ISFs, the reverse slip of Shockley partial dislocations on slip planes parallel to the ISF resulted in the formation of ESFs. Due to the nucleation and expansion of adjacent Shockley dislocations, intersecting ISFs appeared. At a strain of 12.2%, Shockley partial dislocations and disordered atoms appeared in the system. Some of these disordered atoms were located at the connections of ISFs, while others were near vacancy defects. As the strain increased, these disordered atoms transformed into HCP phases, the precursors of the FCC → BCC phase transformation, as well as BCC phases. Some ISFs transitioned into ESFs. As strain continued to increase, deformation twins were observed in the system, along with FCC → HCP phase transformations. This explains the stabilization of the HCP structural content observed in Figure 8. As shown in Figure 9d, at this stage, the deformation mechanism shifted to a combination of TWIP and TRIP, enhancing the alloy further while maintaining high ductility. Figure 9e–h depict the microstructural evolution of the Fe70NiAl29 composition during the tensile process. At a strain of 4.1%, the initial nucleation of Shockley dislocations was observed. With further strain increases, the formation of ISFs was noted in the system. Comparing the deformation mechanisms in Fe90Ni9Al and Fe70NiAl29, it can be seen that Fe90Ni9Al exhibits a greater number of dislocations and more complex deformation mechanisms compared to Fe70NiAl29. This complexity is a key reason that Fe90Ni9Al exhibits superior comprehensive performance [48].
The FCC → BCC and FCC → HCP phase transformation processes observed in Figure 8 are illustrated in Figure 10. Figure 10a depicts the FCC-to-BCC transformation process. Under tensile stress, dislocations in the FCC structure begin to move along the slip planes. When two FCC structures align, the atoms at the four corners of the inner tetrahedron, the atoms at the centers of the top and bottom faces, and the atoms connecting the face centers form the BCC structure. As tensile deformation continues, different stacking faults are generated in the FCC phase. These stacking faults gradually accumulate, creating the HCP phase. Figure 10b illustrates the FCC-to-HCP transformation process. In the FCC phase, the red planes represent the slip planes of the FCC structure. When flattened, this plane ideally forms a full dislocation b. However, during dislocation motion, this dislocation decomposes into two partial dislocations, b1 and b2, as described by the dislocation reaction Equation (9). Upon further tensile deformation, when the atoms in layer A move by the Burgers vector b1 = a/6<112> to the virtual layer B atoms below, the HCP structure is formed.
Dislocation loops play a crucial role in the mechanical properties of materials [49,50,51]. As shown in Figure 11, the formation process of dislocation loops in the Fe90Ni9Al composition during the strain range of 10.3–10.9% can be observed through dislocation analysis. The formation of dislocation loops begins with the nucleation of shear dislocation loops, which continue to move along different paths. First, shear dislocation loops nucleate and move on individual slip planes. Second, under applied stress, some segments of the dislocation loops bend, creating screw dislocation segments. In the FCC structure, screw Shockley partial dislocations cannot undergo cross-slip, whereas screw full dislocations can. Therefore, the cross-slip of {111} slip planes in shear dislocation loops is primarily due to the presence of screw full dislocations at the trailing ends of the initial dislocation loops. Consequently, screw full dislocations in the FCC structure undergo cross-slip, forming a shear dislocation loop with polygonal stacking faults (SFs) [52].
As shown in Figure 12, with continued tensile deformation, a large dislocation cluster forms around the Fe90Ni9Al composition, primarily consisting of full dislocations, extended dislocations dominated by Shockley partial dislocations, Lomer–Cottrell dislocation locks, and shear dislocation loops. Due to the interaction and entanglement of dislocations, extensive dislocation tangles and nodes are formed. Meanwhile, dislocation reactions between Shockley partial dislocations generate immobile Hirth and Stair-rod dislocations. These phenomena significantly enhance the material’s strength and hardness [53,54]. There are three main types of dislocation reactions. The first type involves the decomposition of a full dislocation into two Shockley partial dislocations to form extended dislocations, as illustrated in Figure 11a. The reaction equation is given by Equation (9):
1 2 [ 1 ¯ 1 ¯ 0 ] 1 6 [ 2 ¯ 1 ¯ 1 ] + 1 6 [ 1 ¯ 2 ¯ 1 ¯ ]
As strain increases, some dislocations develop into independent dislocation loops, while others annihilate during dislocation reactions. Extended dislocations bend and gradually evolve into dislocation loops, as shown in Figure 12b. The structure of the dislocation loops consists of Shockley partial dislocations in several different directions. Additionally, as the plastic deformation zone expands, “U-shaped” dislocation loops are generated. The contact reactions between the two Shockley partial dislocations at the tail of the “U-shaped” loop transform it into an independent dislocation loop. The second and third types involve interactions between two Shockley partial dislocations, resulting in immobile dislocations, as shown in Figure 12c,d. The reaction equations are given by Equations (10) and (11):
1 6 [ 2 ¯ 11 ] + 1 6 [ 1 1 ¯ 2 ¯ ] = 1 6 [ 1 ¯ 0 1 ¯ ]
1 6 [ 2 1 ¯ 1 ¯ ] + 1 6 [ 2 ¯ 1 ¯ 1 ] = 1 3 [ 0 1 ¯ 0 ]
The presence of these immobile dislocations hinders the motion of other dislocations, significantly improving the mechanical properties of the material [55].
This study aims to propose a novel method based on molecular dynamics (MD) simulations for the rapid screening and optimization of Fe-Ni-Al ternary alloy compositions, providing theoretical guidance for the future design of high-performance alloy materials. At the same time, we acknowledge the limitations of this work. Specifically, the simulations did not account for real-world factors such as impurities, microalloying elements, and crystal defects that may exist in actual materials and potentially influence their mechanical properties. Moreover, the current work remains at the stage of theoretical calculations and mechanistic analysis, and experimental fabrication and performance validation have not yet been conducted.
Future work will integrate experimental approaches to advance the following aspects:
(1) Fabrication of alloy samples; (2) mechanical property testing and comparison with simulation results; (3) incorporation of microstructural factors such as grain boundaries, vacancies, and secondary phases into the simulations for more realistic analysis, aiming to enhance the engineering applicability and reliability of the proposed method. Once again, we sincerely thank you for your recognition and valuable guidance on this work!

4. Conclusions

Using the MD method, the effects of FeNiAl alloy composition on lattice constants, elastic moduli, GSFE, and plastic deformation mechanisms were investigated. To identify the optimal composition with both high strength and ductility, new selection criteria were established based on the shear modulus G and the intrinsic stacking fault energy γISF. According to the selection criteria and simulation results, the following conclusions were drawn:
  • With the increase in Fe content, the lattice constant shows an overall decreasing trend, primarily due to the reduced lattice distortion caused by the higher Fe content, making the lattice structure closer to the pure Fe matrix.
  • As the Fe and Ni content increases and the Al content decreases, γISF exhibits a monotonic decreasing trend. Therefore, higher Fe and Ni content, along with lower Al content, enhances the strength and ductility of FeNiAl alloys.
  • Four compositions meeting the selection criteria were subjected to tensile testing. The results revealed that Composition 16 (Fe90Ni9Al) demonstrated the best strength–ductility combination. During tensile deformation, minor FCC → BCC and FCC → HCP phase transitions occurred, along with deformation twinning, leading to TRIP and TWIP effects.
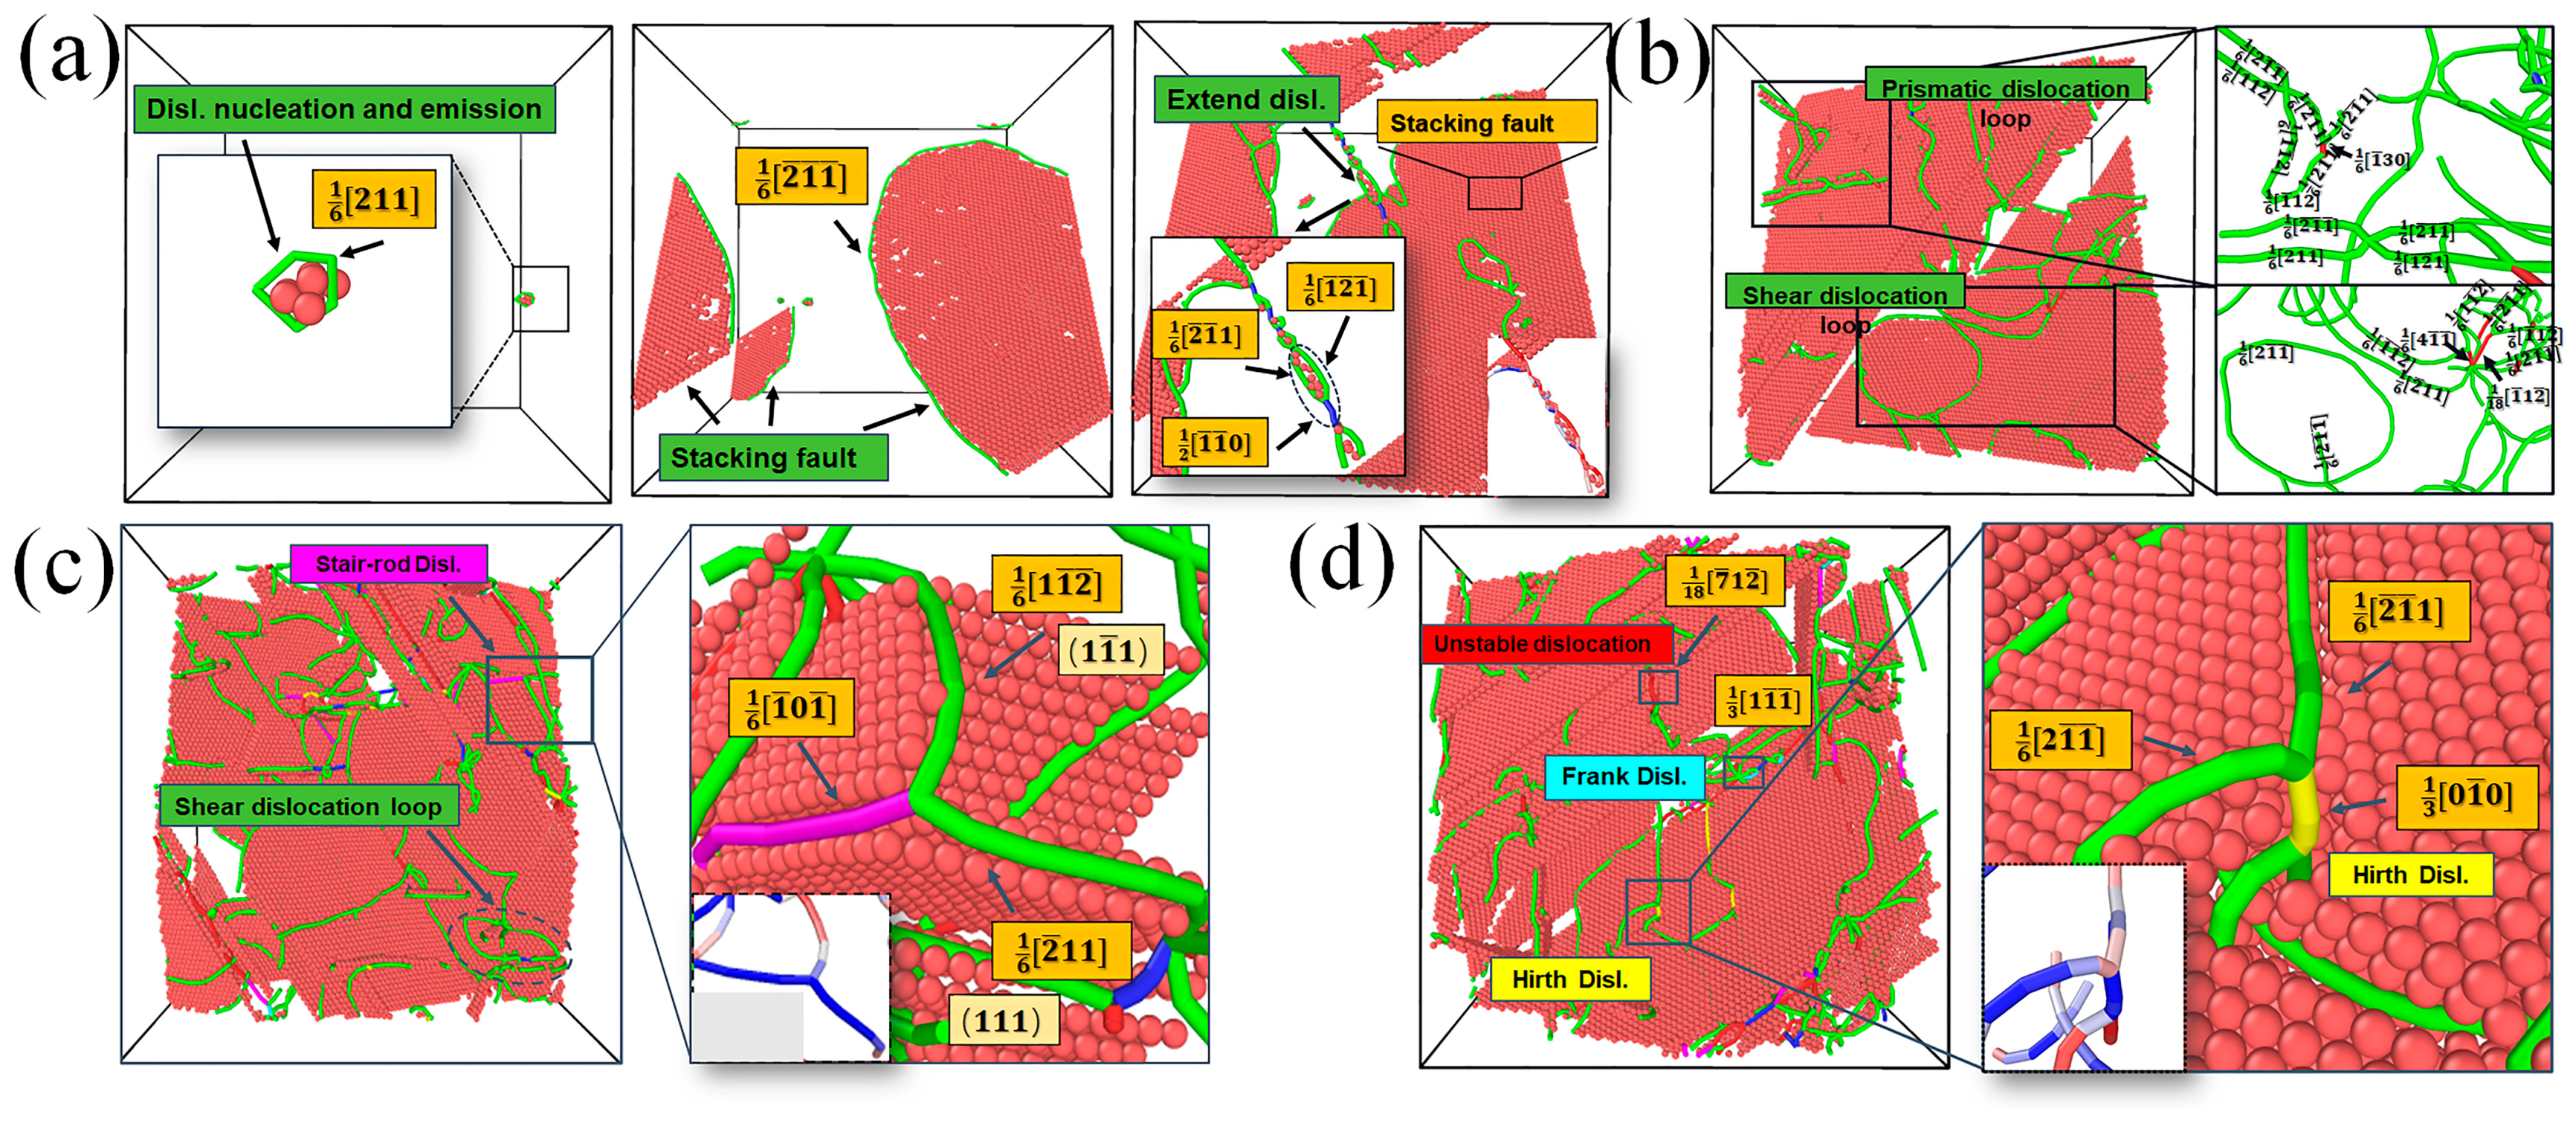
  • The plastic deformation mechanisms primarily include ISFs, ESFs, FCC → HCP phase transitions, FCC → BCC phase transitions, deformation twinning, Lomer–Cottrell dislocation locks, and dislocation reactions. These mechanisms evolve with increasing strain, contributing to the continuous strengthening of the FeNiAl alloy.

Author Contributions

Conceptualization, J.R. and X.T.; methodology, Y.G. and C.C.; software, Y.G. and Y.L.; validation, J.S., Z.Z. and C.W.; formal analysis, Y.L.; investigation, C.W.; resources, C.W. and Y.L.; data curation, J.S. and Z.Z.; writing—original draft preparation, Y.G.; writing—review and editing, C.C.; visualization, X.L.; supervision, J.R. and X.L.; project administration, X.T.; funding acquisition, J.R. All authors have read and agreed to the published version of the manuscript.

Funding

This project is financially supported by the Major Science and Technology Project of Gansu Province (24ZD13GA018), the Gansu Province science and technology plan joint research fund (23JRRB0003), the Jiayuguan City major science and technology special fund (23-01), and the Gansu Province science and technology plan project (25CXGA049).

Data Availability Statement

The original contributions presented in this study are included in the article. Further inquiries can be directed to the corresponding authors.

Conflicts of Interest

Authors Yufeng Li and Changbo Wang were employed by the company Stainless Steel Research Institute, Gansu Jiu Steel Group Hongxing Iron & Steel Co., Ltd. The remaining authors declare that the research was conducted in the absence of any commercial or financial relationships that could be construed as a potential conflict of interest.

References

  1. Zhang, Z.; Fang, C.; Wang, W.; Chen, Y. Material Properties of Fe-SMA and Its Application in Civil Engineering. Disaster Prev. Mitig. Eng. 2022, 42, 411–424. [Google Scholar]
  2. Sun, Z.; Gao, D.; Yang, W.; Huang, X.; Huang, J. Research of Fe3Al Intermetallics in Application to Structural Material. Chin. J. Mater. Res. 2001, 15, 69–76. [Google Scholar]
  3. Zhang, B.; He, B.; Wang, H. Investigation on Laser Cladding Fe-based Gradient Coatings with Hierarchical Enhanced Wear Resistance on U75V Railway Steel. Wear 2024, 552–553, 205444. [Google Scholar] [CrossRef]
  4. Lee, D.W.; Shin, D.S.; Ha, H.; Park, S.J.; Lee, K.A.; Kim, H.S. Modulated Heating Rate Effect on Optimizing Sintered Density and Microstructure in CoCrFeMnNi High-entropy alloy Fabricated Through Metal Injection Molding. Mater. Charact. 2024, 214, 114037. [Google Scholar] [CrossRef]
  5. Xu, K.; An, J.-H.; Zhang, L.; Bai, C.Y.; Tu, J.; Luo, J.-R. Composition Optimization of Cobalt-free Fe-Cr-Ni-Al/Ti multi-principal Element Alloys for Strength-ductility Trade-off based on Machine Learning. Mater. Today Commun. 2023, 36, 106498. [Google Scholar] [CrossRef]
  6. Qi, W.; Wang, W.; Yang, X.; Zhang, G.N.; Ye, W.; Su, Y.T.; Li, Y.; Chen, S.Y. Effects of Al and Ti co-doping on the Strength-ductility-corrosion Resistance of CoCrFeNi-AlTi High-entropy Alloys. J. Alloys Compd. 2022, 925, 166751. [Google Scholar] [CrossRef]
  7. Yang, D.; Liu, Y.; Jiang, H.; Liao, M.Q.; Qu, N.; Han, T.Y.; Lai, Z.H.; Zhu, J.H. A Novel FeCrNiAlTi-based High Entropy Alloy Strengthened by Refined Grains. J. Alloys Compd. 2020, 823, 153729. [Google Scholar] [CrossRef]
  8. Xin, G.A.; Zhou, M.; Jing, K.; Hu, H.Y.; Li, Z.A.; Zhang, Y.; Bai, Q.; Tian, C.J.; Tian, B.H.; Li, X.; et al. Heat Treatment Effects on Microstructure and Properties of Cu–Ti–Fe Alloys. Mater. Sci. Eng. A 2024, 892, 146068. [Google Scholar] [CrossRef]
  9. Yang, G.; Kang, J.; Carsbring, A.; Mu, W.Z.; Hedström, P.; Kim, J.K.; Park, J.H. Heterogeneous Grain Size and Enhanced Hardness by Precipitation of the BCC Particles in Medium Entropy Fe–Ni–Cr Alloys. J. Alloys Compd. 2023, 931, 167580. [Google Scholar] [CrossRef]
  10. Li, X.; Li, Z.; Wu, Z.; Zhao, S.; Zhang, W.; Bei, H.; Gao, Y. Strengthening in Al-, Mo- or Ti-doped CoCrFeNi High Entropy Alloys: A Parallel Comparison. J. Mater. Sci. Technol. 2021, 94, 264–274. [Google Scholar] [CrossRef]
  11. Zhang, L.; Qian, K.; Huang, J.; Liu, M.; Shibuta, Y. Molecular Dynamics Simulation and Machine Learning of Mechanical Response in Non-equiatomic FeCrNiCoMn High-entropy Alloy. J. Mater. Res. Technol. 2021, 13, 2043–2054. [Google Scholar] [CrossRef]
  12. Zhu, J.; Sun, L.; Li, D.; Zhu, L.; He, X. Compositional Undulation Induced Strain Hardening and Delocalization in Multi-principal Element Alloys. Int. J. Mech. Sci. 2023, 241, 107931. [Google Scholar] [CrossRef]
  13. Wan, W.; Liang, K.; Zhu, P.; He, P.; Zhang, S. Recent Advances in the Synthesis and Fabrication Methods of High-entropy Alloy Nanoparticles. J. Mater. Sci. Technol. 2024, 178, 226–246. [Google Scholar] [CrossRef]
  14. Cantor, B.; Chang, I.T.H.; Knight, P.; Vincent, A.J.B. Microstructural Development in Equiatomic Multicomponent Alloys. Mater. Sci. Eng. A 2004, 375–377, 213–218. [Google Scholar] [CrossRef]
  15. Han, Z.D.; Luan, H.W.; Liu, X.; Chen, N.; Li, X.Y.; Shao, Y.; Yao, K.F. Microstructures and Mechanical Properties of TixNbMoTaW Refractory High-entropy Alloys. Mater. Sci. Eng. A 2018, 712, 380–385. [Google Scholar] [CrossRef]
  16. Zhang, Y.; Zuo, T.T. Microstructures and Properties of High-entropy Alloys. Prog. Mater. Sci. 2014, 61, 1–93. [Google Scholar] [CrossRef]
  17. Wang, J.; Jiang, F.; Yang, G.; Xu, M.; Yi, J. Cr Addition-mediated Simultaneous Achievement of Excellent Strength and Plasticity in Non-equiatomic Nb-Ti-Zr-Ta-base Refractory High-entropy Alloys. J. Alloys Compd. 2023, 946, 169423. [Google Scholar] [CrossRef]
  18. Xu, H.; Zhang, Z.J.; Zhang, P.; Cui, C.Y.; Jin, T.; Zhang, T. The Synchronous Improvement of Strength and Plasticity (SISP) in New Ni-Co based Disc Superalloys by Controling Stacking Fault Energy. Sci. Rep. 2017, 7, 8046. [Google Scholar] [CrossRef]
  19. Laplanche, G.; Horst, O.; Otto, F.; Eggeler, G.; George, E.P. Microstructural Evolution of a CoCrFeMnNi High-entropy Alloy after Swaging and Annealing. J. Alloys Compd. 2015, 647, 548–557. [Google Scholar] [CrossRef]
  20. Schneider, M.; Laplanche, G. Effects of Temperature on Mechanical Properties and Deformation Mechanisms of the Equiatomic CrFeNi Medium-entropy Alloy. Acta Mater. 2021, 204, 116470. [Google Scholar] [CrossRef]
  21. Wu, M.; Sim, R.K.; He, A.; Diao, G.; Chen, D.; Li, D. Enhancing Mechanical Performance and Wear Resistance of Co-free B2/A2 CrFeNiAl Alloy via Cr and Ti Adjustment. MRS Bull. 2024, 49, 25–37. [Google Scholar] [CrossRef]
  22. Gao, Q.; Wang, W.; Ren, J.; Li, W.; Sang, B.; Li, L.; Wang, Q.; Lu, X.; Qiao, J. Optimizing Strength-ductility in NiCoMn Medium Entropy Alloys with Atomic-scale Rapid Composition Design. J. Mater. Sci. Technol. 2025, 215, 71–85. [Google Scholar] [CrossRef]
  23. Tang, K.; Wu, Y.K.; Wei, R.; Chen, L.B.; Lu, S.; Qi, Y.L.; Jiang, F.; Sun, J. Achieving Superior Cryogenic Tensile Properties in a Ti-doped (Fe40Mn40Co10Cr10)96.7C3.3 High-entropy Alloy by Recovering Deformation Twinning. Mater. Sci. Eng. A 2021, 808, 140927. [Google Scholar] [CrossRef]
  24. Jiang, D.; Xie, L.; Wang, L. Current Application Status of Multi-scale Simulation and Machine Learning in Research on High-entropy Alloys. J. Mater. Res. Technol. 2023, 26, 1341–1374. [Google Scholar] [CrossRef]
  25. Borovikov, V.V.; Mendelev, M.I.; Smith, T.M.; Lawson, J.W. Molecular Dynamics Simulation of Twin Nucleation and Growth in Ni-based Superalloys. Int. J. Plast. 2023, 166, 103645. [Google Scholar] [CrossRef]
  26. Branicio, P.S.; Rino, J.P.; Gan, C.K.; Tsuzuki, H. Interaction Potential for Indium Phosphide: A Molecular Dynamics and First-principles Study of the Elastic Constants, Generalized Stacking Fault and Surface Energies. J. Phys. Condens. Matter 2009, 21, 095002. [Google Scholar] [CrossRef]
  27. Jarlöv, A.; Ji, W.; Zhu, Z.; Tian, Y.; Babicheva, R.; An, R.; Seet, H.L.; Sharon, M.L.; Zhou, N.K. Molecular Dynamics Study on the Strengthening Mechanisms of Cr–Fe–Co–Ni High-entropy Alloys based on the Generalized Stacking Fault Energy. J. Alloys Compd. 2022, 905, 164137. [Google Scholar] [CrossRef]
  28. Yan, J.X.; Zhang, Z.J.; Li, K.Q.; Yang, J.B.; Zhang, Z.F. Cross-slip Mechanisms of <111> Screw Super dislocations in FeAl. Comput. Mater. Sci. 2021, 189, 110261. [Google Scholar] [CrossRef]
  29. Liu, P.; Xie, J.; Wang, A.; Ma, D.; Mao, Z. Molecular Dynamics Simulation on the Deformation Mechanism of Monocrystalline and Nano-twinned TiN under Nanoindentation. Mater. Chem. Phys. 2020, 252, 123263. [Google Scholar] [CrossRef]
  30. Gao, T.; Song, H.; Wang, B.; Gao, Y.; Liu, Y.; Xie, Q.; Chen, Q.; Xiao, Q.; Liang, Y. Molecular Dynamics Simulations of Tensile Response for FeNiCrCoCu High-entropy Alloy with Voids. Int. J. Mech. Sci. 2023, 237, 107800. [Google Scholar] [CrossRef]
  31. Fang, Q.; Chen, Y.; Li, J.; Jiang, C.; Liu, B.; Liu, Y.; Liaw, P.K. Probing the Phase Transformation and Dislocation Evolution in Dual-phase High-entropy Alloys. Int. J. Plast. 2019, 114, 161–173. [Google Scholar] [CrossRef]
  32. Plimpton, S. Fast Parallel Algorithms for Short-Range Molecular Dynamics. J. Comput. Phys. 1995, 117, 1–19. [Google Scholar] [CrossRef]
  33. Farkas, D.; Caro, A. Model Interatomic Potentials for Fe-Ni-Cr-Co-Al High-entropy Alloys. J. Mater. Res. 2020, 35, 3031–3040. [Google Scholar] [CrossRef]
  34. Hirel, P. Atomsk: A Tool for Manipulating and Converting Atomic Data Files. Comput. Phys. Commun. 2015, 197, 212–219. [Google Scholar] [CrossRef]
  35. Khan, T.Z.; Kirk, T.; Vazquez, G.; Singh, P.; Smirnov, A.V.; Johnson, D.D.; Youssef, K.; Arróyave, R. Towards Stacking Fault Energy Engineering in FCC High Entropy Alloys. Acta Mater. 2022, 224, 117472. [Google Scholar] [CrossRef]
  36. Choi, W.S.; Pang, E.L.; Ko, W.-S.; Jun, H.; Bong, H.J.; Kirchlechner, C.; Raabe, D.; Choi, P.P. Orientation-dependent Plastic Deformation Mechanisms and Competition with Stress-induced Phase Transformation in Microscale NiTi. Acta Mater. 2021, 208, 116731. [Google Scholar] [CrossRef]
  37. Zhang, H.; Wang, C.; Shi, S.; Li, T.; Zou, L.; Lu, Y.; Liaw, P.K. Tuning Deformation Mechanisms of Face-centered-cubic High-entropy Alloys via Boron Doping. J. Alloys Compd. 2022, 911, 165103. [Google Scholar] [CrossRef]
  38. Hu, X.; Huang, M.; Zhu, Y.; Zhao, L.; Li, Z.H. Investigation of Physical Properties and Superdislocation Characters of Ni3Al under Uniaxial Tension/compression Normal to Slip Plane. Intermetallics 2021, 136, 107258. [Google Scholar] [CrossRef]
  39. Rao, S.I.; Varvenne, C.; Woodward, C.; Parthasarathy, T.A.; Miracle, D.; Senkov, O.N.; Curtin, W.A. Atomistic Simulations of Dislocations in a Model BCC Multicomponent Concentrated Solid Solution Alloy. Acta Mater. 2017, 125, 311–320. [Google Scholar] [CrossRef]
  40. Li, W.; Gao, Q.; Ren, J.; Wang, Q.; Li, J.; Xue, H.; Lu, X.; Tang, F. Designing the Composition and Optimizing the Mechanical Properties of Non-equiatomic FeCoNiTi High-entropy Alloys. J. Mater. Res. Technol. 2024, 29, 376–385. [Google Scholar] [CrossRef]
  41. Chmelko, V.; Koščo, T.; Šulko, M.; Margetin, M.; Škriniarová, J. Poisson’s Ratio of Selected Metallic Materials in the Elastic–Plastic Region. Metals 2024, 14, 433. [Google Scholar] [CrossRef]
  42. Zuo, L.; Humbert, M.; Esling, C. Elastic Properties of Polycrystals in the Voigt-Reuss-Hill Approximation. J. Appl. Crystallogr. 1992, 25, 751–755. [Google Scholar] [CrossRef]
  43. Rao, S.I.; Woodward, C.; Parthasarathy, T.A.; Senkov, O. Atomistic Simulations of Dislocation Behavior in a Model FCC Multicomponent Concentrated Solid Solution Alloy. Acta Mater. 2017, 134, 188–194. [Google Scholar] [CrossRef]
  44. Zhang, W.X.; Cong, Y.B.; Wang, J.; Li, C.; Wan, J.; Chen, Y.Z. Revealing the effects of martensitic transformation and dislocation slip in austenite on the micromechanical behaviors of a 9Ni steel using crystal plasticity finite element method. Int. J. Plast. 2024, 174, 103869. [Google Scholar] [CrossRef]
  45. Qi, Y.; Zhao, M.; Feng, M. Molecular Simulation of Microstructure Evolution and Plastic Deformation of Nanocrystalline CoCrFeMnNi High-entropy Alloy under Tension and Compression. J. Alloys Compd. 2021, 851, 156923. [Google Scholar] [CrossRef]
  46. Yang, R.; Yang, L.; Wang, T.; Wang, Q. Untra-fine-grained Equiatomic CoCrNi Medium Entropy Alloys with High Density Stacking Faults and Strengthening Mechanisms. Mater. Sci. Eng. A 2023, 870, 144880. [Google Scholar] [CrossRef]
  47. Yan, Z.; Lin, Y. Lomer-Cottrell Locks with Multiple Stair-rod Dislocations in a Nanostructured Al Alloy Processed by Severe Plastic Deformation. Mater. Sci. Eng. A 2019, 747, 177–184. [Google Scholar] [CrossRef]
  48. Gao, J.; Jiang, S.; Zhao, H. Enhancing Strength and Ductility in a Near Medium Mn Austenitic Steel via Multiple Deformation Mechanisms through Nanoprecipitation. Acta Mater. 2023, 243, 118538. [Google Scholar] [CrossRef]
  49. Alabd Alhafez, I.; Ruestes, C.J.; Zhao, S.; Minor, A.M.; Urbassek, H.M. Dislocation Structures below a Nano-indent of the CoCrNi Medium-entropy Alloy. Mater. Lett. 2021, 283, 128821. [Google Scholar] [CrossRef]
  50. Remington, T.P.; Ruestes, C.J.; Bringa, E.M.; Remington, B.A.; Lu, C.H.; Kad, B.; Meyers, M.A. Plastic Deformation in Nanoindentation of Tantalum: A New Mechanism for Prismatic Loop Formation. Acta Mater. 2014, 78, 378–393. [Google Scholar] [CrossRef]
  51. Erel, C.; Po, G.; Crosby, T.; Ghoniem, N. Generation and Interaction Mechanisms of Prismatic Dislocation Loops in FCC Metals. Comput. Mater. Sci. 2017, 140, 32–46. [Google Scholar] [CrossRef]
  52. Sun, B.; Ouyang, W.; Ren, J.; Mi, L.; Guo, W. Fcc → bcc → hcp Successive Phase Transformations in the Strained Ultrathin Copper Film: A Molecular Dynamic Simulation Study. Mater. Chem. Phys. 2019, 223, 171–182. [Google Scholar] [CrossRef]
  53. Li, Q.; Jiang, C.L.; Du, Y. Molecular Dynamics Study on Dynamic Mechanical Behaviour of FeCoCrCuNi High Entropy Alloy. Mater. Technol. 2023, 38, 2200660. [Google Scholar] [CrossRef]
  54. Zhang, J.; Yan, J.; Liu, C.; Yao, Z.; Huang, J.; Yu, H.; Xie, H.; Yin, F.; Fang, W. Dislocation Behavior in Initial Stage of Plastic Deformation for CoCrNi Medium Entropy Alloy. J. Alloys Compd. 2023, 943, 169057. [Google Scholar]
  55. Liang, Q.; Weng, S.; Fu, T.; Hu, S.; Peng, X. Dislocation Reaction-based Formation Mechanism of Stacking Fault Tetrahedra in FCC High-entropy Alloy. Mater. Chem. Phys. 2022, 282, 125997. [Google Scholar] [CrossRef]
Figure 1. Schematic of GSFE calculation and the upper and lower portions of the relative slip model.
Metals 15 00460 g001
Figure 2. The MD test results of lattice constants of each component.
Metals 15 00460 g002
Figure 3. Relevant values obtained from MD. (a) Elastic constants C11, C12, and C44; (b) C′, Cauchy pressure Cp; (c) Elastic modulus (B, E, G); (d) Poisson’s ratio v.
Metals 15 00460 g003
Figure 4. GSFE of FCC FeNiAl Alloy obtained from MD. (a) GSFE curves of 16 components, (b) γUI, (c) γISF, and (d) γUE and γESF. The red and green atoms represent the FCC and the stacking faults atoms respectively.
Metals 15 00460 g004
Figure 5. Optimal composition selection diagram. (a) Selection based on G value, (b) selection based on γISF.
Metals 15 00460 g005
Figure 6. Equilibrium phase diagram calculations. (a) Ternary equilibrium phase diagram of the Fe-Ni-Al system, (b) Phase fraction versus temperature diagram for Fe90Ni9Al1.
Metals 15 00460 g006
Figure 7. Stress–strain curves of the four variants obtained from MD.
Metals 15 00460 g007
Figure 8. Phase content and dislocation length during the simulation tensile process. (a) HCP phase content of four components and (b) Schockley dislocation length. (c) Phase content curve of component 16 (Fe90Ni9Al) and (d) Dislocation length curve.
Metals 15 00460 g008
Figure 9. The simulation tensile deformation process of Fe90Ni9Al and Fe70NiAl29 alloys. Fe90Ni9Al shows (a) 10.3%, (b) 11.5%, (c) 12.2%, and (d) 13.7% at different strain levels. Fe70NiAl29 shows (e) 4.1%, (f) 4.5%, (g) 5.3%, and (h) 6.4% at different strain levels.
Metals 15 00460 g009
Figure 10. Phase transition mechanism diagram. (a) FCC → BCC phase transition diagram. (b) FCC → HCP phase transition diagram.
Metals 15 00460 g010
Figure 11. Analysis of dislocation loop evolution of Fe90Ni9Al in the process of strain of 10.3–10.9%: (a) 10.3%, without atoms (b) 10.3%,with atoms, (c) 10.4%, (d) 10.5%, (e) 10.6%, (f) 10.7%, (g) 10.8%, (h) 10.9%, the green is Shockley partial dislocation, the red atom is Fe atom, the blue atom is Al atom, and the yellow atom is Ni atom. The red fragment is the screw dislocation fragment, and the blue fragment is the edge dislocation fragment.
Metals 15 00460 g011
Figure 12. The dislocation reaction of the component Fe90Ni9Al during the tensile process: (a) the generation and decomposition of the Perfect dislocation into two Schockley partial dislocations to form an extended dislocation; (b) the Schockley dislocations on the upper part of the shear loop are close to each other to form a ‘U’ dislocation loop. (c) Lomer–Cottrell lock; (d) Hirth and Frank dislocations.
Metals 15 00460 g012
Table 1. Composition of FeNiAl HEAs.
TypeCompositionLattice Constant
1Fe60Ni5Al353.76
2Fe60Ni10Al303.76
3Fe60Ni15Al253.71
4Fe60Ni20Al203.68
5Fe70NiAl293.76
6Fe70Ni5Al253.73
7Fe70Ni10Al203.69
8Fe70Ni15Al153.68
9Fe70Ni20Al103.61
10Fe80Ni5Al153.68
11Fe80Ni10Al103.63
12Fe80Ni15Al53.59
13Fe80Ni19Al3.58
14Fe90NiAl193.64
15Fe90Ni5Al53.59
16Fe90Ni9Al3.56
Table 2. C11, C12, and C44 for each variant obtained from MD.
12345678
C11177.26165.26172.30142.28188.55102.53134.13162.05
C12129.60124.1111562.04150.23108.15144.89135.59
C44166.6094.7386.7081.74101.8989.6578.3592.50
910111213141516
C11148.17132.10271.92185.39223.15186.98189.79187.97
C12152.39150.08144.36124.16152.45143.59117.85148.60
C4494.6171.7359.1968.8789.7692.1256.5481.31
Table 3. Yield strength (σ) and yield strain (ε) of the four variants obtained from MD.
AlloysYield Strength (GPa)Yield Strain (%)
(4) Fe60Ni20Al207.514.1
(5) Fe70NiAl297.164.9
(13) Fe80Ni19Al16.1610.3
(16) Fe90Ni9Al16.3310.4
Disclaimer/Publisher’s Note: The statements, opinions and data contained in all publications are solely those of the individual author(s) and contributor(s) and not of MDPI and/or the editor(s). MDPI and/or the editor(s) disclaim responsibility for any injury to people or property resulting from any ideas, methods, instructions or products referred to in the content.

