Article

Optimization and Finite Element Simulation of Wear Prediction Model for Hot Rolling Rolls

1
National Engineering Research Center for Equipment and Technology of Cold Strip Rolling, Yanshan University, Qinhuangdao 066004, China
2
State Key Laboratory of Metastable Materials Science and Technology, Yanshan University, Qinhuangdao 066004, China
*
Author to whom correspondence should be addressed.
Metals 2025, 15(4), 456; https://doi.org/10.3390/met15040456
Submission received: 18 March 2025 / Revised: 10 April 2025 / Accepted: 15 April 2025 / Published: 18 April 2025
(This article belongs to the Special Issue Advances in Metal Rolling Processes)

Abstract

:
Roll wear significantly affects production efficiency and product quality in hot-rolled strip steel manufacturing by reducing roll lifespan and impeding the control of strip shape. This study addresses these challenges through a comprehensive analysis of the roll wear mechanism and the integration of an elastic deformation model. We propose an optimized wear prediction model for work and backup rolls in a hot continuous rolling finishing mill, dynamically accounting for variations in strip specifications and cumulative wear effects. A three-dimensional elastic–plastic thermo-mechanical coupled finite element model was established using MARC 2020 software, with experimental calibration of wear coefficients under specific production conditions. The developed dynamic simulation software achieved high-precision wear prediction, validated by field measurements. The optimized model reduced prediction deviations for work and backup rolls to 0.012 and 0.004, respectively, improving accuracy by 5.3% and 3.25% for uniform and mixed strip specifications. This research provides a robust theoretical framework and practical tool for precision roll wear management in industrial hot rolling processes.

1. Introduction

Rolls are the primary components in the production of hot-rolled strip steel and are crucial for ensuring good plate shape. However, roll wear damages the surface quality of rolls and the shape of the roll gap, posing numerous challenges to the control of steel product quality [1,2,3,4]. During the rolling process of strip steel, roll wear manifests in various forms, with the wear of work rolls mainly caused by friction from contact with the strip steel. From the perspective of metal wear mechanisms, wear can be classified into abrasive wear, fatigue wear (contact fatigue, thermal fatigue, etc.), adhesive wear, and corrosive wear. In hot rolling, roll wear primarily manifests as cyclic stress under alternating thermal stress, fatigue wear when the cyclic stress exceeds the fatigue strength of the roll, and wear caused by oxide flakes adhering during the rolling process acting as abrasive particles [5,6,7]. Wear not only increases roll consumption but also alters the roll profile and the shape of the roll gap, affecting strip steel production. This leads to an uneven distribution of rolling force and roll pressure along the roll body, thereby impacting the exit shape of the strip steel. Therefore, it is necessary to optimize the roll wear model to more accurately predict roll wear conditions [8,9].
In the field of roll wear research, numerous scholars have conducted in-depth studies on aspects such as roll wear model construction, wear mechanism analysis, and optimization strategies, achieving fruitful results. These studies are of great significance for enhancing roll performance and ensuring the quality of rolled products, providing valuable references for subsequent research. John et al. [10] developed a model to predict the wear profile of rolls in the finishing stands of hot strip mills, offering an important basis for evaluating the wear state of rolls. Wang et al. [11] introduced the concept of a comprehensive profile for work rolls and its predictive calculation model, enriching the theoretical system of roll profile research and facilitating more precise control of the performance of work rolls during the rolling process. Zeng et al. [12] considered the factors affecting uneven wear in steel rolling and rolls, improved the roll wear prediction model, and optimized its parameters, significantly enhancing the accuracy of model prediction. Liu [13] meticulously analyzed various types of wear faced by rolls, deeply explored their formation mechanisms and specific impacts on the performance of rolled products, and then proposed practical improvement strategies such as optimizing roll materials, adjusting rolling process parameters, and implementing scientific wear management. Zhang et al. [14], based on an analysis of the wear data of 1580 mm hot rolling mill rolls in a certain factory, optimized the roll wear prediction model and its parameters by comprehensively considering factors such as the type of rolled steel and non-uniform roll wear. Experimental verification shows that the prediction accuracy of the improved model has been significantly improved, providing a more reliable method for roll wear prediction in actual production. Wu et al. [15], based on the principle of tribology, established a relative sliding model between rolled parts and rolls. By calculating the relative sliding distance, they constructed a wear prediction model for the working rolls of the strip mill and optimized the parameter identification of the model using genetic algorithms, offering new ideas and methods for predicting the wear of working rolls. Zeng et al. [12], through the study of roll wear curves, determined that the irregular wear of rolls affects the convexity of strip steel plates, revealing the relationship between roll wear and strip steel quality and providing a reference for the optimization of strip steel production processes. Li et al. [16], based on the MATLAB 2014a platform, pre-processed and analyzed the surface images of rolls at different stages using image processing technology, constructed a Back Propagation neural network model for the state identification of roll wear morphology, and achieved effective identification and prediction of roll wear morphology, opening up a new way for establishing a quantitative evaluation system for roll wear morphology. Zhang et al. [17] analyzed the wear evolution process of the microscopic morphology of roll surfaces, summarized the main problems existing in the current theoretical research and production practice of steel plate microscopic surface quality, and put forward a number of constructive suggestions for further theoretical and technical research in this field, promoting the development of the field of steel plate microscopic surface quality control.
In addition to the above-mentioned research, many other scholars have also made significant progress in research areas such as rolling simulation and roll wear simulation. Liu et al. [18] utilized the wear subroutine in ABAQUS 2022 to incorporate the Archard wear calculation model into the solution process. They fed the calculated wear amount back to the finite element model and used the adaptive mesh redraw technique to update the wear state, enabling a more accurate simulation of the roll wear process. Peng et al. [19] established a working roll wear prediction model based on Archard’s formula and the basic theory of rolling. They used ABAQUS to construct a thermal coupling model of rolls–workpiece during the rolling process, analyzed the effects of the underpressure rate, rolling speed, width of rolled parts, and support rolls on the contact stress and wear law of the work roll, and found that when the underpressure rate increases, the contact stress and wear increase significantly. Song et al. [20] started from the wear characteristics of the work rolls of hot-rolling and leveling machines, combined with a large amount of on-site actual wear data, and used the ABAQUS finite element simulation and analysis software to establish a coupled calculation model of the roll system–rolling piece for single-stand four-roll hot-rolling and leveling machines, aiming to reveal the mechanism of the role of the contact stress of the work roll in the wear evolution at different wear stages. Pesin et al. [21] conducted numerical analysis of roll wear using finite element simulation, calculated the roll wear amount by the Usui formula, and used the DEFORM 2D 10.2 software to calculate roll wear based on sliding speed, interface pressure, and temperature. The simulation results can be used to optimize the asymmetric rolling process and improve the quality of aluminum plates.
The above studies mainly focus on the static wear of rolls and rarely consider the further impact of cumulative wear during the rolling process. The study of using finite element methods to analyze roll wear mainly stays at the level of obtaining rolling force and other parameters, without directly simulating the amount of roll wear or combining it with actual production results, failing to realize the unity of theory, simulation, and practice. The aim of this study is to optimize the roll wear model by integrating the three aspects of wear, taking into account the effects of different materials and specifications of steel plates in the rolling process, as well as the continuous change and superposition of roll wear with the increase in rolling mileage. By integrating the multi-dimensional analysis of roll wear, this study aims to break through the limitations of the traditional static model. Focusing on real-time rolling pressure updating and inter-roll pressure distribution, the feedback effect of wear accumulation on roll shape change and subsequent wear during the rolling process is comprehensively quantified. 3D elastic–plastic thermodynamically coupled finite element simulation (based on MARC software) is combined with experimental calibration of wear coefficients to enhance industrial adaptability. In order to further realize dynamic prediction, special simulation software is developed to analyze the wear effects of different steel grades and the specifications of strip in real time, validated with on-site data, so as to provide an efficient tool for industrial precision management and a systematic solution for intelligent wear management of hot rolling process.

2. Materials and Methods

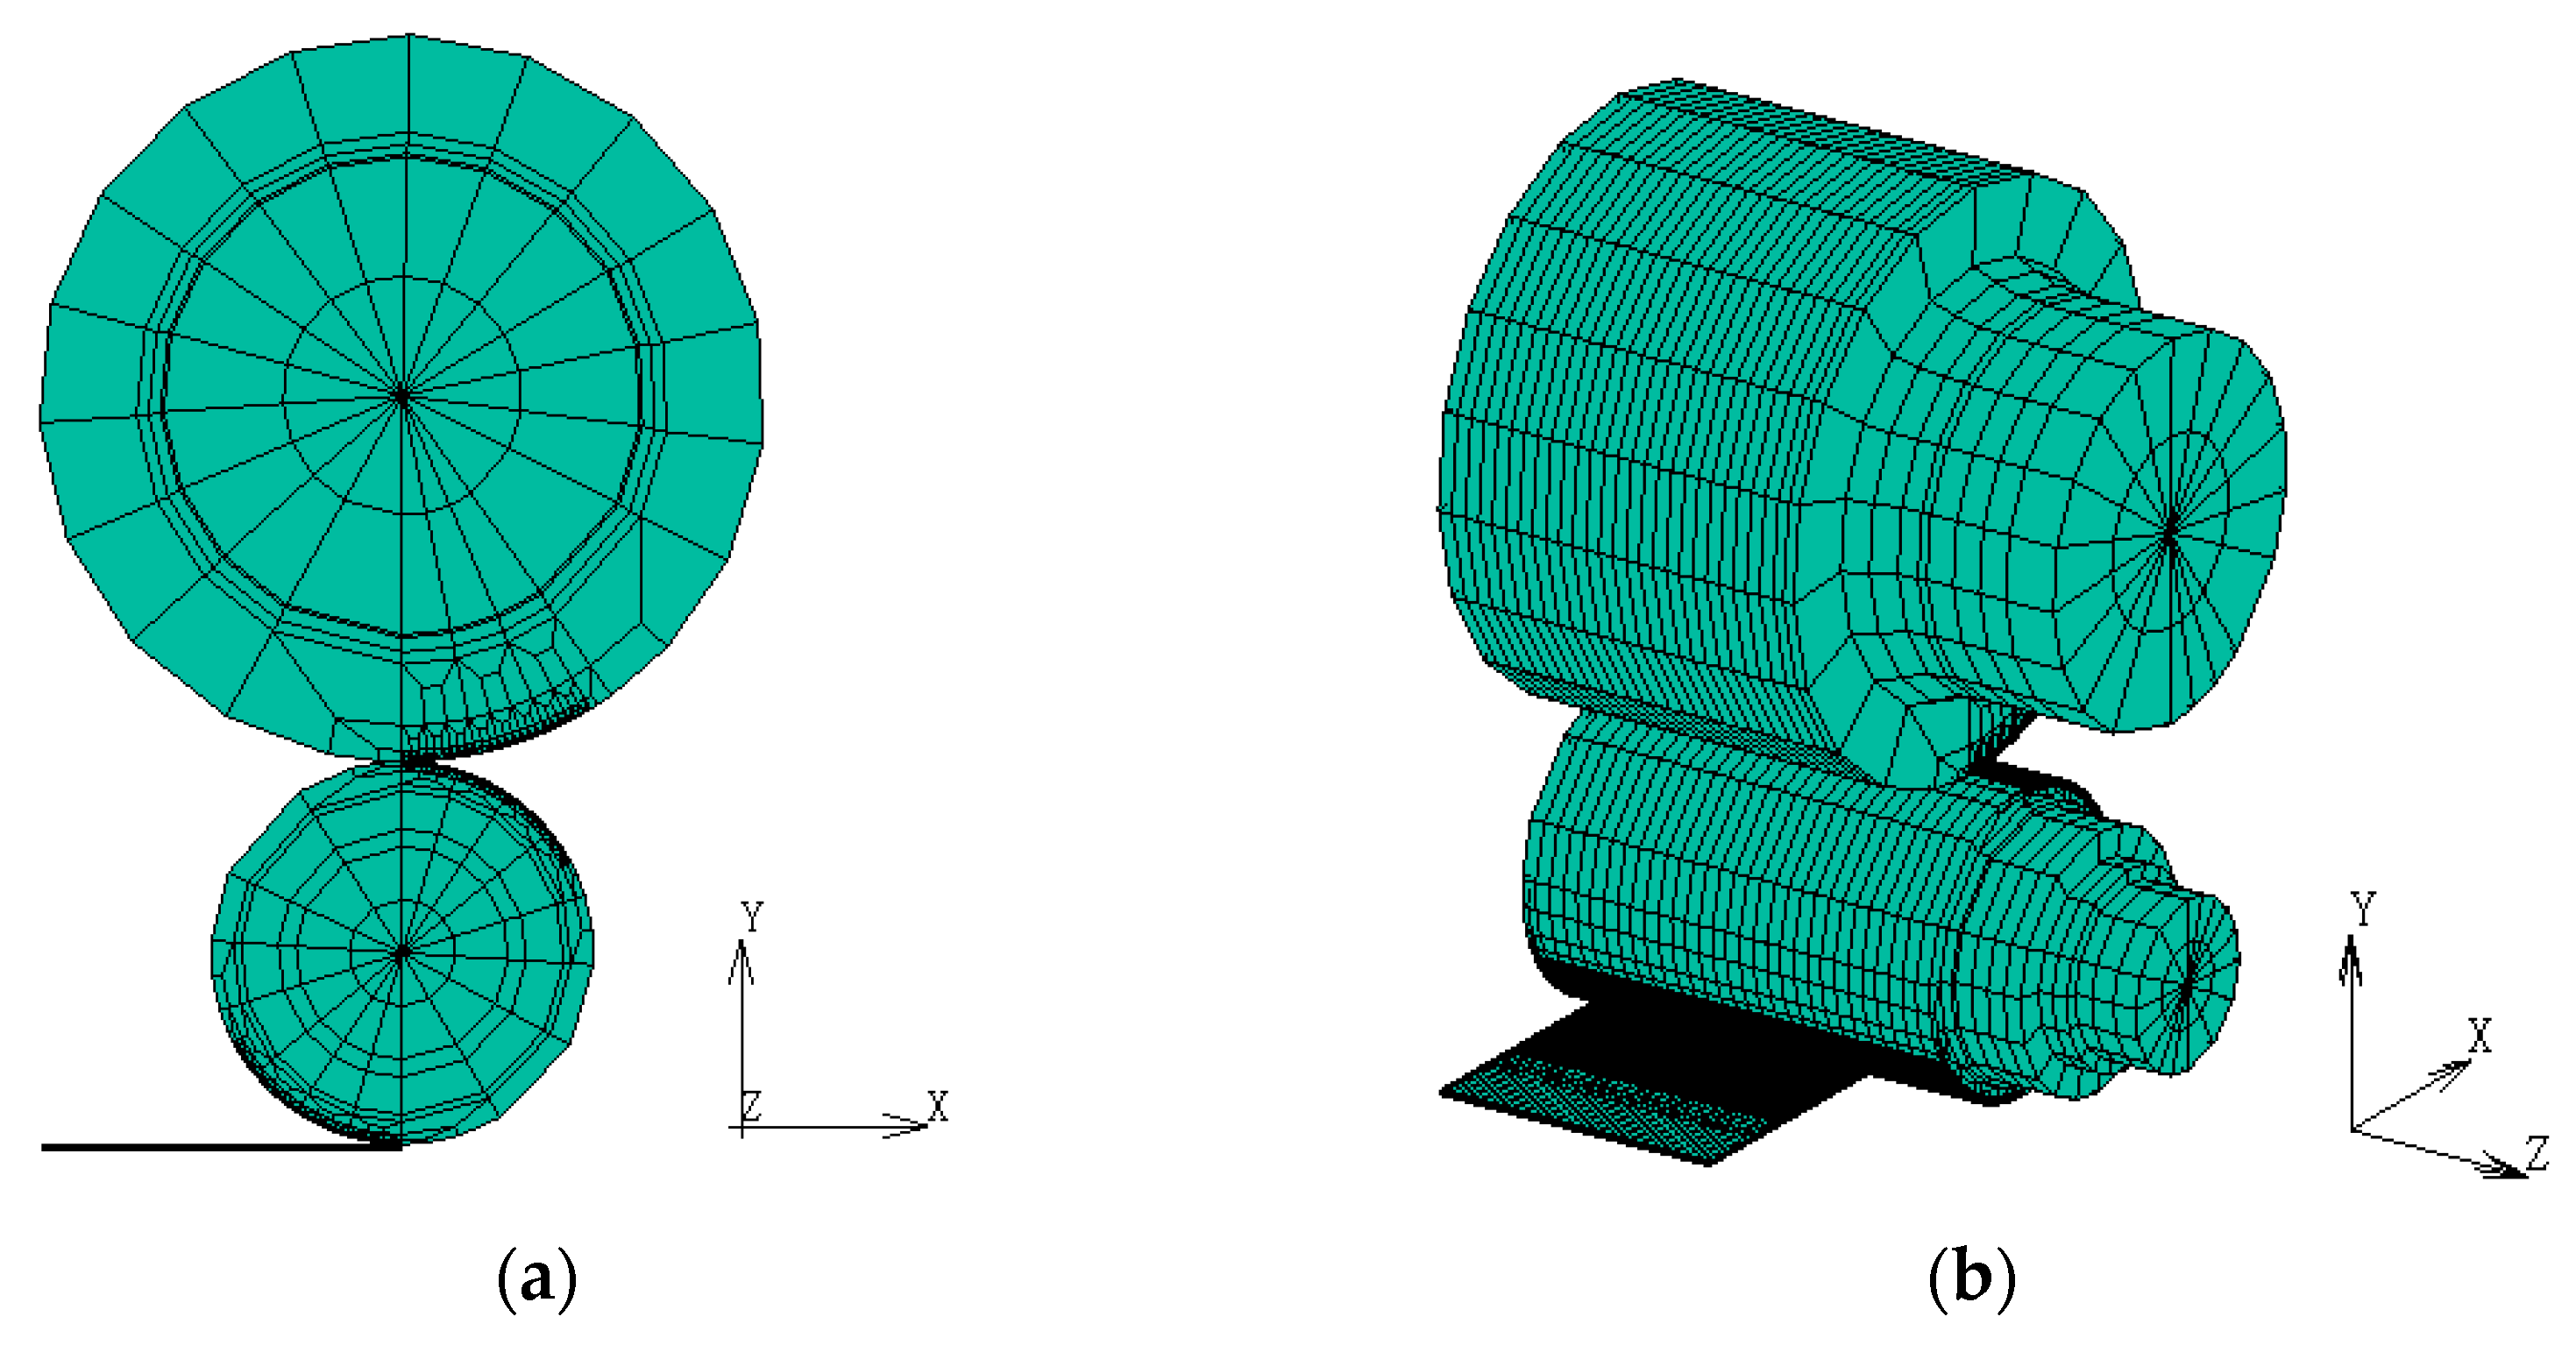
2.1. Model Parameter Settings

To establish a finite element model for hot rolling roll wear using Marc 2020 software (numerical simulations were performed on a high-performance computing cluster equipped with an Intel Core i7-12700K, 32 GB RAM, and an NVIDIA GTX 1660, running Windows 10), an eight-node hexahedral element is employed to ensure the accuracy of the finite element model. The minimum size of the mesh at the contact area is 4 mm. The model contains a total of 36,423 nodes and 28,513 elements. To reduce the computation time of the finite element model, the model is simplified to a 1/4 model based on the working principle of the rolling mill. As shown in Figure 1, the 2D graphic model from AutoCAD 2022 software is imported into Marc software. The custom element creation function in Marc software is utilized to refine the mesh of the contact area between the rolls and the contact area with the strip steel through a partitioning method. (Since this study only focuses on the state of the rolls and the rolled material under steady-state rolling conditions, the mesh in non-contact areas is relatively coarse. Therefore, there is no need to divide small meshes in non-contact areas, as the initial and final stages of rolling do not represent the rolling state of the material. The meshes established in Figure 1 and Figure 2 are sufficient to ensure the model reaches a steady-state rolling condition, and this study is also based on the steady-state rolling condition to investigate roll wear.) To ensure the accuracy of the main analysis area, as shown in Figure 1 and Figure 2, the roll material is alloy cast iron, and the rolled material is wheel steel 380CL. The main geometric parameters of the model are listed in Table 1, and the material parameters are provided in Table 2 [22,23]. The coordinate system is defined as follows: the x-axis represents the rolling direction (RD), the y-axis represents the vertical direction, and the z-axis represents the roll axial direction (TD). All transversely distributed parameters (such as contact pressure and rolling force) are expressed with z as the independent variable.

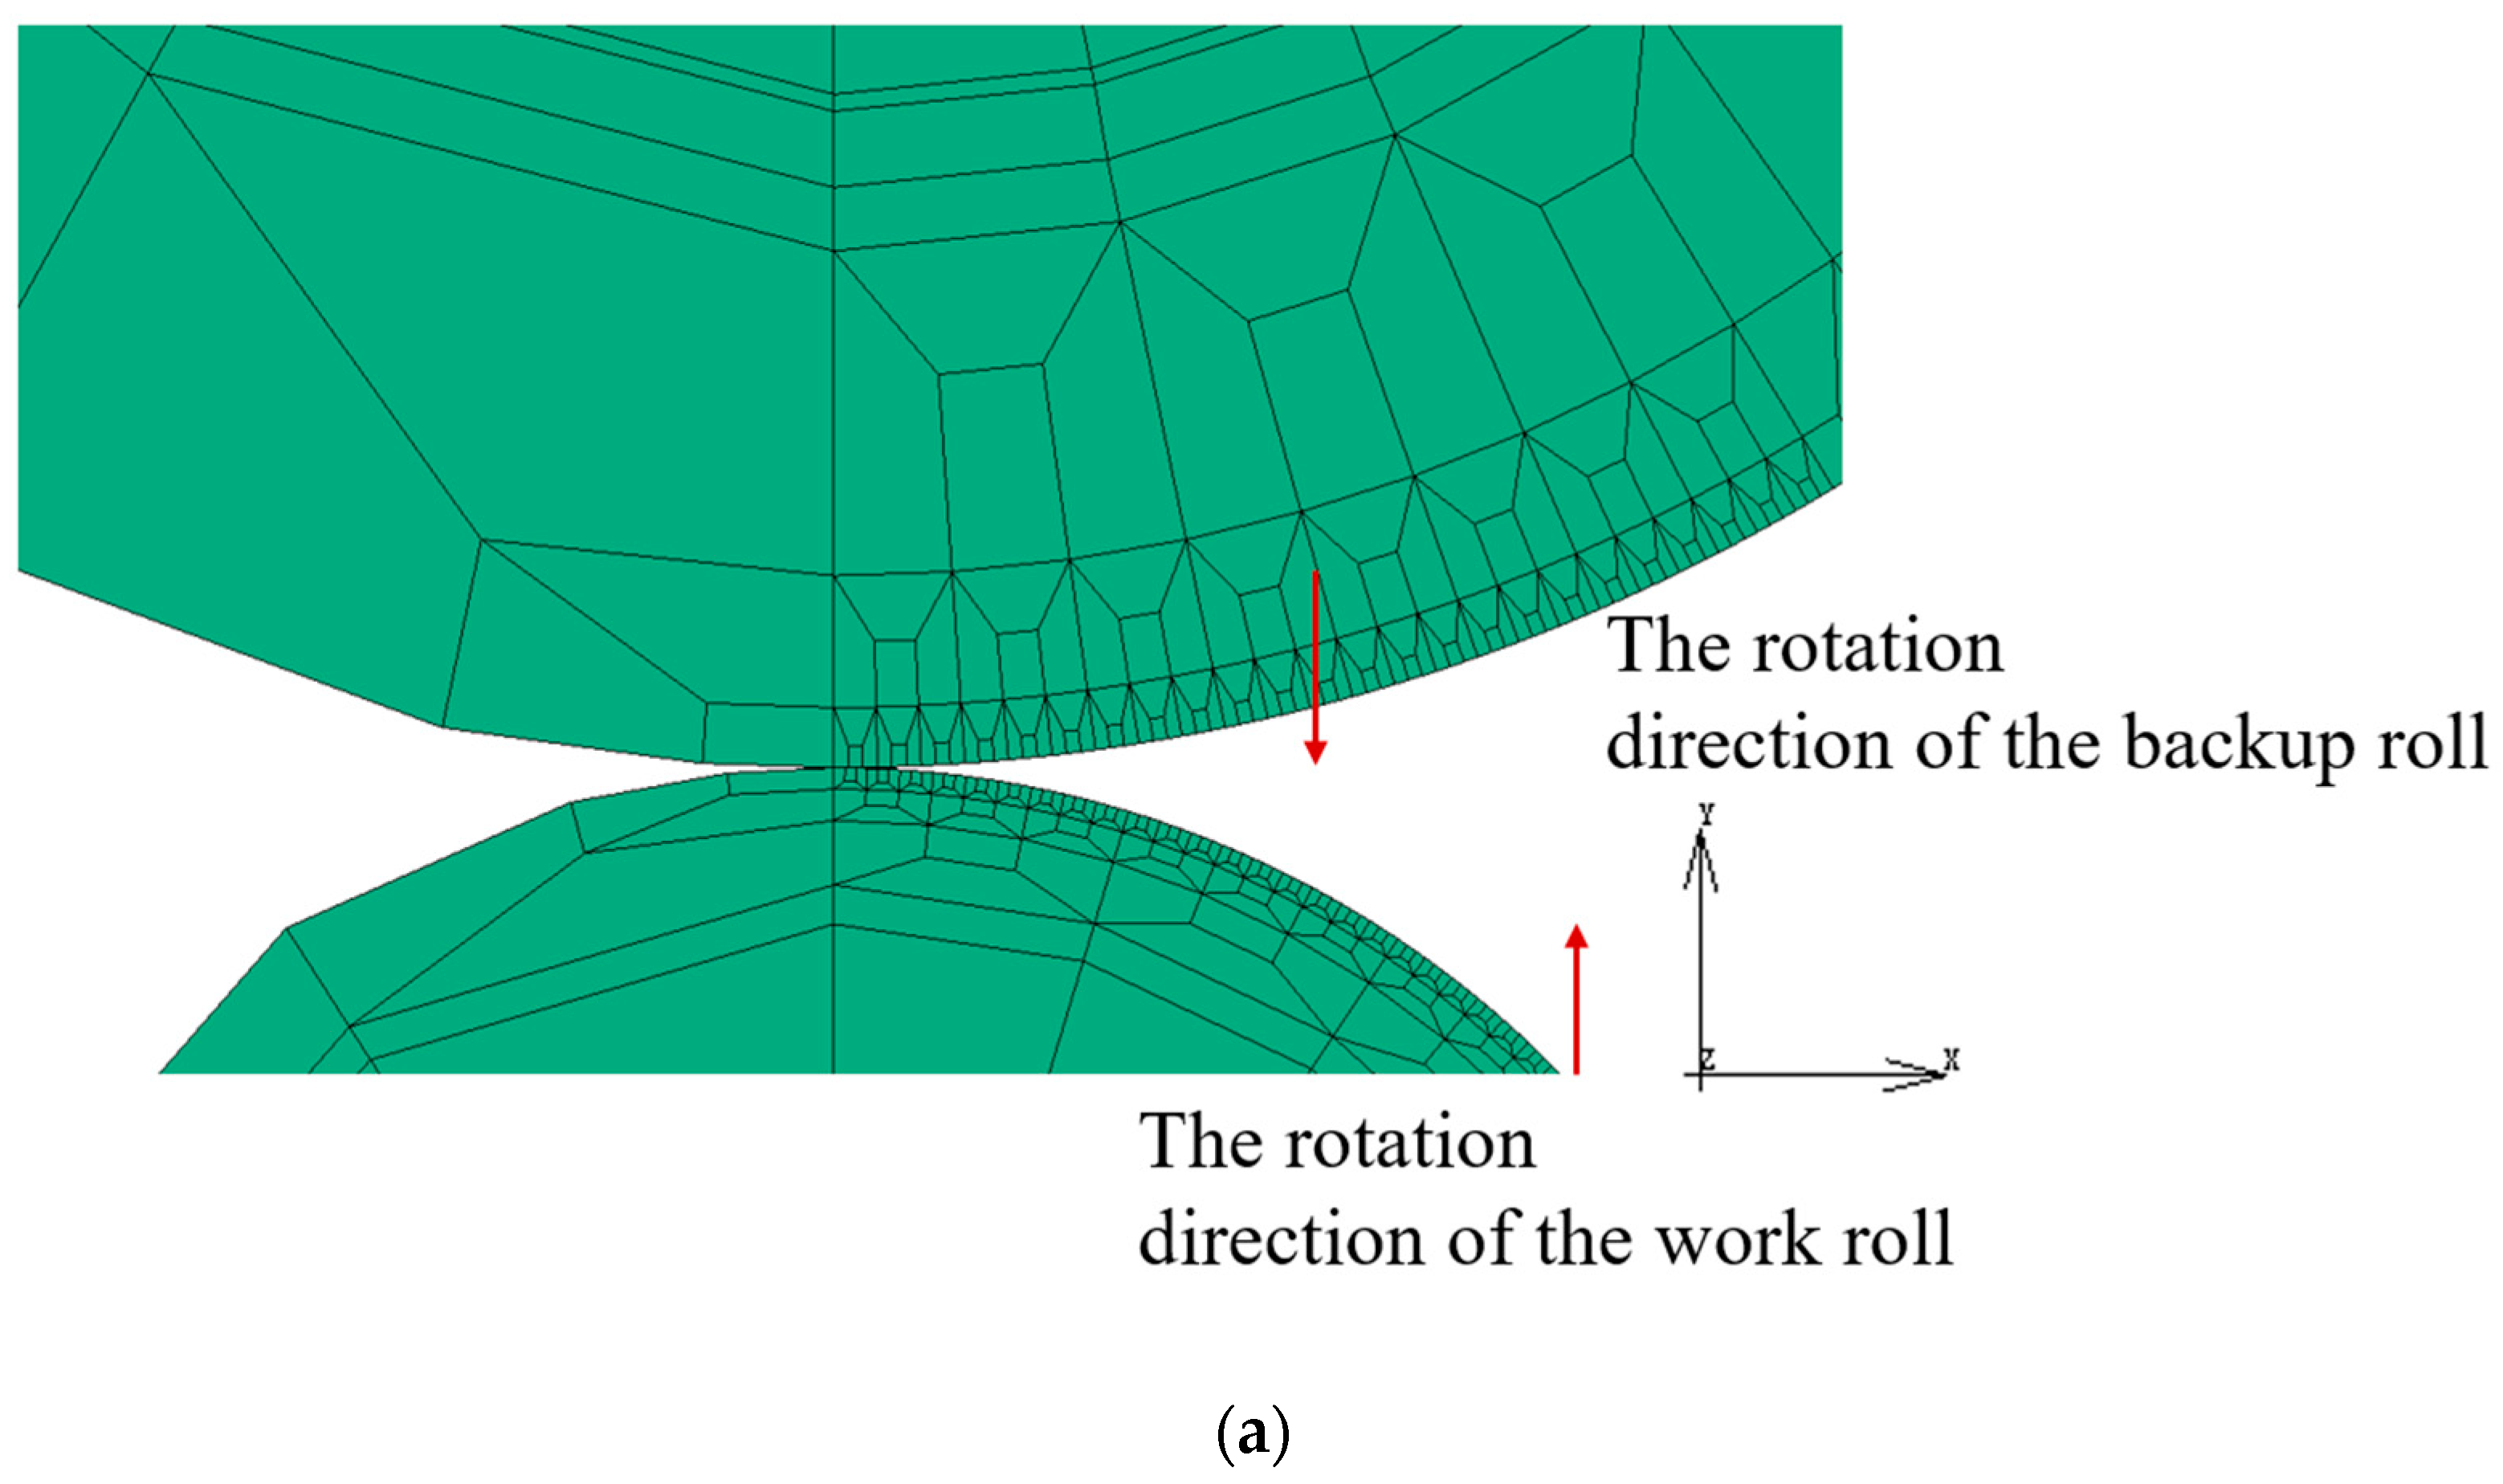
2.2. Definition of Boundary Conditions and Related Parameters

Because the modeling of the finite element model of rolling is simplified according to symmetry, a symmetry plane constraint is established to limit the displacement of the nodes of the finite element model on the symmetry plane.
In the contact setting, the friction coefficients between the rolls and the workpiece, as well as between the rolls themselves, are defined. The friction condition follows a shear friction model based on equivalent stress. The friction coefficient between the rolls and the workpiece is 0.3, and that between the rolls is 0.15. The work rolls drive the backup rolls and the workpiece to move through friction.
Regarding the workpiece, considering that it undergoes significant plastic deformation during the rolling process, we adopt a classic elastoplastic constitutive model, such as the von-Mises yield criterion combined with the isotropic hardening law. For rolls, the linear elastic model is adopted for their constitutive equation because only elastic deformation occurs during rolling.
In the boundary condition setting, a thermo-mechanical coupling model is used for simulation. (The main purpose of the thermal model is to simulate the behavior of the workpiece and the rolls under thermo-mechanical coupling conditions during the hot-rolling process. It is not only used to obtain the accurate temperature of the strip steel to determine the contact stress but also plays an important role in analyzing heat transfer, deformation, and changes in material properties during the rolling process. Through the thermal model, we can more realistically simulate the actual working conditions of hot rolling.) The temperature of the rolls is set at 80 °C, and the temperature of the workpiece is 905 °C. There is a complex heat exchange between the surfaces of the rolls and the workpiece and the contacting fluid environment. Usually, to simplify the model calculation, the overall convection coefficient is commonly used to comprehensively consider the effects of convection and radiation on heat during the rolling process. The convective parameters of the element surfaces are set. The ambient temperature is set at 25 °C, the room temperature convection coefficient is 0.02 kW/(m2·°C), the contact heat-transfer coefficient between the backup rolls and the work rolls is 8 kW/(m2·°C), and the contact heat transfer coefficient between the work rolls and the workpiece is 20 kW/(m2·°C). To simplify the motion of the rolls, a quadrilateral rigid plane is created and bonded to the rolls. The rigid body is associated with a designated node, and the motion of the work rolls is driven by controlling the displacement and rotation of this node. This is a method in Marc software to simplify the motion of large three-dimensional meshes. To enable the backup rolls and work rolls to rotate around their respective axes, the large displacement option is enabled in the analysis settings. The rolls are set as elastic bodies (since only elastic deformation occurs in the rolls during the rolling process, this simplification is made to more accurately simulate the actual rolling process). In this model, the reduction amount is set to −2.94 mm, the reduction ratio is 10.5%, the rolling speed is 1 m/s, the front tension is 20 kg/mm2, the back tension is 18 kg/mm2, and the bending force of the work rolls is 50 tons [24,25]. In the model, two working conditions are set. The first is the roll reduction condition, with 50 steps and a total duration of 1 s (since the results of this condition are not used for final extraction, it has no impact on the results). The second is the roll rotation condition. Considering the large number of grid contacts in this condition, 600 steps are set, and the total duration is 0.25 s.
It is difficult to simulate the conveying and biting process of the strip in the calculation, so the calculation is simplified. The simplified method is to first put the rolled piece into the roll gap, then give the backup roll a pressing displacement, and then drive the work roll to rotate to drive the rolled piece for rolling. The calculation results only analyze the steady-state rolling state.
For the study of wear coefficient, the wear finite element model adopts the Archard wear model. w r = ( K / H ) σ v r e l , where H is hardness; K is the wear coefficient; σ is contact normal stress; and v r e l is relative sliding velocity. At present, the wear coefficient is mostly set according to different materials. The disadvantage of this method is that it cannot accurately set the wear coefficient according to the actual production environment determined on site, so the experimental analysis method was innovatively applied to the finite element model of roll wear [26,27]. In order to obtain the wear coefficient of the roll during stable operation, first assume that the wear coefficient is the simulation value K a in the simulation software and perform N a cycles in the above model to obtain the wear amount M , and combine it with the actual production when the roll reaches the wear amount M The number of cycles required is N s . The actual wear coefficient K s [28] (dimensionless, complies with the Archard wear model) of the roll is obtained as K s = K a × N s N a . After fitting multiple sets of data, the average value of the general guidance K s under this specific production data is 4 × 10⁻⁹. When conducting rolling simulations under other process conditions, it is necessary to recalibrate “ K s ” through the above-mentioned methods. By using the wear in the contact relation option in the finite element software and the wear coefficient, different K s values can be selected at different working conditions at different times according to different types of strips, so as to achieve accurate dynamic wear effects.

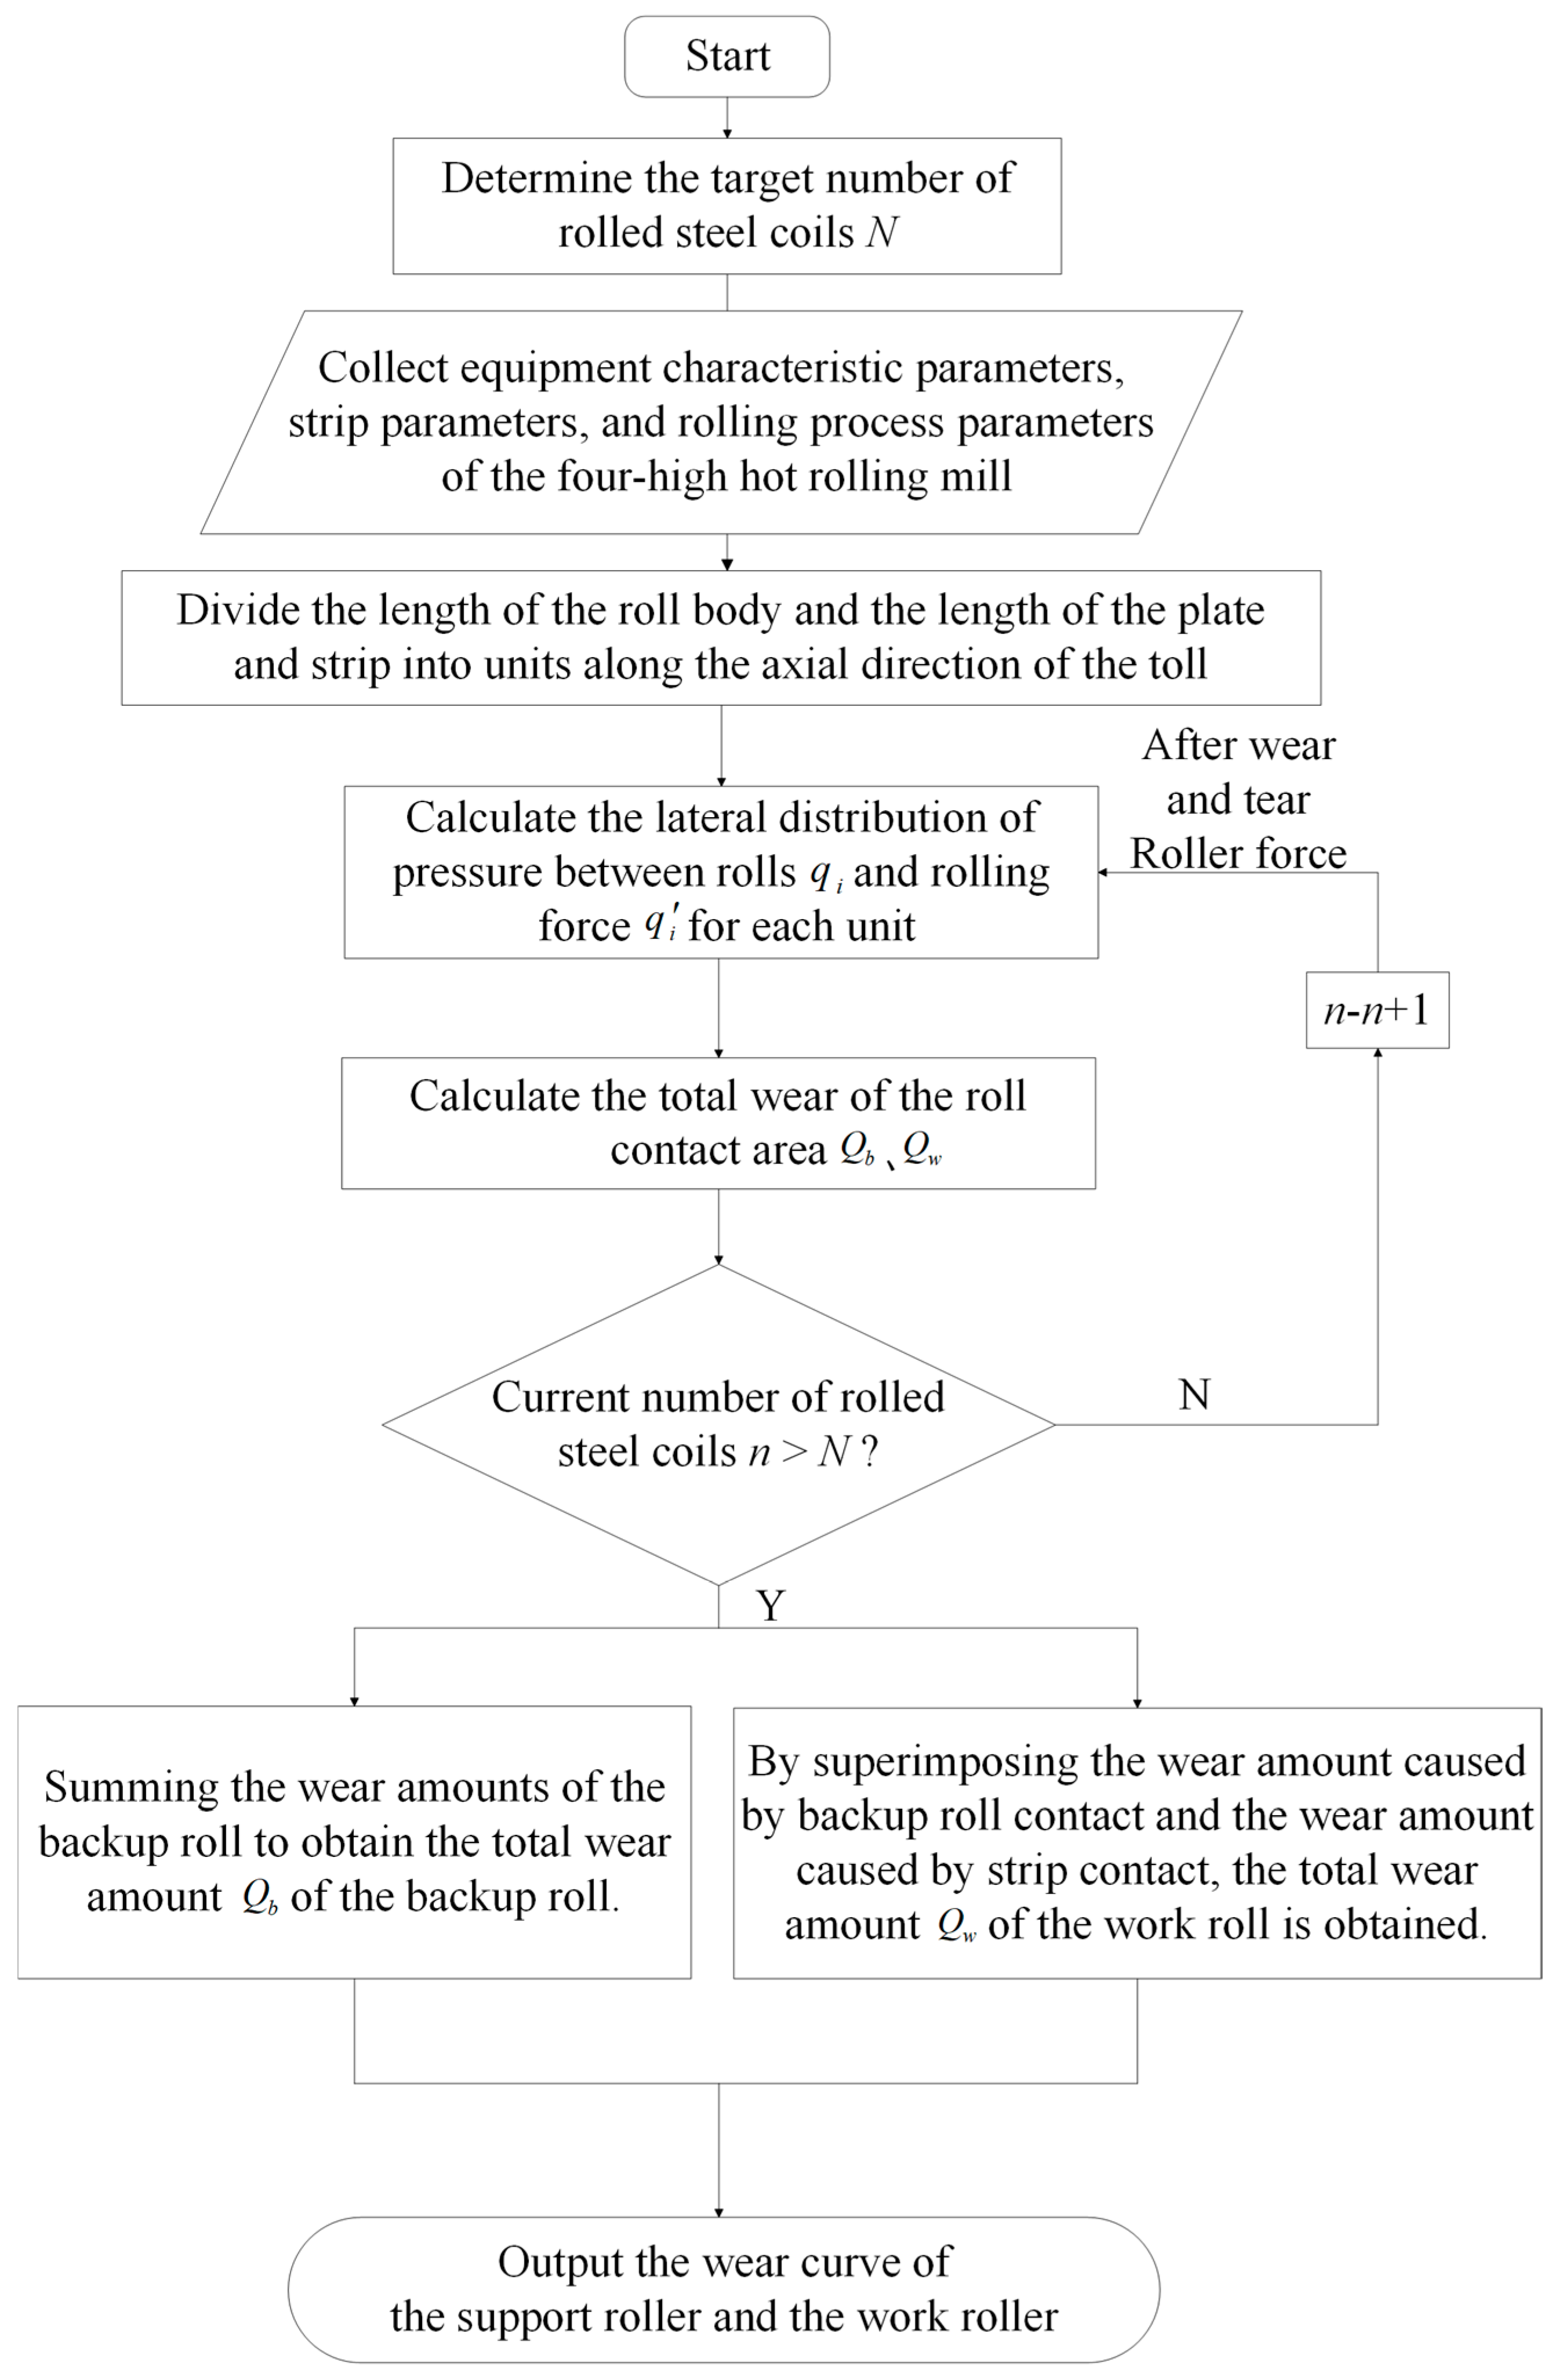
2.3. Dynamic Optimization Method for Roll Wear in Hot Tandem Rolling

The wear of backup rolls is primarily influenced by the distribution of contact pressure between rolls. Therefore, the total wear Q b function of the backup roll caused by sliding and rolling can be expressed by the following formula [29,30]:
Q b z = L b π D b q z g b + k b 1 R w R b ( R b z λ b q ( z ) ) ( R w z λ w q ( z ) )
where Q b is the total wear caused by sliding and rolling of the support roller, mm; L b is rolling mileage of the backup roll change cycle, mm; D b is backup roll diameter, mm; q ( z ) is distribution of contact pressure between rolls, KN/mm; R w and R b are original working radii of work rolls and backup rolls, mm; R w ( z ) and R b ( z ) are the grinding crown distributions of the work roll and backup roll, respectively (i.e., the deviations of the ground surfaces from the nominal radii distributed along the axial direction z), mm; g b and k b characterize the material wear rate under rolling contact conditions and the material wear rate under sliding contact conditions, P a 1 ; and λ w and λ b are compliance coefficients for flattening between work rolls and backup rolls.
As for work roll wear, the part in contact with the strip, that is, the position where the rolling pressure is largest along the direction of the roll body, has the most severe wear. It is mainly caused by the amount of wear of the work roll when rolling high-temperature rolling stock and the contact with the backup roll. The amount of wear can be expressed by the following formula:
Q w z = L w π D w q z g b + k b 1 R w R b ( R b z λ b q ( z ) ) ( R w z λ w q ( z ) ) + q z g w + k w C h h c
where Q w is the total amount of wear generated by the contact between the work roll, support roll, and rolled piece, mm; L w is the rolling mileage of the work roll change cycle, mm; D w is the work roll diameter, mm; q ( z ) is the distribution of rolling pressure, KN/mm; g w and k w characterize the material wear rate under rolling contact conditions and the material wear rate under sliding contact conditions, P a 1 ; C is metal cross flow coefficient; h is the rolling exit thickness, mm; and h c is the rolling average thickness, mm.
The formula analyzed the force on the roll system of a four-roll rolling mill by studying the elastic deformation of the rolls. The roll deflection equation and the roll deformation coordination equation were established, and the distribution of inter-roll pressure q ( z ) and rolling force q ( z ) of the rolls were obtained by solving them simultaneously. This provides a prerequisite for solving the distribution of roll wear along the roll body. It should be noted that the influence of temperature on wear is not reflected in this model because temperature affects the distribution of rolling pressure and inter-roll pressure [5] and is not directly reflected in this article.
Since strip steel of different specifications may be rolled during the work cycle of the roll, the accuracy of applying this wear model is reduced at this time. To enhance the precision of the model, we introduce the comprehensive influence coefficient a x for strip steel. The comprehensive influence coefficient of strip a x is correlated with the characteristics of the strip material, its specifications, and the scheduling of production. In order to further refine the roll wear situation, a quantitative index i of rolled steel coils is introduced. These can replace the rolling mileage with more refined L b i and L w i . i was added and adjusted according to the number and type of rolled strip steel in the actual production process of the factory. Therefore, the modified wear amount of the backup roll and the work roll is as shown in Equations (3) and (4).
Q b z = L b i π D b a x q z g b + k b 1 R w R b ( R b z λ b a x q ( z ) ) ( R w z λ w a x q ( z ) )
Q w = f w D w , R w , R w , R b , R b , q , q , L w i , a x
where L b i and L w i are the rolling mileage of the backup roll and work roll change cycle considering the number of rolled steel coils, mm; a x is comprehensive influence coefficient of strip steel specifications in Equation (4); and a x is the comprehensive influence coefficient, which is defined in accordance with Equation (3) and characterizes the comprehensive influence of different strip specifications and material characteristics on the wear of the working roll. The calculation of “ a x ” is obtained through data regression based on a large amount of actual on-site production data. i = 1 , 2 , 3 x , determined by the actual number of rolled steel coils produced on site.
The models in Equations (3) and (4) cannot effectively capture the cumulative effects of roll wear, specifically the changes in roll profile, redistribution of rolling pressure, and inter-roll pressure distribution caused by roll wear. As rolling continues, the redistribution of rolling pressure and inter-roll pressure due to wear in the previous stage leads to changes in the wear distribution in the new stage. This makes the aforementioned models inadequate for accurately representing the dynamic wear of the rolls. Therefore, to better describe the dynamic accumulation process of roll wear, the model is optimized with a cyclic approach. After each rolling pass, the rolling pressure and inter-roll pressure are recalculated in each cycle, and the rolling pressure and inter-roll pressure from the previous stage are incorporated into the new calculation process to determine the dynamic wear amount for the new stage. Finally, the dynamic wear amounts from all stages are summed to obtain the final wear amount of the roll, thereby improving the computational accuracy of the model. This process is implemented in programming software. The calculation process is illustrated in Figure 3.

3. Results and Discussion

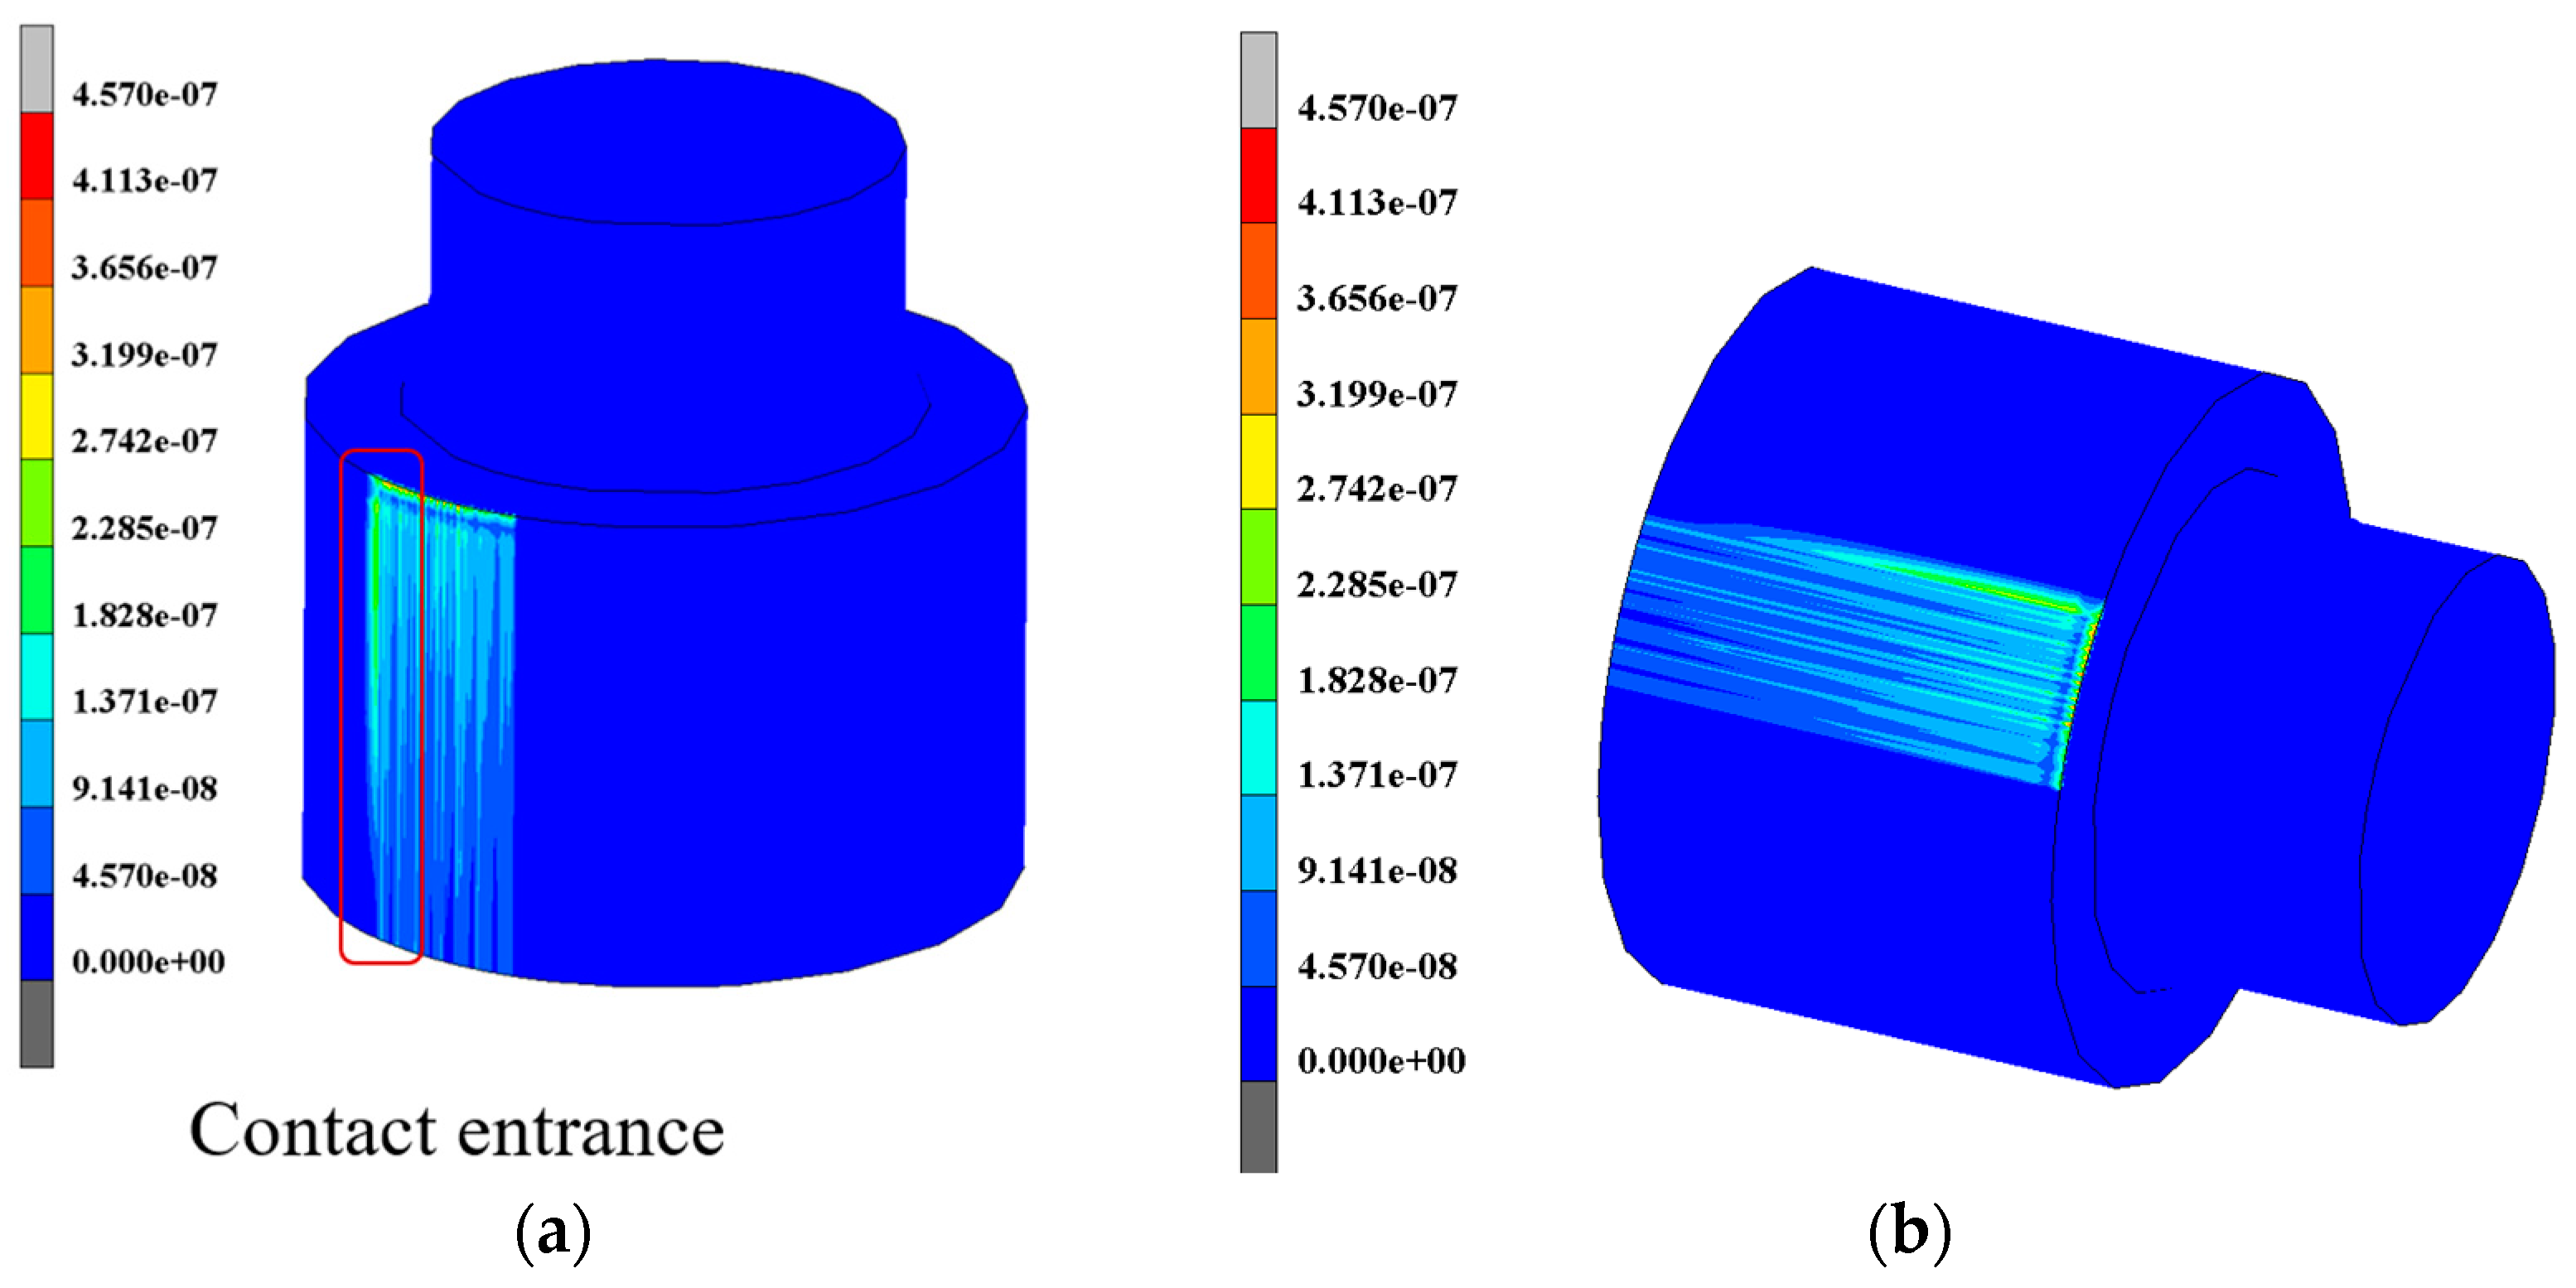
3.1. Finite Element Result Analysis

The simulation results show the wear distribution cloud diagram of the roll in the steady-state area after the deformation of the rolled piece, as shown in Figure 4 and Figure 5. The unit in the figure is mm. We extracted the variation curve of rolling force in finite element software, as shown in Figure 6.
From Figure 4 and Figure 5, it can be seen that when the rolling mill starts working, due to the relatively high contact stress between the rolling mill and the workpiece, the wear between the working mill and the workpiece, as well as between the working mill and the supporting mill, is relatively large. After a certain rolling distance, the rolling enters a steady-state process, and the stress distribution between the rolling mill and the rolled piece is relatively uniform, and the wear amount also tends to be uniform. The wear amount at this time is extracted, and the wear amount is multiplied by the cycle coefficient according to the actual operating cycle of the rolling mill. It can be seen from Figure 6 that the rolling pressure changes with time. The area on the right side of the red line represents the stable rolling stage. In this stage, the rolling pressure tends to be stable. All the data used in this paper are analyzed based on this stage. The wear amount curve is drawn as shown in Figure 7. (It is worth noting that the body length of the backup rolls in this factory is shorter than that of the work rolls. Therefore, in production without roll shifting, the wear of the work rolls usually starts from the contact area with the backup rolls.) Through MARC-FEM simulation, the steady-state wear amount Q f W is extracted and multiplied by the cycle coefficient N c y c l e (i.e., equivalent rolling mileage, unit: km), to obtain the MARC-FEM curve in Figure 7.
The cycle coefficient N c y c l e is defined as the equivalent rolling mileage of the roll within a specific time period, and its calculation formula is as follows (Equation (5)):
N c y c l e = v r o l l i n g t o p e r a t i o n
in which v r o l l i n g is the rolling speed (unit: m/s), and t o p e r a t i o n is the continuous operation time (unit: s).
Figure 7a shows the wear of the work roll, which exhibits a pattern of higher values in the middle and lower values on both sides. The larger values are distributed in the area in contact with the strip steel. Figure 7b shows the wear of the backup roll, presenting a distribution pattern with lower values in the middle and higher values on both sides, and the maximum value is located in the middle of the roll body.

3.2. Field Application of the Model

In the actual production of hot continuous rolling, in order to accurately control the wear situation of the rolls, a four-high rolling mill on a 2050 hot continuous rolling production line in China was taken as the research object. The wear profile of the rolls was predicted and analyzed by combining its equipment parameters and rolling process parameters (the specific parameters are shown in Table 3). This rolling mill is equipped with an advanced automatic control system, which can precisely adjust various rolling parameters, providing a strong guarantee for the stability and accuracy of the experiment.
During the process of predicting the wear profile of the rolls, the finite element model and the software-compiled model were used and applied to the field. Through multiple sets of tests, the actual wear amount of the rolls in a certain period was comprehensively tracked. In the field result measurement link, the detection function of the roll grinder was fully utilized. Before the grinding operation, the roll grinder conducts high-precision scanning detection on the roll surface, covering key information such as the roll profile and radius. By obtaining the roll radius data in the length direction of the roll body through the roll grinder equipment, the wear amount of the roll was accurately calculated by subtracting the post-rolling roll radius from the pre-rolling roll radius.
In addition, during the experiment, the running time of the reel was carefully recorded. The equivalent processing length of the material was obtained by multiplying the rolling speed by the running time. In this experiment, the rolling speed was set at 6 m/s, and the rolls ran continuously for 5 h. After conversion, the equivalent processing length was 108,000 m. These accurate data provided key evidence for evaluating the wear of the rolls and greatly guaranteed the reliability of the experimental results.
In order to more intuitively and deeply demonstrate the accuracy of the model, a set of comparative data was specifically selected for presentation, as shown in Figure 8. Through the analysis of this set of data, the close relationship between the model prediction results and the actual measurement data can be clearly seen, further verifying the reliability and effectiveness of the model in predicting the wear profile of the rolls.
In Figure 8, MARC-FEM refers to the finite element simulation values, Dynamic Model indicates the prediction values of the dynamic optimization model, Field Data stands for the field measured values, and Static Model represents the static model without considering cumulative wear and steel grade changes.
The software values before optimization in the figure refer to the “static model”. This model does not take into account the influence of factors that change overtime during the rolling process, such as the alternate rolling of strips with different specifications and the cumulative effect of roll wear, on the wear of the rolls.
The software values after optimization refer to the “dynamic wear model”. Based on the optimized model, this model further incorporates the changes in the rolling pressure and the inter-roll pressure caused by the roll wear in the previous stage into the new calculation process through a cyclic iterative method, so as to more accurately describe the dynamic cumulative process of roll wear.
It can be seen from the comparison of four sets of data in Figure 8a that when the rolling process parameters are basically the same, for work roll wear, the optimized model is significantly more accurate than the unoptimized data. The finite element model also has a high degree of fit with the actual data. According to Figure 8b, it can be found that the optimized model is more realistic in the data throughout the area, has a higher approximation to the unoptimized model in the middle, and has a higher overall accuracy. During the rolling process, the work roll is in direct contact with the strip, and the strip’s specification parameters have a higher overall impact on the work roll. Therefore, comparing the optimization of the work roll and the backup roll, the accuracy of the work roll is improved. In order to better illustrate the numerical accuracy of the model, the point distance criterion is adopted, that is, to quantitatively measure the degree of approximation between the wear values obtained by different methods and the actual on-site values. The deviation values of unoptimized values, finite element simulation values, and dynamic simulation software values are shown in Table 4. It can be clearly seen that the deviation value of the wear amount obtained by the dynamic simulation software using the optimized roll wear model is lower.
By statistically analyzing different on-site working conditions, it is found that under the typical production conditions of the factory, the roll wear amount predicted by the dynamic wear model is in line with the actual situation, with the average deviation controlled within 0.01 mm. Some experimental results are shown in Table 5. This further demonstrates the effectiveness of the model in predicting the roll wear profile under different rolled materials and process parameters. The test results fully verify the reliability of the model under various working conditions, providing strong support for the accurate prediction and control of roll wear in hot continuous rolling production.
After applying the model to a 2050 hot-rolling production line in a domestic factory, on-site production was tracked. When the wear amounts of ten work rolls and ten backup rolls for rolling the same specification of strip steel were counted, the prediction accuracy increased by 5.3%. When the wear amounts of ten work rolls and ten backup rolls for rolling different specifications of strip steel were counted, the prediction accuracy increased by 3.25%, verifying the accuracy of this optimized model. In addition, when rolling strip steel of the same specification, the prediction accuracy of the model is improved by 5.24%, and when rolling strip steel of mixed specifications, the accuracy is improved by 2.1%. The above-mentioned data indicate that the model has been verified under typical working conditions and has the adaptability to the dynamic changes in multiple steel grades, multiple stands, and process parameters.

4. Conclusions

(1)
The roll wear mechanism was analyzed, and a higher-precision roll wear optimization model was obtained by introducing the comprehensive influence coefficient of the steel type and the cyclic superposition processing of the pressure between the rolls, and a set of dynamic simulation software for the roll wear profile was developed to predict the wear amount.
(2)
Using the nonlinear finite element software MARC, a three-dimensional elastic-plastic thermosolid coupling finite element simulation model of the rolling process of the hot rolling four-high rolling mill was established on the basis of ensuring the accuracy of the model. An experimental analysis method was used to obtain the wear coefficient under a specific production environment. By setting the rolling process parameters for numerical simulation, the simulated distribution curve of roll wear was obtained.
(3)
By comparing the actual measured values of roll wear with simulated values, optimized values, and non-optimized values, it is proven that in the optimized wear model and the finite element wear model, the prediction accuracy of the work roll and backup roll wear is improved to a certain extent. After optimization, the dynamic simulation software indicates that the deviation value of the work roll wear amount is 0.012, and the deviation value of the backup roll is 0.004, both lower than the numerical deviation value of the wear before optimization and the numerical deviation value of the finite element simulation.

5. Discussion and Prospect

(1)
Adhesive wear and corrosive wear are important factors contributing to roll wear, but they account for a relatively low proportion under the working conditions of this study. Future research will focus on expanding the model to incorporate these mechanisms.
(2)
In order to explore and quantify the influence mechanisms of these key factors on roll wear more clearly, the model was appropriately simplified in this article by weakening the temperature factor. This approach helped us to focus on solving the main problems in the initial stage of the research, avoiding the interference of too many complex factors and making the model construction and optimization process clearer and more controllable. Subsequently, we will incorporate the impact of temperature on roll wear into the mathematical model to further improve the accuracy of the model.
(3)
From the above verification data, it can be found that the prediction accuracy of the model is improved more significantly when rolling strip steel of the same specification than when rolling strip steel of mixed specifications. Future research will further expand the verification under extreme working conditions (such as ultra-high-strength steel and ultra-thin strip steel) to improve the universality of the model.
(4)
Future research will focus on the dynamic calibration method of K s for multiple steel grades and wide temperature ranges (such as functional modeling based on material hardness and friction coefficient) to further enhance the universality of the model, thereby enabling the real-time correction of K s .

Author Contributions

Methodology, X.Z., B.Z., J.W. and Z.B.; Software, X.Z. and Z.L.; Validation, X.Z., B.Z. and S.A.E.; Formal analysis, X.Z. and Z.B.; Investigation, Z.L., B.Z., J.W. and S.A.E.; Resources, B.Z.; Data curation, X.Z., Z.L., J.W. and S.A.E.; Writing—original draft, X.Z.; Writing—review & editing, J.W. and Z.B.; Visualization, Z.L.; Supervision, Z.B.; Project administration, S.A.E. All authors have read and agreed to the published version of the manuscript.

Funding

This research was supported by the Hebei Natural Science Foundation (E2024203125), Science Research Project of Hebei Education Department (CXY2023012), S&T Program of Hebei (23280101Z), and S&T Program of Hebei (22281001Z).

Data Availability Statement

The original contributions presented in this study are included in the article. Further inquiries can be directed to the corresponding author.

Conflicts of Interest

The author declares no conflict of interest.

References

  1. Liu, H.Q.; Yang, Q.; Wang, X.C.; Wang, L.S. Wear contour prediction model and application of the work roll in hot wide strip mill. Steel Roll. 2018, 35, 45–49. [Google Scholar]
  2. Ding, J.G.; Li, J.; Zhang, K.; Sun, J. Investigation on contact pressure of backup roll with parabolic chamfer curve and intelligent modeling of plate crown in plate rolling process. Int. J. Adv. Manuf. Technol. 2023, 127, 5633–5650. [Google Scholar] [CrossRef]
  3. Du, F.S.; Zhang, S.B.; Haung, H.G.; Wang, G.G.; Ren, X.Y. Finite element study of the rigidity characteristics of a six-high mill. J. Plast. Eng. 2010, 17, 148. [Google Scholar]
  4. Chen, B.G.; Chen, X.L.; Tieu, A.K. Prediction of work roll thermal deformarion with finite element method on hot strip mill. Iron Steel 1991, 8, 40–44. [Google Scholar]
  5. Sun, R.S.; Cui, X.Y.; Li, X.T.; Bai, X.S.; Wang, N.; Bai, Z.H. Finite element simulation of crushed wave defects during cold continuous rolling. J. Plast. Eng. 2023, 30, 58. [Google Scholar]
  6. Sonboli, A.; Serajzadeh, S. A model for evaluating thermal mechanical stresses within work-rolls in hot-strip rolling. J. Eng. Math. 2012, 72, 73–85. [Google Scholar] [CrossRef]
  7. Wang, J.; Cao, Y.; Hao, Z.Y.; Huang, Z.Y. Finite element analysis on tehperature field of work roll in hot rolling strip mill. Hot Work. Technol. 2013, 42, 102–104. [Google Scholar]
  8. Li, J.H.; Lian, J.C.; Yue, X.L. Prediction Model of Temperature Field and Crown of Work Roll for Hot Strip Mill. J. Iron Steel Res. 2003, 6, 25–28. [Google Scholar]
  9. Sun, Y.K. Model and Control of Hot Strip Rolling; Metallurgical Industry Press: Beijing, China, 2007; pp. 56–106. [Google Scholar]
  10. John, S.; Sikdar, S.; Mukhopadhyay, A.; Pandit, A. Roll wear prediction model for finishing stands of hot strip mill. Ironmak. Steelmak. 2006, 33, 169–175. [Google Scholar] [CrossRef]
  11. Wang, X.D.; Yang, Q.; He, A.R.; Wang, R.Z. Comprehensive contour prediction model of work roll used in online strip shape control model during hot rolling. Ironmak. Steelmak. 2023, 34, 303–311. [Google Scholar] [CrossRef]
  12. Zeng, S.W.; Li, J.G. Practical analysis of convexity control of hot rolled plate. Steel Roll. 2011, 28, 8–11. [Google Scholar]
  13. Liu, J.Y. Roll wear in rolling process and its effect on product properties. J. Metall. Mater. 2024, 44, 121–123. [Google Scholar]
  14. Zhang, C.L.; Wang, Q.N.; Zhu, H.M.; Wang, F.Q. Optimization of wear prediction model for 1580mm hot rolling mill rolls. Steel Roll. 2016, 33, 27–30. [Google Scholar]
  15. Wu, H.M.; Wu, B.S.; Zhao, L.X.; Liu, Z.M.; Wang, L.L.; Hao, W.; Pang, Z.F. Mathematical modeling of roll wear in strip mills. J. Steel Roll. 2010, 27, 13–17. [Google Scholar]
  16. Li, L.X.; Huang, Y.G.; Zhang, K.; Lv, X.Y.; Li, B.; Wu, X.D. Morphological image characteristics and fractals during roll wear. J. Iron Steel 2015, 50, 95–100. [Google Scholar]
  17. Zhang, Q.D.; Zhang, B.Y.; Li, R.; Ma, L. Research progress on the theory and technology of microscopic surface quality control of steel plates. J. Mech. Eng. 2016, 52, 32–45. [Google Scholar] [CrossRef]
  18. Liu, X.Q.; Lu, C.; Sun, T.L.; Chen, X.T. Analysis of the Evolution Law of Friction Block Wear Behavior of Train Brake Pads under Multiple Braking Conditions. J. Tribol. 2025, 1–20. [Google Scholar]
  19. Peng, W.; Sun, J.N.; Li, X.D.; Gong, D.Y.; Sun, Y.Z.; Sun, J.; Zhang, D.H. Wear prediction of work rolls in hot strip rolling process. J. Plast. Eng. 2023, 30, 214–225. [Google Scholar]
  20. Song, G.Y.; Yang, Q.; Wang, X.C.; Zhang, X.B.; Wang, F.M.; Wang, Q.N. Wear pattern of work rolls in hot strip mill leveler. J. Steel 2017, 52, 54–59. [Google Scholar]
  21. Pesin, A.; Pustovoytov, D.; Shveyova, T.; Sverdlik, M. Finite Element Modeling of Roll Wear during Cold Asymmetric Sheet Rolling of Aluminum Alloy 5083. J. MATEC Web Conf. 2015, 26, 01010. [Google Scholar] [CrossRef]
  22. Liu, G.F.; Cui, X.Y.; Li, Z.Z.; Wang, J.H.; Zhang, X.D.; Bai, Z.H. Shape change simulation analysis of wheel steel in a four-high hot rolling mill. Int. J. Simul. Model. 2022, 21, 603–614. [Google Scholar] [CrossRef]
  23. Li, L.J.; Xie, H.B.; Liu, T.W.; Huo, M.S.; Li, X.S.; Liu, X.; Wang, E.R.; Li, J.X.; Liu, H.Q.; Sun, L.; et al. Numerical analysis of the strip crown inheritance in tandem cold rolling by a novel 3D multi-stand FE model. Int. J. Adv. Manuf. Technol. 2022, 120, 3683–3704. [Google Scholar] [CrossRef]
  24. Cui, X.Y.; Li, Z.Z.; Yin, B.L.; Wang, W.Q.; Liu, Y.X.; Bai, Z.H. Modelling analysis of coupling deformation between strip steel and roller system. Int. J. Simul. Model. 2023, 22, 267–278. [Google Scholar] [CrossRef]
  25. Li, L.J.; Xie, H.B.; Zhang, T.; Huo, M.S.; Pan, D.; Wu, H.; Chen, F.H.; Liu, T.W.; Li, X.S.; Liu, X.; et al. Understanding the regulation ability of roll bending on strip shape in a CVC-6 tandem cold mill using a 3D multiple stand FE model. J. Manuf. Process. 2023, 101, 1013–1031. [Google Scholar] [CrossRef]
  26. Wang, D.G.; Zhang, J. Prediction of Fretting Fatigue Crack Propagation Life of Steel Wire Considering Fretting Wear. Tribology 2021, 41, 710–722. [Google Scholar]
  27. Wu, W.C.; Liu, S.H.; Chen, T. Research on the Friction and Wear Law of Continuous Pipe and Casing. J. Plast. Eng. 2024, 31, 240–249. [Google Scholar]
  28. Hu, Z. Study on Assessment of Fretting Damage and Fatigue Life of Mine Hoisting Wire Rope. Ph.D. Thesis, China University of Mining and Technology, Xuzhou, China, 2024. [Google Scholar]
  29. Chen, L.S.; Zhu, H.Y.; Ren, J. Hot Rolled Sheet Production Technology; Metallurgical Industry Press: Beijing, China, 2006; pp. 30–100. [Google Scholar]
  30. Lou, L. Research on the Thermal Crown and Wear for Work Roll of Medium and Heavy Plate Mill. Master’s Thesis, Yanshan University, Qinhuangdao, China, 2013. [Google Scholar]
Figure 1. Quarter finite element model of four-high rolling mill. (a) Front view; (b) isometric view.
Metals 15 00456 g001
Figure 2. Rolls and strip mesh. (a) Mesh of contact area between rolls; (b) mesh division of strip contact area.
Metals 15 00456 g002aMetals 15 00456 g002b
Figure 3. Roll wear calculation flow chart.
Metals 15 00456 g003
Figure 4. Backup roll wear cloud chart during steady rolling state. (a) Front view; (b) isometric view.
Metals 15 00456 g004
Figure 5. Work roll wear cloud chart during steady rolling state. (a) Front view; (b) isometric view.
Metals 15 00456 g005
Figure 6. Rolling force versus time curve.
Metals 15 00456 g006
Figure 7. Roll wear simulation values. (a) Work roll wear simulation values; (b) backup roll wear simulation values.
Metals 15 00456 g007
Figure 8. Roll wear profile comparison. (a) Comparison of work roll wear simulation data and actual data; (b) comparison of backup roll wear simulation values and actual data.
Metals 15 00456 g008
Table 1. Geometric parameters.
Parameter NameValueParameter NameValue
Backup roll diameter/mmØ1520Backup roll length/mm2050
Work roll diameter/mmØ800Work roll length/mm2350
Strip entrance thickness/mm28Strip entrance width/mm1556
Table 2. Material parameters.
TypeMaterialYoung Modulus PaPoisson RatioYield Strength MPa
RollElastic2.06 × 10110.3-
ProductsElastoplastic2.10 × 10110.3189.6
Table 3. Rolling process related parameters.
Strip Entrance Thickness/mmStrip Entrance Width/mmStrip Temperature/°CRoll Bending Force/tFront Tension/kg/mm2Rear Tension/kg/mm2
281556905502018
Table 4. Wear amount comparison.
Wear Amount Value GroupValue Before OptimizationFinite Element Simulation Numerical ValuesDynamic Simulation Software Values
Deviation (Work roll)0.0650.0190.012
Deviation (Backup roll)0.0050.0070.004
Table 5. Experimental data under different steel grades, stands, and process parameters.
Steel GradeStandStrip Entrance Thickness/mmStrip Entrance Width/mmStrip Temperature/°CRoll Bending Force/tFront Tension/kg/mm2Rear Tension/kg/mm2Average Deviation/mm
Test1Beam Steel 510L310.71127697806.157.430.008
Test2Beam Steel 700L411.551533982800000.0094
Test3Wheel Steel 255PL518.1615558935005.086.120.0064
Test4Wheel Steel 380CL610.316128806506.16.990.0077
Test5Wheel Steel 380CL130.221615980800/4.830.0051
Test6Wheel Steel 380CL221.8416149598004.834.910.0062
Test7Wheel Steel 255PL228.0115569175004.804.850.0071
Test8Wheel Steel 255PL322.1315559055004.854.910.0025
Test9Beam Steel 700L63.901272923650000.0038
Test10Beam Steel 510L64.18127291209.2310.690.0067
Disclaimer/Publisher’s Note: The statements, opinions and data contained in all publications are solely those of the individual author(s) and contributor(s) and not of MDPI and/or the editor(s). MDPI and/or the editor(s) disclaim responsibility for any injury to people or property resulting from any ideas, methods, instructions or products referred to in the content.

