Article

Effect of Phase Structure on the Properties of Additively Manufactured NiTi Alloy Based on Molecular Dynamics Simulation

1
State Key Laboratory of Advanced Processing and Recycling of Non-Ferrous Metal, Lanzhou University of Technology, Lanzhou 730050, China
2
Materials Science and Engineering College, Lanzhou University of Technology, Lanzhou 730050, China
*
Author to whom correspondence should be addressed.
Metals 2025, 15(4), 411; https://doi.org/10.3390/met15040411
Submission received: 10 March 2025 / Revised: 28 March 2025 / Accepted: 4 April 2025 / Published: 5 April 2025
(This article belongs to the Special Issue Thermodynamics and Kinetics Analysis of Metallic Material)

Abstract

NiTi alloy has been widely used due to its excellent shape memory effect, superelasticity, and high damping performance. These excellent properties are mainly derived from its unique phase structure. In order to further explore the effect of different phase ratios on the performance of NiTi alloy, this study successfully prepared NiTi alloys with different atomic ratios by controlling the wire feeding speed to control the atomic ratio in the alloy. The results of TEM showed that the alloy with a lower Ni atomic ratio is enriched with Ti element, while the alloy with a higher Ni atomic ratio has a coexistence of NiTi phase and NiTi2 phase. At the same time, the compression performance showed that the increase in Ni atomic ratio can improve the compression performance of the alloy. In addition, by constructing a molecular dynamics model of NiTi alloys with different phase ratios, the unloading recovery behavior and phase transformation characteristics of the alloy under external force were analyzed. The results showed that with the increase of the NiTi2 phase ratio in the alloy, the irrecoverable strain also increases, exceeding the elastic strain limit of the NiTi2 phase, resulting in the generation of disordered structure and plastic deformation in the late deformation stage. In addition, with the increase of the NiTi2 phase ratio, the energy dissipation area of the hysteresis curve increases, reflecting a greater energy loss.

1. Introduction

NiTi alloy has attracted much attention due to its unique superelasticity and shape memory effect. These properties are derived from the reversible phase transformation mechanism between austenite and martensite, which makes it have important application potential in the fields of biomedicine [1,2,3], aerospace [4,5], and automotive industry [6,7,8]. Studies have shown that the relative proportion of TiNi phase and Ti2Ni phase can be effectively adjusted by precisely controlling the Ni/Ti atomic ratio, thereby achieving customized design of the phase transformation temperature and mechanical properties of the material [7,8].
Additive manufacturing technology provides a new way to form complex structures of NiTi alloys. Its layer-by-layer deposition characteristics can not only achieve precise control of the microstructure but also improve manufacturing efficiency through composition gradient design [9,10,11]. Current research mainly focuses on two types of high-energy beam processes: powder bed fusion (PBF) [12,13] and directed energy deposition (DED) [14,15]. However, their high manufacturing costs and low material utilization seriously restrict engineering applications [16,17]. In contrast, wire arc additive manufacturing (WAAM) has shown significant advantages due to its simplicity of equipment, high deposition rate (5–10 kg/h), and large-scale component manufacturing capabilities. Wang et al. [18] successfully prepared NiTi alloy with a Ni content of 53.5 at% through a double-wire in situ synthesis strategy, verifying the feasibility of the WAAM process; Zeng et al. [19] further used GTAW-WAAM technology to achieve stable forming of the wall structure of Ni50.5Ti49.5 alloy. Resnina et al. [20] used GMAW to prepare a 5-layer Ni50.9Ti49.1 alloy thin-walled structure with a tensile strength of 550 MPa and an elongation of 6.2%. However, existing research mainly focuses on macroscopic forming quality and microstructural regulation, and lacks in-depth discussion on the mechanical behavior and evolution mechanism of NiTi alloy. Especially in the additive manufacturing process, NiTi alloy undergoes a complex rapid heating and cooling process, and microscopic mechanisms such as martensitic deformation rearrangement and interface evolution directly dominate the mechanical response of the material [21,22]. Traditional experimental methods are difficult to analyze the dynamic phase transformation process at the atomic scale.
In recent years, molecular dynamics (MD) simulation has provided a breakthrough research method by tracking atomic trajectories and energy evolution. Among them, MD research on NiTi alloys mainly focuses on superelasticity, phase transformation dynamics, and the influence of precipitation on material properties. Wang et al. [23] used molecular dynamics to simulate the superelastic behavior of NiTi SMA with an amorphous surface and found that the reduction of grain size led to the simultaneous increase of phase transformation stress and tensile stress, and the amorphous phase caused superelastic degradation through plastic deformation; Li et al. [24] used molecular dynamics (MD) to study the thermodynamic behavior of NiTi SMAs with different Ni contents and found that the type of martensitic variants was significantly affected by lattice constraints; Ataollahi et al. [25] confirmed that Ni4Ti3 precipitates reduced the superelastic recovery rate by changing the local stress field distribution. These studies have successfully established a correlation model between atomic-scale behavior and macroscopic properties, providing a theoretical basis for revealing the “structure–performance” relationship of NiTi alloys [26,27,28,29,30]. However, in the WAAM process, complex thermal cycling effects may cause composition segregation and changes in phase stability. The mechanism of the influence of the TiNi/Ti2Ni phase ratio on the mechanical properties after deposition with different Ni/Ti ratios remains unclear.
In this study, a twin-wire arc additive manufacturing process was employed to fabricate NiTi alloy by feeding separate Ti and Ni wires. During the experiment, it was observed that both NiTi and NiTi2 phases coexisted in the fabricated alloy. To investigate the effect of phase ratio on the alloy’s performance, a molecular dynamics simulation approach was used to establish models with varying phase ratios. The study analyzed the unloading recovery ability, phase structure transformation, and stress changes during stretching, with the aim of understanding the impact of phase structure on alloy performance and providing guidance for the twin-wire additive manufacturing of NiTi alloys.

2. Experimental Materials and Methods
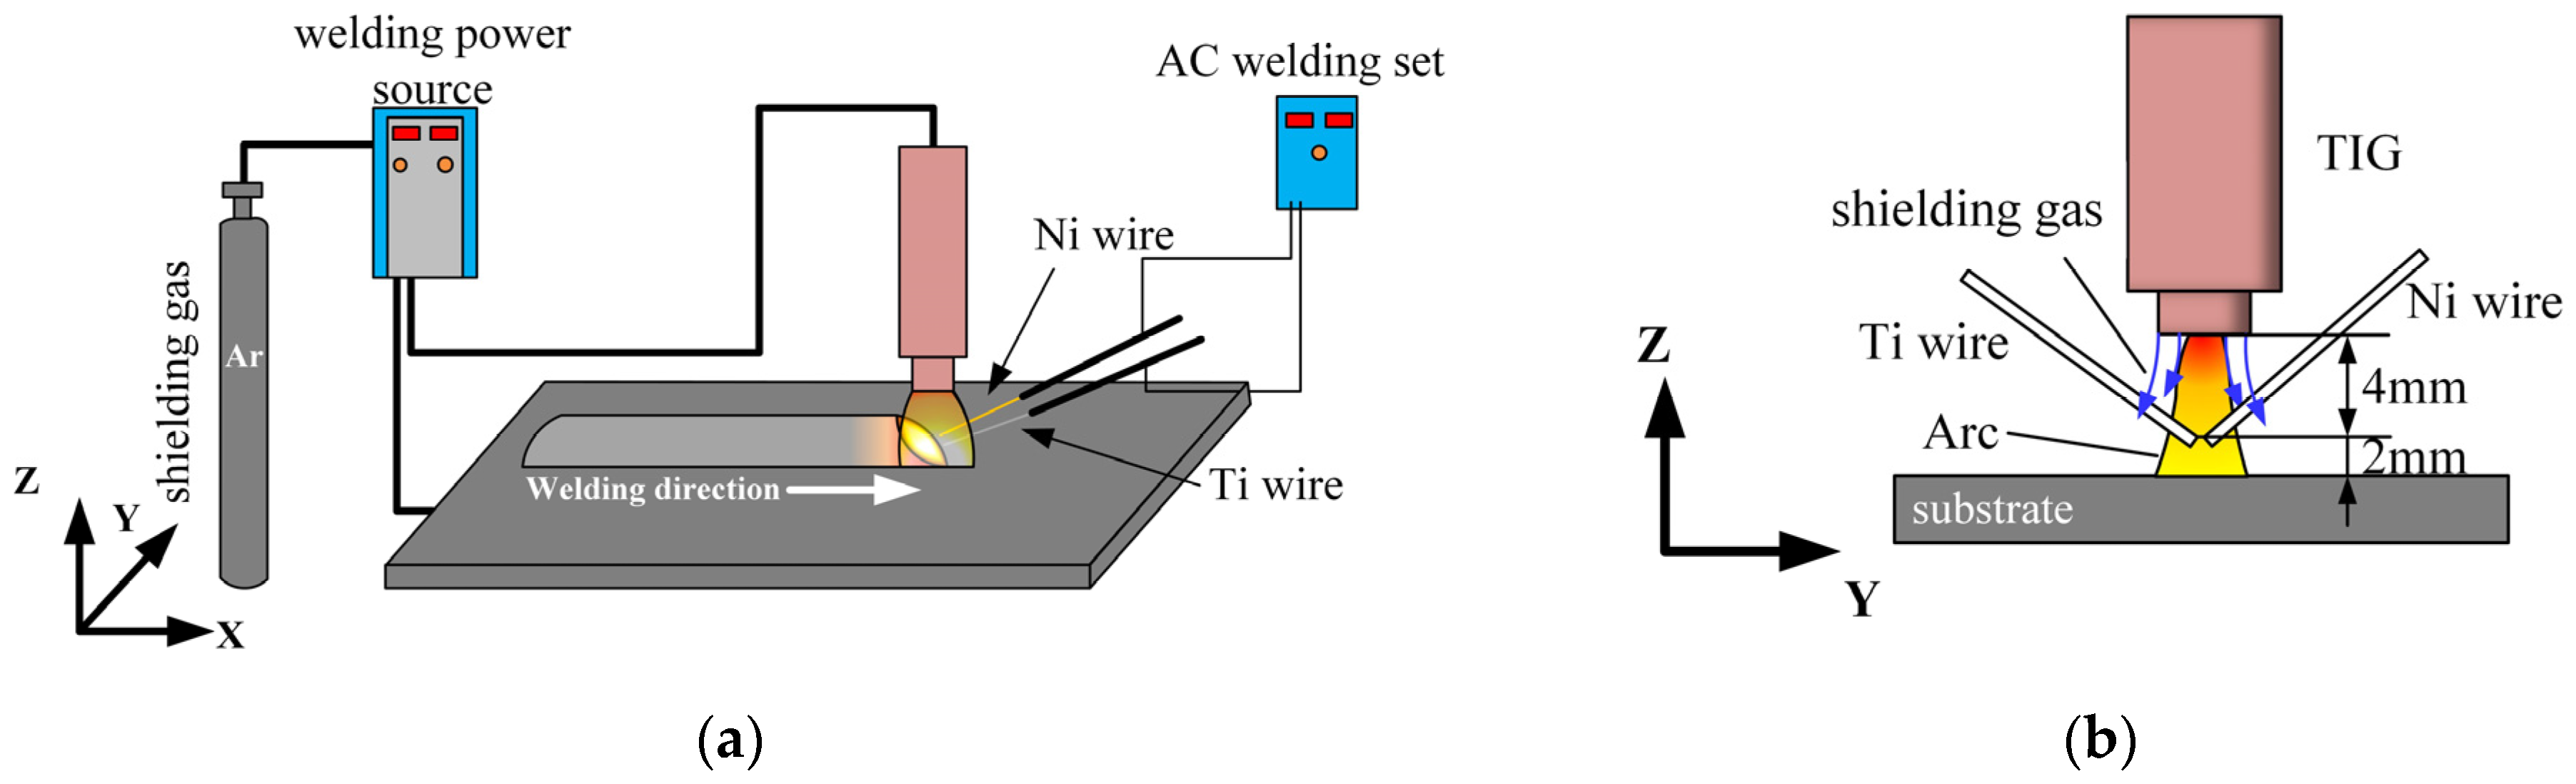
2.1. Test Equipment

The experiment utilizes a double-wire arc additive manufacturing method to melt two different filler wires—nickel wire and titanium wire—through an arc, depositing them onto a substrate to achieve the additive manufacturing of NiTi alloy. The experimental setup is shown in Figure 1. The base material used in the experiment is a titanium plate with dimensions of 100 mm × 50 mm × 5 mm. The filler wires are nickel wire and titanium wire, both with a diameter of 1.2 mm. The positional relationship between the filler wire and the arc is shown in Figure 1b. The connection point of the filler wire is located directly below the tungsten electrode, 4 mm from the tip of the tungsten electrode, and 2 mm from the substrate. During the experiment, the atomic ratio in the sample is controlled by controlling the wire feeding speed of different filler wires. The filler wires and base materials are purchased from material manufacturers, and the chemical composition is provided. The specific composition is shown in Table 1. The purity of the argon gas used in the experiment is 99.99%.
To ensure the stability and quality of the deposition process, the welding gun is fixed on the workbench, while the workpiece moves along a predefined path at a constant speed to achieve layer-by-layer material deposition. This approach results in a uniform and dense NiTi alloy deposition structure. The specific process parameters used during the deposition significantly influence the morphology, microstructure, and mechanical properties of the final parts. Through preliminary experiments, we have debugged the welding current and moving speed many times and obtained the process parameters with the most stable forming process and the best forming morphology. These deposition process parameters are detailed in Table 2.
The additive samples were processed into 0.5 mm samples by wire cutting equipment, polished to 50 μm with sandpaper, and ion-thinned in RES101 ion thinning machine (JEOL Ltd., Tokyo, Japan). During the experiment, the samples were observed using a JEM-3010 transmission electron microscope with an acceleration voltage of 200 kV, and the magnification range was from 5000 to 20,000 times.

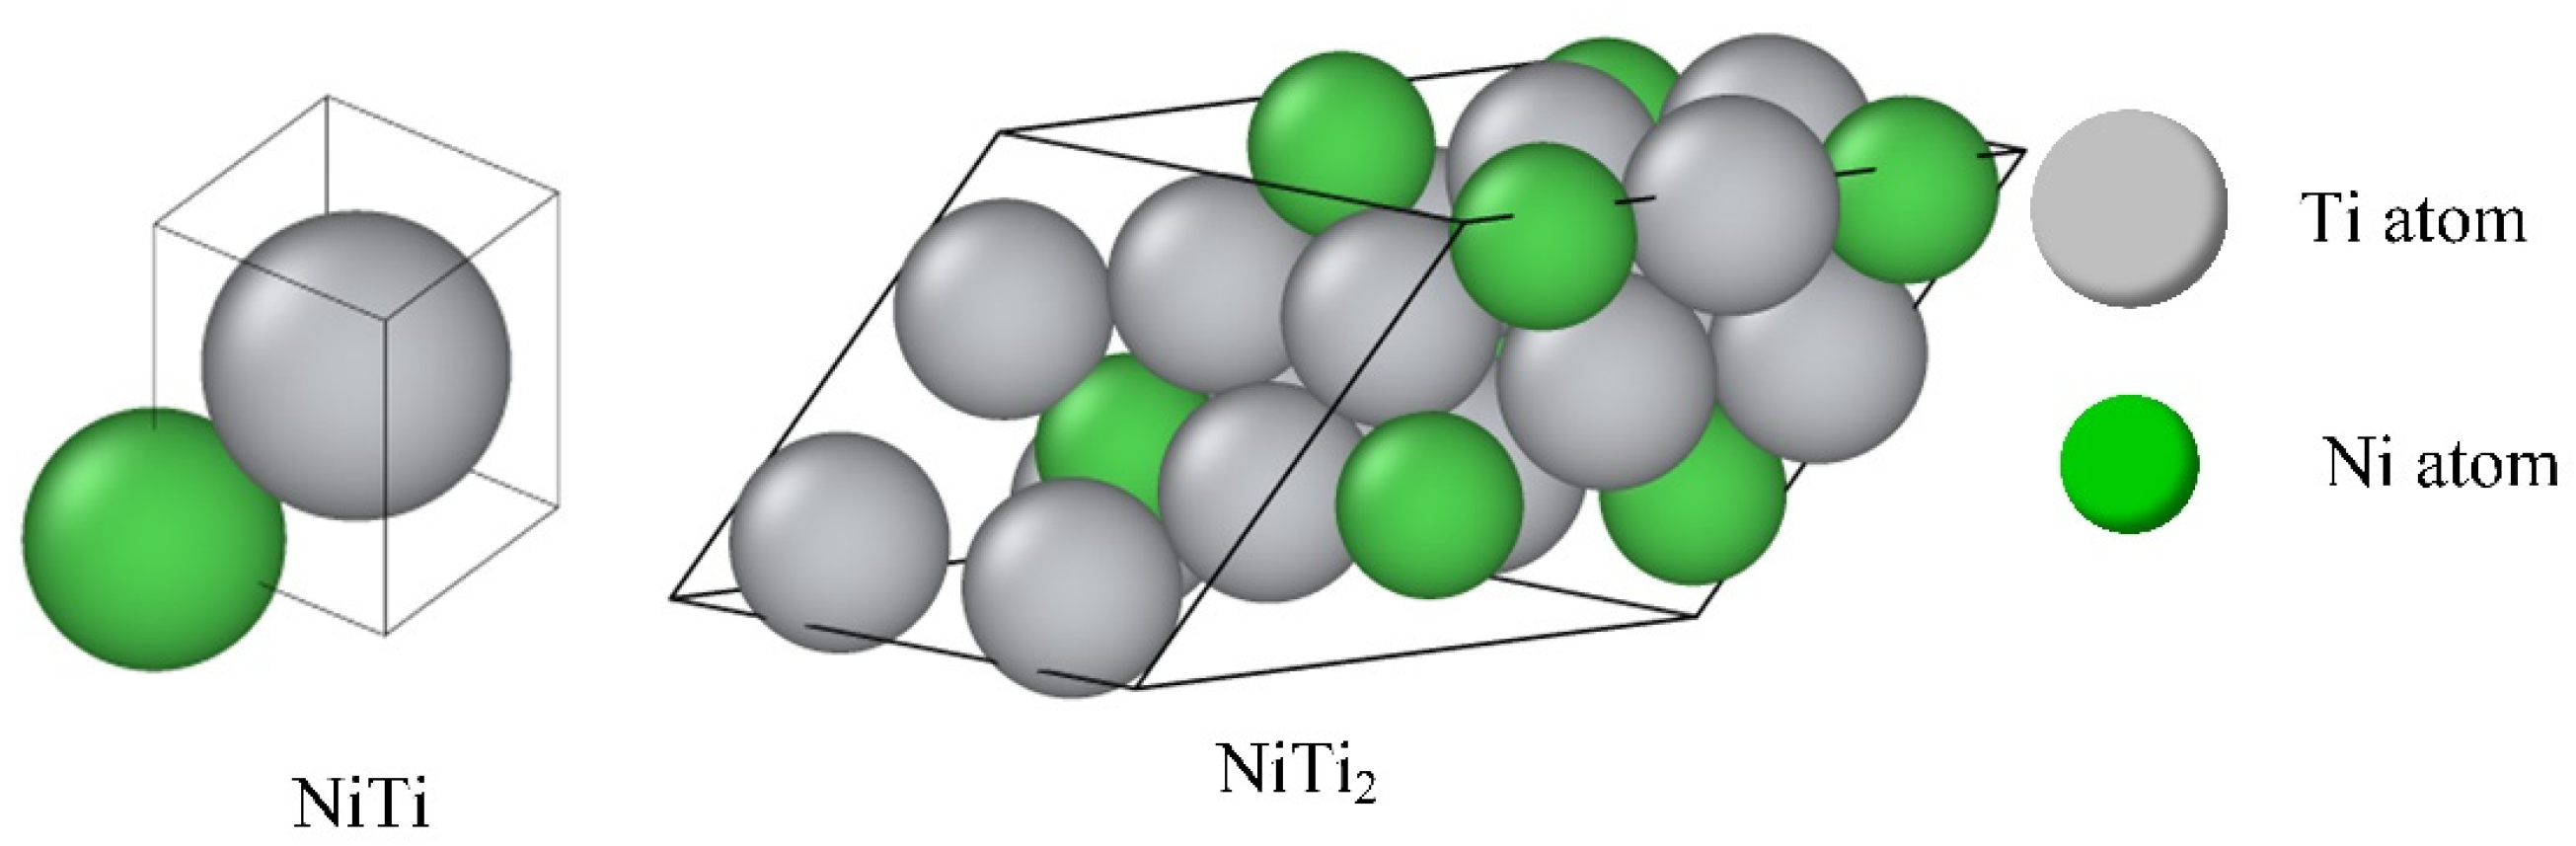
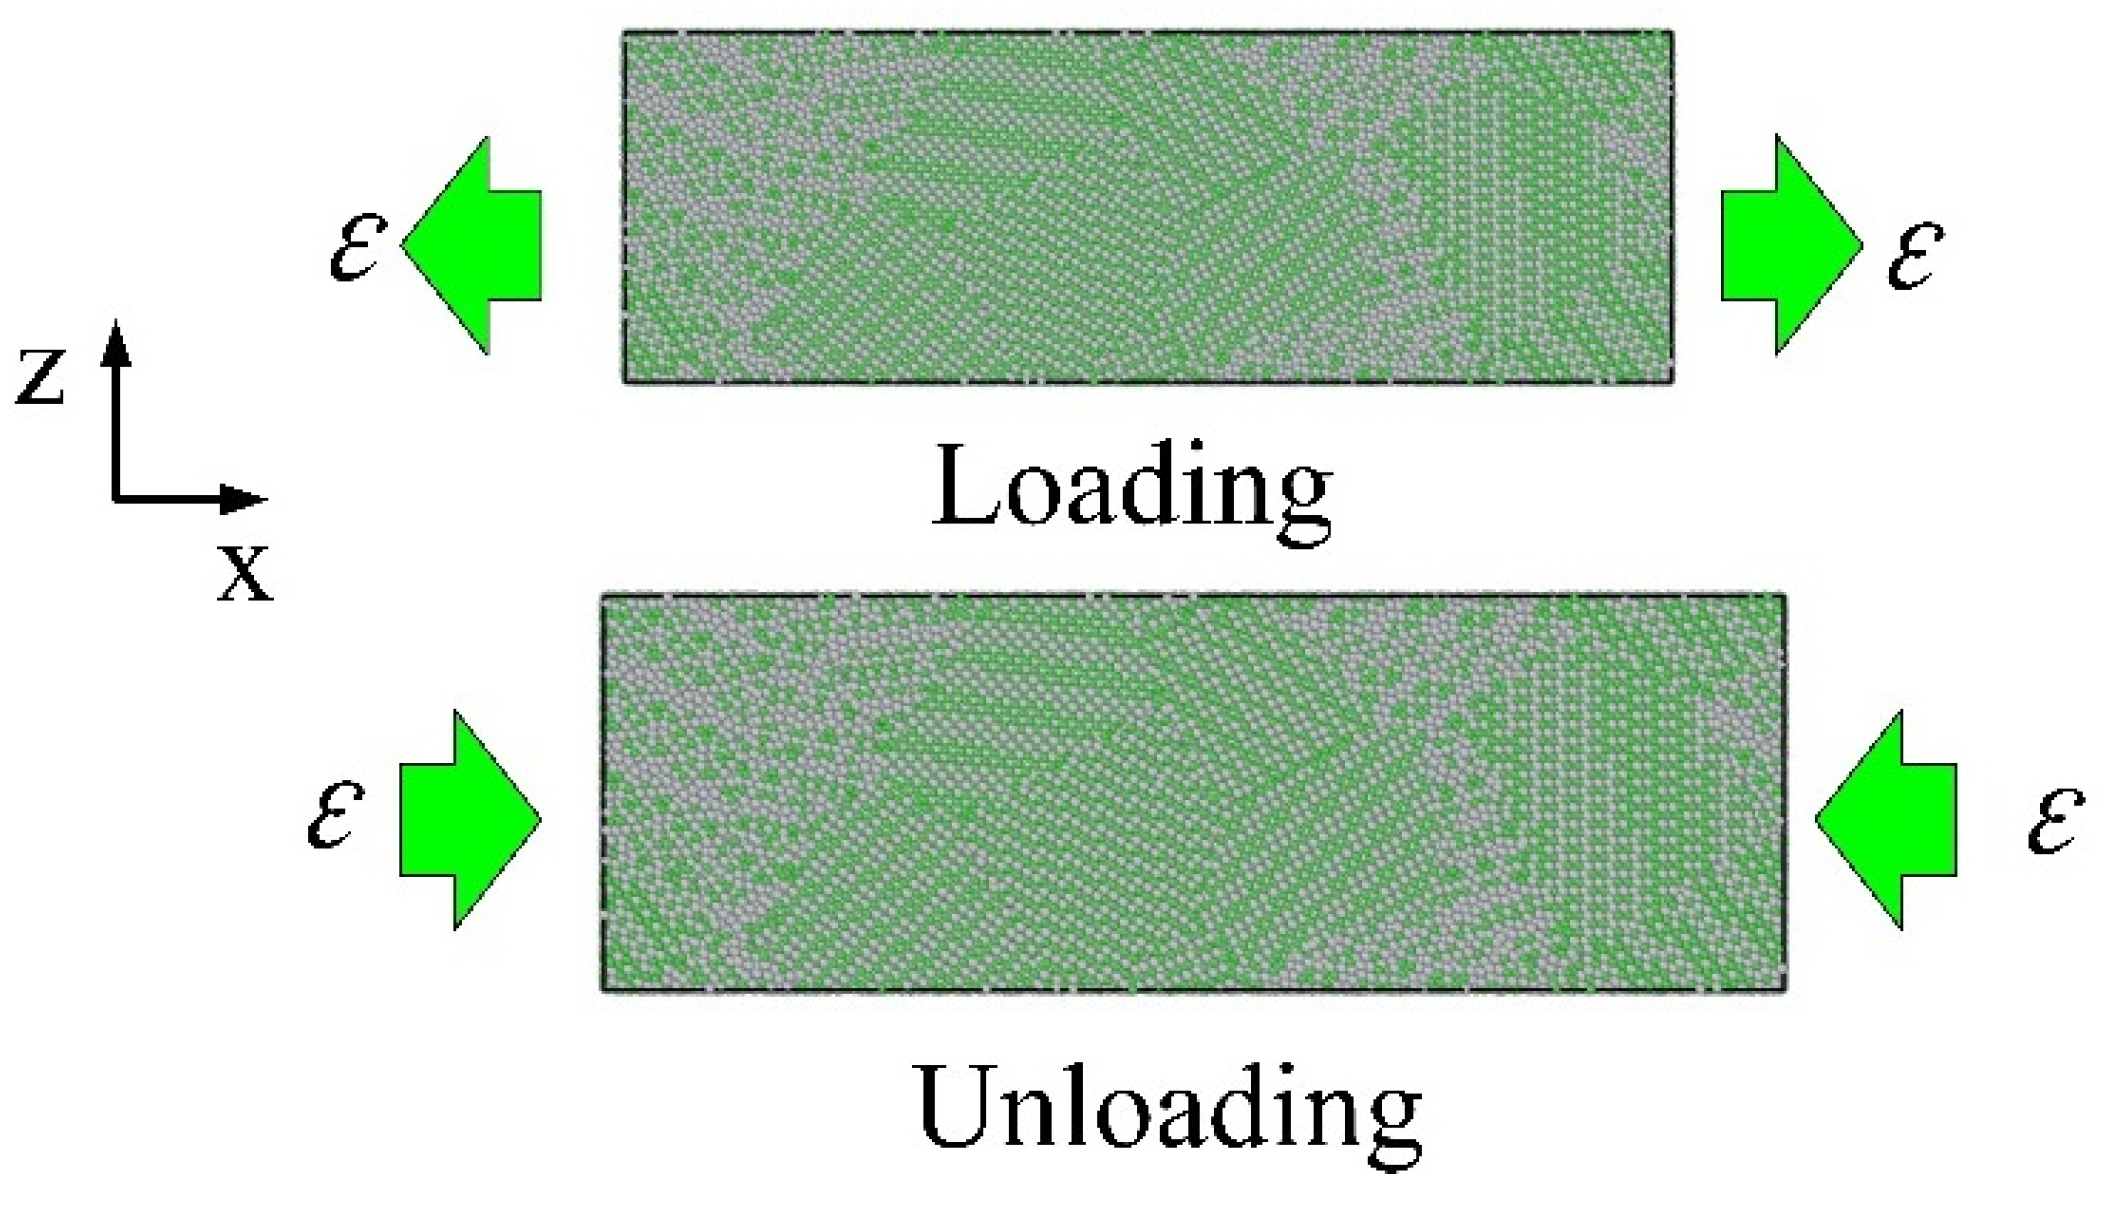
2.2. Modeling and Methods

To investigate the influence of phase content on alloy properties, the molecular dynamics method was employed to establish a microscopic model with varying NiTi phase and NiTi2 phase ratios. Dynamic analysis was then conducted to study the changes in the alloy’s performance.
In this study, Atomsk software (v1.3) [31] was used to construct the model, while LAMMPS open-source software (2 August 2023) [32,33] was employed for the MD simulations during the stretching process of the model. The MEAM (modified embedded atom method) potential function [34,35,36] was applied in the MD simulations to describe the interactions between Ni and Ti atoms within the system. The total energy of the system in the MEAM is expressed as follows:
E p = i [ F i ρ i ¯ + 1 2 j i S i j φ i j R i j ]
where Ep represents the total energy of the system, F is the embedding energy of the atom, ρ is the embedded electron density, S is the screening function, φ is the interaction between atoms, and R represents the distance between atoms.
This potential function was developed to simulate phase transformations in NiTi. Srinivasan et al. [37] compared the EAM-Finnis-Sinclair and MEAM potentials and showed that the MEAM potential more accurately predicted the lattice and elastic constants of NiTi; Ko et al. [33] showed that the simulation of temperature-induced phase transformations using this potential showed that nanotwinned martensitic structures with multiple domains appeared in models with various sizes and constraints, which was consistent with experimental results. Guo et al. [38] calculated the physical properties of equiatomic NiTi alloys and compared them with experimental results and other potentials, confirming that this potential can be used to study temperature- and stress-induced phase transformations. Therefore, this MEAM potential is suitable for simulating the superelastic behavior of NiTi with complex microstructures.
In order to study the deformation behavior of different models, a polycrystalline model with a size of 300 Å × 100 Å × 100 Å was established, which included about 210,000 atoms and contained 20 grains. The grains of this model were filled with NiTi and NiTi2 unit cells (Figure 2). The crystal structure models of NiTi and NiTi2 are from the Materials Project website, where the space group of NiTi is P4/nmm and the space group of NiTi2 is Fd 3 _ m. Four models with different phase ratios were obtained: NiTi, NiTi:NiTi2 = 3:1, NiTi:NiTi2 = 1:1, and NiTi:NiTi2 = 1:3, as shown in Figure 3. During the model-building process, the model was relaxed for 100 ps using the NPT ensemble at 300 K to eliminate defects in the modeling process and allow the system to reach equilibrium.
The model underwent a relaxation process for 5.0 ns to eliminate the interface energy formed during the splicing process. During the stretching process, the system deformed along the X-axis, with the maximum strain controlled at 8%. When the strain reached 8%, the model was unloaded to a stress of 0 GPa. The schematic diagram of loading–unloading is shown in Figure 4. The strain rate was set to 5 × 10⁸ s−1, which is within the strain rate range commonly used in conventional MD simulations (107 to 109 s−1). The choice of strain in the simulation experiment is primarily to consider the scale. The time and model scale of molecular dynamics simulation are very small, so a higher strain is required to produce deformation in a shorter time. Secondly, it is limited by computing power and computing resources. Therefore, the use of high strain rates is the result of a compromise between simulation scale and computing resources, but high strain rates have certain limitations. In the study of Ko et al. [33], it was shown that high strain rates will increase the peak stress.
To monitor the phase transformation behavior of the alloy model during the tensile process, the visualization software OVITO (3.10.0) was used to observe the deformation behavior. The program was employed to study the local atomic arrangement and lattice orientation. Additionally, atomic rearrangement during deformation was characterized by the local shear strain of atoms. In order to analyze the influence of different phase proportions on the phase transformation in the alloy, the common neighbor analysis (CNA) method was used to calculate different CNA values, and the structural evolution process was described by the changing trend of different atomic structure proportions. Furthermore, the atomic structure was analyzed using the radial distribution function (RDF) [39]. Applying RDF to molecular dynamics research can describe the distribution probability of particles at a specific distance and reveal the local structural characteristics of the system. The RDF typically refers to the coordinates of a particle and the probability of the distribution of other particles in space (i.e., their distance from the given particle). For two different types of atoms, A and B, the RDF can be defined as follows:
g A B r = N A B 4 π ρ B 3 r m a x 3 r m i n 3
where rmax is the maximum radius, rmin is the minimum radius, N is the number density of particles between the shells formed by the maximum radius and the minimum radius, and ρ is the number density of particles in the system. 5000 parameter points were selected in the statistics of the radial distribution function.

3. Results and Analysis
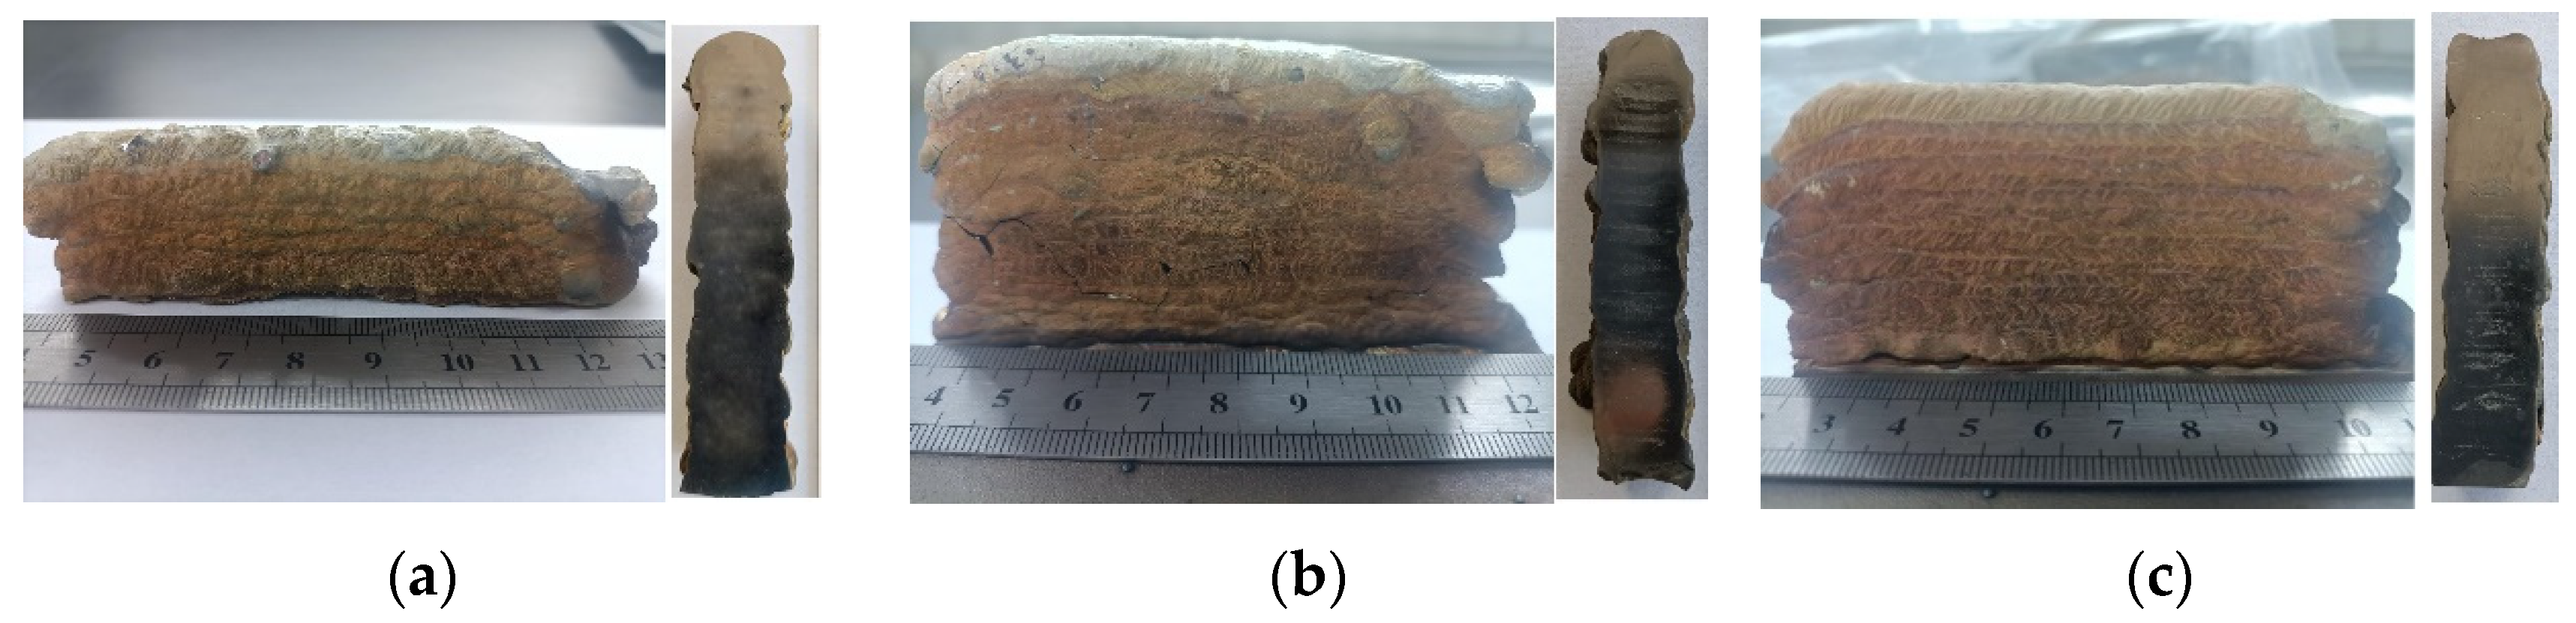
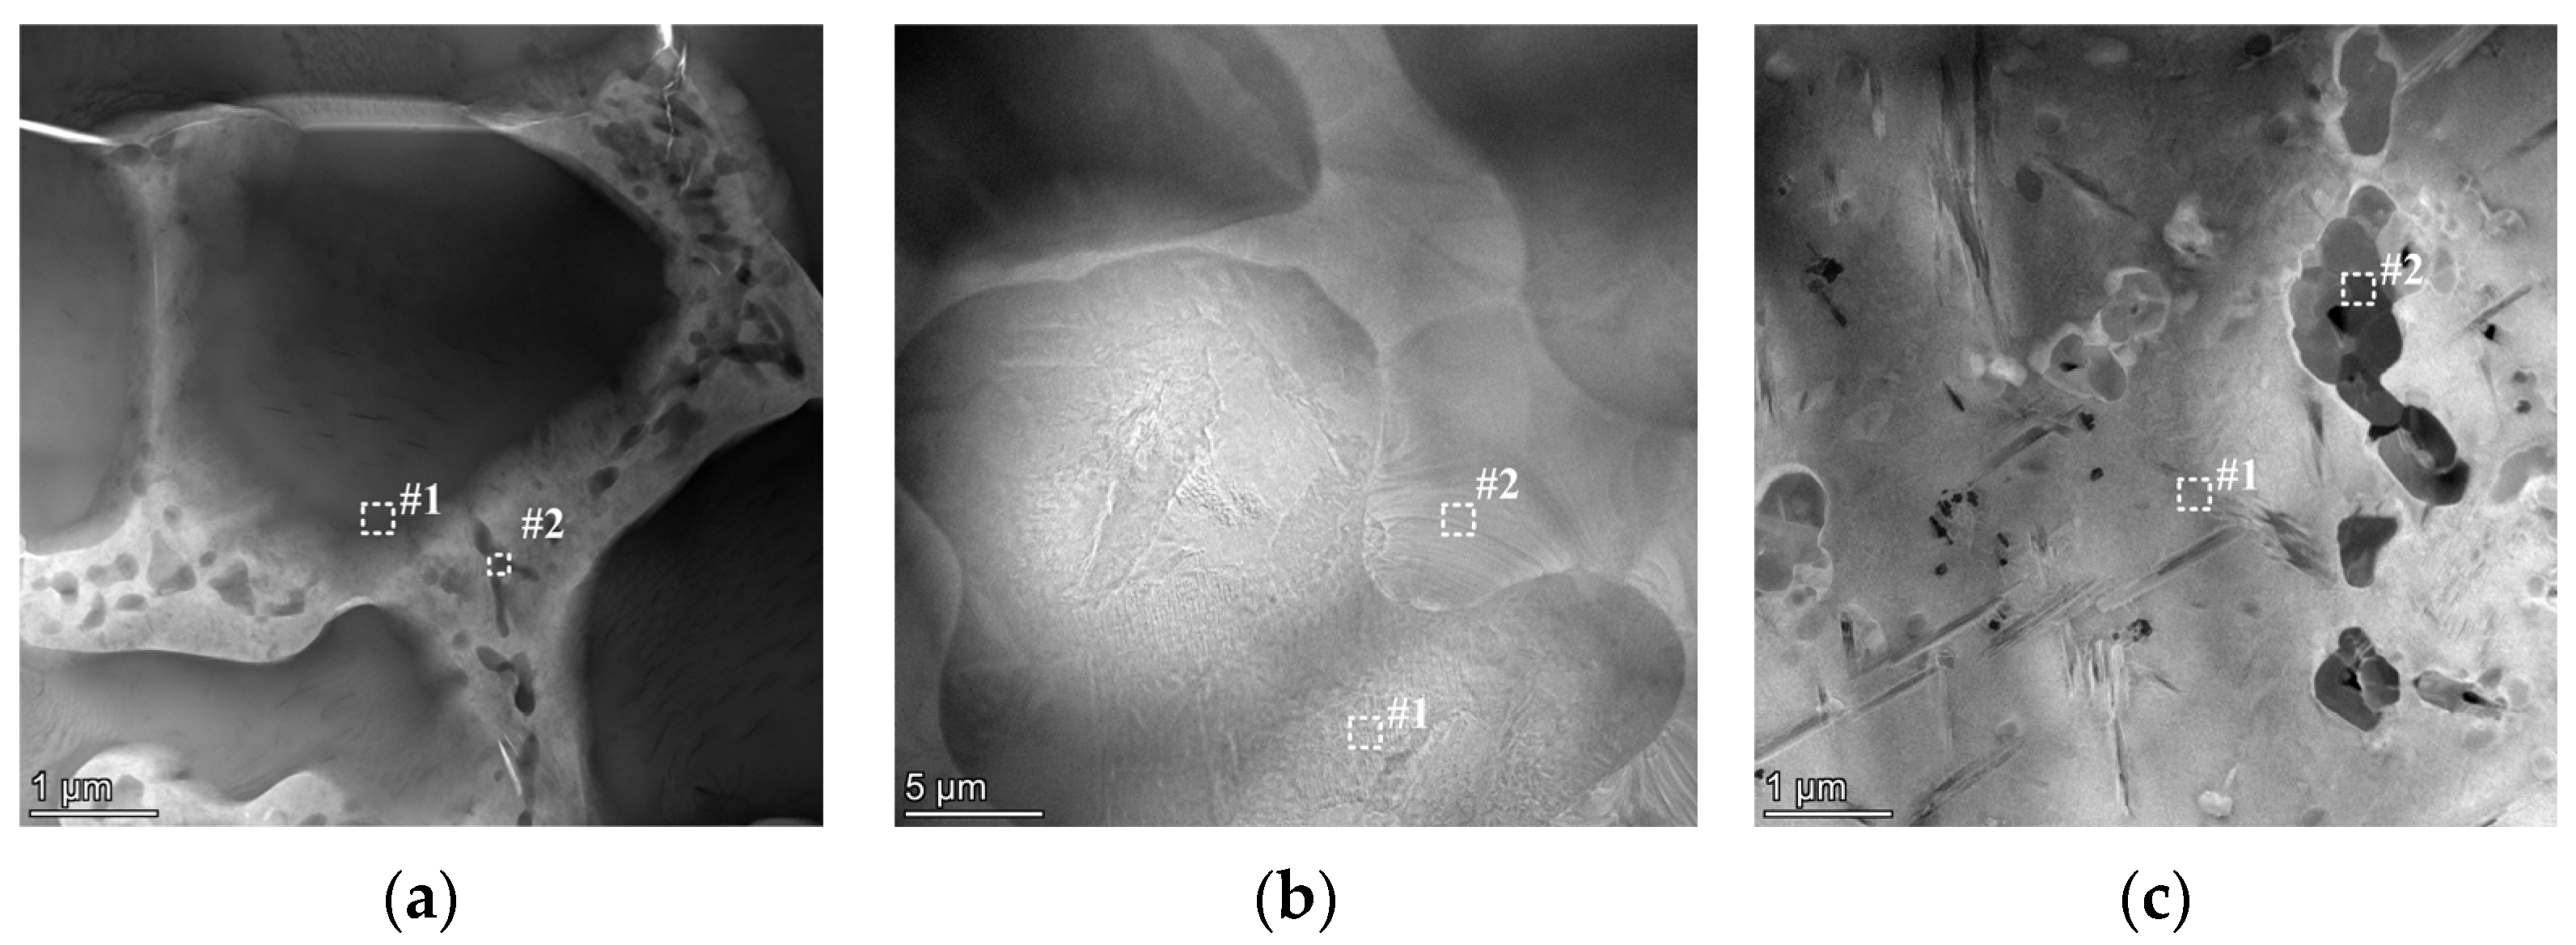
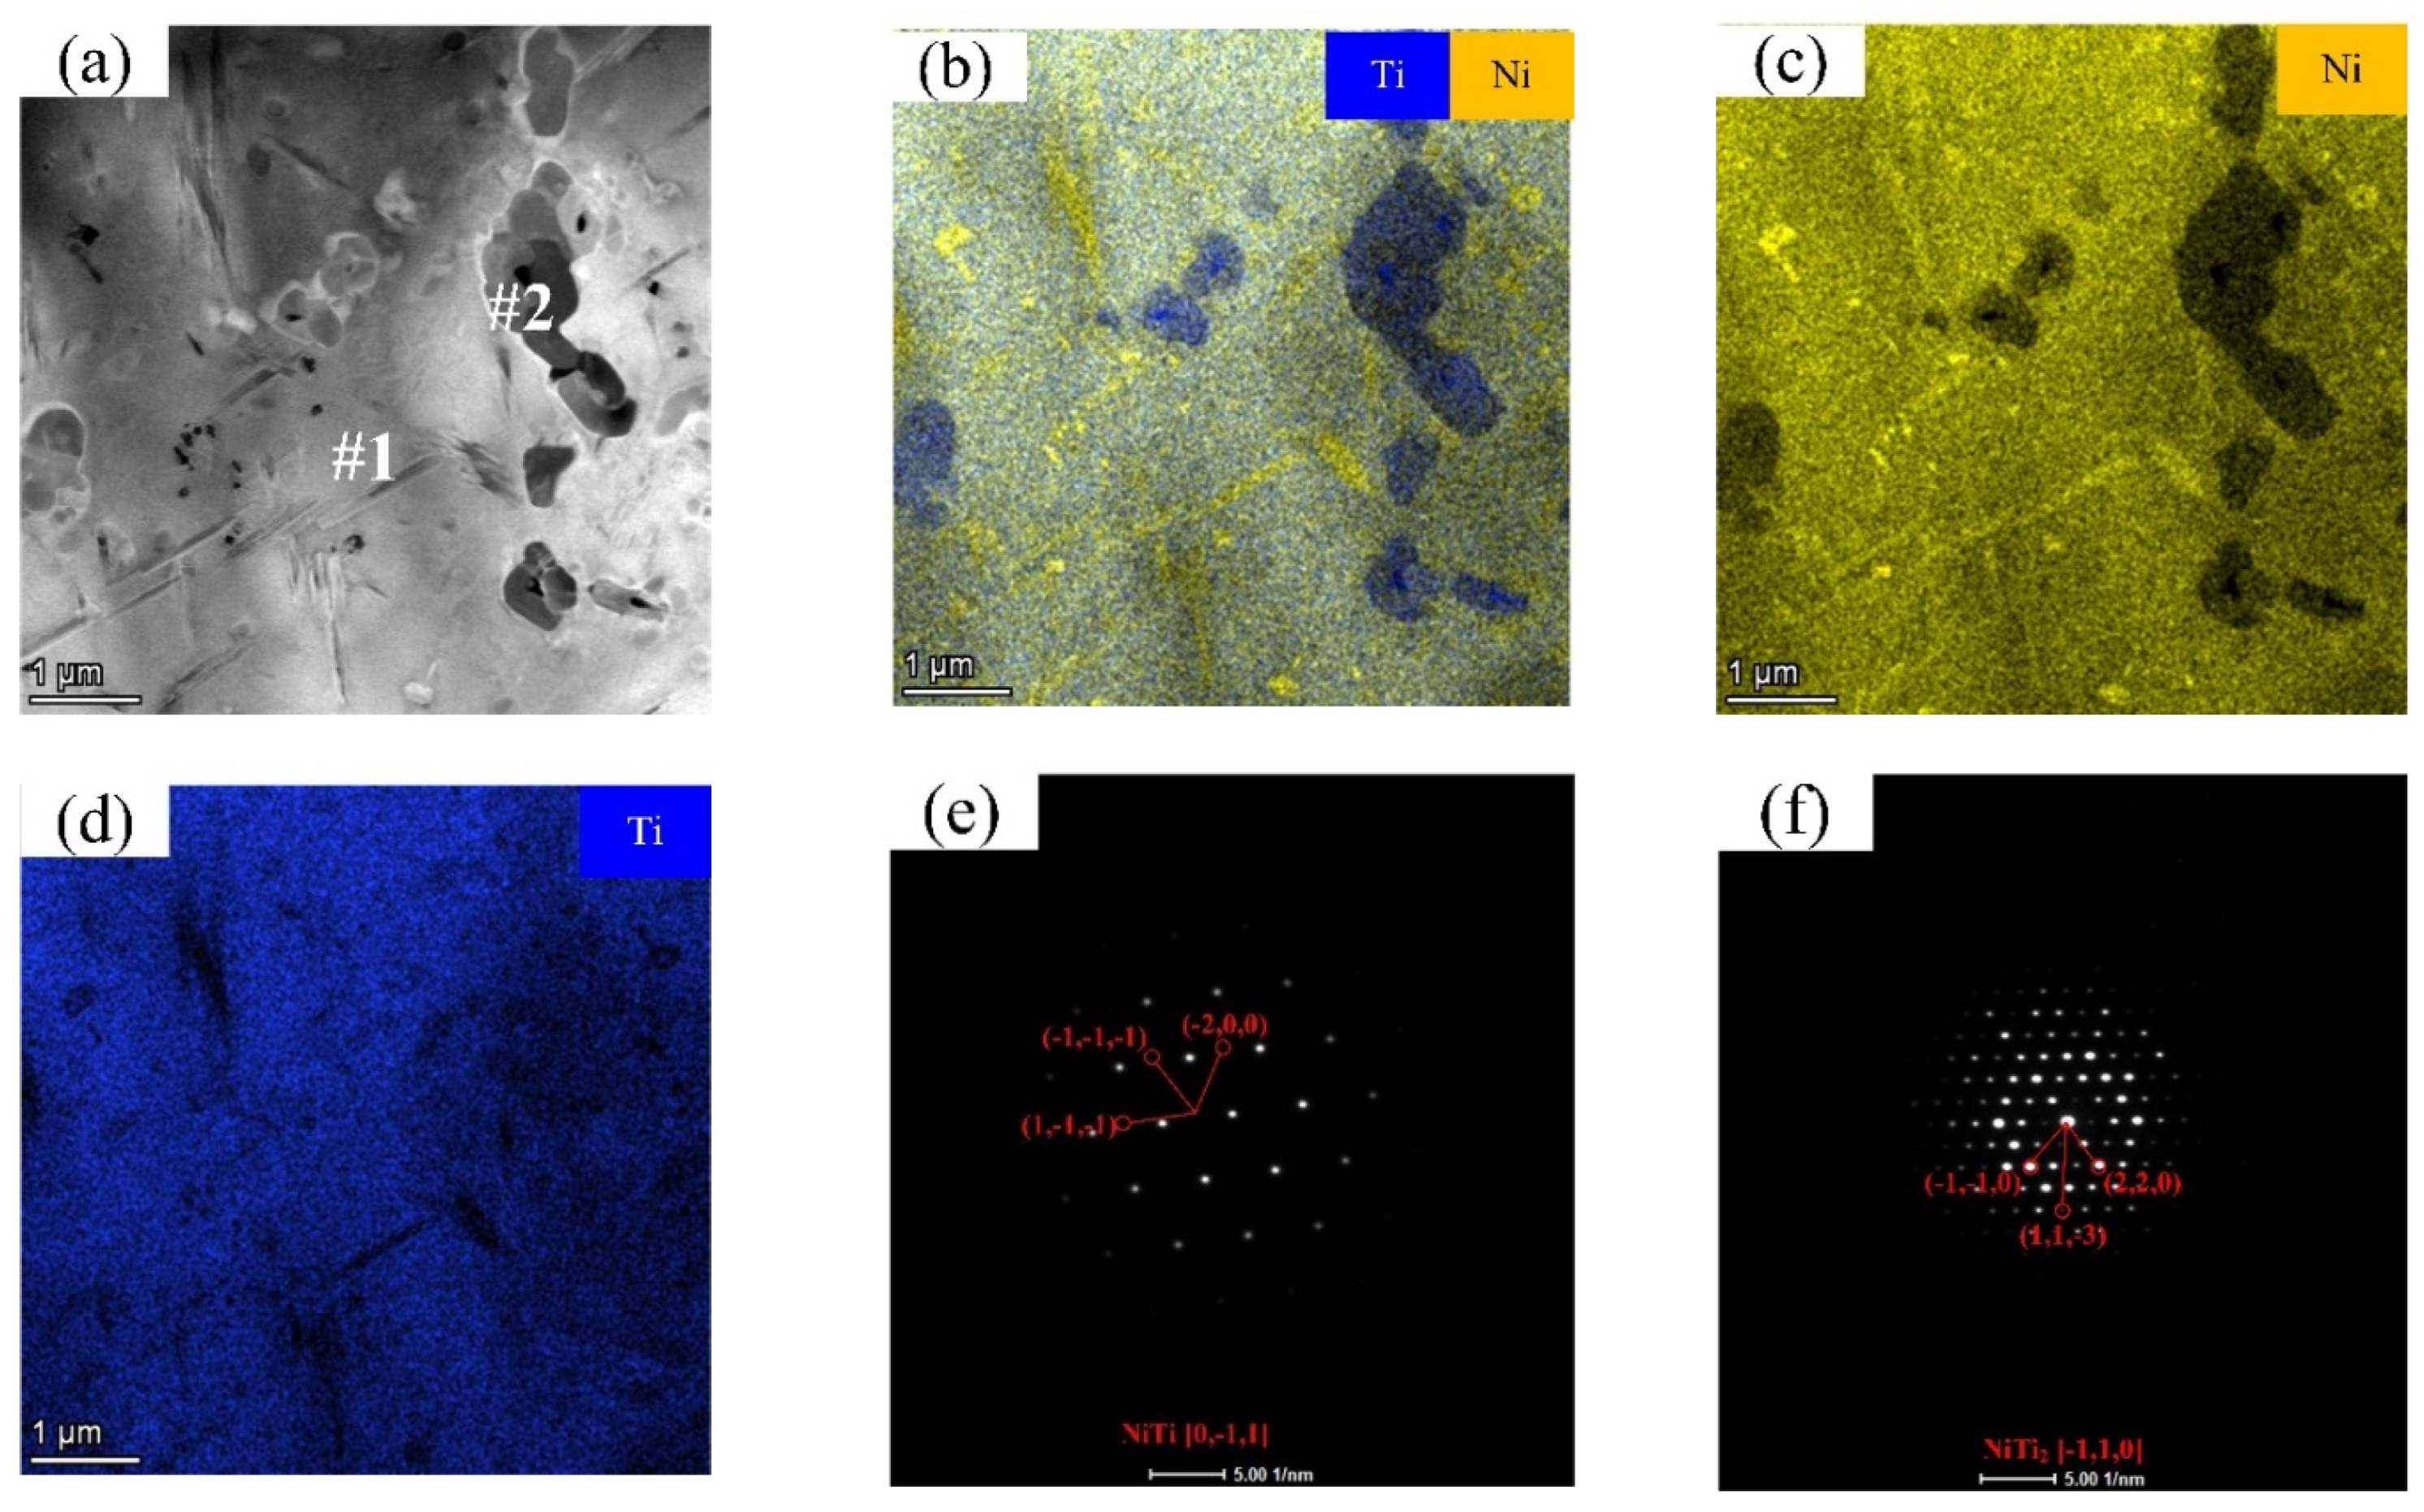
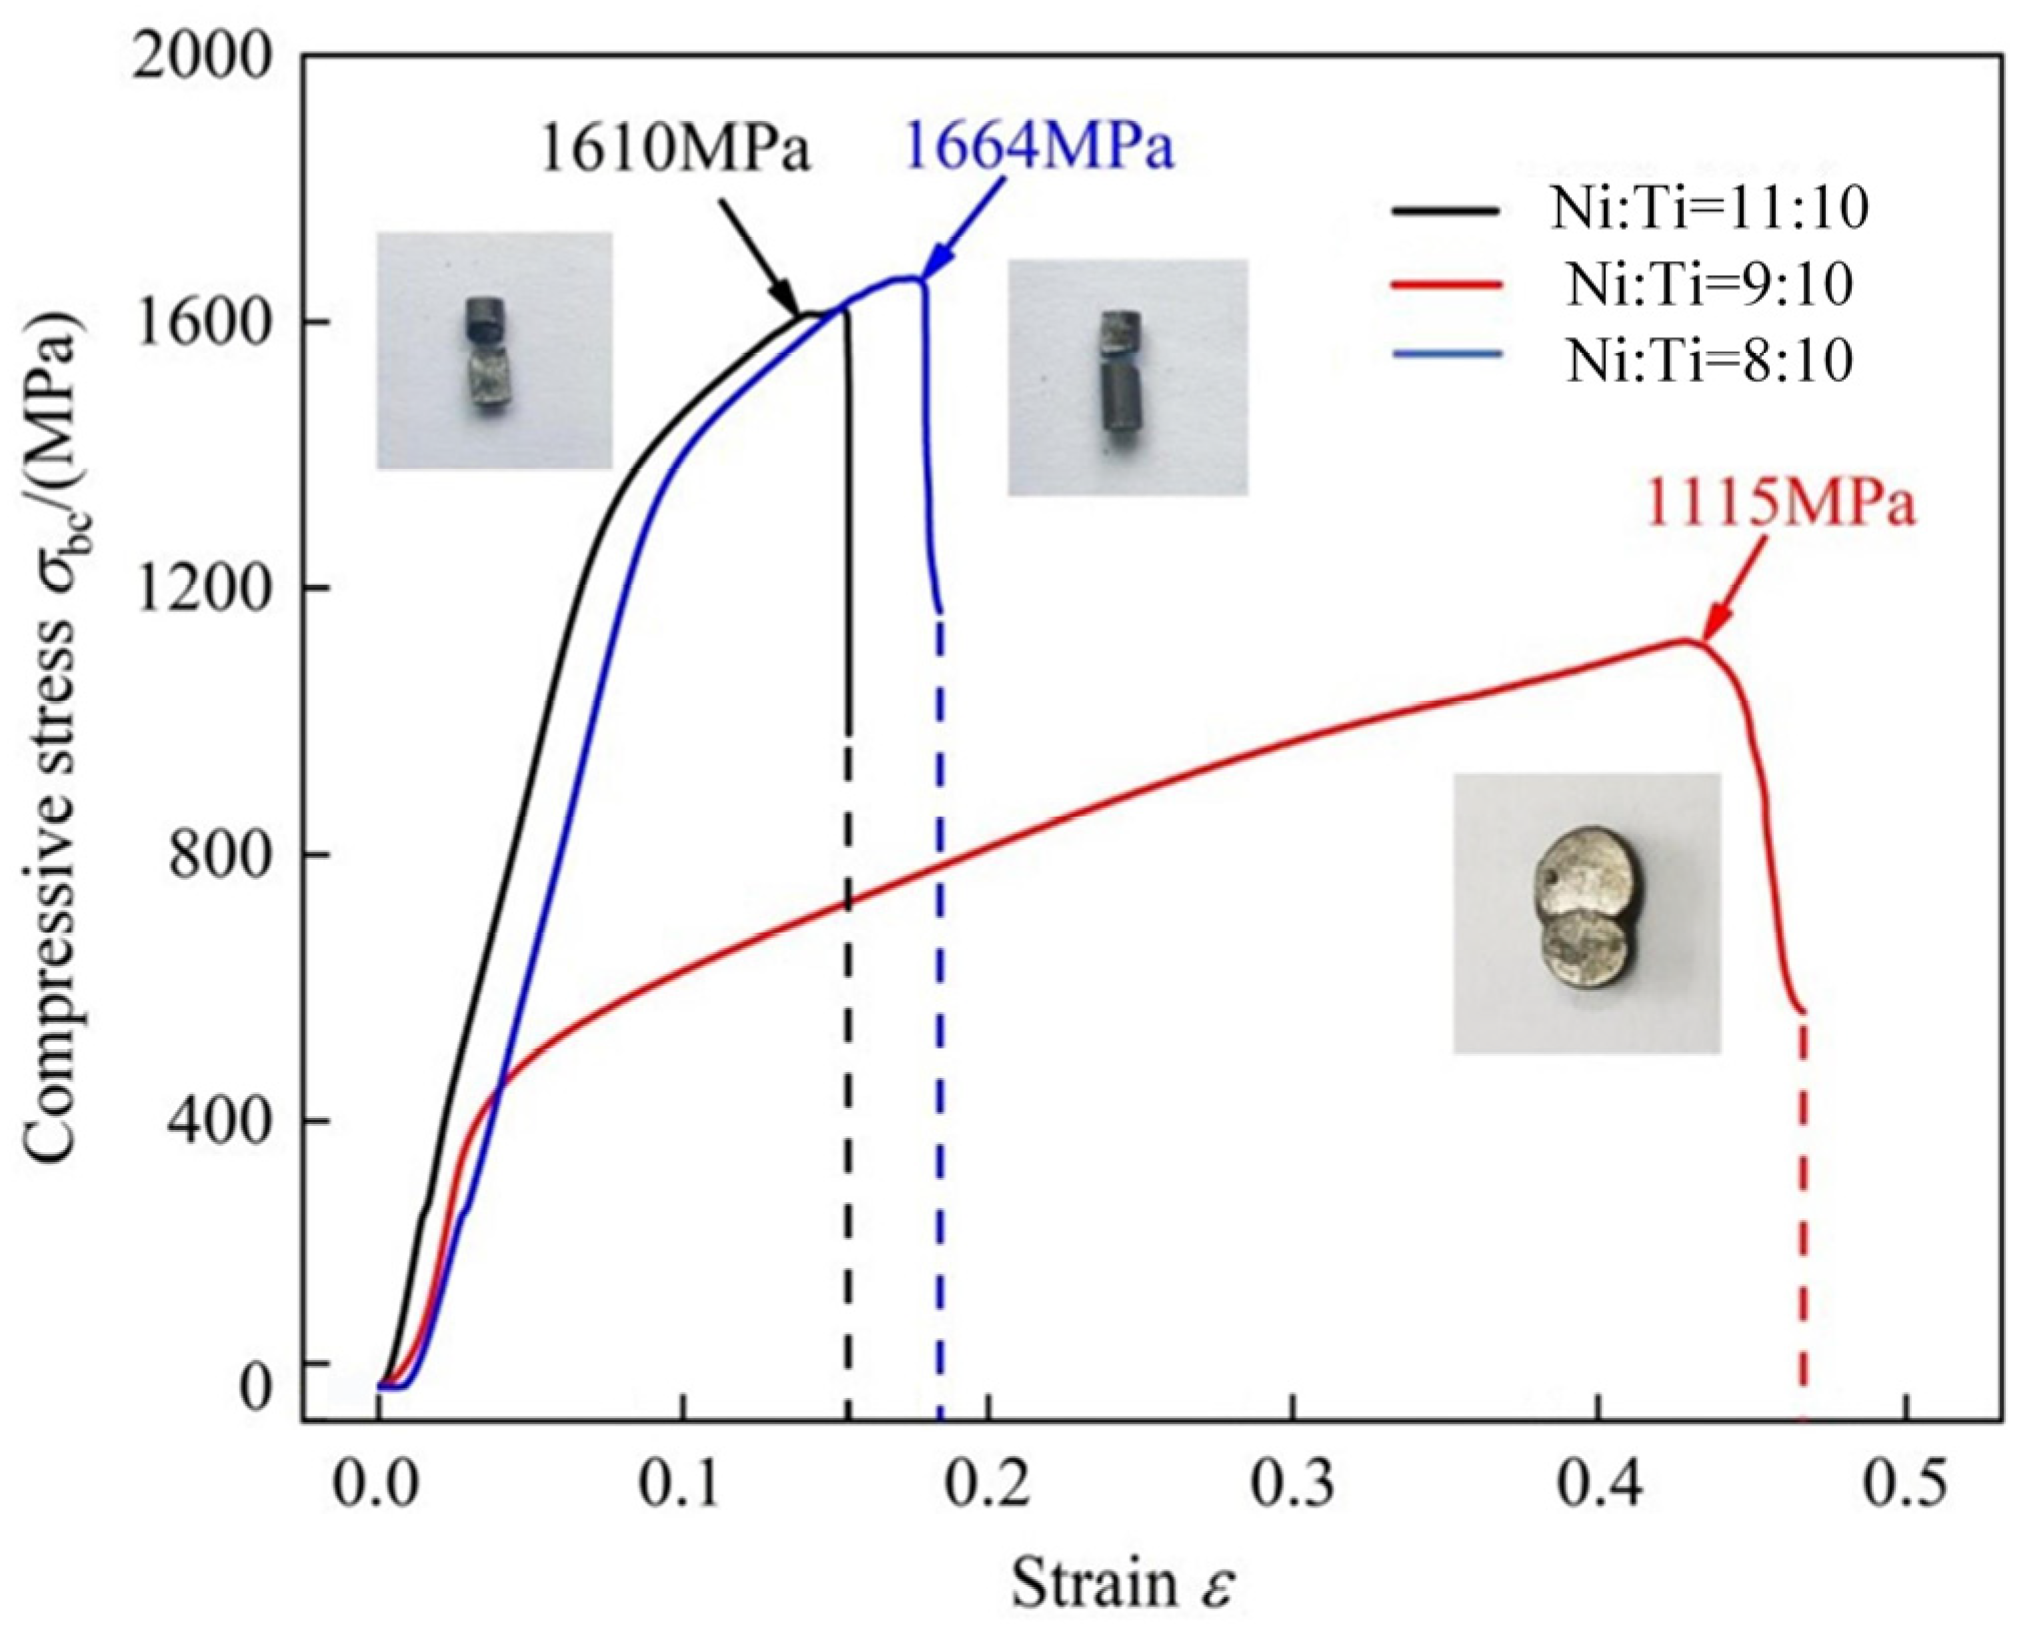
3.1. Test Results

The NiTi alloy parts prepared by twin-wire arc additive manufacturing technology achieve the purpose of adjusting the atomic ratio in the alloy by adjusting different wire feeding speeds. The macroscopic morphology of additive samples with different atomic ratios is shown in Figure 5. When the Ti atomic ratio in the alloy is large, the forming quality is poor, and there are obvious macroscopic defects; when the Ni atomic ratio is high, the forming quality is good, and there are no obvious defects. It can be seen from the cross-sectional images that good connections can be formed between different layers In addition, it should be noted that no post-processing method was used to treat the samples during the experiment.
The unique shape memory effect and superelastic behavior of NiTi alloy are mainly attributed to the formation of the NiTi phase and its unique microstructure. TEM analysis provides valuable information about the microstructural characteristics of NiTi alloy and provides important clues for understanding its phase transformation behavior and its relationship with process parameters. The TEM image of the NiTi alloy sample obtained by additive manufacturing is shown in Figure 6. From the TEM images, it can be seen that using different atomic ratios affects the phase structure in the additive samples. The scanning results of the TEM image are provided in Table 3. It can be found that the enrichment of pure Ti element is produced in the sample with a Ni:Ti atomic ratio of 8:10, and the sample is mainly NiTi2; at the same time, with the increase of Ni element in the alloy sample, the proportion of NiTi phase in the alloy increases, and the proportion of NiTi2 phase decreases.
The TEM images show that there are different phase structures in the NiTi alloy. To further analyze its phase, the energy spectrum was scanned, and its diffraction pattern was photographed, as shown in Figure 7. The TEM images are from the sample with a Ni:Ti = 11:10 ratio. Through energy spectrum analysis, it can be found that the sample is mainly composed of NiTi and NiTi2.
The unique shape memory effect and superelastic behavior of NiTi alloy are mainly attributed to the formation of the NiTi phase and its unique microstructure [36,40]. The obtained NiTi alloy contains the NiTi phase (Figure 7c) and NiTi2 phase (Figure 7d). According to the TiNi alloy phase diagram, ignoring element consumption, the liquid metal alloy undergoes the following phase transformation sequence during cooling and solidification: L (Ni, Ti) → L (Ti-rich) + NiTi, then L (Ti-rich) + NiTi → NiTi2 + NiTi [41]. From a thermodynamic point of view, the formation of NiTi2 has a low Gibbs free energy, indicating that its formation process is very spontaneous and is particularly easy to form during cooling and solidification. During additive manufacturing, high cooling rates and repeated thermal cycles further inhibit the effective diffusion of elements and make it impossible to achieve chemical uniformity [22,42]. In this case, the Ti element is more likely to be enriched along the grain boundaries or the molten pool boundaries to form the NiTi2 phase. This phenomenon of enrichment along the grain boundaries, especially under high cooling rate conditions, may lead to excessive precipitation of the NiTi2 phase in local areas.
Through TEM spectra. The existence of the NiTi phase and NiTi2 phase was found in the additive specimen, and the two phases were intermixed. It is worth noting that although the formation of a small amount of NiTi phase is significantly beneficial to the mechanical properties, the presence of NiTi2 phase may have a negative impact on the plastic deformation ability and fatigue properties of the material [43]. Therefore, in practical applications, the content of the NiTi2 phase should be controlled in combination with process adjustment and composition optimization to maximize the formation of the NiTi phase, thereby further enhancing the shape memory effect, superelasticity, and overall mechanical properties of the material.
The compressive stress–strain curves of the additive samples under three different Ni:Ti atomic ratios (11:10, 9:10, 8:10) are shown in Figure 8. The compression test was carried out using a UTM5105 universal testing machine (MTS Systems Corporation, Eden Prairie, MN, USA). The size of the compression specimen used in the test was φ 3 mm × 9 mm, and the compression rate was 0.5 mm/min. The results showed obvious differences in mechanical properties, especially in compressive strength and plasticity. When the Ni:Ti atomic ratio is 11:10, the compressive strength of the sample is 1610 MPa. When the Ni:Ti atomic ratio is 9:10, the compressive strength of the sample is lower, at 1115 MPa. When the Ni:Ti atomic ratio is 8:10, the compressive strength of the sample reaches 1664 MPa, the highest value under the three conditions. In order to further ensure the reliability of the test results, multiple compression tests were carried out on the same sample. The results are shown in Table 4. The differences in the tensile data of each group are within a reasonable range.

3.2. Simulation Results

In order to further verify the accuracy of the model, the elastic modulus was first calculated and compared with the literature data. As shown in Figure 9, the bulk elastic modulus of the model is within a reasonable range, confirming the reliability of the modeling method.
The stress–strain curves of the simulation model during tensile loading and unloading at 300 K are shown in Figure 10. It can be observed that the simulated stress levels are significantly higher than those experimentally reported by Sun et al. [48]. This discrepancy is primarily due to the extremely high strain rate used in the MD simulation process. The irrecoverable strain of the model is shown in Figure 11. As the proportion of the NiTi2 phase in the model increases, the stress value under the same strain conditions gradually increases. Under the 8% strain condition, when the NiTi2 content in the alloy model reaches 75%, the maximum stress value is 2.0617 GPa. Simultaneously, the irrecoverable strain in the alloy model increases after unloading. When the NiTi2 content is 75%, the irrecoverable strain after unloading is 3.383%.
The atomic configuration of the model under different load states is shown in Figure 12, which represents the loaded state, the state at 8% strain, and the unloaded state from left to right. Blue represents the BCC crystal form, red represents the HCP crystal form. It should be noted that this structure does not represent the physical phase in the model. This is a transient structure caused by atomic reconstruction during deformation. Yellow represents the ICO (icosahedral) crystal form. The main reason for this type of crystal form is the rearrangement of atoms during the equilibrium process. Gray represents other types, namely disordered stacking structures. It can be observed that when the stress is unloaded to 0 GPa, the NiTi phase in the model returns to its initial state. However, the transformation of the NiTi2 phase depends on the proportion of the NiTi phase in the model. When the NiTi phase proportion is high, the NiTi2 phase undergoes minimal change. In contrast, when the NiTi phase proportion is low, the NiTi2 phase transforms into the “Other” phase and cannot return to its initial state after unloading.
Upon loading the model to a maximum strain of 8%, some blue atoms are observed, indicating residual austenite that has not fully transformed into martensite. This incomplete phase transformation occurs because, during stress-induced transformation, certain grains preferentially align in the direction of the applied load, while others, oriented in non-preferred directions, do not undergo complete transformation. It can also be observed that at 8% strain, martensite is present, but its distribution within the model is unclear. This is due to the fact that the strain value chosen for this study is an idealized value. During the simulation, model structure limitations, including grain boundaries and other influencing factors, prevent achieving the theoretical strain limit. In reality, stress induces further deformation in the martensite structure, causing atomic reorientation.
The trend of CNA during the tensile process for different models is shown in Figure 13. To more clearly illustrate the changes in crystal structure, the trend of “Other” crystals is omitted from the figure. The single NiTi phase is primarily in the BCC form. During tensile loading, the proportion of the BCC phase gradually decreases, while the HCP phase increases. As shown in Figure 13b,c, the NiTi2 phase is represented as the ICO phase in the CNA calculation. In the NiTi:NiTi2 = 3:1 and NiTi:NiTi2 = 1:1 models, increasing the proportion of the NiTi2 phase has little effect on the transformation of the NiTi phase. However, the total proportion of BCC and HCP phases decreases during loading, and a greater amount of “Other” phases appears in the model. When the NiTi:NiTi2 ratio is 1:3, a large amount of “Other” phases is generated during loading. Through the visualization analysis software, it can be observed that there are obvious ordered structures and disordered structures in the model, and the disordered structure is identified as the “Other” phase, as shown in Figure 14. This indicates that as the proportion of the NiTi2 phase increases, the model becomes more disordered during loading, leading to a more significant impact on the alloy’s properties.
The results of molecular dynamics simulation show that the unloading recovery ability of the alloy gradually decreases with the increase of the proportion of the NiTi2 phase. This behavior is closely related to the presence of the amorphous phase in the alloy model, and the amorphous phase increases with the increase of NiTi2 proportion. During recovery, it is able to restore the initial state. Therefore, alloys with a higher proportion of NiTi phase show better unloading recovery ability. The crystal structure of the NiTi2 phase is more complex, and when its proportion is higher, the alloy model shows more amorphous structure under the unloading state. During loading, this structure tends to transform into an amorphous state, and when unloading, this amorphous structure cannot be restored to the initial state but remains in the alloy model in the form of an amorphous state. Therefore, the unloading recovery ability is significantly reduced.
The above research demonstrates that the transformation of the NiTi2 phase into the amorphous phase during stretching significantly impacts the superelasticity and recovery ability of nickel–titanium alloy. To further investigate the mechanism behind this transformation, a model consisting solely of the NiTi2 phase was created, and the same simulation process was applied. As shown in Figure 15b, the crystal structure undergoes a change during loading. Specifically, the ICO transforms into other (amorphous) phases during loading due to the amorphous disordered stacking structure generated by atomic displacement during deformation, and this transformation cannot be reversed after unloading.
The deformation behavior of the NiTi2 phase is shown in Figure 16. After unloading, more regions of different colors are observed in the model, indicating areas where atomic displacements are much larger than those of the surrounding atoms. This behavior is linked to the transformation of part of the crystal structure into an amorphous phase during tensile loading. These atomic groups are typically defined as the shear transformation zones (STZ) in amorphous alloys during plastic deformation. The observed phenomenon is a result of the increasing proportion of the NiTi2 phase, which contributes to a higher fraction of the amorphous phase that forms during tensile loading. In this study, the 8% strain exceeds the elastic strain limit of the NiTi2 phase, leading to plastic deformation in the amorphous phase at the later stages of deformation [49].
Figure 17 shows the radial distribution function of NiTi2 during the simulated loading and unloading process. The first peak of RDF in amorphous alloys is usually affected by the atomic composition and the nearest shell structure, forming a short-range ordered (SRO) structure. During the tensile loading process, the height of the first peak gradually decreases, indicating that the atomic distribution inhomogeneity increases after deformation. At the same time, it can be found that the remaining peaks have decreased to varying degrees. The significant changes in the position and intensity of the RDF peaks before and after deformation indicate that the atoms have been rearranged, which is clear evidence of atomic-scale deformation. For amorphous alloys, the second peak of RDF is usually split into two sub-peaks, which is related to the polyhedral connection and corresponds to the medium-range ordered (MRO) structure [50]. However, no split peak was observed in the second RDF peak, which may be because the NiTi2 phase in this study did not completely transform into an amorphous state. Instead, part of the crystal structure remained intact, which may also be affected by the limitations of the potential function used in the simulation.
By analyzing the stress–strain curves of different phase structures obtained by molecular dynamics, it can be found that with the increase of the proportion of the NiTi2 phase in the alloy, the superelastic properties of the alloy decrease. This serves as a reference for the actual test process. In order to obtain alloy samples with better performance, the proportion of Ti atoms should be controlled in the actual test, so as to reduce the generation of the NiTi2 phase in the process of heterogeneous wire additive manufacturing and improve the performance of the alloy.

4. Discussion

By comparing the tensile curves of NiTi and NiTi2, as shown in Figure 10a and Figure 16a, it can be observed that the NiTi phase exhibits a higher elastic limit, whereas the NiTi2 phase has a lower elastic limit. Furthermore, by comparing the curves of nickel–titanium alloys with different microstructures, the stretching process can be roughly divided into four distinct stages, as shown in Figure 16b: (1) Both NiTi and NiTi2 phases undergo elastic deformation. (2) The softer NiTi2 phase undergoes plastic deformation, while the harder NiTi phase continues to deform elastically. (3) The NiTi phase experiences plastic deformation due to phase transformation. (4) Both phases undergo plastic deformation. The deformation resulting from the applied tensile stress can be expressed as follows:
ε t = ε e + ε m + ε p
in the formula, ε e represents the elastic strain, ε m is the recoverable strain caused by phase transformation, and ε p denotes the irrecoverable strain resulting from stress. Figure 18c illustrates the change in crystal structure within the alloy model. Under the strain condition of 8%, the irrecoverable deformation of the model after unloading is primarily due to the plastic deformation of the NiTi2 phase.
To further characterize the impact of different phase ratios on alloy properties, the area of the hysteresis loop is used to evaluate the plastic deformation of the alloy model, as shown in the shaded region of Figure 18b. The area of the hysteresis loop quantifies the energy loss of the material during the loading–unloading cycle, which can be expressed through integration:
A = ε 1 ε 2 σ ε d ε
where A is the area of the hysteresis loop, ε 1 and ε 2 are the starting and ending points of the strain during loading and unloading, and σ(ε) is the function of stress to strain.
As the proportion of the NiTi2 phase in the alloy model increases, the area of the hysteresis loop gradually expands. When the proportion of NiTi2 is 0%, the area of the hysteresis loop is 40.18 MJ, while at 100% NiTi2, it increases to 83.05 MJ. This significant increase in the hysteresis loop area clearly reflects that a higher proportion of the NiTi2 phase results in greater plastic deformation. To further analyze the relationship between the hysteresis loop area and the NiTi2 phase proportion, the ExpDe model was applied to fit the obtained data points. The fitting curve, shown in Figure 19, demonstrates that the energy consumption area of the hysteresis loop increases exponentially with the proportion of the NiTi2 phase.

5. Conclusions

This study utilizes molecular dynamics simulations to explore the effect of phase ratio on the properties of NiTi alloys. Alloy models with different phase structures were established, including single NiTi, NiTi:NiTi2 = 3:1, NiTi:NiTi2 = 1:1, and NiTi:NiTi2 = 1:3. The performance and structural transformations of these models were analyzed through MD simulations. Additionally, a single NiTi2 model was created to investigate the mechanism of transformation from the NiTi2 phase to the amorphous phase. The key conclusions are as follows:
(1)
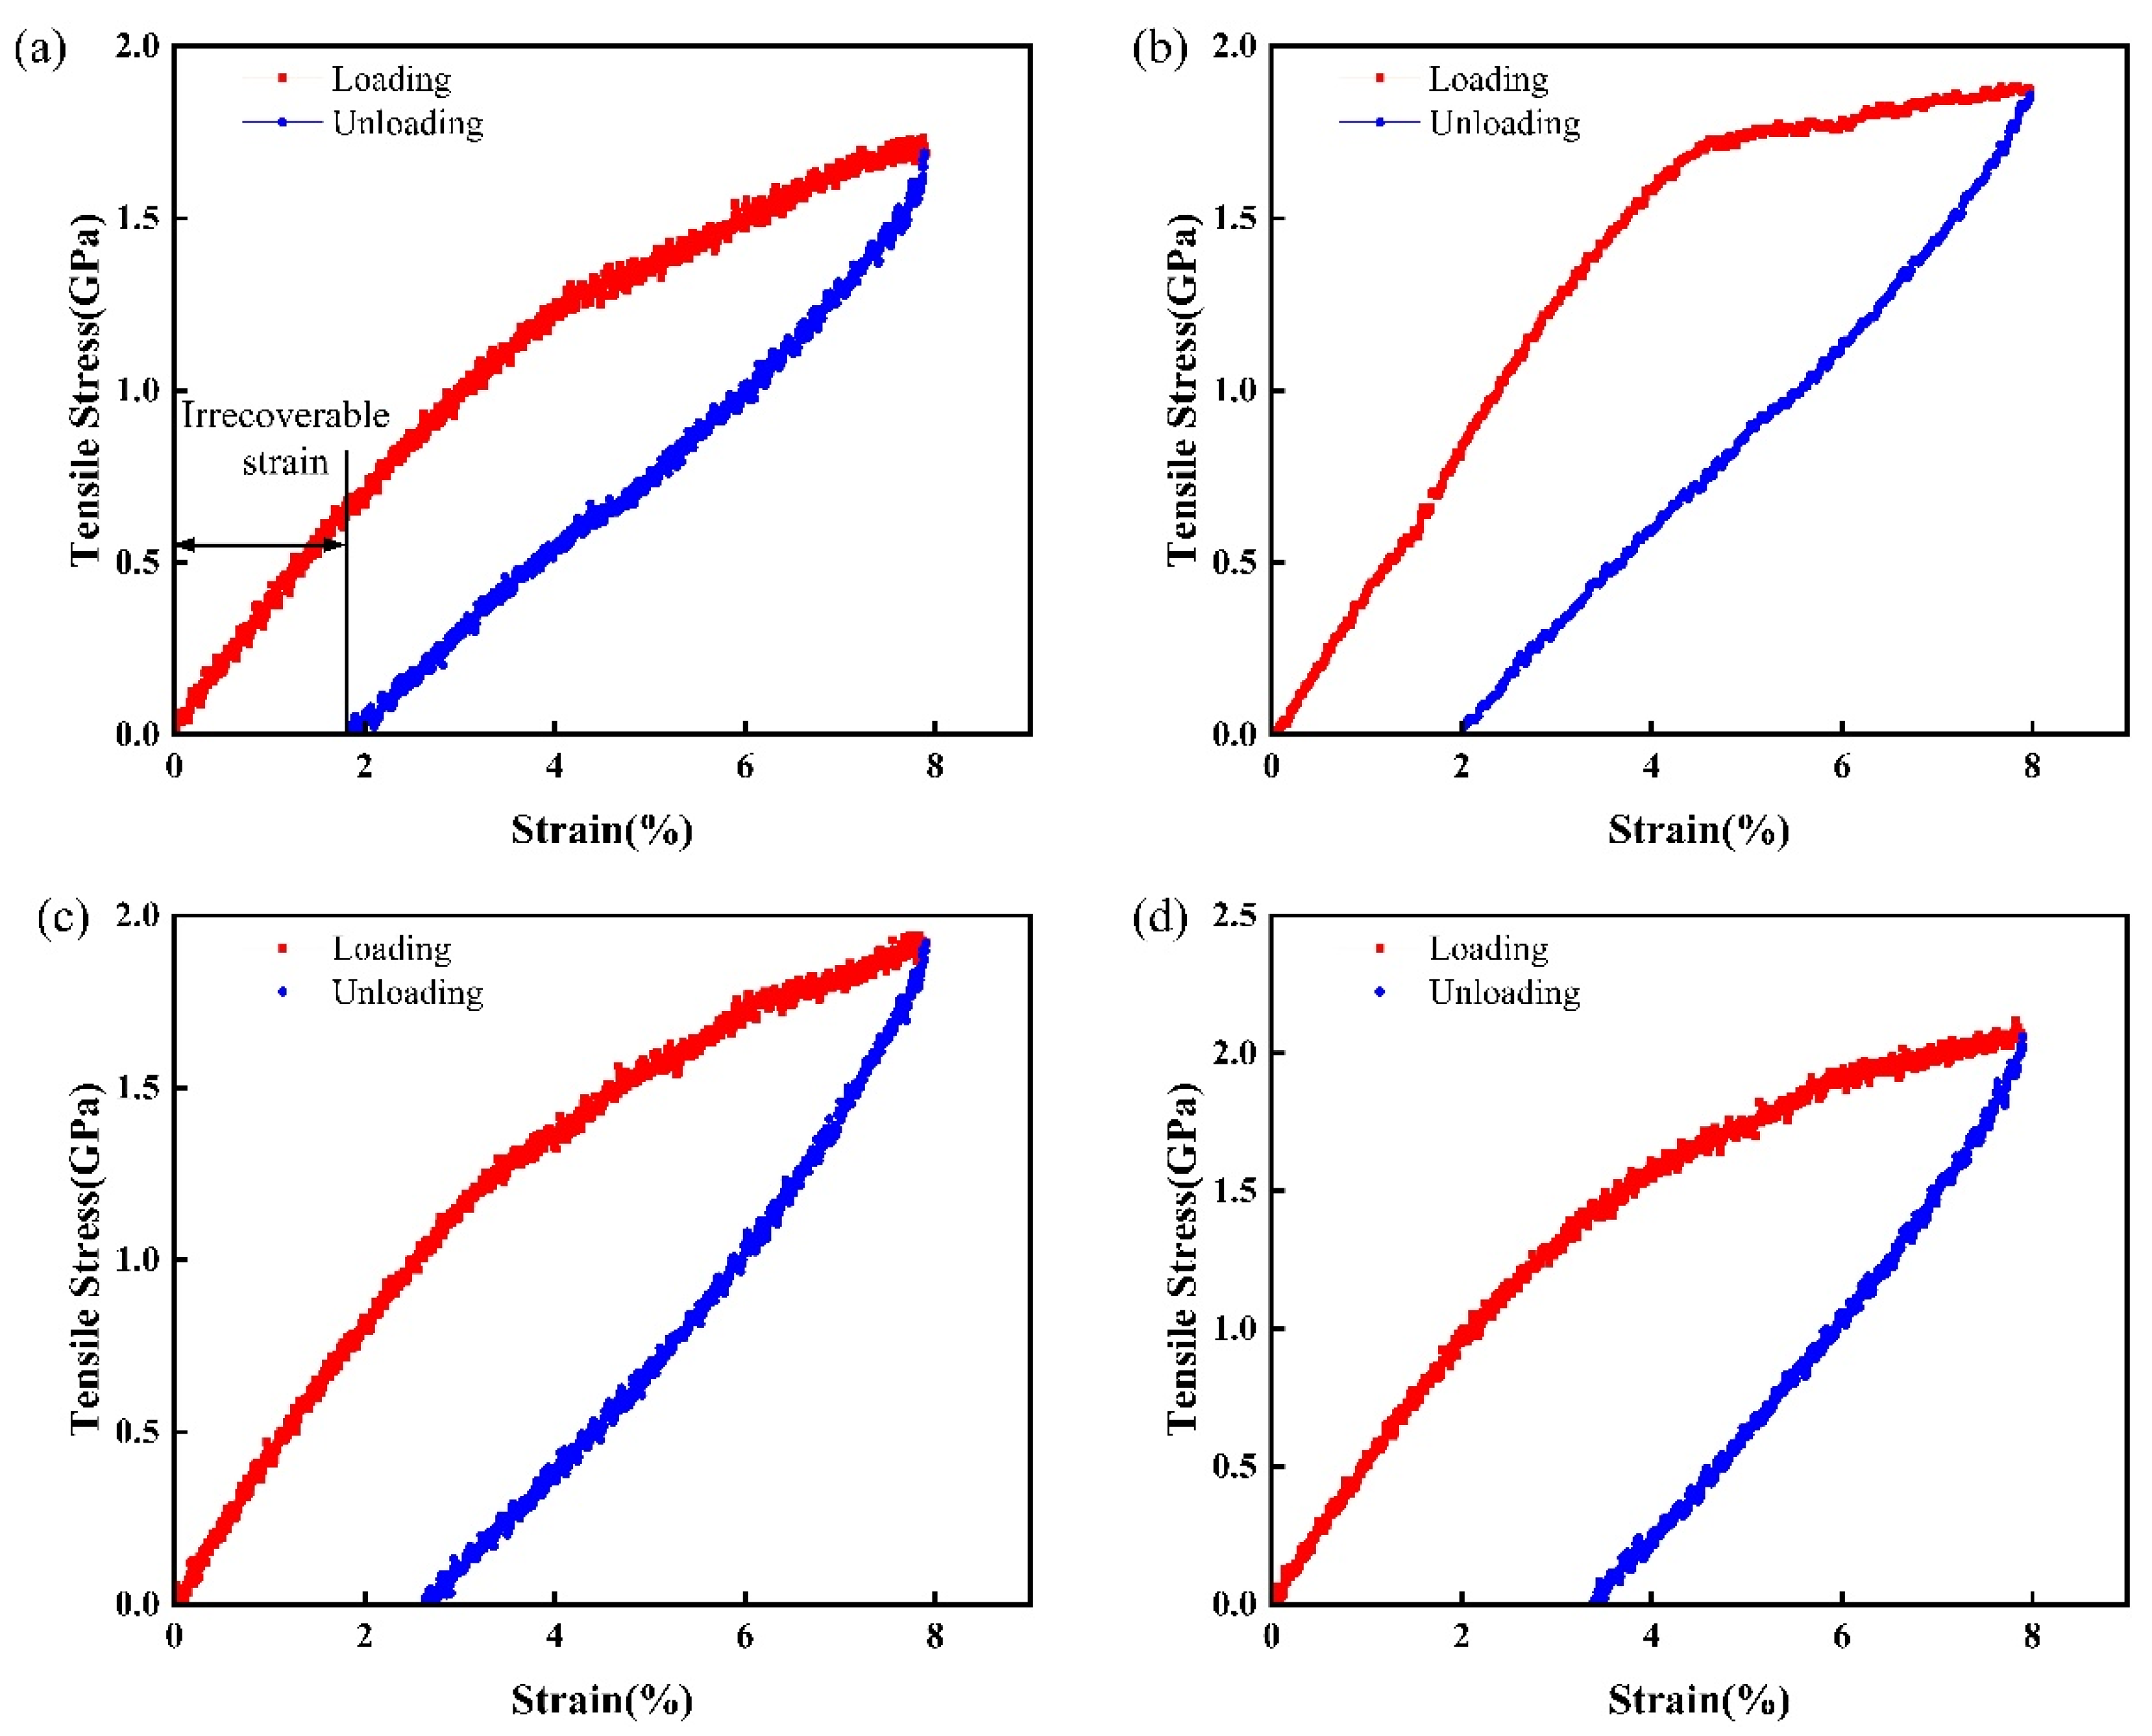
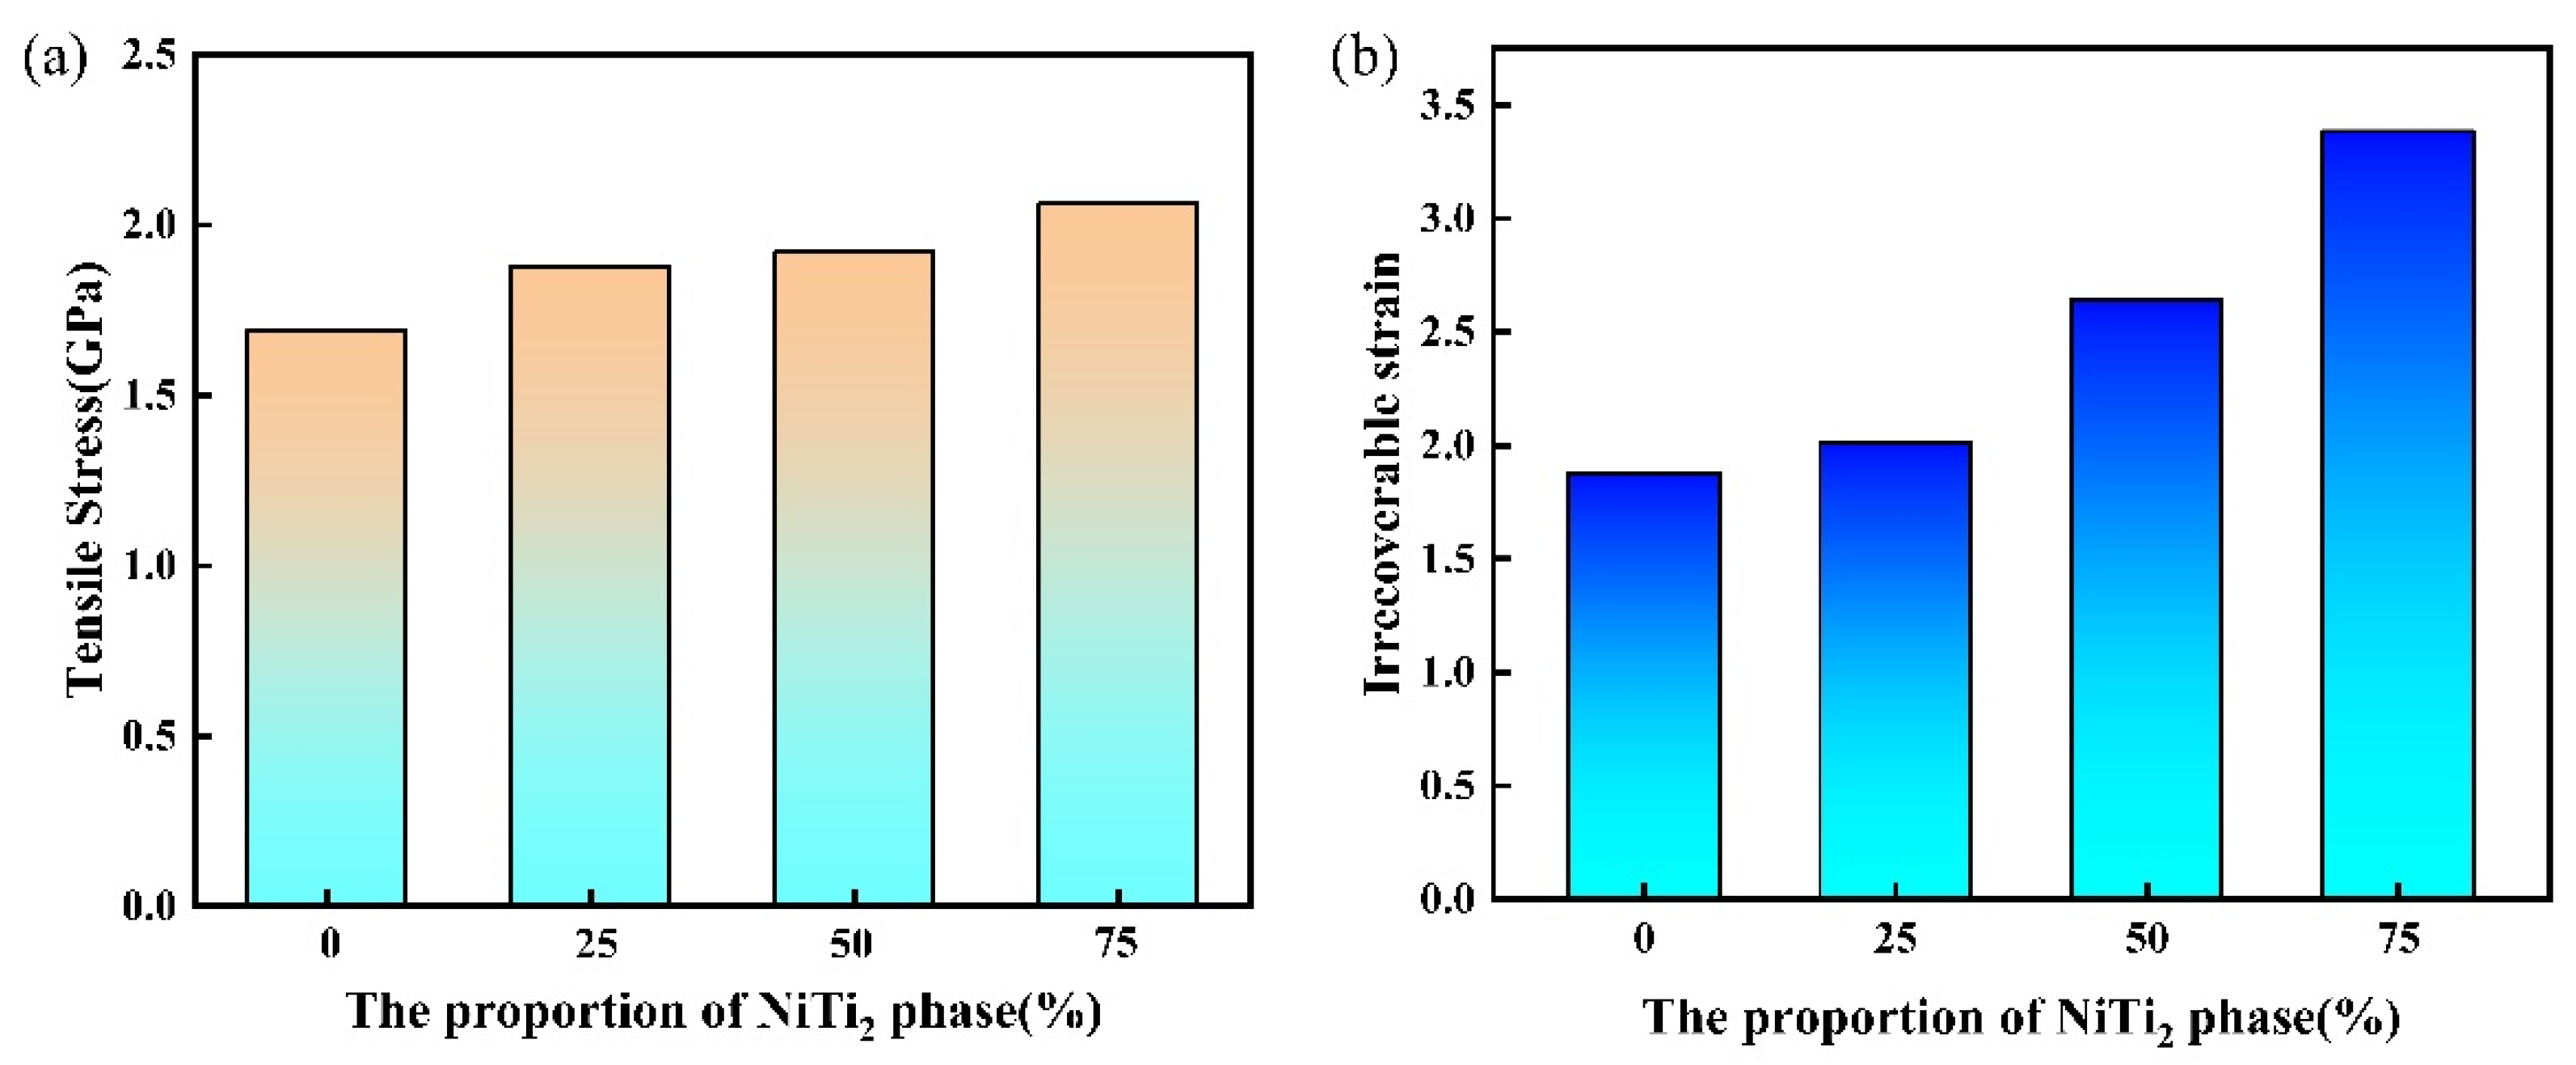
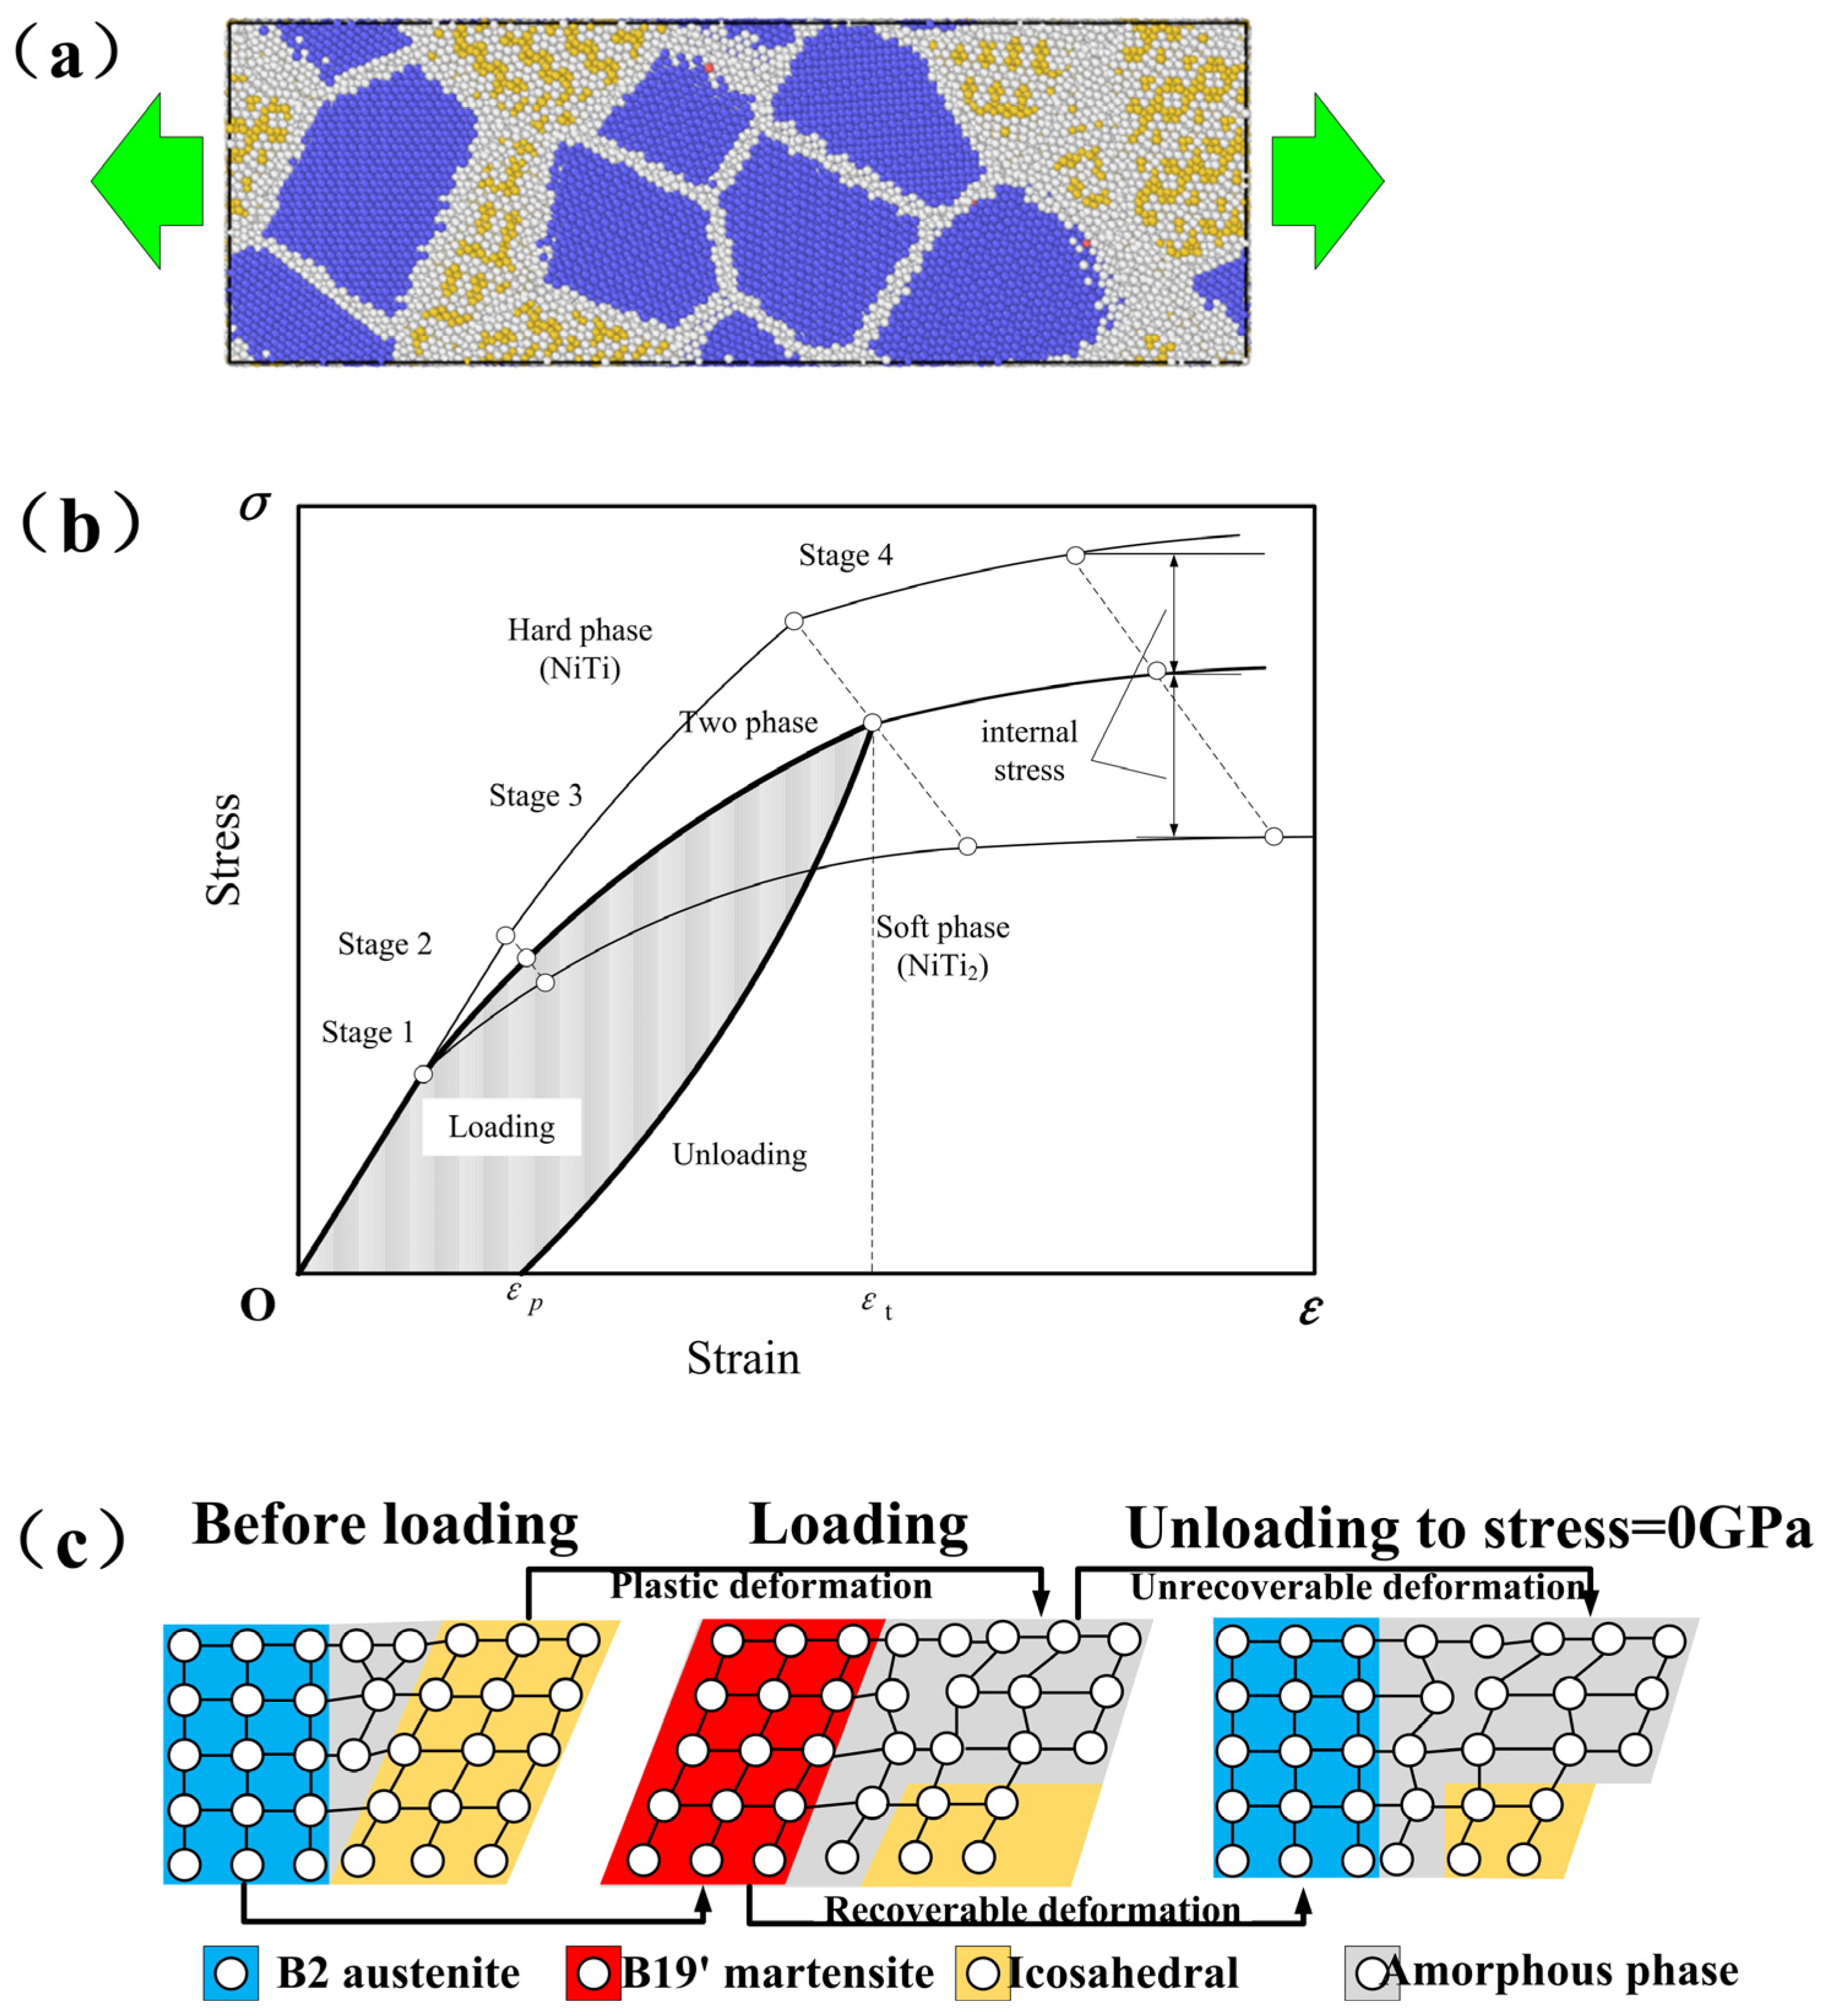
Upon unloading external stress to zero, irrecoverable strain occurs in all models. The NiTi2 model exhibits the highest irrecoverable deformation, which increases as the proportion of the NiTi2 phase in the alloy model rises.
(2)
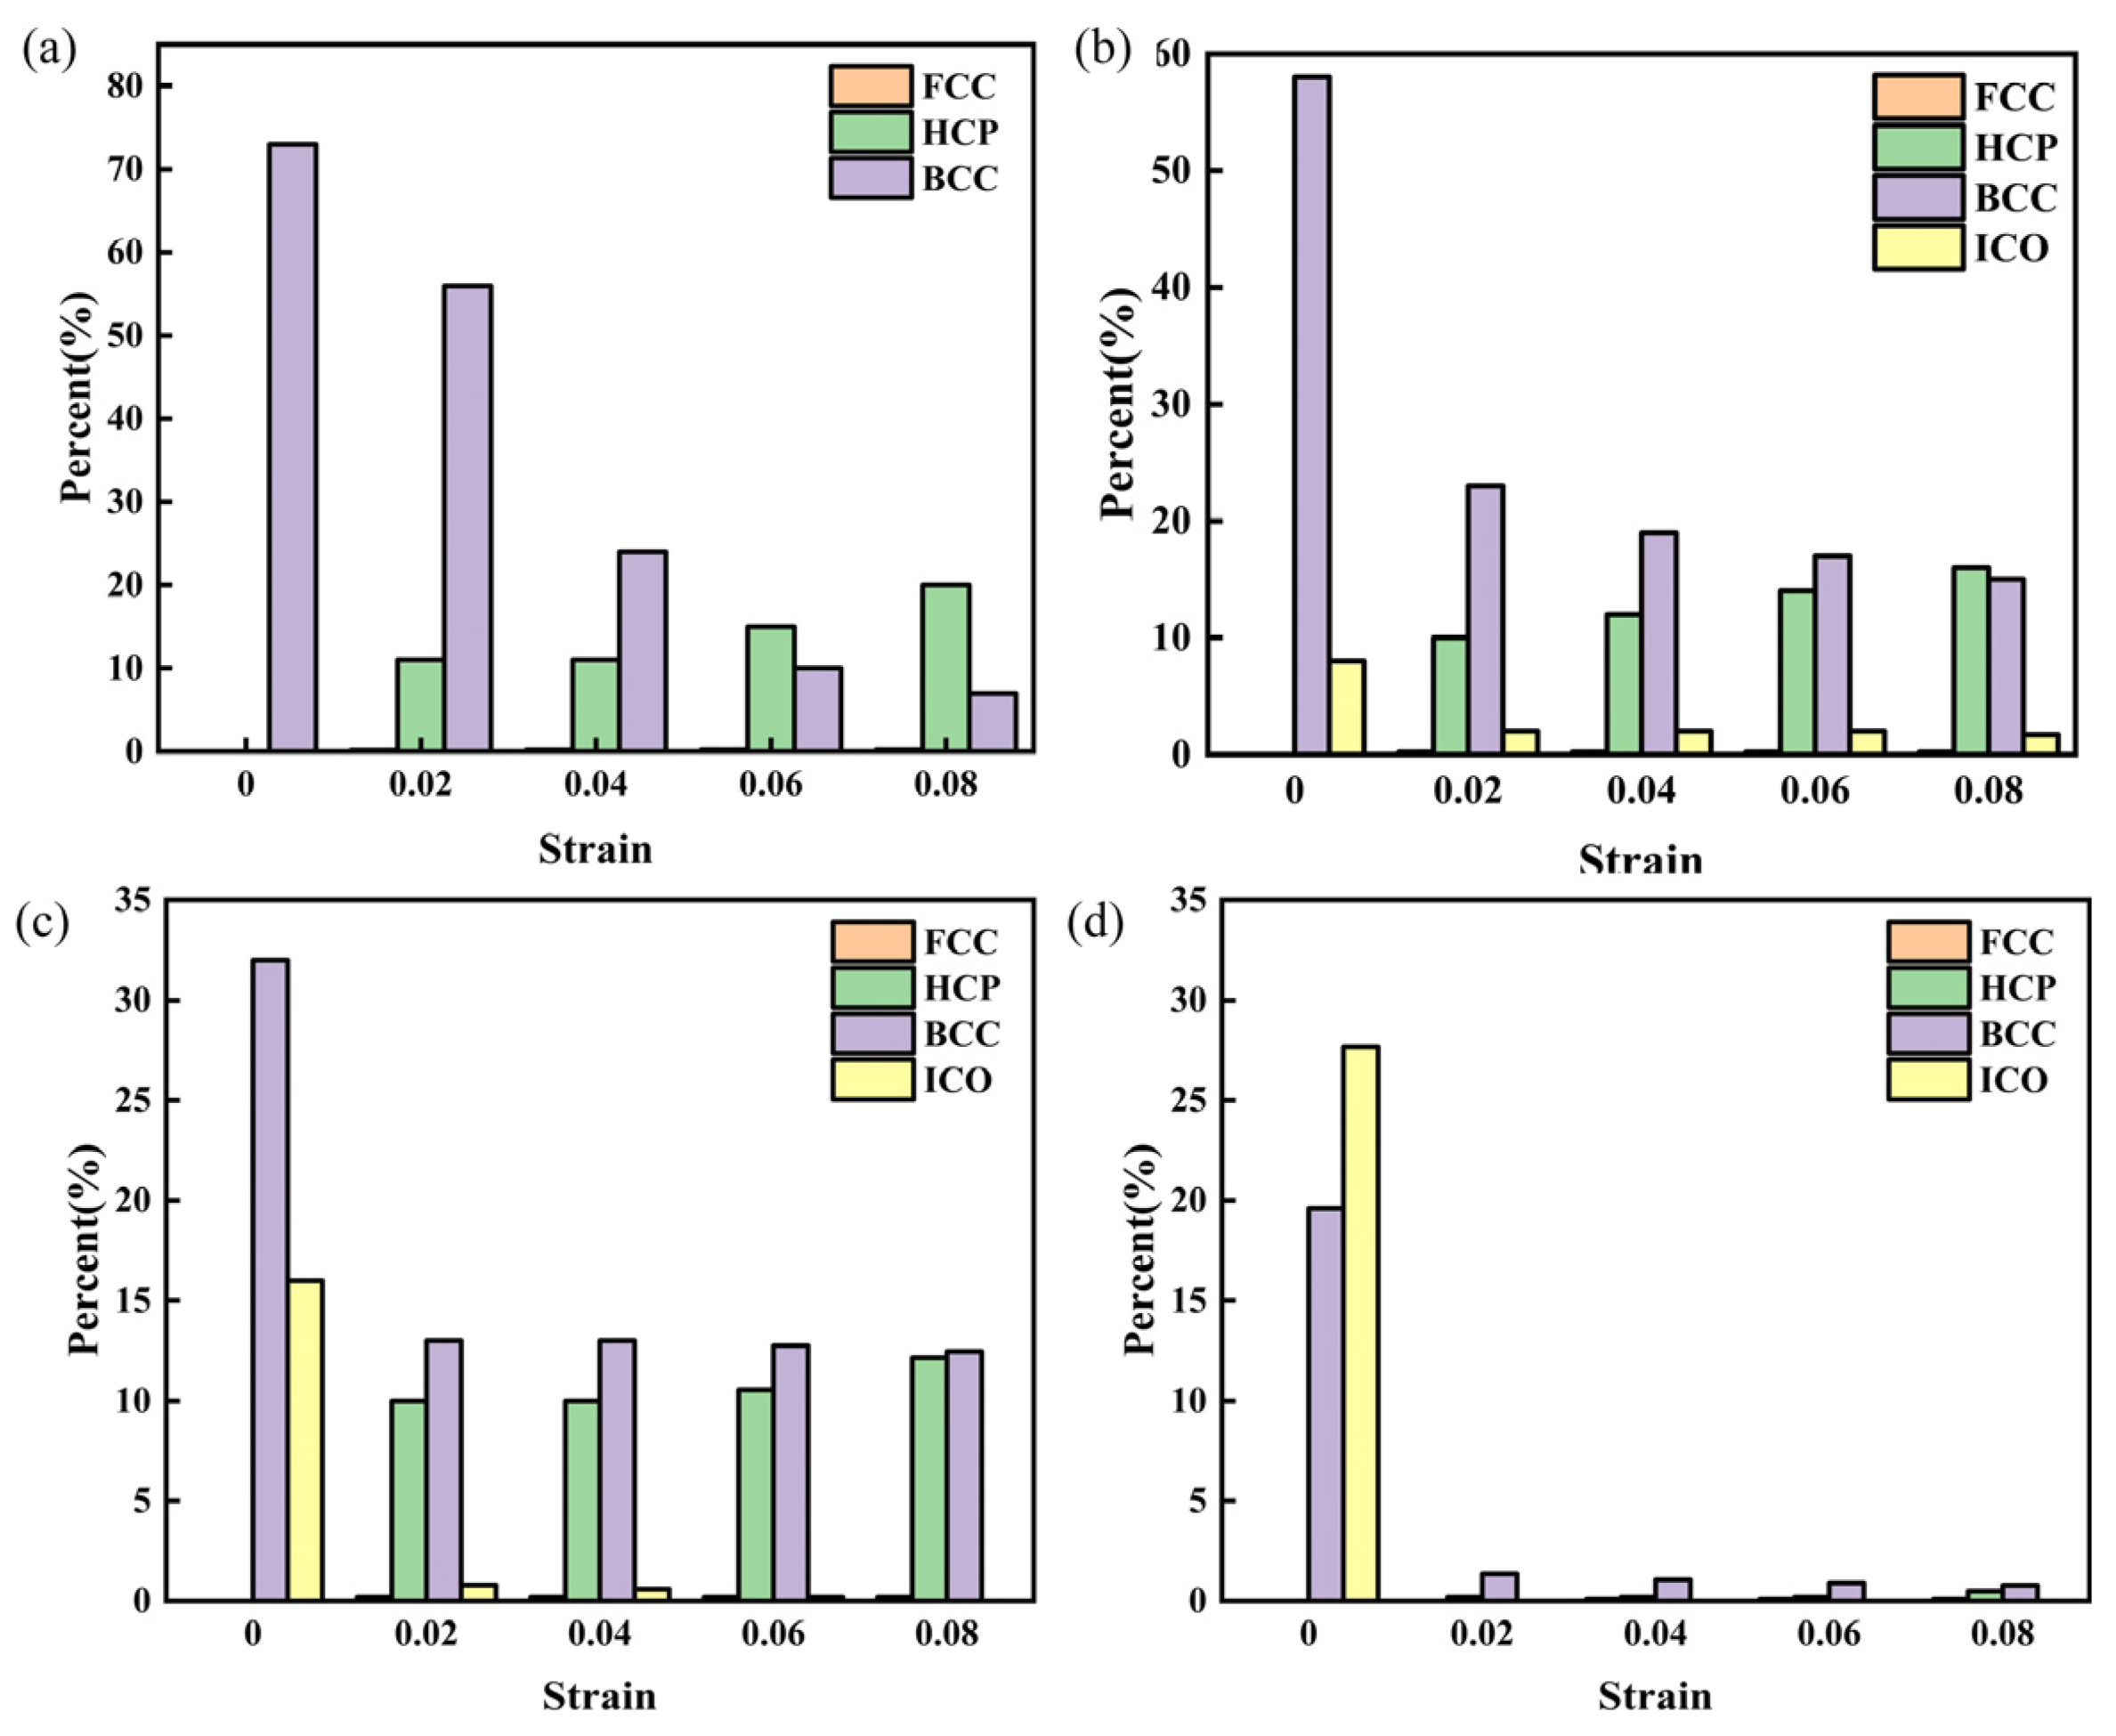
The transformation from the NiTi2 phase to the amorphous phase plays a significant role in the formation of irrecoverable strain. An applied strain of 8% exceeds the elastic strain limit of NiTi2, leading to plastic deformation in the amorphous phase during the later stages of deformation.
(3)
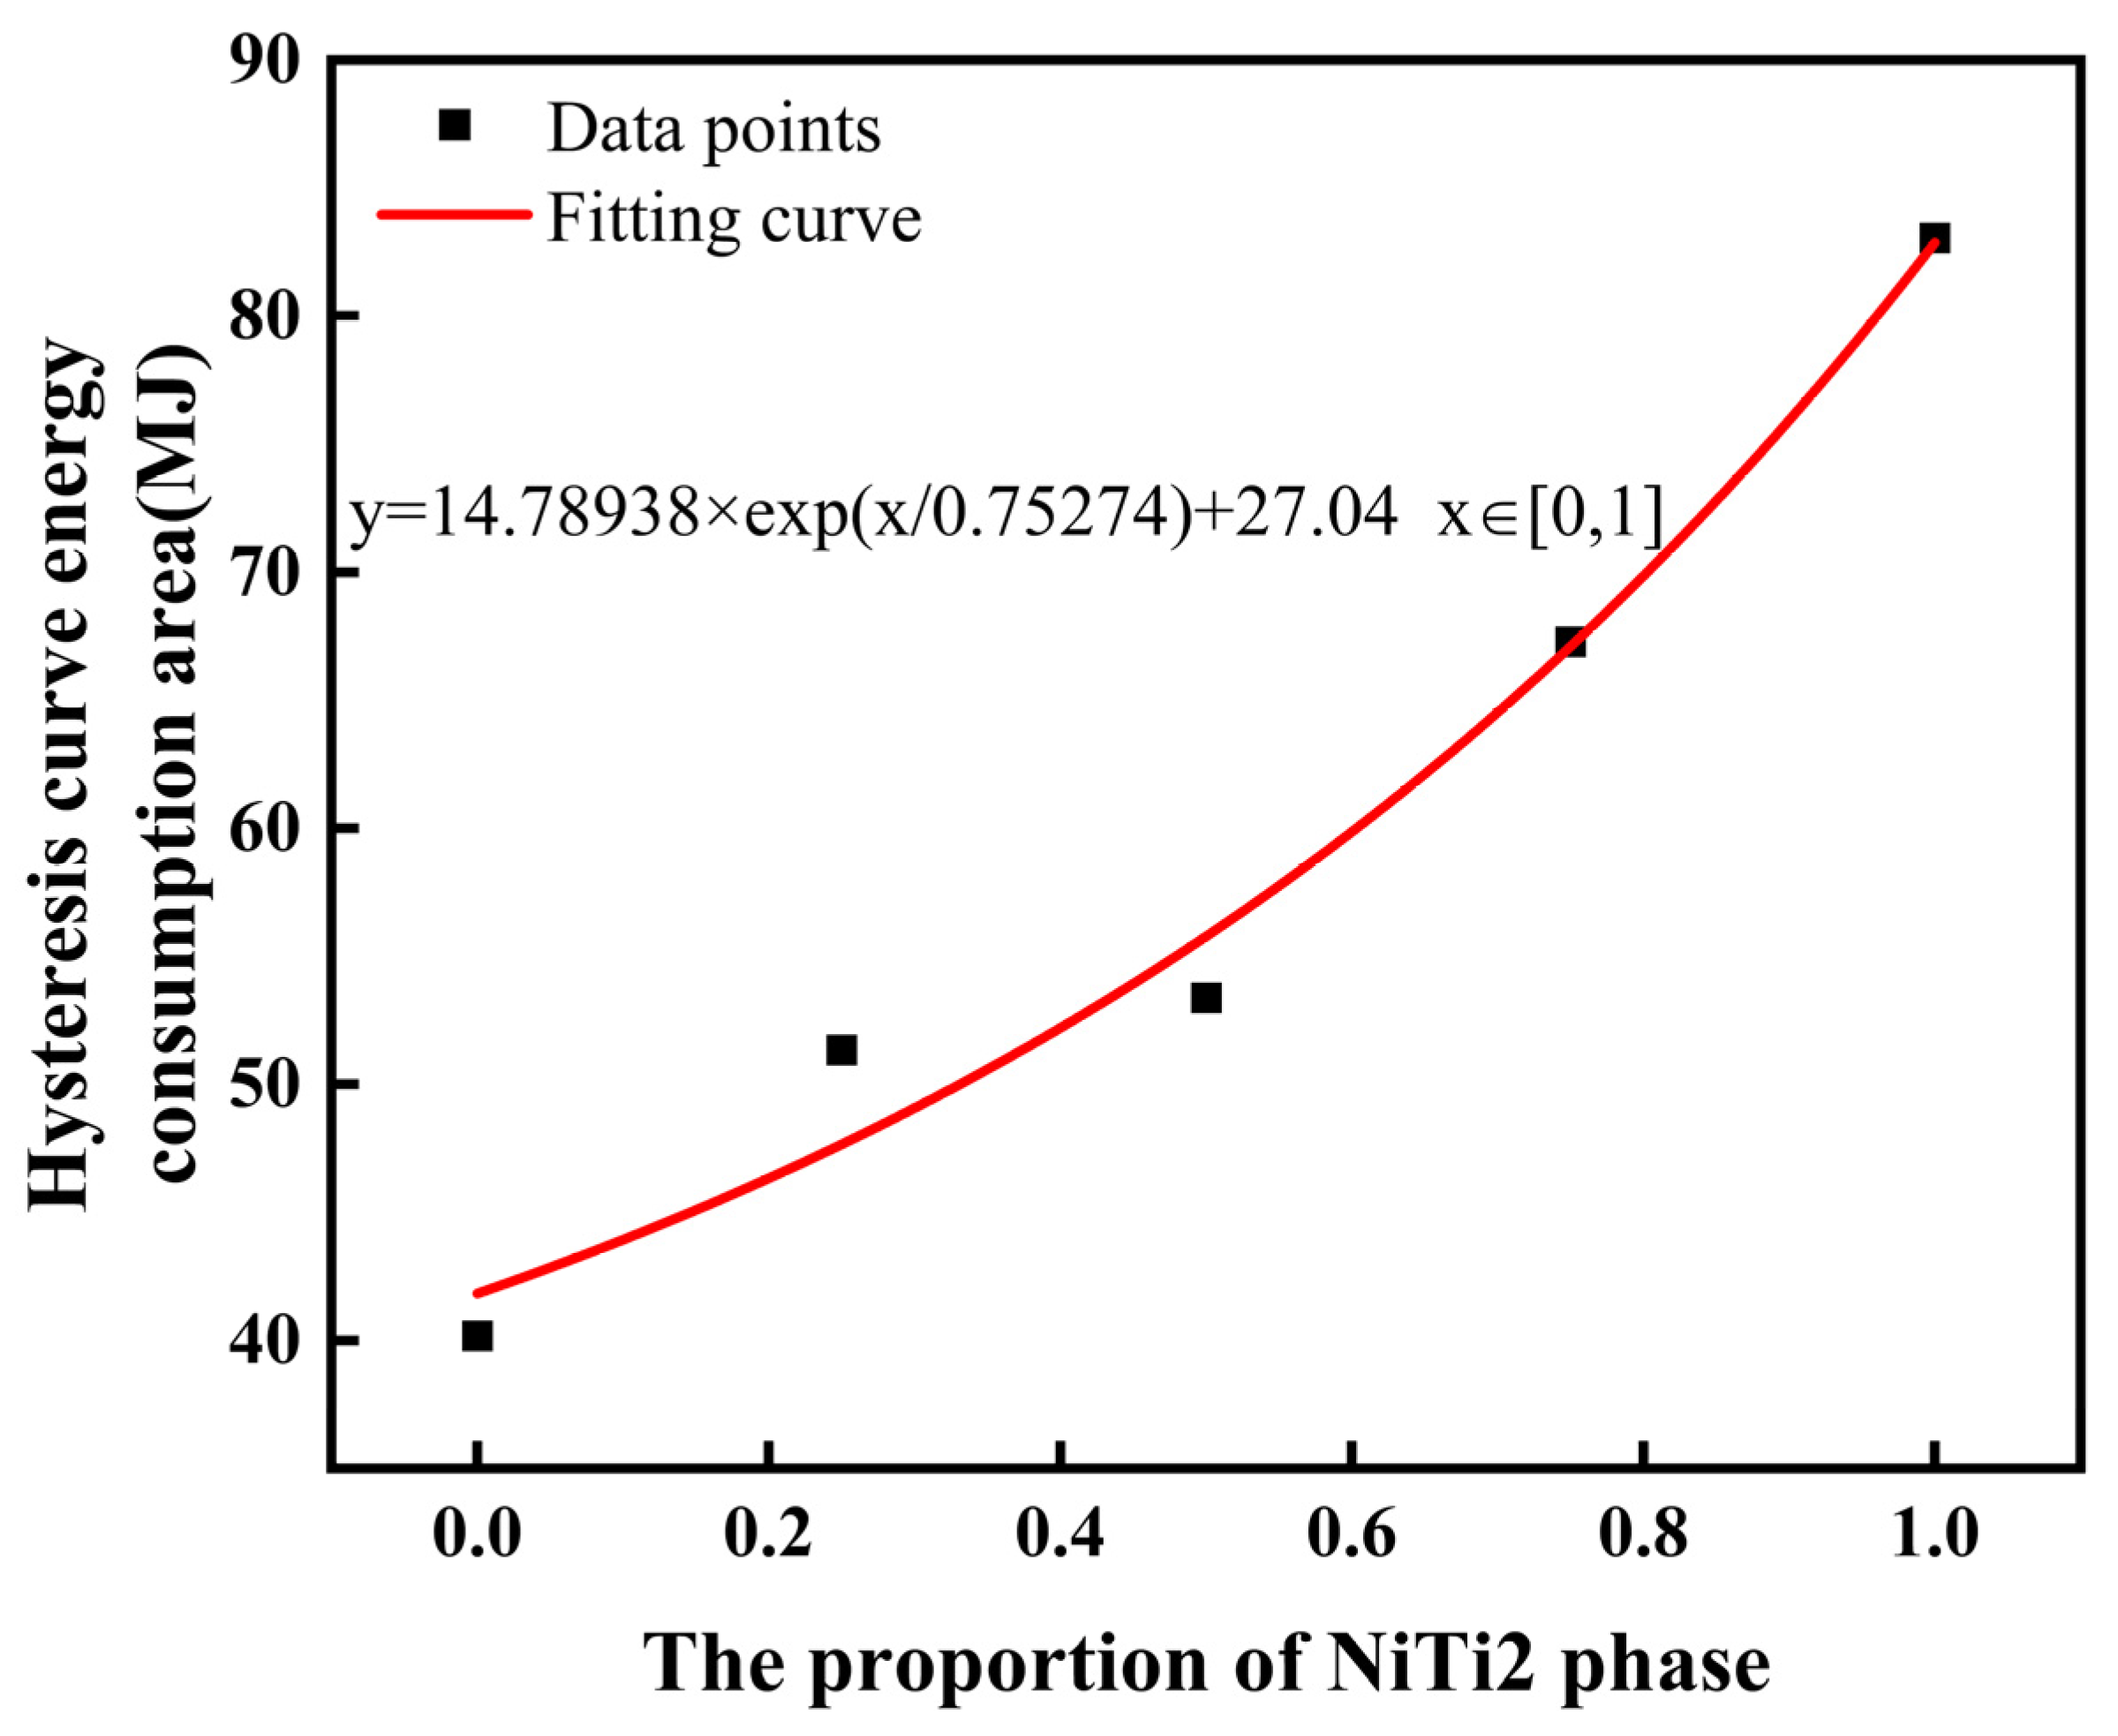
Analysis of the hysteresis curve during tensile unloading reveals that a higher proportion of the NiTi2 phase results in a larger energy consumption area. Exponential fitting of the energy consumption data indicates that the area increases exponentially with the increasing proportion of the NiTi2 phase.

Author Contributions

Conceptualization, J.H. and D.F.; methodology, J.H. and D.F.; software, T.Z.; investigation, H.Z., R.X. and X.S.; data curation, H.Z., R.X. and X.S.; writing—original draft, T.Z. All authors have read and agreed to the published version of the manuscript.

Funding

This research was funded by the Program for Hongliu Distinguished Young Scholars in Lanzhou University of Technology, and the Major Scientific and Technological Project of Gansu Province grant number 22ZD6GA008 and National Natural Science Foundation of China grant number 52175324.

Data Availability Statement

Data will be made available upon request.

Conflicts of Interest

The authors declare that they have no known competing financial interests or personal relationships that could have appeared to influence the work reported in this paper.

References

  1. Sevcikova, J.; Pavkova Goldbergova, M. Biocompatibility of NiTi alloys in the cell behaviour. Biometals 2017, 30, 163–169. [Google Scholar] [CrossRef] [PubMed]
  2. Yang, D.; Lü, X.; Hong, Y.; Xi, T.; Zhang, D. The molecular mechanism for effects of TiN coating on NiTi alloy on endothelial cell function. Biomaterials 2014, 35, 6195–6205. [Google Scholar] [CrossRef] [PubMed]
  3. Yang, D.; Lü, X.; Hong, Y.; Xi, T.; Zhang, D. The molecular mechanism of mediation of adsorbed serum proteins to endothelial cells adhesion and growth on biomaterials. Biomaterials 2013, 34, 5747–5758. [Google Scholar] [CrossRef] [PubMed]
  4. Naser, M.Z.; Chehab, A.I. Materials and design concepts for space-resilient structures. Prog. Aerosp. Sci. 2018, 98, 74–90. [Google Scholar] [CrossRef]
  5. Malik, V.; Srivastava, S.; Gupta, S.; Sharma, V.; Vishnoi, M.; Mamatha, T.G. A novel review on shape memory alloy and their applications in extraterrestrial roving missions. Mater. Today Proc. 2021, 44, 4961–4965. [Google Scholar] [CrossRef]
  6. Shreekrishna, S.; Nachimuthu, R.; Nair, V.S. A review on shape memory alloys and their prominence in automotive technology. J. Intell. Mater. Syst. Struct. 2023, 34, 499–524. [Google Scholar] [CrossRef]
  7. Riccio, A.; Sellitto, A.; Ameduri, S.; Concilio, A.; Arena, M. Shape memory alloys (SMA) for automotive applications and challenges. In Shape Memory Alloy Engineering; Elsevier: Amsterdam, The Netherlands, 2021; pp. 785–808. [Google Scholar] [CrossRef]
  8. Chaudhari, R.; Vora, J.J.; Parikh, D.M. A review on applications of nitinol shape memory alloy. In Recent Advances in Mechanical Infrastructure: Proceedings of ICRAM 2020; Springer: Berlin/Heidelberg, Germany, 2021; pp. 123–132. [Google Scholar] [CrossRef]
  9. Wen, S.; Liu, Y.; Zhou, Y.; Zhao, A.; Yan, C.; Shi, Y. Effect of Ni content on the transformation behavior and mechanical property of NiTi shape memory alloys fabricated by laser powder bed fusion. Opt. Laser Technol. 2021, 134, 106653. [Google Scholar] [CrossRef]
  10. Elahinia, M.; Moghaddam, N.S.; Andani, M.T.; Amerinatanzi, A.; Bimber, B.A.; Hamilton, R.F. Fabrication of NiTi through additive manufacturing: A review. Prog. Mater. Sci. 2016, 83, 630–663. [Google Scholar] [CrossRef]
  11. Jani, J.M.; Leary, M.; Subic, A.; Gibson, M.A. A review of shape memory alloy research, applications and opportunities. Mater. Des. 2014, 56, 1078–1113. [Google Scholar] [CrossRef]
  12. Andani, M.T.; Saedi, S.; Turabi, A.S.; Karamooz, M.R.; Haberland, C.; Karaca, H.E.; Elahinia, M. Mechanical and shape memory properties of porous Ni50. 1Ti49. 9 alloys manufactured by selective laser melting. J. Mech. Behav. Biomed. Mater. 2017, 68, 224–231. [Google Scholar] [CrossRef]
  13. Zhou, Q.; Hayat, M.D.; Chen, G.; Cai, S.; Qu, X.; Tang, H.; Cao, P. Selective electron beam melting of NiTi: Microstructure, phase transformation and mechanical properties. Mater. Sci. Eng. A 2019, 744, 290–298. [Google Scholar] [CrossRef]
  14. Luo, M.; Li, R.; Zheng, D.; Kang, J.; Wu, H.; Deng, S.; Niu, P. Formation mechanism of inherent spatial heterogeneity of microstructure and mechanical properties of NiTi SMA prepared by laser directed energy deposition. Int. J. Extrem. Manuf. 2023, 5, 035005. [Google Scholar] [CrossRef]
  15. Bimber, B.A.; Hamilton, R.F.; Keist, J.; Palmer, T.A. Anisotropic microstructure and superelasticity of additive manufactured NiTi alloy bulk builds using laser directed energy deposition. Mater. Sci. Eng. A 2016, 674, 125–134. [Google Scholar] [CrossRef]
  16. Mosallanejad, M.H.; Niroumand, B.; Aversa, A.; Saboori, A. In-situ alloying in laser-based additive manufacturing processes: A critical review. J. Alloys Compd. 2021, 872, 159567. [Google Scholar] [CrossRef]
  17. Amadi, A.; Mohyaldinn, M.; Ridha, S.; Ola, V. Advancing engineering frontiers with NiTi shape memory alloys: A multifaceted review of properties, fabrication, and application potentials. J. Alloys Compd. 2024, 976, 173227. [Google Scholar] [CrossRef]
  18. Wang, J.; Pan, Z.; Wang, Y.; Wang, L.; Su, L.; Cuiuri, D.; Zhao, Y.; Li, H. Evolution of crystallographic orientation, precipitation, phase transformation and mechanical properties realized by enhancing deposition current for dual-wire arc additive manufactured Ni-rich NiTi alloy. Addit. Manuf. 2020, 34, 101240. [Google Scholar] [CrossRef]
  19. Zeng, Z.; Cong, B.; Oliveira, J.; Ke, W.; Schell, N.; Peng, B.; Qi, Z.; Ge, F.; Zhang, W.; Ao, S. Wire and arc additive manufacturing of a Ni-rich NiTi shape memory alloy: Microstructure and mechanical properties. Addit. Manuf. 2020, 32, 101051. [Google Scholar] [CrossRef]
  20. Resnina, N.; Palani, I.; Belyaev, S.; Prabu, S.M.; Liulchak, P.; Karaseva, U.; Manikandan, M.; Jayachandran, S.; Bryukhanova, V.; Sahu, A.; et al. Structure, martensitic transformations and mechanical behaviour of NiTi shape memory alloy produced by wire arc additive manufacturing. J. Alloys Compd. 2021, 851, 156851. [Google Scholar] [CrossRef]
  21. Liu, Z.; Zhao, D.; Wang, P.; Yan, M.; Yang, C.; Chen, Z.; Lu, J.; Lu, Z. Additive manufacturing of metals: Microstructure evolution and multistage control. J. Mater. Sci. Technol. 2022, 100, 224–236. [Google Scholar] [CrossRef]
  22. Rodrigues, T.A.; Duarte, V.; Avila, J.A.; Santos, T.G.; Miranda, R.; Oliveira, J. Wire and arc additive manufacturing of HSLA steel: Effect of thermal cycles on microstructure and mechanical properties. Addit. Manuf. 2019, 27, 440–450. [Google Scholar] [CrossRef]
  23. Wang, M.; Jiang, S.; Zhang, Y.; Sun, D.; Yan, B. Molecular dynamics investigation on mechanical behaviour and phase transition of nanocrystalline NiTi shape memory alloy containing amorphous surface. Appl. Surf. Sci. 2022, 587, 152871. [Google Scholar] [CrossRef]
  24. Li, G.; Yu, T.; Zhang, N.; Chen, M. The effect of Ni content on phase transformation behavior of NiTi alloys: An atomistic modeling study. Comput. Mater. Sci. 2022, 215, 111804. [Google Scholar] [CrossRef]
  25. Ataollahi, S.; Mahtabi, M.J. Effects of precipitate on the phase transformation of single-crystal NiTi alloy under thermal and mechanical loads: A molecular dynamics study. Mater. Today Commun. 2021, 29, 102859. [Google Scholar] [CrossRef]
  26. Ehrich, H.J.; Dollmann, A.; Grützmacher, P.G.; Gachot, C.; Eder, S.J. Automated identification and tracking of deformation twin structures in molecular dynamics simulations. Comput. Mater. Sci. 2024, 236, 112878. [Google Scholar] [CrossRef]
  27. Fadila, N.; Arkundato, A.; Rohman, L.; Syarifah, R.D.; Shafii, M.A. Effect of chromium concentration addition for stabilizing the crystal structure of iron in liquid bismuth. In AIP Conference Proceedings; AIP Publishing: New York, NY, USA, 2023; Volume 2818. [Google Scholar] [CrossRef]
  28. Chen, X.; Liu, T.; Li, R.; Liu, J.; Zhao, Y. Molecular dynamics simulation on the shape memory effect and superelasticity in NiTi shape memory alloy. Comput. Mater. Sci. 2018, 146, 61–69. [Google Scholar] [CrossRef]
  29. Plummer, G.; Mendelev, M.I.; Lawson, J.W. Molecular dynamics simulations of austenite-martensite interface migration in NiTi alloy. Phys. Rev. Mater. 2022, 6, 123601. [Google Scholar] [CrossRef]
  30. Wang, M.; Jiang, S.; Sun, D.; Zhang, Y.; Yan, B. Molecular dynamics simulation of mechanical behavior and phase transformation of nanocrystalline NiTi shape memory alloy with gradient structure. Comput. Mater. Sci. 2022, 204, 111186. [Google Scholar] [CrossRef]
  31. Chen, J.; Huo, D.; Yeddu, H.K. Molecular dynamics study of phase transformations in NiTi shape memory alloy embedded with precipitates. Mater. Res. Express 2021, 8, 106508. [Google Scholar] [CrossRef]
  32. Mirzaeifar, R.; Gall, K.; Zhu, T.; Yavari, A.; DesRoches, R. Structural transformations in NiTi shape memory alloy nanowires. J. Appl. Phys. 2014, 115, 194307. [Google Scholar] [CrossRef]
  33. Ko, W.S.; Maisel, S.B.; Grabowski, B.; Jeon, J.B.; Neugebauer, J. Atomic scale processes of phase transformations in nanocrystalline NiTi shape-memory alloys. Acta Mater. 2017, 123, 90–101. [Google Scholar] [CrossRef]
  34. Timonova, M.; Thijsse, B.J. Optimizing the MEAM potential for silicon. Model. Simul. Mater. Sci. Eng. 2010, 19, 015003. [Google Scholar] [CrossRef]
  35. Zhang, Y.; Jiang, S.; Wang, M. Atomistic investigation on superelasticity of NiTi shape memory alloy with complex microstructures based on molecular dynamics simulation. Int. J. Plast. 2020, 125, 27–51. [Google Scholar] [CrossRef]
  36. Nargatti, K.; Ahankari, S. Advances in enhancing structural and functional fatigue resistance of superelastic NiTi shape memory alloy: A Review. J. Intell. Mater. Syst. Struct. 2022, 33, 503–531. [Google Scholar] [CrossRef]
  37. Srinivasan, P.; Nicola, L.; Simone, A. Modeling pseudo-elasticity in NiTi: Why the MEAM potential outperforms the EAM-FS potential. Comput. Mater. Sci. 2017, 134, 145–152. [Google Scholar] [CrossRef]
  38. Guo, Y.; Zeng, X.; Chen, H.; Han, T.; Tian, H.; Wang, F. Molecular Dynamics Modeling of the Effect of Nanotwins on the Superelasticity of Single-Crystalline NiTi Alloys. Adv. Mater. Sci. Eng. 2017, 2017, 7427039. [Google Scholar] [CrossRef]
  39. Li, F.; Lannin, J.S. Radial distribution function of amorphous carbon. Phys. Rev. Lett. 1990, 65, 1905. [Google Scholar] [CrossRef]
  40. Oliveira, J.P.; Miranda, R.M.; Fernandes, F.B. Welding and joining of NiTi shape memory alloys: A review. Prog. Mater. Sci. 2017, 88, 412–466. [Google Scholar] [CrossRef]
  41. Song, X.; Huang, J.; Yu, X.; Zhang, J.; Xu, J.; Fan, D. Microstructure transformation and mechanical behavior in NiTi alloys fabricated by dissimilar double wires arc additive manufacturing. J. Mater. Res. Technol. 2024, 33, 9603–9613. [Google Scholar] [CrossRef]
  42. Zhang, D.; Qiu, D.; Gibson, M.A.; Zheng, Y.; Fraser, H.L.; StJohn, D.H.; Easton, M.A. Additive manufacturing of ultrafine-grained high-strength titanium alloys. Nature 2019, 576, 91–95. [Google Scholar] [CrossRef] [PubMed]
  43. Manh, D.N.; Pasturel, A.; Paxton, A.T.; Van Schilfgaarde, M. Structural stability of NiTi2 intermetallic compounds. J. Phys. Condens. Matter 1993, 5, 9087. [Google Scholar] [CrossRef]
  44. Mercier, O.; Melton, K.N.; Gremaud, G.; Hägi, J. Single-crystal elastic constants of the equiatomic NiTi alloy near the martensitic transformation. J. Appl. Phys. 1980, 51, 1833–1834. [Google Scholar] [CrossRef]
  45. Toprek, D.; Belosevic-Cavor, J.; Koteski, V. Ab initio studies of the structural, elastic, electronic and thermal properties of NiTi2 intermetallic. J. Phys. Chem. Solids 2015, 85, 197–205. [Google Scholar] [CrossRef]
  46. Hatcher, N.; Kontsevoi, O.Y.; Freeman, A.J. Role of elastic and shear stabilities in the martensitic transformation path of NiTi. Phys. Rev. B 2009, 80, 144203. [Google Scholar] [CrossRef]
  47. Zhong, Y.; Gall, K.; Zhu, T. Atomistic study of nanotwins in NiTi shape memory alloys. J. Appl. Phys. 2011, 110, 033532. [Google Scholar] [CrossRef]
  48. Sun, Q.; Aslan, A.; Li, M.; Chen, M. Effects of grain size on phase transition behavior of nanocrystalline shape memory alloys. Sci. China Technol. Sci. 2014, 57, 671–679. [Google Scholar] [CrossRef]
  49. Tian, L.; Cheng, Y.-Q.; Shan, Z.-W.; Li, J.; Wang, C.-C.; Han, X.-D.; Sun, J.; Ma, E. Approaching the ideal elastic limit of metallic glasses. Nat. Commun. 2012, 3, 609. [Google Scholar] [CrossRef] [PubMed]
  50. Feng, S.; Qi, L.; Wang, L.; Pan, S.; Ma, M.; Zhang, X.; Li, G.; Liu, R. Atomic structure of shear bands in Cu64Zr36 metallic glasses studied by molecular dynamics simulations. Acta Mater. 2015, 95, 236–243. [Google Scholar] [CrossRef]
Figure 1. Schematic diagram of test equipment. (a) Welding system schematic. (b) Welding system side view.
Metals 15 00411 g001
Figure 2. NiTi and NiTi2 unit cell model.
Metals 15 00411 g002
Figure 3. Different phase scale models. (a) NiTi. (b) NiTi:NiTi2 = 3:1. (c) NiTi:NiTi2 = 1:1. (d) NiTi:NiTi2 = 1:3.
Metals 15 00411 g003
Figure 4. Loading–unloading schematic.
Metals 15 00411 g004
Figure 5. Morphology of nickel–titanium alloy components. (a) Ni:Ti = 8:10. (b) Ni:Ti = 9:10. (c) Ni:Ti = 11:10.
Metals 15 00411 g005
Figure 6. TEM images of different atomic ratios. (a) Ni:Ti = 8:10. (b) Ni:Ti = 9:10. (c) Ni:Ti = 11:10.
Metals 15 00411 g006
Figure 7. TEM image of nickel–titanium alloy sample. (a) TEM image; (b) TEM energy spectrum analysis; (c) Ni element distribution map; (d) Ti element distribution map; (e) selected area diffraction pattern in (a) #1; (f) selected area diffraction pattern in (a) #2.
Metals 15 00411 g007
Figure 8. Compressive stress–strain curves.
Metals 15 00411 g008
Figure 9. Bulk modulus comparison-Adapted from Refs. [44,45,46,47].
Metals 15 00411 g009
Figure 10. Stress–strain curves during compression loading and unloading. (a) NiTi. (b) NiTi:NiTi2 = 3:1. (c) NiTi:NiTi2 = 1:1. (d) NiTi:NiTi2 = 1:3.
Metals 15 00411 g010
Figure 11. Stress–strain curves during compression loading and unloading. (a) Stress value at strain 8%. (b) Unrecoverable deformation at 0 GPa.
Metals 15 00411 g011
Figure 12. Atomic configuration of the model under different loading states.
Metals 15 00411 g012
Figure 13. CNA variation trend during stretching of different models. (a) NiTi. (b) NiTi:NiTi2 = 3:1. (c) NiTi:NiTi2 = 1:1. (d) NiTi:NiTi2 = 1:3.
Metals 15 00411 g013
Figure 14. Model structure and crystal identification results. (a) Model structure. (b) Crystal identification results.
Metals 15 00411 g014
Figure 15. Energy of NiTi2 loading process and changes in crystal type during simulation. (a) Model changes before and after deformation; (b) Changes in structural proportions in the model.
Metals 15 00411 g015
Figure 16. Deformation behavior of the NiTi2 phase. (a) Tensile stress-strain curves; (b) Evolution of atomic local shear strain; (c) Details for the atomic local shear strain after unloading to the stress of 0 GPa (Corresponding to the unloading strain of 5.2% in (b)).
Metals 15 00411 g016
Figure 17. Radial distribution function of NiTi2-simulated loading and unloading process. (a) The RDF curves; (b) Magnification of zone B in (a); (c) Magnification of zone C in (a).
Metals 15 00411 g017
Figure 18. Loading–unloading cycle process. (a) Loading process. (b) Stress–strain curves of two-phase material. (c) Structural changes during the loading–unloading cycle.
Metals 15 00411 g018
Figure 19. Hysteresis loop area.
Metals 15 00411 g019
Table 1. Chemical composition of nickel wire, titanium wire, and titanium alloy substrate.
MaterialMgAlVFeCuSiCNONiTi
Ni wires0.01--0.0150.005-0.093--Bal.-
Ti wires---0.25-0.010.100.030.15-Bal.
Substrate-6.104.00.30--0.080.030.20-Bal.
Table 2. Additive manufacturing process parameters.
ParametersValue
TIG arc current (A)110
Movement speed (mm/min)80
Shielding gas flow (L/min)15
AC current size (A)40
AC frequency (Hz)20
Table 3. TEM image scanning results.
Ti Atomic (%)Ni Atomic (%)
Ni:Ti = 8:10#168.5731.43
#298.971.03
Ni:Ti = 9:10#153.4746.53
#263.2936.41
Ni:Ti = 11:10#147.8452.16
#261.7238.28
Table 4. Compression test results.
Stress (MPa)Strain
Ni:Ti = 8:10116640.19
215000.15
315500.12
Ni:Ti = 9:10110800.41
211150.47
311080.38
Ni:Ti = 11:10114500.12
214000.09
316100.19
Disclaimer/Publisher’s Note: The statements, opinions and data contained in all publications are solely those of the individual author(s) and contributor(s) and not of MDPI and/or the editor(s). MDPI and/or the editor(s) disclaim responsibility for any injury to people or property resulting from any ideas, methods, instructions or products referred to in the content.

