Article

Enhanced Corrosion Protection as a Sustainable Approach for Nickel Using Novel FeL Salen Complex: Electrochemical Investigation and DFT Insights

by
Hoda Abd El-Shafy Shilkamy
1,
Mohamed Salaheldeen
2,3,4,*,
Arcady Zhukov
2,4,
R. A. El-Kasaby
5,6,
Mehran Feizi-Dehnayebi
7,
Mona M. A. Alharas
1,
Hala M. Abo-Dief
8,
Rafat M. El-Khatib
1 and
Ahmed M. Abu-Dief
1,5,*
1
Department of Chemistry, Faculty of Science, Sohag University, Sohag 82524, Egypt
2
Department of Polymers and Advanced Materials, Faculty of Chemistry, University of the Basque Country, UPV/EHU, 20018 San Sebastián, Spain
3
Physics Department, Faculty of Science, Sohag University, Sohag 82524, Egypt
4
Department of Applied Physics I, EIG, Faculty of Engineering, University of the Basque Country, UPV/EHU, 20018 San Sebastián, Spain
5
Department of Chemistry, College of Science, Taibah University, Al-Madinah Al-Munawarah 30002, Saudi Arabia
6
Chemistry Department, Women’s College for Arts Science and Education, Ain Shams University, Cairo 11566, Egypt
7
Department of Organic Chemistry, Faculty of Chemistry, Alzahra University, Tehran 1993893973, Iran
8
Department of Science and Technology, University College-Ranyah, Taif University, P.O. Box 11099, Taif 21944, Saudi Arabia
*
Authors to whom correspondence should be addressed.
Metals 2025, 15(4), 403; https://doi.org/10.3390/met15040403
Submission received: 21 February 2025 / Revised: 21 March 2025 / Accepted: 30 March 2025 / Published: 3 April 2025

Abstract

A novel tera-dentate salen ligand and its Fe(III) complex was synthesized and characterized via several spectroscopic and physicochemical techniques. The corrosion rate inhibition of nickel and its alloys inspired the utilization of the L ligand and its FeL complex as vital and eco-friendly inhibitors. To assess their effectiveness, both Tafel plot analysis and electrochemical impedance spectroscopy were employed to examine the electrochemical properties of L and the FeL complex. The results show that corrosion current density (Icorr) steadily drops when the additive concentration is increased, but the inhibition efficiency increases. It has been observed that the efficiency of inhibition rises with temperature, particularly at high temperatures (55 °C) when 1 × 10⁻³ M of L and FeL are present as additives, with η = 90.5% and 92.7%, respectively. Additionally, the findings propose that the adsorption mechanism of both L and FeL additive reptiles follows the Langmuir design isotherm. Electrochemical impedance spectroscopy has also verified these findings. DFT calculations were employed to prove the structure of the investigated FeL complex and its activity as a corrosion inhibitor.

1. Introduction

Essential components of the structural makeup of many materials used in domestic and industrial equipment are metals and their alloys. As these metallic elements come into contact with various harsh conditions, corrosion is a highly important problem in both industry and residential buildings. Numerous direct and indirect costs to industry and humanity are caused by corrosion. One of the most popular ways to stop corrosion is to employ artificial and environmentally friendly corrosion inhibitors in acidic environments. In an acidic solution, many organic compounds with heteroatoms such as N, P, S and X, as well functional groups made of heteroatoms, operate as corrosion inhibitors (CIs). By creating an insulating barrier on the metal, chemical and organic corrosion inhibitors reduce the corrosive action of inorganic acids. For industrial purposes, one of the most crucial materials is nickel and alloys containing nickel. Numerous studies have examined the corrosion of nickel in aqueous electrolytes, driven by the significant technical value of Ni-containing alloys like stainless steel and other alloys faced with corrosion [1]. In many industrial operations, unwanted scale and rust are pickled using acid solutions. Owing to its anti-scaling properties, sulfuric acid is frequently employed for cleansing metals and their alloys in a variety of baths for pickling. Despite the widespread belief that nickel is a “metal that corrodes easily” in harsh environments, it nonetheless corrodes significantly in neutral or mineral acidic environments [2]. Among the best methods to lessen metal corrosion is the use of utilize inhibitors. Interactions between the metal and inhibitor change the properties of the metal’s surface and make it more resistant to severe environments. It is widely recognized that organic matter can prevent the metal from becoming rusted. A great deal of investigation has been done on how different chemicals and inorganic enhancements can impede the action of nickel and its alloys in acidic surroundings [3,4].
Constituents that contain heteroatoms and specific organic compounds, particularly those enriched with phosphorus, nitrogen, sulfur, and oxygen, exhibit remarkable efficacy as corrosion inhibitors [1]. Notably, Schiff bases distinguish themselves in this regard due to the presence of an azomethine group along with sulfur and/or oxygen atoms, all contributing to their potent inhibitory properties, which are further enhanced by the electronegative nature of nitrogen. These compounds work by the particularity of the metal surface’s interaction with the structural categories. Therefore, understanding the interactions that occur between inhibitor molecules and metal surfaces is crucial to developing novel and powerful corrosion inhibitors. Tetradentate dibasic chelating Schiff bases are very good at protecting against corrosion since they have multiple aromatic systems and two imine groups. In addition to this, certain sorts of chemicals have antimicrobial qualities. Because of their low toxicity, they are environmentally friendly inhibitors. These compounds typically attach to metal surfaces and start working [5,6,7,8].
The first stage of an inhibitor’s mechanisms of action in harsh acid exposure environments has been historically speculated about. The phenomenon of an inhibitor’s adsorption on a metal substrate is crucial for understanding how inhibitors operate. This process is governed by various factors such as the molecular charge distribution, the nature of strong electrolytes present, the types of bonds within the organic compound, and the primary interactions that occur at the interface between the organic inhibitors and the metal surface.
Reactive centers such as N atoms and aromatic rings with delocalized p-electron systems can help the pharmaceutical compounds under investigation adsorb onto metal surfaces. These compounds are non-toxic, inexpensive, as well as environmentally benign, and they are utilized in treating hypertension diseases. Additionally, because of their huge molecular weights, they can probably successfully cover a larger portion of the metal’s surface area via adsorption, halting corrosion.
In addition to having an inhibitory effect, substances with heteroatoms such as phosphorus, oxygen, nitrogen, and sulfur also adsorb onto the surface of metals. The nucleophile cores of inhibitor compounds are heteroatoms with unbound electron pairs, or π-electrons, which can easily form bonds. The atoms on the outermost layer of the metal behave electrophilically due to its negative charge, which makes adsorption easier. For example, it has been shown that nitrogen-containing substances exhibit a strong tendency to adsorb onto the negatively charged areas of iron surfaces in acidic conditions; contrarily, compounds with S mainly chemisorb on the anodic regions [9,10].
A significant percentage of inhibitor compounds are hazardous to both human health and their surroundings, despite the fact that some have shown clear anticorrosive potential. Globally, there are ongoing worries regarding safeguarding and the environmental effects of corrosion inhibitors used in different industrial contexts.
Nowadays, researchers are working on alternative, environmentally friendly corrosion inhibitors, such as imine and amino acid combinations, organic compounds [11], and rare earth elements [12].
An example of good inhibitors is amino acids, as they are soluble in aqueous media, safe, biodegradable, and reasonably priced. The body of research on amino acids’ ability to prevent metal corrosion is growing [13,14,15,16,17,18,19]. Among the most plausible candidates is cysteine (HSCH2CHNH2COOH), as it possesses three groups: a carboxyl group (-COOH), an amino group (-NH2), and a thiol group (-SH).
The current study aims to investigate the suppression of nickel corrosion in acidic media using imine ligand and its FeL complex to provide an appropriate mechanism for inhibitions through the use of ac impedance spectroscopy as well potentiodynamic polarization. Furthermore, Ni’s charge–discharge processes have been investigated both with and without inhibitors. Studies on potentiodynamic polarization show that these substances provide good protection in 0.5 M H2SO4. SEM and EDAX examinations were used to further investigate the inhibition caused by these chemicals as an occasion of metal surface adsorption. The electrochemical results have been supported by the calculation of specific quantum chemical parameters. DFT insights were applied to confirm the inhibition activity of the compounds under inspection.

2. Experimental

2.1. Reagents

No additional purifying procedures were required because all of the chemicals and solvents utilized in the investigation were of commercial reagent grade (5-bromosalicyldehyde and 3,4 diaminobenzophenone). The initial materials secured from Sigma-Aldrich included metal compounds like iron (III) nitrate nonahydrate, denoted as Fe(NO3)3·9H2O, which signifies an iron salt with three nitrate ions and nine molecules of water. Furthermore, the list of acquired substances features high-quality organic solvents suitable for spectroscopic applications, such as ethanol, glacial acetic acid, and concentrated hydrochloric acid. Sigma-Aldrich provided 99.9% of the alcohol, piperidine, and acetone.

2.2. Synthesis of L Imine Ligand

The condensation procedure, which included the following steps, produced the tetra-dentate L imine ligand (see Scheme 1). Here 5 millimoles (1.06 g) of 3,4-diaminobenzophenone were mixed with 10 millimoles (2.01 g) of 5-bromosalicylaldehyde, which had been previously dissolved in 100 milliliters of ethanol, to form an alcoholic solution. Subsequently, the reaction concoctions underwent reflux for a duration of two hours at a consistent temperature of 85 degrees Celsius, with persistent agitation throughout the process. After that, it was left to cool until a yellow precipitate developed. TLC was used to track the completion of the reaction mixture (Hexane: Ethyl Acetate) (6:4). After filtering and drying over anhydrous CaCl2, the isolated products were cleaned with ethanol.
1H NMR (Figure 1 and Figure S2), (δ, ppm), in DMSO-d6: δ = 6.21 (d, 2H, H-6,6*), 6.98 (d, 2H, H-7,7*), 7.03 (t, 2H, H-1,1*), 7.51 (d, 1H, H-5), 7.56 (t, 1H, H-3,), 7.63 (s, 2H, H-8,8*), 8.08 (s, 2H, H-4,4*), 12.04, 12.70 (s, 2H/-OH); 9.02 and 8.91 ppm (s, 2CH=N).
13C NMR for L (Figure S1), δ = 115.8 (Cq), 118.0 (CH), 120.6 (Cq), 123.0 (CH), 124.9 (CH), 128.2 (CH), 129.9 (CH), 130.1 (CH), 132.2 (CH), 133.7 (CH), 135.5 (CH), 137.6 (Cq), 146.4 (Cq), 150.4 (Cq), 165.8 (Cq), 163.7 (CH=N), 187.0 (C=O) ppm.

2.3. Preparation of LFe Imine Complex

A standard procedure was used to obtain the Fe (III) imine complex. When 10 mmol of Fe(NO3)3·9H2O (4.04 g) metal salt was dissolved in an aqueous ethanolic mixture and 10 mmol of L imine ligand (5.78 g) was dissolved in ethanol, a molar ratio of 1:1 was noted. An hour of refluxing at 85 °C was followed by the addition of a piperidine drop. After the solvent evaporated, the precipitated material was filtered out, vacuum-dried, and extensively cleaned with ethanol to eliminate any last unreacted initial ingredients. The complex’s color was bright dark brown about 30 min later (Scheme 1).
We attempted to obtain single crystals of the imine ligand L and its FeL complex using various solvent systems; however, we faced challenges in growing diffraction-quality crystals. Despite multiple trials with different solvent combinations and slow evaporation techniques, the crystals obtained were not suitable for use in X-ray diffraction studies.

2.4. Equipments

All the physical measurements and conditions that were used are recorded in the supporting documentation (Part 1). Individual requirements were typed in the Section 3.

2.5. Stoichiometry and Formation Constants of Complexes in Solution

Job’s method (mole ratio and continuous fluctuation) was used to evaluate the stoichiometric ratio and stability of complexes in solution [20,21,22]. After combining solutions M and L and allowing them to settle, the absorbance was recorded for each solution, and then they were schemed against either ([L]/[M]) or ([L]/[L] + [M]). The following relation is frequently used to obtain the complexes’ formation constants (Kf) via the spectrophotometric process [23]:
K f = A / A m ( 1 A / A m ) 2 C
where [C] is the metal’s molar concentration, Am is the greatest absorbance for absorbance peak, and [A] is the absorbance values along either side of randomly assigned absorption peaks. Furthermore, the following equation ΔG = −RT ln Kf (at 25 °C) serves to calculate ΔG* values, which represent the free energy changes under standard conditions. This formula aids in understanding the energetic aspects of a chemical reaction and its spontaneity, where Kf, R, and T stand for the formation constant, gas constant, and temperature in Kelvin, respectively.

2.6. Materials and Methods Utilized in Corrosion Inhibition

The materials and procedures used for corrosion are represented in detail in the Supplementary Data [24]. Charge–discharge processes of Ni in 0.5 M H2SO4 solution in the presence and absence of different concentrations of inhibitors were conducted utilizing the Galvanostatic charge–discharge technique at applied different current densities (±1, ±3, ±5, ±10, ±15, ±20, ±30 mA·cm−2).

2.7. Computational Approach

The geometrical shapes of the molecules of the ligand (L) and its Fe(III) complex were optimized through density functional theory (DFT) calculations. The B3LYP hybrid functional, combined with the 6-311g(d,p) basis set, was employed for the non-metal atoms (C, O, H, Br, and N), while the LANL2DZ basis set was applied to the Fe3⁺ ion. Frontier molecular orbital (FMO) electronic density plots were generated and visualized using GaussView 6.0 software, Wallingford, Connecticut, USA. Computational analyses were conducted using the Gaussian 09W software package, Wallingford, CT, USA [25]. A comprehensive investigation into the electronic properties and potential active sites of the ligand and its Fe (III) complex was conducted. This analysis included molecular electrostatic potential (MEP) surface mapping and the evaluation of quantum chemical reactivity parameters. Moreover, the study investigated the chemical responsiveness and toughness against corrosion of the compounds by analyzing their HOMO and LUMO energy surfaces. To validate these energy levels, the computation of the Density of States (DOS) spectrum was also performed.

3. Results and Discussion

3.1. Physicochemical Properties of the Prepared L Imine Ligand and Its Fe (III) Complex

3.1.1. NMR and IR of the Investigated Imine Ligand and Its FeL the Complex

The identification of compounds was validated by the use of NMR spectroscopy. 1H NMR spectra (Figure 1) and 1H NMR (d, ppm) of the imine L ligand in DMSO-d6.
The nuclear magnetic resonance spectrum of the processed L imine ligand (Figure 1 and Figure S2) is recorded in the Section 2. The nuclear magnetic resonance spectrum of the L imine ligand exhibited singlet signals at δ = 12.04 and 12.74, which are assigned to the two phenolic -OH groups. The signals related to the two azomethine protons (CH=N) were found at δ = 8.91 and 9.02 ppm [26,27]. Furthermore, for aromatic CH, it displayed multiplet signals of eight protons around 6.21–8.08 ppm.
L imine ligand’s 13C NMR spectra show a signal at 163.7 ppm for the CH=N and 187.0 ppm for (C=O). Additionally, the signals that show up in the range of 115.8–155.8 ppm are associated with the phenyl carbons (Figure S1).
In KBr pellets, the infrared spectra of L and its complex were discovered to range from 400 to 4000 cm−1. The synthesis of the ligand and the metal complex can be verified by closely comparing the infrared spectra of the two compounds. These ensembles offer vital data concerning the arrangement of the practical groups attached to the metal atoms. The characteristic infrared spectra of the L ligand and its metal compound, along with their respective identifications, are shown in Figure S3. The many bands that result from CH=N and OH reveal information about the structure of the ligand and how it interacts with the metal. The stretching vibration of C=N is the source of the band seen in the L ligand at 1617 cm−1. During complexation, this band moves to a lower frequency (1607). The shift in this band unequivocally demonstrates that azomethine’s nitrogen atoms aid in the creation of metal chelates [28,29].
This is supported by the development of a band at 445 cm−1, which is the stretching vibration of the M-N bond. Bands at 554 cm−1 represent the stretching vibration of M–O [30]. Free OH stretching vibrations are the cause of the 3438 cm−1 band in the ligand spectra. According to the elemental analysis findings, this musical ensemble, frequently referred to as the υ(OH) stretching vibration of crystalline H2O molecules, exhibits a notable shift to 3422 cm−1. The emergence of a characteristic peak at 886 cm−1 (OH rocking mode) within the synthesized compound suggests the involvement of coordinated water molecules. Upon the process of coordination, the absorption band associated with the metal ion and phenolic oxygen atoms moves towards lower energy levels, reaching 1246 cm−1. This transition implies that these entities are participating in a coordinative bond within the complex. Additionally, the presence of the L imine ligand is discernible through its absorption pattern in the lower frequency range of the spectrum, located at 1276 cm−1, which may be caused by the stretching vibration of the phenolic group (C–O).

3.1.2. Elemental Analyses and Conductivity Measurement Studies

According to Scheme 1, the L mine ligand functions as a tetra-dentate and forms complexes with Fe (III) ions at a metal to ligand ratio of 1:1. Table 1 describes the generated imine ligand along with the data derived from the elemental analysis of its combinations. At room temperature, the resulting complex is pigmented, rigid, and robust, and it possesses a high degree of stability and is not hydrophilic. Using DMF as a solvent, the molar conductance of the prepared FeL complex was measured at room temperature (Table 1). The value of molar conductance at room temperature of the LFe chelate is 10.75 Ω−1 cm2 mol−1, which could be attributed to its non-electrolytic character [31].

3.1.3. Electronic Spectrum

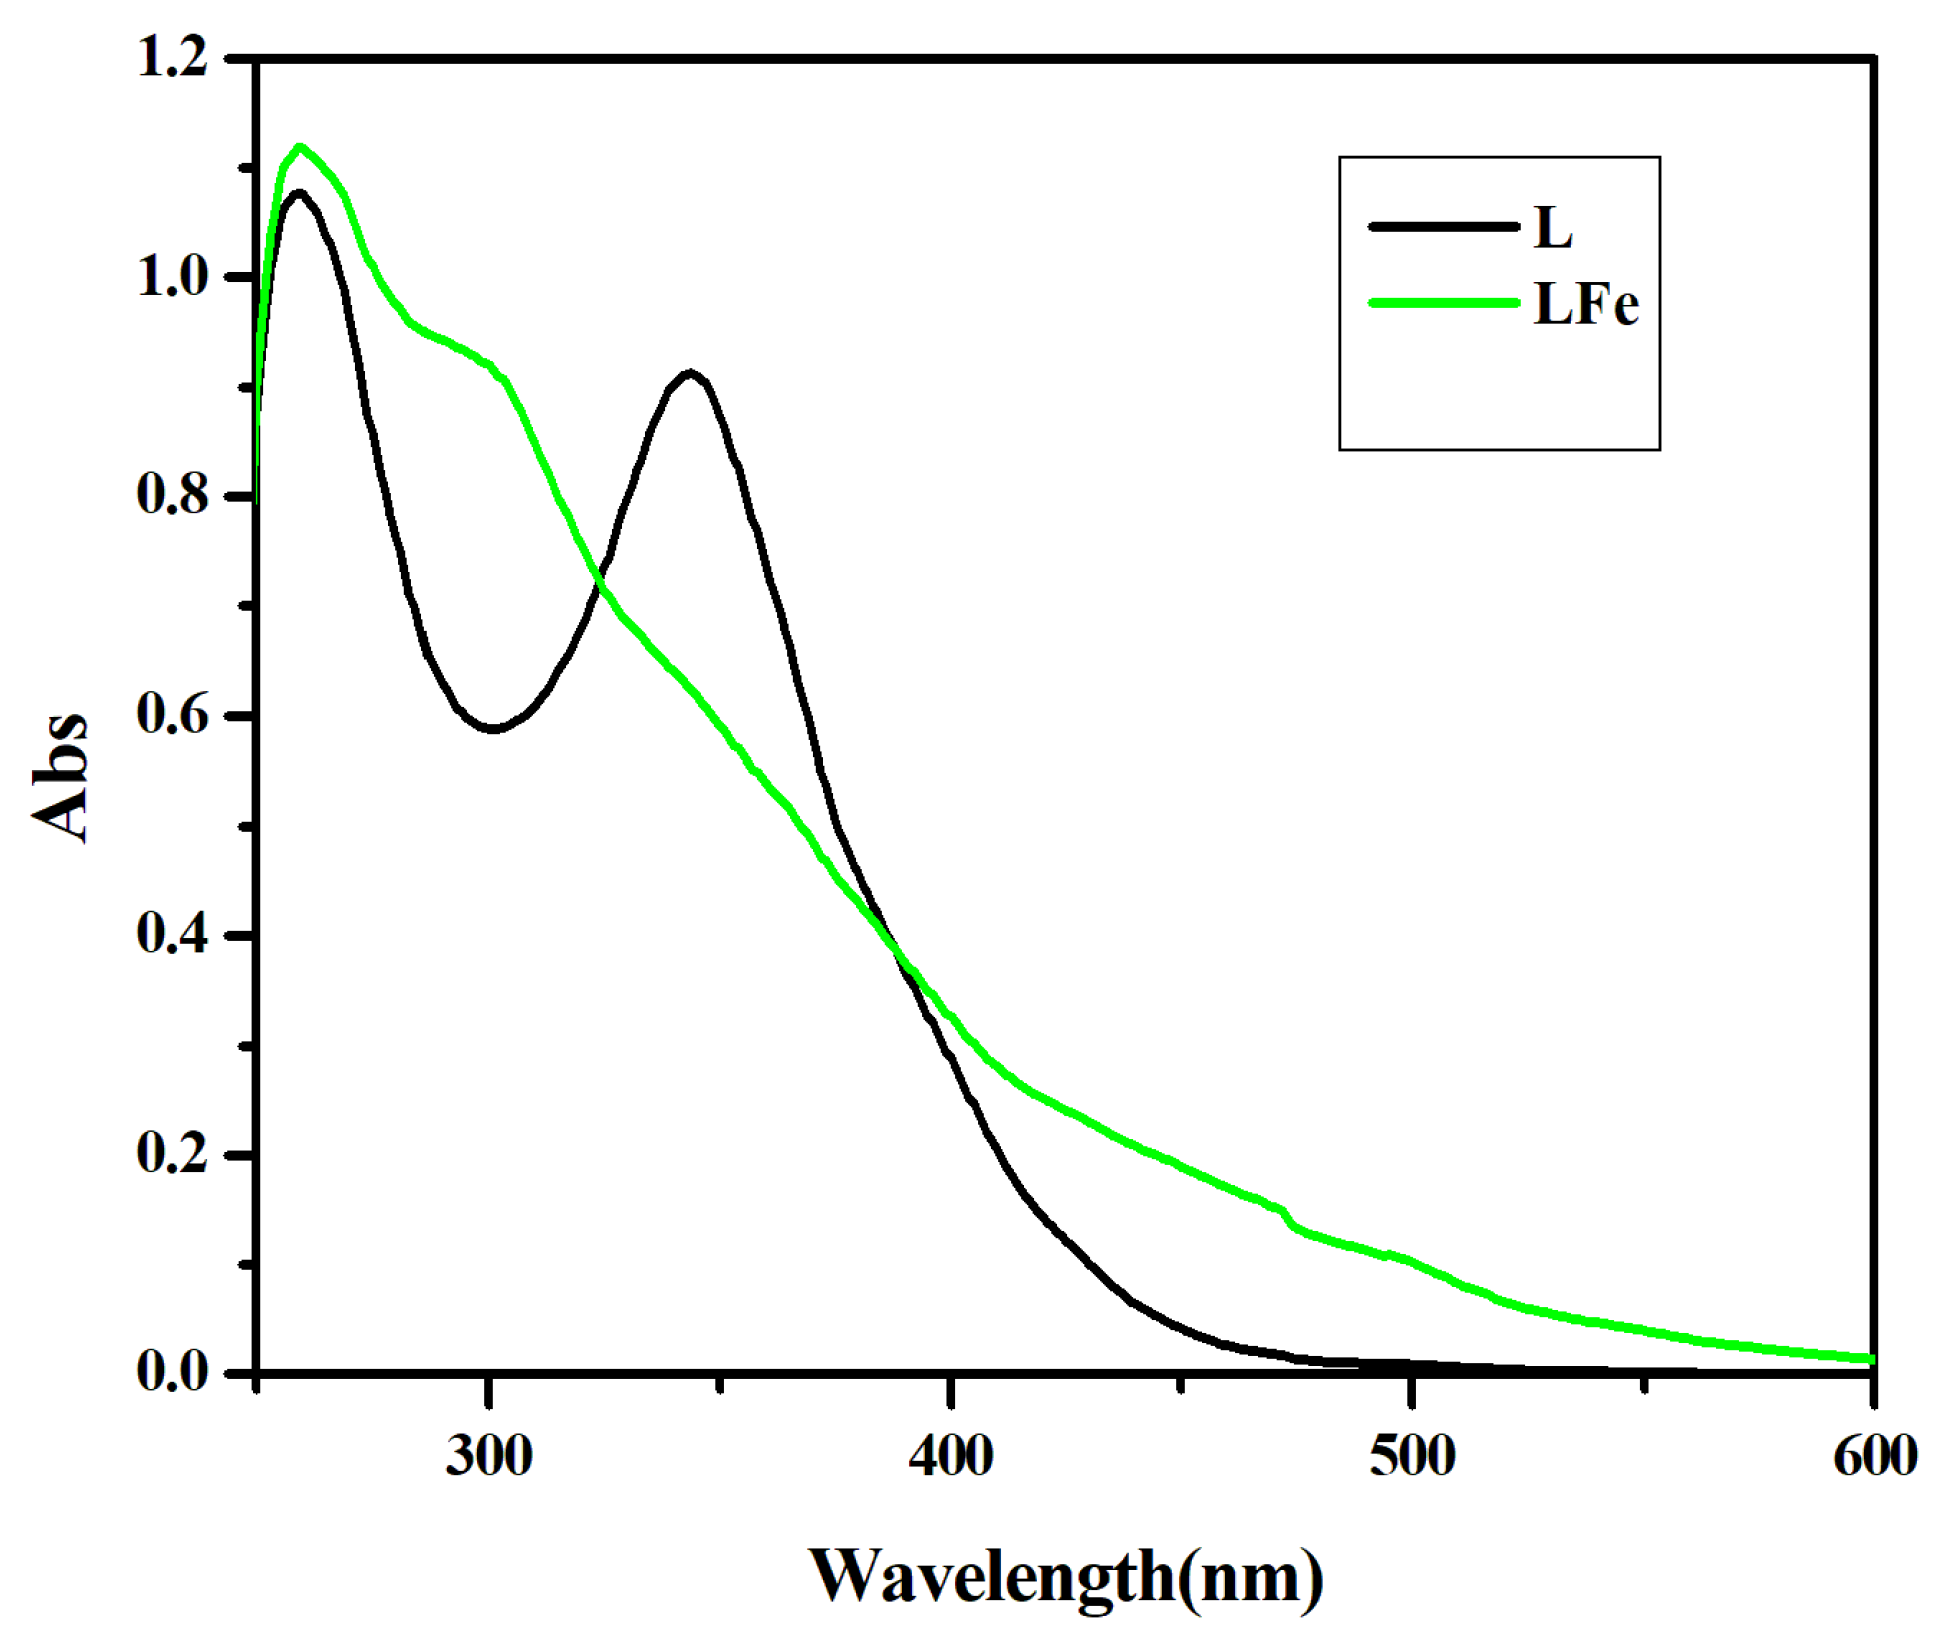
Molecular absorption spectroscopy often plays a pivotal role in interpreting the findings of various analytical methods. By scrutinizing the electronic spectra, researchers can deduce the specifics of the metal ion’s ligand environment. The spectra of the ligands and their corresponding complexes were recorded at a temperature of 298 Kelvin, encompassing a wavelength span from 800 to 200 nanometers. Figure 2 displays the maximum absorption wavelength (λmax) and molar absorptivity (εmax). There are two distinct bands in the UV–Vis area, which is described as π→π*, n→π*, at about 259,344 nm [32]. These bands are the consequence of a charge transfer process that occurs inside molecules and which takes place in the ligand, and an intra ligand band transition triggered by the activity of the imine. Amazingly, new bands representing the π→π*, n→π*, and d-d transitions were discovered at 259, 299, and 472 nm, respectively [33].

3.1.4. Moment of Magnetism

Magnetic reactivity studies provide information about the geometrical makeup of compounds. Generally speaking, the magnetic moments discovered for complexes can be used to identify the metal ion’s surrounding cooperative geometry (Table 1). As anticipated or octahedral Fe (III) complexes, the magnetic moment of the LFe complex is 5.52 BM, or five unpaired electrons.

3.1.5. Mass Spectra

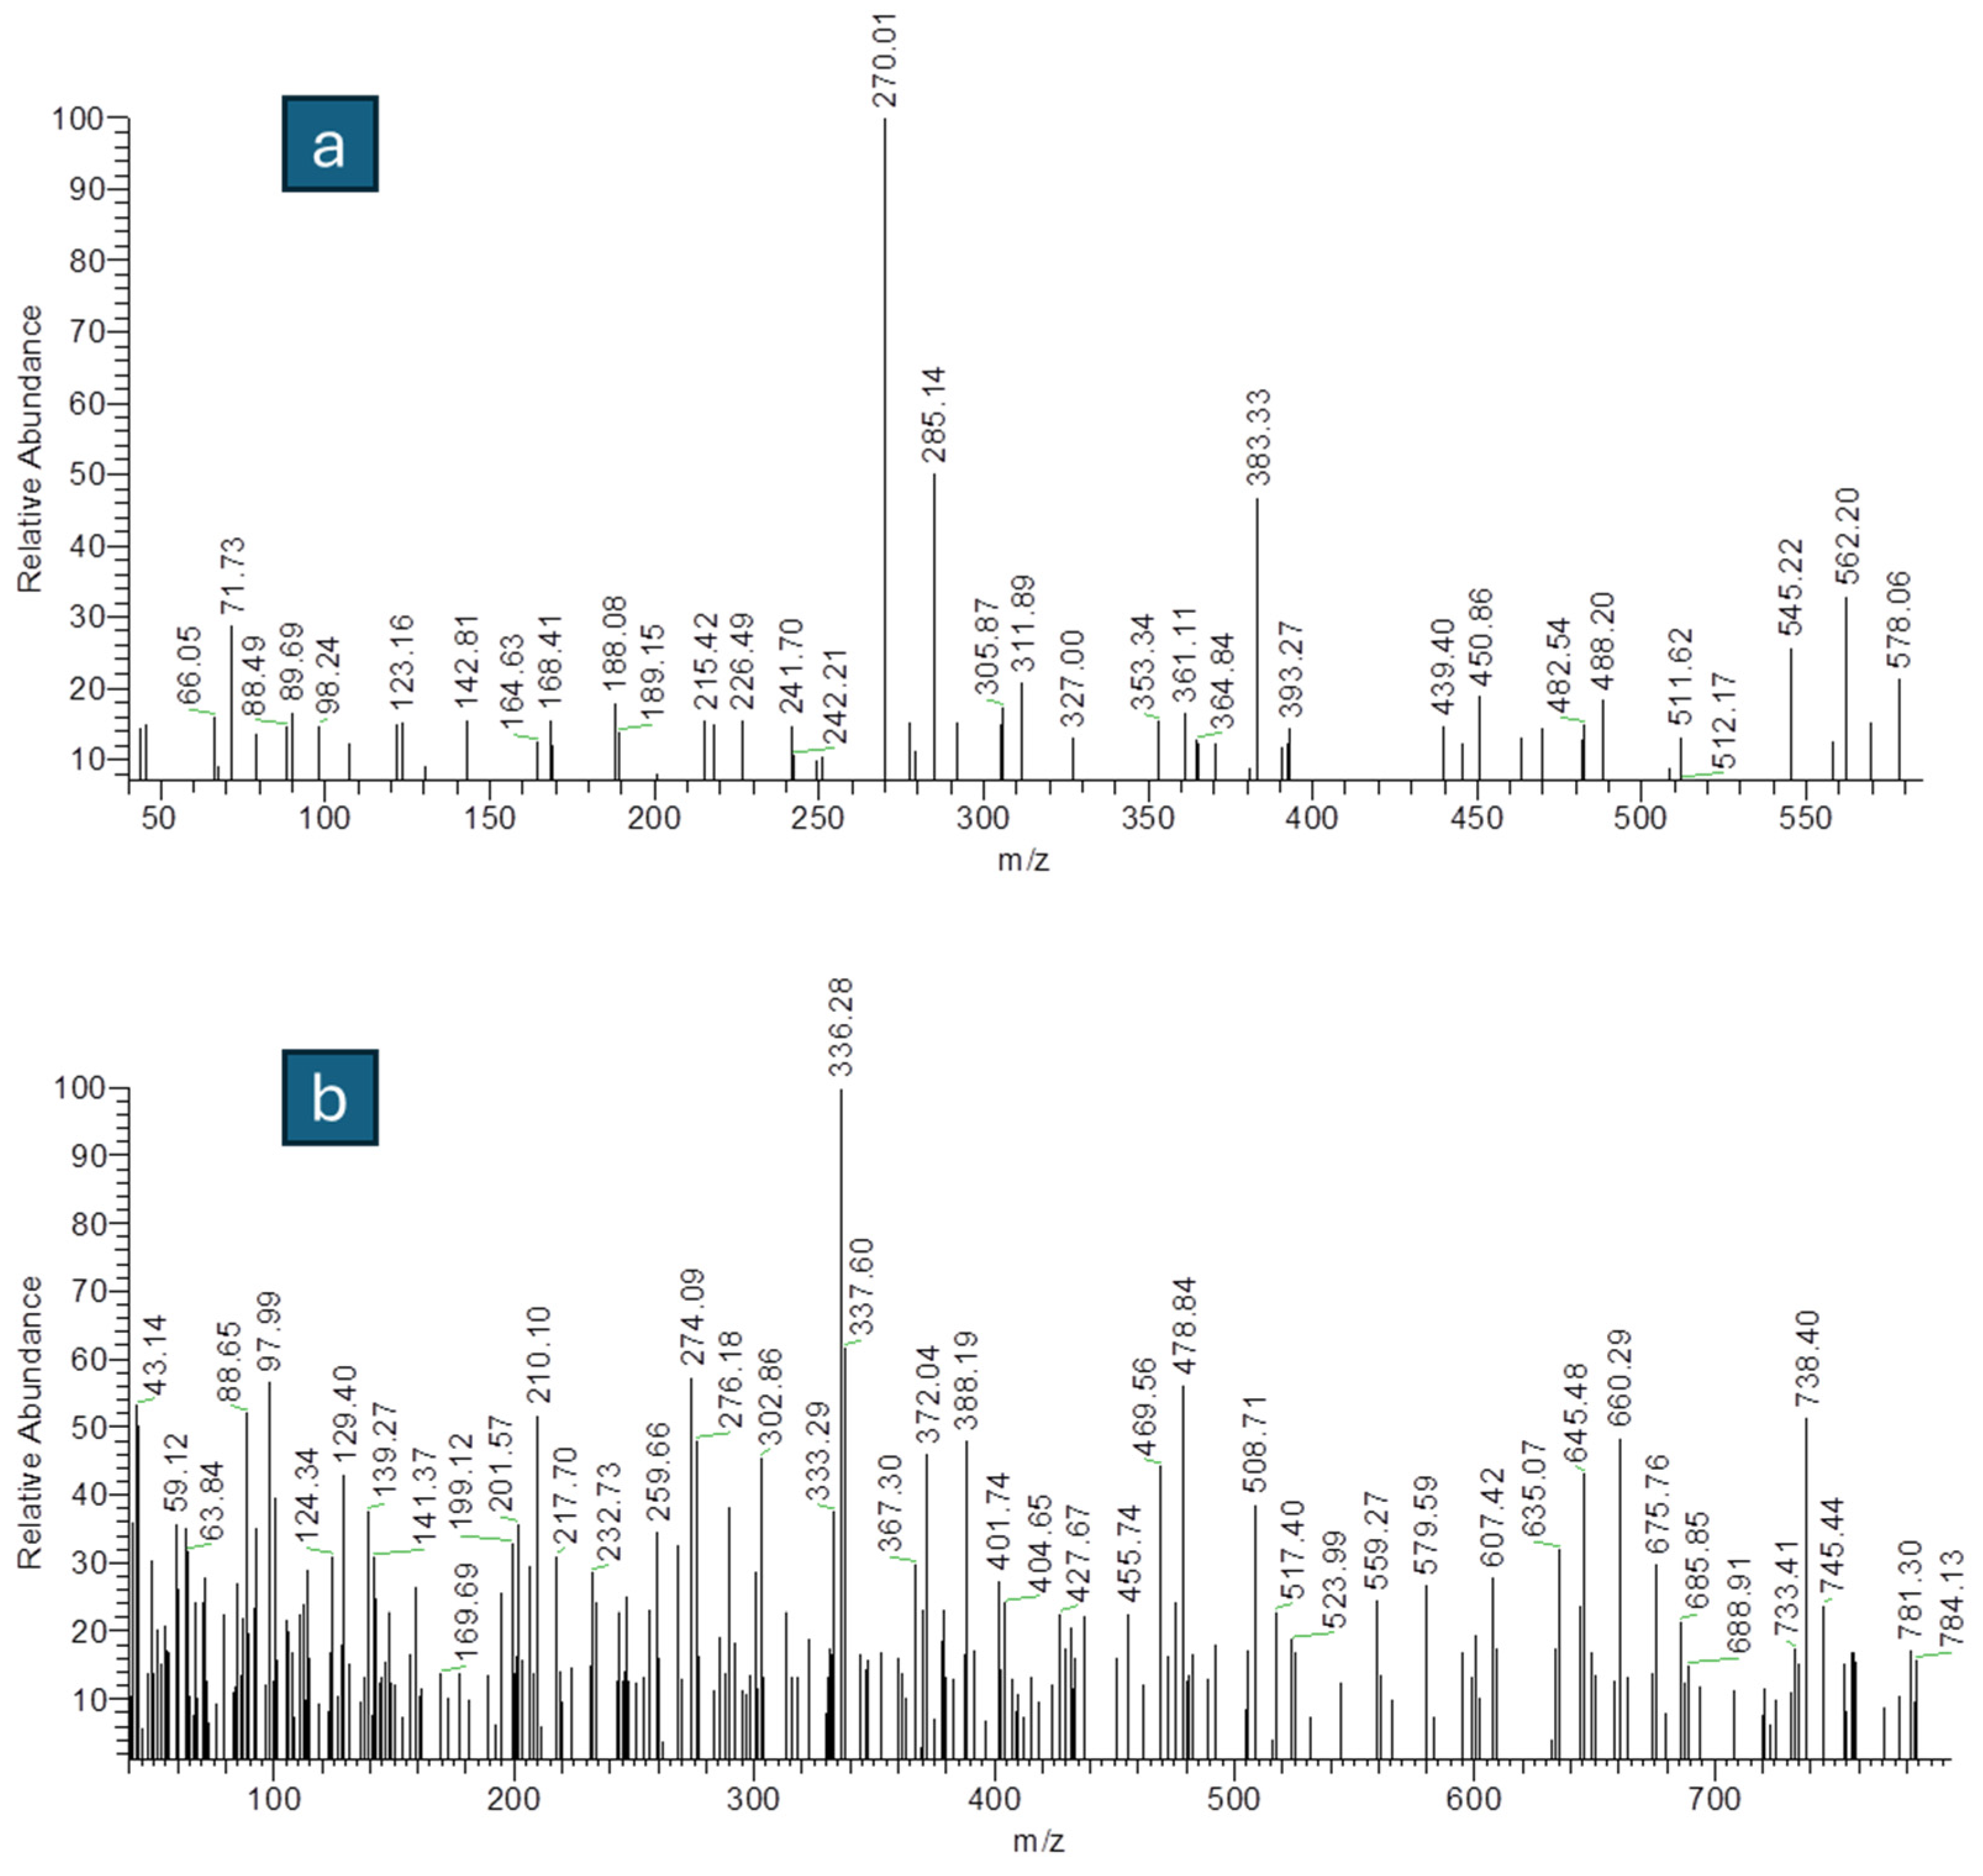
Mass spectra are an essential tool for defining the complex requirements related to describing metal species structures. The MS of the L imine ligand (Figure 3a) displayed a [M+] at m/z = 578.06 amu that implies their suggested structure [C27H18Br2N2O3; M. wt = 578.25 g/mol]. The produced LFe mass spectra were captured (Figure 3b), and their stoichiometric compositions were compared.
The molecular ion peaks of the [C27H26Br2FeN3O11] species are visible in the mass spectra of the Fe (III) chelate at m/z (784.13) (M+1), and they match their suggested molecular weights. The intensity of the ionic reptiles is shown by the base peaks (Figure 3b, Scheme S1). The ultimate dissociation of the Fe (III) chelate was determined by analyzing the other fragmentation ions identified in Scheme S1 at m/z 694.04, 631.85, 565.85, 407.40, 302.86, 211.25, 108.21, 68.14 and 43.78.

3.1.6. Spectrophotometric Determination of the Stoichiometry of the Prepared Complex

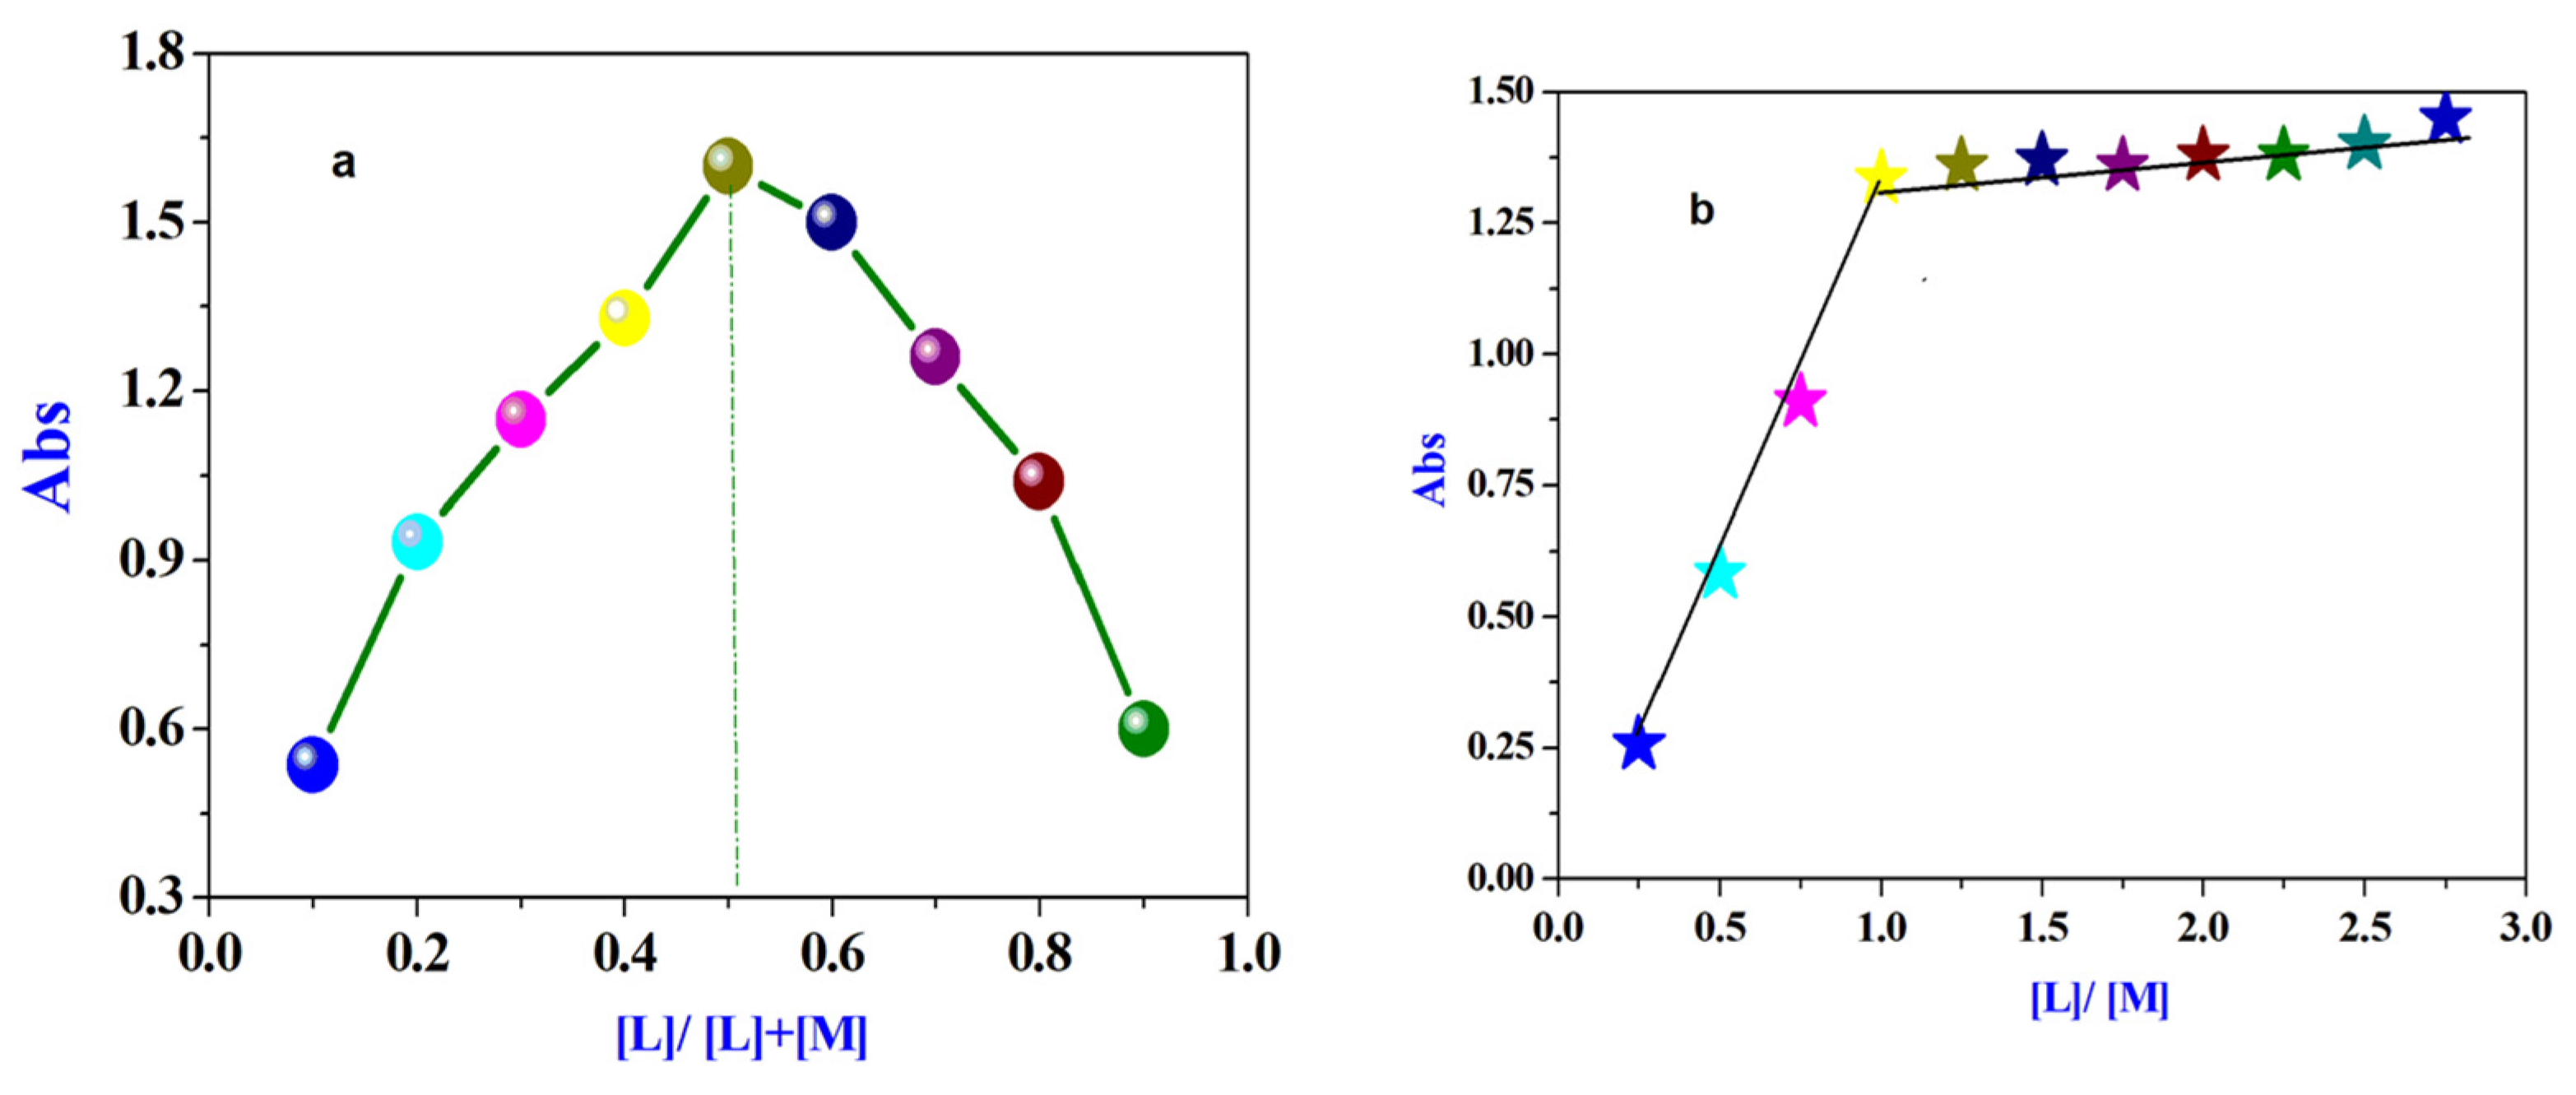
Spectrophotometry has been implemented in both the molar ratio view and the continuous variations method to assess the stoichiometry of the complexes. The information gathered signifies that the synthesized compounds have a 1:1 stoichiometry. The continuous variation strategy’s curves demonstrate a 1:1 molar complexation between the metal ions and ligand (Figure 4), with Xligand = 0.52 being the greatest mole fraction absorption. Plus, the metal ion to ligand ratio of the produced complexes is validated by the data acquired using the molar ratio technique (Figure 4) [34,35].
The correlation between experimental data and the proposed structure of the prepared LFe complex relies on various spectroscopic, analytical, and physicochemical techniques. Elemental analysis (CHN and metal content) confirms the molecular composition, while FT-IR spectroscopy identifies coordination sites through shifts in functional group vibrations, such as -OH, CH=N, M-N, and M-O bonds. UV-Vis spectroscopy provides insight into the electronic transitions, helping to determine the octahedral geometry of the prepared LFe complex. Magnetic susceptibility measurements distinguish between high-spin configurations, further supporting the structural hypothesis. Mass spectrometry (MS) confirms the molecular weight and fragmentation patterns, whereas NMR spectroscopy provides evidence for ligand coordination and symmetry. By analyzing these experimental results collectively, the proposed structure of the metal complex can be rationalized, ensuring consistency with the observed chemical and physical properties.

3.2. Impact of Concentration of the Inhibitor

3.2.1. Tafel Plot

[L] and FeL function as corrosion inhibitors for nickel in the corrosive medium used, and different techniques are employed to examine their impact. The Tafel polarization method is applied to study the rate of corrosion.
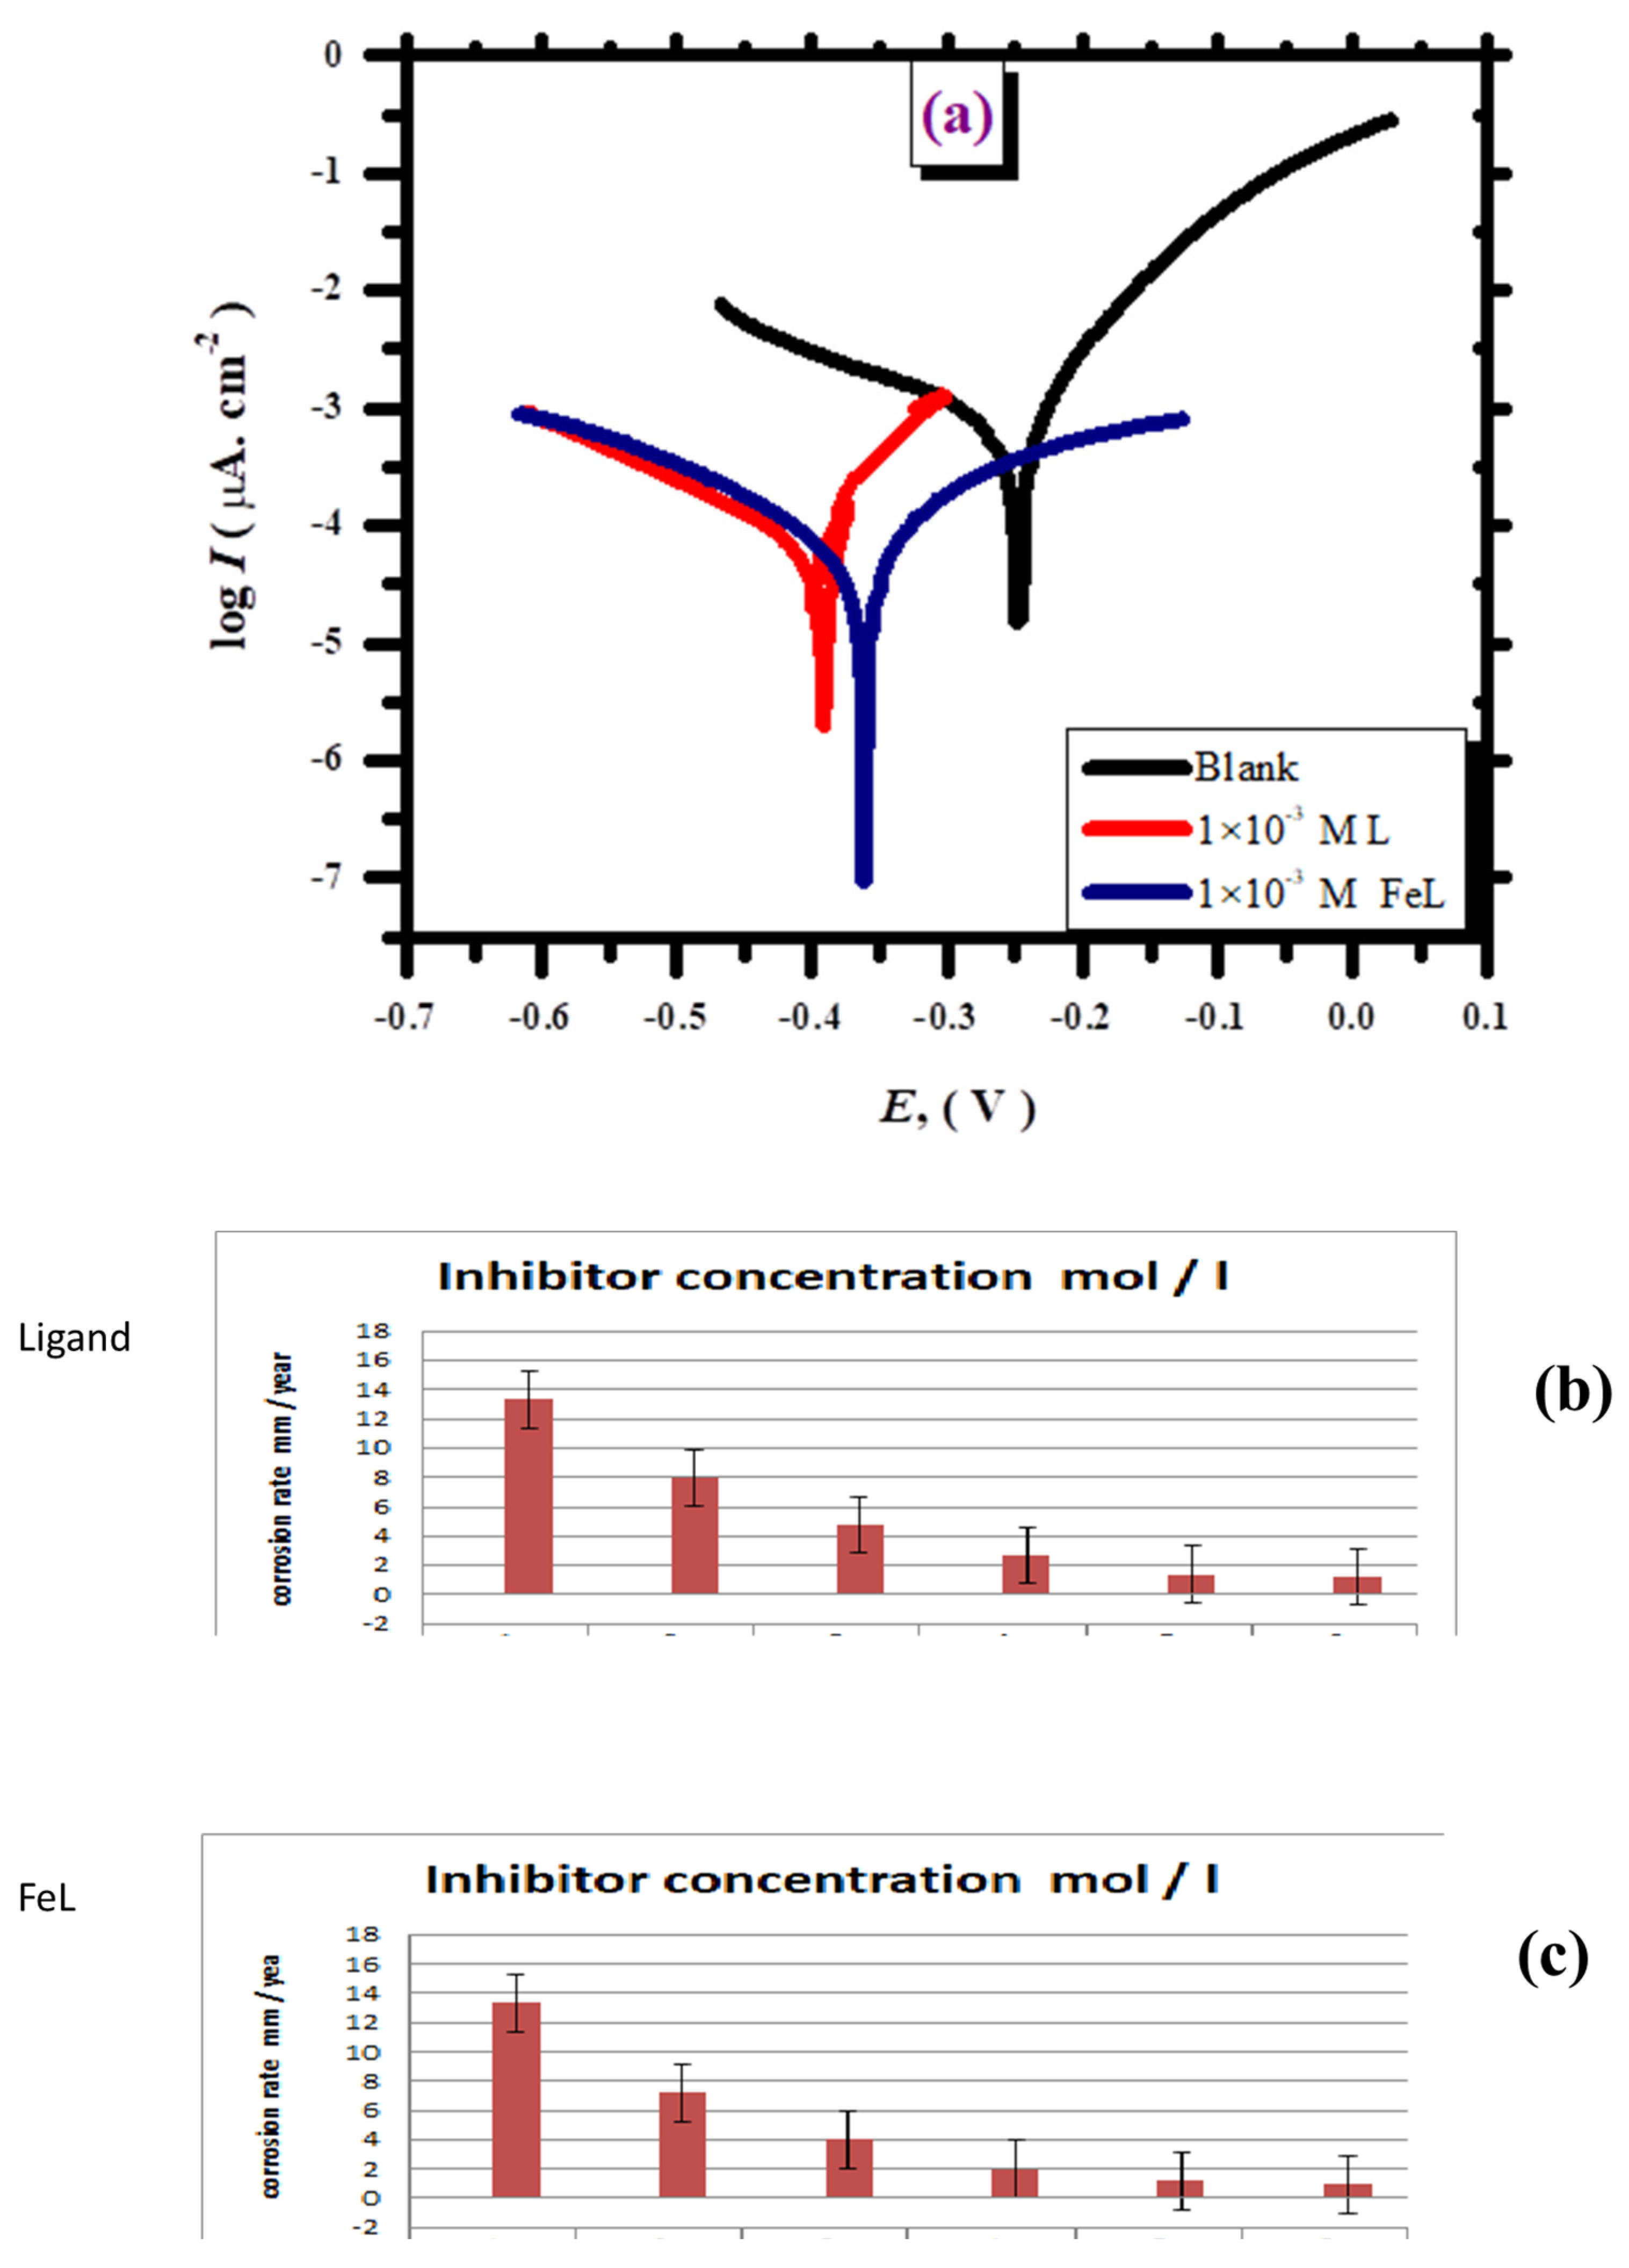
Figure 5 displays the shortcomings of several additive concentrations added to 0.5 M H2SO4 along with the potentiodynamic polarization curves that are currently in place. Extrapolated potentiodynamic curves were used to obtain the electrochemical polarization parameters for nickel corrosion, such as corrosion potential (Ecorr), corrosion current density (Icorr), and cathodic and anodic Tafel constants βc and βa. Table 2 displays the inhibition efficiency IE (%) along with further results.
Furthermore, βc, βa, and cathodic and anodic Tafel constants were stimulated. Table 2 records the inhibition efficiency (IE (%)) and other outcomes. Figure 6 demonstrated that the corrosion current density decreases as the concentration of inhibitor increases from 1 × 10⁻⁵ to 1 × 10⁻³ M when the solution under examination—0.5 M H2SO4—contains additives. This behavior can be explained by the fact that nickel ions produced by corrosion procedures bound by L and FeL created a nickel compound that dissolves in acidic environments. This phenomenon makes sense when we consider that during corrosion processes, nickel ions bound by L create soluble nickel complexes in acidic conditions. The upgraded inhibiting efficiency came about as a result of two processes occurring at the same time that reduce the production of a dissolving nickel complex and nickel corrosion.
At all additive concentrations, the corrosion potential of Ni (Ecorr) significantly shifted toward negative potential as the L concentration increased from 1 × 10⁻⁵ to 1 × 10⁻³ M. In the case of utilizing FeL, the corrosion potential is shown to be shifted in the negative direction at all additive concentrations. However, with an increasing FeL concentration, the corrosion potential is shifted in the positive direction (but still more negative than that of pure medium). A closer examination of Table 2 shows that different additive concentrations have an impact on both βc and βa values, showing that important anodic and cathodic spots on the metal’s surface were occluded by adsorbent inhibitor particles. As inhibitor concentration is raised, the presence of inhibitors is reduced in important areas where the corrosion process occurred [36].
Additives affect the reaction pathway and mutually change the anodic and cathodic Tafel constants. That result points out that L and FeL react to different alterations in a comparable way. The phenomenon suggests that when ligands and complex molecules concurrently coat the anodic and cathodic sites, the processes of anodic dissolution and cathodic reduction are significantly reduced. Additionally, it was observed that the extent of protection offered by these inhibitors, as well as the external surface coverage, enhanced progressively as the inhibitor concentration in the solution was elevated from 1 × 10⁻⁵ M to 1 × 10⁻³ M. Consequently, the most suitable concentration for protecting metal against corrosion in acidic environments is considered to be 1 × 10⁻³ M for either L or FeL compounds. By examining polarization curves, it became apparent that the rates of both anodic and cathodic reactions diminished with increasing inhibitor concentrations. This observation indicates that, regardless of the specific additive concentration, the presence of these substances leads to a decrease in the rate of the electrochemical processes involved in corrosion. The adding of inhibitors reduces anodic dissolutions and delays hydrogen evolution process [37]. On the metal’s surface, electrochemical reactions are connected to inhibitor adsorption, and it is known that adsorption is dependent on the inhibitors’ chemical structure. The findings, which are displayed in Table 2, prove that the inhibitor-containing systems and the blank system had different Ecorr values. At all additive concentrations, it is crucial to note that Ecorr values for the inhibitor-containing systems virtually move towards the cathodic regions in comparison to those of the blank. Regarding the Ecorr values of L and FeL, notable variations of approximately −180 mV and −116 mV in comparison to the blank Ecorr are observed when measured against the SCE standard. These inhibitors can be grouped as cathodic inhibitors since the displacement in Ecorr exceeds 85 mV in the negative direction [38,39].
Additionally, the data in Table 2 suggest that the cathodic and anodic Tafel line slopes (βa and βc) are roughly constant and unaffected by inhibitor concentration, indicating that the metal dissolution mechanism is unaffected by the generated inhibitors. The data clearly illustrate that as the concentration of the inhibitor progressively increases, the current densities associated with corrosion tend to diminish. Specifically, at a concentration of 1.0 mM, the L and FeL inhibitors’ Icorr values were found to be 58.3 and 44.67 µA cm−2, respectively, as stated in Table 2, which is substantially less than the Ni concentration of 616.6 µA cm−2 in free H2SO4. Moreover, as inhibitor concentrations are gradually increased, corrosion currents are reduced.
Furthermore, the information presented in Table 2 indicates a direct relationship between the rise of inhibitor concentrations and the enhancement of surface coverage. As the inhibitor levels increase, a corresponding growth in the proportion of the surface that is covered can be observed, reducing corrosion current densities in the process. The potentiodynamic measurements’ findings demonstrate that the presence of 1.0 mM of L as well FeL results in increased inhibition efficiency (90.5% and 92.7%, respectively). The wider surface coverage results from more inhibitor molecules being adsorbed on the metal surface and these compounds operating as adsorption inhibitors, as evidenced by the increasing inhibition efficiency and decrease in corrosion currents when inhibitors are present [40].
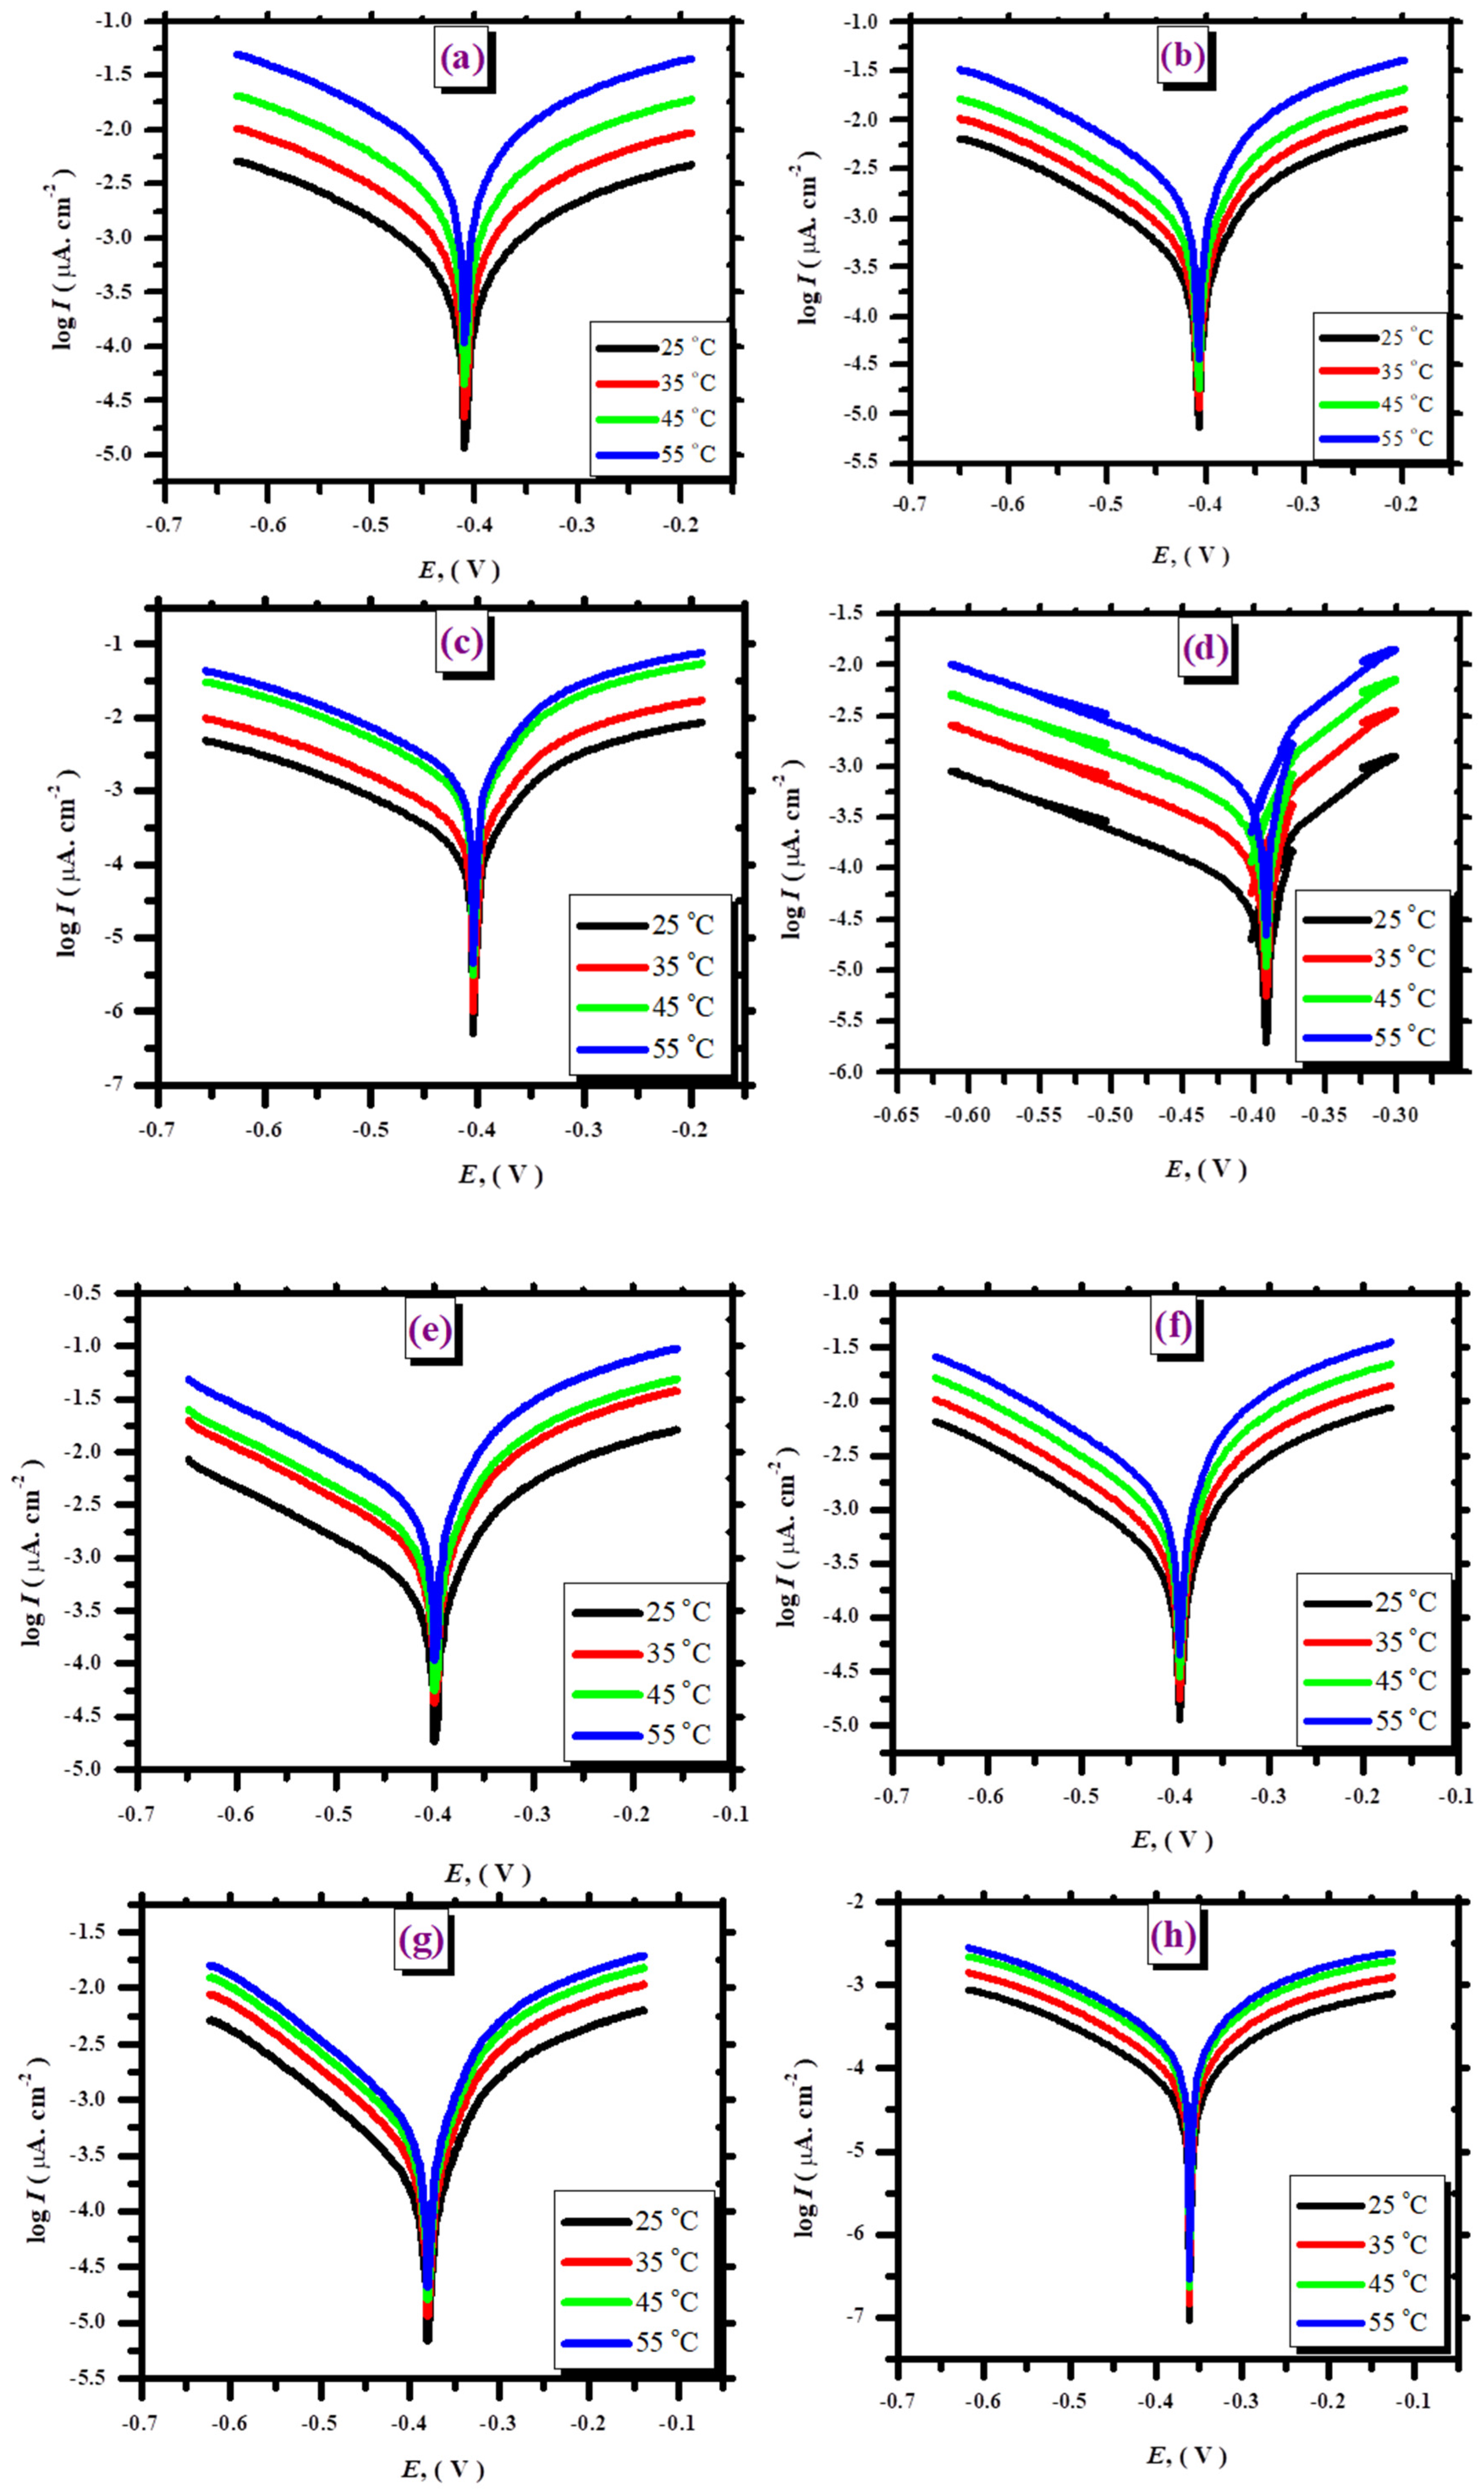
The inhibition efficiency and corrosion current densities of various chemicals are compared, and the results indicate that the dissolution rate of Ni in a 0.5 M H2SO4 solution decreases significantly as the concentration of the inhibitor substance increases. The EIS method’s results are reasonably consistent. The data of two methods reveal that the η% of FeL is greater than that of L at the same concentration. The compounds’ molecular size provides the best explanation for this achievement level. The molecular weight of FeL is 748.13 g/mol, which is substantially larger than that of L, which is 578.25 g/mol. This indicates that although both compounds having similar numbers of active sites, FeL exhibits a greater inhibition efficiency (η%) due to its larger size. The Tafel plot analysis of nickel in a 0.5 M sulfuric acid solution, in both the presence and absence of 1 × 10⁻³ M concentrations of L and FeL, is presented in Figure 5a. This outcome highlights the performance and characteristics of the two inhibitors under the specific conditions and a temperature of 25 degrees Celsius. The additive effect of concentration on the corrosion rate of Ni is shown in Figure 5b,c. It is found that growing the FeL level in an acidic solution shifts the corrosion potential positively; in contrast, with L participation, the tendency moves progressively towards negative outcomes as a result of the reduced rates of anodic dissolution as well cathodic hydrogen evolution reactions, which occur with the presence of the additives. All of the corrosion potentials, however, are greater when the additives are included than when they are not.

3.2.2. Electrochemical Impedance Spectroscopy

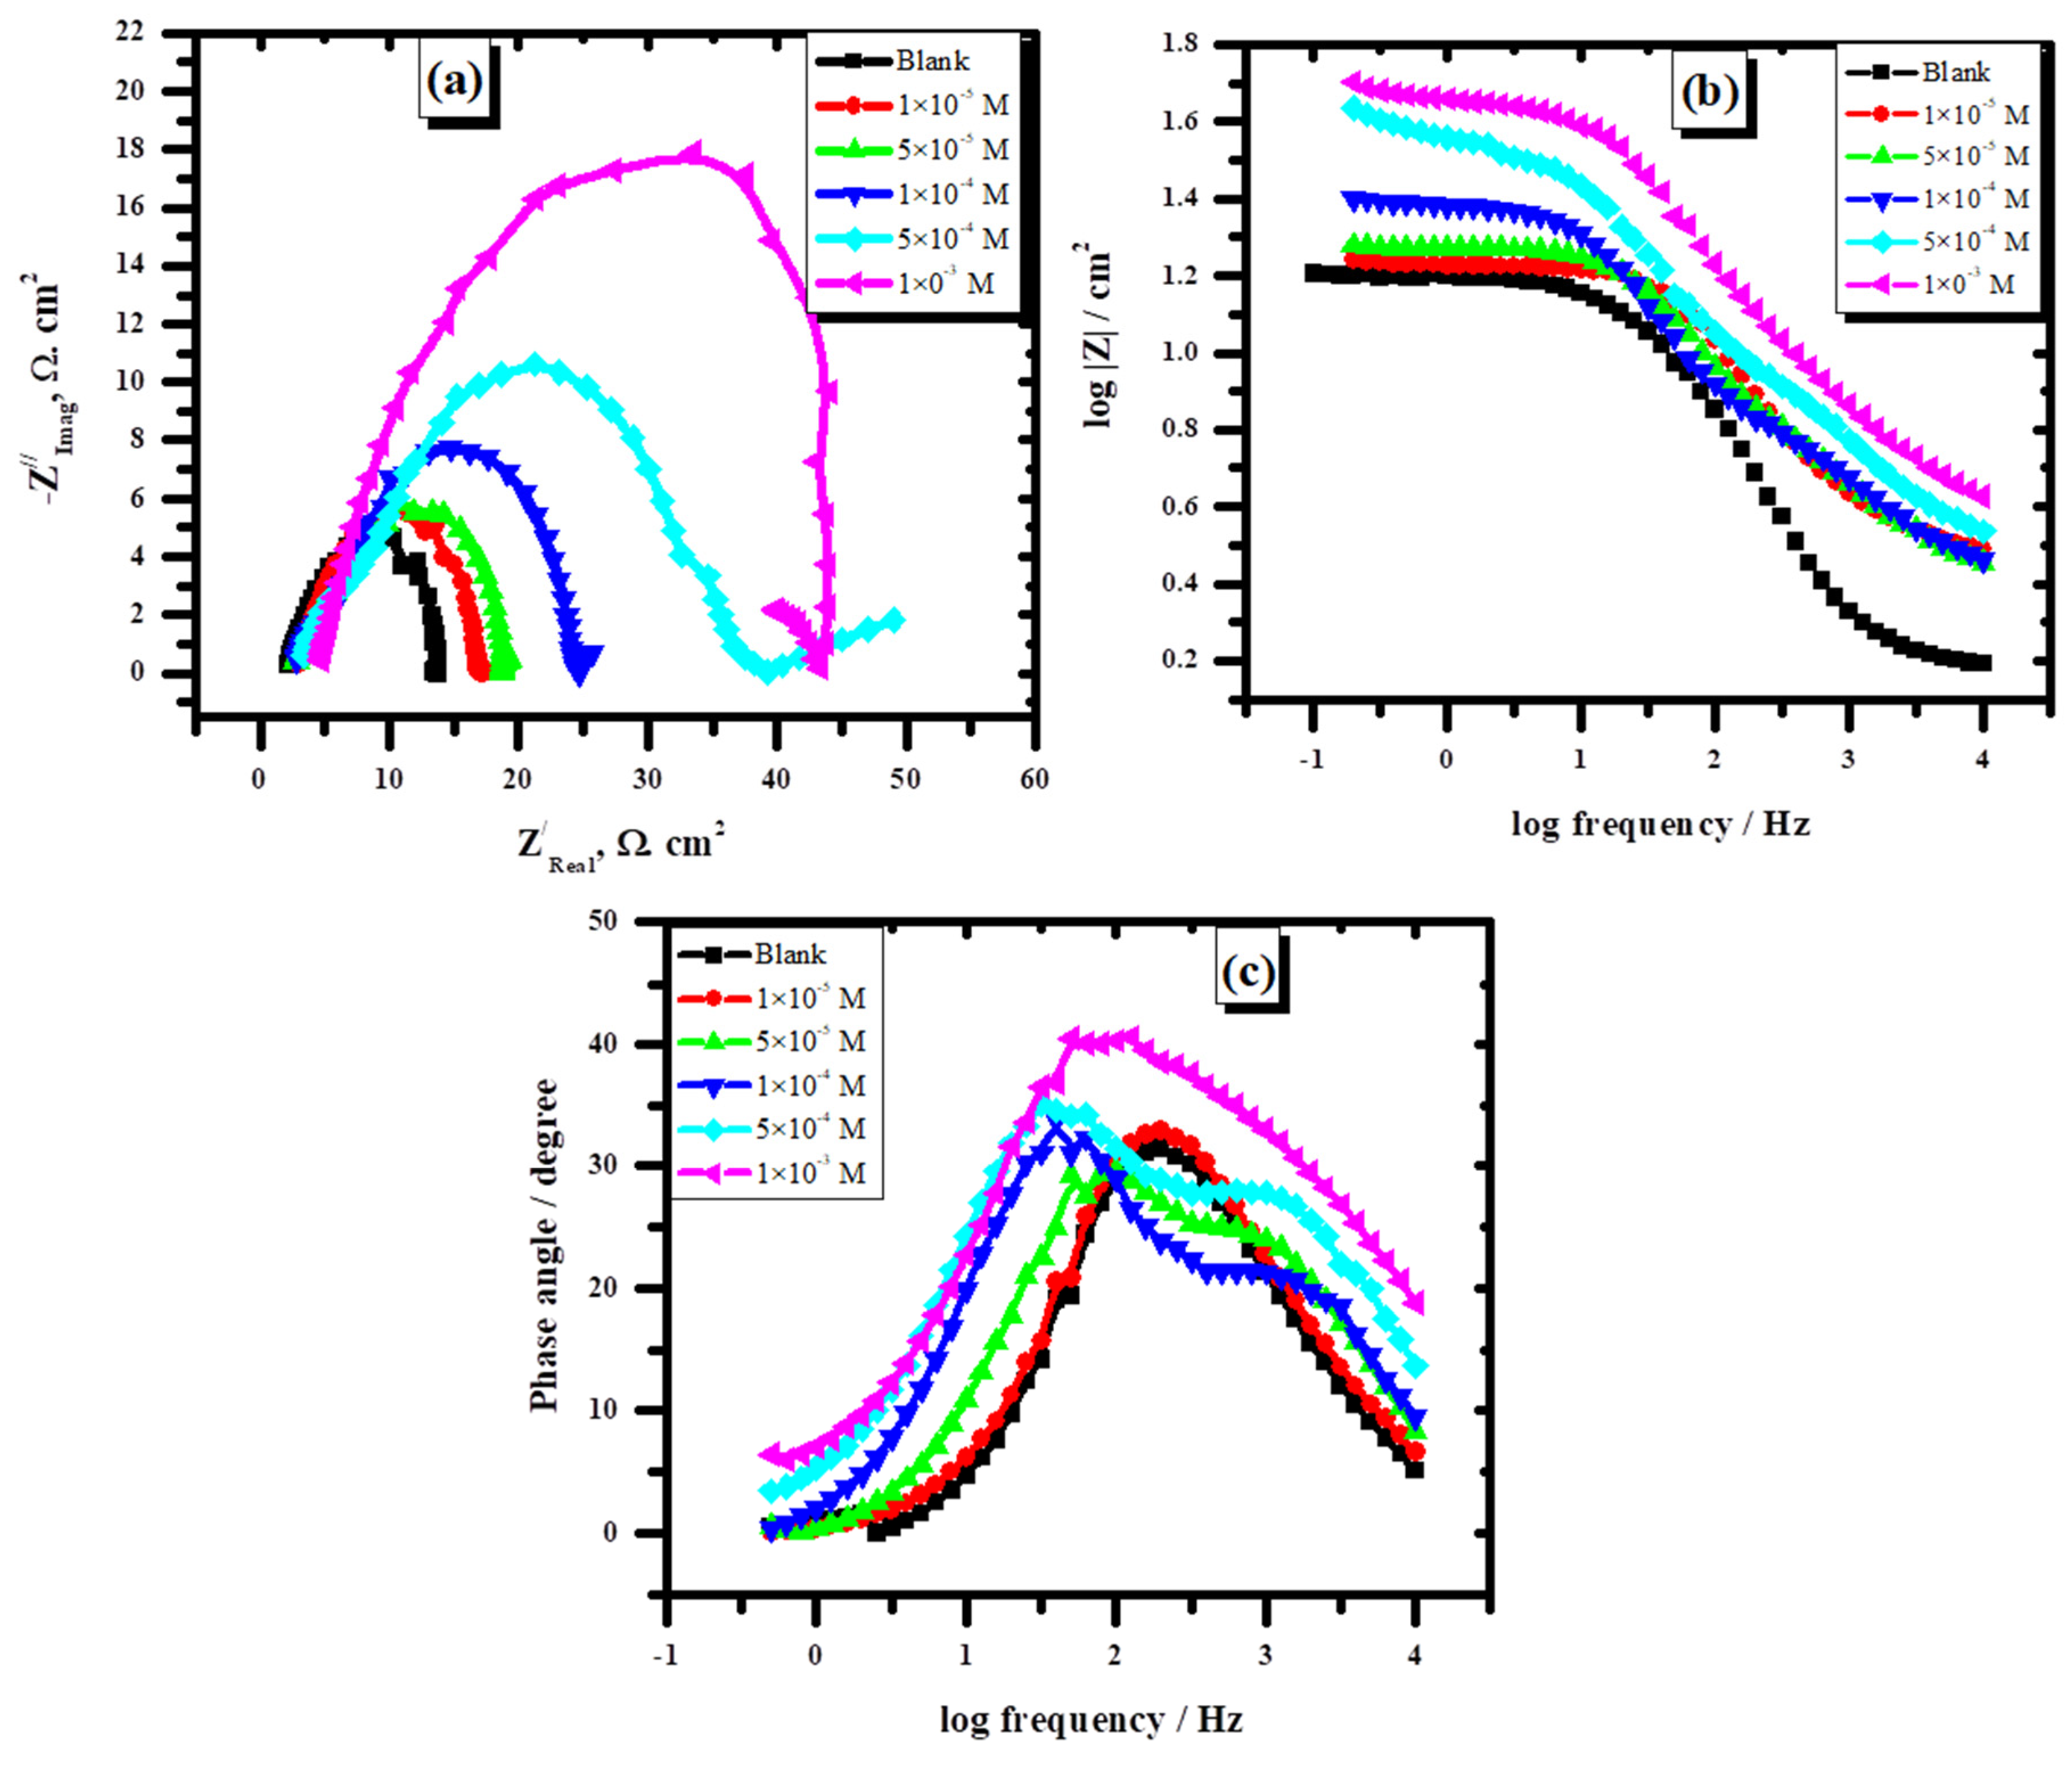
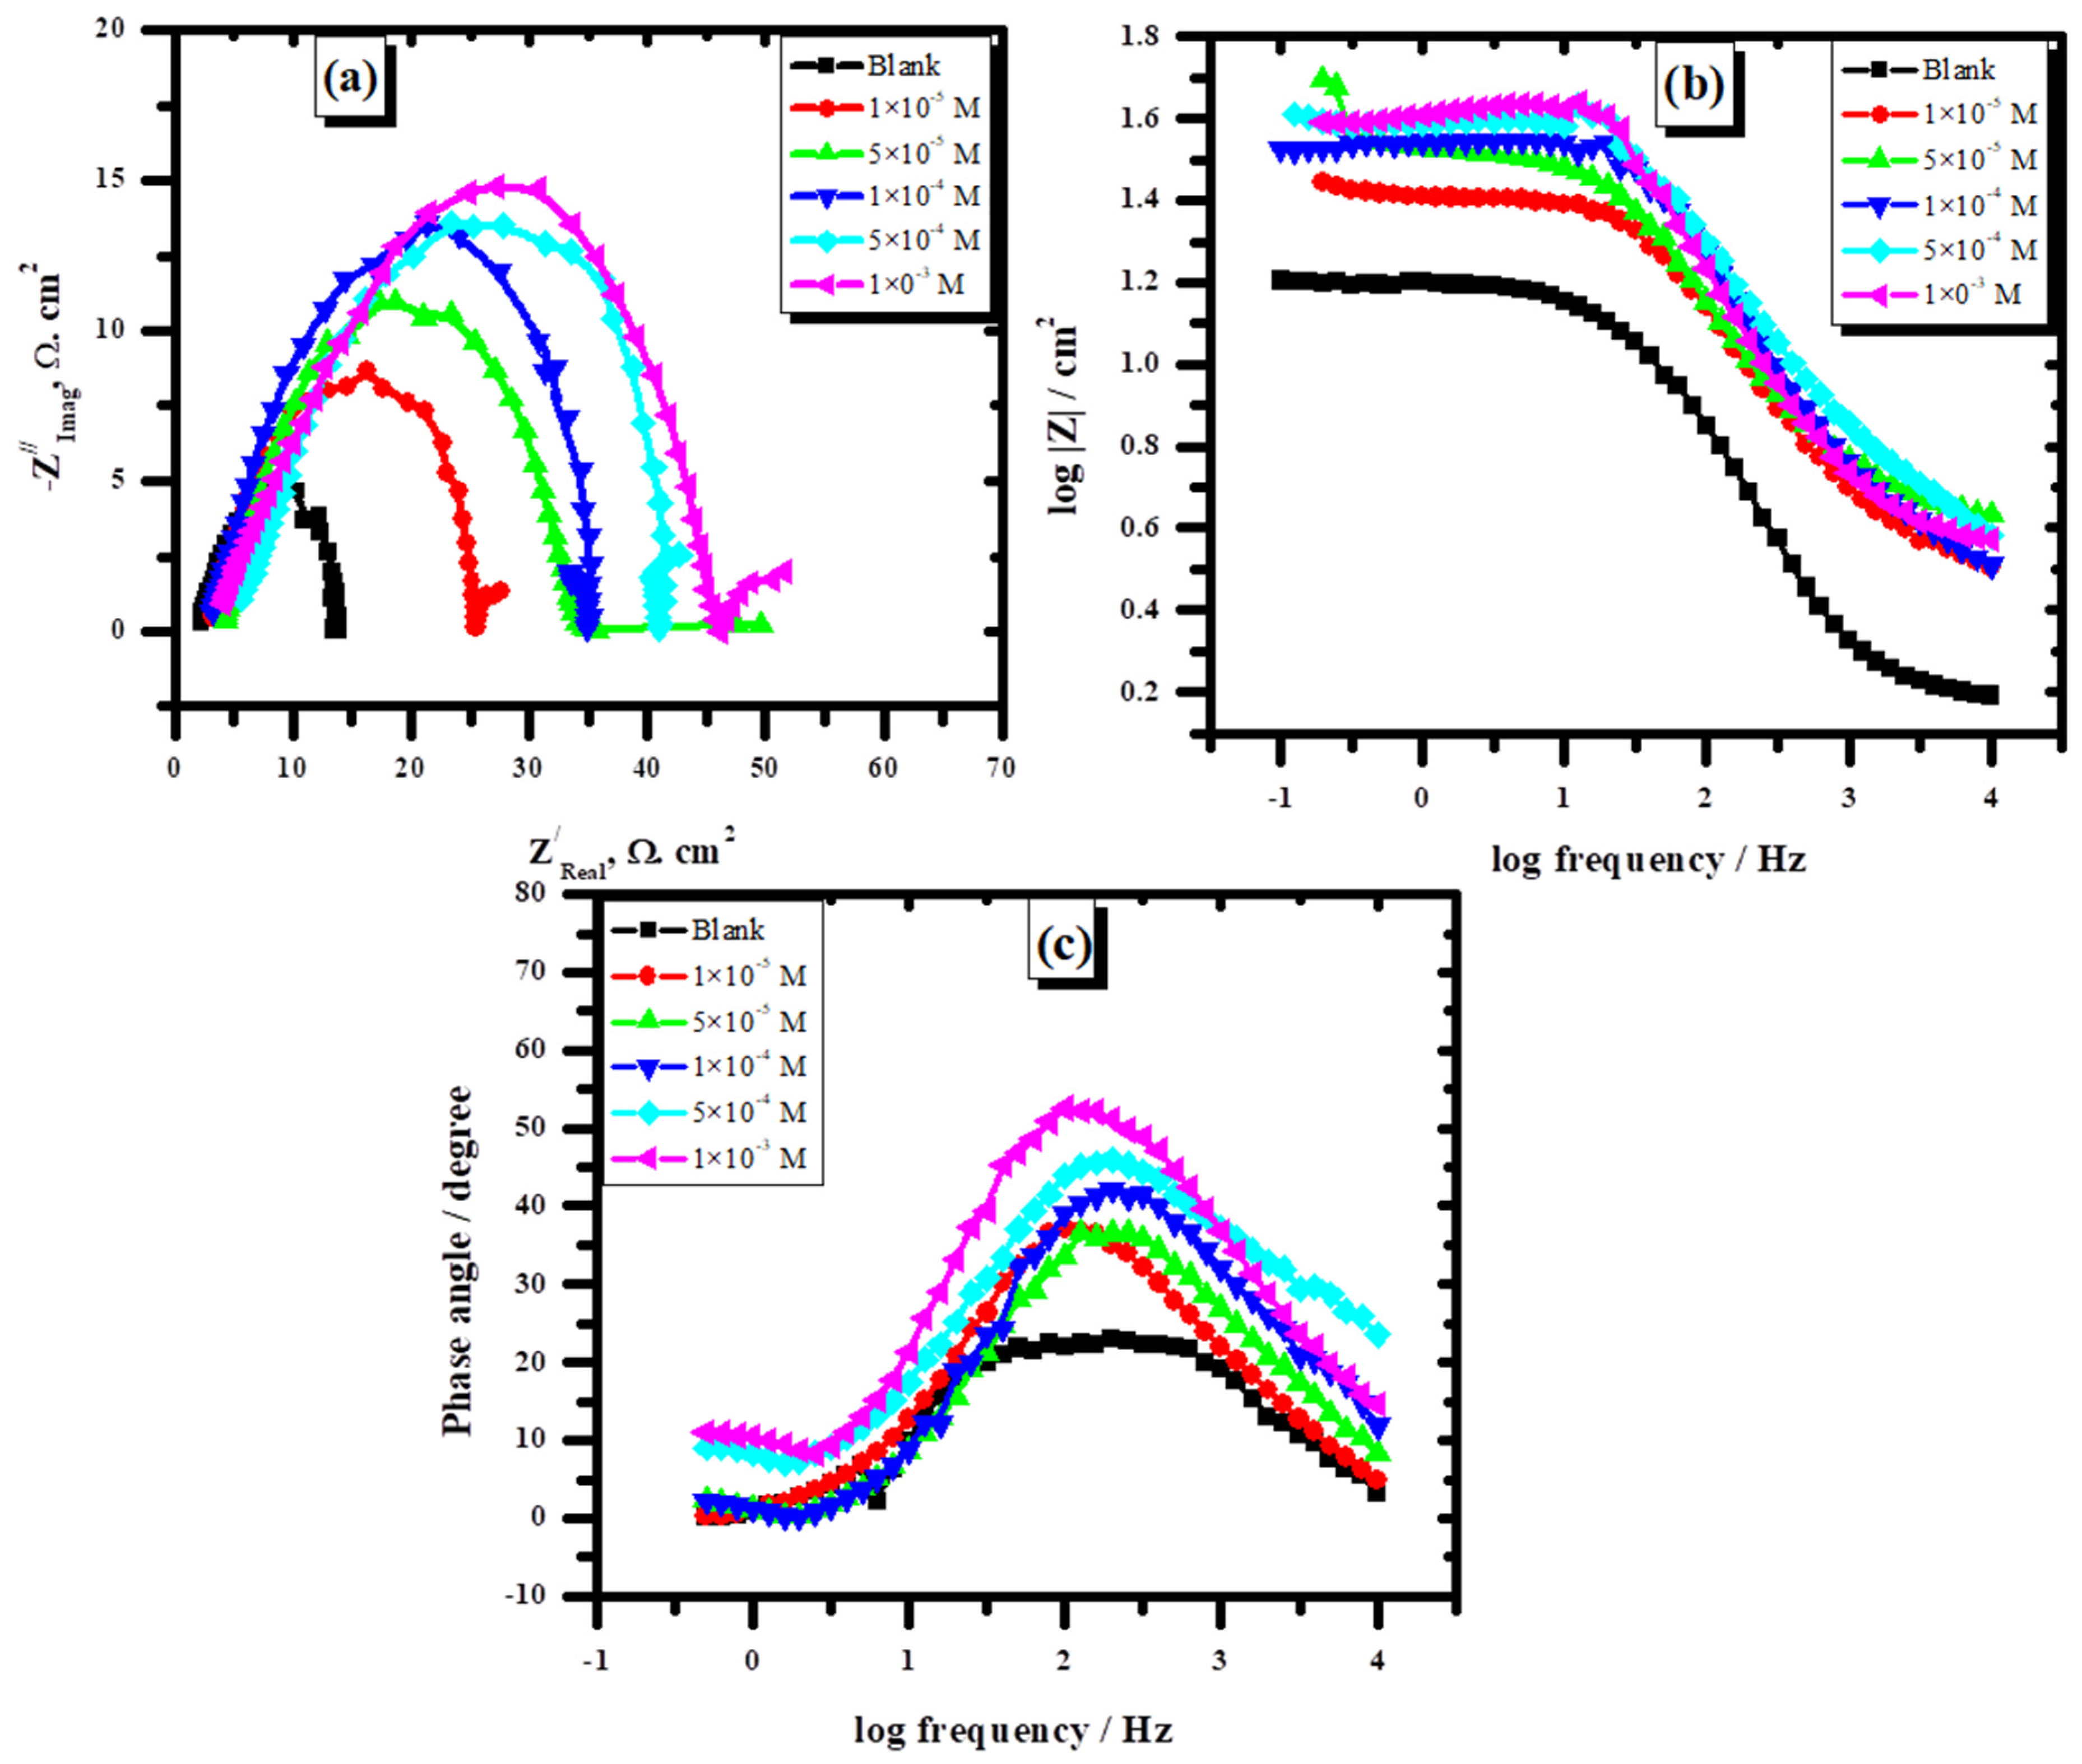
The verification of potentiodynamic polarization results was aided by examining the EIS of nickel metal in 0.5 M H2SO4 with different concentrations of L and FeL. The complicated plane of the impedance plot at Ecorr is shown in Figure 7a–c as well Figure 8a–c. Both with and without varying inhibitor concentrations, one capacitive loop can be seen in the impedance spectra acquired with Ni as the anode. The single semicircle shape of the spectrum showed that there was a corrosive reaction occurring at the interface between the electrolyte and the external surfaces. This figure (Figure 7a and Figure 8a) showed that the impedance response of Ni changed significantly when additives in different amounts were added to corrosive media. This can be explained by the fact that both the lowest and greatest inhibitor concentrations cause an increase in substrate impedance. The semicircle looks to deviate from the ideal capacitive behavior because of roughness considerations, surface heterogeneities, and SO42− ion adsorption [41]. Conversely, the semicircle steadily improves as the additive concentration increases. When FeL and L are used simultaneously, this phenomenon is seen. According to the Nyquist plot data, the loop size in H2SO4 increases with increasing inhibitor concentrations, indicating that the transfer of charges is more complicated [42,43,44,45].
The parameters obtained from the electrochemical impedance analysis for Ni immersed in 0.5 M H2SO4 with varying concentrations of L additives (1 × 10⁻⁵, 5 × 10⁻⁵, 1 × 10⁻⁴, 5 × 10⁻⁴, and 1 × 10⁻³ M) at 25 °C are presented in Table 3. The corresponding plots, which include Nyquist diagrams, Bode plots, and phase angle Bode plots, are shown in Figure 7, with panels (a), (b), and (c) displaying these data. The results indicate a clear trend where the charge transfer resistance undergoes a progressive increase with the elevation of L additive concentration. Additionally, it is observed that the double layer capacitance, denoted as Cdl, exhibits a consistent decrease as the concentration of the additive is increased.
Double-layer capacitance results have been calculated with the use of Equation (3). Furthermore, it was found that solution resistance was nearly constant across all additive concentrations [46]. The nickel corrosion rate in a 0.5 M H2SO4 environment is found to be inversely related to the concentration of substance L in the solution. As the quantity of L in the solution becomes greater, the corrosion rate of nickel decreases. Furthermore, a similar tendency is observed when FeL is used, as shown in Figure 8a–c. The occurrence of a time constant associated with electrode operation is indicated by Bode plots, as shown in Figure 7b and Figure 8, which display a single-phase maximum at median frequencies. Furthermore, the phase angle rise was more noticeable when FeL was present, suggesting that FeL provides better corrosion protection for Ni than L in acidic environments [47,48]. Furthermore, surface heterogeneity is minimized as a result of additive particle adsorption at particular sites. A different impedance constant of Ni is obtained (Table 3) when the two additions are added in multiple concentrations to 0.5 M H2SO4. This behavior confirms previous data obtained from potentiodynamic polarization.
f   ( Z max / / ) = 1 2 Π C d   l R Ct

3.2.3. Effect of Temperature

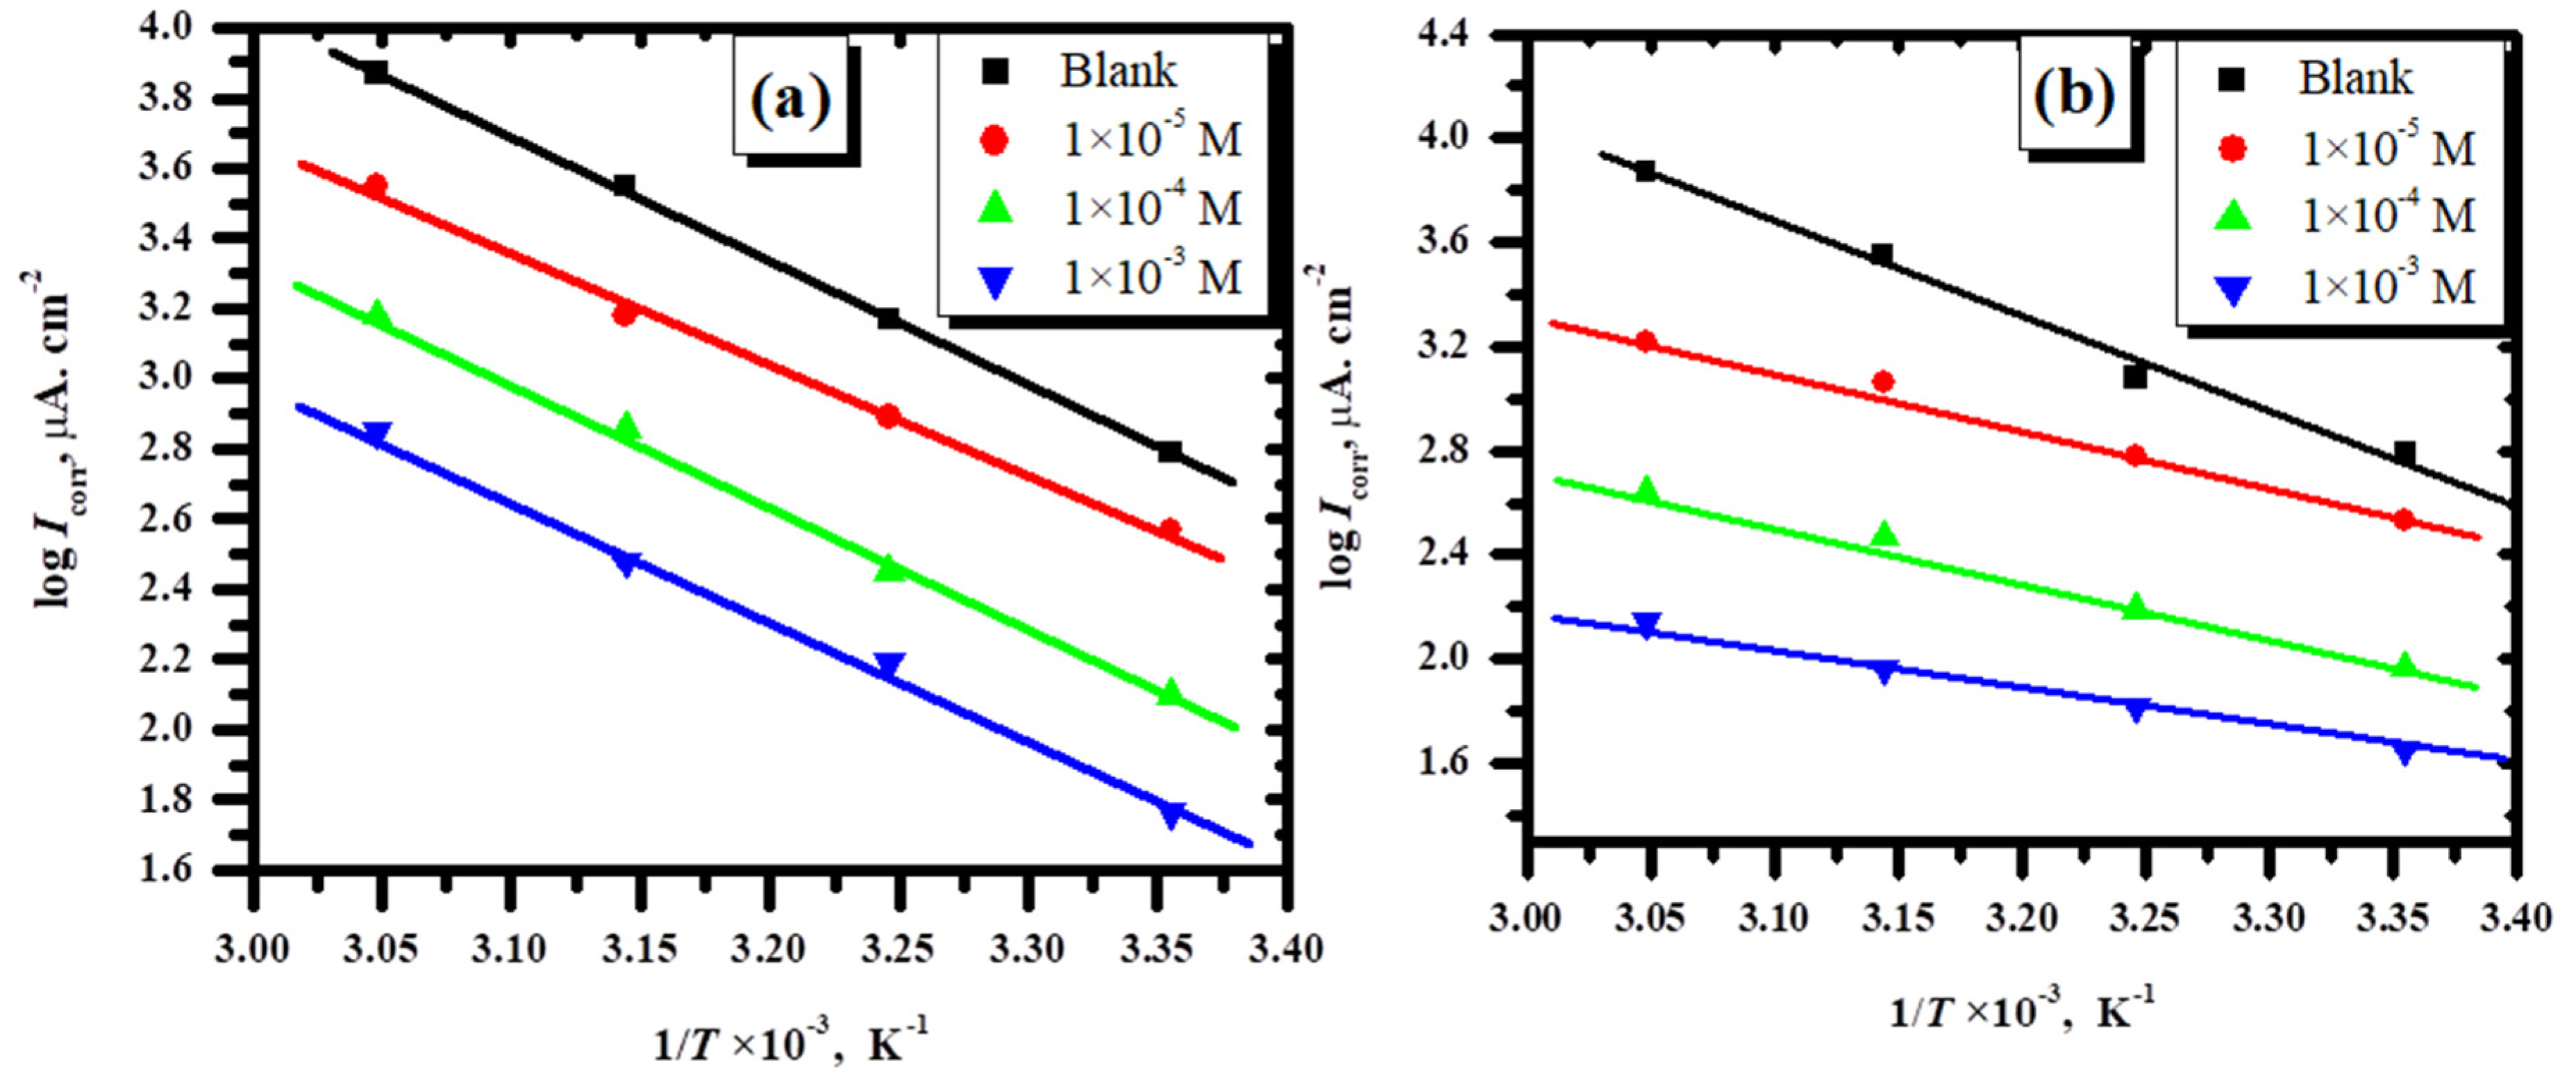
As shown in Figure 9a–f, the Tafel plot was used to examine the additives’ effects at different applied temperatures (25–55 °C) in 0.5 M H2SO4 in the presence of different concentrations of additives. The effects of temperature on the corrosion’s current density, Icorr, and inhibition efficiency (IE%) in the presence and absence of L and FeL are demonstrated in Table S1, Table 4 and Table 5. It is evident that an increase in Icorr values follows rising temperatures, and as a result, the corrosion rate of Ni in 0.5 M H2SO4 is increased in both uninhibited and inhibited media. Moreover, L and FeL inhibition efficiency both increase with rising temperatures on the surface. A rise in temperature has the ability to increase the tendency of adsorption over desorption. This suggests that the amount of surface coverage was here increased. This trend is obviously seen in the case of FeL inhibition efficiency at different temperatures. Moreover, an improved surface coating at elevated temperatures resulted in a minimized roughness of the metal surface. Tafel variables for the Ni metal in 0.5 M H2SO4 at various inhibitor concentrations and temperatures are shown in Table 4 and Table 5. Applying the Arrhenius Formula (3), the activation energy is evident; the findings (Ea) of Ni corrosion were calculated both with and without additives at different concentrations [49,50,51,52].
  logI corr = L ogA     E a 2 . 303   R   T
Here, T is the absolute temperature, R is the universal gas constant, and A is the Arrhenius pre-exponential variable. For the 0.5 M H2SO4 medium, Figure 10 displays lines that are straight and that span log Icorr vs. 1/T of Ni corrosion both with and without multiple additive concentrations. The log Icorr vs. 1/T straight regression coefficients were all close to 0.99 [53]. Activation energy is calculated and listed as well. The findings reveal the presence of inhibitors in 0.5 M H2SO4. The solutions’ Ea values rose at all concentrations, and the range of improvement was proportionate to the additive concentrate ion, indicating that the energetic barrier to corrosion increases in the presence of inhibitors. Building a protective layer on the Ni surface slows down the rate of corrosion because progress in the energy barrier is linked to the adsorption of inhibitors. The activation energy reached 45.8 and 50.7 kJ mol−1 for L and FeL, respectively. This pattern in activation energy data supports the findings of the earlier method of additions derived from room temperature Tafel plots. The Ea data are listed in Table S2.
This relationship highlights how the corrosion process develops when the metal is exposed to different thermal conditions without the presence of any inhibitors. The examination of Icorr across a range of temperatures provides insights into the fundamental reaction kinetics and activation energy involved in the dissolution of nickel in the given acidic solution. The study is applied with multiple concentrations to observe the effect of temperature on corrosion dynamics in the absence of any external protective agents.

3.2.4. Thermodynamic Constants and the Adsorption Isotherm for the Corrosion Process

The inhibitors’ abilities to adsorb are modulated by their structure, the type of metal and its charge, the way the charge is distributed inside the molecule, and the type of electrolytes [54,55,56]. Studying the adsorption isotherm in important ways reveals the relationship between the additive and the Ni surface. As L and FeL increase, so do the surface coverage values θ. High inhibitor adsorption on the Ni surface is the explanation for this result (Figure 11). Further to the adsorption of H2O molecules on the nickel surface, it is commonly thought that the interaction of organic species with the external layer of nickel in an aqueous environment is facilitated by an extra adsorption process involving an organic inhibitor in the aqueous solution, as described by Equation (4) in reference [57].
Org . ( sol ) + ( H 2 O ) ads . Org . ( ads . ) + x H 2 O ( sol . )
A number of isotherms, including Freundlich Frumkin, Langmuir, and Temkin, were tried to fit surface coverage θ values, where x is the percentage or size fraction of H2O molecules that were used in place of each organic molecule. The findings with the most appropriate fit were derived using the Langmuir adsorption isotherm, the equation of which is as follows (5):
  C inh θ =   C inh + 1 K ads
where Kads is the adsorptiion constant, Cinh. The concentration of an additive and the corresponding values of surface coverage (θ) are derived from potendynamic polarization studies. For different concentrations, the adsorption equilibrium constant (Kads) values are calculated. The determined Kads for L and FeL are 1.41 × 10⁵ M−1 and 5.9 × 10³ M−1, respectively, at a temperature of 298 K. These high figures indicate that the adsorption of both L and FeL onto the Ni surface is highly effective. It is evident that the adsorption process is significantly more favorable than the desorption process. The relationship between Kads and the standard free energy change of adsorption is established through the following Formula (6) provided in [56].
Here, Kads signifies the equilibrium constant for the adsorption–desorption process, which is directly correlated to the standard adsorption free energy (ΔG°). This equation underscores the strong adsorption tendency of L and FeL onto the nickel surface at the specified conditions.
K ads = 1 55 . 5 exp ( Δ G ads o RT ) .
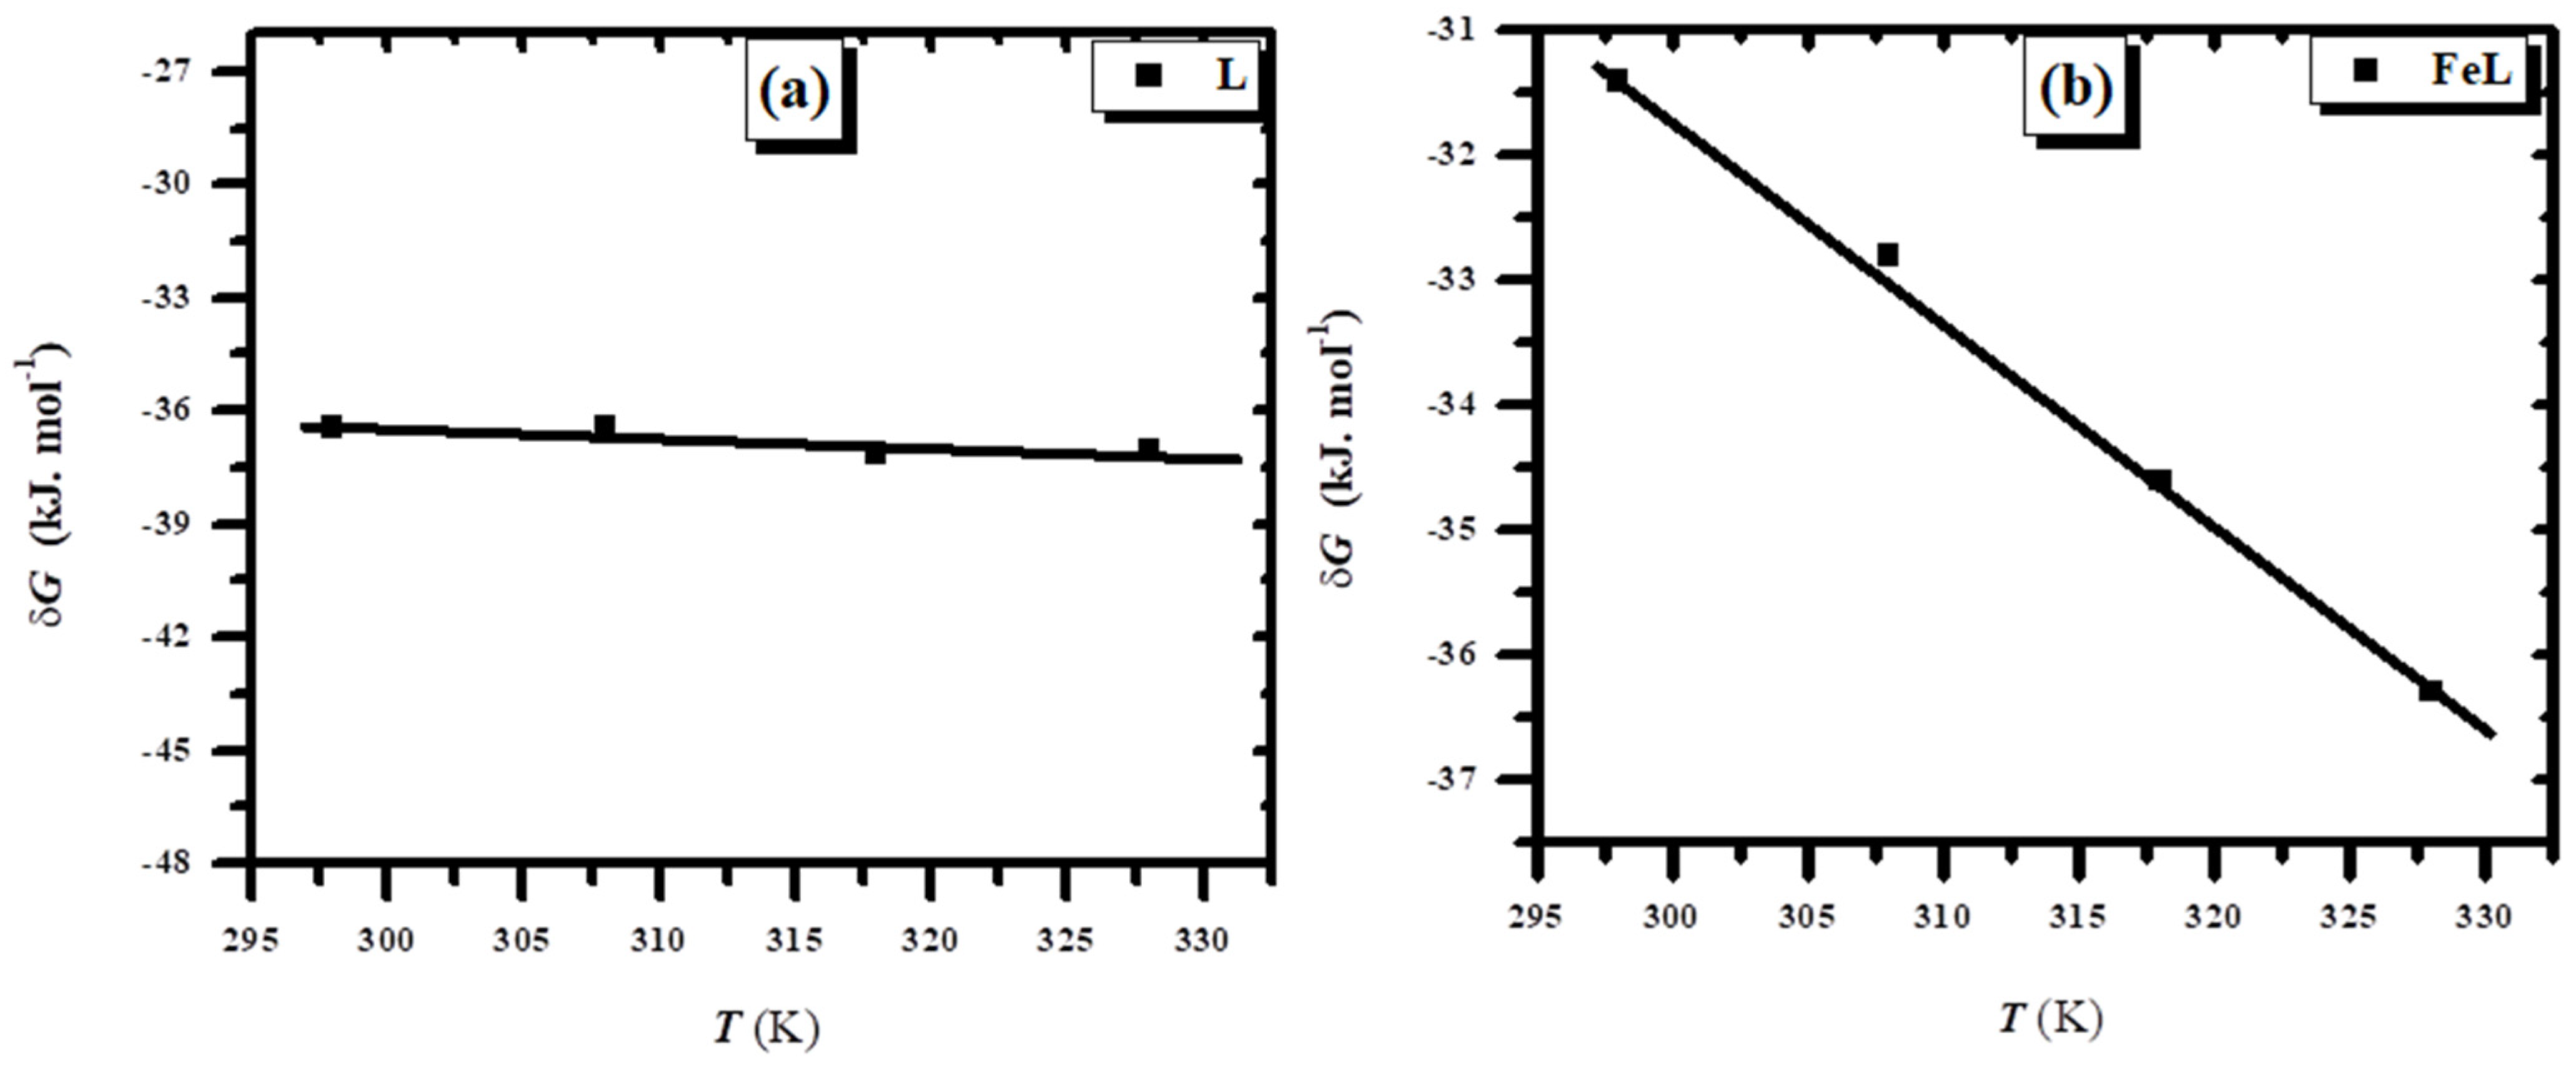
Here, Kads is the equilibrium parameter for adsorption–desorption operations and Cinh. is concentration of organic additive in acidic conditions. The Gibbs free energy of adsorption (ΔGadso) for Ni at 298 K was determined to be −39.30 and −31.40 kJ mol−1 in the presence of L and FeL, respectively. These significantly negative values suggest strong relationships between the inhibitor molecules and the metal surface, indicating favorable interactions [55]. It is well-established that physisorption occurs at ΔGadso values of ≤−20 kJ mol−1, while chemical adsorption, characterized by the formation of coordinate covalent bonds, is represented by values ≥ −40 kJ mol−1 or lower [56]. It should be highlighted, nonetheless, that there are other explanations for organic molecule adsorption besides physical or chemical ones [57]. In this work, ΔGadso values for FeL and L are closer to −40 kJ mol−1. The process of adsorption on the Ni surface involves a mechanism that is primarily chemisorption, yet with some physical adsorption characteristics. It is plausible to suggest that both L and FeL inhibitors are adsorbed through a combination of chemical and physical interactions, with a substantial role played by chemisorption [56]. Table 6 presents the adsorption isotherm parameters, which indicates the efficiency of these additives on Ni in a 0.5 M H2SO4 environment at various concentrations. The graphical representation in Figure 12 illustrates the relationship between the Gibbs free energy of adsorption (ΔGads) and temperature (T) for Ni metal when exposed to both types of additives.
Standard enthalpy changes ΔH0ads rates, as have been determined. The interaction energies for Ni in H2SO4, when treated with significant amounts of L and FeL, were measured at −29.14 and −31.01 kJ/mol, respectively. This outcome indicates that the adsorption process is exothermic. Moreover, the study validated that the effectiveness of inhibition exhibits temperature-dependent variation when using the chemisorption approach (Figure 12). The standard entropy change ΔS0ads values were found to be −520 and −160 kJ/mol for Ni, respectively. The negative value of ΔH0ads revealed an exothermic adsorption path for organic additives [58,59,60,61]. A decrease in solvent energy as well as a decline in water desorption entropy may be associated with a negative ΔS0ads value [62,63,64].

3.2.5. Surface Characterization

Scanning Electron Microscope (SEM)
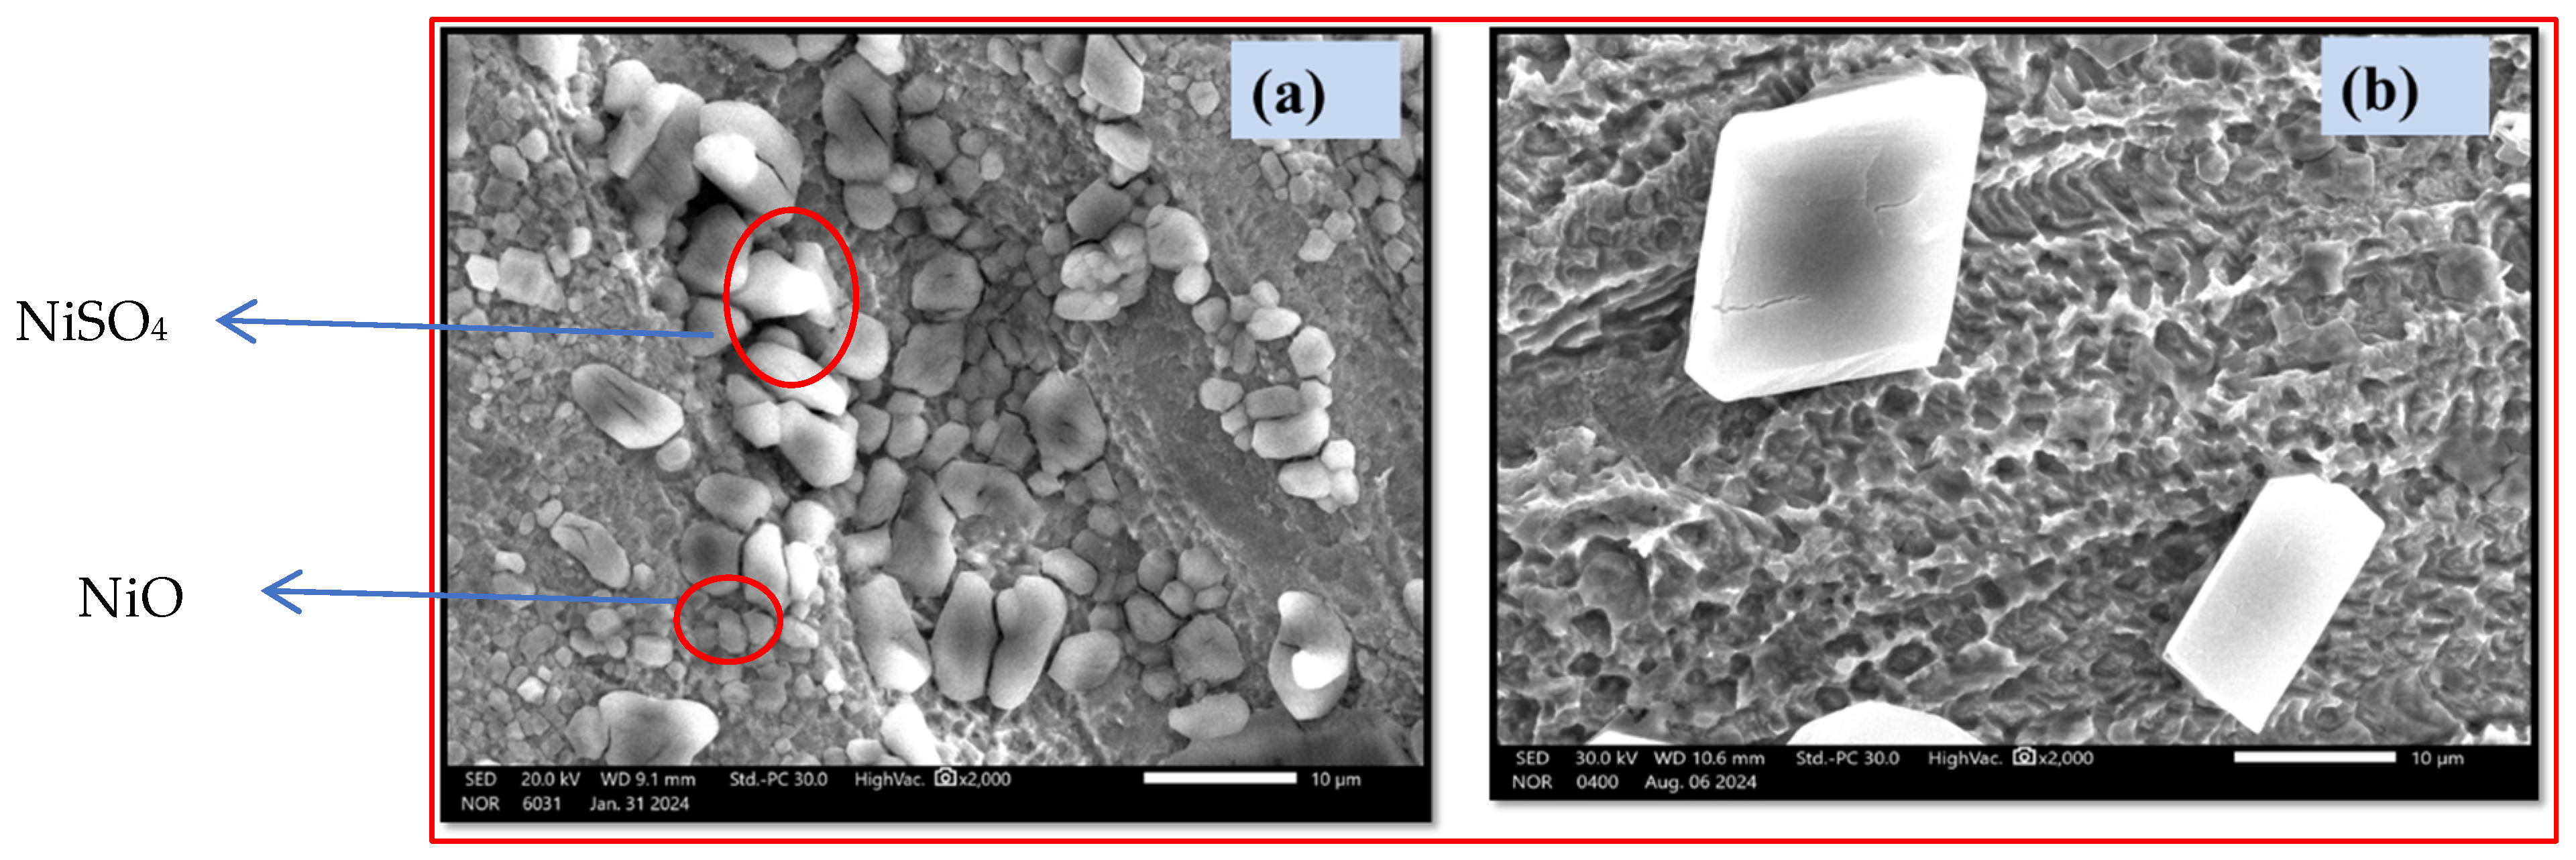
The inhibiting impact of inhibitors was assessed by assessing scanning electron imaging SEM microscope images of Ni following a deficit soak in 0.5 M H2SO4, while the presence of various concentrations of L and FeL is displayed in Figure 13a,b and Figure 14a–c. With a lack of additives, the metal surface is extremely rough and coated by a heavy coating of spongy oxide from NiO and NiSO4 due to severe corrosion (Figure 13a). The surface is smoother and the quantities of sulfate and nickel oxide particles are reduced when L is present at a high concentration 1 × 10⁻³ (Figure 13b) compared to when it is not, pointing out that the L additive has an inhibiting impact. When different concentrations of FeL are present in the solution (1 × 10⁻⁵, 1 × 10⁻⁴, 1 × 10⁻³ M), the NiO and NiSO4 particles undergo a significant transformation, effectively disappearing, and the outer layer of the material transitions to an almost transparent and pristine state. New small particles are present on the surface due to the presence of the FeL complex, which is chemisorbed. The amount of these particles is very low, and the surface in this case was apparent. These outcomes indicate how the inhibition efficiency of FeL increases Ni’s ability to withstand corrosion in acidic settings. This is how a low corrosion rate and the positive usage of Ni in acidic atmospheres were attained via green and well-proposed inhibitors [65,66,67,68,69].
Energy-Dispersive X-Ray Spectroscopy (EDX)
The preservative layers implemented on the Ni surface have been analyzed via EDX analysis. The intensity of the Ni signal suggests the formation of protective layers. Table 7 presents the results of the EDAX analysis of Ni immersed in 0.5 M H2SO4 with the presence of 1 mM of L and FeL. The findings indicate that in the absence of additives, the corroded Ni surface consists mainly of metal oxides and metal sulfates (as seen in Table S3). When the electrode is exposed to 0.5 M H2SO4 with 1 × 10⁻⁵ M of L inhibitor, there is an increased presence of oxygen and sulfur on the Ni surface compared to after exposure to the acid alone. This suggests that the inhibitor has an effect on the film formation and composition. This maintains the preventive impact of ligand particle adsorption on the metal’s surface. This is an important success, since it validates earlier discussions and data gathered through employing the technique of Electrochemical Impedance Spectroscopy (EIS) alongside Tafel plot analysis, after which it was observed that the addition of 1 × 10⁻³ M of the compound FeL to the system resulted in exceptional protection for the nickel (Ni) surface. This remarkable protection effect is attributed to the formation of a protective film of adsorbed inhibitor molecules (FeL) that adhere to the nickel’s surface, thereby significantly enhancing its corrosion resistance. This led to the outstanding level of inhibiting impact. The ratios of oxygen are decreased from 32.20% in the presence of L to 9.66% by mass in the presence of FeL. Additionally, the percentages of sulfur in oxide films were clearly reduced from 8.21% in the case of L to 3.53% by mass in the case of FeL, while percentages of Ni are highly increased, indicating that a pure surface of the metal has been obtained, while oxides and sulfates have been greatly minimized. An iron content also appeared on the derived surface layers when FeL additive was used, confirming the chemisorption of FeL. Figure 15a,b shows an EDAX analysis of oxide coatings formed on the Ni surface after Tafel experiments in 0.5 M sulfuric acid solution containing different concentrations of FeL additive. Figure S4 shows the EDAX analysis of oxide films acquired on the Ni surface in pure medium without additives.

3.2.6. Charge Discharge Studies

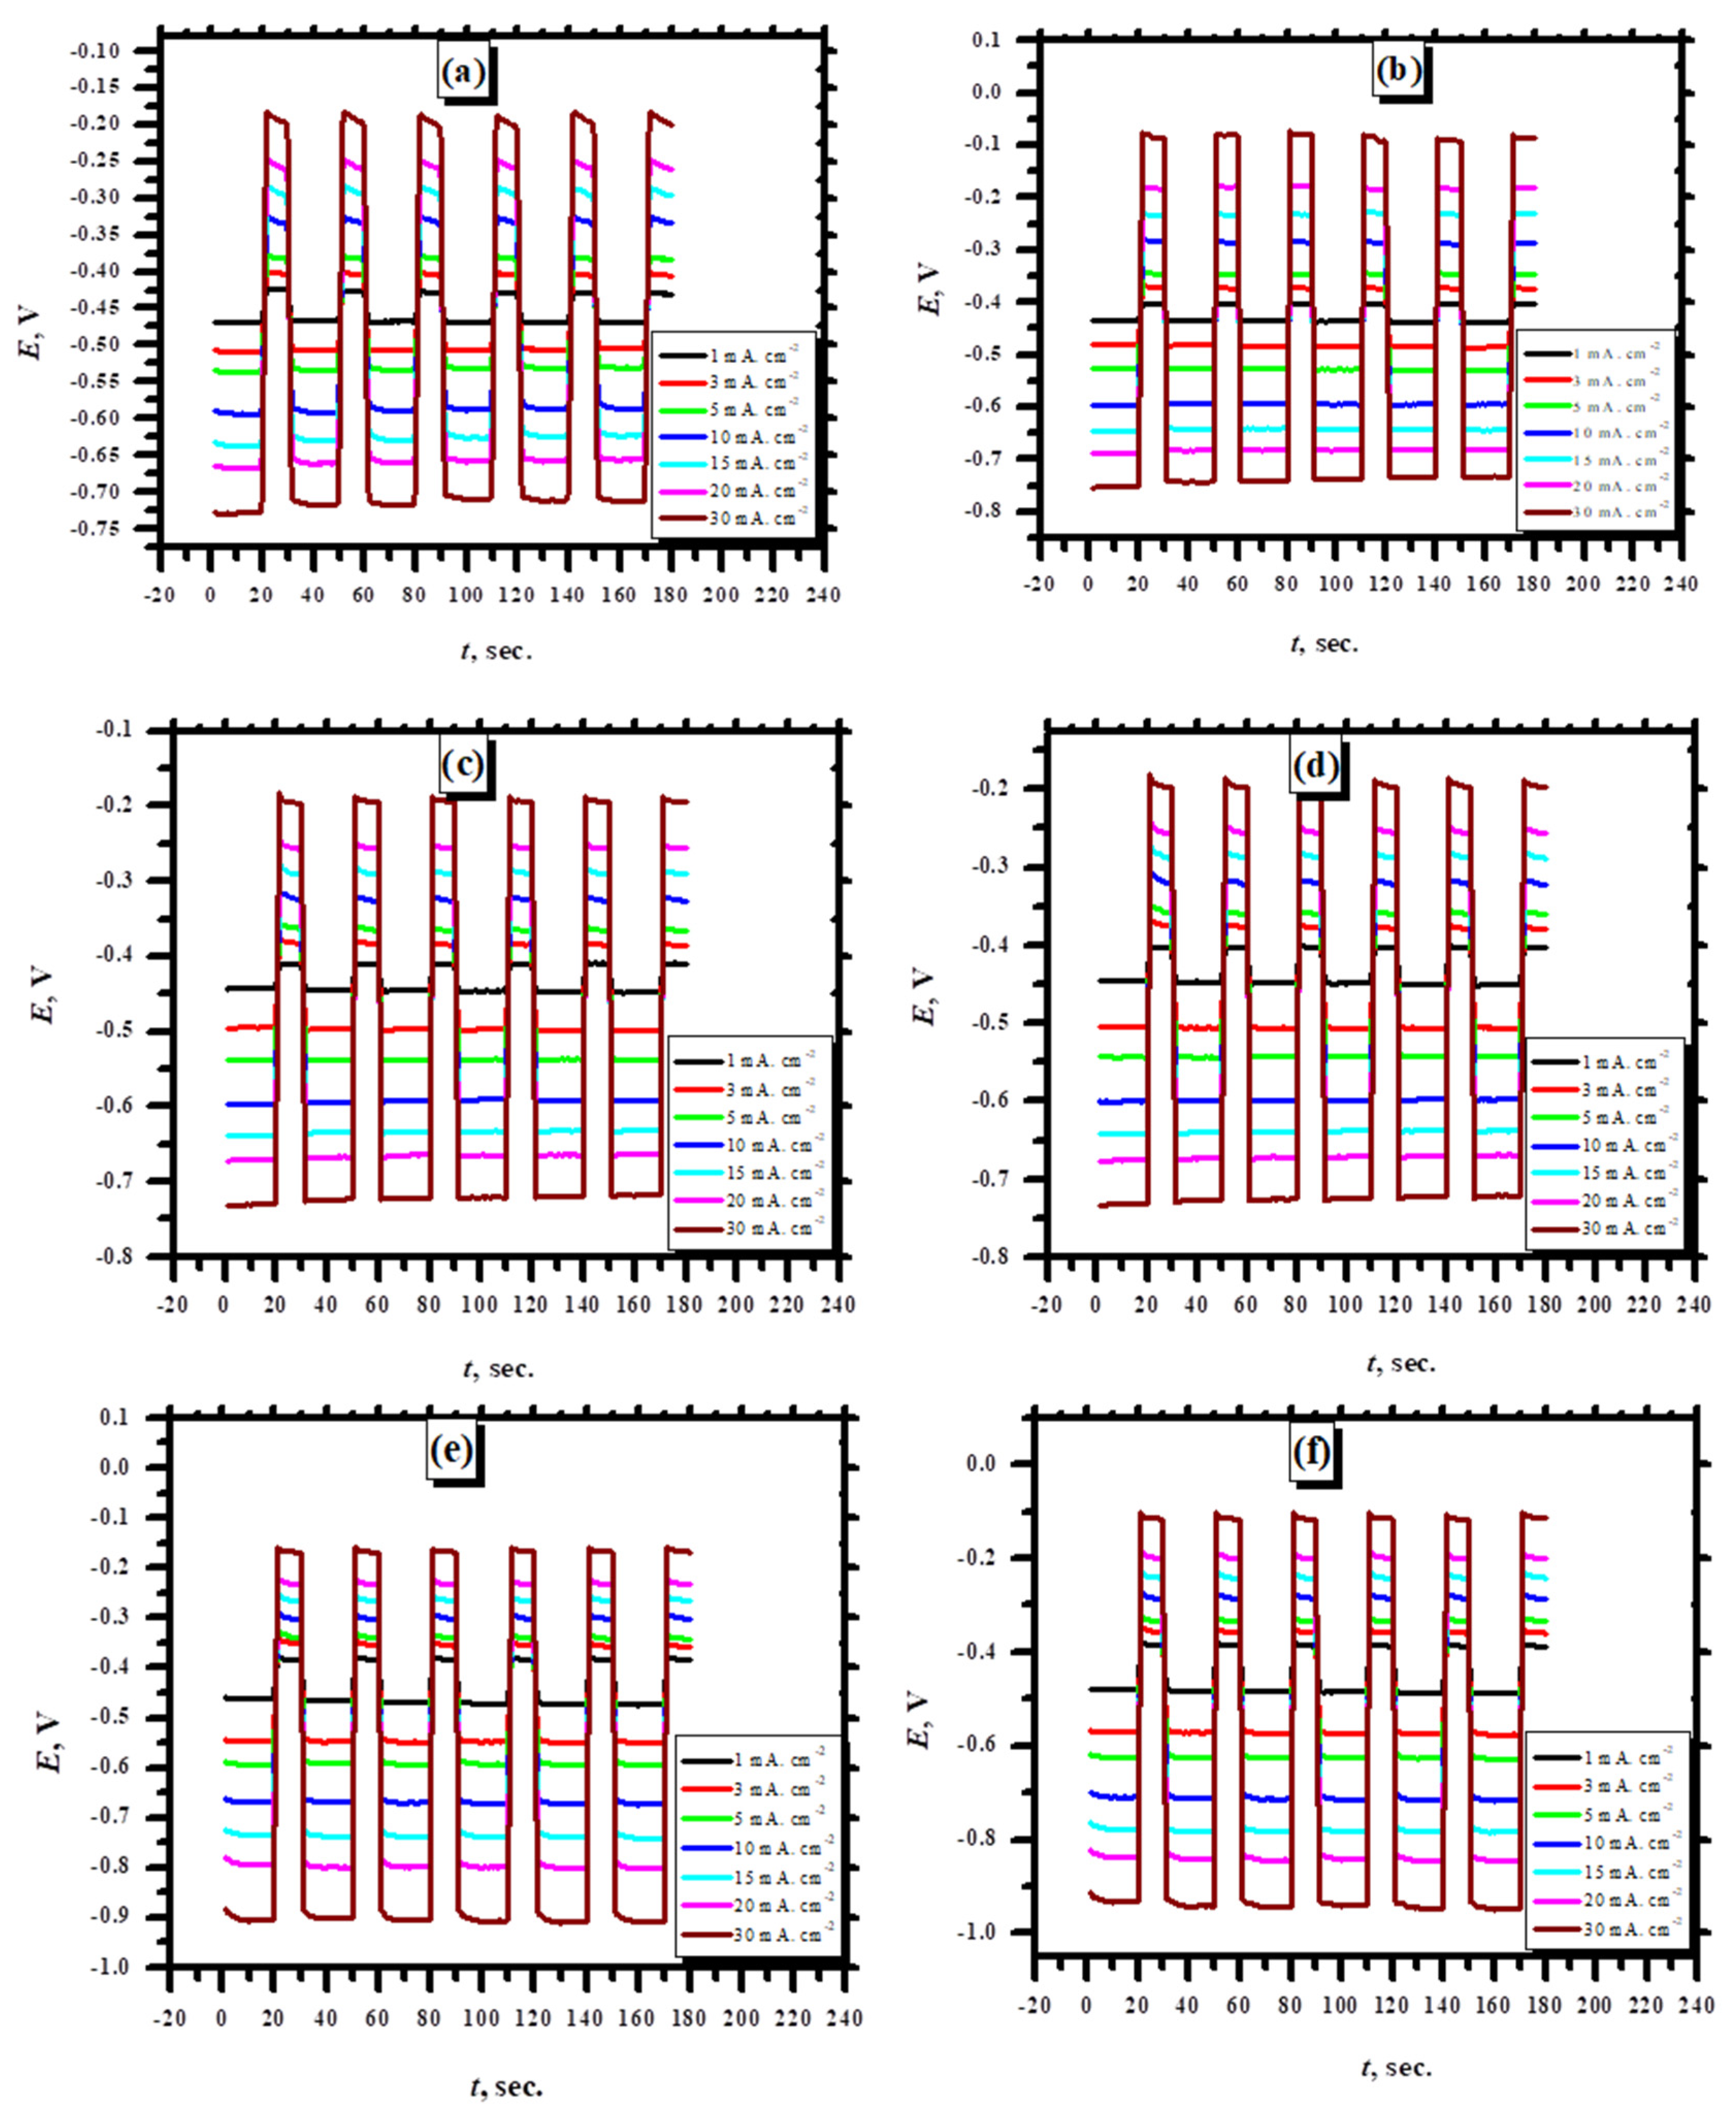
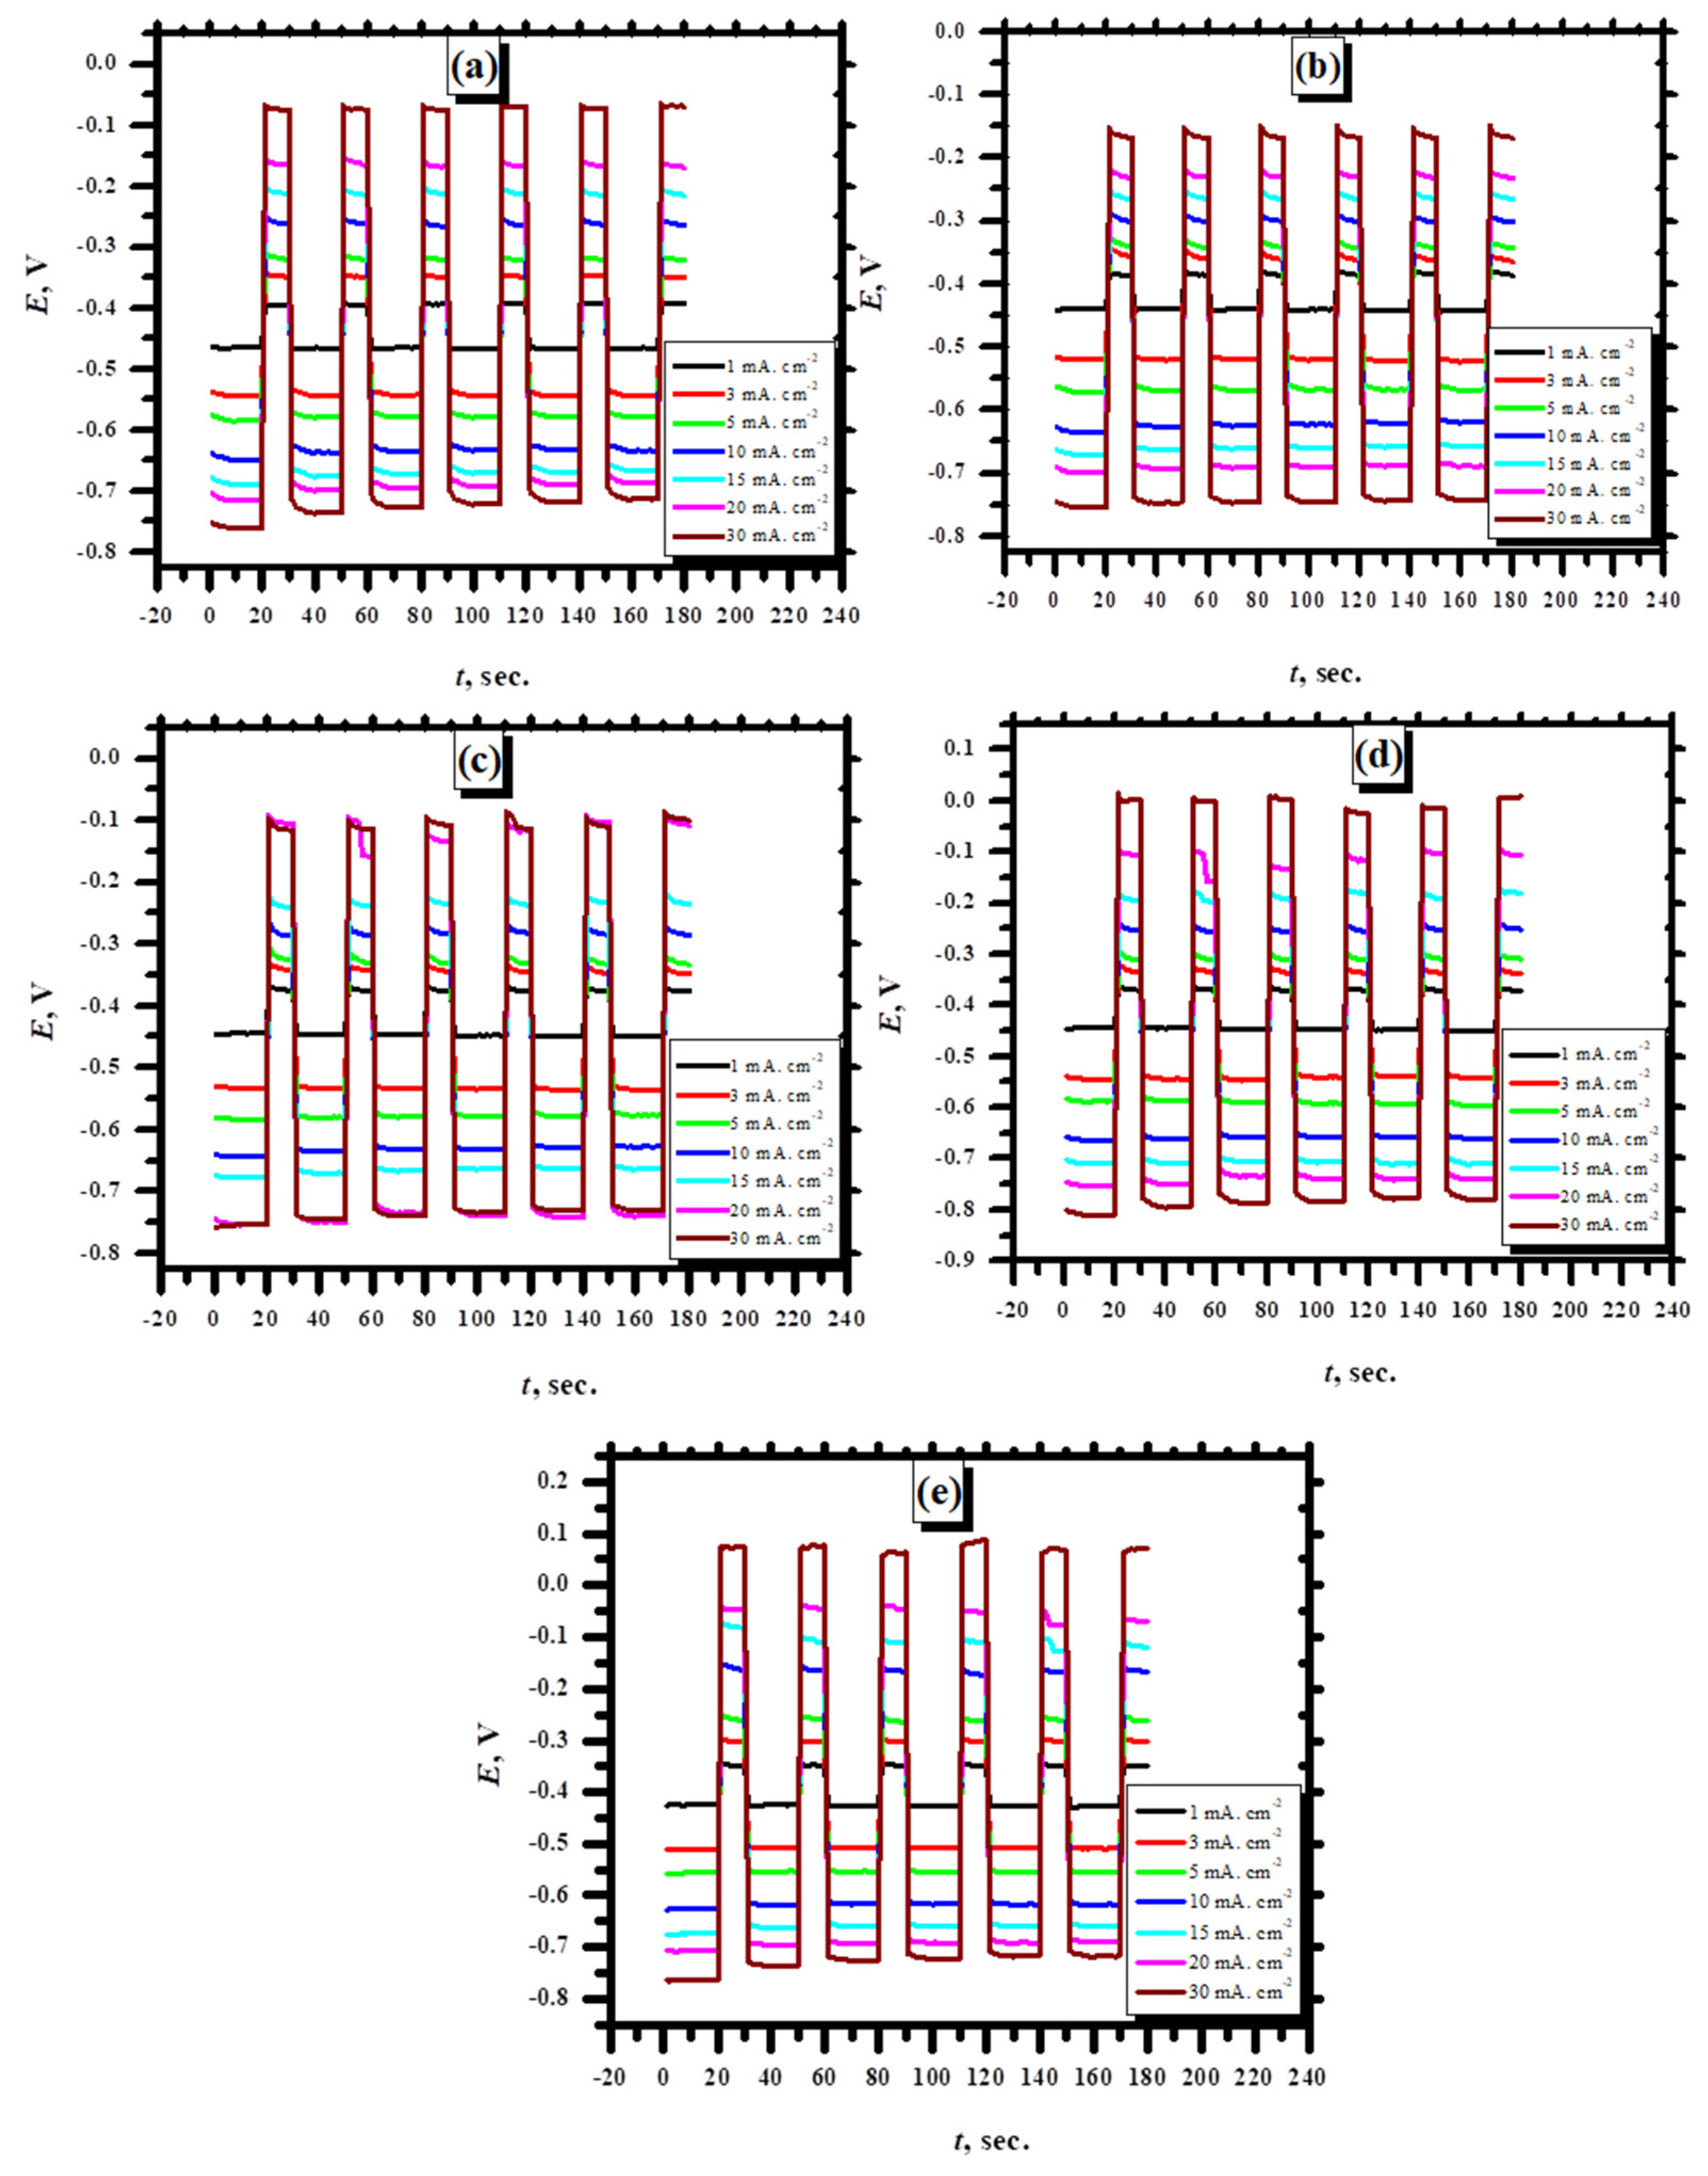
Galvanostatic charge–discharge curves for nickel electrode in 0.5 M H2SO4 without and with the inclusions applied at multiple current densities (±1, ±3, ±5, ±10, ±15, ±20 as well as ±30 mA·cm−2) are shown in Figure 16a–f and Figure 17a–e. The figure illustrates that when the applied current density is raised from ±1 to ±30 mA·cm−2, the examined electrode’s specific capacitance S.C. and potential difference ΔV generally rise. This shows that, in both the presence and absence of additives, the electrode under consideration exhibits a desirable charge–discharge behavior; in addition, a suitable discharge level was established at varied current densities. Additionally, it has been observed that in both the presence and absence of additives, increasing the applied current density increases the discharge time (tdis.).
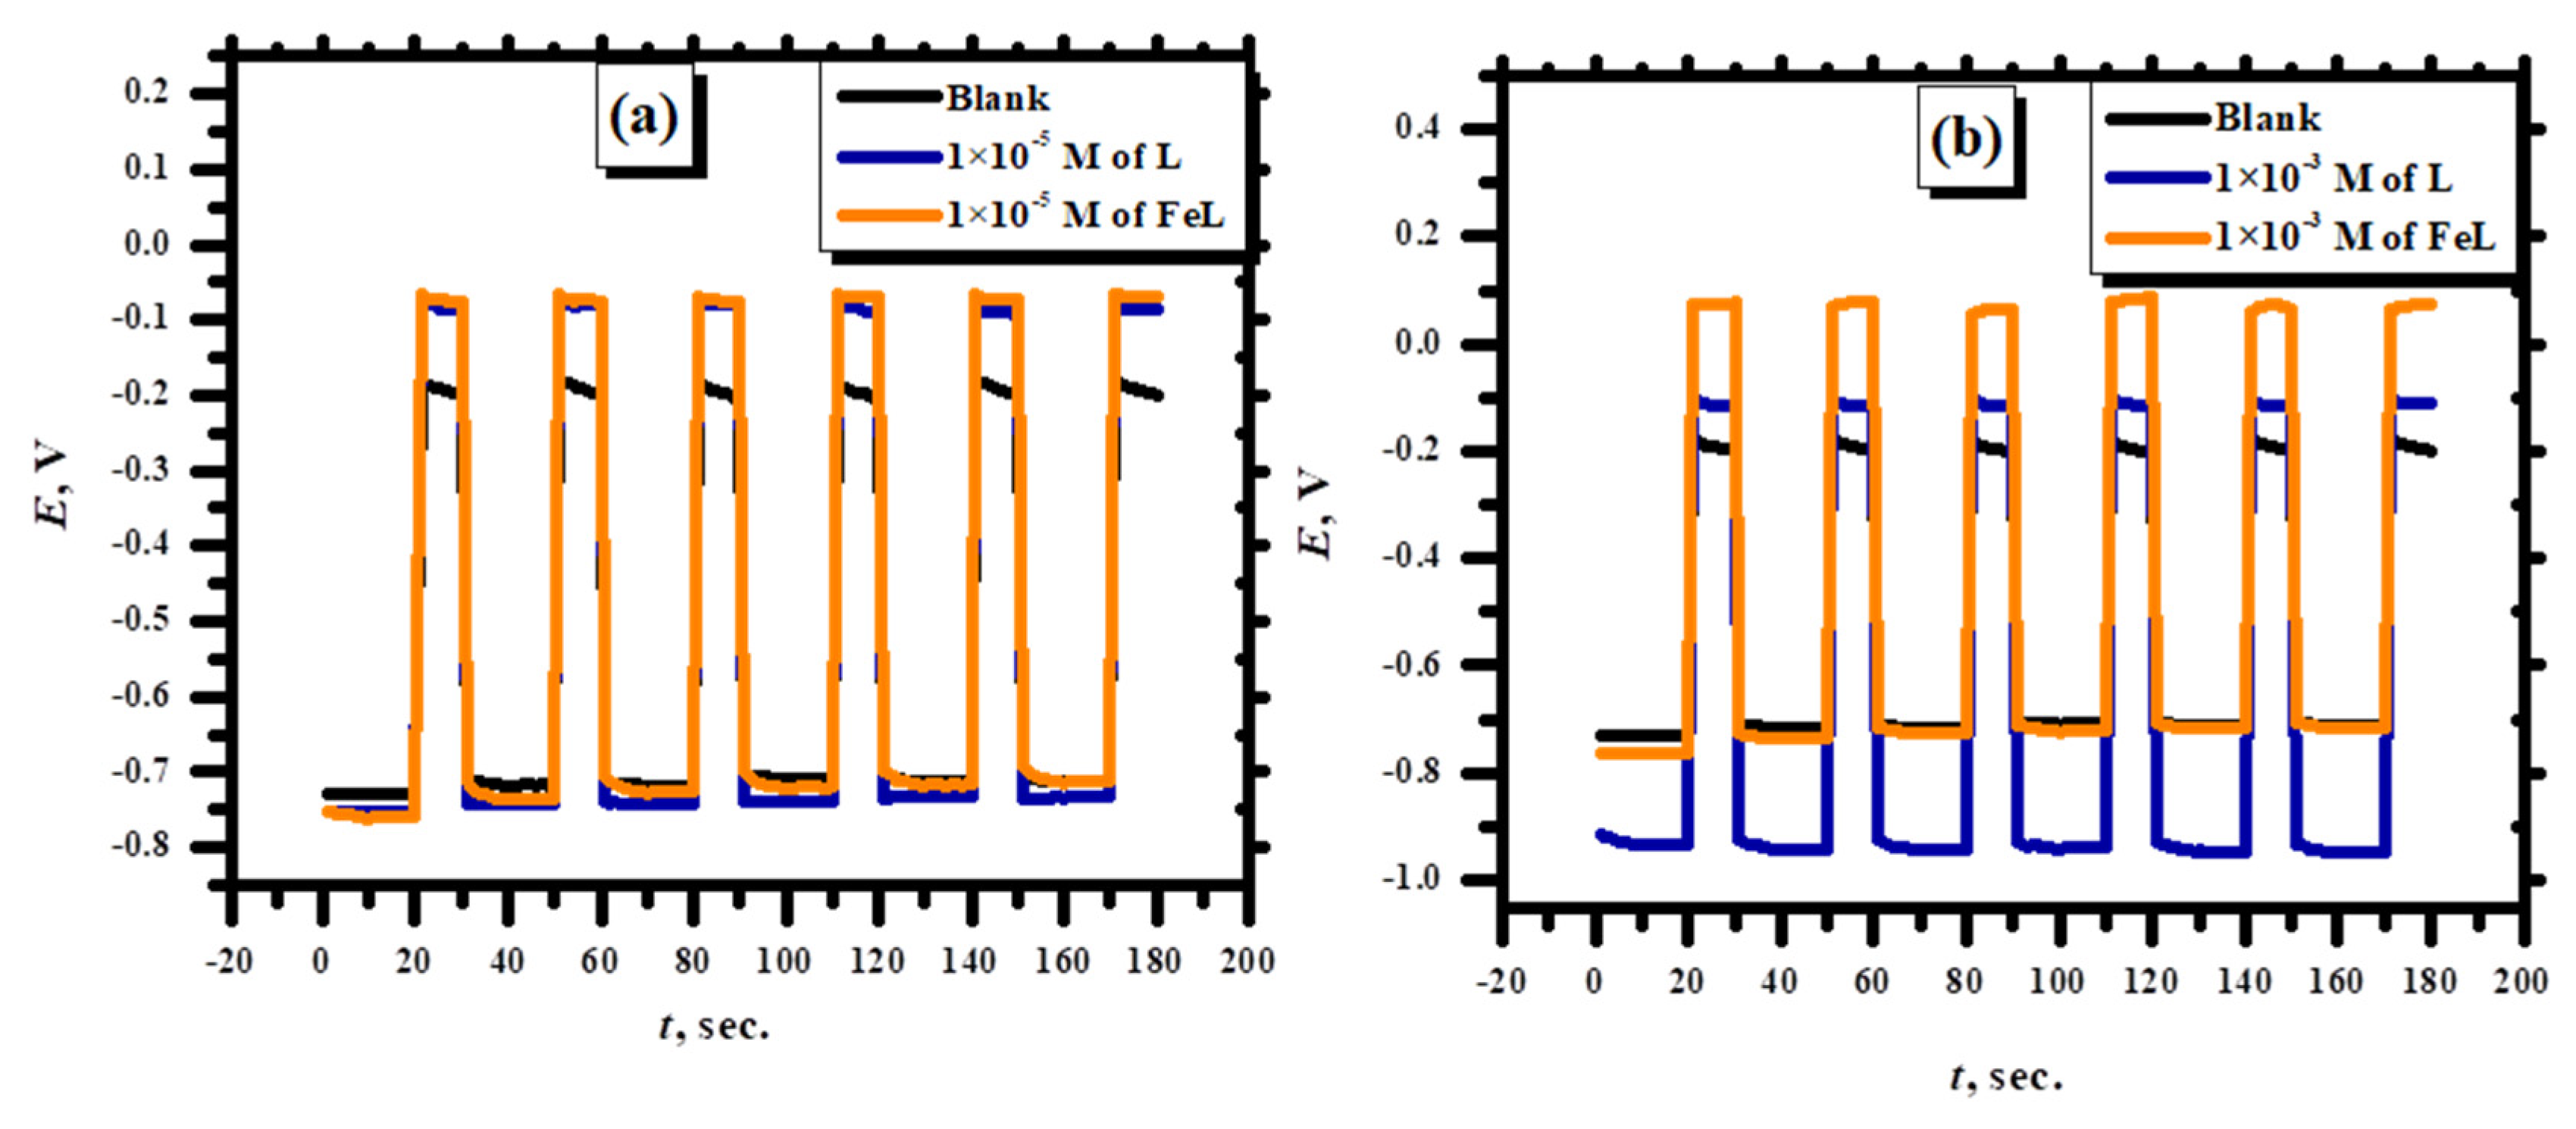
Figure 18a,b shows the galvanostatic charge–discharge curvatures for the Ni electrode in the absence as well as presence of 1 × 10⁻⁵ and 1 × 10⁻³ M of L and FeL at a conducted current of ±30 mA·cm−2. It was noticed that the Ni metal reached the highest discharging time (13.3 s) in the presence of 1 mM of L and FeL at an applied current density of ±30 mA·cm−2. Also, the specific capacitance of Ni reached improved values 0.544 and 0.179 mAhr in the presence of 5 × 10⁻⁵ M of L and FeL, respectively, at the applied current density ±30 mA·cm−2. It is commonly recognized that the energy density of nickel metal is primarily determined by how well the nickel anode material is used in the solution. Nevertheless, in certain situations, the oxidation of nickel may not be suitable for the nickel anode, and in the solutions used here, hydrogen spontaneously evolves on the surface. As a result, increasing concentrations of L and FeL in the solution slows down the nickel’s spontaneous self-discharge, increasing discharge efficiency. Table 8 shows the charge–discharge parameters (tdis., ΔV, S.C.) for the investigated electrode in 0.5 M H2SO4, possessing different concentrations of L and FeL.
The above results show the stability of the investigated electrode. It was detected that the discharging time of Ni reached a higher value in the presence of 1 mM of L and 0.1 mM FeL in 0.5 M H2SO4, showing that its impedance behaviors were improved, and thus confirming the obtained impedance data. These experimental data demonstrate that energy efficiency has been enhanced. Finally, the data show that the addition of L and FeL has a notable impact on the developing features of the nickel anode in acidic media. This improvement can be attributed to the fact that the corrosion potential of Ecorr has been switched to an excessively negative value when the electrode is in the presence of these additives. Accordingly, the investigated electrode has lower corrosion attack resistance, enhanced discharging time, as well higher specific capacitance (especially in the presence of 5 × 10⁻⁵ M), in the presence of our novel prepared ligand and its FeL complex.

3.3. Computational Details

3.3.1. Optimized Structure

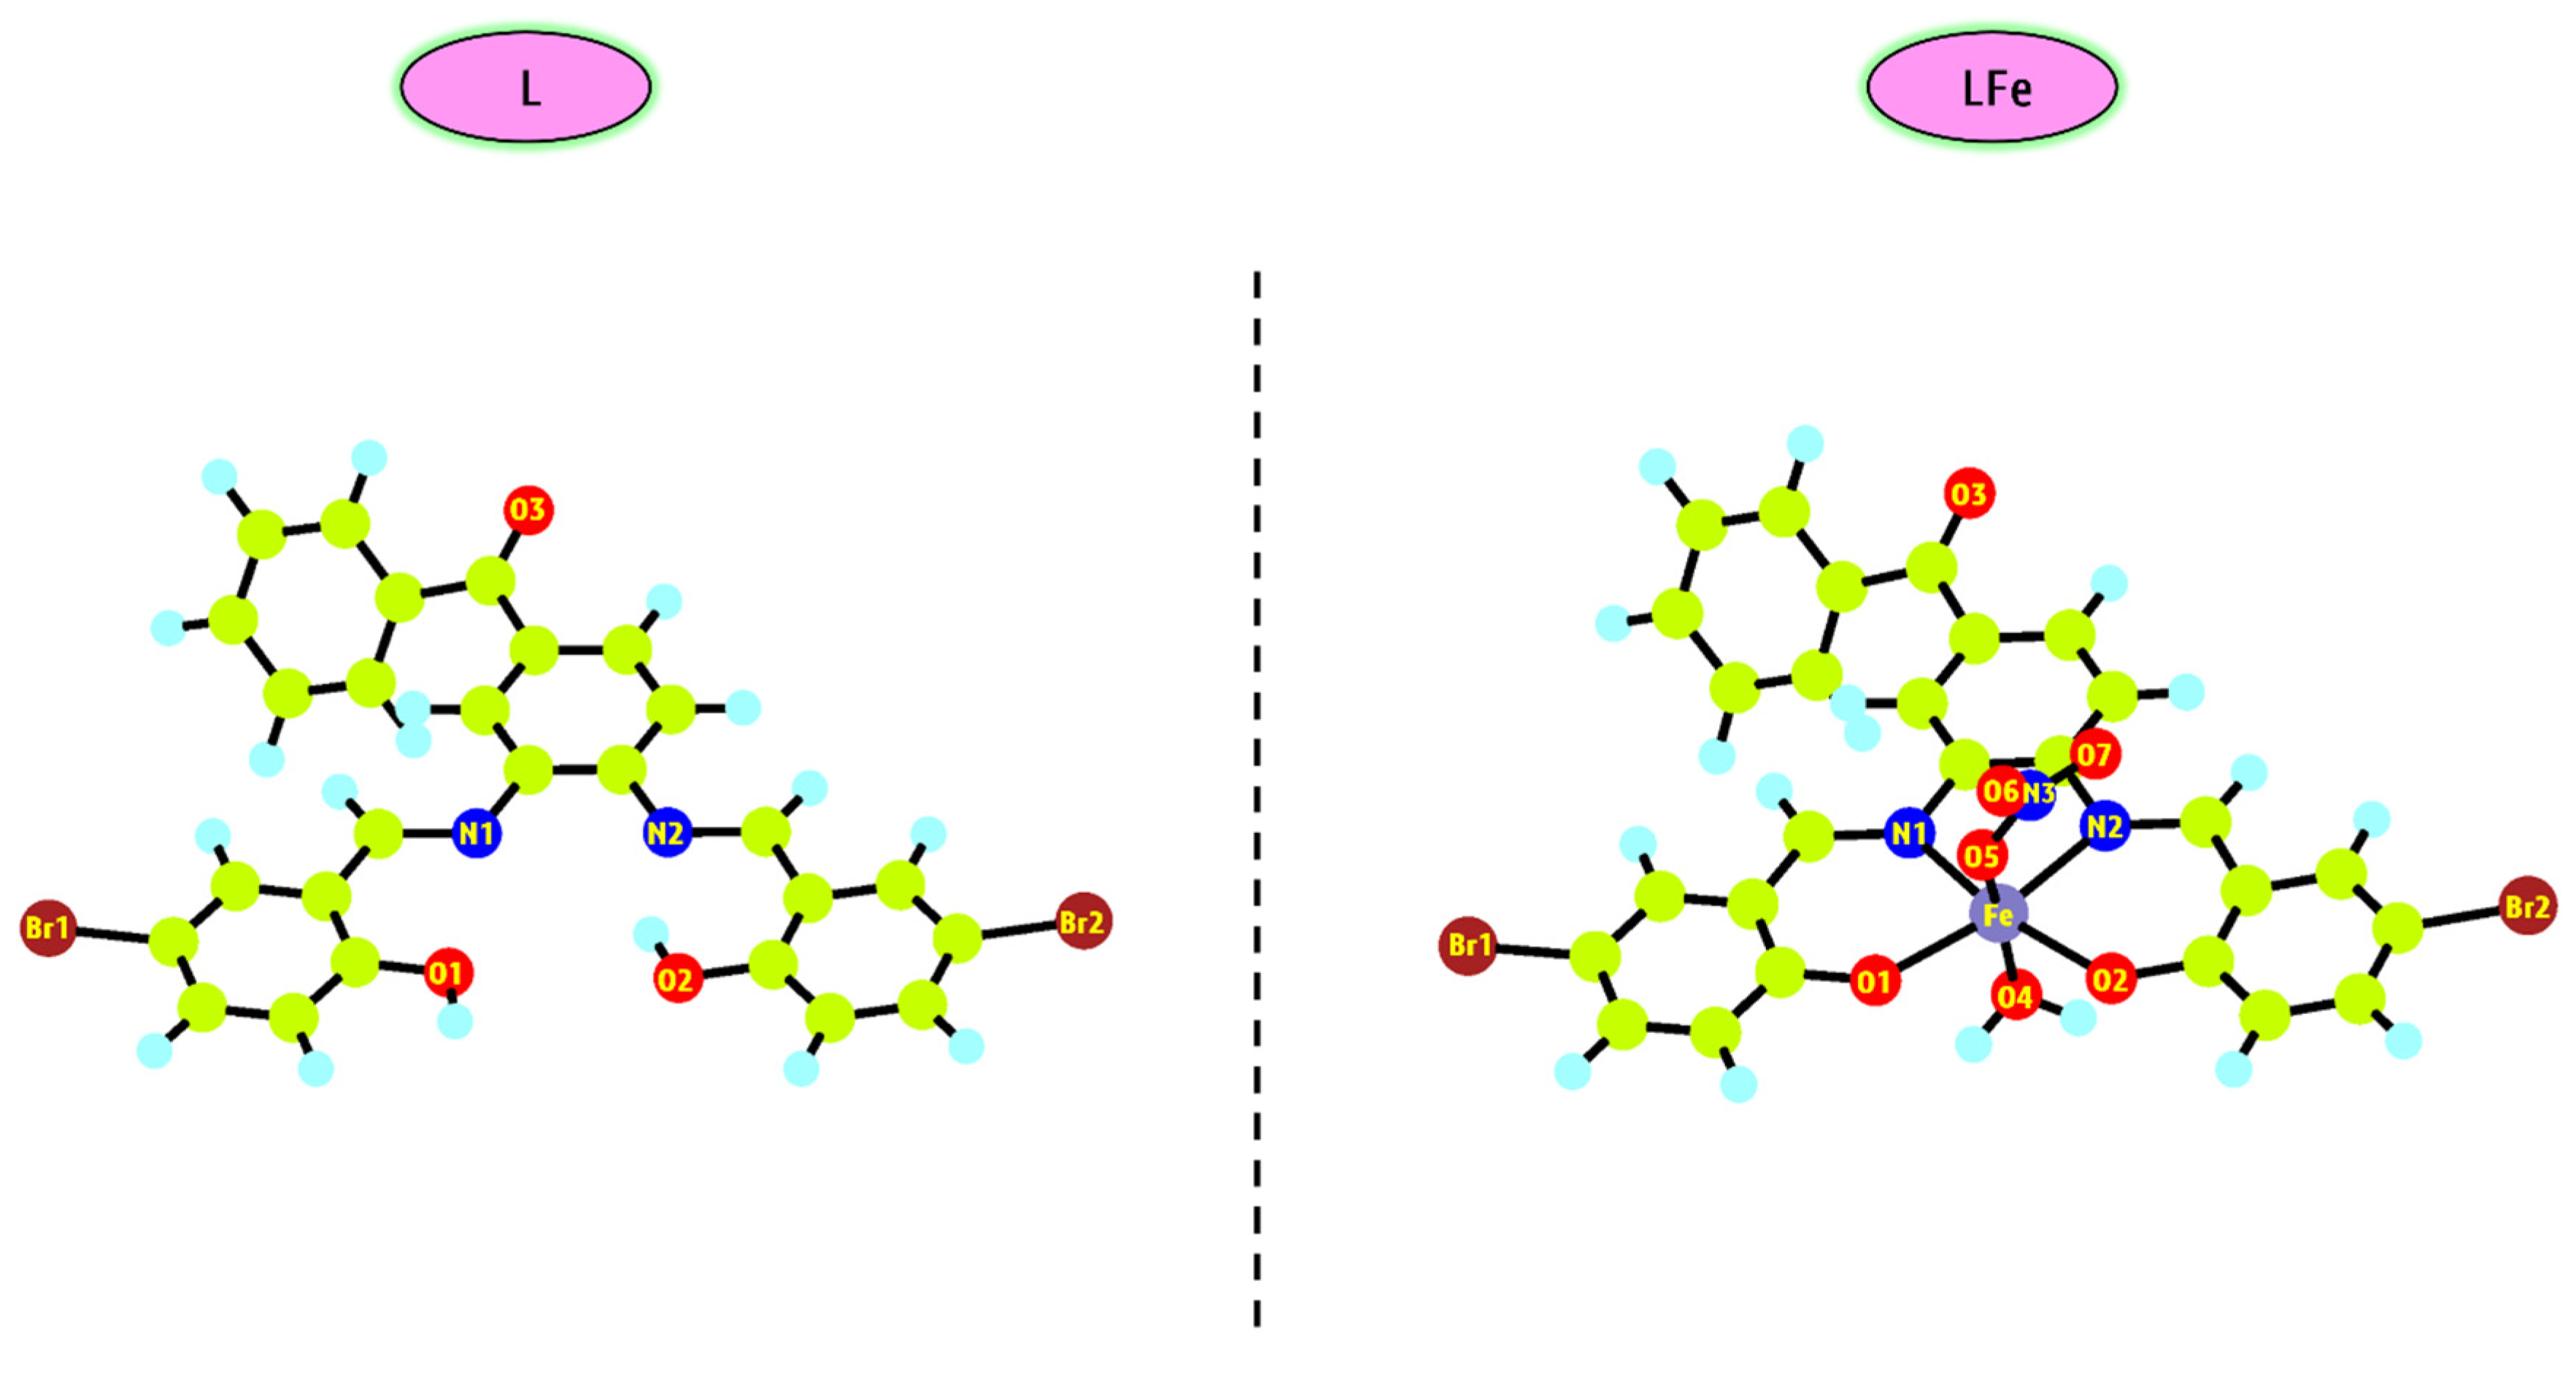
The geometric optimization of L (ligand) and its complex (FeL) was carried out using the DFT/B3LYP method in the gas phase. For this process, the 6-311g (d,p) basis set was employed for lighter atoms, while the LANL2DZ basis set was utilized for Fe3+. The calculated lowest-energy configurations for L and FeL were determined to be −6523.40 and −7002.49 Hartree, respectively. The findings reveal that the synthesized Fe(III) complex exhibits significantly enhanced energy stability compared to the L ligand. Furthermore, the optimized structures were confirmed to represent true energy minima, as evidenced by the complete absence of imaginary harmonic frequencies. The optimized geometry of the title compounds is demonstrated in Figure 19. During the optimization process, the Fe3⁺ ion was found to adopt an octahedral geometry. The DFT analysis of the metal ion’s configuration aligns well with the structural model of the FeL complex presented in the Section 2.

3.3.2. MEP Mapping

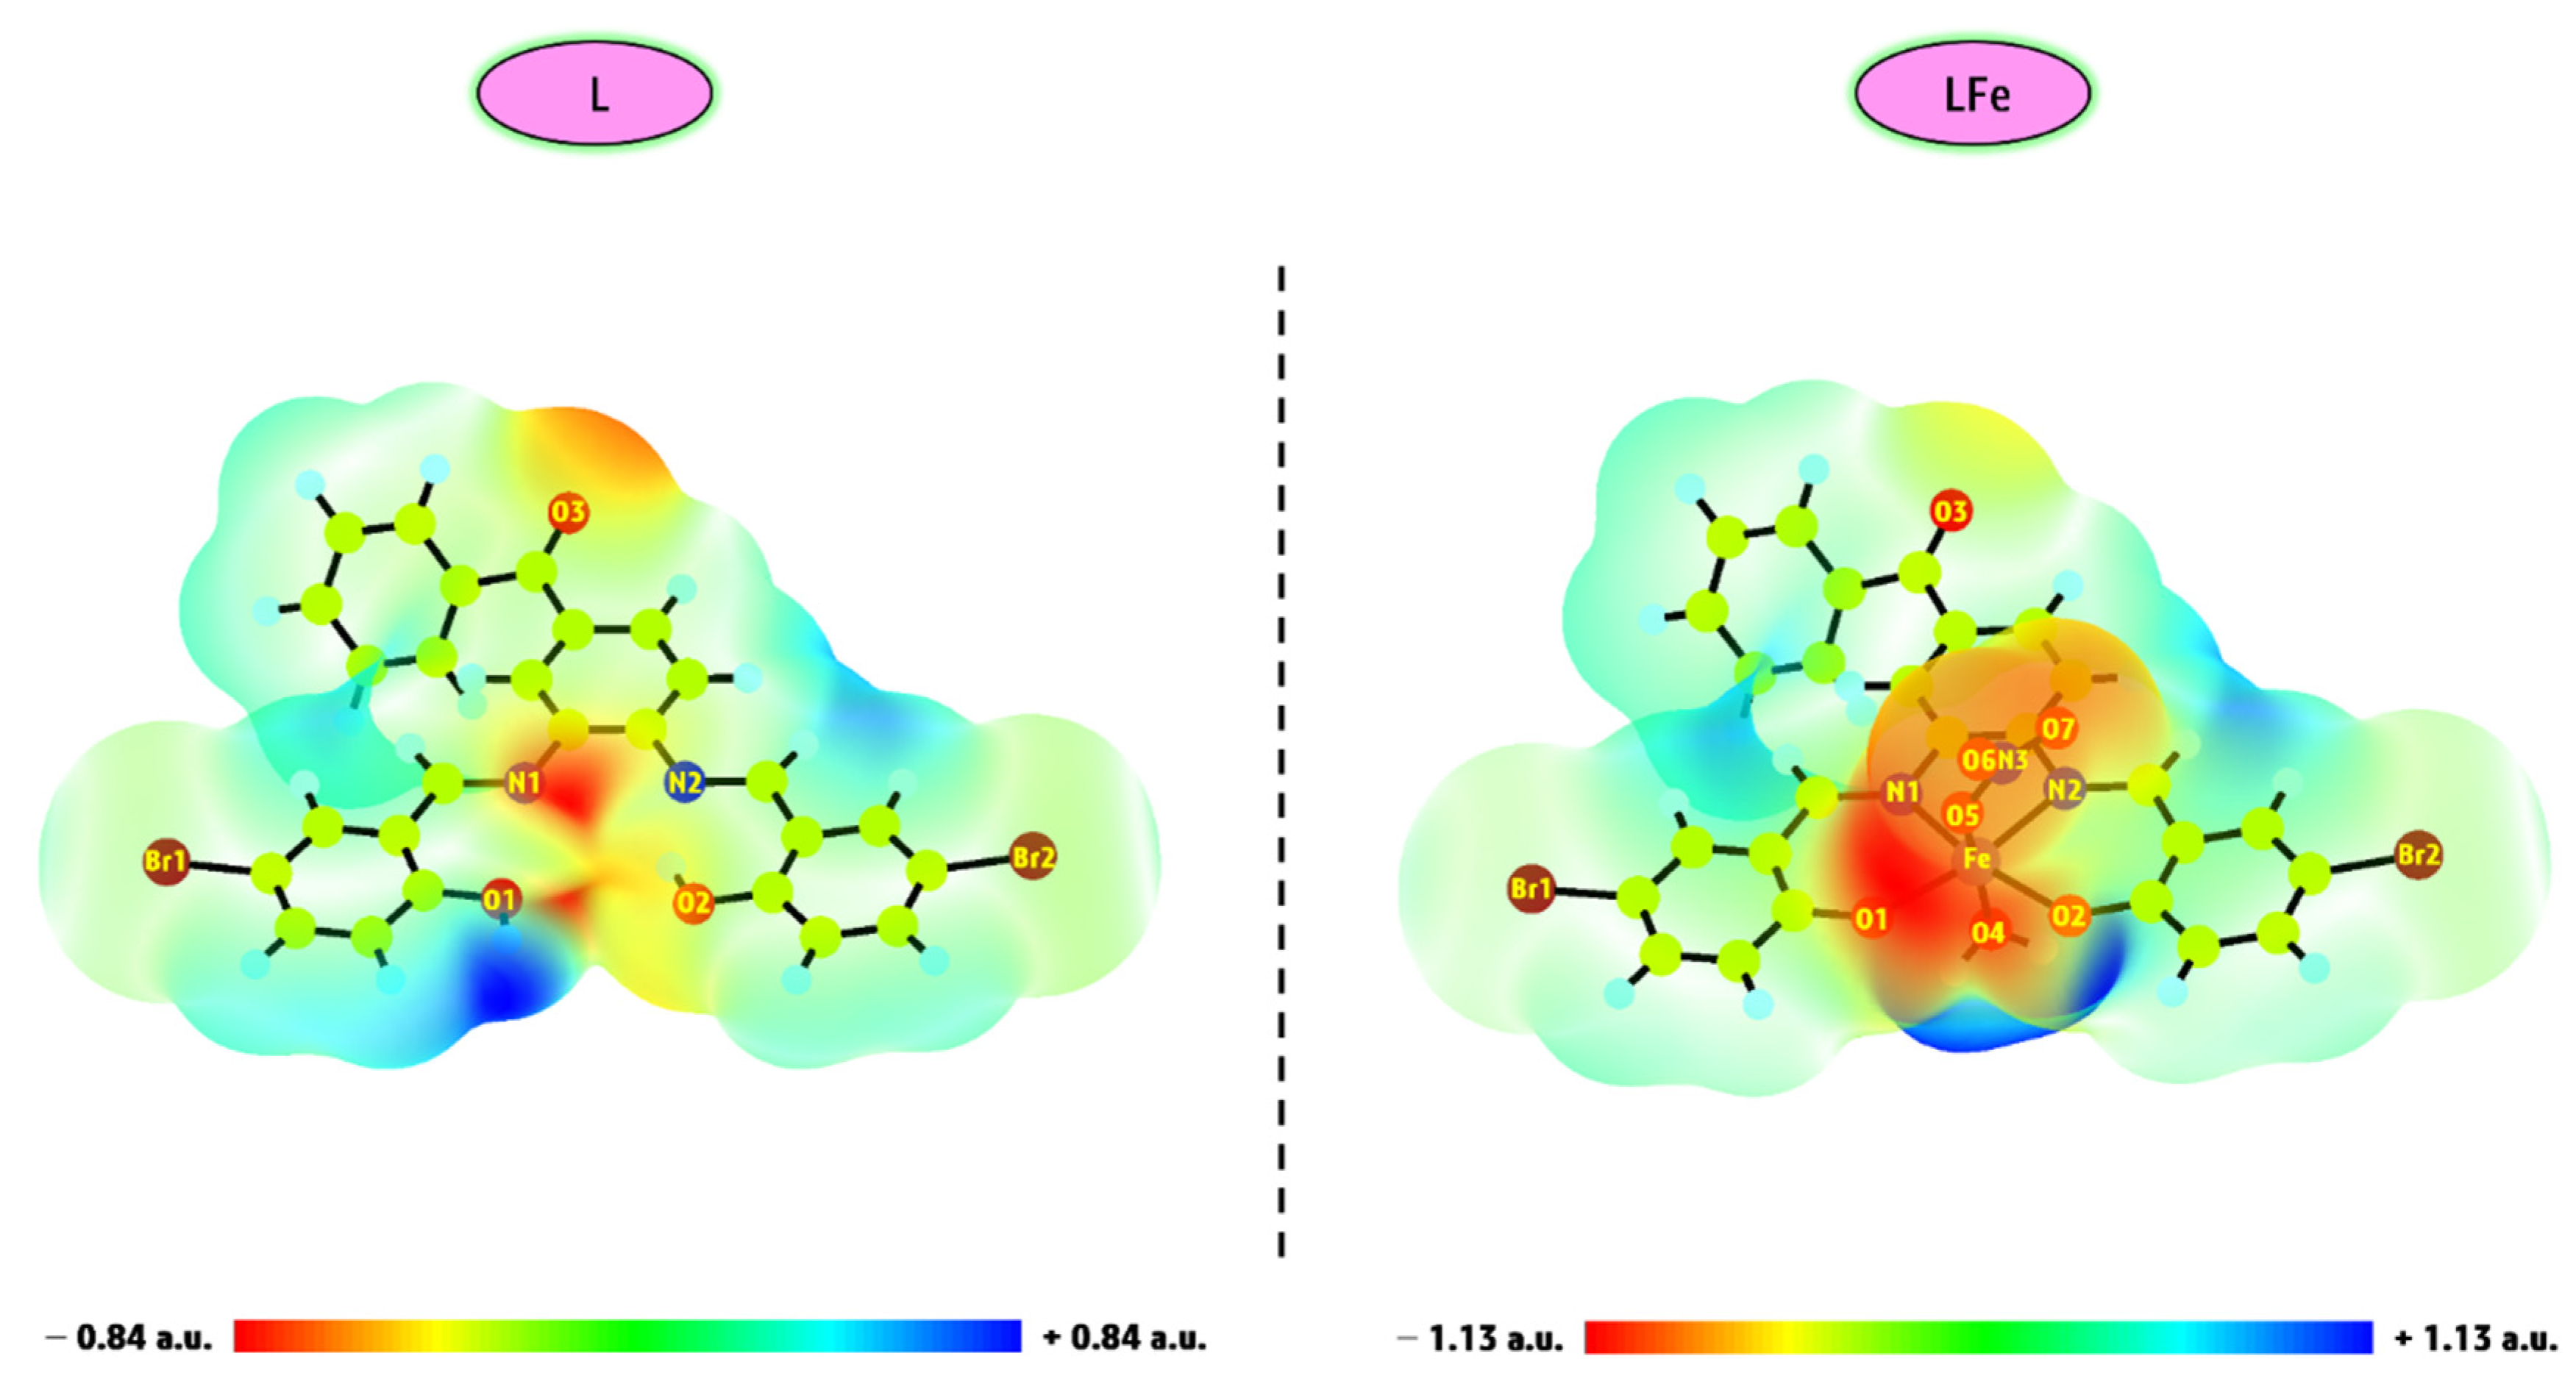
The MEP offers a visually creative illustration of the electrostatic charge distribution within a molecule, providing valuable insights into the properties of its binding areas [70]. Typically, different colors are used to signify varying charge regions—red, orange, and yellow indicate negatively charged zones prone to electrophilic interactions; blue highlights areas susceptible to nucleophilic attacks; and green denotes regions with neutral potential [71,72]. Using the DFT/B3LYP/6-311g (d,p)/LANL2DZ methodology, MEP diagrams were generated for L and LFe. The results are illustrated in Figure 20. The elected representative from region L exhibits a significant amassing of negatively charged particles, namely, electrons, in the proximity of several atoms, namely, O1, O2, N1, O3, and N2. These atoms display a discernible pattern of charge concentration, with a distinct color gradient transitioning from red to yellow. A region emerges prominently in the area between N1, N2, O1, and O2, representing the presence of lone electron pairs on the electronegative atoms. This observation points to the existence of Lewis base species within these regions. As a result, it is evident that the space surrounding these atoms is highly susceptible to electrophilic interactions [73,74]. Specifically concerning metal ions like Fe3+, the Molecular Electrostatic Potential (MEP) map of the LFe system discloses significant information regarding its electrical properties. This visual representation provides a deeper understanding of the complex’s electrostatic nature and interactions. In this map, the O3 atom and the center of the molecule (the region between the O6 and O7 atoms) are highlighted in red-yellow, indicating areas of strong electron density. Conversely, the blue regions correspond to the hydrogens attached to the O4 atom, signifying areas of electron deficiency. Consequently, the electrophilic interactions of the LFe complex are predominantly directed toward the O3, O6, and O7 atoms. The Molecular Electrostatic Potential (MEP) analysis reveals that the nucleophilic propensity is particularly pronounced near the hydrogens attached to the O4 atom. This indicates that the O6 and O7 atoms possess a higher likelihood of engaging with a metallic interface relative to the rest of the molecule. This distribution is advantageous as it enhances the material’s corrosion resistance. The MEP map has been standardized with color scales ranging from −0.84 to +0.84 arbitrary units for L and −1.13 to +1.13 arbitrary units for FeL.

3.3.3. Mulliken Atomic Charge

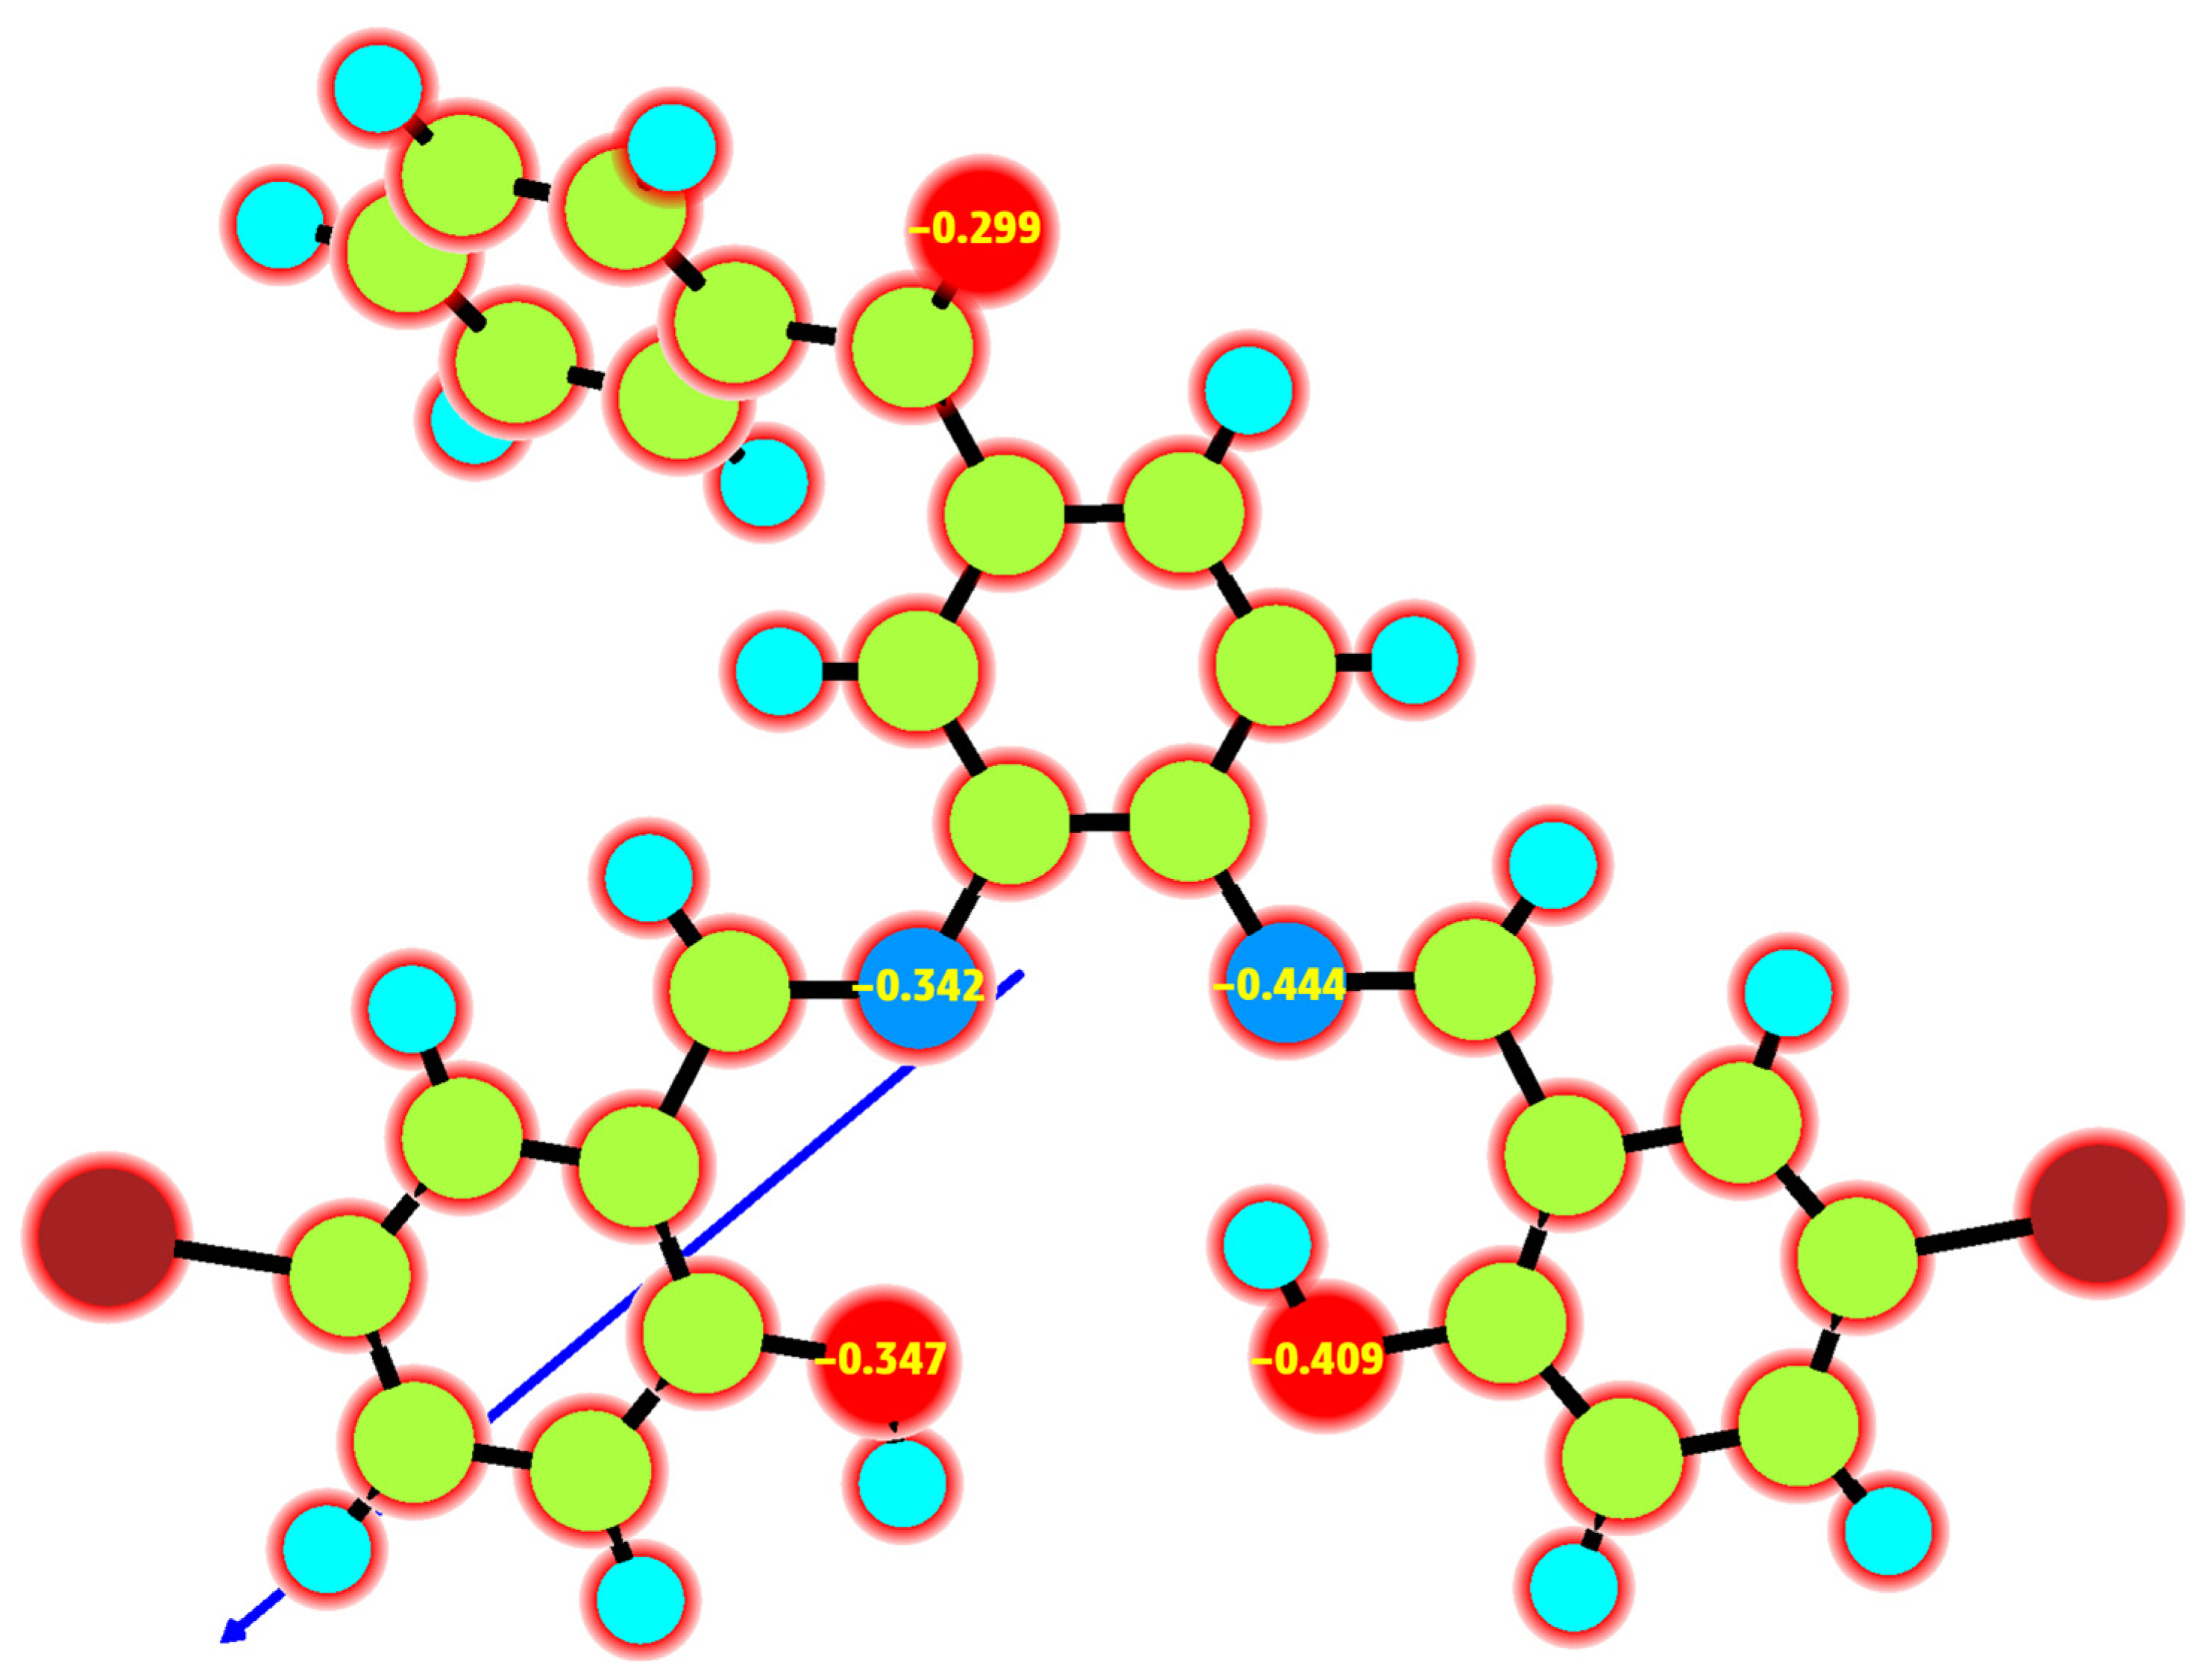
The Mulliken survey of the population offers insights into the charge distribution across individual atoms within a molecule, making it a valuable tool for examining various aspects of molecular geometry. Accurately determining atomic charges is essential when applying quantum chemical computations to study molecular interactions. For the ligand (L), the Mulliken charges for selected atoms, N1 (−0.342), N2 (−0.444), O1 (−0.347), O2 (−0.409), and O3 (−0.299), were computed based on the geometry optimized in the gas phase. These calculated negative charges on the nitrogen and oxygen atoms indicate a higher electron density in these regions, which makes them more susceptible to electrophilic interactions. As a result, N1, N2, O1, and O2 atoms are likely to form bonds with positively charged species, such as Fe3+. This finding aligns with the predictions made by the MEP diagram. The optimized geometries of L and FeL exhibit dipole moment values of 3.12 and 10.49 Debye, respectively. This result indicates that the LFe complex possesses a significantly higher dipole moment, suggesting that the process of complexation induces substantial dipole–dipole interactions within the structural framework of the complex. The Mulliken charge’s dissemination along with the dipole moment direction for the L compound is revealed in Figure 21.

3.3.4. HOMO-LUMO Analysis

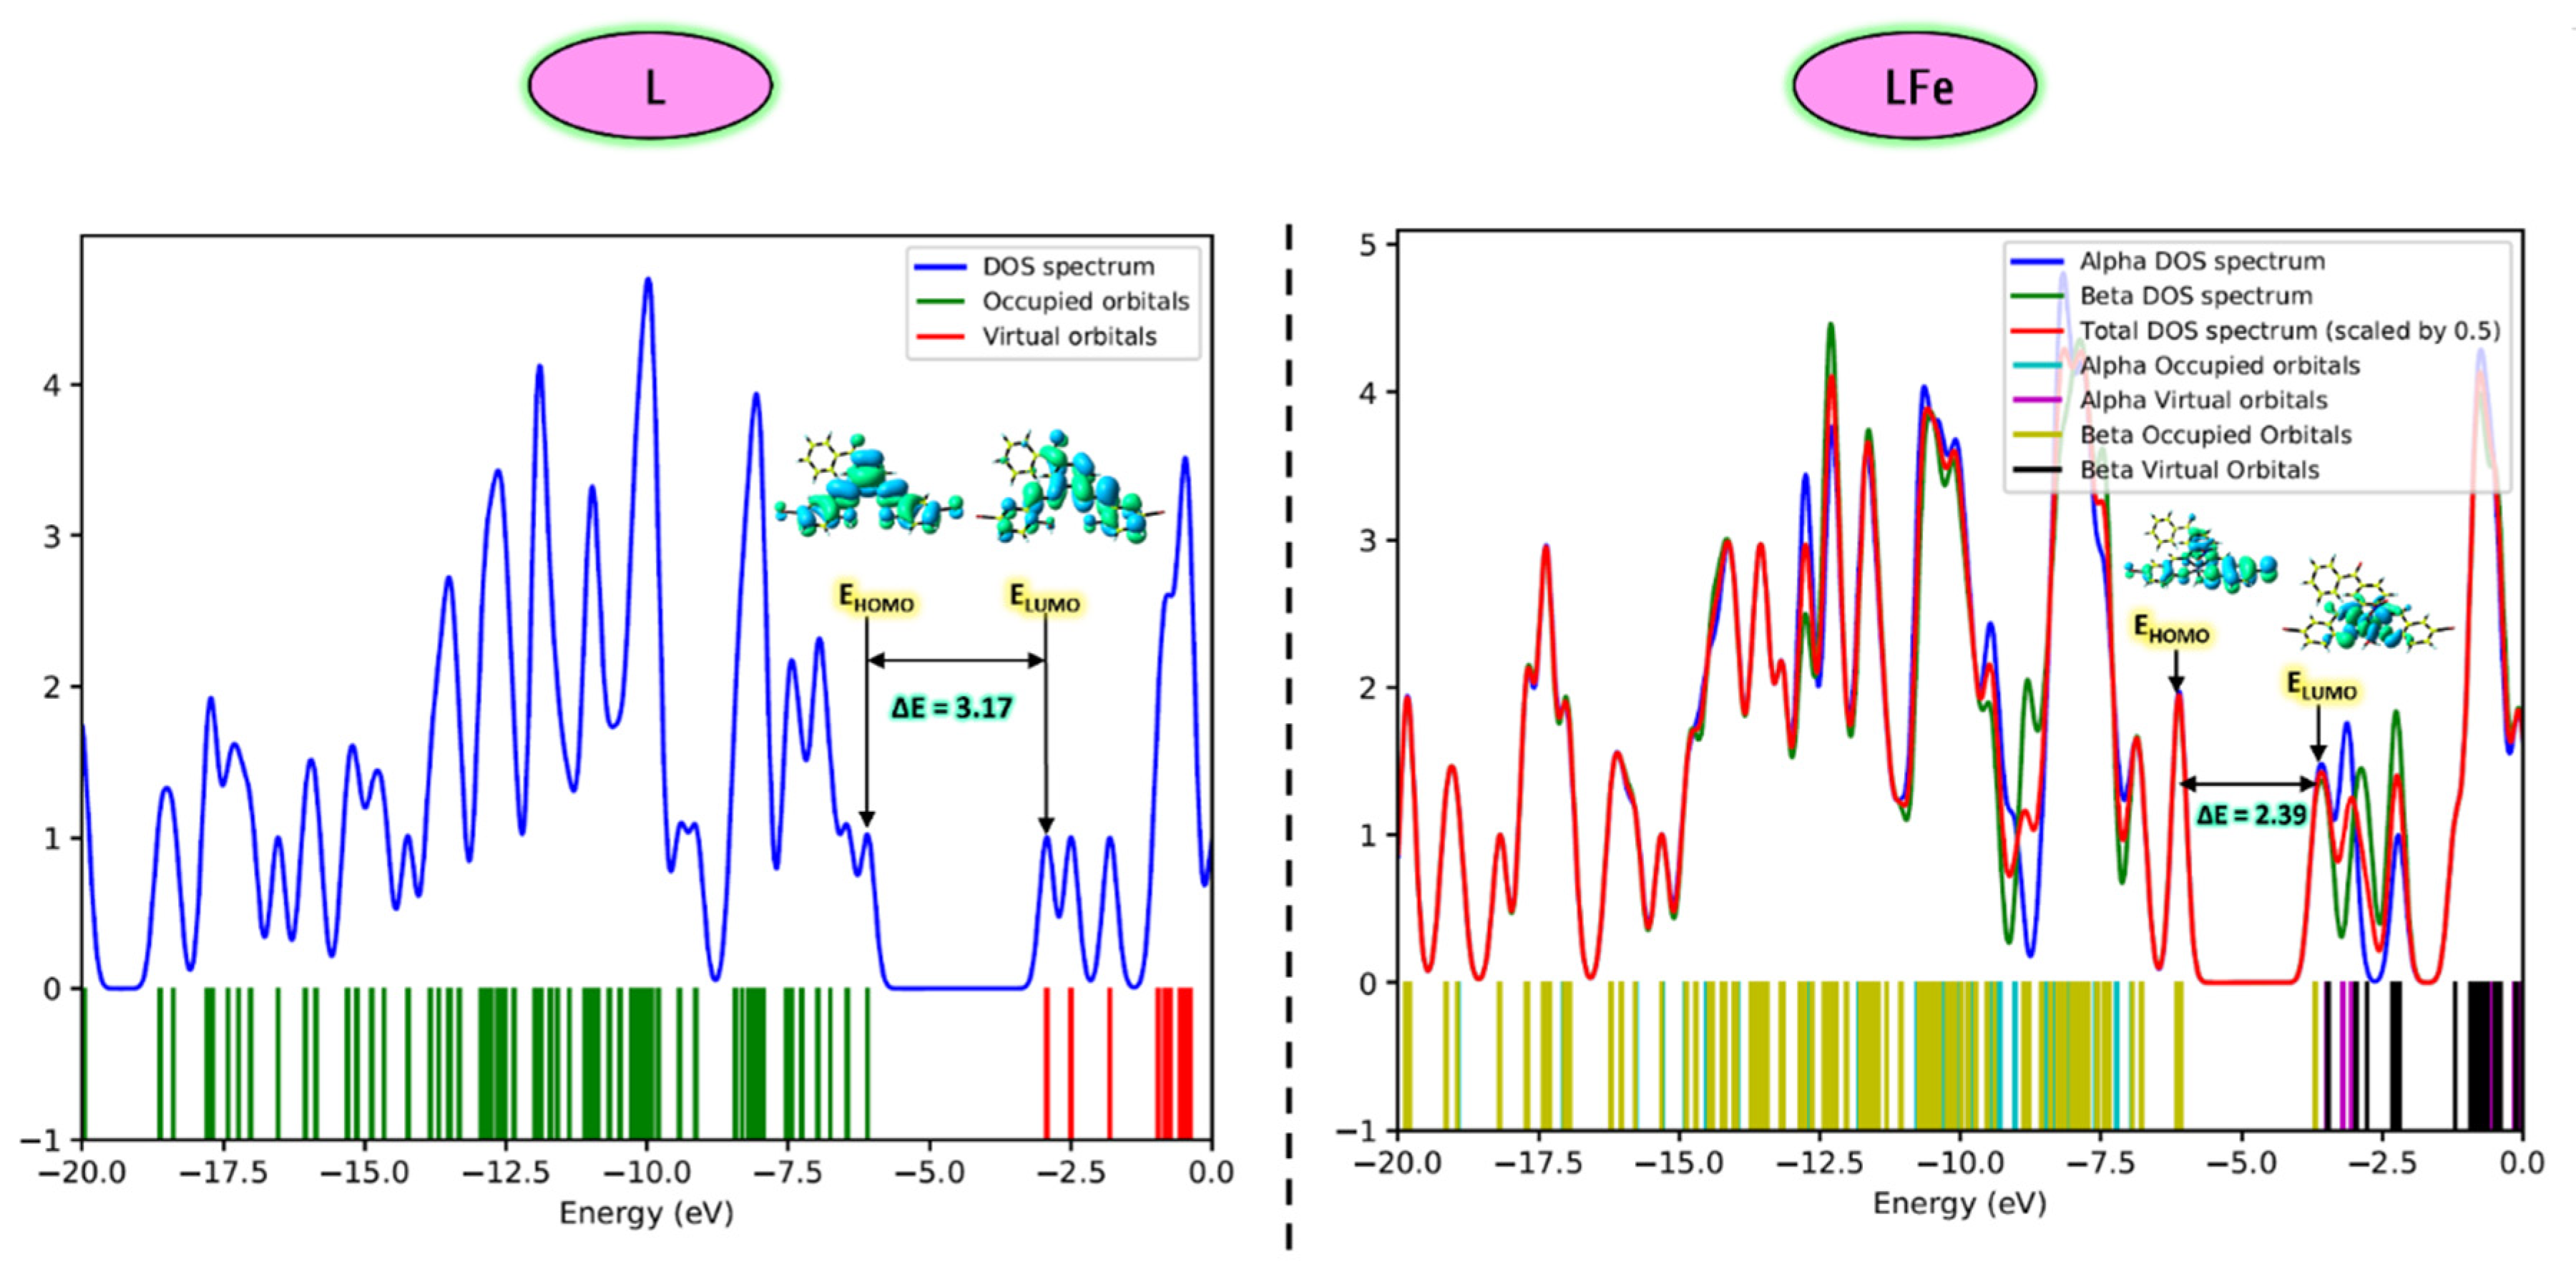
Frontier molecular orbitals (FMOs) encompass the most occupied molecular orbital (HOMO) and the least unoccupied molecular orbital (LUMO). These orbitals have significant influence over a molecule’s optical and electrical characteristics, as well as its behavior in quantum chemistry. The HOMO reflects a molecule’s potential to donate electrons, whereas the LUMO signifies its capacity to accept electrons. The HOMO-LUMO energy gap plays a critical role in determining a molecule’s kinetic stability, optical polarizability, chemical reactivity, and chemical hardness or softness [75]. To assess the energetic properties of the title compound, the HOMO–LUMO energy gap was determined using the B3LYP/6-311g (d,p)/LANL2DZ computational method. The computed HOMO and LUMO energy, along with energy gap values of L compound, are obtained as −6.09, −2.92, and 3.17, respectively, in the gaseous phase. Despite this, the related values for HOMO and LUMO energies for the LFe complex are observed at −6.09 and −3.69 eV, respectively. The Fe(III) complex exhibits an energy gap of 2.39 eV, a characteristic that underpins the charge transfer interactions occurring within the molecule. This interaction plays a pivotal role in shaping the metal complex’s chemical reactivity. Figure 22 illustrates the energy gap and surfaces of HOMO and LUMO, as well as their spatial distributions, for the newly synthesized compounds.

3.3.5. Inhibition of Corrosion and Quantum Reactivity

The assessment of a corrosion inhibitor’s characteristics and performance is heavily reliant on a thorough investigation of its electronic configuration and molecular shape. To achieve this, a series of quantum chemical computations were performed on the substances denoted as L and FeL. These compounds were subjected to detailed electronic structure analysis and geometrical optimization to evaluate their corrosion inhibition capabilities. The quantum chemical properties of these compounds were analyzed, focusing on parameters derived from the HOMO and LUMO energy levels. These properties include absolute electronegativity (χ = − (EHOMO + ELUMO)/2), absolute softness (σ = 1/η), chemical potential (Pi = − χ), additional electronic charge (ΔNmax = −Pi/η), global electrophilicity (ω = Pi2/2η), and absolute hardness (η = (ELUMO − EHOMO)/2) [76,77]. The calculated values for these parameters are summarized in Table 9.
The evaluation of how a substance interacts with a metallic interface can be assessed by considering its ELUMO and HOMO (Energy Level of the Lowest Unoccupied Molecular Orbital and Highest Occupied Molecular Orbital) to calculate the energy band gap (ΔE). Typically, an increase in the HOMO energy or a decrease in ∆E correlates with a stronger propensity for the substance to adhere to the surface of the metal [78,79]. According to the data, the LFe complex exhibits a narrower band gap (2.39 eV) compared to the ligand (∆E = 3.07 eV). According to these data, the L ligand complexation, which is indicated by its smaller band gap of 2.39 eV, could enhance its potential to mitigate metal surface corrosion effectively. The global reactivity of the compounds, determined by their energy gaps, reveals a clear trend: LFe exhibits higher reactivity than L. This behavior aligns with the principles of the hard–soft acid–base (HSAB) theory. According to this framework, biological targets such as cells, proteins, and surfaces are classified as “soft” entities. Soft molecules display a stronger affinity for interacting with these targets compared to their harder counterparts [80]. Consequently, increased molecular softness corresponds to enhanced biological activity and heightened chemical reactivity. Therefore, the reactivity hierarchy is predicted to follow the order LFe > L. The absolute electronegativity (χ) parameter serves as an indicator of a compound’s tendency to take up electrons when a back connection is being formed. This dynamic process, involving the interplay of electron donation and back-donation, enhances the compound’s adsorption strength on the metal exterior side [81]. Compounds with elevated electronegativity values exhibit a pronounced ability to strongly adhere to the metal externally. The electron transfer parameter, denoted as ΔNmax, serves as a critical indicator of the interaction between a compound and a metal surface. A ΔNmax value less than zero (ΔNmax < 0) signifies electron flow from the metal surface to the molecule, while a value greater than zero (ΔNmax > 0) reflects electron transfer from the compound to the surface [82]. In the cases of both L and its complex (LFe), positive ΔNmax values confirm that the metal surface is receiving electrons from the chemicals. This electron donation plays a pivotal role in bolstering the corrosion resistance of the metal during the reaction process. Interestingly, the protective capacity of the compound increases as the ΔNmax value rises, demonstrating an enhanced ability to shield the metal surface from corrosion. FeL exhibits a ΔNmax of 4.10, surpassing the ΔNmax of L at 2.85. This result suggests that the Fe(III) complex exerts A more powerful impact in strengthening the metal’s resistance to corrosion, underscoring its superior inhibitory performance.

3.3.6. Density of States (DOS) Spectra

The GaussSum 3.0 software [83] was utilized to analyze the contributions of the groups to the molecular orbitals (HOMO and LUMO) and to generate the DOS spectrum illustrated in Figure 23. This spectrum for the L and FeL compounds was instrumental in evaluating their band gap as well as their potential anti-corrosion characteristics. The DOS spectra were obtained by blending the molecular orbital data with Gaussian curves of unit height. In the spectrum, the green and red lines represent the HOMO and LUMO levels, respectively. DOS analysis reveals that the L compound possesses HOMO and LUMO energy levels of −6.10 and −2.93 eV, respectively, corresponding to a band gap of 3.17 eV. On the other hand, the LFe complex exhibits these energy levels at −6.09 and −3.70 eV, resulting in a narrower band gap of 2.39 eV. These observations align well with HOMO-LUMO analysis, affirming the reliability of the DOS analysis for the compounds. Furthermore, the findings corroborate previous DFT results, underscoring the anti-corrosion efficacy of the FeL complex.

4. Conclusions

In acidic conditions, different concentrations of L and FeL additions are used as Ni inhibitors. It was found that the presence of inhibitors reduced the corrosion current density of nickel. The inhibition efficiency for nickel at a concentration of 1 × 10⁻³ M with L and FeL was observed to be 90.50% and 92.70% at a temperature of 25 degrees Celsius, respectively.
Several Electrochemical Impedance Spectroscopy (EIS) studies have been performed on the electrode of interest in an acidic medium, with varying concentrations of each addition. Nyquist plots showed that the presence of additives led to the development of charge transfer resistance. This behavior is observed when both L and FeL additives are used. Furthermore, Ni’s charge transfer resistance values are higher when FeL is present in different concentrations than when L is present under the same circumstances and concentrations. Additionally, when L and FeL additives are present, the double layer capacitance decreases. This result is consistent with information obtained from potentiodynamic polarization measurements of a Tafel plot.
To investigate the influence of temperature on the electrochemical and corrosive behaviors of nickel in acidic media, as well as the presence or absence of various concentrations of additives, a Tafel plot is constructed for our electrode under investigation at various temperatures. Activation energy values are calculated. The presence of a large concentration of the additive (1 × 10⁻³ M for L and FeL, respectively) could be responsible for the observed greater energy barrier, which would impede the dissolving process. The Gibb’s free energy for nickel has been calculated at various temperatures. The dissolving process becomes more spontaneous as the temperature rises, increasing the Gibbs free energy values for each addition that was present. This suggests that the inhibitor chemisorbs onto Ni’s surface. Thermodynamic parameters have been calculated. In H2SO4 solution, the standard enthalpy change ΔH0ads Ni was calculated to be −29.14 and −31.01 kJ mol−1 with varying concentrations of L and FeL. When L and FeL were present, the standard entropy change ΔS0ad. values for Ni were −520 and −160 kJ/mol, respectively. The exothermic ecology of inhibitor adsorption processes was determined following the concept of ∆Hoads. Both negative ∆Soads and negative ∆Hoads values are caused by the process of replacement that takes place when the additives adsorb on the surface.
Ni’s surface layers were examined using SEM analysis following Tafel plot testing. According to oxide film study data, the thin layer on the nickel surface is mostly made up of NiO and NiSO4 in pure medium; in acidic media, the inhibiting effect of each additive concentration decreased these oxide films. In the case of utilizing the FeL additive, new particles appeared on the Ni surface, which increase with increases in the additive concentration. These species are related to FeL complex chemisorbed particles. More pure surface regions without oxides appeared in this case.
Galvanostatic charge–discharge cycling curves at applied various current densities have been constructed to study the effects of each additive on the charge–discharge features of Ni in the acidic media. It has been found that the addition of 5 × 10⁻⁵ M of FeL provides an enhanced specific capacitance of Ni at the applied current density of ±30 mA.cm−2 in acidic media. The most enhanced discharging time values were obtained with 1 × 10⁻³ M of L present and FeL at the applied current density of 30 mA. cm−2. The above charge–discharge results indicate that the stability of the investigated electrode increased. It was noted that the discharge time of Ni achieved its highest value in the vicinity of 1 × 10⁻³ M of L and FeL in 0.5 M H2SO4, specifying that its impedance behaviors are enhanced, and confirming the obtained impedance results.

Supplementary Materials

The following supporting information can be downloaded at: https://www.mdpi.com/article/10.3390/met15040403/s1, Figure S1: 13C NMR spectra of the L imine pro-ligand; Figure S2: proposal structure of L imine ligand; Figure S3: FT-IR spectrum of L imine ligand and its complex Figure S4: EDAX analysis for oxide layers formed on Ni exterior side in 0.5 M H2SO4; Figure S5: Change of capacity during six cycles for Ni metal in 0.5 M H2SO4 (a) without and with 1 × 10⁻⁵ M (b) 5 × 10⁻⁵ M (c), 1 × 10⁻⁴ M (d), 5 × 10⁻⁴ M (e), and 1 × 10⁻³ M (f) of L at applied various current densities; Figure S6: Power variation of Ni metal during six cycles in 0.5 M H2SO4 (a) without and with 1 × 10⁻⁵ M (b) 5 × 10⁻⁵ M (c), 1 × 10⁻⁴ M (d), 5 × 10⁻⁴ M (e), and 1 × 10⁻³ M (f) of L at applied various current densities; Figure S7: Change of Energy with cycle number for Ni metal in 0.5 M H2SO4 (a) without and with 1 × 10⁻⁵ M (b) 5 × 10⁻⁵ M (c), 1 × 10⁻⁴ M (d), 5 × 10⁻⁴ M (e), and 1 × 10⁻³ M (f) of L at applied various current densities; Figure S8: Change of Capacity during six cycles for Ni metal in 0.5 M H2SO4 with 1 × 10⁻⁵ M (a) 5 × 10⁻⁵ M (b), 1 × 10⁻⁴ M (c), 5 × 10⁻⁴ M (d), and 1 × 10⁻³ M (e) of FeL at applied various current densities; Figure S9: Power variation during six cycles for Ni metal in 0.5 M H2SO4 with 1 × 10⁻⁵ M (a) 5 × 10⁻⁵ M (b), 1 × 10⁻⁴ M (c), 5 × 10⁻⁴ M (d), and 1 × 10⁻³ M (e) of FeL at applied various current densities; Figure S10: Change of Energy with time for Ni metal in 0.5 M H2SO4 with 1 × 10⁻⁵ M (a) 5 × 10⁻⁵ M (b), 1 × 10⁻⁴ M (c), 5 × 10⁻⁴ M (d), and 1 × 10⁻³ M (e) of FeL at applied various current densities; Scheme S1: Fragmentation pathway of LFe complex. Below each structure, the precise masses of the particles and their chemical formulas are displayed; Table S1: Tafel parameters for Nickel metal in 0.5 M H2SO4 without additives at distinct temperatures; Table S2: Activation energy data (Ea) of Ni in [0.5 M H2SO4] solution, while additives are absent and present in multiple doses; Table S3: EDAX analysis for the oxide layers formed on Ni surface in 0.5 M H2SO4.

Author Contributions

Conceptualization, H.M.A.-D.; methodology, H.A.E.-S.S., A.Z., R.A.E.-K., H.M.A.-D., R.M.E.-K. and A.M.A.-D.; software, M.S., R.A.E.-K., M.F.-D., M.M.A.A. and H.M.A.-D.; validation, A.Z., M.F.-D., M.M.A.A., H.M.A.-D., R.M.E.-K. and A.M.A.-D.; formal analysis, H.A.E.-S.S., M.S., R.A.E.-K., M.F.-D., M.M.A.A., R.M.E.-K. and A.M.A.-D.; investigation, H.A.E.-S.S., M.S., M.F.-D., M.M.A.A., H.M.A.-D. and A.M.A.-D.; resources, H.A.E.-S.S., M.S., A.Z., R.A.E.-K., H.M.A.-D. and A.M.A.-D.; data curation, H.A.E.-S.S., R.A.E.-K., M.M.A.A., R.M.E.-K. and A.M.A.-D.; writing—original draft, H.A.E.-S.S., M.S. and A.M.A.-D.; visualization, A.Z. and M.F.-D.; supervision, A.Z. and A.M.A.-D.; project administration, R.M.E.-K. and A.M.A.-D.; funding acquisition, H.M.A.-D., A.Z., M.S. and A.M.A.-D. All authors have read and agreed to the published version of the manuscript.

Funding

This work was supported by Taif University, Saudi Arabia, through the project number TU-DSPP-2024-28. Also, this research was funded by the Spanish MICIN under PID2022-141373NB-I00 project, by the EU (Horizon Europe) under “INFINITE” (HORIZON-CL5-2021-D5-01-06) and “HARMONY”, and by the Government of the Basque Country under Elkartek (MOSINCO and ATLANTIS) projects and the scheme of “Ayuda a Grupos Consolidados” (Ref.: IT1670-22). In addition, Mohamed Salaheldeen wishes to acknowledge the funding within the Maria Zambrano contract provided by the Spanish Ministerio de Universidades and European Union–Next Generation EU (“Financiado por la Unión Europea-Next Generation EU”).

Data Availability Statement

The original contributions presented in this study are included in the article/Supplementary Materials. Further inquiries can be directed to the corresponding authors.

Acknowledgments

The authors extend their appreciation to Taif University, Saudi Arabia, through the project number TU-DSPP-2024-28. Also, the authors are thankful for the technical and human support provided by SGIker of UPV/EHU (Medidas Magnéticas Gipuzkoa) and European funding (ERDF and ESF). This research was funded by the Spanish MICIN under PID2022-141373NB-I00 project, by the EU (Horizon Europe) under “INFINITE” (HORIZON-CL5-2021-D5-01-06) and “HARMONY”, and by the Government of the Basque Country under Elkartek (MOSINCO and ATLANTIS) projects and the scheme of “Ayuda a Grupos Consolidados” (Ref.: IT1670-22).

Conflicts of Interest

The authors declare no conflict of interest.

References

  1. Selembo, P.A.; Merrill, M.D.; Logan, B.E. The use of stainless steel and nickel alloys as low-cost cathodes in microbial electrolysis cells. J. Power Sources 2009, 190, 271–278. [Google Scholar]
  2. Khaled, K.F. Molecular modeling and electrochemical investigations of the corrosion inhibition of nickel using some thiosemicarbazone derivatives. J. Appl. Electrochem. 2011, 41, 423–433. [Google Scholar]
  3. Arslan, T.; Kandemirli, F.; Ebenso, E.E.; Love, I.; Alemu, H. Quantum chemical studies on the corrosion inhibition of some sulphonamides on mild steel in acidic medium. Corros. Sci. 2009, 51, 35. [Google Scholar] [CrossRef]
  4. Shokry, H.; Mabrouk, E.M. Computational and electrochemical investigation for corrosion inhibition of nickel in molar sulfuric acid by dihydrazide derivatives. Part II. Arab. J. Chem. 2017, 10, S3402–S3411. [Google Scholar]
  5. Shilkamy, H.A.E.S.; El-Khatib, R.M.; Feizi-Dehnayebi, M.; Alharas, M.M.; AL-Faze, R.; Abu-Dief, A.M. Green corrosion inhibitors for nickel in acidic media utilizing novel imine ligand and its Zn (II) metal chelate supported by DFT calculation. J. Mol. Liq. 2024, 416, 126468. [Google Scholar] [CrossRef]
  6. El-Lateef, H.M.A.; Mohamad, A.D.M.; Shehata, M.R.; Abu-Dief, A.M. Targeted synthesis of two iron (III) tetradentate dibasic chelating Schiff base complexes toward inhibition of acidic induced steel corrosion: Empirical and DFT insights. Appl. Organomet. Chem. 2022, 36, e6718. [Google Scholar]
  7. El-Lateef, H.M.A.; Abu-Dief, A.M.; Mohamed, M.A. Corrosion inhibition of carbon steel pipelines by some novel Schiff base compounds during acidizing treatment of oil wells studied by electrochemical and quantum chemical methods. J. Mol. Struct. 2017, 1130, 522–542. [Google Scholar]
  8. El-Lateef, H.M.A.; Abu-Dief, A.M.; Abdel-Rahman, L.H.; Sañudo, E.C.; Aliaga-Alcalde, N. Electrochemical and theoretical quantum approaches on the inhibition of C1018 carbon steel corrosion in acidic medium containing chloride using some newly synthesized phenolic Schiff bases compounds. J. Electroanal. Chem. 2015, 743, 120–133. [Google Scholar]
  9. Gowri, S.; SathiyabamA, J.; Rajendran, S. Corrosion inhibition by amino acids—An over review. Eur. Chem. Bull. 2012, 11, 470–476. [Google Scholar]
  10. El Attari, H.; Chefira, K.; Siniti, M.; El Kihel, A.; Rchid, H. Adsorption and corrosion inhibition performance of 1,3-dihydro- 2Hbenzimidazole-2-thione for mild steel C35 E in sulfuric acid solution. Int. J. Recent Trends Eng. Res. (IJRTER) 2017, 03, 2455–2457. [Google Scholar]
  11. Taleb, H.I.; Mohamed, A.Z. Corrosion inhibition of mild steel using fig leaves extract in hydrochloric acid solution. Int. J. Electrochem. Sci. 2011, 6, 6442–6455. [Google Scholar]
  12. Tian, H.; Li, W.; Cao, K.; Hou, B. Potent inhibition of copper corrosion in neutral chloride media by novel non-toxic thiadiazole derivatives. Corros. Sci. 2013, 73, 281–291. [Google Scholar] [CrossRef]
  13. Ismail, K.M. Evaluation of cysteine as environmentally friendly corrosion inhibitor for copper in neutral and acidic chloride solutions. Electrochim. Acta 2007, 52, 7811–7819. [Google Scholar] [CrossRef]
  14. Saifi, H.; Bernard, M.C.; Joiret, S.; Rahmouni, K.; Takenouti, H.; Talhi, B. Corrosion inhibitive action of cysteine on Cu–30Ni alloy in aerated 0.5 M H2SO4. Mater. Chem. Phys. 2010, 120, 661–669. [Google Scholar] [CrossRef]
  15. Obot, I.B.; Obi-Egbedi, N.O.; Umoren, S.A. Antifungal drugs as corrosion inhibitors for aluminium in 0.1 M HCl. Surf. Rev. Lett. 2008, 15, 277. [Google Scholar]
  16. Ebenso, E.E.; Alemu, H.; Umoren, S.A.; Obot, I.B. Inhibition of mild steel corrosion in sulphuric acid using alizarin yellow GG dye and synergistic iodide additive. Int. J. Electrochem. Sci. 2008, 3, 1325. [Google Scholar] [CrossRef]
  17. Bouklah, M.; Hammouti, B.; Lagrenee, M.; Bentiss, F. The inhibited effect of some tetrazolic compounds towards the corrosion of brass in nitric acid solution. Corros. Sci. 2006, 48, 2831. [Google Scholar] [CrossRef]
  18. Magaji, L.; Ameh, P.O.; Eddy, N.O.; Uzairu, A.; Siaka, A.A.; Habib, S.; Ayuba, A.M.; Gumel, S.M. Ciprofloxacin as corrosion inhibitors for mild steel—Effects of concentration and temperature. Int. J. Mod. Chem. 2012, 2, 64. [Google Scholar]
  19. Alahmadi, M.; Mohamed, W.S.; Zhukov, A.; Salaheldeen, M.; Alsaedi, W.H.; Alhashmialameer, D.; Al-Ghamdi, K.; Abu Dief, A.M. One-step hydrothermal synthesis of flower-like MoS2/VS2 nanocomposite for biomedical applications. Inorg. Chem. Commun. 2023, 157, 111336. [Google Scholar] [CrossRef]
  20. Abdel-Rahman, L.H.; Abu-Dief, A.M.; El-Khatib, R.M.; Abdel-Fatah, S.M. Some new nano-sized Fe(II), Cd(II) and Zn(II) Schiff base complexes as precursor for metal oxides: Sonochemical synthesis, characterization, DNA interaction, in vitro antimicrobial and anticancer activities. Bioorg. Chem. 2016, 69, 140. [Google Scholar] [CrossRef]
  21. Abu-Dief, A.M.; El-Metwaly, N.M.; Alzahrani, S.O.; Alkhatib, F.M.; Abualnaja, M.; El-Dabea, T.; El-Remaily, M.A.A. Synthesis and characterization of Fe (III), Pd (II) and Cu (II)-thiazole complexes; DFT, pharmacophore modeling, in-vitro assay and DNA binding studies. J. Mol. Liq. 2021, 326, 115277. [Google Scholar] [CrossRef]
  22. Li, X.; Zhang, Y.; Xu, Y. Modified asynchronous orthogonal sample design scheme @ Job’s method to determine the stoichiometric ratio in the molecular association system. J. Mol. Struct. 2020, 1206, 127757. [Google Scholar] [CrossRef]
  23. Abdel-Rahman, L.H.; Abu-Dief, A.M.; Basha, M.; Abdel-Mawgoud, A.A.H. Three novel Ni(II), VO(II) and Cr(III) mononuclear complexes encompassing potentially tridentate imine ligand: Synthesis, structural characterization, DNA interaction, antimicrobial evaluation and anticancer activity. Appl. Organomet. Chem. 2017, 31, 3750. [Google Scholar] [CrossRef]
  24. Abdel-Samad, H.; El-Jemni, M.A.; Abd El Rehim, S.S.; Hassan, H.H. Simply Prepared α-Ni(OH)2-Based Electrode for Efficient Electrocatalysis of EOR and OER. Electrochim. Acta 2024, 503, 144896. [Google Scholar] [CrossRef]
  25. Van Mourik, T.; Bühl, M.; Gaigeot, M.P. Density functional theory across chemistry, physics and biology. Philos. Trans. R. Soc. A 2014, 372, 20120488. [Google Scholar] [CrossRef]
  26. Alaghaz, A.N.M.; Zayed, M.E.; Alharbi, S.A.; Ammar, R.A.; Chinnathambi, A. Synthesis, spectroscopic identification, thermal, potentiometric and antibacterial activity studies of 4-amino-5-mercapto-S-triazole Schiff’s base complexes. J. Mol. Struct. 2015, 1087, 60–67. [Google Scholar] [CrossRef]
  27. Tassaoui, K.; Damej, M.; Molhi, A.; Berisha, A.; Errili, M.; Ksama, S.; Mehmeti, V.; El Hajjaji, S.; Benmessaoud, M. Contribution to the corrosion inhibition of Cu–30Ni copper–nickel alloy by 3-amino-1,2,4-triazole-5-thiol (ATT) in 3% NaCl solution. Experimental and theoretical study (DFT, MC and MD). Int. J. Corros. Scale Inhib. 2022, 11, 221–244. [Google Scholar]
  28. Abu-Dief, A.M.; El-Khatib, R.M.; Aljohani, F.S.; Alzahrani, S.O.; Mahran, A.; Khalifa, M.E.; El-Metwaly, N.M. Synthesis and intensive characterization for novel Zn (II), Pd (II), Cr (III) and VO (II)-Schiff base complexes; DNA-interaction, DFT, drug-likeness and molecular docking studies. J. Mol. Struct. 2021, 1242, 130693. [Google Scholar] [CrossRef]
  29. Hosny, S.; Shehata, M.R.; Aly, S.A.; Alsehli, A.H.; Salaheldeen, M.; Abu-Dief, A.M.; Abu-El-Wafa, S.M. Designing of novel nano-sized coordination compounds based on Spinacia oleracea extract: Synthesis, structural characterization, molecular docking, computational calculations, and biomedical applications. Inorg. Chem. Commun. 2024, 160, 111994. [Google Scholar] [CrossRef]
  30. Emara, A.A. Structural, spectral and biological studies of binuclear tetradentate metal complexes of N3O Schiff base ligand synthesized from 4, 6-diacetylresorcinol and diethylenetriamine. Spectrochim. Acta Part A Mol. Biomol. Spectrosc. 2010, 77, 117–125. [Google Scholar] [CrossRef]
  31. Geary, W.J. The use of conductivity measurements in organic solvents for the characterisation of coordination compounds. Coord. Chem. Rev. 1971, 7, 81–122. [Google Scholar] [CrossRef]
  32. Pahontu, E.; Usataia, I.; Graur, V.; Chumakov, Y.; Petrenko, P.; Gudumac, V.; Gulea, A. Synthesis, characterization, crystal structure of novel Cu (II), Co (III), Fe (III) and Cr (III) complexes with 2-hydroxybenzaldehyde-4-allyl-S-methylisothiosemicarbazone: Antimicrobial, antioxidant and in vitro antiproliferative activity. Appl. Organomet. Chem. 2018, 32, e4544. [Google Scholar] [CrossRef]
  33. Singh, B.K.; Mishra, P.; Prakash, A.; Bhojak, N. Spectroscopic, electrochemical and biological studies of the metal complexes of the Schiff base derived from pyrrole-2-carbaldehyde and ethylenediamine. Arab. J. Chem. 2017, 10, S472–S483. [Google Scholar] [CrossRef]
  34. Li, D.; Cui, X.; Wen, X.; Jin, G.; Liu, J.; Zheng, W. Effects of graphene-based corrosion inhibition materials on the microstructure and corrosion resistance of Ni-based coating on Mg-Li alloys. Corros. Sci. 2024, 233, 112116. [Google Scholar] [CrossRef]
  35. Abdel-Rahman, L.H.; Abu-Dief, A.M.; Hamdan, S.K.; Seleem, A.A. Nano structure Iron (II) and Copper (II) Schiff base complexes of a NNO-tridentate ligand as new antibiotic agents: Spectral, thermal behaviors and DNA binding ability. Int. J. Nano Chem. 2015, 1, 65–77. [Google Scholar]
  36. Thakur, A.; Kaya, S.; Kumar, A. Recent trends in the characterization and application progress of nano-modified coatings in corrosion mitigation of metals and alloys. Appl. Sci. 2023, 13, 730. [Google Scholar] [CrossRef]
  37. Danaee, I.; Ghasemi, O.; Rashed, G.R.; Avei, M.R.; Maddahy, M.H. Effect of hydroxyl group position on adsorption behavior and corrosion inhibition of hydroxybenzaldehyde Schiff bases: Electrochemical and quantum calculations. J. Mol. Struct. 2013, 1035, 247–259. [Google Scholar] [CrossRef]
  38. El-Lateef, H.M.A.; Abbasov, V.M.; Aliyeva, L.I.; Khalaf, M.M. Novel naphthenate surfactants based on petroleum acids and nitrogenous bases as corrosion inhibitors for C1018-type mild steel in CO2-saturated brine. Egypt. J. Pet. 2015, 24, 175–182. [Google Scholar] [CrossRef]
  39. Victoria, S.N.; Prasad, R.; Manivannan, R. Psidium guajava leaf extract as green corrosion inhibitor for mild steel in phosphoric acid. Int. J. Electrochem. Sci. 2015, 10, 2220–2238. [Google Scholar] [CrossRef]
  40. Avci, G. Corrosion inhibition of indole-3-acetic acid on mild steel in 0.5 M HCl. Colloids Surf. A Physicochem. Eng. Asp. 2008, 317, 730–736. [Google Scholar] [CrossRef]
  41. Belayachi, M.; Serrar, H.; Zarrok, H.; El Assyry, A.; Zarrouk, A.; Oudda, H.; Boukhris, S.; Hammouti, B.; Ebenso, E.E.; Geunbour, A. New pyrimidothiazine derivative as corrosion inhibitor for carbon steel in acidic media. Int. J. Electrochem. Sci. 2015, 10, 3010–3025. [Google Scholar]
  42. Al-Gorair, A.S.; Al-Habal, T.; El-Sayed, R.; Al-Juaid, S.S.; Hameed, R.A.; Abdallah, M. Investigations of non-ionic surfactants derived from triazoles and pyrroles as potent corrosion inhibitors for carbon steel in hydrochloric acid. Int. J. Electrochem. Sci. 2023, 18, 100269. [Google Scholar]
  43. Verma, C.; Thakur, A.; Ganjoo, R.; Sharma, S.; Assad, H.; Kumar, A.; Quraishi, M.A.; Alfantazi, A. Coordination bonding and corrosion inhibition potential of nitrogen-rich heterocycles: Azoles and triazines as specific examples. Coord. Chem. Rev. 2023, 488, 215177. [Google Scholar]
  44. El-Lateef, H.M.A. Corrosion inhibition characteristics of a novel salycilidene isatin hydrazine sodium sulfonate on carbon steel in HCl and a synergistic nickel ions additive: A combined experimental and theoretical perspective. Appl. Surf. Sci. 2020, 501, 144237. [Google Scholar] [CrossRef]
  45. Deyab, M.A.; Alghamdi, M.M.; El-Zahhar, A.A. Impact of some inorganic anions on the corrosion of nickel in a solution containing Na2SO4 and NaClO4. Sci. Rep. 2024, 14, 1853. [Google Scholar] [CrossRef]
  46. Noorbakhsh Nezhad, A.H.; Davoodi, A.; Mohammadi Zahrani, E.; Arefinia, R. The effects of an inorganic corrosion inhibitor on the electrochemical behavior of superhydrophobic micro-nano structured Ni films in 3.5% NaCl solution. Surf. Coat. Technol. 2020, 395, 125946. [Google Scholar] [CrossRef]
  47. Feng, Z.; She, X.; Peng, J.; Qiang, Y.; Zhang, S. Robust corrosion protection of Ni-thiolate coordination polymer/Mg(OH)2 coating on magnesium alloy AZ31. J. Mater. Res. Technol. 2023, 26, 2407–2418. [Google Scholar]
  48. Abd El-Lateef, H.M.; Elrouby, M.; Shilkamy, H.A.S. Influence of phytic acid on corrosion behavior and charge-discharge processes of Pb-2% In alloy anode for lead-acid battery applications. J. Mol. Struct. 2024, 1306, 137938. [Google Scholar]
  49. Goulart, C.M.; Esteves-Souza, A.; Martinez-Huitle, C.A.; Rodrigues, C.J.F.; Maciel, M.A.M.; Echevarria, A. Experimental and theoretical evaluation of semicarbazones and thiosemicarbazones as organic corrosion inhibitors. Corros. Sci. 2013, 67, 281–291. [Google Scholar]
  50. Fouda, A.E.A.S.; Nageeb, M.; Gaber, G.A.; Ahmed, A.S.; El-Hossiany, A.A.; Atia, M.F. Carob fruit extract as naturally products corrosion inhibitor for copper-nickel alloys in brine solutions. Sci. Rep. 2024, 14, 29290. [Google Scholar]
  51. Majidi, R.; Farhadi, A.; Danaee, I.; Panah, N.B.; Zarei, D.; Nikmanesh, S. Investigation of synthesized planar Cu-MOF and spherical Ni-MOF nanofillers for improving the anti-corrosion performance of epoxy coatings. Prog. Org. Coat. 2023, 183, 107803. [Google Scholar] [CrossRef]
  52. Lee, Y.H.; Choi, S.R.; Ko, S.J.; Kim, J.G. Effect of benzotriazole on the prevention of electroless nickel–immersion gold treated copper corrosion. J. Phys. Chem. Solids 2023, 176, 111226. [Google Scholar] [CrossRef]
  53. Anadebe, V.C.; Chukwuike, V.I.; Nayak, K.C.; Ebenso, E.E.; Barik, R.C. Combined electrochemical, atomic scale-DFT and MD simulation of Nickel based metal organic framework (Ni-MOF) as corrosion inhibitor for X65 pipeline steel in CO2-saturated brine. Mater. Chem. Phys. 2024, 312, 128606. [Google Scholar] [CrossRef]
  54. Tassaoui, K.; Al-Shami, A.; Damej, M.; Molhi, A.; Mounkachi, O.; Benmessaoud, M. Contribution to the corrosion inhibitors of copper-nickel (Cu-30Ni) in 3% NaCl solution by two new molecules of triazole: Electrochemical and theoretical studies. J. Mol. Struct. 2023, 1291, 135836. [Google Scholar] [CrossRef]
  55. Abbasov, V.; El-Lateef, H.M.A.; Aliyeva, L.; Qasimov, E.; Ismayilov, I.; Khalaf, M.M. A study of the corrosion inhibition of mild steel C1018 in CO2-saturated brine using some novel surfactants based on corn oil. Egypt. J. Pet. 2013, 22, 451–470. [Google Scholar] [CrossRef]
  56. Ismayilov, I.T.; El-Lateef, H.M.A.; Abbasov, V.M.; Aliyeva, L.I.; Efremenko, E.N.; Mamedxanova, S.A. Adsorption and corrosion inhibitive properties of novel surfactants in the series of fatty acids based on palm oil on carbon steel in CO2-containing solution. Int. Res. J. Pure Appl. Chem. 2014, 4, 299–314. [Google Scholar] [CrossRef]
  57. Ituen, E.; Singh, A.; Yuanhua, L. Synthesis of bio-based nickel nanoparticles composite, characterization and corrosion in hibition in simulated oilfield microbial and acidizing environments. J. Adhes. Sci. Technol. 2021, 35, 15–34. [Google Scholar] [CrossRef]
  58. Li, J.; Lin, O.; Cheng, C.; Wang, W.; Xu, C.; Ren, L. Fabrication of a Ni/SiC composite coating on steel surface with excellent corrosion inhibition performance. J. Mater. Process. Technol. 2021, 290, 116987.59. [Google Scholar] [CrossRef]
  59. Li, J.; Zeng, H.; Luo, J.L. Probing the corrosion resistance of a smart electroless Ni-P composite coating embedded with pH-responsive corrosion inhibitor-loaded nanocapsules. Chem. Eng. J. 2021, 421, 127752. [Google Scholar] [CrossRef]
  60. Solomon, M.M.; Gerengi, H.; Umoren, S.A. Carboxymethyl cellulose/silver nanoparticles composite: Synthesis, characterization and application as a benign corrosion inhibitor for St37 steel in 15% H2SO4 medium. ACS Appl. Mater. Interfaces 2017, 9, 6376–6389. [Google Scholar] [CrossRef]
  61. Hussin, M.H.; Kassim, M.J. Electrochemical, thermodynamic and adsorption studies of (+)-catechin hydrate as natural mild steel corrosion inhibitor in 1 M HCl. Int. J. Electrochem. Sci. 2011, 6, 1396–1414. [Google Scholar] [CrossRef]
  62. Liu, G.; Zhang, Y.; Ma, C.; Tang, Q.; Li, H.; Chen, S.; Shen, J. Corrosion inhibition of Ga-based thermal interface materials with Ni coating on Cu substrate. Surf. Coat. Technol. 2024, 493, 131286. [Google Scholar] [CrossRef]
  63. Ukaga, I.; Okafor, P.; Onyeachu, I.B.; Ikeuba, A.I.; Njoku, D.I. The inhibitive performance of 2, 3-pyrazine dicarboxylic acid and synergistic impact of KI during acid corrosion of 70/30 and 90/10 copper–nickel alloys. Mater. Chem. Phys. 2023, 296, 127313. [Google Scholar] [CrossRef]
  64. Dardeer, H.M.; Abbas, S.A.; Ghobashy, M.M.; Gaber, G.A.; Aly, M.F. Synthesis and characterization of novel chitosan-sodium pyruvate polymer and its derivatives for corrosion feature evaluation of Cu-Ni alloy. Inorg. Chem. Commun. 2023, 157, 111308. [Google Scholar] [CrossRef]
  65. Akhavan-Bahabadi, Z.; Zare, H.R.; Mohammadpour, Z.; Mirjalili, B.B.F. Improvement of Anti-Corrosion Performance of a Cu-Ni Bimetallic Organic Framework Smart Coating Using Amino-Substitution Triazole. ChemistrySelect 2023, 8, e202300363. [Google Scholar] [CrossRef]
  66. Ituen, E.; Singh, A.; Yuanhua, L. Inhibitive effect of onion mesocarp extract-nickel nanoparticles composite on simultaneous hydrogen production and pipework corrosion in 1 M HCl. Int. J. Hydrogen Energy 2020, 45, 10814–10825. [Google Scholar] [CrossRef]
  67. Zhu, M.; Yi, H.; Lu, J.; Huang, C.; Zhang, H.; Bo, P.; Huang, J. Corrosion of Ni–Fe based alloy in chloride molten salts for concentrating solar power containing aluminum as corrosion inhibitor. Sol. Energy Mater. Sol. Cells 2022, 241, 111737. [Google Scholar] [CrossRef]
  68. Kumar, H.; Sharma, R.; Yadav, A.; Kumari, R. Synthesis, characterization and influence of reduced Graphene Oxide (rGO) on the performance of mixed metal oxide nano-composite as optoelectronic material and corrosion inhibitor. Chem. Data Collect. 2020, 29, 100527. [Google Scholar] [CrossRef]
  69. Elrouby, M.; Shilkamy, H.A.E.S.; El-Sayed, A.E.R. Breakdown of passivation for zinc-antimony alloy in alkaline batteries verification; galvanostatic, impedance spectra, and charge-discharge techniques. Korean J. Chem. Eng. 2023, 40, 572–583. [Google Scholar] [CrossRef]
  70. Sivasubramanian, M.; Saravanan, R.R.; Manimehan, I.; Panneerselvam, K. Crystal structure analysis, Hirshfeld surface analysis, spectral investigations (FT-IR, FT-R), DFT calculations, ADMET studies and molecular docking of 3H-Methyl-1H-pyrazole-1-carboxamide (3MPC). J. Ind. Chem. Soc. 2022, 99, 100402. [Google Scholar] [CrossRef]
  71. Abu-Dief, A.M.; Feizi-Dehnayebi, M.; Nafady, A.; Almalki, M.A.; Kassem, A.M.; Al-Ola, K.A.A.; Abdel-Rahman, L.H. Fabrication, structural inspection, stability studies in solution and DFT calculations of some novel complexes drived from 4-(Benzothiazol-2-yliminomethyl)-phenol ligand: Pharmaceutical applications supported by molecular docking approach. J. Mol. Struct. 2025, 1328, 141284. [Google Scholar]
  72. Nirmala, T.; Kumar, M.; Swarnamughi, P.; Manikandan, P.; Geetha, E.; Manikandan, A.; Muthu, S. Spectroscopic, Molecular Structure, Electronic Topology Surface, and Pharmaceutical Investigation of 1-[(4-Chlorophenyl)Methyl]-1H-Indole-3-Carboxaldehyde by Quantum Computation—Prediction of Antitumor Activity. Chem. Phys. Impact 2024, 8, 100513. [Google Scholar]
  73. Hashim, K.M.; Manoj, E.; Kurup, M.P. A Novel Manganese (II) Bisthiocarbohydrazone Complex: Crystal Structures, Hirshfeld Surface Analysis, DFT and Molecular Docking Study with SARS-CoV-2. J. Mol. Struct. 2021, 1246, 131125. [Google Scholar] [PubMed]
  74. Mohammadi Ziarani, G.; Ebrahimi, D.; Feizi-Dehnayebi, M.; Badiei, A.; Abu-Dief, A.M. Tailored Silica-Based Sensors (SBA-Pr-Ald-MA) for Efficient Detection of Iron (III) Ions: A Comprehensive Theoretical and Experimental Viewpoint. Appl. Organomet. Chem. 2025, 39, e7917. [Google Scholar]
  75. Kohn, W.; Becke, A.D.; Parr, R.G. Density functional theory of electronic structure. J. Phys. Chem. 1996, 100, 12974–12980. [Google Scholar]
  76. Panahande, Z.; Mohammadi Ziarani, G.; Feizi-Dehnayebi, M.; Badiei, A.; Abu-Dief, A.M. Synthesis and DFT Calculation of Hg2+ Fluorescence Chemosensor Based on a New Hybrid Organic–Inorganic Nanoporous Material of SBA-Pr-Is-Hy. Appl. Organomet. Chem. 2025, 39, e7818. [Google Scholar]
  77. Domingo, L.R.; Ríos-Gutiérrez, M.; Pérez, P. Applications of the conceptual density functional theory indices to organic chemistry reactivity. Molecules 2016, 21, 748. [Google Scholar] [CrossRef]
  78. Oguzie, E.E.; Adindu, C.B.; Enenebeaku, C.K.; Ogukwe, C.E.; Chidiebere, M.A.; Oguzie, K.L. Natural products for materials protection: Mechanism of corrosion inhibition of mild steel by acid extracts of Piper guineense. J. Phys. Chem. C 2012, 116, 13603–13615. [Google Scholar]
  79. Kumar, D.; Jain, V.; Rai, B. Imidazole Derivatives as Corrosion Inhibitors for Copper: A DFT and Reactive Force Field Study. Corros. Sci. 2020, 171, 108724. [Google Scholar] [CrossRef]
  80. Abdou, A. Synthesis, structural, molecular docking, DFT, vibrational spectroscopy, HOMO-LUMO, MEP exploration, antibacterial and antifungal activity of new Fe (III), Co (II) and Ni (II) hetero-ligand complexes. J. Mol. Struct. 2022, 1262, 132911. [Google Scholar]
  81. Lai, Z.; Wang, S.; Wang, C.; Hong, Y.; Zhou, G.; Chen, Y.; He, W.; Peng, Y.; Xiao, D. A Comparison of Typical Additives for Copper Electroplating Based on Theoretical Computation. Comput. Mater. Sci. 2018, 147, 95–102. [Google Scholar]
  82. Bourzi, H.; Oukhrib, R.; El Ibrahimi, B.; Oualid, H.A.; Abdellaoui, Y.; Balkard, B.; Hilali, M.; El Issami, S. Understanding of Anti-Corrosive Behavior of Some Tetrazole Derivatives in Acidic Medium: Adsorption on Cu (111) Surface Using Quantum Chemical Calculations and Monte Carlo Simulations. Surf. Sci. 2020, 702, 121692. [Google Scholar]
  83. Aayisha, S.; Renuga Devi, T.S.; Janani, S.; Muthu, S.; Raja, M.; Sevvanthi, S.; Raajaraman, B.R. Vibrational and computational analysis for molecular structure properties of N-(2-(trifluoromethyl) phenyl) acetamide: Density functional theory approach. Spectrosc. Lett. 2019, 52, 563–576. [Google Scholar]
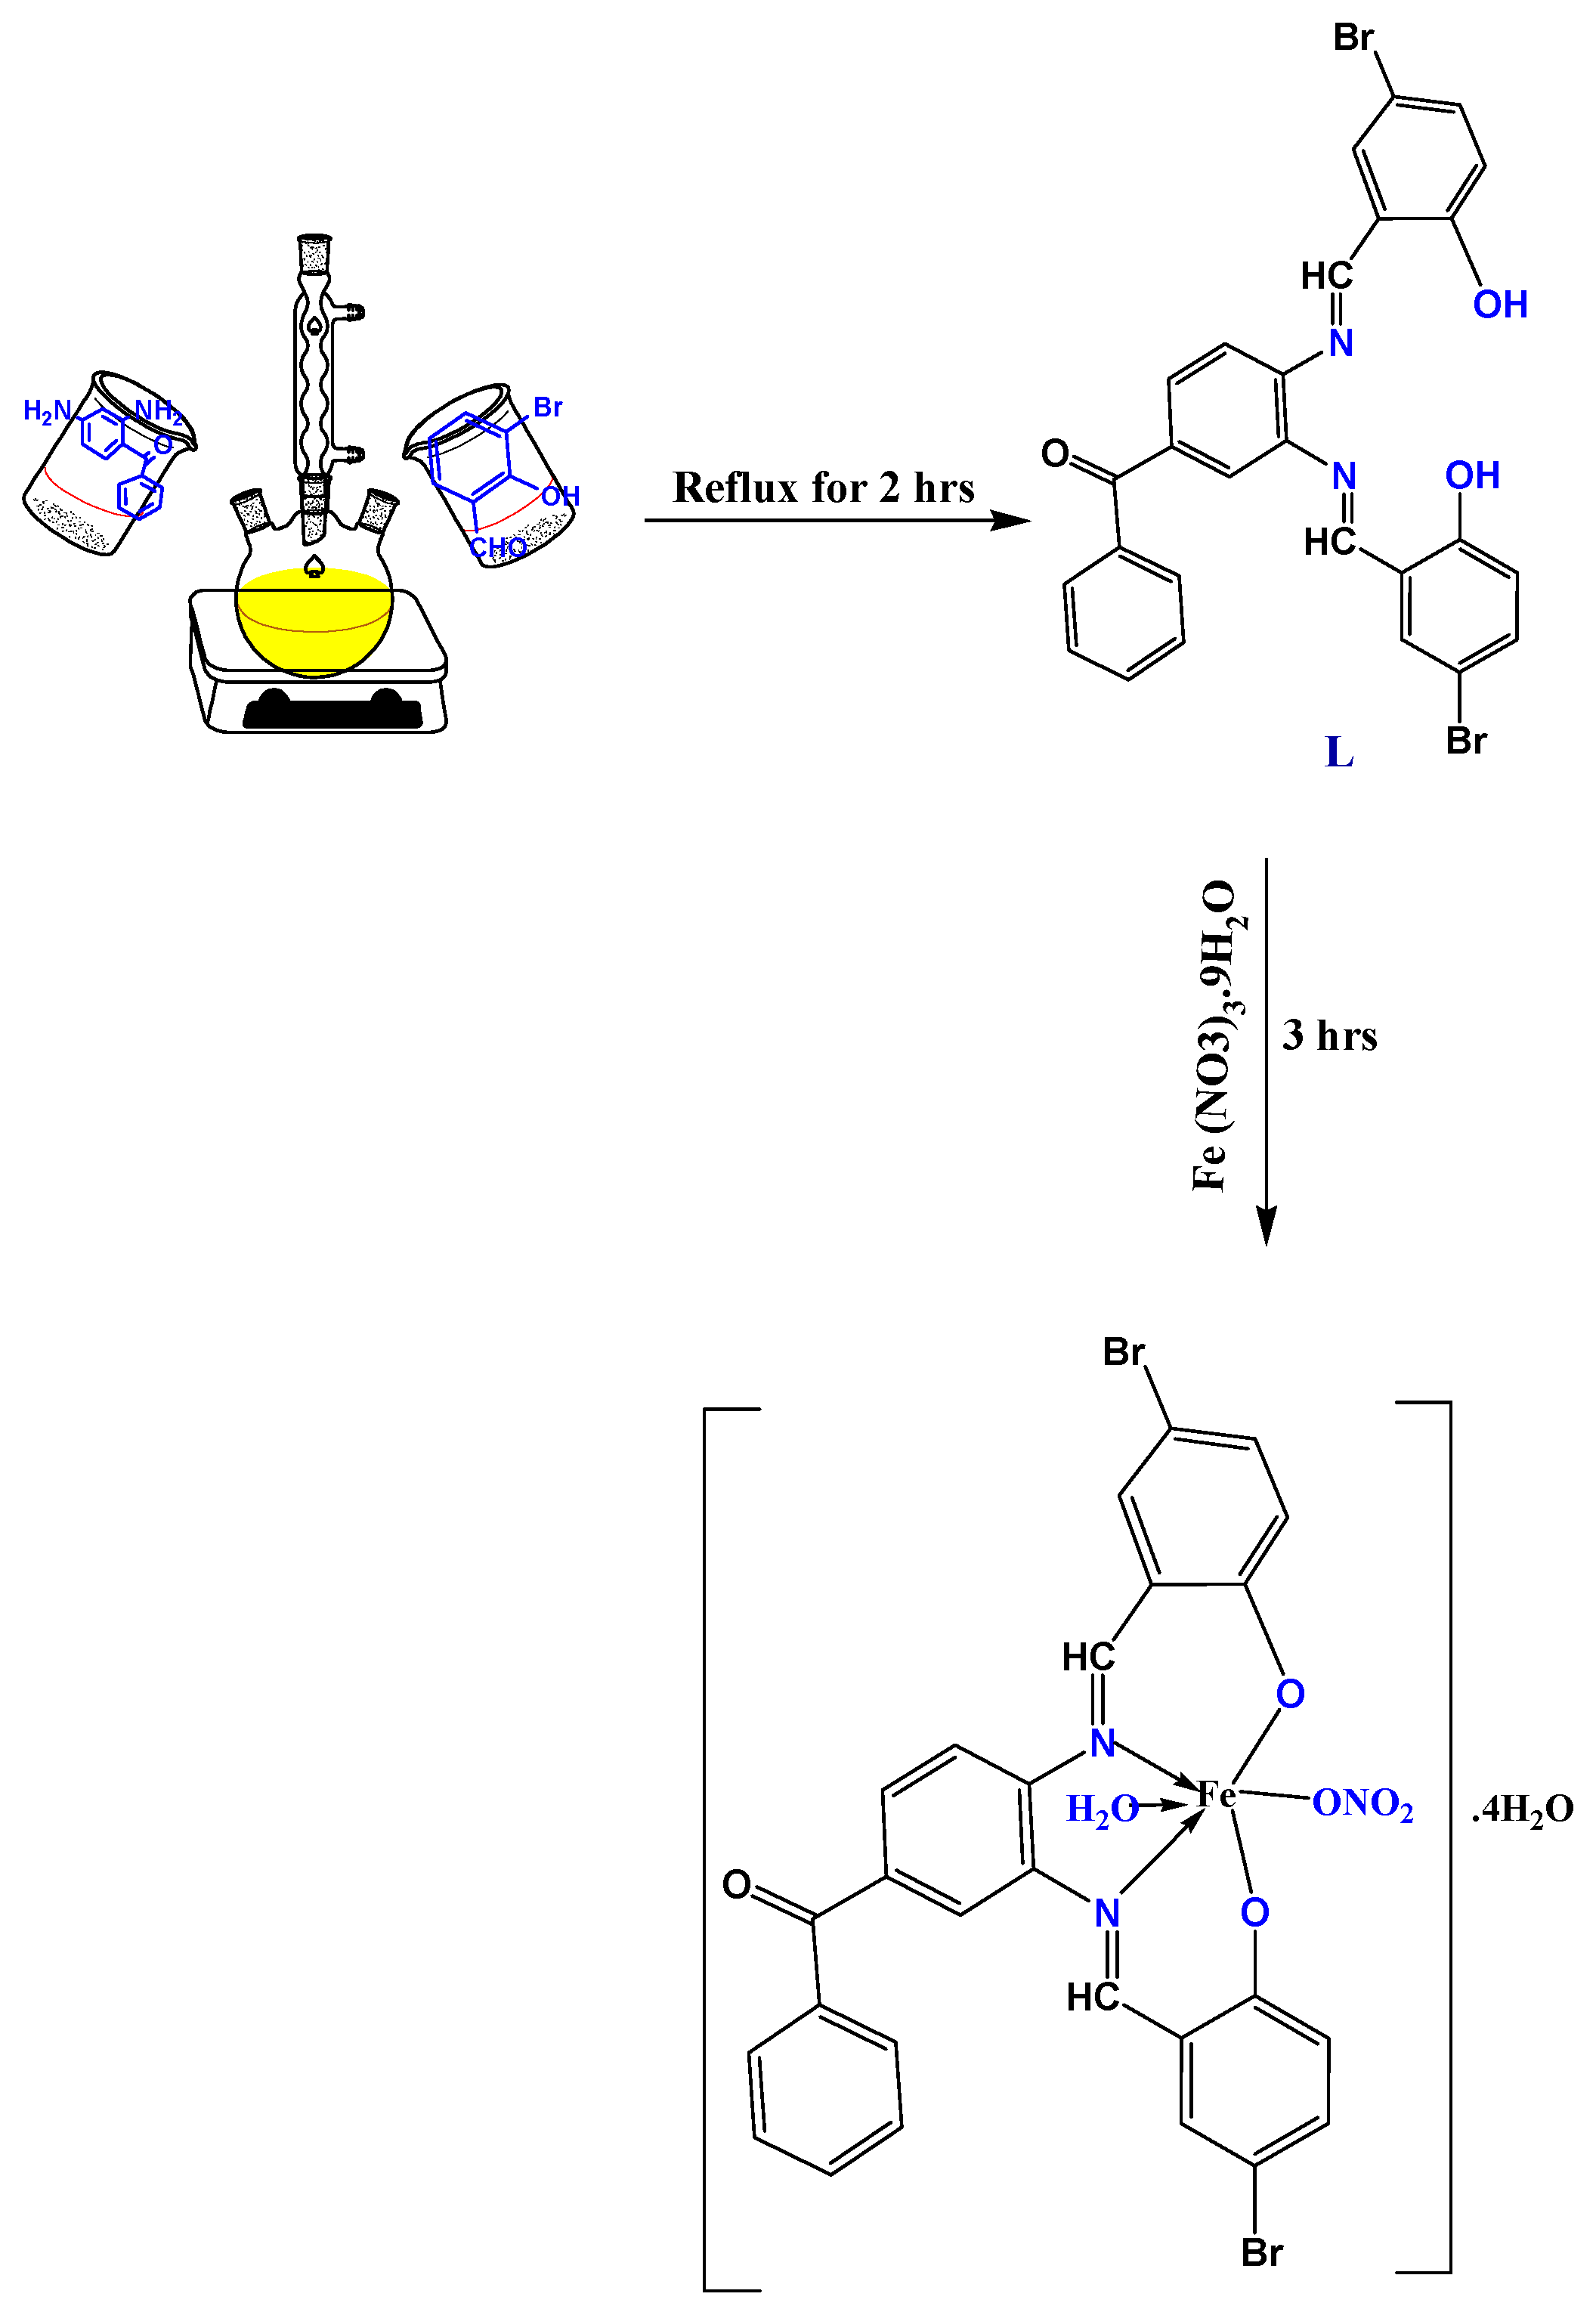
Scheme 1. Production of the imine ligand (L) and its LFe complex using a synthetic approach.
Metals 15 00403 sch001
Figure 1. 1HNMR spectra of L imine pro-ligand.
Metals 15 00403 g001
Figure 2. Molecular electronic spectra of L ligand and its LFe complex in ethanol at 298 K.
Metals 15 00403 g002
Figure 3. Mass spectrum of (a) imine ligand L and (b) its LFe complex.
Metals 15 00403 g003
Figure 4. The stoichiometry of the produced compounds in water-based ethanolic solution using (a) Job’s and (b) molar ratio plots at 10−3 M of FeL complex and 298 K.
Metals 15 00403 g004
Figure 5. Tafel plot curves showing the presence of 1 × 10⁻³ M of L and Ni in 0.5 M H2SO4 in deficit and FeL (a), relation between corrosion rate and inhibitor concentration Cinh. in the presence of L (b) as well as FeL (c).
Metals 15 00403 g005
Figure 6. At 25 °C, the Tafel plot curves for Ni in 0.5 M H2SO4 with different concentrations of L (a) and FeL (b) are shown.
Metals 15 00403 g006
Figure 7. For Ni in 0.5 M H2SO4, with different dosages of L at 25 °C, the Nyquist plot (a), bode plot (b), and phase bode plot (c) are shown.
Metals 15 00403 g007
Figure 8. For Ni in 0.5 M H2SO4 with different dosages of FeL at 25 °C: Nyquist plot (a), bode plot (b), and phase bode plot (c).
Metals 15 00403 g008
Figure 9. Tafel curvatures for Nickel in 0.5 M H2SO4, which have 1 × 10⁻⁵ M (a), 5 × 10⁻⁵ and (b) 1 × 10⁻⁴ M (c), as well as 1 × 10⁻³ M (d) of L and 1 × 10⁻⁵ M (e), 5 × 10⁻⁵ (f) 1 × 10⁻⁴ M (g), and 1 × 10⁻³ M (h) of FeL complex at different temperatures.
Metals 15 00403 g009
Figure 10. The Arrhenius equation, when applied to the corrosion rate (Icorr) of nickel in a 0.5 M H2SO4 environment devoid of additives, indicates the impacts of varying temperatures for (a) L imine ligand and (b) its FeL complex.
Metals 15 00403 g010
Figure 11. The experimental findings obtained from Tafel polarization studies on Ni metal, conducted in a 0.5 M H2SO4 environment with varying concentrations of several inhibitors, were meticulously analyzed. The data, recorded at temperatures of 25 °C, 35 °C, 45 °C, and 55 °C, underwent fitting with the Langmuir adsorption model. This model involved the comparison of the actual surface coverage (θ) with the theoretical maximum coverage (Cinh.), considering both the presence of the inhibitors denoted by L (parameters (ad)) and their respective FeL complexes (parameters (eh)).
Metals 15 00403 g011
Figure 12. The graph depicts the alteration of ΔG0ads as a function of temperature T, with Ni situated in 0.5 M H2SO4 solutions for (a) L imine ligand and (b) its FeL complex. The study incorporates multiple temperature settings to observe the effects of different inhibitor concentrations on the system.
Metals 15 00403 g012
Figure 13. SEM images of oxide films formed on the Ni surface in 0.5 M H2SO4, in the presence of 1 × 10⁻³ M of L (b) and in the absence of L (a), have been captured.
Metals 15 00403 g013
Figure 14. Captured SEM images for oxide films produced on Ni external side in 0.5 M H2SO4 in the presence of 1 × 10⁻⁵ M (a), 1 × 10⁻⁴ M (b) and 1 × 10⁻³ M (c) of FeL.
Metals 15 00403 g014
Figure 15. Analysis with EDAX for oxide layers that form on the outside of Ni when there is 1 × 10⁻⁵ M (a) and 1 × 10⁻³ M (b) of FeL present.
Metals 15 00403 g015
Figure 16. Galvanostatic charge–discharge curves of Ni electrode in 0.5 M H2SO4 without L (a), and with 1 × 10⁻⁵ M (b), 5 × 10⁻⁵ (c), 1 × 10⁻⁴ (d), 5 × 10⁻⁴ (e), and 1 × 10⁻³ (f) of L, at various current densities.
Metals 15 00403 g016
Figure 17. Galvanostatic charge–discharge curvatures of Ni electrode in 0.5 M H2SO4 containing 1 × 10⁻⁵ M (a), 5 × 10⁻⁵ (b), 1 × 10⁻⁴ (c), 5 × 10⁻⁴ (d), and 1 × 10⁻³ (e) of FeL additive at various current densities.
Metals 15 00403 g017
Figure 18. Galvanostatic charge–discharge curvatures of Ni in the absence and presence of 1 × 10⁻⁵ M (a) and 1 × 10⁻³ M (b) of L, as well as FeL additives, in 0.5 M H2SO4 at an applied current density of ±30 mA · cm−2.
Metals 15 00403 g018
Figure 19. The suggested structure of L and FeL generated via the DFT method.
Metals 15 00403 g019
Figure 20. The MEP diagram of L and its LFe complex generated via the DFT method.
Metals 15 00403 g020
Figure 21. The Mulliken charge distribution of the L compound generated via the DFT method.
Metals 15 00403 g021
Figure 22. The distributions and HOMO and LUMO energy surface of the L and LFe complex generated via the DFT method.
Metals 15 00403 g022
Figure 23. The DFT approach produced the DOS spectrum for the L ligand and its FeL complex.
Metals 15 00403 g023
Table 1. Both physical characteristics and data from analysis of the L imine pro-ligand and its complex.
Compound (Molecular Formula)M. WeightYieldColorMolar Conductanceμeff (BM)M.p. and Dec.temp. (°C)Analysis (%) Found (Calcd)
m, Ω−1 cm2 mol−1CHN
L
C27H18Br2N2O3
(578.25)95%yellow--21056.15
(56.03)
3.18
(3.11)
4.76
(4.84)
LFe
C27H26Br2FeN3O11
(784.13)91%bright brown10.755.52>30041.28
(41.35)
3.25
(3.34)
5.41
(5.36)
Table 2. Ni metal Tafel constants in 0.5 M H2SO4 at different concentrations of the L and FeL complexes at 25 °C.
Cinh.Ecorr (V)Icorr
(µA cm−2)
βa
(V/Decade)
βc
(V/Decade)
Θη%
In the presence of L
Blank−0.228616.619.5−4.38--
1 × 10⁻⁵ M−0.377371.523.3−4.530.39739.7
5 × 10⁻⁵ M−0.396223.826.2−9.50.63763.7
1 × 10⁻⁴ M−0.394125.331.1−5.30.79679.6
5 × 10⁻⁴ M−0.40864.533.6−6.20.89689.6
1 × 10⁻³ M−0.40858.333.4−4.750.90590.5
In the presence of FeL
1 × 10⁻⁵ M−0.387338.333.4−4.60.45145.1
5 × 10⁻⁵ M−0.384186.434.5−5.30.69869.8
1 × 10⁻⁴ M−0.37093.033.1−5.10.84984.9
5 × 10⁻⁴ M−0.35860.233.5−5.30.90290.2
1 × 10⁻³ M−0.34444.6729.3−4.30.92792.7
Table 3. Electrochemical resistance values for nickel metal in 0.5 M H2SO4 at 25 °C with multiple L and FeL concentrations.
In the presence of L
Cinh.RsRctCdl F
Blank1.013.81.15 × 10−6
1 × 10⁻⁵ M1.017.09.36 × 10—7
5 × 10⁻⁵ M1.019.58.16 × 10−7
1 × 10⁻⁴ M1.024.66.46 × 10−7
5 × 10⁻⁴ M5.039.64.019 × 10−7
1 × 10⁻³ M5.043.73.6 × 10−7
In the presence of FeL
1 × 10⁻⁵ M1.025.46.3 × 10−7
5 × 10⁻⁵ M1.034.14.66 × 10−7
1 × 10⁻⁴ M3.035.24.52 × 10−7
5 × 10⁻⁴ M3.041.63.82 × 10−7
1 × 10⁻³ M1.046.53.42 × 10−7
Table 4. Tafel parameters for the Nickel metal in 0.5 M H2SO4 when L is present as well as absent at various concentrations and at distinct temperatures.
With the presence of 1 × 10⁻⁵ L
Temp. Ecorr
(V)
Icorr
(µA cm−2)
βa
(V/decade)
βc
(V/decade)
Θη%
25 °C −0.377371.523.3−4.530.39739.7
35 °C−0.388776.317.01−4.140.35435.4
45 °C−0.3911506.618.42−4.340.57557.5
55 °C−0.3893548.1320.87−4.470.52152.1
With the presence of 5 × 10⁻⁵ L
Temp.Ecorr
(V)
Icorr
(µA cm−2)
βa
(V/decade)
βc
(V/decade)
Θη%
25 °C −0.396223.826.2−9.50.63763.7
35 °C−0.41830213.8−5.60.7575.0
45 °C−0.415432.528.2−5.50.87887.8
55 °C−0.427173823.3−4.90.76576.5
With the presence of 1 × 10⁻⁴ L
Temp.Ecorr
(V)
Icorr
(µA cm−2)
βa
(V/decade)
βc
(V/decade)
Θη%
25 °C −0.394125.331.1−5.30.79679.6
35 °C−0.393281.825.9−5.460.76676.6
45 °C−0.3911071.620.81−4.830.69869.8
55 °C−0.3881513.621.1−5.220.79579.5
With the presence of 1 × 10⁻³ L
Temp.Ecorr
(V)
Icorr
(µA cm−2)
βa
(V/decade)
βc
(V/decade)
Θη%
25 °C −0.40858.333.4−4.750.90690.6
35 °C−0.392154.830.1−5.60.87287.2
45 °C−0.387301.932.2−4.70.91491.4
55 °C−0.389703.132.1−5.20.90590.5
Table 5. Tafel parameters for Nickel metal in 0.5 M H2SO4 when FeL is present as well as absent at various concentrations and at different temperatures.
With the presence of 1 × 10⁻⁵ FeL
Temp. Ecorr
(V)
Icorr
(µA cm−2)
βa
(V/decade)
βc
(V/decade)
Θη%
25 °C −0.387338.333.4−4.60.45145.1
35 °C−0.385981.729.5−4.80.18418.4
45 °C−0.3841161.427.6−4.650.67367.3
55 °C−0.3891663.427.9−4.90.77577.5
With the presence of 5 × 10⁻⁵ FeL
Temp.Ecorr
(V)
Icorr
(µA cm−2)
βa
(V/decade)
βc
(V/decade)
Θη%
25 °C −0.384186.434.5−5.30.69869.8
35 °C−0.413407.428.1−5.30.6666.1
45 °C−0.418783.425.3−5.20.7878.0
55 °C−0.4141148.226.1−6.60.84484.4
With the presence of 1 × 10⁻⁴ FeL
Temp.Ecorr
(V)
Icorr
(µA cm−2)
βa
(V/decade)
βc
(V/decade)
Θη%
25 °C −0.37093.033.1−5.10.8585.0
35 °C−0.363301.927.1−6.30.74874.8
45 °C−0.363297.228.2−6.40.91691.6
55 °C−0.366436.528.6−6.30.94294.2
With the presence of 1 × 10⁻³ FeL
Temp.Ecorr
(V)
Icorr
(µA cm−2)
βa
(V/decade)
βc
(V/decade)
Θη%
25 °C −0.34444.6729.3−4.30.92792.7
35 °C−0.34089.228.2−4.50.92592.5
45 °C−0.35491.828.1−4.90.97497.4
55 °C−0.348138.128.8−3.770.98198.1
Table 6. The study examined the impacts of various additives on the adsorption behavior of nickel in a 0.5 M hydrochloric acid solution, analyzing the effects of different concentrations and types of additives to determine their optimal usage.
TemperatureKads M−1 (L)Kads M−1 (FeL)−∆Goads. kJ·mol−1 (L)−∆Goads. kJ·mol−1 (FeL)
2984.4 × 1045.9 × 10336.4431.4
3082.7 × 1046.6 × 10336.4532.8
3182.2 × 1049.02 × 10337.1134.6
3281.4 × 1041.06 × 10437.0536.3
Table 7. EDAX analysis of oxide films formed on the Ni metal after Tafel experiments in the presence of 1 mM of L and FeL.
L
ElementLineMass %Atom %
NK6.22 ± 0.109.73 ± 0.15
OK32.01 ± 0.1637.92 ± 0.22
CK3.16 ± 0.012.06 ± 0.03
SK8.21 ± 0.041.92 ± 0.03
NiK50.40 ± 0.1148.37 ± 0.09
Total 100.00100.00
FeL
OK9.66 ± 0.0715.73 ± 0.21
CK3.20 ± 0.013.05 ± 0.01
NK5.36 ± 0.027.2 ± 0.01
SK3.53 ± 0.031.23 ± 0.04
NiK77.09 ± 0.1171.73 ± 0.07
FeK1.16 ± 0.011.06 ± 0.00
Total 100.00100.00
Table 9. Descriptors of L and FeL compounds’ quantum reactivity.
DescriptorLFeL
EHOMO−6.09−6.08
ELUMO−2.92−3.69
ΔE(LUMO-HOMO)3.172.39
χ4.504.88
η1.581.19
σ0.630.84
Pi−4.50−4.88
ω6.4110.00
ΔNmax2.854.10
Table 8. Charge–discharge parameters for the Ni metal in a 0.5 M H2SO4 solution with different concentrations of L as well as FeL at the different current densities applied.
In 0.5 M H2SO4
Blank
Applied current density tdis.ΔVS.C. (mA. hr−1)
19.150.0370.068
39.70.1040.077
510.10.1540.091
1011.10.2610.118
1511.00.3440.133
2011.60.4120.156
3011.60.5310.182
In the presnce of 1 × 10⁻⁵ M of L
Applied current densitytdis.ΔVS.C.
18.50.0340.069
38.80.1070.685
59.20.1840.069
109.60.3130.085
1510.40.4140.105
2011.30.510.123
3011.80.6680.147
In the presence of 5 × 10⁻⁵ M of L
Applied current densitytdis.ΔVS.C.
19.00.0350.714
39.20.1190.064
510.20.1770.08
1010.60.280.105
1511.20.3530.132
2011.30.1480.422
3011.40.1740.544
In the presence of 1 × 10⁻⁴ M of L
Applied current densitytdis.ΔVS.C.
110.480.0460.063
310.80.1290.069
511.10.2810.054
1011.60.3490.092
1512.00.3490.14
2012.80.420.17
3012.80.5430.197
In the presence of 5 × 10⁻⁴ M of L
Applied current densitytdis.ΔVS.C.
19.80.0790.0344
310.70.1970.045
511.750.2650.062
1012.40.3730.092
1512.70.4670.113
2013.10.5690.128
3013.30.7360.151
In the presence of 1 × 10⁻³ M of L
Applied current densitytdis.ΔVS.C.
19.80.0960.028
311.50.220.043
511.70.280.568
1012.00.420.079
1512.60.5320.098
2013.00.6390.113
3013.20.8220.134
In the presence of FeL
In the existence of 1 × 10⁻⁵ M of FeL
Applied current densitytdis.ΔVS.C.
110.60.0740.039
311.00.1940.047
512.00.2660.063
1012.30.3830.089
1512.80.4750.112
2012.90.5490.131
3012.90.6900.155
In the presence of 5 × 10⁻⁵ M of FeL
Applied current densitytdis.ΔVS.C.
19.00.0550.045
310.00.1640.051
510.70.2280.065
1010.90.3420.088
1512.00.4030.124
2012.50.4810.144
3012.80.5930.179
In the presence of 1 × 10⁻⁴ M of FeL
Applied current densitytdis.ΔVS.C.
19.80.0790.034
311.00.1870.049
511.10.2650.058
1012.10.3880.086
1512.60.4330.121
2012.80.6440.110
3013.10.6440.170
In the presence of 5 × 10⁻⁴ M of FeL
Applied current densitytdis.ΔVS.C.
18.70.0780.031
39.90.2130.038
510.50.290.05
1011.10.4190.073
1511.40.5210.091
2011.90.6510.102
3012.80.8070.132
In the presence of 1 × 10⁻³ M of FeL
Applied current densitytdis.ΔVS.C.
19.820.0730.037
310.50.2060.042
511.10.2990.052
1011.70.4650.698
1512.00.5960.084
2012.60.3030.231
3013.30.6900.161
Disclaimer/Publisher’s Note: The statements, opinions and data contained in all publications are solely those of the individual author(s) and contributor(s) and not of MDPI and/or the editor(s). MDPI and/or the editor(s) disclaim responsibility for any injury to people or property resulting from any ideas, methods, instructions or products referred to in the content.