2. Experimental Method
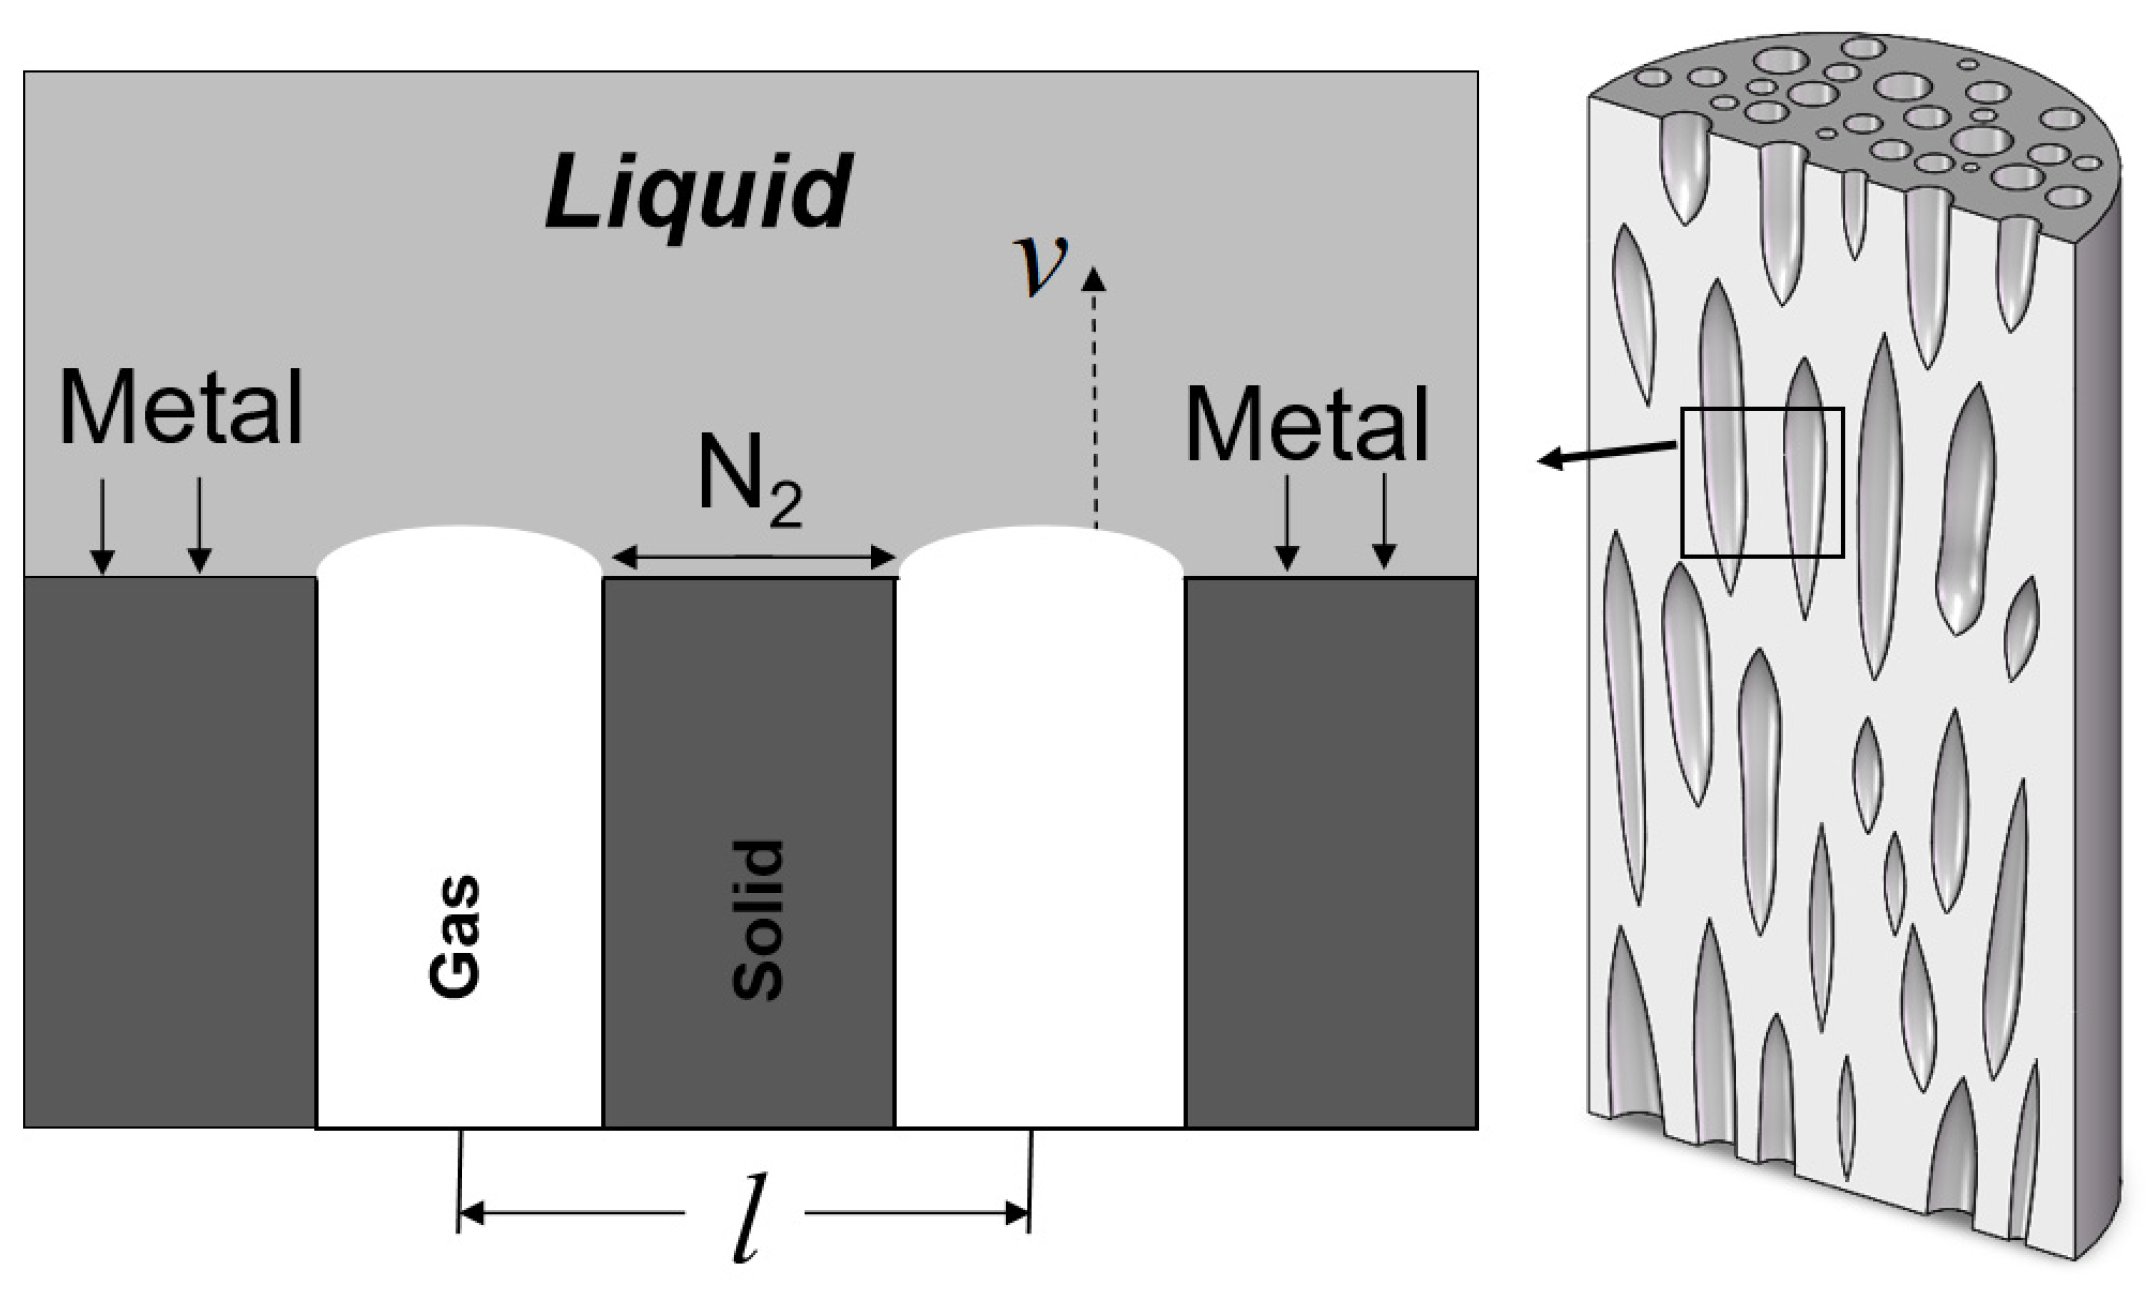
The apparatus used in this study was a vacuum/high-pressure zone melting furnace independently developed and assembled by our research group. Porous pure iron was prepared using the vertical zone melting method (
Figure 1). The maximum power of the furnace’s power supply is 40 kW. In the experiment, high-purity iron rods with a diameter of 10 mm and a length of 300 mm (99.99% purity) were used as samples, and their chemical composition is shown in
Table 1.
Before performing zone melting, a single mechanical pump was used for vacuum extraction. Through pre-vacuum treatment, the furnace pressure was reduced to 1 Pa, effectively preventing the oxidation of the melt. High-pressure nitrogen was then introduced at the required pressure to promote the dissolution of more nitrogen into the melt, as the solubility of nitrogen is not affected by trace impurity gases. Therefore, this method was sufficient to meet the experimental requirements. If hydrogen were used as the working gas, a higher degree of vacuum would typically be required to ensure safety. However, in this experiment, since the inert gas nitrogen was used, there were no safety concerns, and multiple vacuum pumping to achieve an extremely high vacuum level was unnecessary. This is one of the advantages of using nitrogen as the working gas. A single-turn coil high-frequency induction power source was used to heat the sample, melting a small section (approximately 8 mm wide), which remained suspended within the sample due to surface tension. The sample was then pulled at a controlled withdrawal rate to produce lotus-type porous iron.
According to previous reports, when using the zone melting process to prepare lotus-type porous materials, different pulling rates are typically tested under pressures of 25–28 atm. For example, the pulling rate for NiTi alloy is 330 μm/s (20 mm/min) [
17], while for carbon steel, it is set at 160 μm/s (10 mm/min) and 330 μm/s (20 mm/min) [
18], and for stainless steel, the pulling rates used are 160 μm/s (10 mm/min), 330 μm/s (20 mm/min), and 500 μm/s (30 mm/min) [
19]. Considering these experimental parameters and the potential risks of excessively high pressure, we initially selected a nitrogen pressure of 0.6 MPa and a pulling rate of 20 mm/min. However, the obtained sample exhibited an uneven pore surface morphology similar to that observed in Nakajima’s study. We hypothesized that this phenomenon may be caused by insufficient nitrogen diffusion during pore growth, and we aimed to optimize the process parameters by increasing the nitrogen pressure and reducing the pulling rate.
Based on the experimental parameters reported in previous studies, this research was conducted under a nitrogen atmosphere (0.2–1.0 MPa), with the pulling speed of the zone-melted iron rod set between 5 and 25 mm/min. The porosity of the samples was determined using the Archimedean method (water displacement method). An electrical discharge cutting machine was used to cut the samples along the axial and perpendicular directions to obtain longitudinal and cross-sectional views for pore morphology observation.
To investigate the effect of volumetric nitriding treatment on the material, we tested the nitrogen content and micro-Vickers hardness of the lotus-type porous iron. The nitrogen content was measured using an oxygen–nitrogen–hydrogen analyzer (ONH-800) (Sichuan Science Instruments Co., Ltd., Deyang, China), while the micro-Vickers hardness was determined using a fully automatic micro-Vickers hardness tester (HMV-G21) (Shimadzu Corporation (China) Co., Ltd., Kyoto, Japan). The sample was placed on the stage, and a test load of 0.98 N was applied for measurement.
3. Experimental Results
Figure 2 shows the cross-sectional morphology of the porous iron prepared under different nitrogen pressures, with a fixed withdrawal rate of 20 mm/min. At lower nitrogen pressures (0.2 MPa and 0.4 MPa), only a few large pores are formed in the central region of the material, while the peripheral areas have almost no visible pores. This results in low overall porosity and uneven pore distribution, making the porous characteristics of the material less pronounced. This phenomenon may be due to the fact that lower nitrogen pressure is insufficient to provide adequate gas dissolution and precipitation, thereby limiting the effective formation of pores. As the nitrogen pressure increases, significant changes occur in the pore structure. The pore size gradually decreases, while the number of pores increases significantly, and their distribution becomes more uniform. However, despite the improved uniformity in pore distribution, the pore walls appear relatively rough, and the pores are mostly irregularly elliptical in shape. In comparison, the smoothness of the pore walls in porous structures prepared under a nitrogen atmosphere is noticeably lower than that of lotus-type porous materials fabricated in a hydrogen environment.
Figure 3 illustrates the significant influence of the withdrawal speed on the pore morphology of porous iron under a constant nitrogen pressure of 1.0 MPa. It is evident that as the withdrawal speed changes, noticeable variations occur in the number, shape, and quality of the pore walls. At lower withdrawal speeds (5 mm/min and 10 mm/min), the material experiences a longer cooling time during solidification, which favors the stable precipitation of gas and the orderly formation of pores. In this stage, the resulting pores typically exhibit a regular shape, are elongated in alignment, and possess smooth and uniform walls, demonstrating good continuity and structural integrity.
However, as the withdrawal speed increases, the cooling and solidification rates of the material accelerate, significantly shortening the time available for gas to precipitate and diffuse. This leads to the suppression of pore formation. When the withdrawal speed reaches 15 mm/min or higher, the number of pores decreases sharply, the distribution of pores becomes uneven, and the pore walls gradually shift from smooth to rough. When the withdrawal speed further increases to 25 mm/min, the formation of pores is almost completely inhibited.
In summary, nitrogen pressure and withdrawal speed are key factors affecting the pore structure of porous iron. Higher nitrogen pressure and a lower withdrawal speed result in more stable and uniform pore structures. Under the conditions of 1.0 MPa nitrogen pressure and a 5 mm/min withdrawal speed, the most regular lotus-type pores were obtained, with a porosity of 35%, which is almost the same as the materials prepared under a hydrogen atmosphere (40%).
Since the primary factor affecting nitrogen content variation is nitrogen gas pressure, we measured the nitrogen content and micro-Vickers hardness of lotus-type porous iron samples under different pressure conditions to investigate the effect of nitrogen gas pressure on the material properties. As shown in
Figure 4, the nitrogen content increases with rising nitrogen gas pressure. At 0.2 MPa, the nitrogen content is 0.031 wt.%, while at 1.0 MPa, it increases to 0.077 wt.%. This indicates that higher nitrogen gas pressure facilitates the dissolution of nitrogen in the iron-based material, thereby altering its microstructure and mechanical properties.
To further analyze the effect of nitrogen gas pressure on material hardness, we sampled along the solidification direction and selected multiple evenly distributed test points along the thickness direction for micro-Vickers hardness measurements. The results show that the micro-Vickers hardness of lotus-type porous iron significantly increases with nitrogen gas pressure. Specifically, at 0.2 MPa, the hardness was 148 HV, while at 1.0 MPa, it rose to 192 HV. In comparison, the micro-Vickers hardness of pure iron is only 136 HV. This change is primarily attributed to the solid solution strengthening effect of nitrogen in the iron-based material [
20]. As the nitrogen content increases, the solid solution effect of nitrogen atoms in the iron matrix becomes more pronounced, thereby enhancing the material’s hardness and overall mechanical performance. Thus, the increase in nitrogen gas pressure not only promotes the dissolution of nitrogen in the iron-based material but also enhances the solid solution strengthening effect, leading to improved mechanical properties of the porous iron-based material.
In the field of biomedical materials, mechanical strength and weight are crucial factors influencing material applications. While maintaining low density, the mechanical properties of porous iron-based materials can be optimized by adjusting the nitrogen gas pressure, enabling excellent strength and lightweight characteristics. This tunable feature makes them highly promising for applications in the biomedical field, such as bone implants or scaffold materials, to meet specific mechanical requirements.
4. Discussion
The formation of lotus-type pores is the result of the simultaneous growth of gas and solid phases during directional solidification. An earlier study [
21] suggested that this process resembles a solid/gas eutectic transition, where the liquid phase transforms into solid and gas phases. However, in traditional binary eutectic reactions, the formation of an ordered eutectic structure requires two solid phases with similar thermochemical properties. Clearly, the formation of lotus-type pores does not meet this condition, as gases and metals have distinct thermochemical properties.
The process of simultaneous directional growth of gas and solid phases can be simplified into the growth model shown in
Figure 5. Gas undergoes long-range diffusion into the bubbles along the solidification interface, while liquid atoms undergo short-range diffusion to transition into the solid phase at the interface. The nitrogen diffusion rate along the solidification interface can be expressed as follows [
21]:
Figure 6 is a schematic diagram of the free energy–composition curve for the Fe-N melt. As shown in
Figure 6, the free energy curve of the Fe-N melt exhibits significant asymmetry. Firstly, due to the extremely low solubility of N in the iron melt (typically much less than 1%), the minimum of the curve is heavily skewed toward the Fe side. Secondly, the free energy curve extends significantly upward on the N side because the transformation of N in the Fe-N melt into N
2 gas bubbles releases much more energy (far higher than the energy released when liquid Fe transforms into solid Fe).
To transform the saturated Fe-N melt into a lotus-type porous material, the melt must possess sufficient undercooling to provide the diffusion driving force
for both N and Fe, as shown in
Figure 6. During directional solidification, N will accumulate at the solid phase front at the solidification interface (at point ① on the
curve), while N will be depleted at the gas phase front (at point ② on the
curve).
If a tangent is drawn at point ① on the curve, the tangent will intersect the left and right vertical axes of the graph at points a and c, respectively. Point a represents the chemical potential of Fe in the melt at the solid phase front, , while point c represents the chemical potential of N in the melt at the solid phase front, . Since the solid phase and the melt composition at point ① are in equilibrium at the solid/liquid interface, the tangent should coincide with the free energy of the solid phase at point a—that is, .
Similarly, the tangent drawn at point ② intersects the left vertical axis at point d, which represents the chemical potential of Fe in the liquid iron at the gas phase front, , and intersects the right vertical axis at point b, which represents the chemical potential of N in the liquid phase at the gas phase front, . Since the gas phase and the melt composition at point II are in equilibrium at the gas/liquid interface, the tangent should coincide with the free energy of the gas phase at point b—that is, .
The length ad represents
, which is the driving force for Fe diffusion; the length cb represents
, which is the driving force for N diffusion. From
Figure 6, it can be seen that due to the asymmetric shape of the
curve, the driving force for N diffusion is much greater than that for Fe diffusion. This is consistent with the previous discussion, where N diffusion is essentially long-range and thus requires more energy compared to the short-range diffusion of Fe.
According to the geometric relationships shown in
Figure 6,
can be expressed as follows:
where
represents the mole fraction of N in the iron melt.
Because the minimum of the free energy–composition curve is extremely close to the metal side (
Figure 6), the diffusion Gibbs free energy
is approximately equal to
. According to solidification theory, at this point,
, where L is the latent heat of solidification of iron (J/m
3). Therefore:
At the solidification interface, the nitrogen diffusion flux
required for stable bubble growth is as follows:
where
is the solubility of nitrogen (mol/m
3) in the liquid phase at the melting point, and its relationship with the mole fraction
is as follows:
where
represents the molar mass of Fe (kg/mol), and
is the density of Fe (kg/m
3).
When the pore grows at a constant rate, the required nitrogen diffusion flux
is as follows:
where
is the gas pressure in the pore. Here,
, where
is the pressure of nitrogen above the melt,
is the capillary pressure of the bubble (which can be neglected due to the pore diameter being on the millimeter scale), and
is the hydrostatic pressure (which can also be neglected since the length of the molten zone is less than 10 mm).
To ensure steady growth of both the bubble and the solid phase, the following condition must be satisfied:
Combining Equations (1)–(7) gives the following:
Assuming that the pore spacing is constant, and under the melting point and a given pressure, the nitrogen diffusion coefficient
, the latent heat of solidification
of iron, and the solubility
of nitrogen in the iron melt are all constants. Therefore, Equation (8) can be simplified as follows:
This inequality reflects the necessary condition for the formation of aligned pores during directional solidification. If is too high (i.e., if the pressure is excessively high or the withdrawal rate is too fast, or both), then nitrogen cannot accumulate at the solid–liquid interface to a sufficient concentration to sustain stable pore growth. This leads to an insufficient number of pores, rough pore walls, and low porosity.
Substituting the corresponding parameters from
Table 2 into Equation (8), the influence of nitrogen pressure and withdrawal rate on pore morphology can be determined, as shown in
Figure 7. The region below the curve corresponds to the conditions under which pores can form, while the region above the curve corresponds to the conditions under which pores cannot form. Stable pore growth requires balancing the pressure and the withdrawal rate. Low nitrogen pressure results in fewer pores, while high solidification rates prevent nitrogen from dissolving adequately into the molten zone, thus hindering regular pore formation.
Thus, it can be seen that achieving stable pore growth is primarily based on the strategy of having “sufficiently high pressure” and a “sufficiently low withdrawal rate” while satisfying . These two factors need to be balanced in practical process control: although a higher pressure is beneficial for nitrogen dissolution and pore formation, it also poses significant challenges to equipment safety and increases costs. Similarly, a slower withdrawal rate promotes pore formation but reduces production efficiency. Therefore, in actual production, it is essential to consider factors such as material properties, equipment capabilities, and cost-effectiveness to select the appropriate parameters that meet the necessary conditions for forming a lotus-type porous structure.


