Article

Effects of Heating Methods on Precipitation Behavior and Nucleation Activation Energy of γ′ Phase in Iron–Nickel-Based Alloy

1
Department of Mechanical Engineering, Tsinghua University, Beijing 100084, China
2
Datang North China Electric Power Test and Research Institute, Beijing 100040, China
3
AVIC Changhe Aircraft Industry (Group) Co., Ltd., Jingdezhen 333002, China
4
Shanghai Turbine Plant, Shanghai Electric Power Generation Equipment Co., Ltd., Shanghai 200240, China
*
Author to whom correspondence should be addressed.
Metals 2025, 15(4), 345; https://doi.org/10.3390/met15040345
Submission received: 19 February 2025 / Revised: 9 March 2025 / Accepted: 19 March 2025 / Published: 21 March 2025

Abstract

:
Electromagnetic induction heating, which converts electromagnetic energy into thermal energy via electron-lattice collisions, and heat conduction heating, which transfers thermal energy through lattice vibrations, both have significant impacts on the solid-state precipitation behavior caused by atomic diffusion. This paper proposes a creep method based on heat conduction heating, which utilizes the turning point of negative creep to measure the isothermal transformation start curve of the γ′ phase in the alloy. The results are compared with the thermal expansion experiments under electromagnetic induction heating and simulations from the thermodynamic analysis software JMatPro. The results indicate that the nucleation incubation period of the γ′ phase in the creep experiment is longer, excluding the non-thermal effects of electricity, and more consistent with actual heat treatment conditions. The overlapping precipitation of other phases, such as M23C6 carbides at grain boundaries, reduces the γ′ phase’s fastest precipitation temperature determined by the creep and thermal expansion methods, thereby lowering the accuracy of the isothermal transformation curve. This study provides a reference for optimizing production processes and evaluating the service performance of precipitation-strengthened iron–nickel-based alloys.

1. Introduction

Due to their lower cost compared to Ni-based superalloys and their excellent mechanical properties, precipitation-strengthened iron–nickel-based alloys have become a candidate material for 650 °C thermal power units [1,2]. As the primary strengthening phase, γ′-Ni₃(Al, Ti) significantly enhances the alloy’s strength by hindering dislocation movement. Research has shown that the nucleation and precipitation behavior of the γ′ phase directly affects the material’s mechanical properties [3,4]. Therefore, understanding the precipitation behavior of the γ′ phase is crucial for optimizing heat treatment processes and predicting the service performance of new iron–nickel-based alloys.
Isothermal precipitation curves (“Precipitation” here denotes the formation of γ′ phase particles, distinct from phase transformations involving structural rearrangements.) are commonly used to reflect the precipitation behavior of the γ′ phase. In the precipitation process of iron–nickel-based alloys, there are not only microstructural changes but also changes in mechanical properties, volume, and magnetism. Based on these changes, researchers have employed classical methods [5,6] such as thermal expansion, magnetic analysis, and metallographic hardness to determine isothermal precipitation curves. In recent years, with the development of thermodynamic simulation software (e.g., Thermo-Cal 2024b and JMatPro V9.0), researchers can more conveniently predict the precipitation behavior and stability of the γ′ phase [7]. However, the accuracy and application scope of these methods still need further validation.
In studies of γ′ phase precipitation behavior, electromagnetic induction heating is often used for thermal expansion experiments due to its fast and uniform heating characteristics. However, in industrial production, heat conduction heating is more commonly used. Unlike electromagnetic induction heating [8], which converts electromagnetic energy into thermal energy through electron–lattice collisions, heat conduction heating relies on lattice vibrations to transfer heat energy, leading to differences in the γ′ phase precipitation process. Therefore, it is necessary to study the different effects of electromagnetic induction heating and heat conduction heating on the microstructure and mechanical properties during alloy heat treatment.
This study focuses on a new type of iron–nickel-based alloy. Through creep experiments, thermal expansion experiments, and precipitation simulations, three γ′ phase isothermal precipitation start curves were obtained. By analyzing the γ′ phase precipitation rate and precipitation temperature, combined with microstructural analysis, the differences in isothermal precipitation curves measured by different methods were investigated.

2. Materials and Methods

2.1. Sample Information

The new iron–nickel-based material used in this paper was produced by a Shanghai turbine plant from Shanghai Electric Power Generation Equipment Co., Ltd. using heavy forging technology. The composition of the new iron–nickel-based alloy used in this study after measurement by an electron probe microanalyzer (EPMA, JXA8230, JEOL, Tokyo, Japan) is shown in Table 1. Elements such as Ti and Al were introduced in the alloy design to form a stable γ′ precipitation-strengthened phase [9].
According to the factory processing specifications, the raw material (1000 mm × 900 mm × 150 mm) was subjected to a two-step homogenization process to eliminate chemical segregation and precipitated phases as follows: (1) holding at 1080 °C for 210 min, followed by air cooling for 30–40 min; (2) holding at 1000 °C for 120 min, followed by water cooling to room temperature to retain solute uniformity.

2.2. Experimental Methods

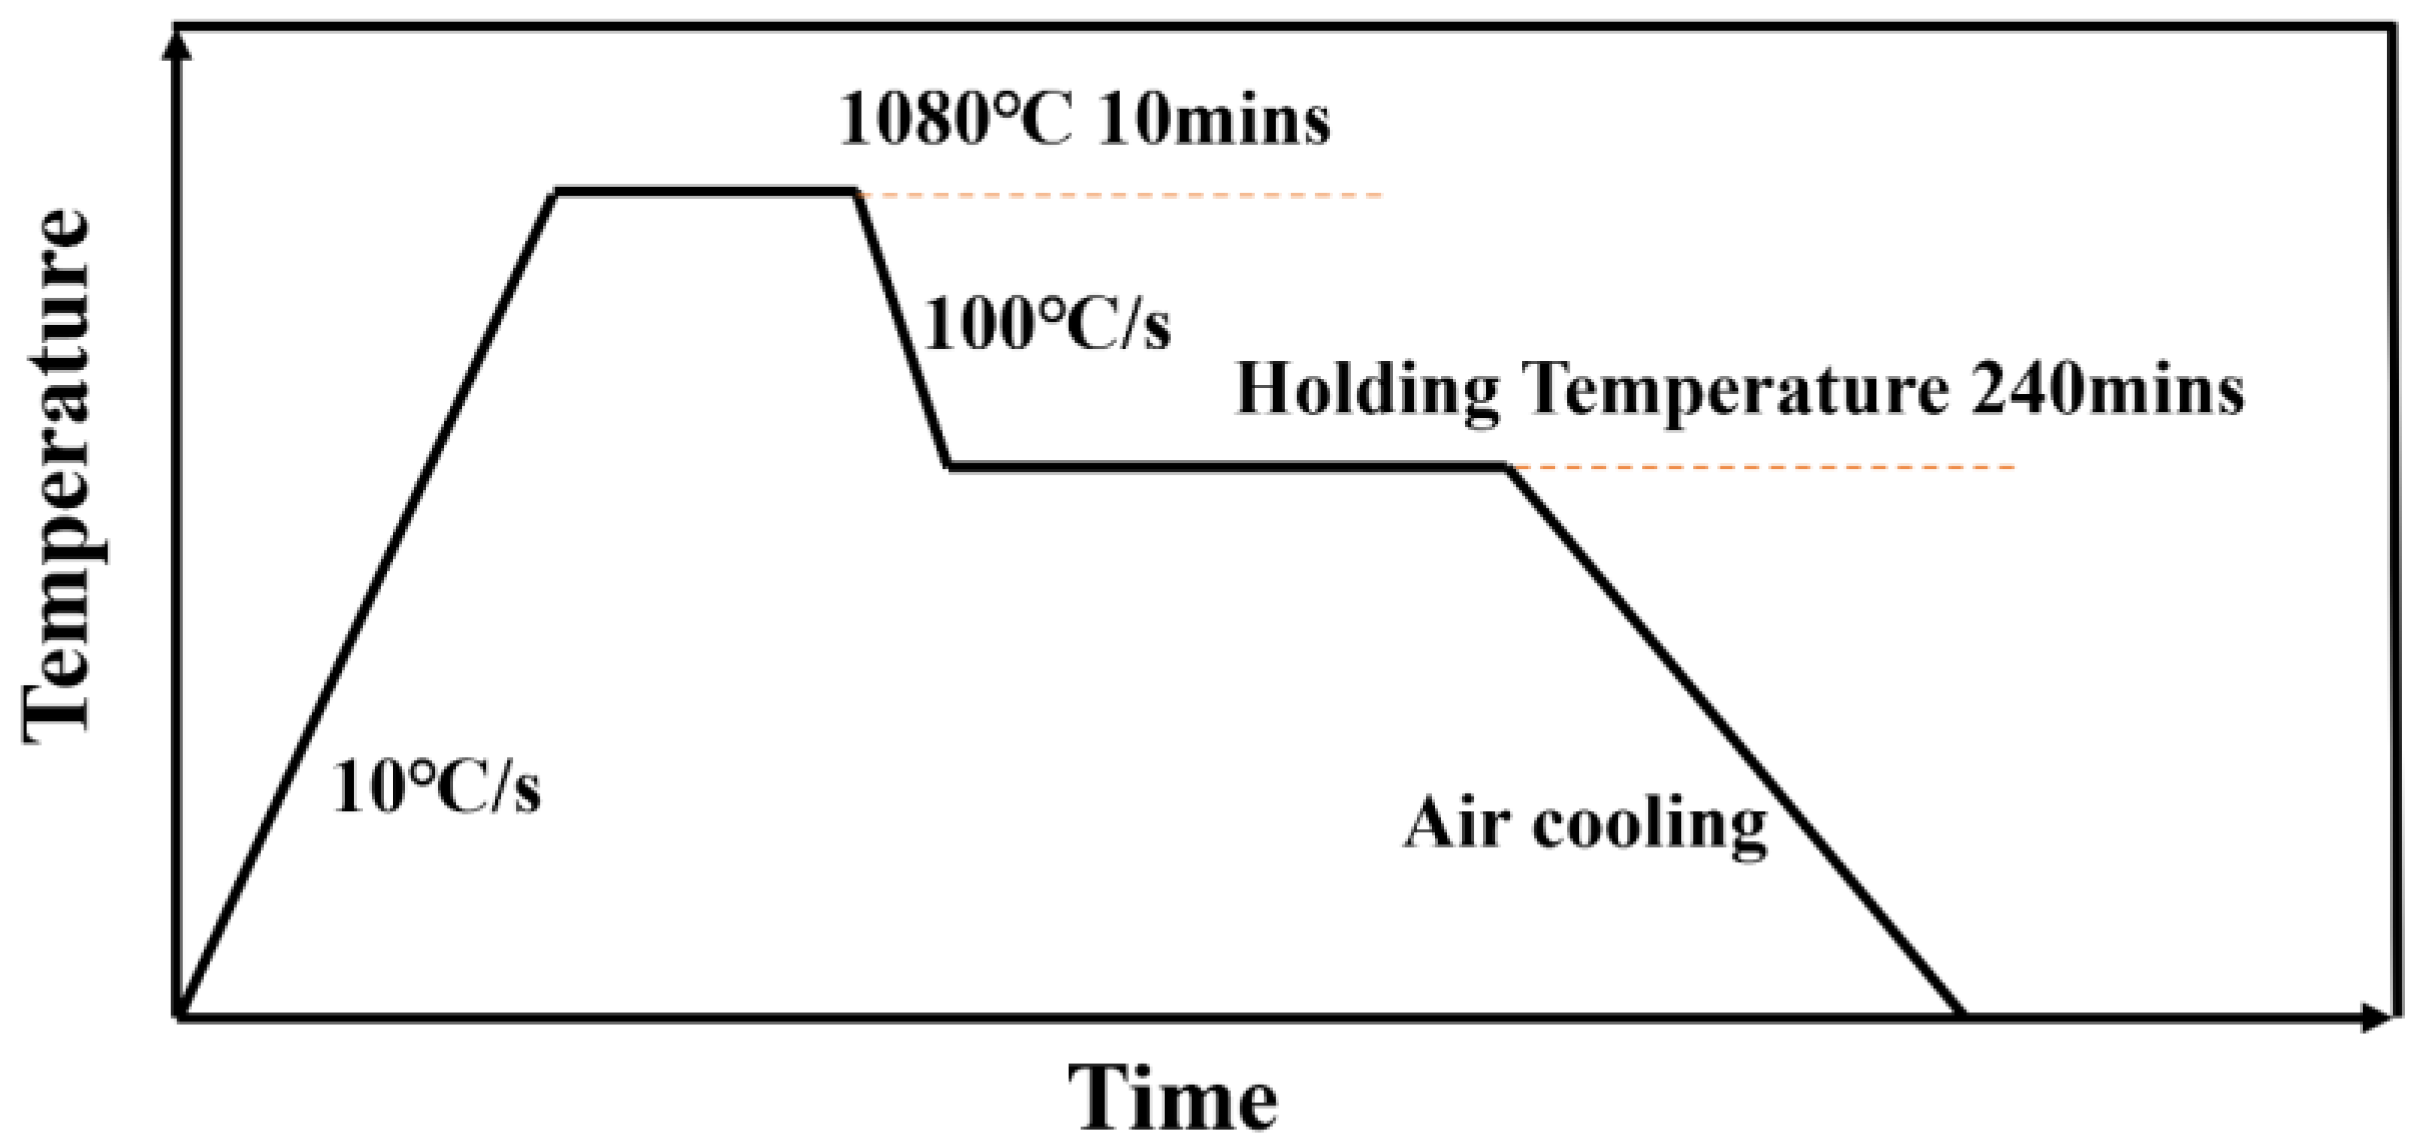
2.2.1. Thermal Expansion Test
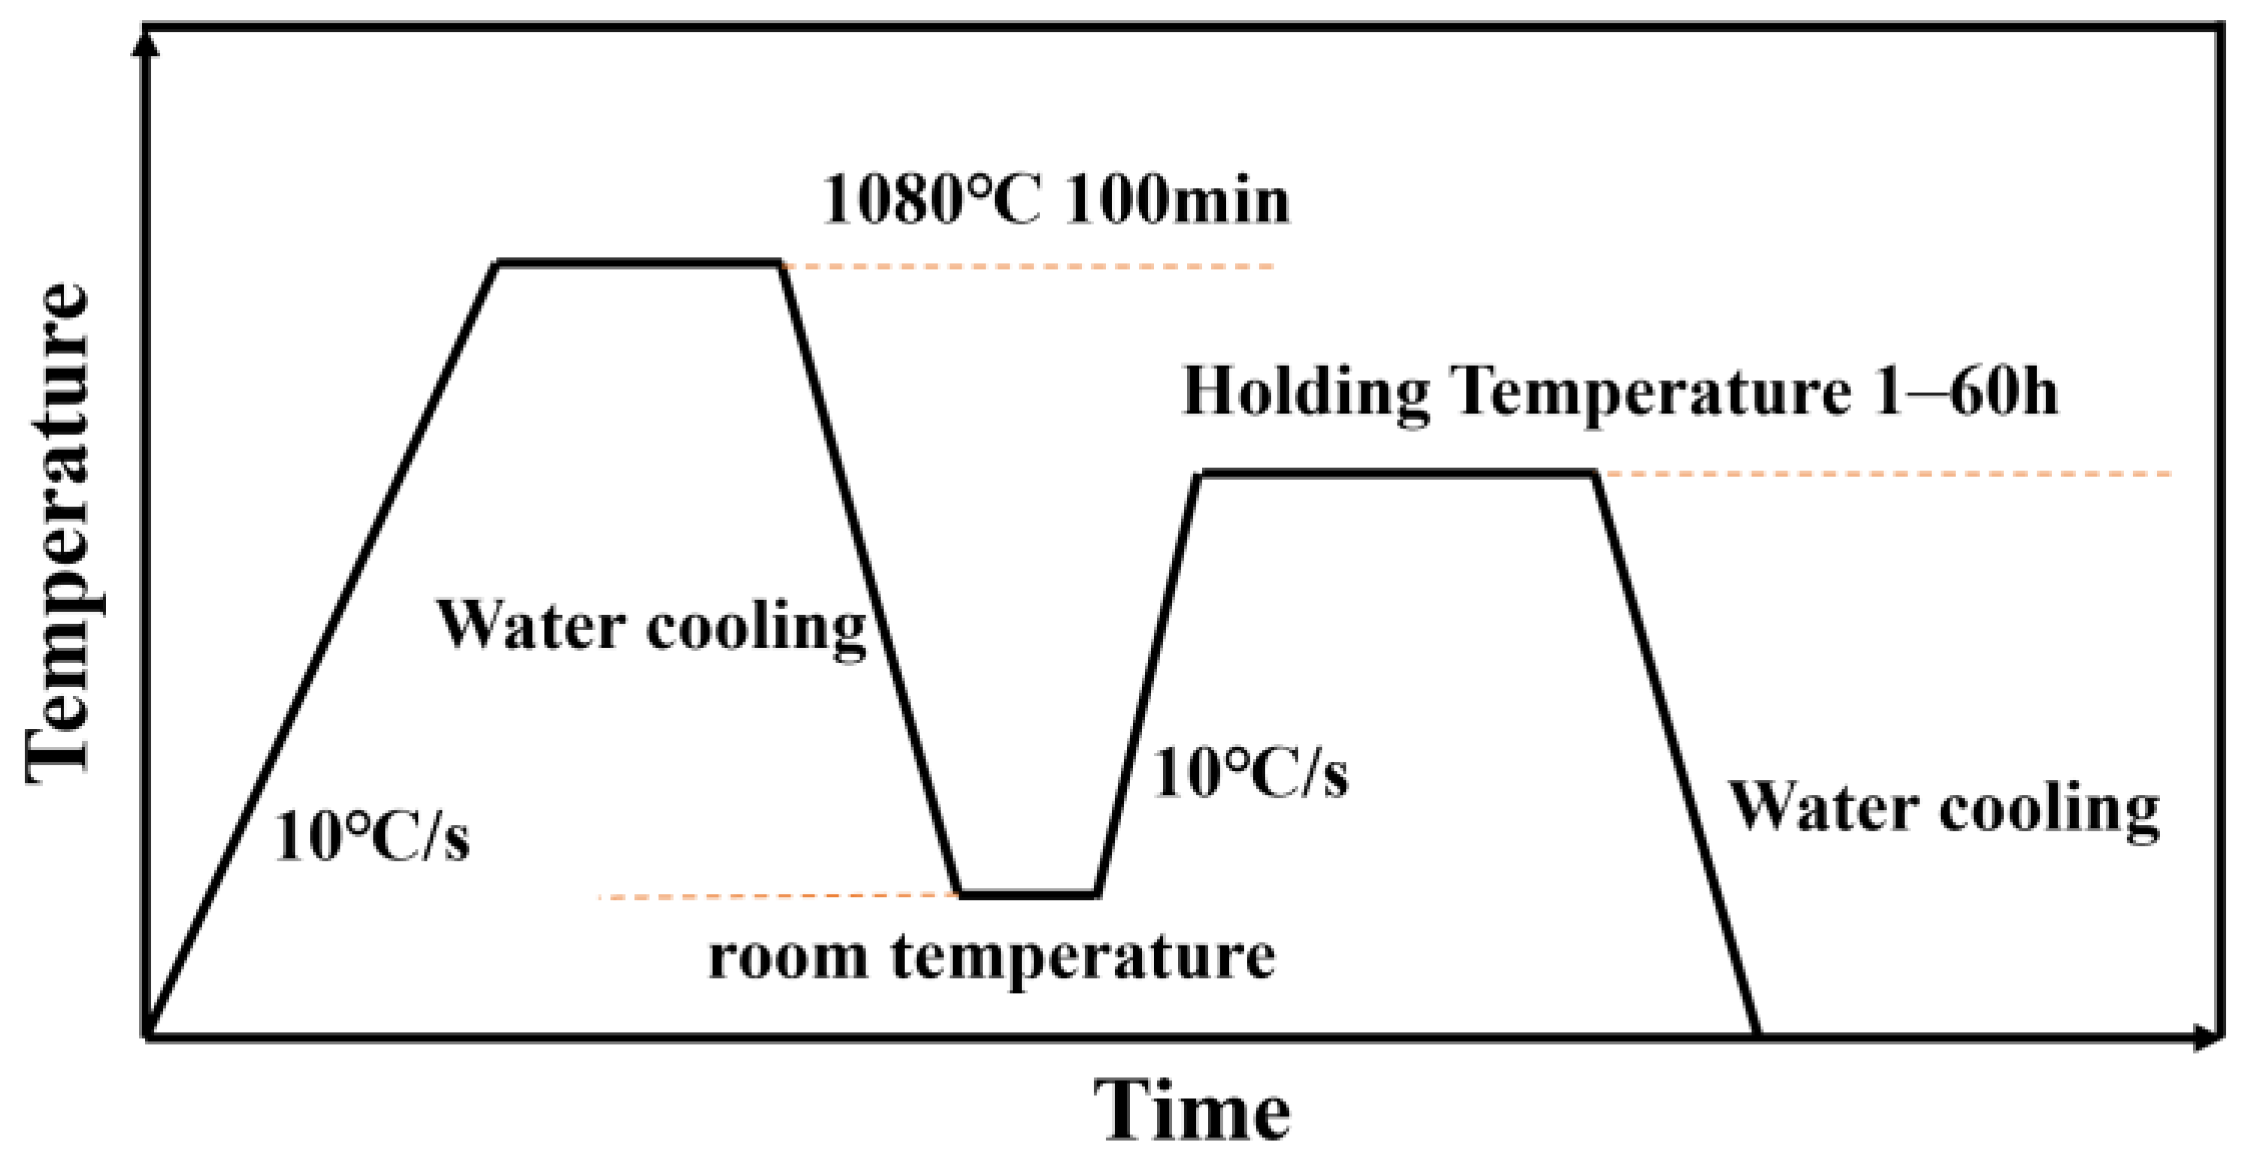
This study used a quenching dilatometer (DIL, 805ADT, Waters, Shanghai, China) to measure the isothermal transformation start curve of the γ′ phase under electromagnetic induction heating. Six samples with dimensions of Φ4 mm × 10 mm were prepared, and the ends of the samples were polished to ensure parallelism. The thermal expansion test procedure was as follows: hold the samples at 1080 °C for 10 min, then cool them to different temperatures between 600 °C and 850 °C (with intervals of 50 °C) and hold for 4 h. The experimental process is shown in Figure 1. The thermal expansion test was conducted by monitoring the volume shrinkage of the samples during the holding process and plotting the curve of volume change versus holding time. The starting and ending points of γ′ phase precipitation were determined from these curves to evaluate the precipitation behavior. This method is considered to be one of the more accurate approaches for determining isothermal precipitation curves [10].

2.2.2. Creep Test

Negative creep, a phenomenon where a material exhibits abnormal creep or stress relaxation behavior under certain conditions, is an important feature in precipitation-strengthened iron–nickel-based alloys [11,12]. It is widely believed that the essence of negative creep is the volume shrinkage caused by the precipitation phase during the precipitation process [13]. Inspired by this shrinkage strain, a series of low-stress creep experiments were designed. Using a high-temperature creep tester (HCT, GWT, MTS, Shanghai China) that simulates heat conduction heating, the actual industrial heating method was replicated. Six creep specimens with a gauge length of 25 mm, a diameter of 5 mm, and total length of 100 mm were held at temperatures between 600 °C and 850 °C (with intervals of 50 °C) for 4 h [14].
The choice of experimental stress is crucial. To minimize the influence of tensile stress on the negative creep precipitation process, the tensile stress in the creep test was kept as close to zero as possible. However, due to the operational requirements of the creep tester, a certain tensile load had to be applied to maintain grip stability. Therefore, a tensile load of 15 MPa was selected. Studies [15,16] have shown that this stress level effectively reduces the impact of creep stress on the precipitation-induced shrinkage process while ensuring data stability.

2.2.3. Precipitation Simulation Using JMatPro

To verify the accuracy of the experimentally obtained γ′ phase isothermal precipitation curves, the thermodynamic software JMatPro V9.0 simulation utilized the exact composition listed in Table 1, including 2.0 wt.% Al and 1.4 wt.% Ti. The nickel–iron alloy database (Ni-Fe-Ti-Al-Cr-Co) was selected to account for multi-component interactions, the isothermal precipitation start curves of the γ′ phase were calculated and compared with experimental results.

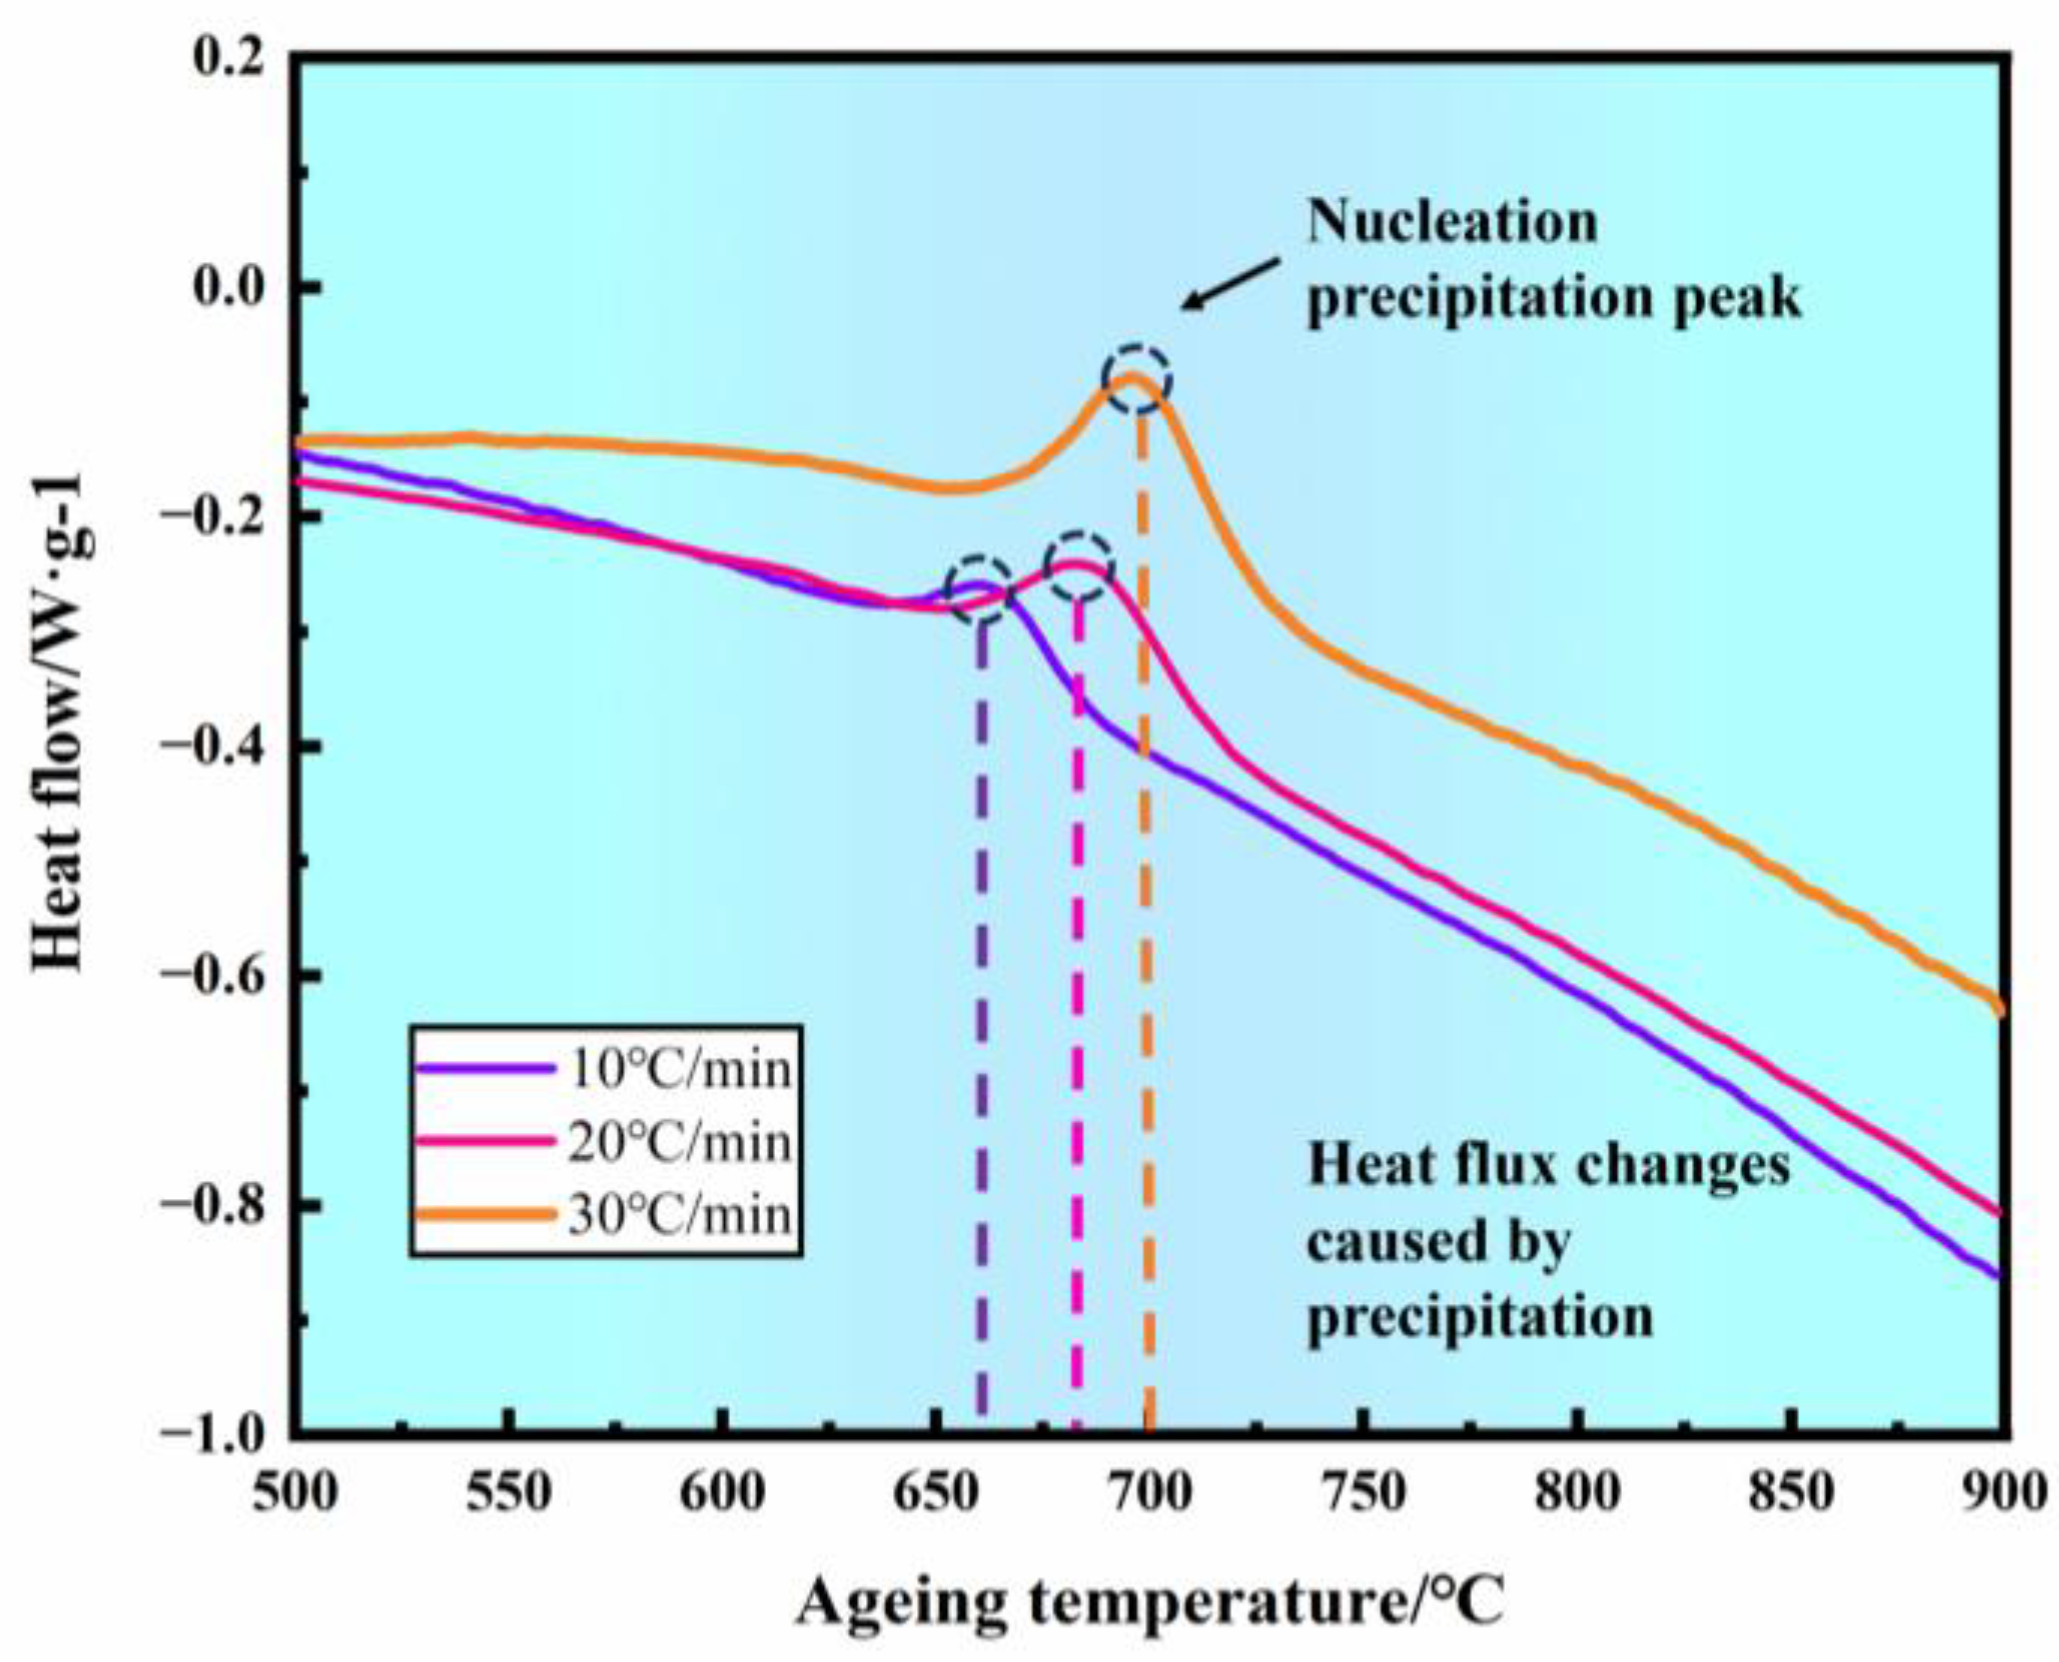
2.2.4. Differential Scanning Calorimetry (DSC)

Unlike grain growth, nucleation often occurs rapidly at high temperatures, making it difficult to precisely measure by direct observation. Therefore, obtaining nucleation activation energy is a complex process [17]. Currently, DSC is a commonly used method for determining nucleation activation energy [18,19]. Three disc-shaped samples (Φ3 mm × 1 mm) were placed in ceramic crucibles, and DSC tests were performed using a simultaneous thermal analyzer (DSC, 1600LF, METTLER TOLEDO, Greifensee, Switzerland) under nitrogen protection to observe heat flow changes and the exothermic peak position of the precipitated phase. The DSC was customized with an induction coil integrated into the furnace chamber, allowing direct electromagnetic heating of conductive samples. This configuration achieves heating rates up to 100 °C/s, suitable for simulating rapid thermal cycles in industrial processes. The heating temperature range was 500 °C to 900 °C, and the heating rates were 10 °C/min, 20 °C/min, and 30 °C/min.

2.2.5. Aging Test

To analyze the differences in the fastest precipitation temperature of the γ′ phase in the isothermal precipitation curves, an aging experiment was designed to observe the evolution of different structures in the alloy. The heat treatment process is shown in Figure 2 as follows: (1) solution treatment: 28 samples were held at 1080 °C for 100 min, followed by water cooling to room temperature; (2) aging treatment: The samples were divided into four groups and held at 650 °C, 750 °C, 800 °C, and 850 °C for 60 h.
The samples were mounted, mechanically polished, and prepared as metallographic specimens. A mixed solution of 40 mL water, 10 mL hydrochloric acid, and 8 mL copper chloride was used for etching, and a scanning electron microscope (SEM, GeminiSEM 300, ZEISS, Oberkochen, Germany) equipped with an EDS spectrometer was used to observe the microstructure at different temperatures and times.

3. Results

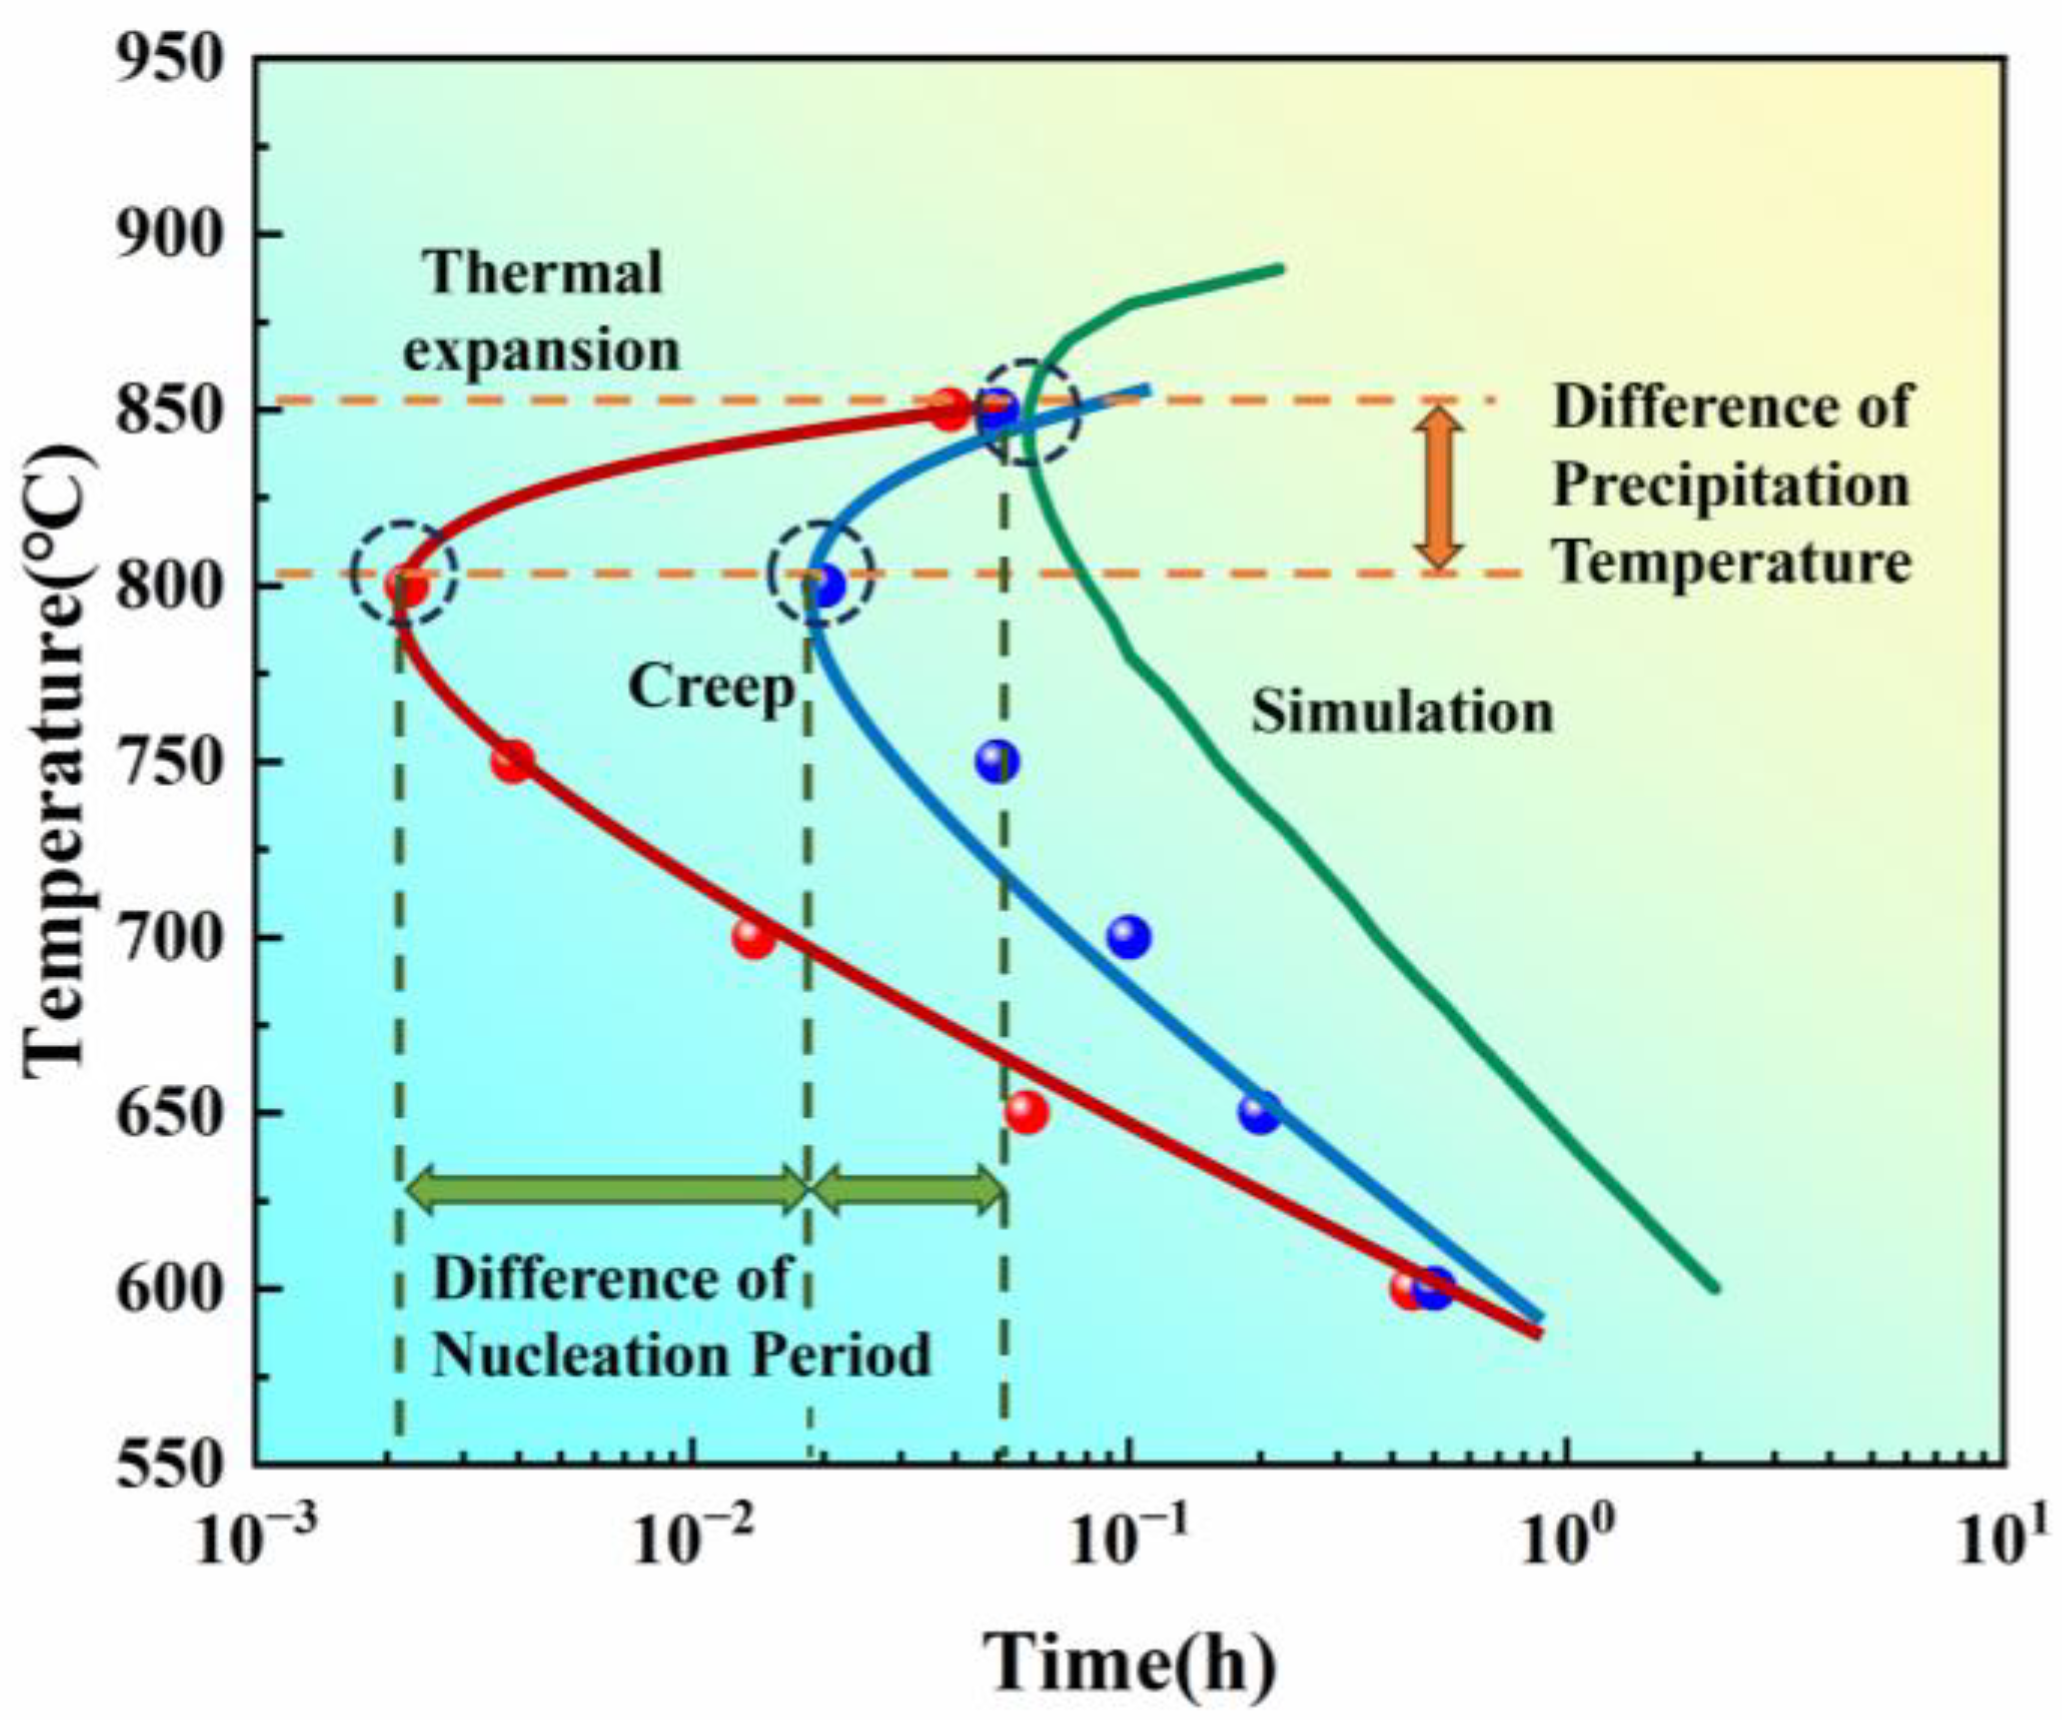
3.1. Thermal Expansion Test

The strain variation of the samples within 4 h was measured using the thermal expansion method, and the results are shown in Figure 3. All six thermal expansion curves exhibit similar three-stage precipitation characteristics: (1) Incubation Period: During this stage, the amount of precipitation is low, and the volume contraction occurs slowly; (2) Rapid Precipitation Period: After the turning point, the rate of contraction increases significantly, and the amount of precipitation grows rapidly; (3) Completion Stage: In the later stage of heating, interactions between precipitated phases (e.g., aggregation and dissolution) slow down or stop the precipitation, and the volume contraction rate reaches a minimum. The maximum volume contraction rate reached 1.6‰.
Within the 600–850 °C temperature range, the volume contraction decreases as the temperature increases, while the precipitation rate gradually increases from 600 °C to 800 °C, peaking at 800 °C. This corresponds to the nose temperature of the isothermal transformation curve, where the rapid precipitation start time is approximately 0.0025 h. At temperatures above 800 °C, such as at 850 °C, the precipitation rate begins to decrease.
In this study, the starting point of γ′ phase precipitation was determined by identifying the deviation from linearity in the thermal contraction curve [20] (red arrows indicate the precipitation start points determined by first derivative analysis as shown in Figure 3). Firstly, the first derivative of strain versus time (dε/dt) was calculated to identify deviations from linearity. A significant increase in∣dε/dt∣ marked the onset of precipitation-induced contraction. Then, the precipitation start time was defined as the intersection point of this linear deviation and the baseline [20].
The uncertainty in determining the start time was estimated to be ±0.001 h, based on repeated measurements of three samples at each temperature. By summarizing the precipitation start times at different temperatures, the isothermal transformation curve was plotted (Figure 4).

3.2. Creep Test

Figure 5 shows the creep curves and their smoothed results at temperatures ranging from 600 °C to 850 °C. The experimental results reveal positive and negative creep oscillation phenomena during the creep process under low-stress conditions at different temperatures, showing the creep turning point (CTP) and the negative creep turning point (NCTP).
(1)
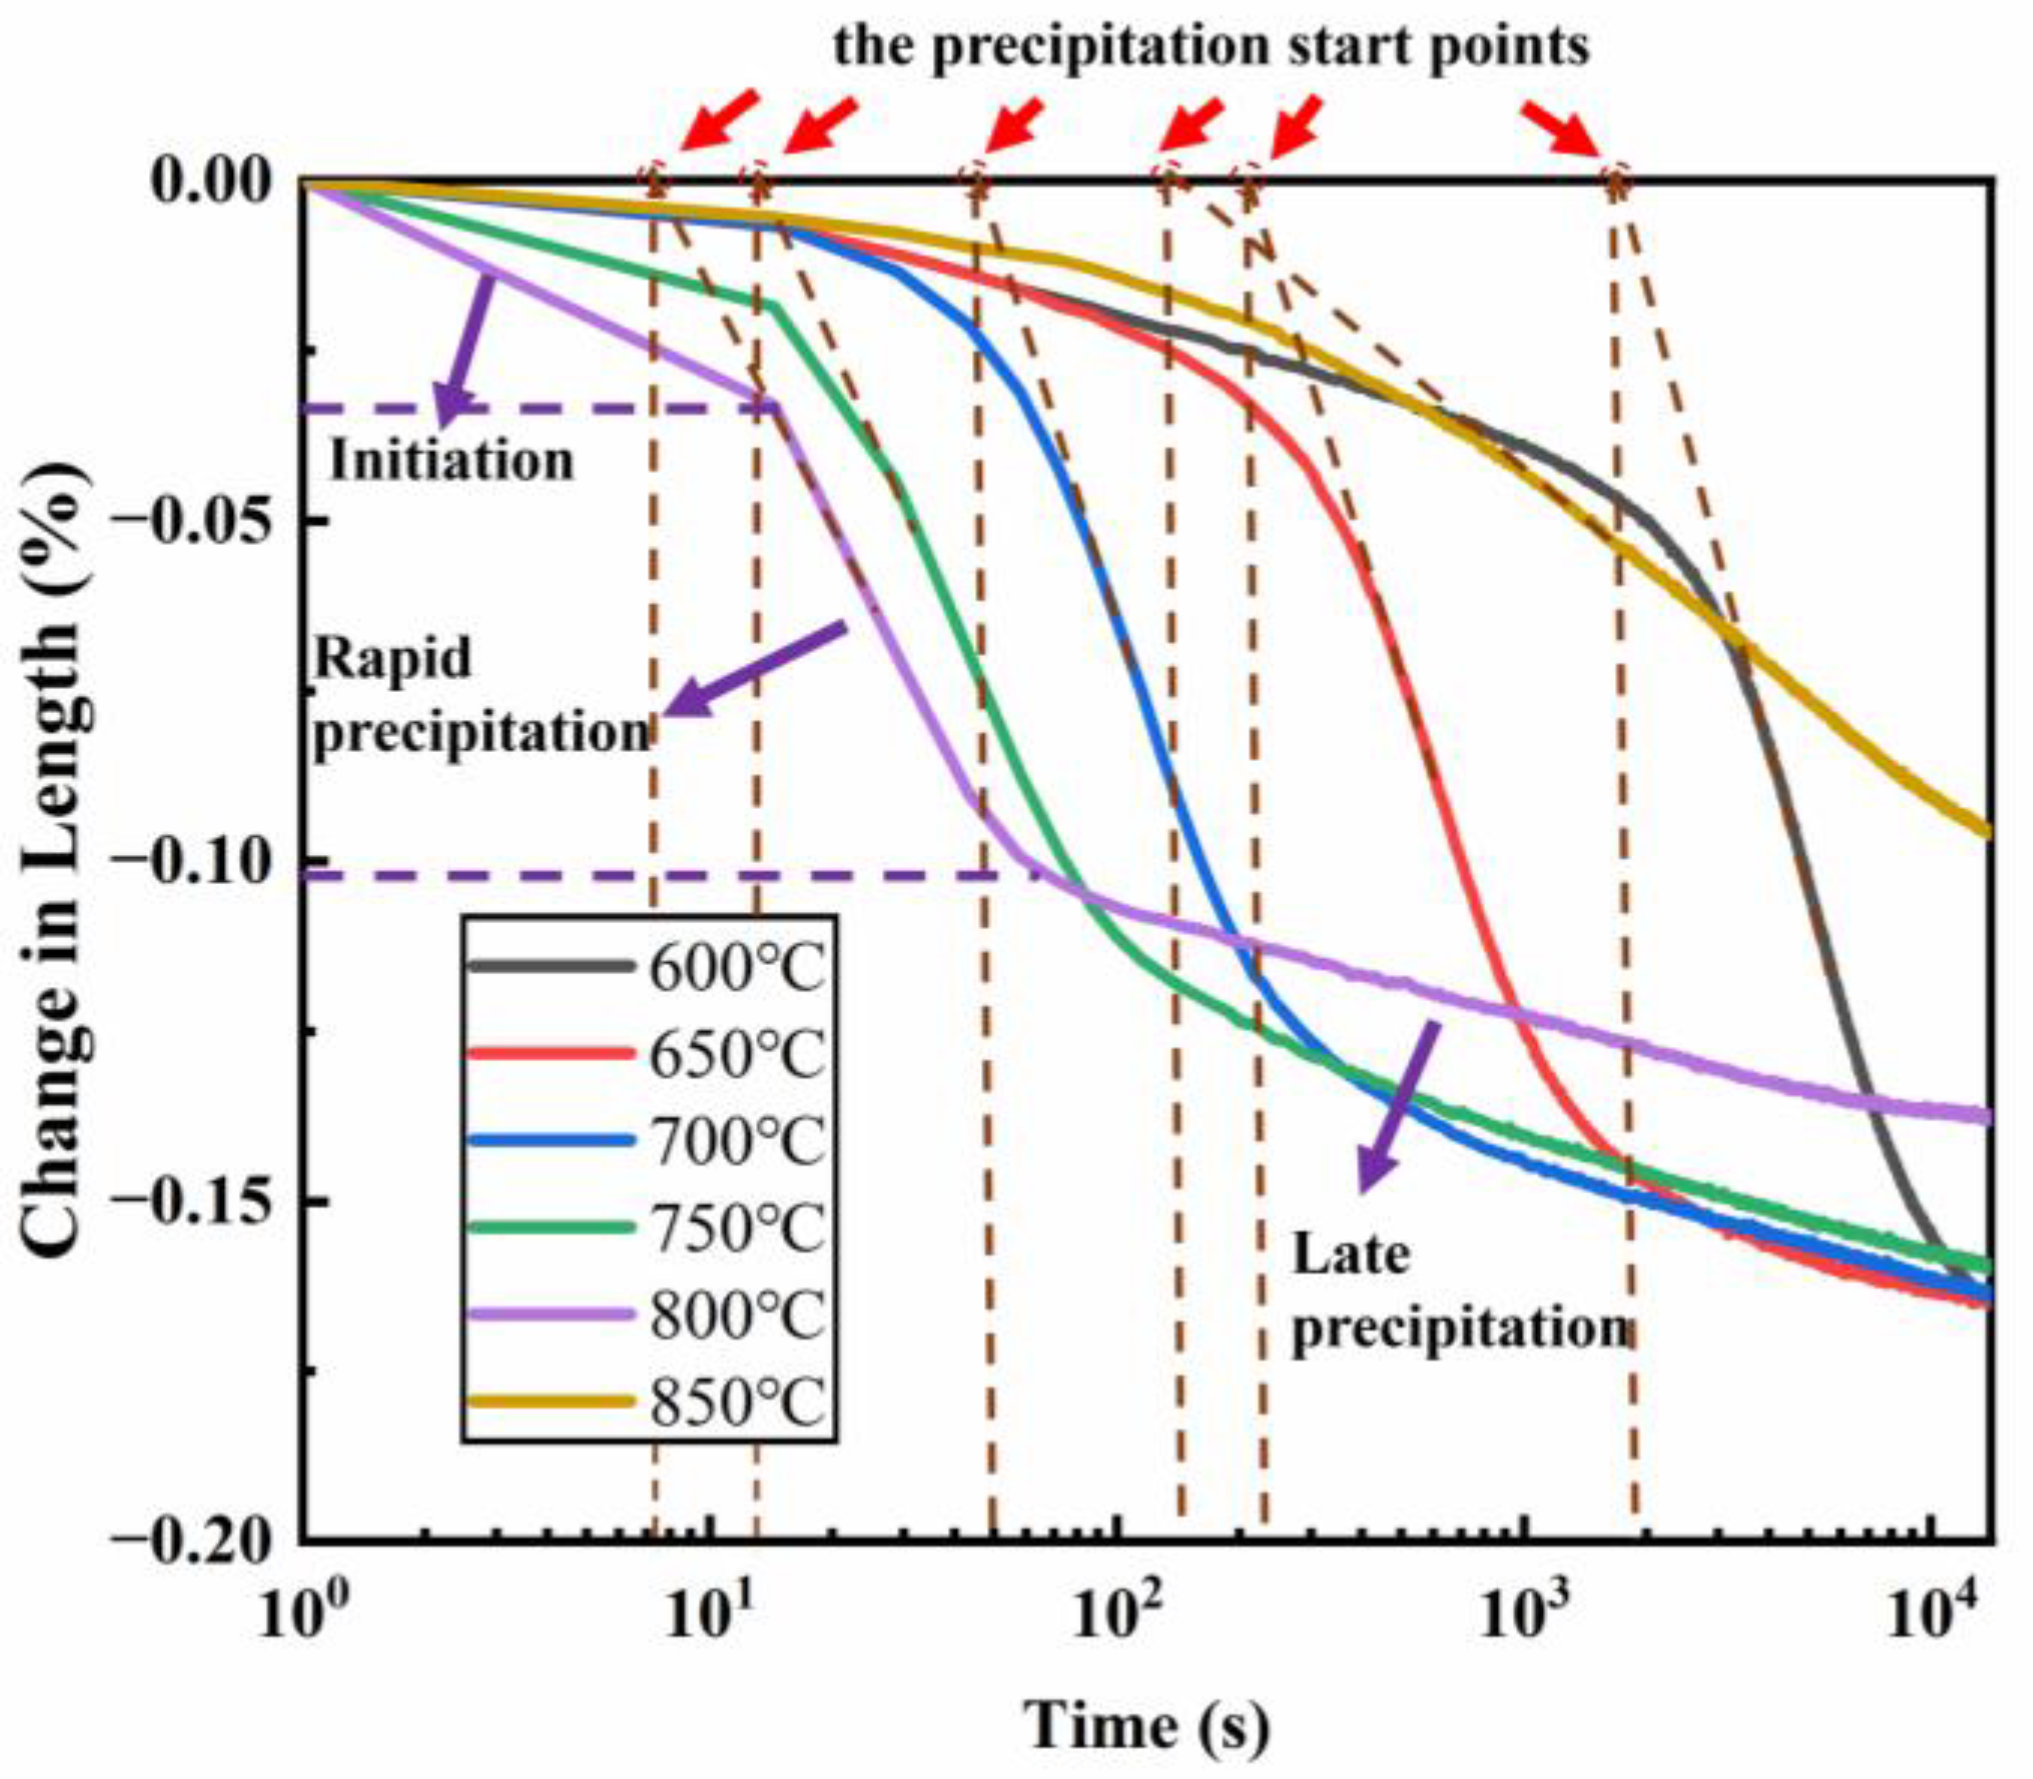
At 600 °C/700 °C/750 °C: At these temperatures, the creep curves exhibit a NCTP after the incubation period, followed by a rapid negative creep stage (Figure 5a–c).
(2)
At 750 °C: An abnormal alternating positive and negative creep phenomenon occurs. After a slight precipitation incubation period, a CTP appears, followed by a positive creep stage, then another NCTP, leading to a rapid negative creep stage (Figure 5d).
(3)
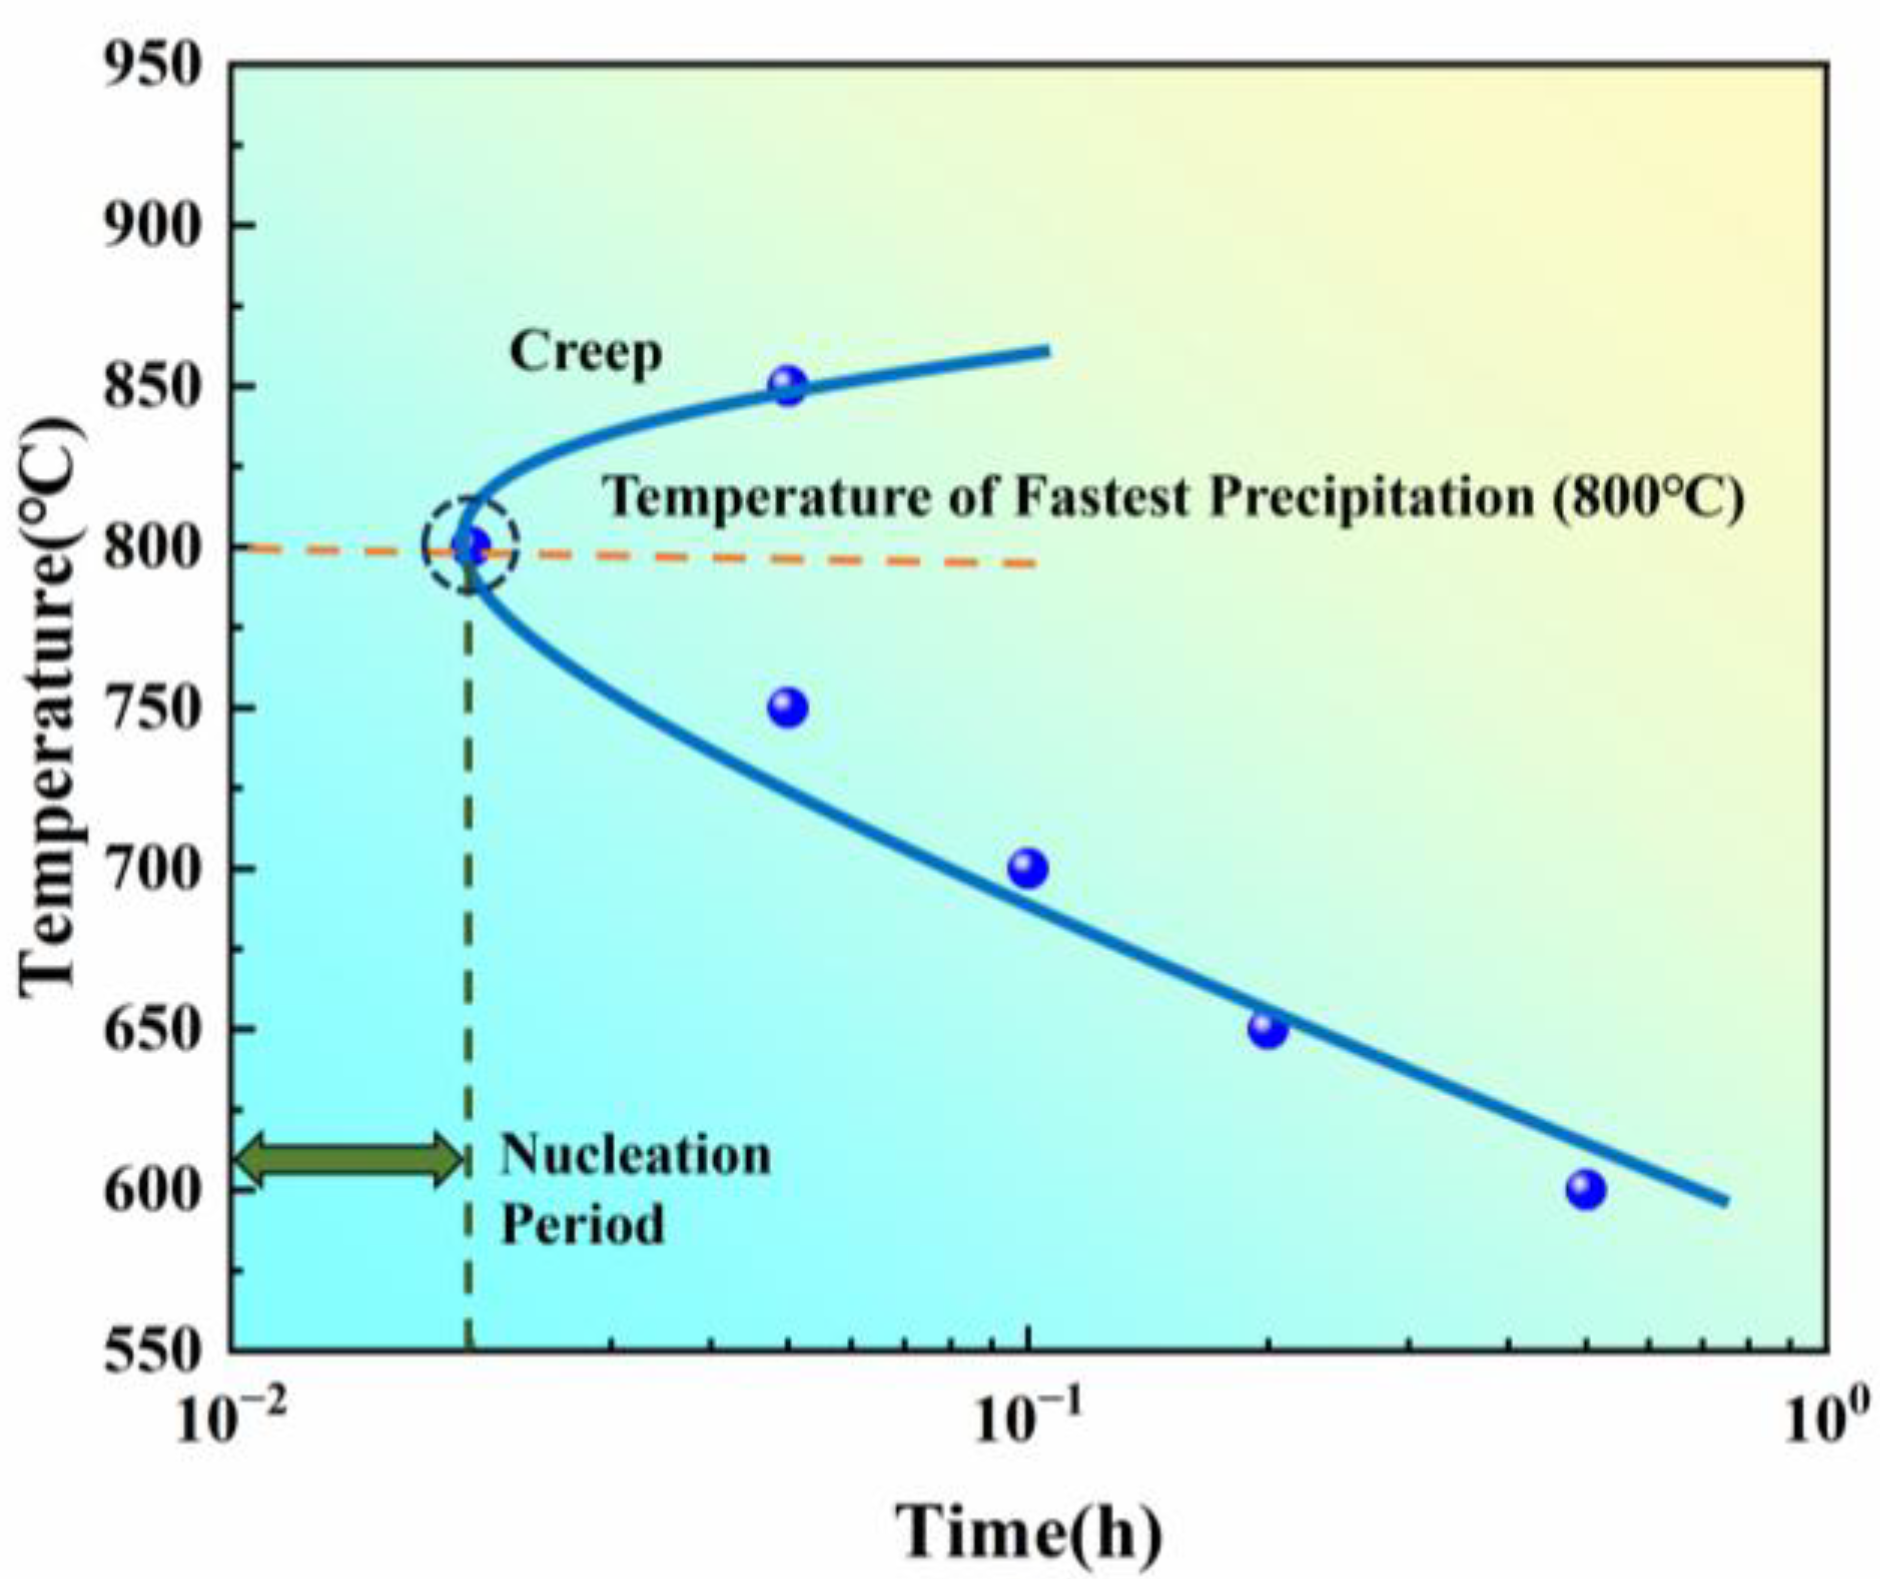
At 800 °C: The rapid precipitation starts at approximately 0.02 h, showing a NCTP, followed by a rapid precipitation stage, and then shifts to a positive creep stage (Figure 5e). This suggests that this temperature is close to the nose temperature of the isothermal transformation curve.
(4)
At 850 °C: Similar to the alternating positive and negative creep phenomenon observed at 750 °C, a CTP appears after the incubation period, followed by a positive creep stage, and then a NCTP (Figure 5f).
By statistically analyzing NCTP at different temperatures, the isothermal transformation start curve was plotted based on the creep method (Figure 6).

3.3. Precipitation Simulation

The simulation results of the precipitation process are shown in Figure 7, where the fastest precipitation time for the γ′ phase occurs at approximately 0.058 h, with the temperature being around 850 °C. Compared to the experimentally measured isothermal precipitation curves, the incubation period in the simulation is significantly longer, and the fastest precipitation temperature is higher.
The three isothermal precipitation start curves obtained through thermal expansion, creep tests, and simulation are summarized in Figure 7. The shape of the curves resembles a “C”, and the distance between the curve and the vertical axis represents the incubation period. The shortest incubation period corresponds to the fastest precipitation temperature.
On one hand, in terms of precipitation speed, there are differences in the incubation periods before the rapid precipitation starts for the three curves. The thermal expansion curve, using electromagnetic induction heating, has the shortest incubation period, followed by the creep curve using heat conduction heating, and the thermodynamic simulation curve has the longest incubation period. On the other hand, in terms of the temperature at which the fastest precipitation occurs, the fastest precipitation temperatures in the creep and thermal expansion curves (800 °C) are lower than those in the simulation curve (850 °C).

4. Discussion

4.1. Analysis of Precipitation Speed Differences

The length of the incubation period indicates the stability of the microstructure under different supercooling conditions and primarily involves the diffusion process required for nucleus formation. To analyze the reasons for the differences in the incubation periods of the three isothermal precipitation curves, this section explores the influence of heating methods and nucleation mechanisms.

4.1.1. Effect of Heating Methods on Precipitation Speed

The different heating methods used in the three experimental approaches led to significant differences in the experimental results, further influencing the microstructural changes and thermodynamic behavior.
Thermal expansion experiments are commonly used to obtain isothermal precipitation curves. Due to the small sample size, high-frequency electromagnetic induction heating is typically used. Electromagnetic induction heating generates heat by inducing eddy currents through alternating magnetic fields, allowing for rapid and uniform heating of the samples. However, electromagnetic induction heating inevitably introduces non-thermal effects of electricity while increasing the temperature.
Studies have shown that these non-thermal effects have a significant impact on material precipitation behavior and microstructural evolution. For example, Lienig et al. [21,22,23] found that electric heating triggers electromigration effects, accelerating the movement of atoms within the material, lowering the enthalpy of formation and diffusion activation energy, and accelerating solute atom diffusion. In addition, Zhang et al. [24] indicated that electric fields can induce electron-dislocation interactions, triggering defect migration and lattice distortion in the dislocation core, thereby reducing the nucleation activation energy of the precipitated phase. Therefore, assuming that the frequency of atomic vibrations and nucleation sizes are the same, the non-thermal effects of electricity increase the probability of atomic diffusion, accelerate the nucleation rate, and shorten the incubation period.
Furthermore, the magnetic fields induced by the electric field during heating also influence precipitation behavior and microstructural evolution. Qian et al. [25] demonstrated that an external magnetic field promotes dislocation motion and effectively reduces the activation energy for nucleation, primarily driven by element diffusion. Therefore, under electric heating conditions, the combined effects of non-thermal electricity and electromagnetic fields may significantly influence material precipitation behavior, particularly in iron–nickel-based alloys.
In the process of electromagnetic induction heating, the non-thermal effects of electricity play a crucial role in the microstructural evolution of iron–nickel-based alloys, particularly in the nucleation process where atoms aggregate to form γ′ phase cells. This effect enhances the migration efficiency of atoms or dislocations, accelerating the nucleation process and reducing the resistance to atomic diffusion, thereby significantly shortening the incubation period of the isothermal transformation curve, as illustrated in Figure 8.
Methods such as reducing electric field strength, decreasing sample size, and using high-purity samples are insufficient to eliminate the non-thermal effects of electricity. In contrast, the creep experiment employed a tubular high-temperature furnace that heats the samples via heat conduction, avoiding the non-thermal effects of electricity and more closely replicating the actual heating conditions used in alloy heat treatment.

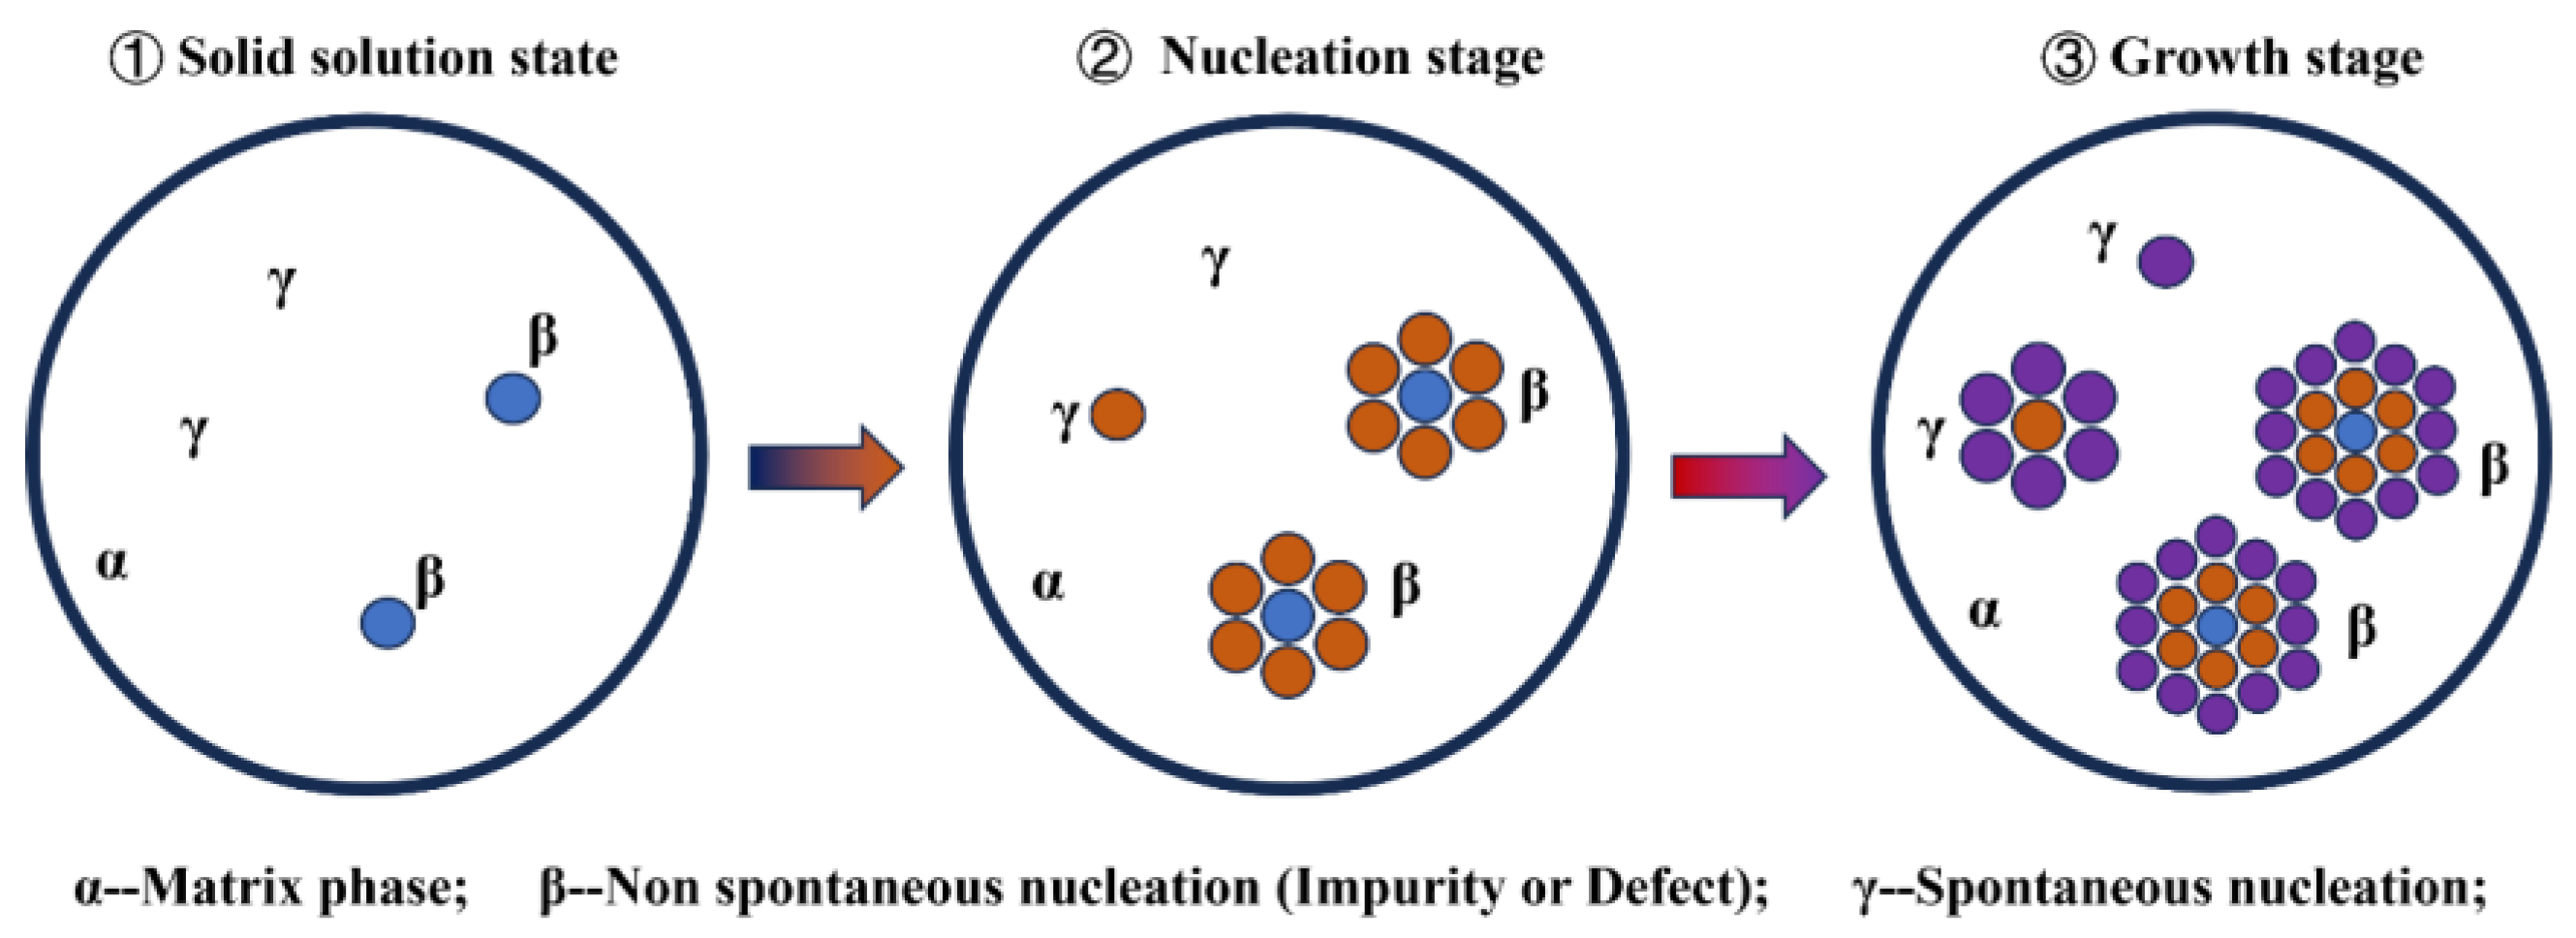
4.1.2. Effect of Nucleation Mechanisms on Precipitation Speed

In addition to the influence of non-thermal effects of electricity, differences in nucleation mechanisms also play a crucial role in determining precipitation speed. The primary nucleation mechanisms include non-spontaneous nucleation at microstructural defects, such as grain boundaries, and spontaneous nucleation within homogeneous phases. These mechanisms significantly impact the rate of precipitation.
Generally, non-spontaneous nucleation is more relevant to actual alloy heat treatment processes because a large number of microstructural defects, such as grain boundaries, dislocations, and vacancies, are inevitably present in materials. These defect regions are areas of high energy and stress concentration, where energy fluctuations, structural fluctuations, and compositional fluctuations are the greatest. Nucleation in these regions encounters lower resistance to atomic diffusion and occurs at a faster rate, while phase transformation stress is more easily relaxed. Therefore, non-spontaneous nucleation can accelerate the nucleation process and shorten the incubation period. In contrast, spontaneous nucleation requires more stringent local structural and orientation relationships, typically requiring longer incubation periods.
In both the thermal expansion and creep experiments, the samples were derived from the base material of the new iron–nickel-based alloy, and the nucleation mechanism was non-spontaneous nucleation, where new phases preferentially nucleated at heterogeneous sites within the base phase. As a result, the incubation period in experiments (Figure 4 and Figure 6) was relatively short, consistent with the non-spontaneous nucleation mechanism depicted in Figure 9. In contrast, the simulation assumed spontaneous nucleation, where the material composition was assumed to be relatively pure, and the precipitation process depended on energy changes in the liquid metal, leading to a longer incubation period.

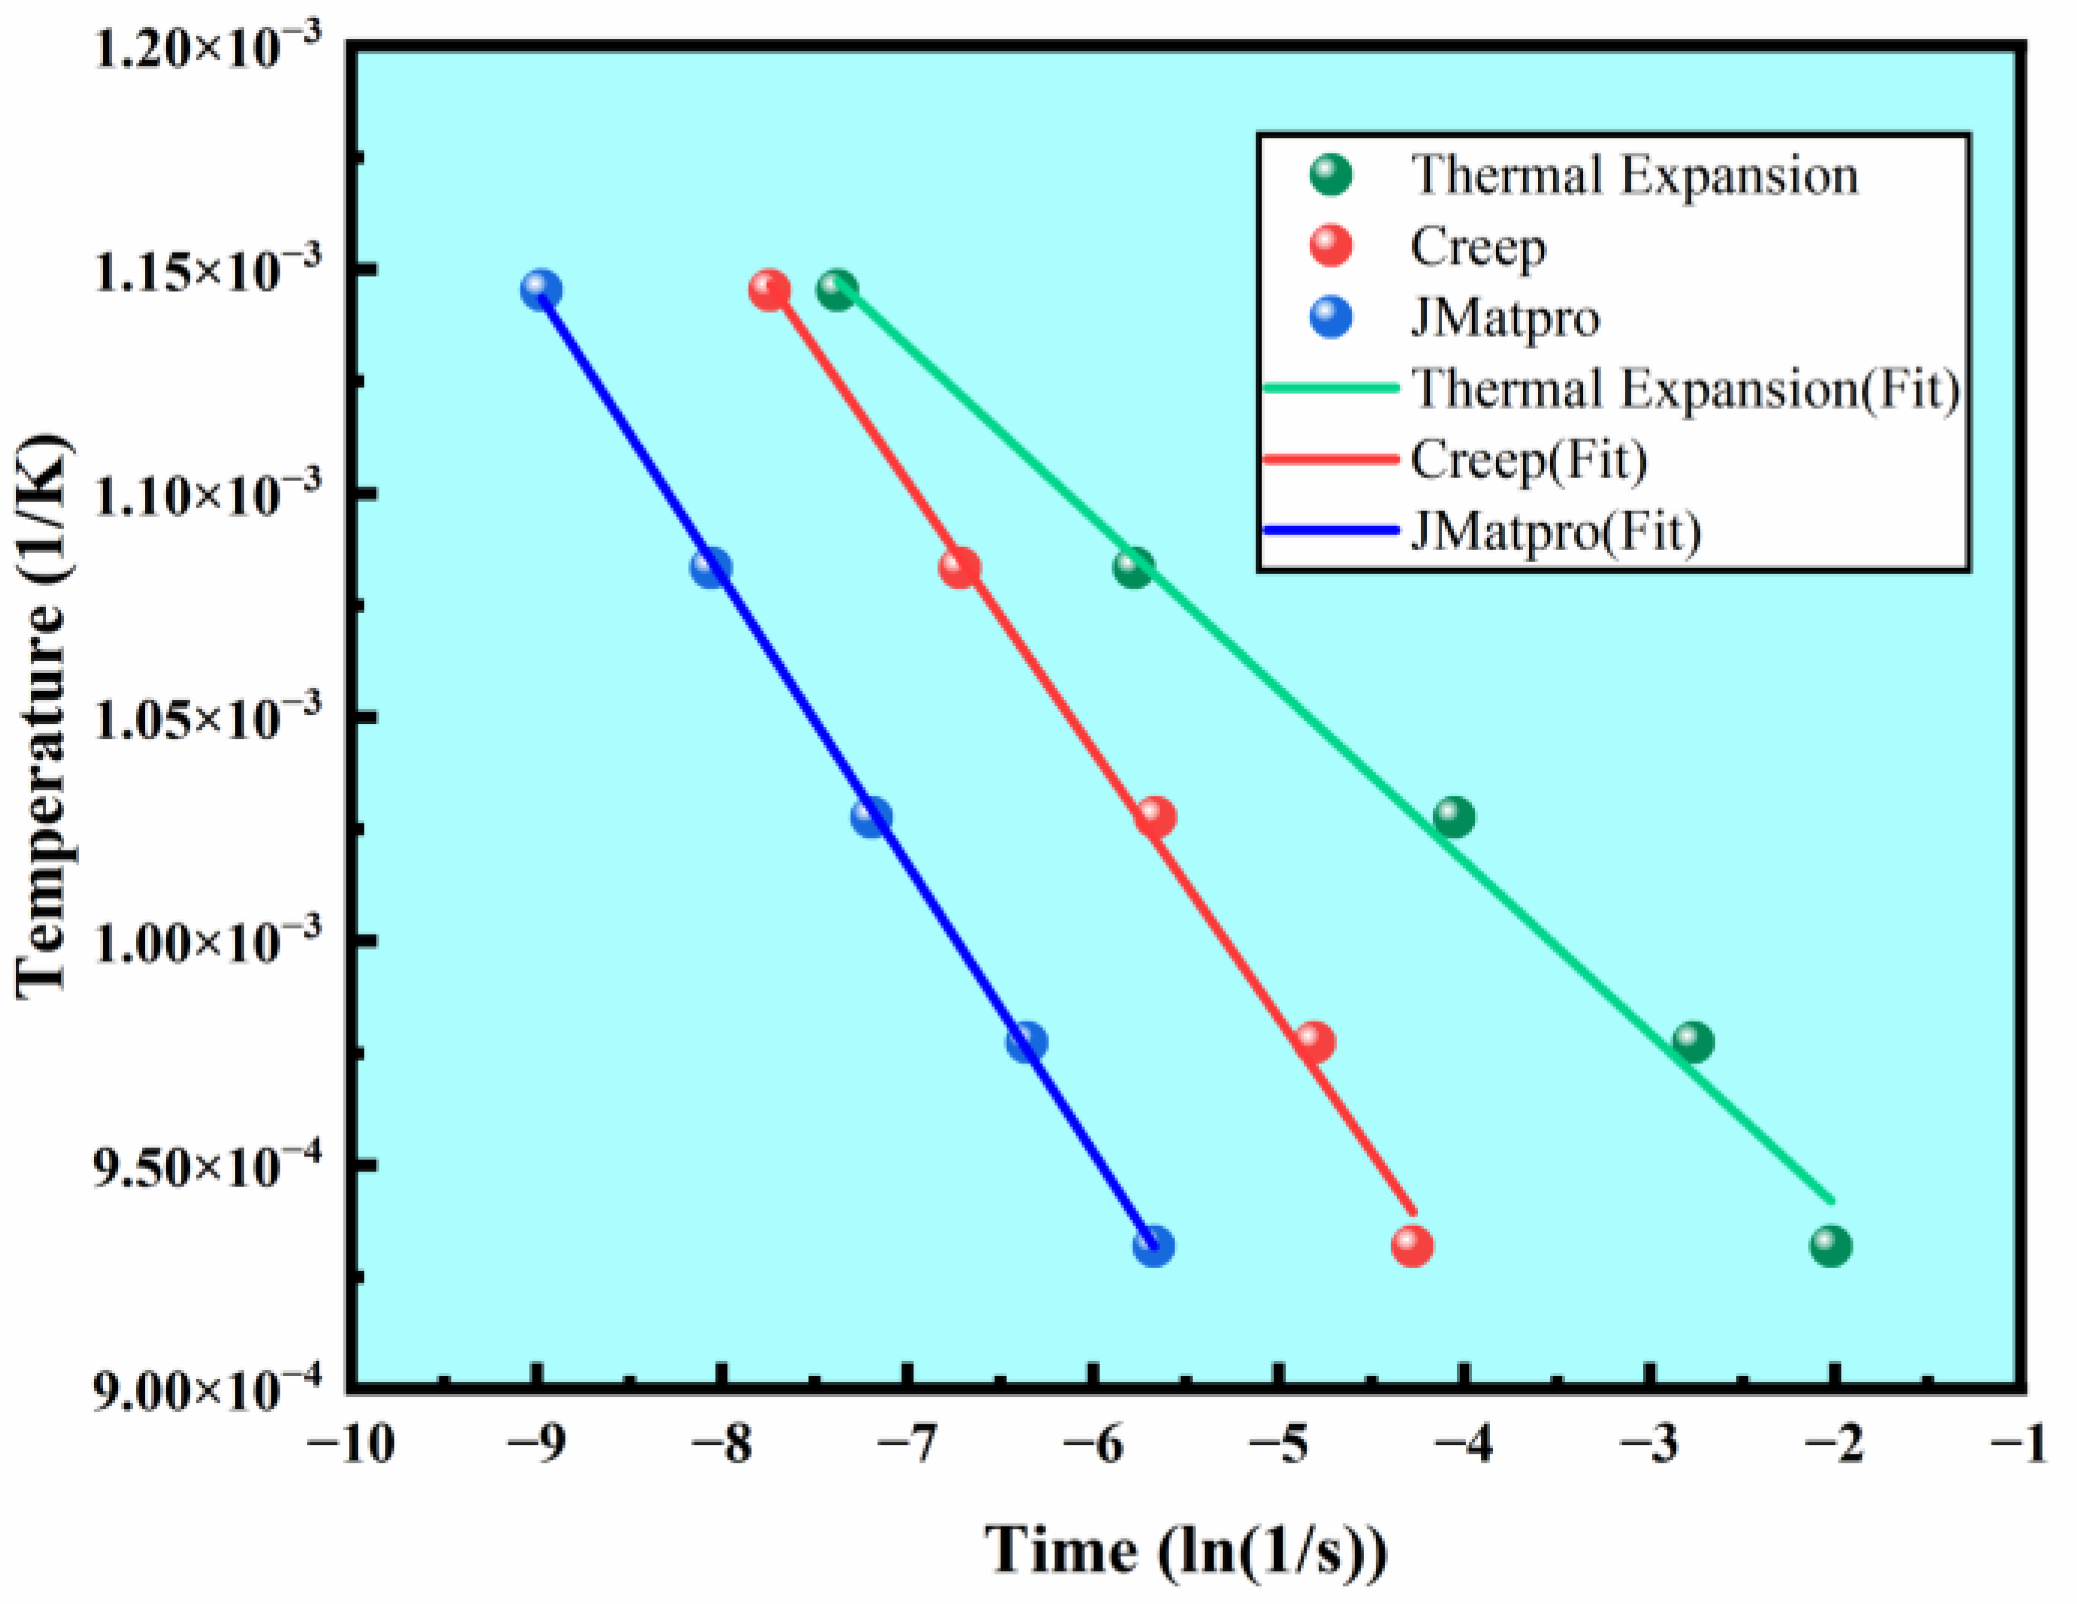
4.1.3. Determination of Nucleation Activation Energy

The nucleation ability of the γ′ phase is a key parameter for evaluating the precipitation-strengthening effect of an alloy. As an important indicator of nucleation difficulty [26], nucleation activation energy is typically related to factors such as element concentration, interfacial energy, and chemical potential difference [27]. It provides a quantitative measure of the nucleation ability of the same alloy under different isothermal transformation conditions, which is essential for understanding and optimizing the nucleation process. For instance, under electromagnetic induction heating, the non-thermal effects of electricity can reduce nucleation resistance, thereby lowering the nucleation activation energy.

Electromagnetic Induction Heating

The DSC curves of the new iron–nickel-based alloy after solution treatment at different heating rates are shown in Figure 10. The samples exhibit an exothermic reaction between 500 °C and 900 °C, corresponding to the nucleation of the Ti/Al-rich γ′ phase within the γ matrix [28].
The exothermic peak temperatures on the DSC curves are distributed around 650 °C to 700 °C, shifting toward higher temperatures as the heating rate increases. By applying the Kissinger equation [29] to fit the exothermic peak temperatures at different heating rates, the nucleation activation energy can be determined as follows:
ln ( v T p 2 ) = Q R T p + C
where v is the heating rate (°C/min), T p is the exothermic peak temperature (°C), Q is the nucleation activation energy (kJ/mol), C = l n ( A R Q ) is a constant equal, A is the frequency factor (collision frequency in thermodynamic reactions), and R is the gas constant.
By inserting the heating rates and peak temperatures into the Kissinger equation, the nucleation activation energy for the γ′ phase is calculated to be 127.35 kJ/mol.

Heat Conduction Heating

The DSC experiments were conducted using a modified Netzsch 1600LF system equipped with high-frequency induction heating modules. This setup enables rapid heating via electromagnetic induction, where eddy currents generated in the sample holder convert electromagnetic energy into thermal energy aligning with the electromagnetic induction method used in thermal expansion tests, which is different from the heat conduction heating method used in actual heat treatment. Therefore, the activation energy solved in the DSC experiment above is only the activation energy under electromagnetic induction heating, and there are many heating methods for heat conduction in factories, so it is necessary to consider calculating the nucleation activation energy under heat conduction heating.
The Arrhenius equation [30] can be used to quantify the reaction rate of chemical processes. For the nucleation and precipitation process, this study proposes a modified Arrhenius equation to determine the relative activation energy in the creep test based on the following isothermal precipitation curves:
The Arrhenius equation:
k = A e Q RT
where k is the reaction rate constant, A is the pre-exponential factor, and T is the reaction temperature.
In different isothermal precipitation curves, while lower activation energy generally implies a faster reaction rate, the reaction rate is also influenced by the pre-exponential factor “ A ”. The pre-exponential factor “ A ” typically increases with rising temperatures because the entropy of the reaction system and the frequency of atomic vibrations both increase at higher temperatures, thereby raising the likelihood of the reaction occurring. Therefore, when calculating the activation energy, it is essential to account for the effect of the pre-exponential factor “ A ”.
According to the Arrhenius equation, as temperature increases, activation energy decreases, resulting in a greater increase in the reaction rate. This implies that, under the same isothermal treatment duration, the incubation time required for γ′ phase precipitation is shortened, leading to a leftward shift in the isothermal transformation curve, meaning the phase transformation occurs earlier.
In the precipitation process, the inverse of the precipitation time ( 1 / t ) can be used to replace the diffusion rate k , allowing for the analysis of precipitation behavior from a time perspective. Assuming that activation energy is independent of temperature, ln ( 1 / t ) can be plotted against 1 / T to form the modified Arrhenius equation as follows:
1 t = A e Q RT
In practical calculations, the relative value formula is used to solve for the relative activation energies from the isothermal precipitation curves as follows:
Q i / Q j = l n ( A i / A j )     T j / T i
where i and j represent different isothermal precipitation curves, A * is the pre-exponential factor, and Q * is the relative activation energy.
By extracting the precipitation start points from the three isothermal precipitation curves, the fitting relationship between ln ( 1 / t ) and 1 / T is plotted (Figure 11), and the slopes and intercepts are used to calculate the relative activation energy (Table 2).
The results show that the nucleation activation energy determined from the creep experiment is 17.99% lower than the simulation results and 24.24% higher than that from the thermal expansion experiment. The nucleation activation energy calculated from the creep experiment reflects the actual nucleation behavior during alloy heat treatment, avoiding the influence of the non-thermal effects of electricity and spontaneous nucleation.
Recent studies [31,32] have shown that in some complex alloy systems, the nucleation activation energy depends on a combination of the diffusion barrier in the diffusion process and the resistance of the lattice to dislocation movement. Therefore, compared to the thermal expansion test, the nucleation activation energy derived from the creep experiment also suggests that the atomic diffusion and dislocation migration rates in the creep test may be reduced by approximately 20%.
In summary, the method for determining nucleation activation energy from the creep experiment can be outlined as follows:
(1)
Obtain isothermal precipitation curves from both the creep and thermal expansion experiments.
(2)
Use the modified Arrhenius equation to calculate the relative nucleation activation energies.
(3)
Determine the nucleation activation energy under electromagnetic induction heating using DSC.
(4)
Ultimately, obtain a prediction of the nucleation activation energy that closely matches the actual heat treatment conditions.
This modified Arrhenius method can estimate the nucleation activation energy in practical heat treatments for different alloys, overcoming the limitations of DSC in determining nucleation activation energy under heat conduction heating, providing a reliable theoretical basis for alloy preparation and welding processes.

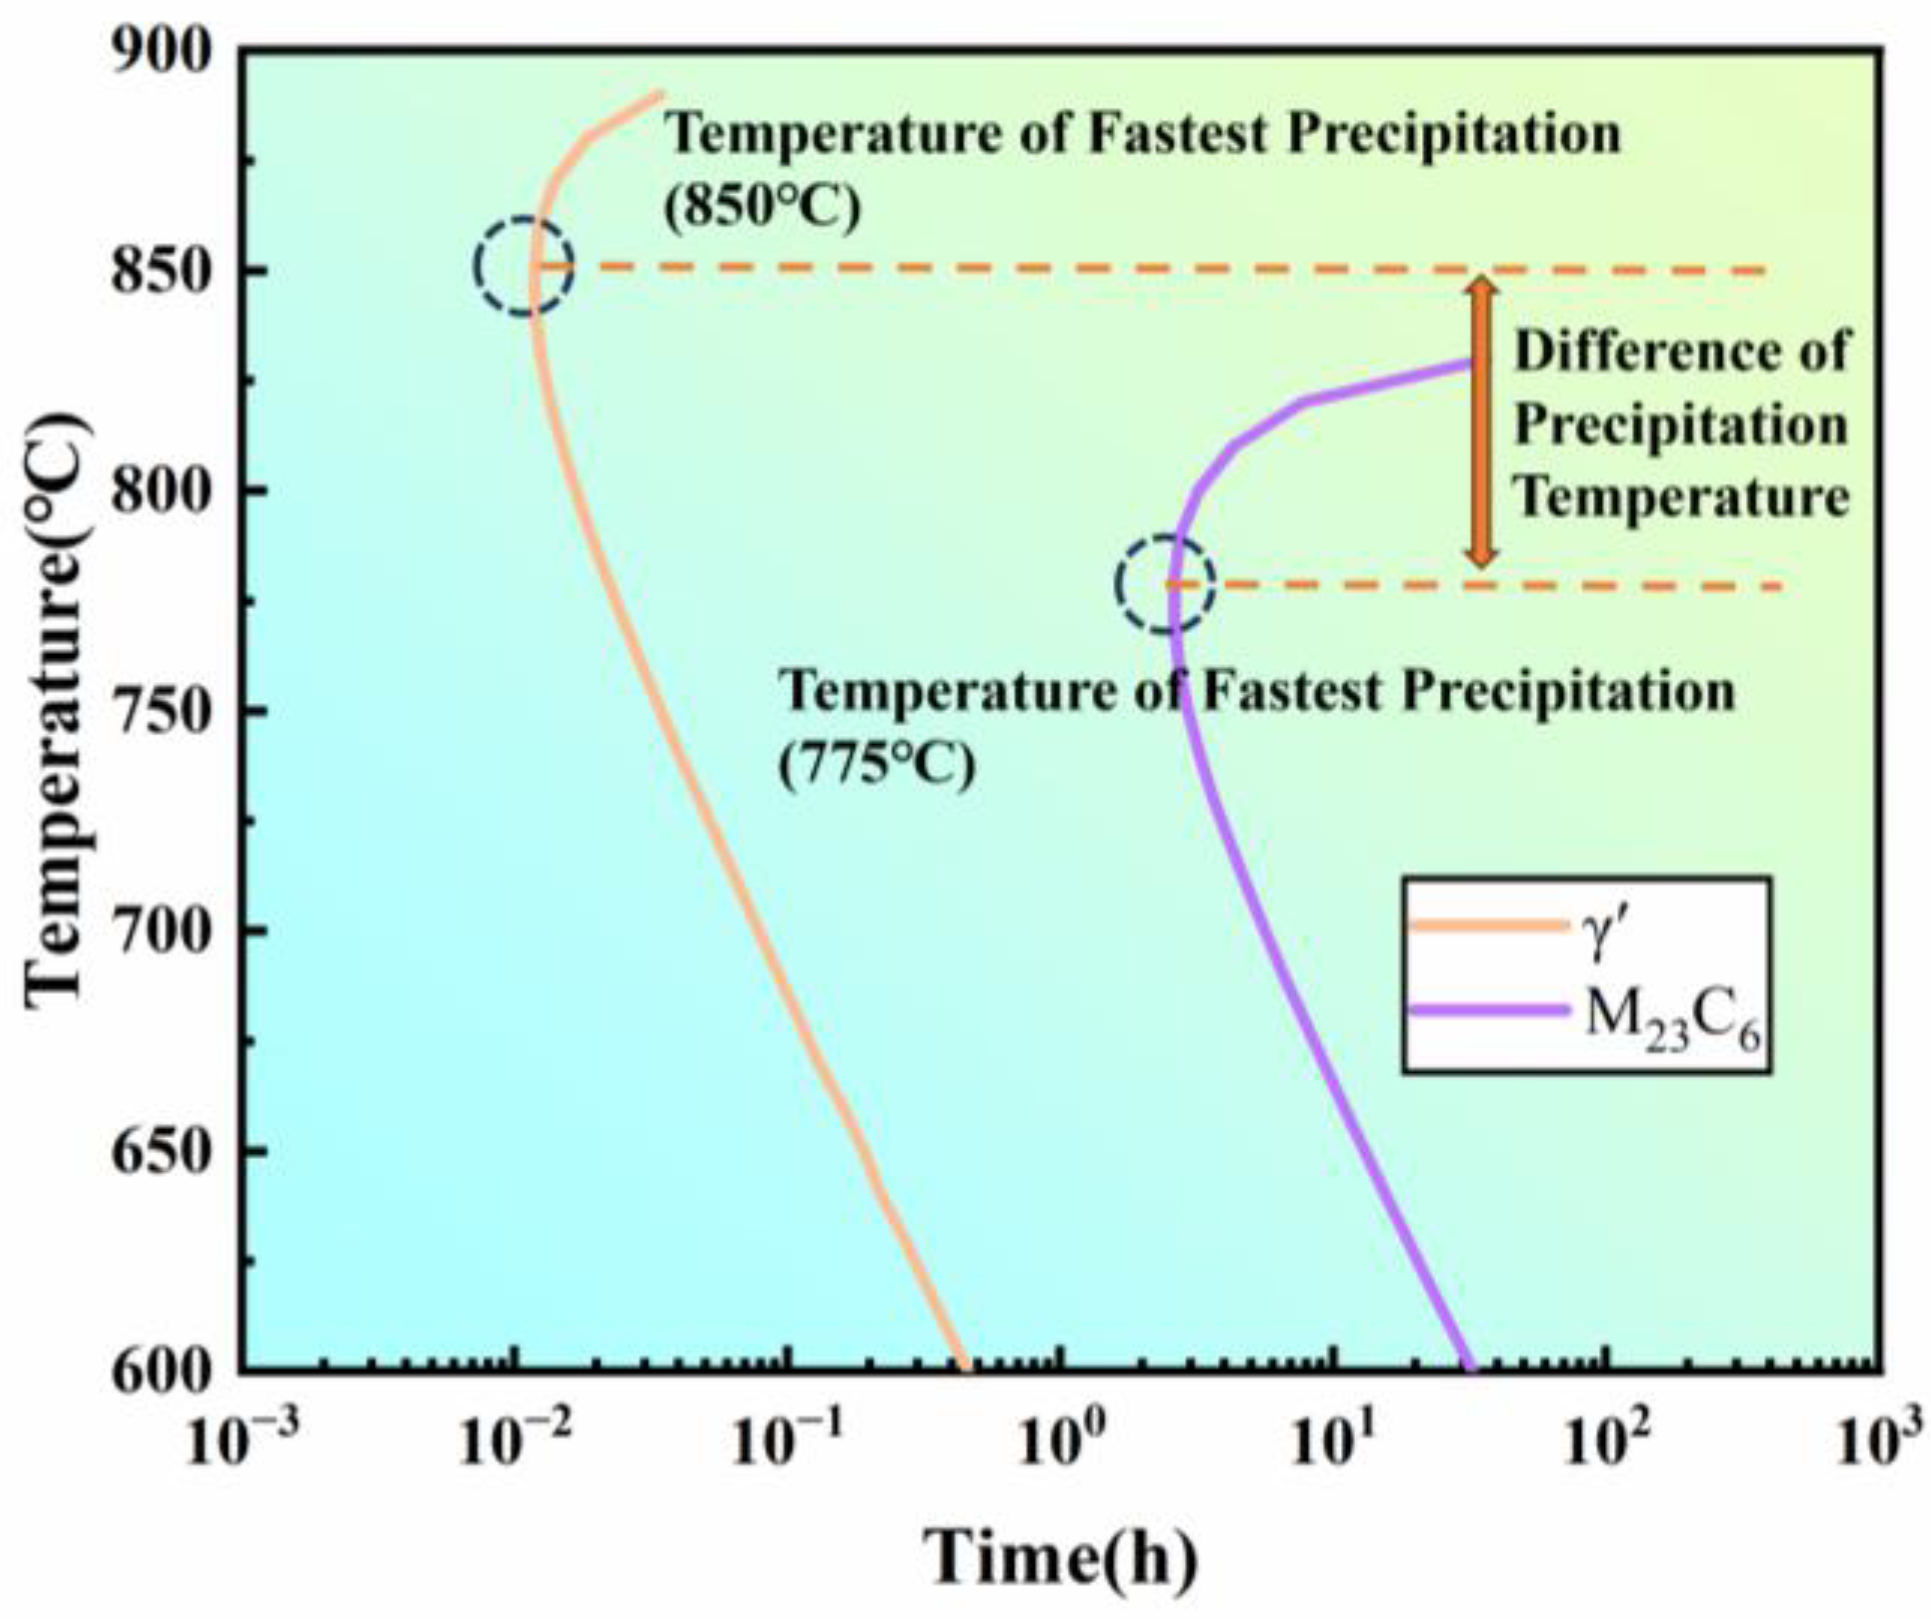
4.2. Analysis of Differences in Precipitation Temperature

4.2.1. Microstructure

The identification of γ′, M23C6 and MC carbides was rigorously validated in our prior study [33], where it was confirmed by transmission electron microscopy (TEM) combined with selected-area electron diffraction (SAED). The aged microstructure of the alloy primarily consists of a γ matrix, γ′ precipitates, MC randomly distributed within the grains, and M23C6 along the grain boundaries. Harmful phases, such as σ and η phases, are present in very small amounts. The equilibrium phase diagram generated from simulations also supports this conclusion (Figure 12).
As shown in Figure 13, as the temperature increases, the amount of spherical γ′ precipitates increases, and they are uniformly distributed in the γ matrix. The measured γ′ particle sizes at the four different temperatures are as follows: 0 nm, 21.02 nm, 35.60 nm, and 49.71 nm. Meanwhile, there is a certain difference in the content of γ′ phase between simulation and aging. On the one hand, this is because the thermodynamic database relied upon by the simulation software may not fully cover the complex composition of this new experimental alloy. On the other hand, it may be due to the interaction of multiple phases. For example, simulations usually analyze a single phase in isolation, while in experiments, the competitive precipitation of multiple phases (such as γ′ phase, M23C6, and MC carbides) can change the local composition, further affecting the precipitation behavior.
The EDS mapping results (Figure 14) show that a large number of Cr/Mo-rich discontinuous chain-like M23C6 precipitate at the grain boundaries. Studies have shown that these grain boundary carbides not only prevent grain boundary sliding but also enhance the strength of the alloy through the Orowan mechanism [34]. Additionally, a small amount of blocky MC, rich in Ti/Mo elements, are discretely distributed within the grains, with sizes ranging from 1 to 10 μm.

4.2.2. Influence of Different Phases on the Highest Precipitation Temperature

Research indicates that the precipitation of intragranular γ′ phase and grain boundary M23C6 both result in volume shrinkage of the material [35], while MC, due to their larger lattice constants and stable structure, have minimal influence on volume changes [36]. In multi-phase precipitation processes, especially the combined precipitation of γ′ phase and M23C6, significant interference is introduced when using volume strain variations to determine the onset of γ′ precipitation.

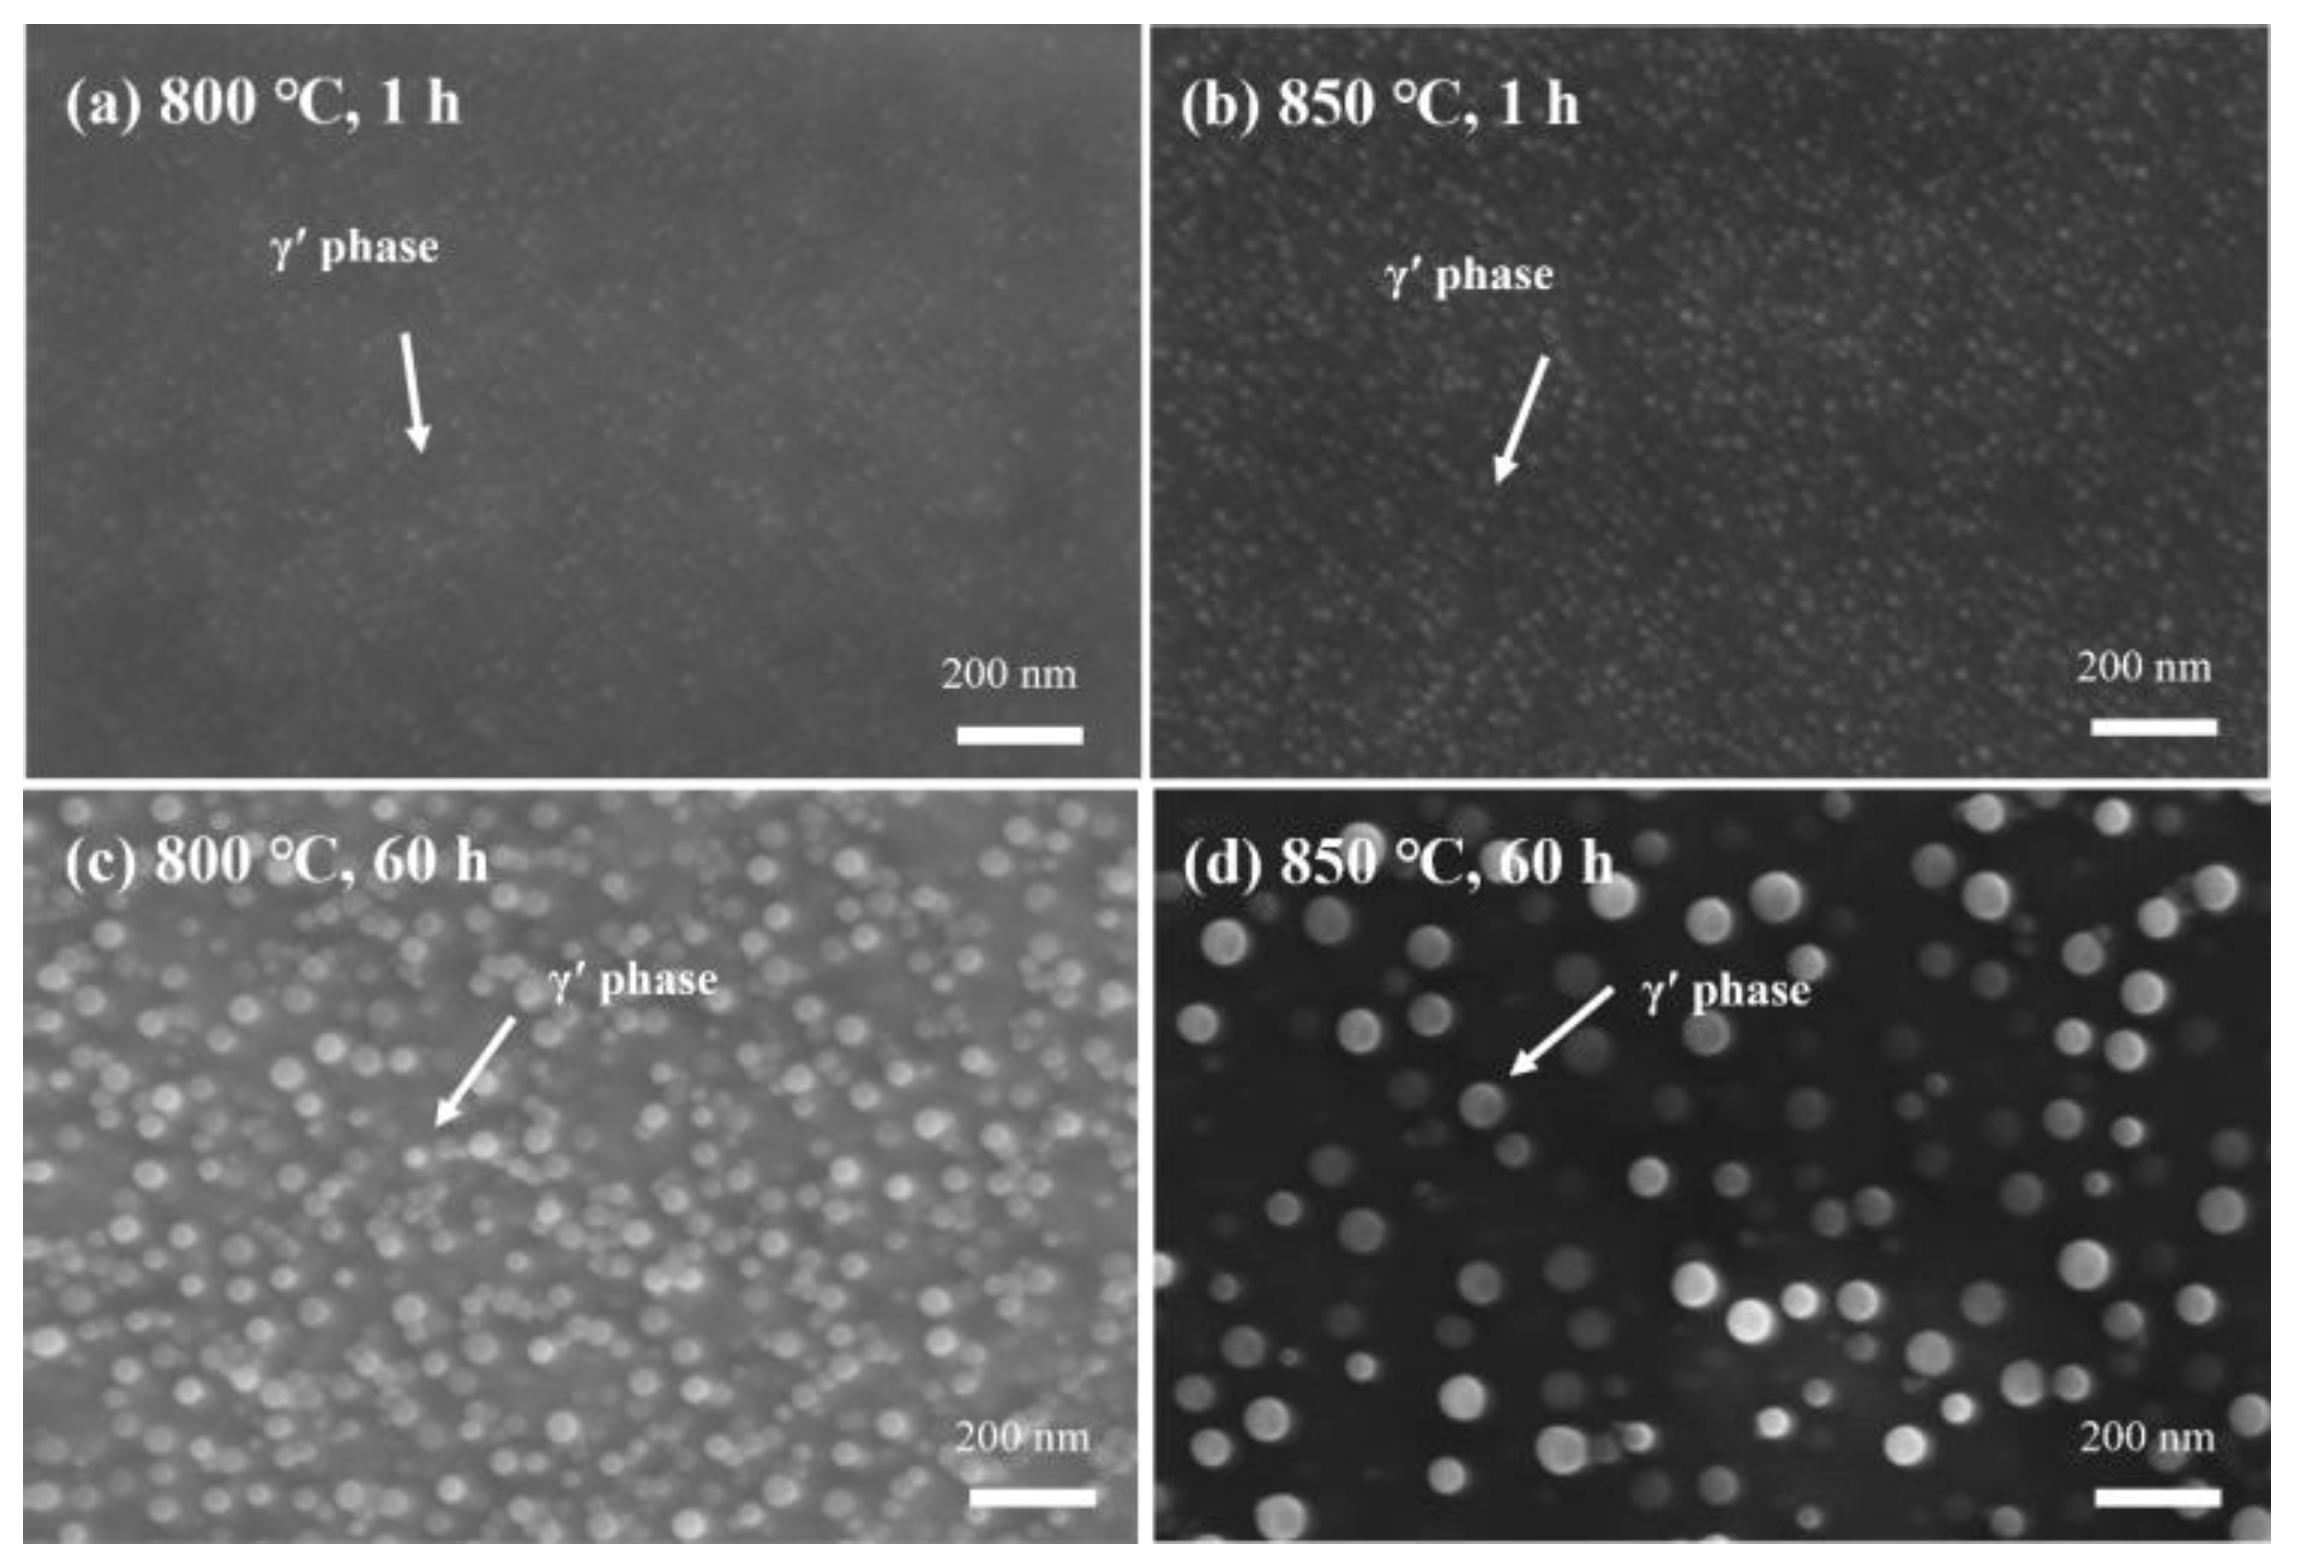
Precipitation Behavior of the γ′ Phase

SEM analysis (Figure 15) reveals significant differences in the precipitation rate and size of γ′ precipitates at 800 °C and 850 °C. At 800 °C, the γ′ particle sizes are 13.388 nm and 37.319 nm after 1 h and 60 h, respectively. At 850 °C, the particle sizes are 14.318 nm and 47.785 nm for the same time intervals. This indicates that the fastest precipitation temperature of the γ′ phase is close to or even exceeds 850 °C, as the precipitation is faster, and the particle size is larger at 850 °C.

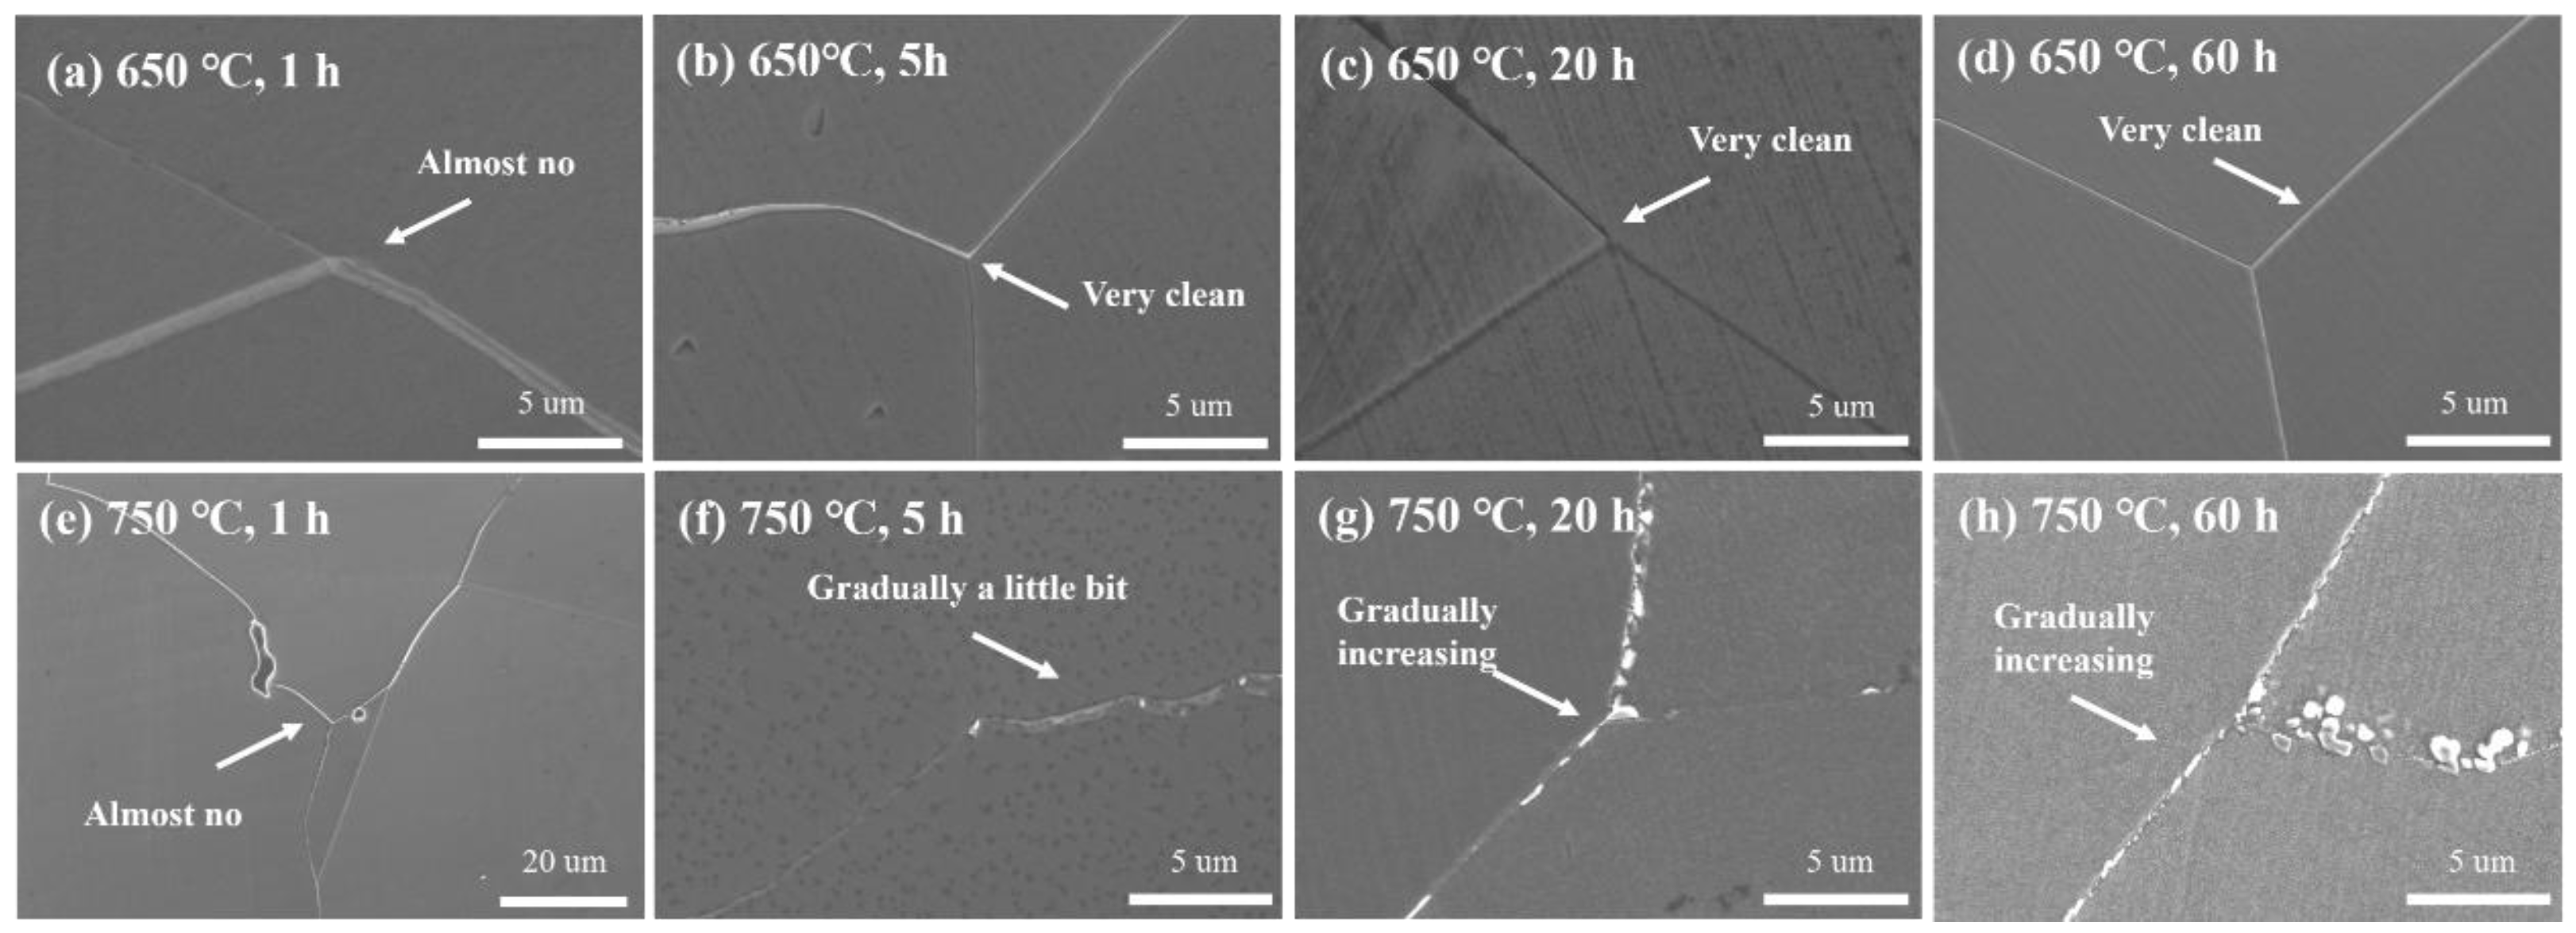
Precipitation Behavior of M23C6

SEM analysis also revealed the precipitation behavior of M23C6 at different temperatures and aging times (Figure 16 and Figure 17):
(1)
At 650 °C: M23C6 barely precipitated within 60 h.
(2)
At 750 °C: Precipitation began after 5 h, followed by gradual aggregation and growth.
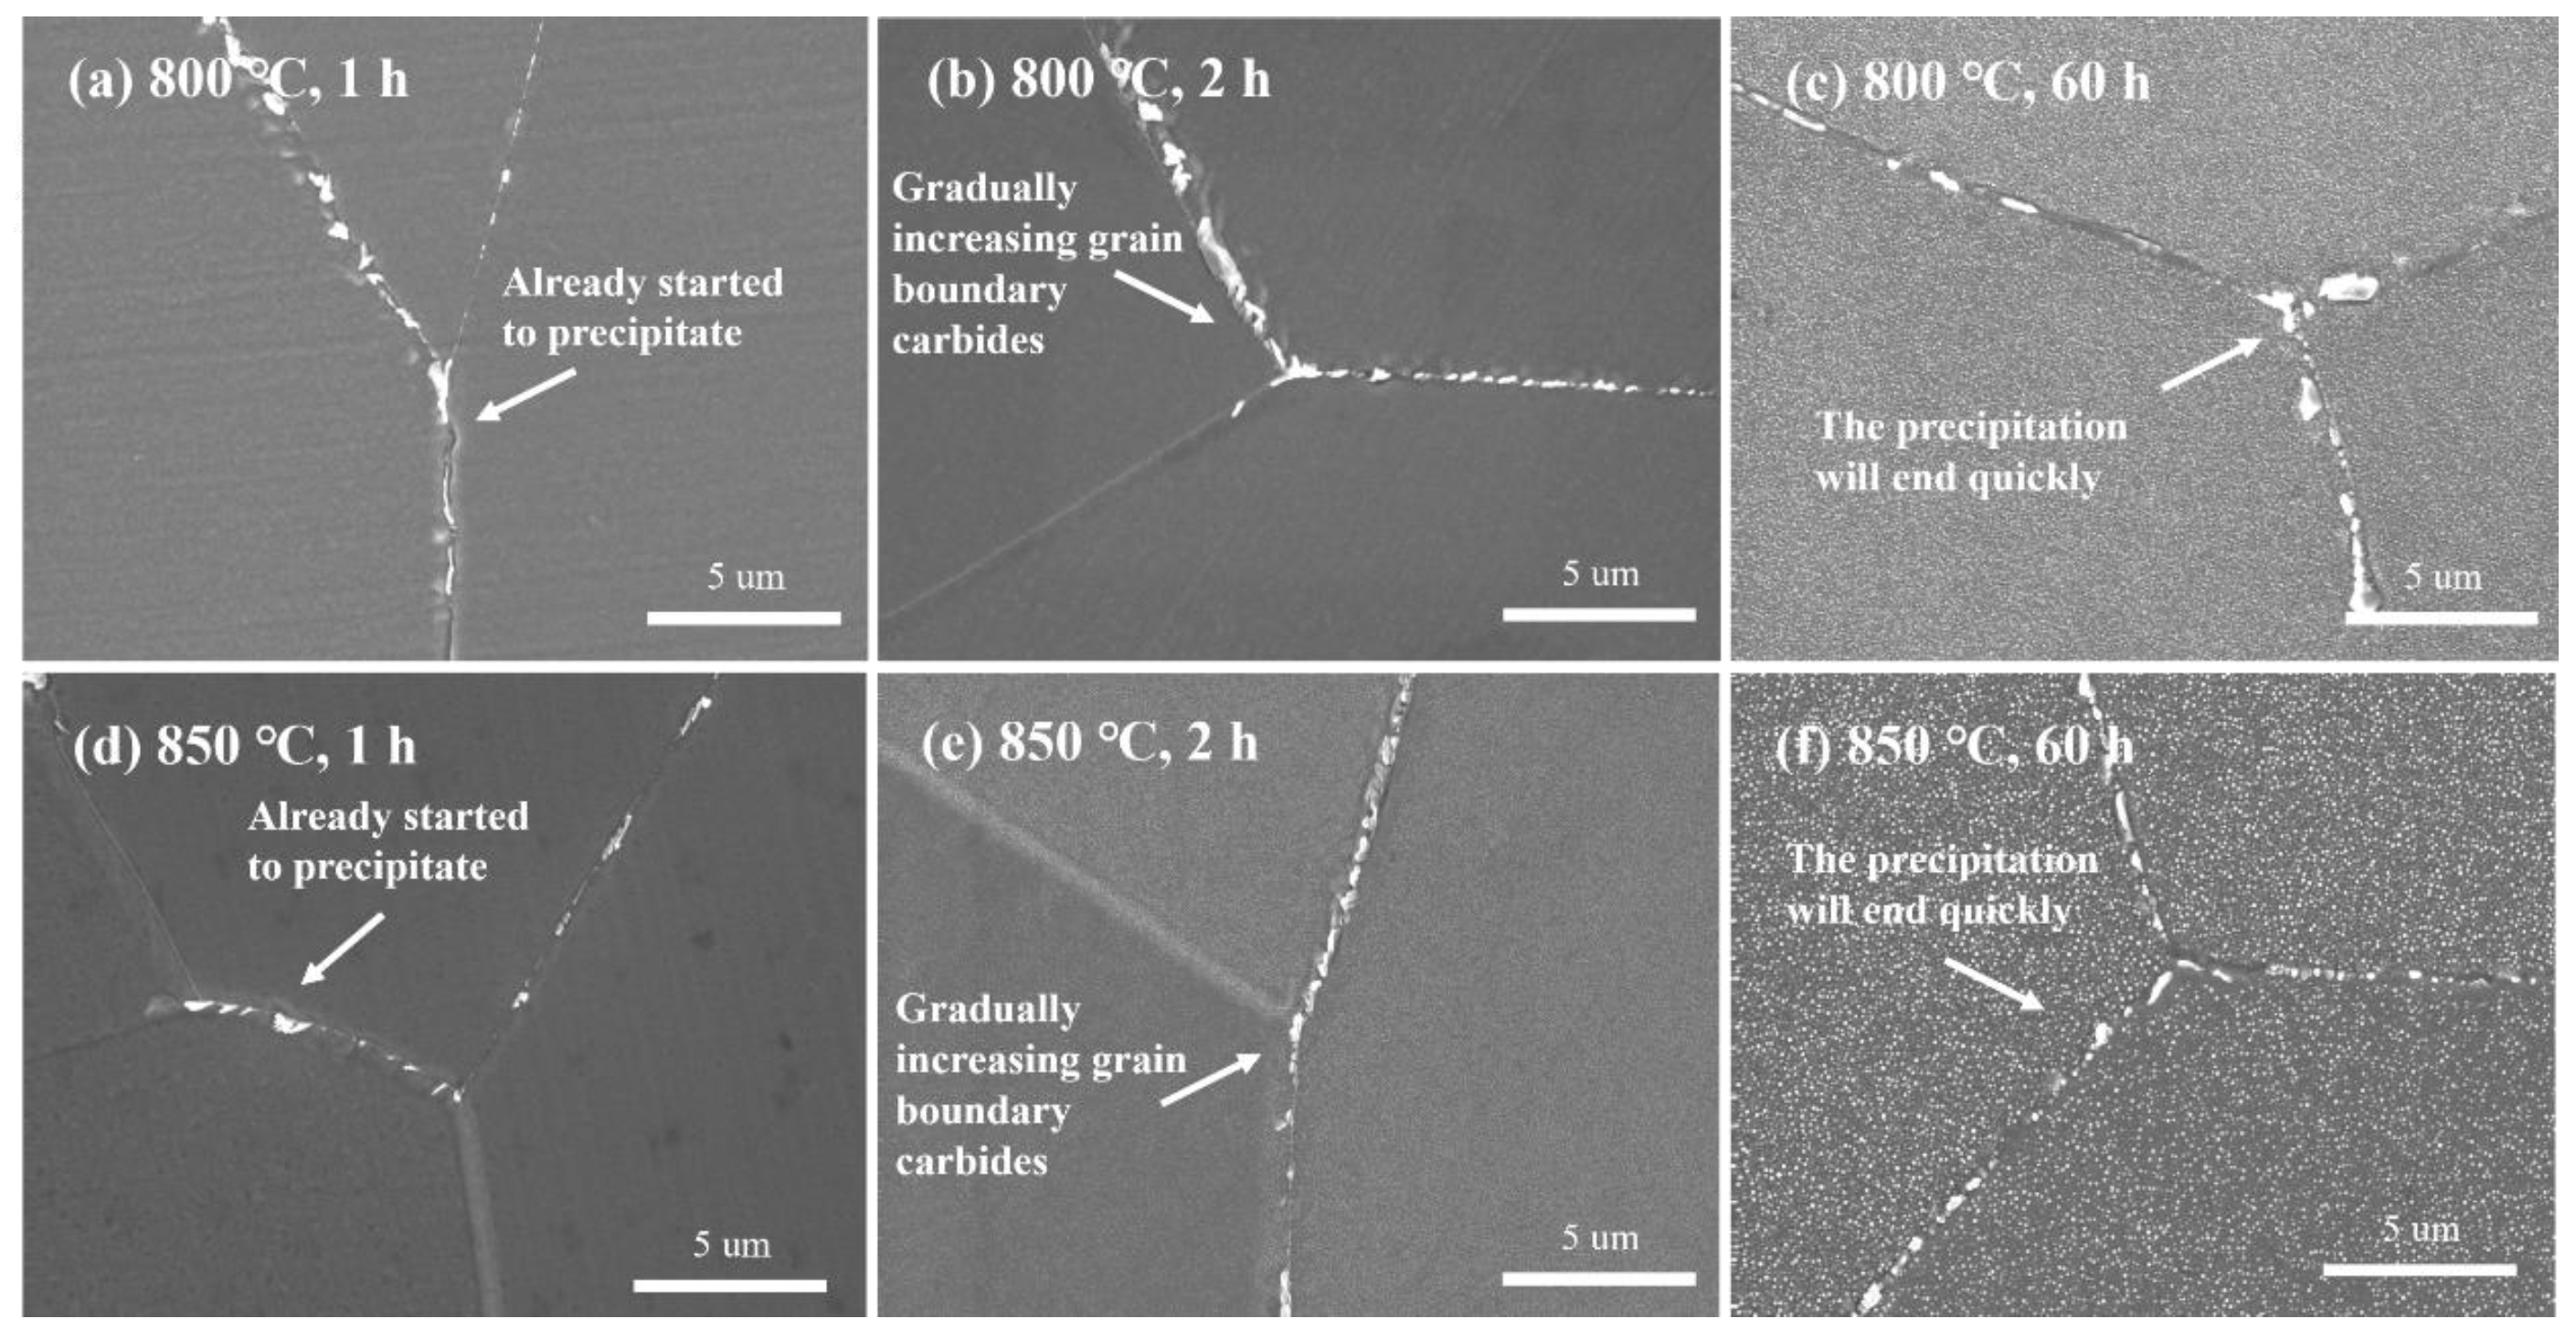
(3)
At 800 °C: Rapid precipitation occurred within 1 h, followed by slow aggregation and growth over 60 h.
(4)
At 850 °C: Rapid precipitation occurred within 1 h, followed by slow aggregation and growth, but the precipitation rate of M23C6 was slower than at 800 °C. This indicates that the fastest precipitation temperature for M23C6 is around 800 °C.
In conclusion, the fastest precipitation temperature for the γ′ phase is approximately 850 °C, while that for M23C6 is around 800 °C. The simulation results also support this conclusion (Figure 18). However, the fastest precipitation temperature of the γ′ phase, as measured in the creep and thermal expansion experiments, is about 800 °C. This discrepancy suggests that the combined precipitation of other phases, such as M23C6, indeed lowers the measured fastest precipitation temperature for the γ′ phase. Therefore, in practical engineering applications, the influence of other precipitated phases should be fully considered when experimentally determining the isothermal transformation curve for the γ′ phase, and the results should be corrected accordingly to ensure data accuracy and relevance for industrial applications.

5. Conclusions

This study introduces an innovative application of creep testing to measure the isothermal transformation start curve of the γ′ phase in a new iron–nickel-based alloy. The results are compared with thermal expansion tests and JMatPro simulations. The study reveals the complex precipitation behavior of the γ′ phase and the impact of multiple phases on the isothermal transformation curve, leading to the following conclusions:
(1)
A new low-stress creep test method was proposed to measure the isothermal transformation start curve of the γ′ phase. This method, which uses heat conduction heating and measures the start point of negative creep shrinkage to determine the onset of rapid precipitation, provides an isothermal transformation curve that is more consistent with actual heat treatment conditions and eliminates the non-thermal effects of electromagnetic induction heating.
(2)
The nucleation activation energy of the γ′ phase obtained from the creep test was calculated to be 158.22 kJ/mol, 24.24% higher than that obtained from the thermal expansion experiment using electromagnetic induction heating. This increase is attributed to the exclusion of the non-thermal effects of electricity. The nucleation activation energy was 17.99% lower than the simulation result, likely due to the non-spontaneous nucleation in the material. These differences in nucleation activation energy reflect variations in atom diffusion and dislocation migration rates under different measurement conditions.
(3)
A correction method was proposed for experimentally determining the isothermal transformation curve of the γ′ phase. The analysis shows that the differences in the fastest precipitation temperature of the three isothermal precipitation curves are caused by the overlapping precipitation of other phases, such as M23C6. The rapid precipitation and aggregation of grain boundary M23C6 during γ′ phase precipitation alter the overall precipitation behavior of the matrix, thereby affecting the shape and position of the isothermal transformation curve.
This research provides valuable insights for the development of high-performance iron–nickel-based alloys and offers practical guidance for accurately controlling microstructures through heat treatment.

Author Contributions

Conceptualization, Z.Y., K.L., J.L., C.Q., X.L. and Z.C.; methodology, Z.Y., J.L., J.C. (Jun Cheng), J.C. (Junjian Cai) and C.Q.; software, Z.Y. and Z.C.; validation, Z.Y., K.L., S.L. and Q.L.; formal analysis, Z.Y. and J.L.; investigation, J.C. (Jun Cheng), J.C. (Junjian Cai) and X.H.; resources, X.L.; data curation, Z.Y., K.L., J.C. (Jun Cheng), J.C. (Junjian Cai) and Q.L.; writing—original draft, Z.Y., K.L. and J.L.; writing—review and editing, K.L., J.L. and X.H.; visualization, C.Q., X.L., S.L. and Q.L.; supervision, C.Q. and Z.C.; project administration, X.H., X.L. and S.L.; funding acquisition, Z.C. All authors have read and agreed to the published version of the manuscript.

Funding

This work supported by National Key R&D Program of China (No. 2020YFA0714900), National Natural Science Foundation of China (No. 52031003), Joint Fund of the Ministry of Education (No.8091B012201).

Data Availability Statement

The raw data supporting the conclusions of this article will be made available by the authors on request.

Conflicts of Interest

Author Chengkai Qian was employed by the AVIC Changhe Aircraft Industry (Group) Co., Ltd. and Authors Xin Huo, Xia Liu and Shengzhi Li was employed by the Shanghai Electric Power Generation Equipment Co., Ltd. The remaining authors declare that the research was conducted in the absence of any commercial or financial relationships that could be construed as a potential conflict of interest.

References

  1. Pan, Y.M.; Dunn, D.S.; Cragnolino, G.A.; Sridhar, N. Grain-boundary chemistry and intergranular corrosion in alloy 825. Metall. Mater. Trans. A 2000, 31, 1163–1173. [Google Scholar]
  2. Yang, J.; Chen, J.; Wang, Z.; Wang, Z.; Zhang, Q.; He, B.; Zhang, T.; Gong, W.; Chen, M.; Qi, M. High-capacity iron–based anodes for aqueous secondary nickel—iron batteries: Recent progress and prospects. ChemElectroChem 2021, 8, 274–290. [Google Scholar] [CrossRef]
  3. Kim, M.; Kim, D.; Oh, O. Effect of γ′ precipitation during hot isostatic pressing on the mechanical property of a nickel-based superalloy. Mater. Sci. Eng. A 2008, 480, 218–225. [Google Scholar]
  4. Babu, B.N.P.; Bhat, M.S.; Parker, E.R.; Zackay, V.F. A rapid magnetometric technique to plot isothermal transformation diagrams. Metall. Trans. A 1976, 7, 17–22. [Google Scholar] [CrossRef]
  5. Raghavan, V.; Cohen, M. Measurement and interpretation of isothermal martensitic kinetics. Metall. Trans. 1971, 2, 2409–2418. [Google Scholar] [CrossRef]
  6. Liu, Y.; Wang, D.; Sommer, F.; Mittemeijer, E.J. Isothermal austenite–ferrite transformation of Fe–0.04 at.% C alloy: Dilatometric measurement and kinetic analysis. Acta Mater. 2008, 56, 3833–3842. [Google Scholar]
  7. Wong, M.J.; Sanders, P.G.; Shingledecker, J.P.; White, C.L. Design of an Eta-Phase Precipitation-Hardenable Nickel-Based Alloy with the Potential for Improved Creep Strength Above 1023 K (750 °C). Metall. Mater. Trans. A 2015, 46, 2947–2955. [Google Scholar] [CrossRef]
  8. Eshraghi, M.; Felicelli, S.D. An implicit lattice Boltzmann model for heat conduction with phase change. Int. J. Heat Mass Transf. 2012, 55, 2420–2428. [Google Scholar]
  9. Zhang, H.K.; Yao, Z.; Kirk, M.A.; Daymond, M.R. Stability of Ni3(Al, Ti) Gamma Prime Precipitates in a Nickel-Based Superalloy Inconel X-750 Under Heavy Ion Irradiation. Metall. Mater. Trans. A 2014, 45, 3422–3428. [Google Scholar]
  10. Luo, P.; Li, X.; Zhang, W.; Liang, X.; Tan, Z.; Wang, D.; Jiang, C.; Hou, J.; Sun, L. The Study of Phase Transformation Behaviors for 38MnB5Nb Ultra High-Strength Steel by CCT Curves and TTT Curves. Metals 2023, 13, 190. [Google Scholar] [CrossRef]
  11. Hsu, C.-A.; Gan, N.-H.; Chang, H.-Y.; Wang, S.-H.; Tsao, T.-C.; Yang, J.-R.; Chiu, P.-H.; Zheng, X.-Q.; Lee, Y.-T. Characteristics of negative creep aging and its microstructure-oriented tensile behavior. Mater. Sci. Eng. A 2024, 897, 146352. [Google Scholar]
  12. Vianco, P.; Li, J. Negative creep in an amorphous metallic alloy. Mater. Sci. Eng. 1987, 95, 175–186. [Google Scholar]
  13. Qin, H.; Bi, Z.; Li, D.; Zhang, R.; Lee, T.L.; Feng, G.; Dong, H.; Du, J.; Zhang, J. Study of precipitation-assisted stress relaxation and creep behavior during the ageing of a nickel-iron superalloy. Mater. Sci. Eng. A 2019, 742, 493–500. [Google Scholar] [CrossRef]
  14. E139-11; Standard Test Method for Conducting Creep, Creep-Rupture and Stress-Rupture Tests of Metallic Materials, American Society for Testing and Materials. ASTM: West Conshehoken, PA, USA, 2011.
  15. Locq, D.; Caron, P.; Raujol, S.; Pettinari-Sturmel, F.; Coujou, A.; Clément, N. On the Role of Tertiary γ’Precipitates in the Creep Behaviour at 700 C of a PM Disk Superalloy. Superalloys 2004, 2004, 179–187. [Google Scholar]
  16. Xu, K.; Wang, G.; Liu, J.; Li, J.; Liu, J.; Wang, X.; Yang, Y.; Ye, L.; Zhou, Y.; Sun, X. Creep behavior and a deformation mechanism based creep rate model under high temperature and low stress condition for single crystal superalloy DD5. Mater. Sci. Eng. A 2020, 786, 139414. [Google Scholar]
  17. Lu, K.; Wang, J. Activation energies for crystal nucleation and growth in amorphous alloys. Mater. Sci. Eng. A 1991, 133, 500–503. [Google Scholar]
  18. Miesenberger, B.; Kozeschnik, E.; Milkereit, B.; Warczok, P.; Povoden-Karadeniz, E. Computational analysis of heterogeneous nucleation and precipitation in AA6005 Al-alloy during continuous cooling DSC experiments. Materialia 2022, 25, 101538. [Google Scholar]
  19. Starink, M.; Zahra, A.-M. β′ and β precipitation in an Al–Mg alloy studied by DSC and TEM. Acta Mater. 1998, 46, 3381–3397. [Google Scholar]
  20. Yu, H.; Li, W.; Li, S.; Zou, H.; Zhai, T.; Liu, L. Study on Transformation Mechanism and Kinetics of α’ Martensite in TC4 Alloy Isothermal Aging Process. Crystals 2020, 10, 229. [Google Scholar] [CrossRef]
  21. Schreiber, H.-U.; Grabe, B. Electromigration measuring techniques for grain boundary diffusion activation energy in aluminum. Solid-State Electron. 1981, 24, 1135–1146. [Google Scholar]
  22. Park, C.W.; Vook, R.W. Activation energy for electromigration in Cu films. Appl. Phys. Lett. 1991, 59, 175–177. [Google Scholar] [CrossRef]
  23. Lienig, J.; Thiele, M.; Lienig, J.; Thiele, M. Fundamentals of Electromigration; Springer: Berlin/Heidelberg, Germany, 2018. [Google Scholar]
  24. Li, X.; Zhu, Q.; Hong, Y.; Zheng, H.; Wang, J.; Wang, J.; Zhang, Z. Revealing the pulse-induced electroplasticity by decoupling electron wind force. Nat. Commun. 2022, 13, 6503. [Google Scholar] [CrossRef] [PubMed]
  25. Qian, C.; Li, K.; Rui, S.-S.; Hou, M.; Zhang, X.; Wu, Y.; Cai, Z. Magnetic induced re-dissolution and microstructure modifications on mechanical properties of Cr4Mo4V steel subjected to pulsed magnetic treatment. J. Alloys Compd. 2021, 881, 160471. [Google Scholar] [CrossRef]
  26. Cadenato, A.; Salla, J.M.; Ramis, X.; Morancho, J.M.; Marroyo, L.M.; Martin, J.L. Determination of gel and vitrification times of thermoset curing process by means of TMA, DMTA and DSC techniques. J. Therm. Anal. 1997, 49, 269–279. [Google Scholar] [CrossRef]
  27. Zhao, J.C.; Ravikumar, V.; Beltran, A.M. Phase precipitation and phase stability in Nimonic 263. Metall. Mater. Trans. A 2001, 32, 1271–1282. [Google Scholar] [CrossRef]
  28. Rowolt, C.; Milkereit, B.; Andreazza, P.; Kessler, O. Quantitative high temperature calorimetry on precipitation in steel and nickel alloys. Thermochim. Acta 2019, 677, 169–179. [Google Scholar] [CrossRef]
  29. Kissinger, H.E. Reaction Kinetics in Differential Thermal Analysis. Anal. Chem. 1957, 29, 1702–1706. [Google Scholar] [CrossRef]
  30. Menzinger, M.; Wolfgang, R. The meaning and use of the Arrhenius activation energy. Angew. Chem. Int. Ed. Engl. 1969, 8, 438–444. [Google Scholar] [CrossRef]
  31. Rafiei, M.; Mirzadeh, H.; Malekan, M.; Sohrabi, M.J. Homogenization kinetics of a typical nickel-based superalloy. J. Alloy. Compd. 2019, 793, 277–282. [Google Scholar] [CrossRef]
  32. Olson, G.; Cohen, M. A general mechanism of martensitic nucleation: Part II. FCC→ BCC and other martensitic transformations. Metall. Trans. A 1976, 7, 1905–1914. [Google Scholar]
  33. Cheng, J.; Li, K.; Yang, Z.; Huo, X.; Fan, M.; Li, S.; Li, S.; Liu, Q.; Ma, Q.; Cai, Z. Investigation of Precipitation Behavior of a Novel Ni-Fe-Based Superalloy during High-Temperature Aging Treatment. Materials 2024, 17, 4875. [Google Scholar] [CrossRef] [PubMed]
  34. Xu, J.; Zhao, X.; Yue, Q.; Xia, W.; Duan, H.; Gu, Y.; Zhang, Z. A morphological control strategy of γ′ precipitates in nickel-based single-crystal superalloys: An aging design, fundamental principle, and evolutionary simulation. Mater. Today Nano 2023, 22, 100335. [Google Scholar] [CrossRef]
  35. Tang, Y.T.; Karamched, P.; Liu, J.; Haley, J.C.; Reed, R.C.; Wilkinson, A.J. Grain boundary serration in nickel alloy inconel 600: Quantification and mechanisms. Acta Mater. 2019, 181, 352–366. [Google Scholar] [CrossRef]
  36. Liu, L.; Sommer, F.; Fu, H. Effect of solidification conditions on MC carbides in a nickel-base superalloy IN 738 LC. Scr. Metall. Mater. 1994, 30, 587–591. [Google Scholar] [CrossRef]
Figure 1. Heat treatment process for thermal expansion experiment.
Metals 15 00345 g001
Figure 2. Heat treatment process for aging experiment.
Metals 15 00345 g002
Figure 3. Thermal expansion curves of a new iron–nickel-based alloy in the 600–850 °C temperature range.
Metals 15 00345 g003
Figure 4. Isothermal transformation start curve obtained by thermal expansion method for a new iron–nickel-based alloy.
Metals 15 00345 g004
Figure 5. Creep curves of a new iron–nickel-based alloy in the 600–850 °C temperature range: (a) 600 °C; (b) 650 °C; (c) 700 °C; (d) 750 °C; (e) 800 °C; (f) 850 °C.
Metals 15 00345 g005
Figure 6. Isothermal transformation start curve obtained by the creep method for a new iron–nickel-based alloy.
Metals 15 00345 g006
Figure 7. Isothermal precipitation start curves for the new iron–nickel-based alloy obtained through thermal expansion, creep tests, and simulation.
Metals 15 00345 g007
Figure 8. Schematic diagram of the effect of non-thermal electricity.
Metals 15 00345 g008
Figure 9. Schematic diagram of non-spontaneous and spontaneous nucleation processes.
Metals 15 00345 g009
Figure 10. DSC curves of the new iron–nickel-based alloy at different heating rates.
Metals 15 00345 g010
Figure 11. Modified Arrhenius equation fitting relationships for the three isothermal precipitation curves.
Metals 15 00345 g011
Figure 12. Simulated phase diagram of the new iron–nickel-based alloy.
Metals 15 00345 g012
Figure 13. Secondary electron images of γ′ precipitates at different temperatures after 60 h of aging: (a) 650 °C, 60 h; (b) 750 °C, 60 h; (c) 800 °C, 60 h; (d) 850 °C, 60 h.
Metals 15 00345 g013
Figure 14. SEM and EDS results of grain boundary and intragranular carbides in the new iron–nickel-based alloy: (a) secondary electron image of intragranular carbides; (b) Ti; (c) Mo; (d) secondary electron image of grain boundary carbides; (e) Cr; (f) Ti.
Metals 15 00345 g014
Figure 15. Secondary electron images of γ′ precipitates in the new iron–nickel-based alloy: (a) 800 °C, 1 h; (b) 850 °C, 1 h; (c) 800 °C, 60 h; (d) 850 °C, 60 h.
Metals 15 00345 g015
Figure 16. Secondary electron images of M23C6 at 650 °C and 750 °C at different times: (a) 650 °C, 1 h; (b) 650 °C, 5 h; (c) 650 °C, 20 h; (d) 650 °C, 60 h; (e) 750 °C, 1 h; (f) 750 °C, 5 h; (g) 750 °C, 20 h; (h) 750 °C, 60 h.
Metals 15 00345 g016
Figure 17. Secondary electron images of M23C6 at 800 °C and 850 °C at different times: (a) 800 °C, 1 h; (b) 800 °C, 2 h; (c) 800 °C, 60 h; (d) 850 °C, 1 h; (e) 850 °C, 2 h; (f) 850 °C, 60 h.
Metals 15 00345 g017
Figure 18. Simulated isothermal precipitation start curves of different precipitates in the new iron–nickel-based alloy.
Metals 15 00345 g018
Table 1. Chemical composition of the new iron–nickel-based alloy.
ElementCCoFeAlTiCrNi
wt.%0.042.0402.01.416.1Bal.
Table 2. Nucleation activation energy for the new iron–nickel-based alloy under three methods.
MethodHeating MethodlnAMethodHeating Method
Thermal ExpansionElectromagnetic Induction2.23 × 1010.66127.35
CreepHeat Conduction1.17 × 1010.82158.22
SimulationSimulation8.84 × 1001.00192.95
Disclaimer/Publisher’s Note: The statements, opinions and data contained in all publications are solely those of the individual author(s) and contributor(s) and not of MDPI and/or the editor(s). MDPI and/or the editor(s) disclaim responsibility for any injury to people or property resulting from any ideas, methods, instructions or products referred to in the content.

