Abstract
The study analyzes the splash dynamics of liquid steel jets impacting solid surfaces, using a physical model with scaled-down water experiments. Two turbulence inhibitor designs are compared, focusing on droplet formation and distribution. The interaction of the jet with the inhibitors influences droplet generation and dispersion, impacting the safety and quality of the continuous casting process. Key parameters such as the Weber number and surface tension are identified as factors affecting the stability of liquid films. Finally, similarities between splash dynamics in water and steel are highlighted.
1. Introduction
The splashing phenomenon of impacting jets on solid surfaces is critical in various fields, including steelmaking, foundries, pharmaceuticals, automotive painting, thermal coatings, natural waterfalls, the food industry, and inkjet printing [1,2,3,4]. Although somewhat underestimated, splashing had not been thoroughly studied until recent years, largely due to advancements in high-speed imaging technology [5,6,7]. High-speed imaging of droplets and bubbles has significantly improved the understanding of these processes.
Liquid jet splashing generates droplets with size distributions that depend on the specific dynamic conditions of a given process. In some applications, the generation and subsequent fragmentation of droplets are desirable phenomena. However, in continuous steel casting, the formation of multiple small droplets leads to reoxidation, particularly during the first heat of a casting sequence. The overall fluid dynamics of continuous casting were previously addressed in an earlier publication [8]. The present study focuses specifically on the detailed analysis of splashing and droplet generation. In the context of steel casting, controlling droplet size distribution is not necessarily the primary objective; rather, flow reorientation and turbulence control are the key considerations.
Understanding the fluid dynamics of splashing during steel jet impact on solid surfaces is impossible in an actual industrial system. Therefore, as in the previous publication, a water model is employed. Water-downscaled modeling is a well-established technique for studying steel fluid flow in industrial tundishes, based on the Froude similarity criterion. The Froude number is equivalent for both the model and the prototype of the distributor. The model’s flow rate is calculated based on the liquid steel flow rate , . [9,10,11,12]. However, using water to investigate steel jet impact and its associated phenomena does not replicate the physical behavior of the real system due to the significantly different physical properties of both liquids, as shown in Table 1. For example, the surface tension ratio between steel and water is approximately 25, while their density ratio is about 7. Physically, one would expect larger air bubbles in water compared to liquid steel. Consequently, a direct translation between water and steel jet behavior is not feasible. Nevertheless, since this study is a comparative analysis of the two turbulence inhibitor (TI) designs tested in the previous publication [8], generating qualitative insights remains a viable approach. The reason for using water to model steel lies in their kinematic viscosity, as both values are very similar (see Table 1). This implies that the dimensionless numbers exhibit good agreement, ensuring kinematic similarity. Additionally, the tundish and turbulence inhibitor models comply with the laws of geometric similarity.
Most research on tundish fluid dynamics has focused on steady-state flows, reactor-like behavior, flow characterization, inclusions removal, temperature distribution, and flow modifiers [13,14,15,16,17]. However, the transient phase at the start of casting remains largely unexplored, despite being a critical period where reoxidation and cleanliness issues arise. During the initial moments of casting, the liquid steel jet impacts the tundish surface, generating splashing and mixing with atmospheric air. This phenomenon introduces oxygen into the molten steel, leading to the formation of exogenous oxide inclusions—such as alumina—and increasing the levels of dissolved oxygen and nitrogen, ultimately degrading steel cleanliness.
Reoxidation-induced inclusions tend to agglomerate, forming larger clusters that can cause defects such as cracks, surface lines, or “slivers” in rolled products, as well as deterioration of mechanical properties, including toughness and fatigue resistance [18]. Additionally, severe reoxidation contributes to nozzle clogging, leading to casting obstructions, mold level fluctuations, surface defects, and even process interruptions. In response, steel mills often rework the first cast tons if they have undergone severe reoxidation. However, the ultimate goal is to implement practices that ensure consistent quality from the first casting. Despite the significant impact of these issues, research has primarily focused on steady-state casting, leaving a gap in understanding the transient phase and its effects on steel quality.

Table 1.
Properties of the steel at 1550 °C [19] and the water at 20 °C.
Table 1.
Properties of the steel at 1550 °C [19] and the water at 20 °C.
| Steel [1550 °C] | Water [20 °C] | |
|---|---|---|
| Density [kg/m3] | 7000 | 1000 |
| Viscosity [Pa·s] | 0.0065 | 0.001 |
| Kinematic viscosity [m2/s] | 0.928 × 10⁻⁶ | 1.0 × 10⁻⁶ |
| surface tension [N/m] | 1.8 | 0.0728 |
2. Physical Model
The water model is the same as that presented in the former publication [7]; it consists of a 1/3-scale, three-strand tundish, and two turbulence inhibitor designs to be tested. The three elements are reported in Figure 1, Figure 2 and Figure 3 for illustration purposes, avoiding referring to the original paper. The experimental setup consists of piping connections, a water flowmeter, a high speed, and conventional video cameras to capture the generations of droplets and bubbles at the jet impact times. A red dye was injected in the 1° orifice to ensure a correct mix with water and better contrast during video and photo recordings. Flowmeters were calibrated before testing the flows (30 L/min, 46 L/min, 60 L/min), then the red dye was injected, and water began coming up from the tank and started to fill the tundish; cameras recorded the filling process. The process was stopped when the tundish model bottom was covered.
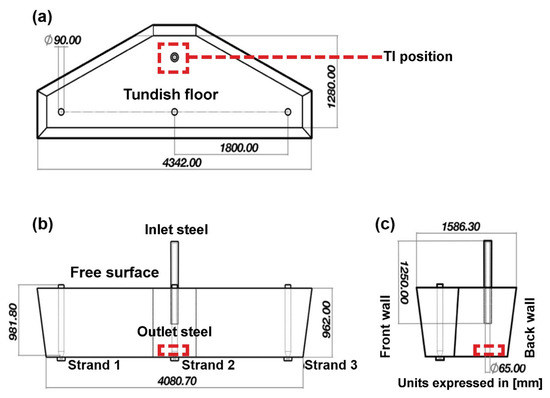
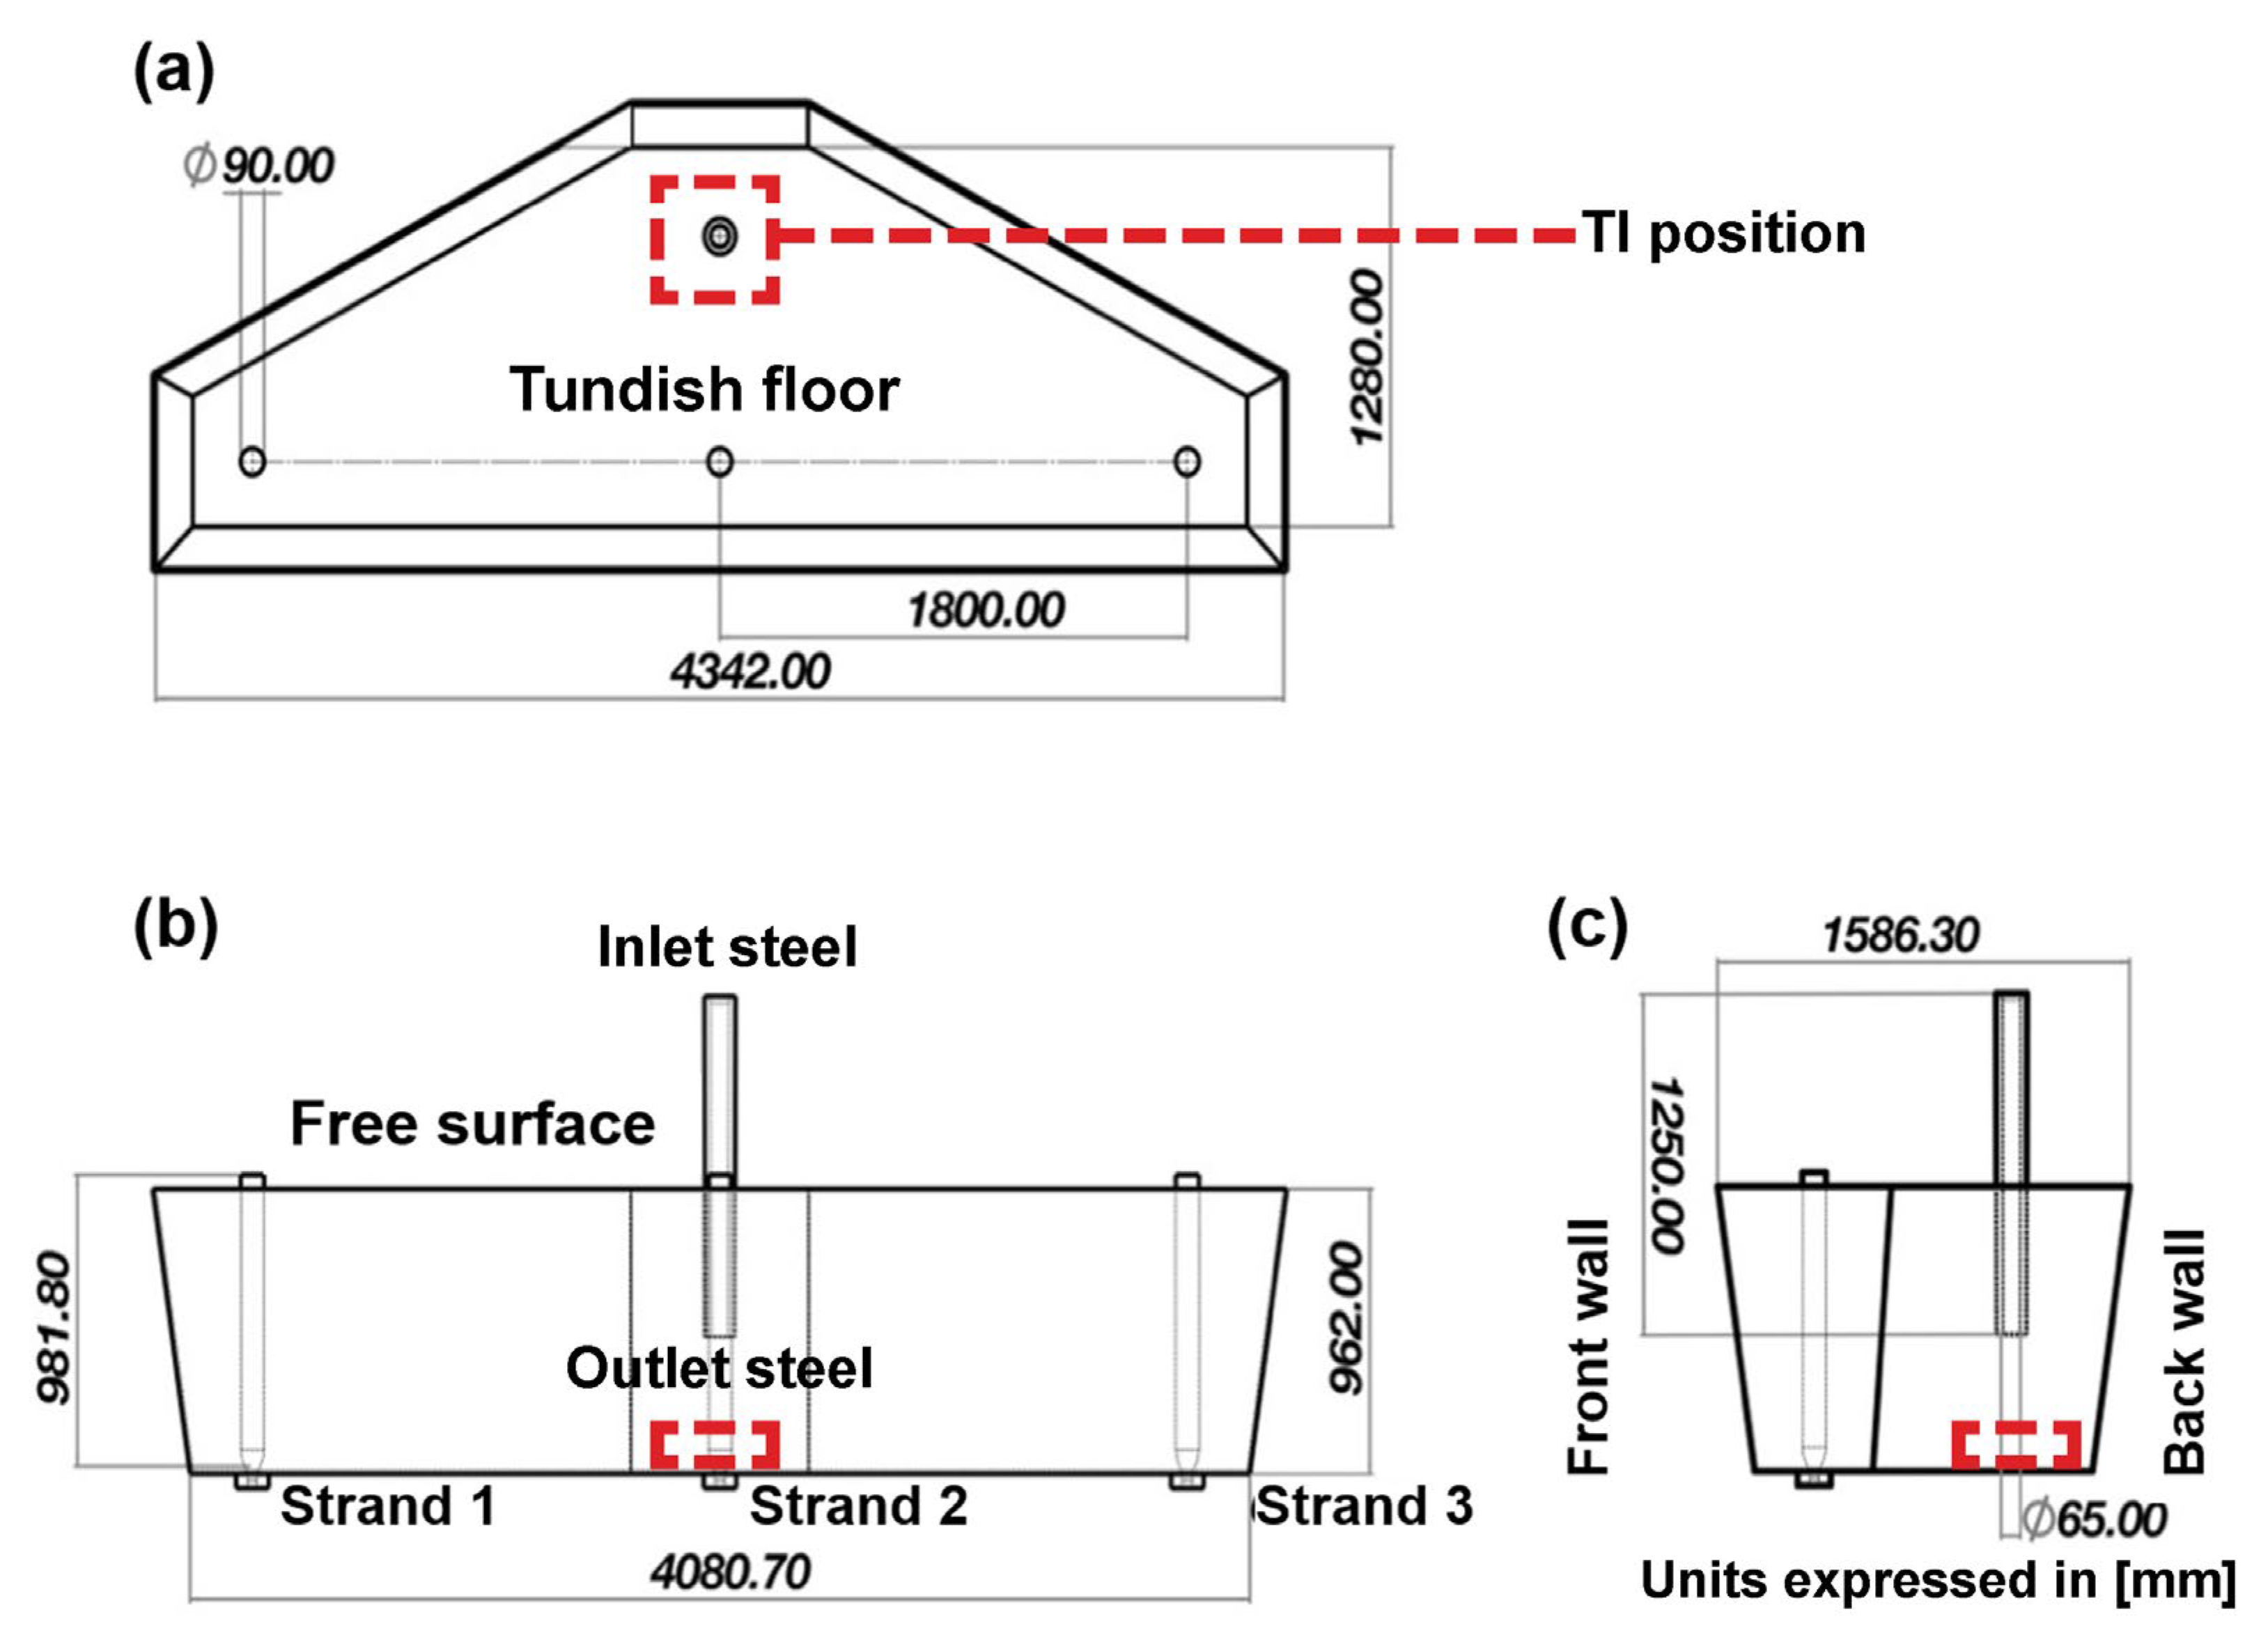
Figure 1.
The tundish and ladle shroud dimension. In (a) the superior view, in (b) the front view, and (c) the side view and the LS dimensions. Units are expressed in mm.
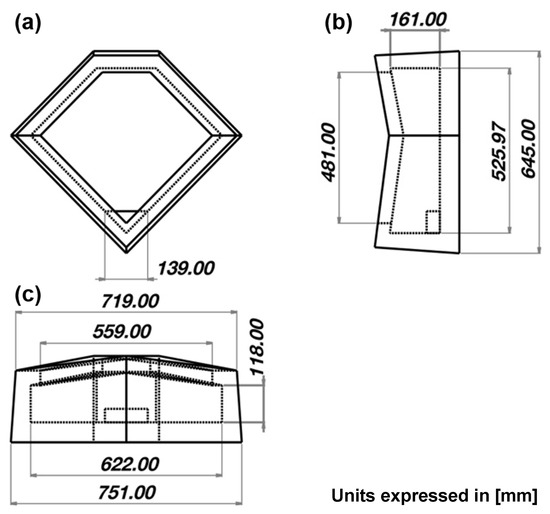
Figure 2.
Dimensions of TI1, the original design used in the industry: (a) top view of TI1, (b) side view of TI1, and (c) front view of TI1. Units are expressed in mm.

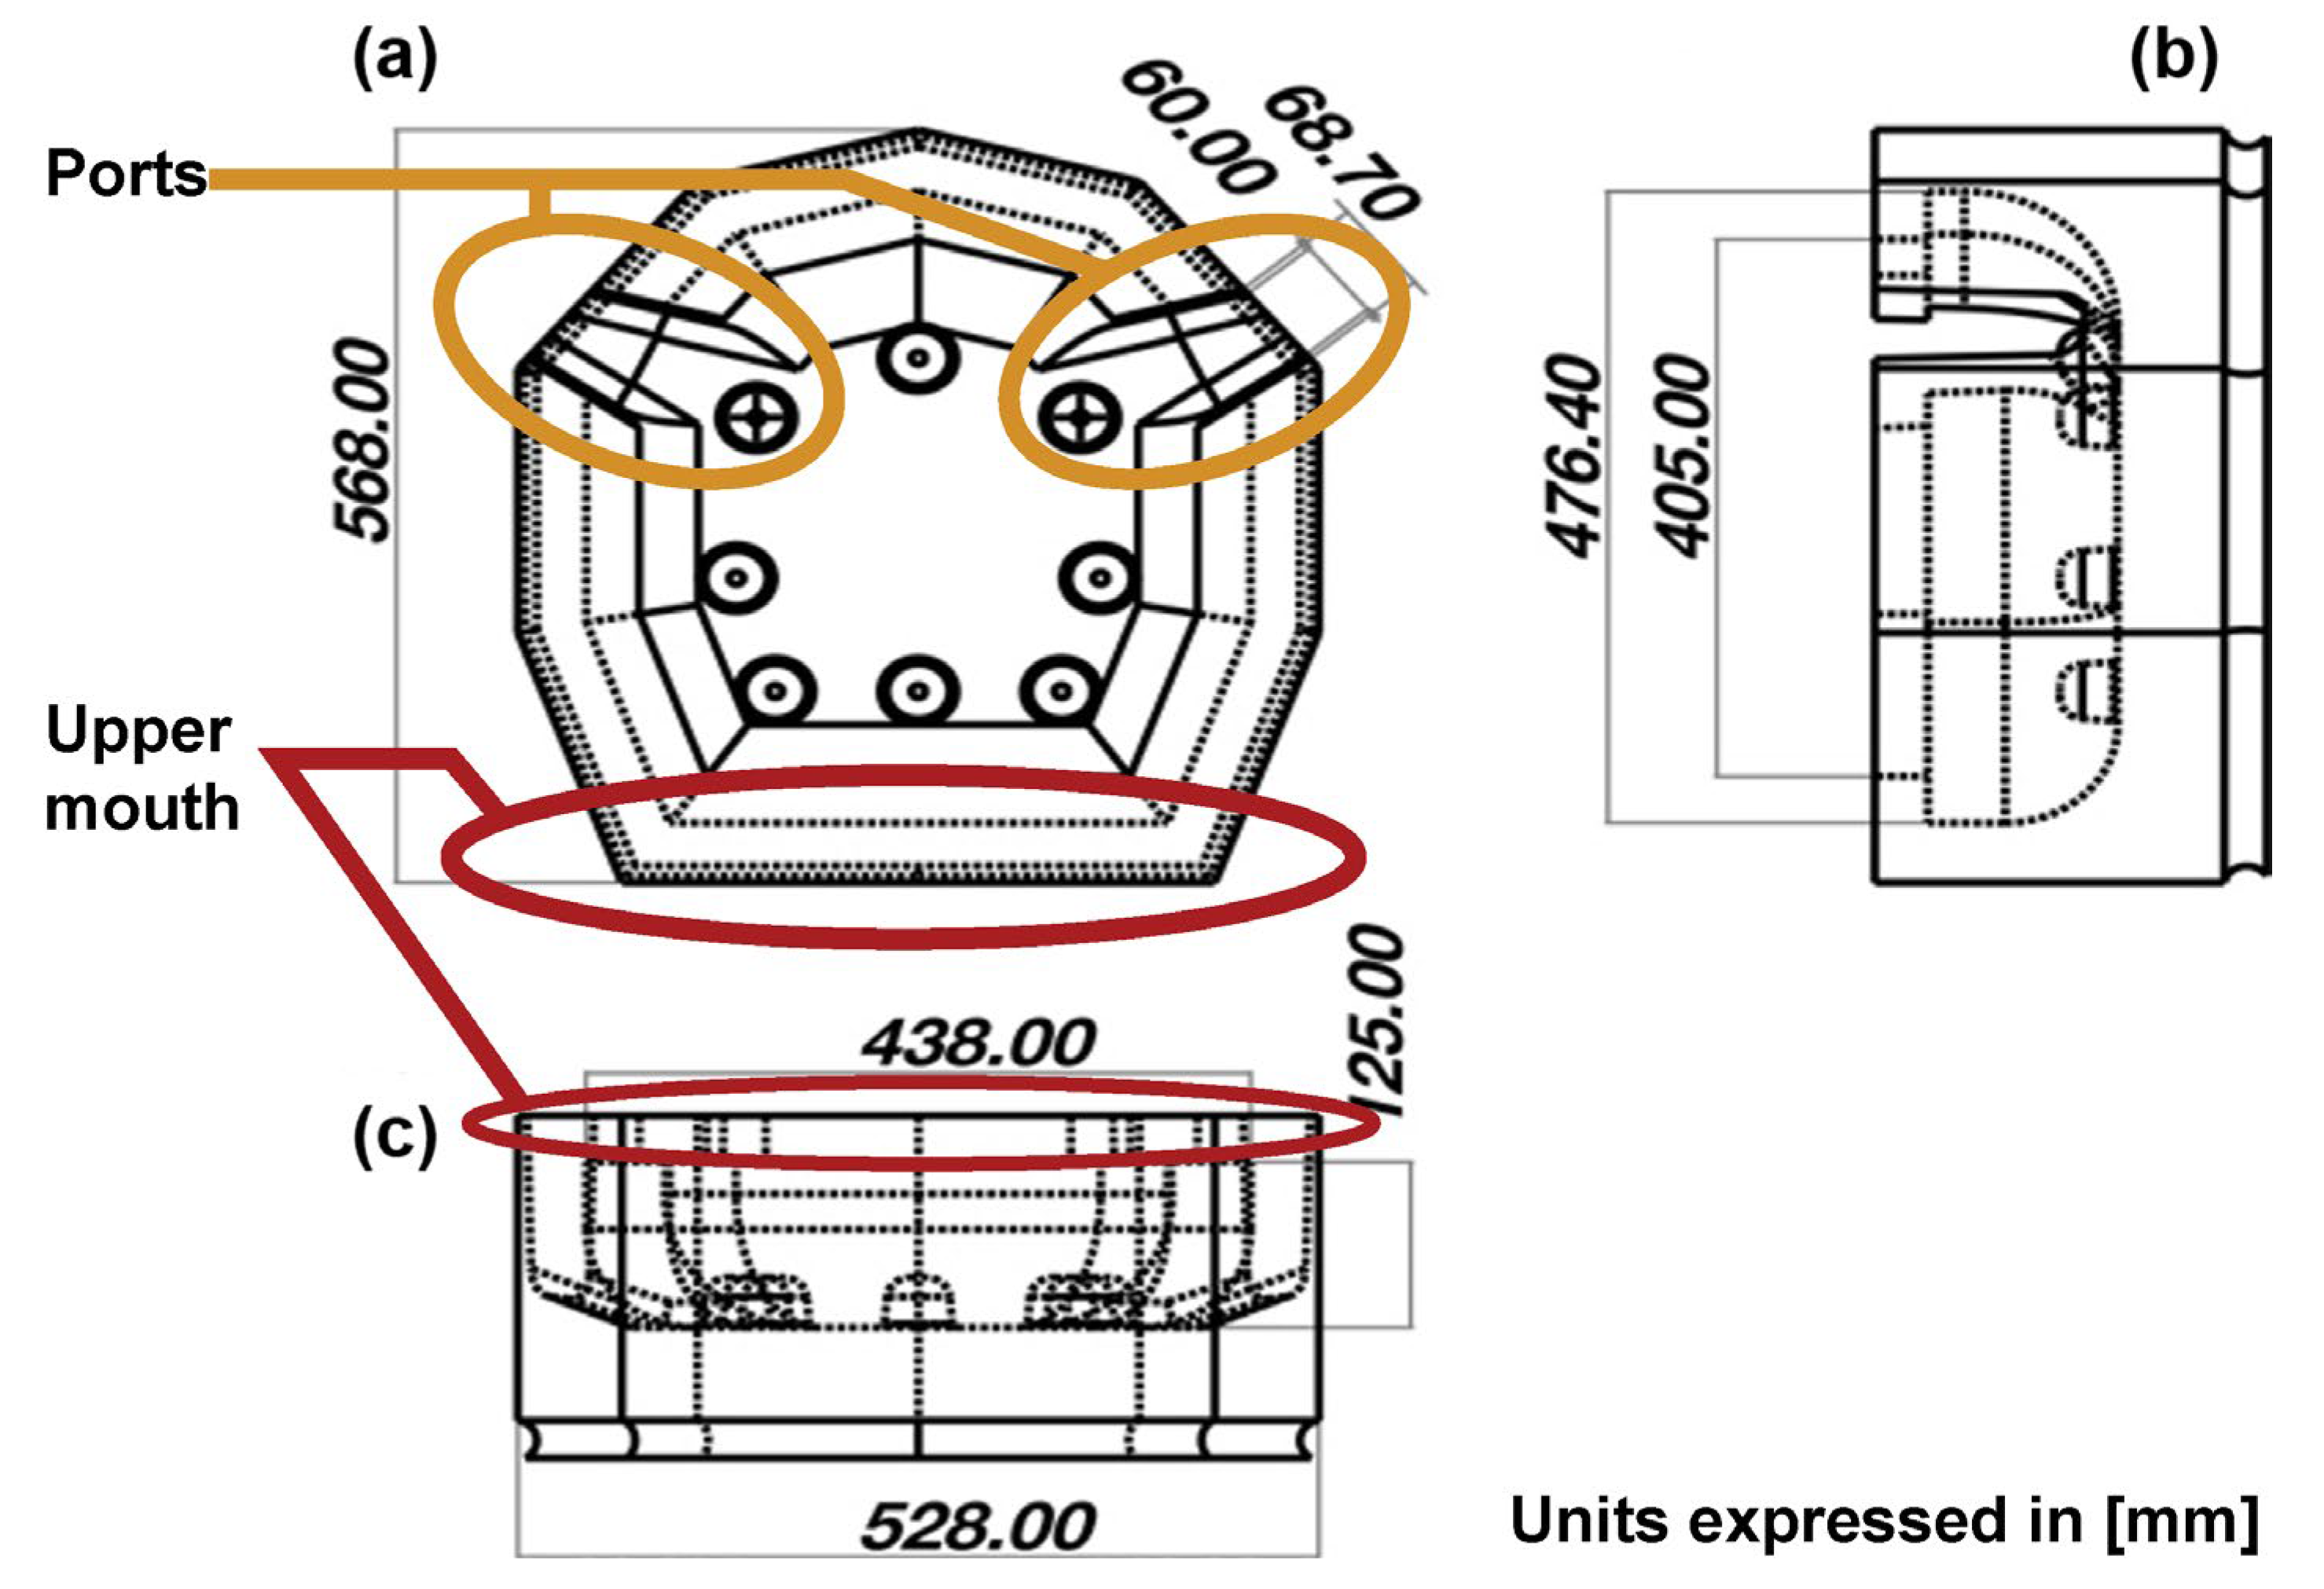
Figure 3.
The dimension of TI2, a proposed design: (a) TI2 superior view, (b) TI2 lateral view, and (c) TI2 front view. The liquid outlet ports have been circled in orange and the upper mouth in red. Units are expressed in mm.
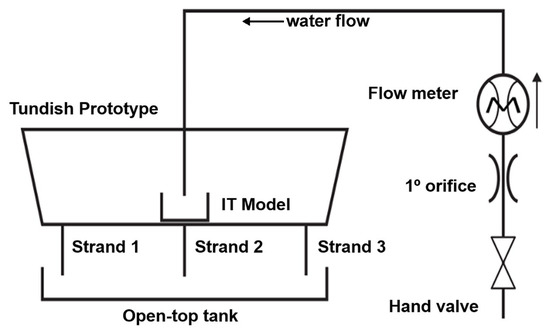
The images from the recording systems were subjected to quantitative analysis using a MATLAB subroutine in the version R2022b, to determine the droplet size distribution upon impact on the tundish back wall. Figure 4 shows a schematic representation of the experimental setup. The hand valve was used to start and stop the experiment, while the flow meter allowed us to regulate the flow rate. The red dye was injected into Orifice 1 before the valve was opened. The strands served as the water outlets, which was finally collected in the open-top tank.
In these experiments, three tundish liquid feeding rates were tested: the current rate (30 L/min), one higher (60 L/min), and one lower (30 L/min). Table 2 shows the flow rates for the model (water) and the corresponding values for the steel in the plant. Performing this allowed us to observe how the turbulence inhibitor behaves in different situations.
Table 2.
Flow rate tested in the experiments.
3. Results and Discussion
3.1. Initial Flow Patterns
Figure 5 and Figure 6 show the impact of time frames during the jet impact on turbulence inhibitor (TI) TI1 and TI2, respectively, using the working tundish filling rate (46 L/min). The impact flow pattern on TI1 indicates the liquid sheet’s instability and the fingers’ formation at the spreading front in the very early stages of droplet formation. Once the pool is developed inside the TI1, the jet impacts its surface, completely changing the droplet formation mechanism due to the development of a pool. On the other hand, due to its design, the jet-impacting TI2 does not develop a pool because the liquid is continuously drained through the two ports and used to fill the tundish. In its early stages, splashing develops a crown-type flow in both TIs. The dimensionless variables governing the splashing dynamics and subsequent droplet formation are reported in Table 3. The Froude number is so large that it has practically no influence on the involved phenomena. Other significant dimensionless numbers include Reynolds, Weber, Ohnesorge, and Capillary, which account for inertia, surface tension, and capillary forces. The density and viscosity ratios between the gas and liquid phases are also influencing factors, but both are encompassed in the Stokes number, as reported in the same table.
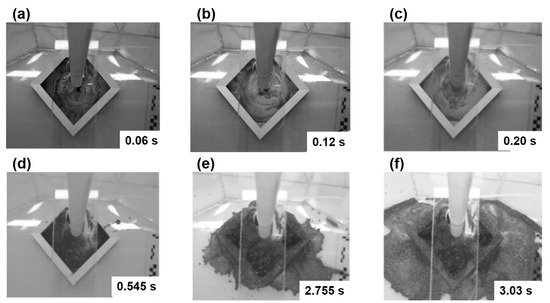
Figure 5.
Collection of frames from the impact pattern during the tundish filling process at a flow rate of 46 L/min, using IT1. The first three frames (a–c) correspond to the 0.06 s, 0.12 s, 0.20 s in the modeling, depict the formation of the Worthington–Edgerton crown inside the IT. Frame (d) shows the fully developed pool, (e) illustrates the initial spreading of the pool, and (f) captures the way the water covers the floor.
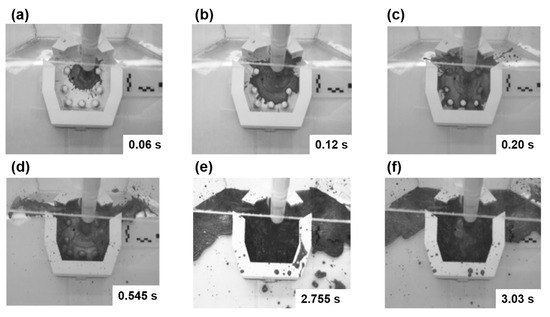
Figure 6.
Collection of frames from the impact pattern during the tundish filling process at a flow rate of 46 L/min, using IT2. The first two frames (a,b) correspond to 0.06 s, 0.12 s in the modelling, depict the formation of the Worthington–Edgerton crown inside the IT. In (c), the evacuation of water through the ports begins to be observed. Frame (d) shows the fully developed pool, (e) illustrates the initial spreading of the pool, and (f) captures the way the water covers the floor.
Table 3.
The dimensionless variables that governing the splashing dynamics and the subsequent drop formation are reported in.
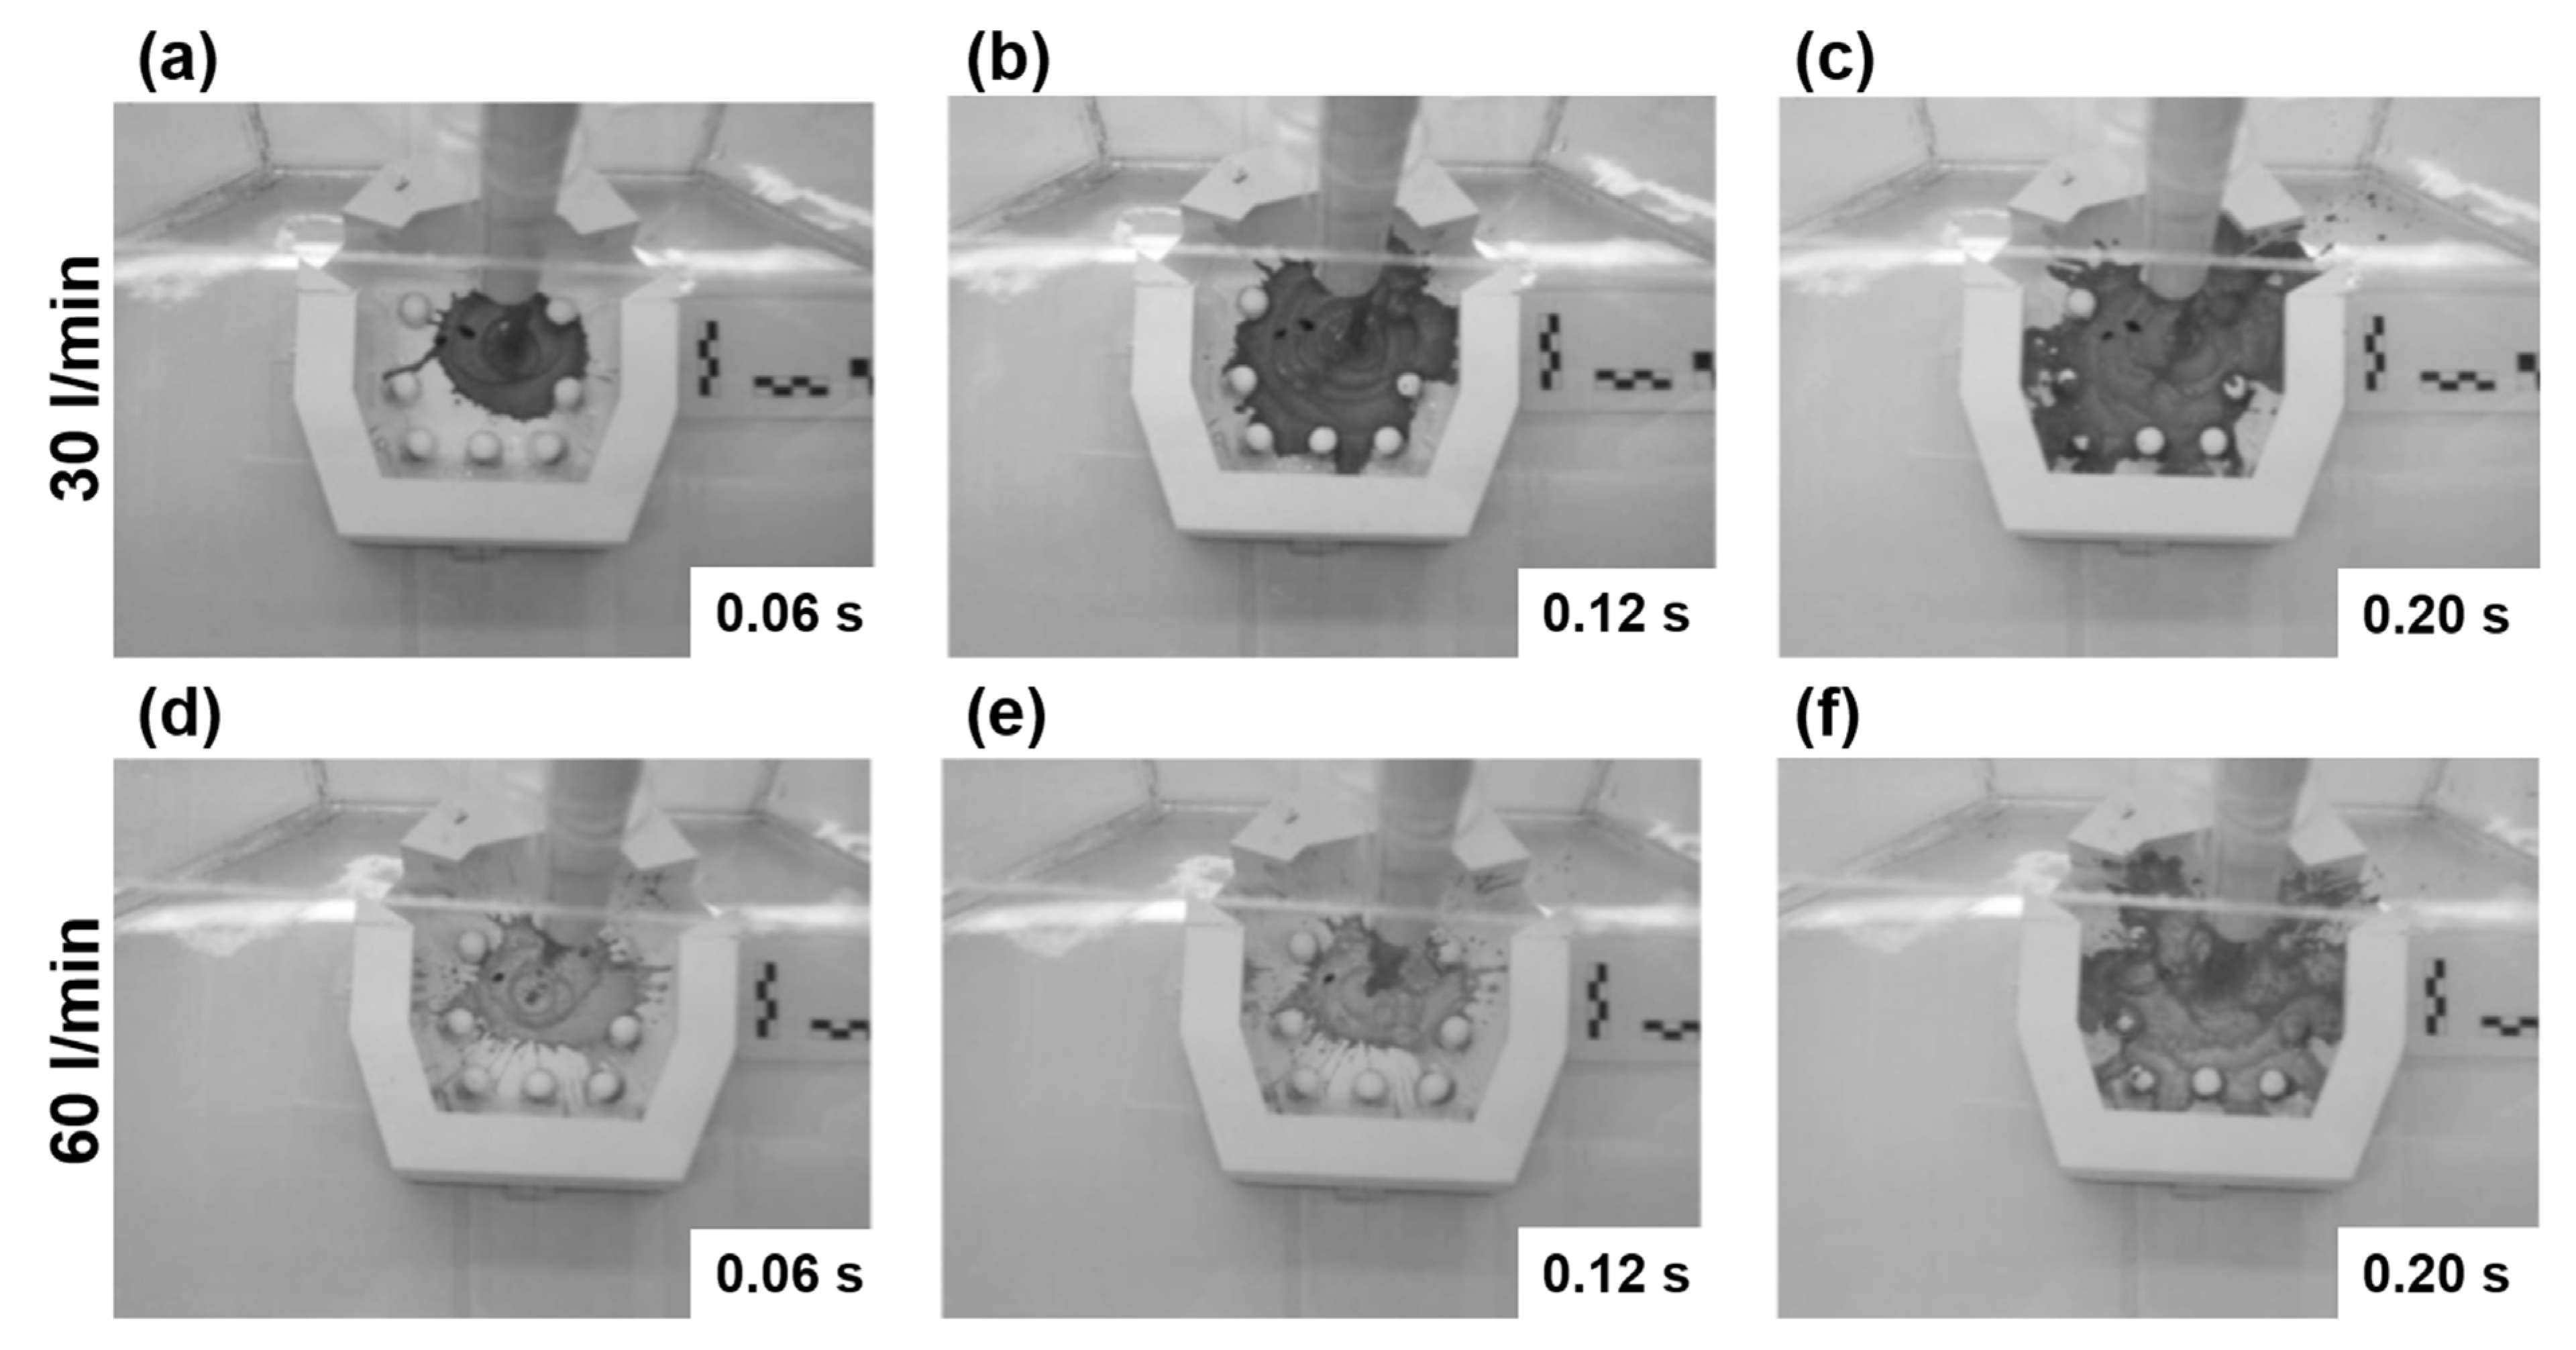
Under atmospheric conditions, before the jet contacts the solid surface, it first encounters a compressed layer of air 2 to 5 μm thick. This trapped air is displaced before the liquid can reach the surface. As the air disk forms, it contracts, causing the liquid to spread against increasing resistance, which results in a crown or finger-like structure. This phenomenon can be seen in Figure 5a,b for TI1 and Figure 6a,b for TI2 for the regular tundish filling rate. The finger structures that develop during the initial moments of jet impact at filling rates of 30 and 60 L/min using TI1 are shown in Figure 7a–f. The corresponding structures for filling rates of 30 and 60 L/min using TI2 are depicted in Figure 8a,f. A pool is not developed since the liquid drains TI2 through the ports oriented toward the tundish back wall. TI1 develops a pool given its wrapping geometry, while in TI2, the finger structures last longer until a draining pool develops, as seen in Figure 6e,f. The accumulation of liquid in the area behind the tundish back wall at TI1, observed at 2.755 and 3.03 s, seen in Figure 5e,f, is minimal. In contrast, the accumulation of liquid in the same area with TI2 results in a significant water layer, as shown in Figure 6e,f. This latter condition maintains a sufficiently large liquid steel temperature, ensuring it is high enough to prevent freezing upon reaching the strand nozzles.
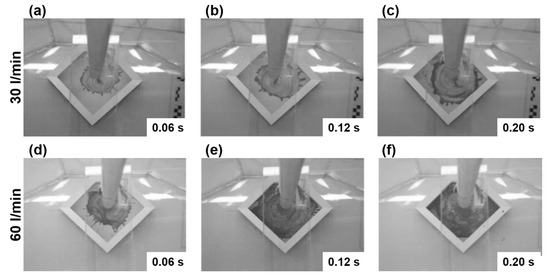
Figure 7.
Collection of frames showing the formation of the finger structure by the liquid film upon the impact of the liquid jet on TI1, at both lower and higher flow rates. Frames (a–c) correspond to the 30 L/min flow rate, while frames (d–f) correspond to the 60 L/min flow rate.

Figure 8.
Collection of frames showing the formation of the finger structure by the liquid film upon the impact of the liquid jet on TI2, at both lower and higher flow rates. Frames (a–c) correspond to the 30 L/min flow rate, while frames (d–f) correspond to the 60 L/min flow rate.
3.2. Drop and Splashing Dynamics
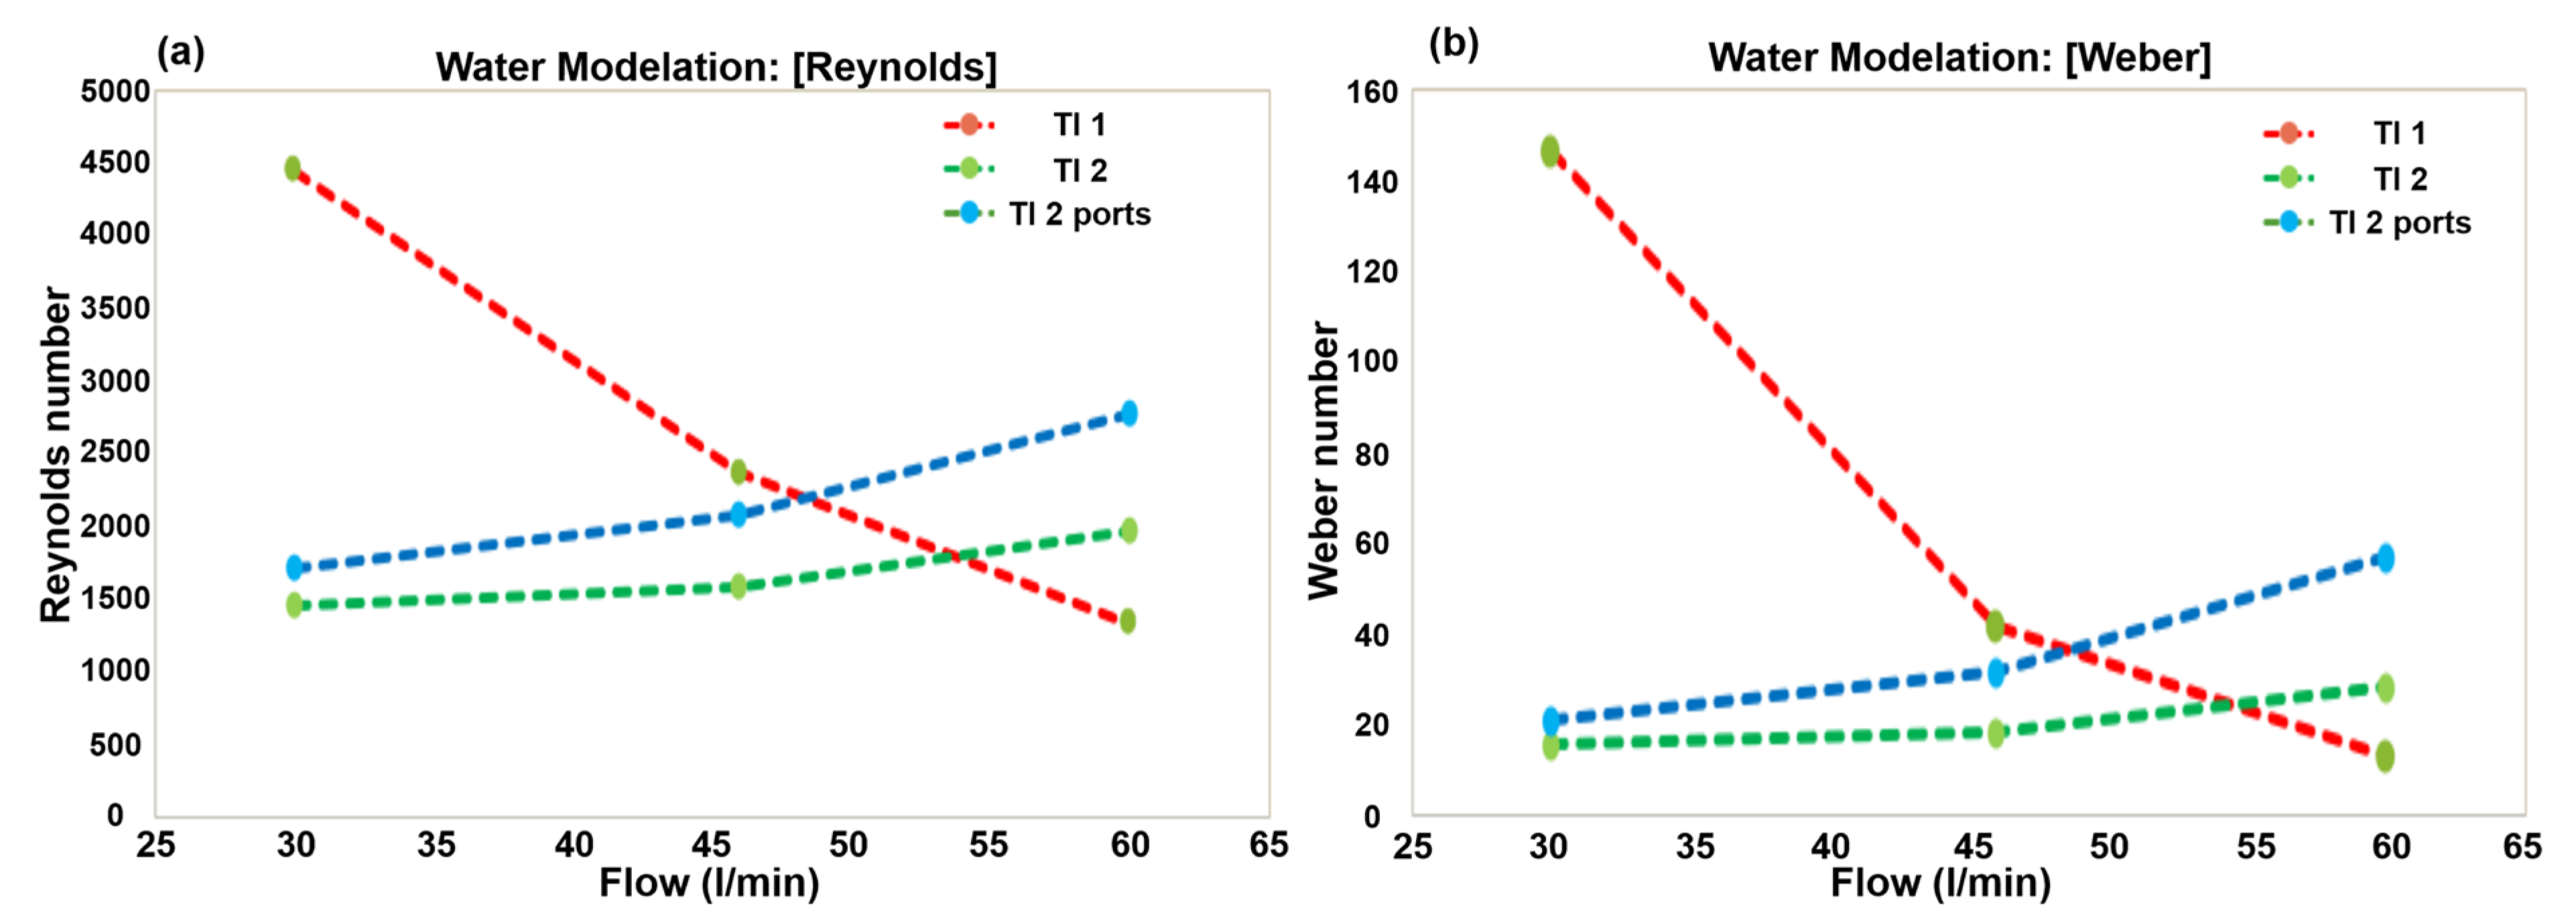
The average drop velocities measured using fast video recordings for both tundish inhibitors (TIs) are displayed in Figure 9. The velocity of the flying ejecting drops increases with the tundish filling rate, in the case of TI2, through the upper mouth and the ports. Notably, the velocities are higher when the drops pass through the ports than the upper mouth. This phenomenon occurs because TI2 drains quickly during filling. In contrast, when using TI1, the drop velocity shows a reverse trend due to the splashing in the deep pool maintained by its wrapping geometry. Figure 10a–c show the normal drop size distributions for both TIs and tundish filling rate; the average drop size becomes independent as the tundish filling rate increases. The size distribution widens with larger tundish filling rates. Figure 11a,b show the developed flying drops Reynolds and Weber numbers during the liquid splashing owing to the jet impact. As expected, both plots follow the same trends as the velocities, as explained before.
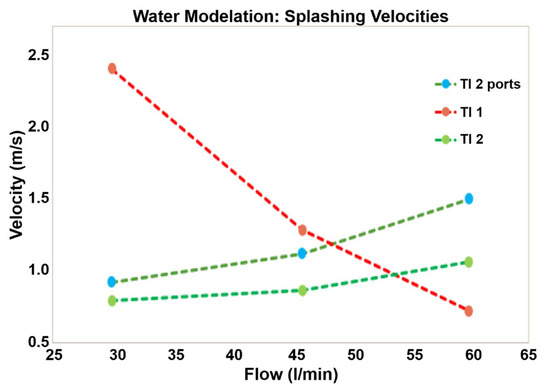
Figure 9.
Plot of the average velocities measured for the three flow rates. This plot was generated using data obtained from the experiments. The green-blue dashed line with circles represents measurements taken in the ports zone of TI2, while the green dashed line with circles corresponds to measurements taken in the upper mouth zone.
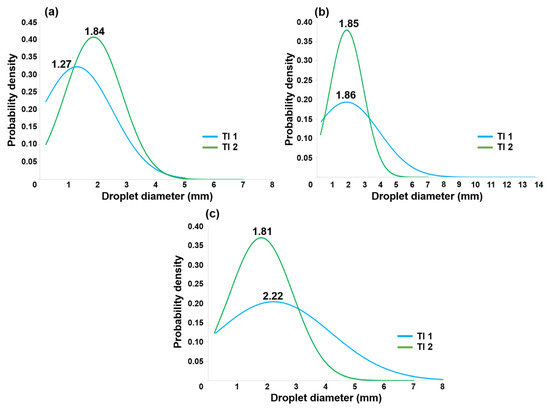
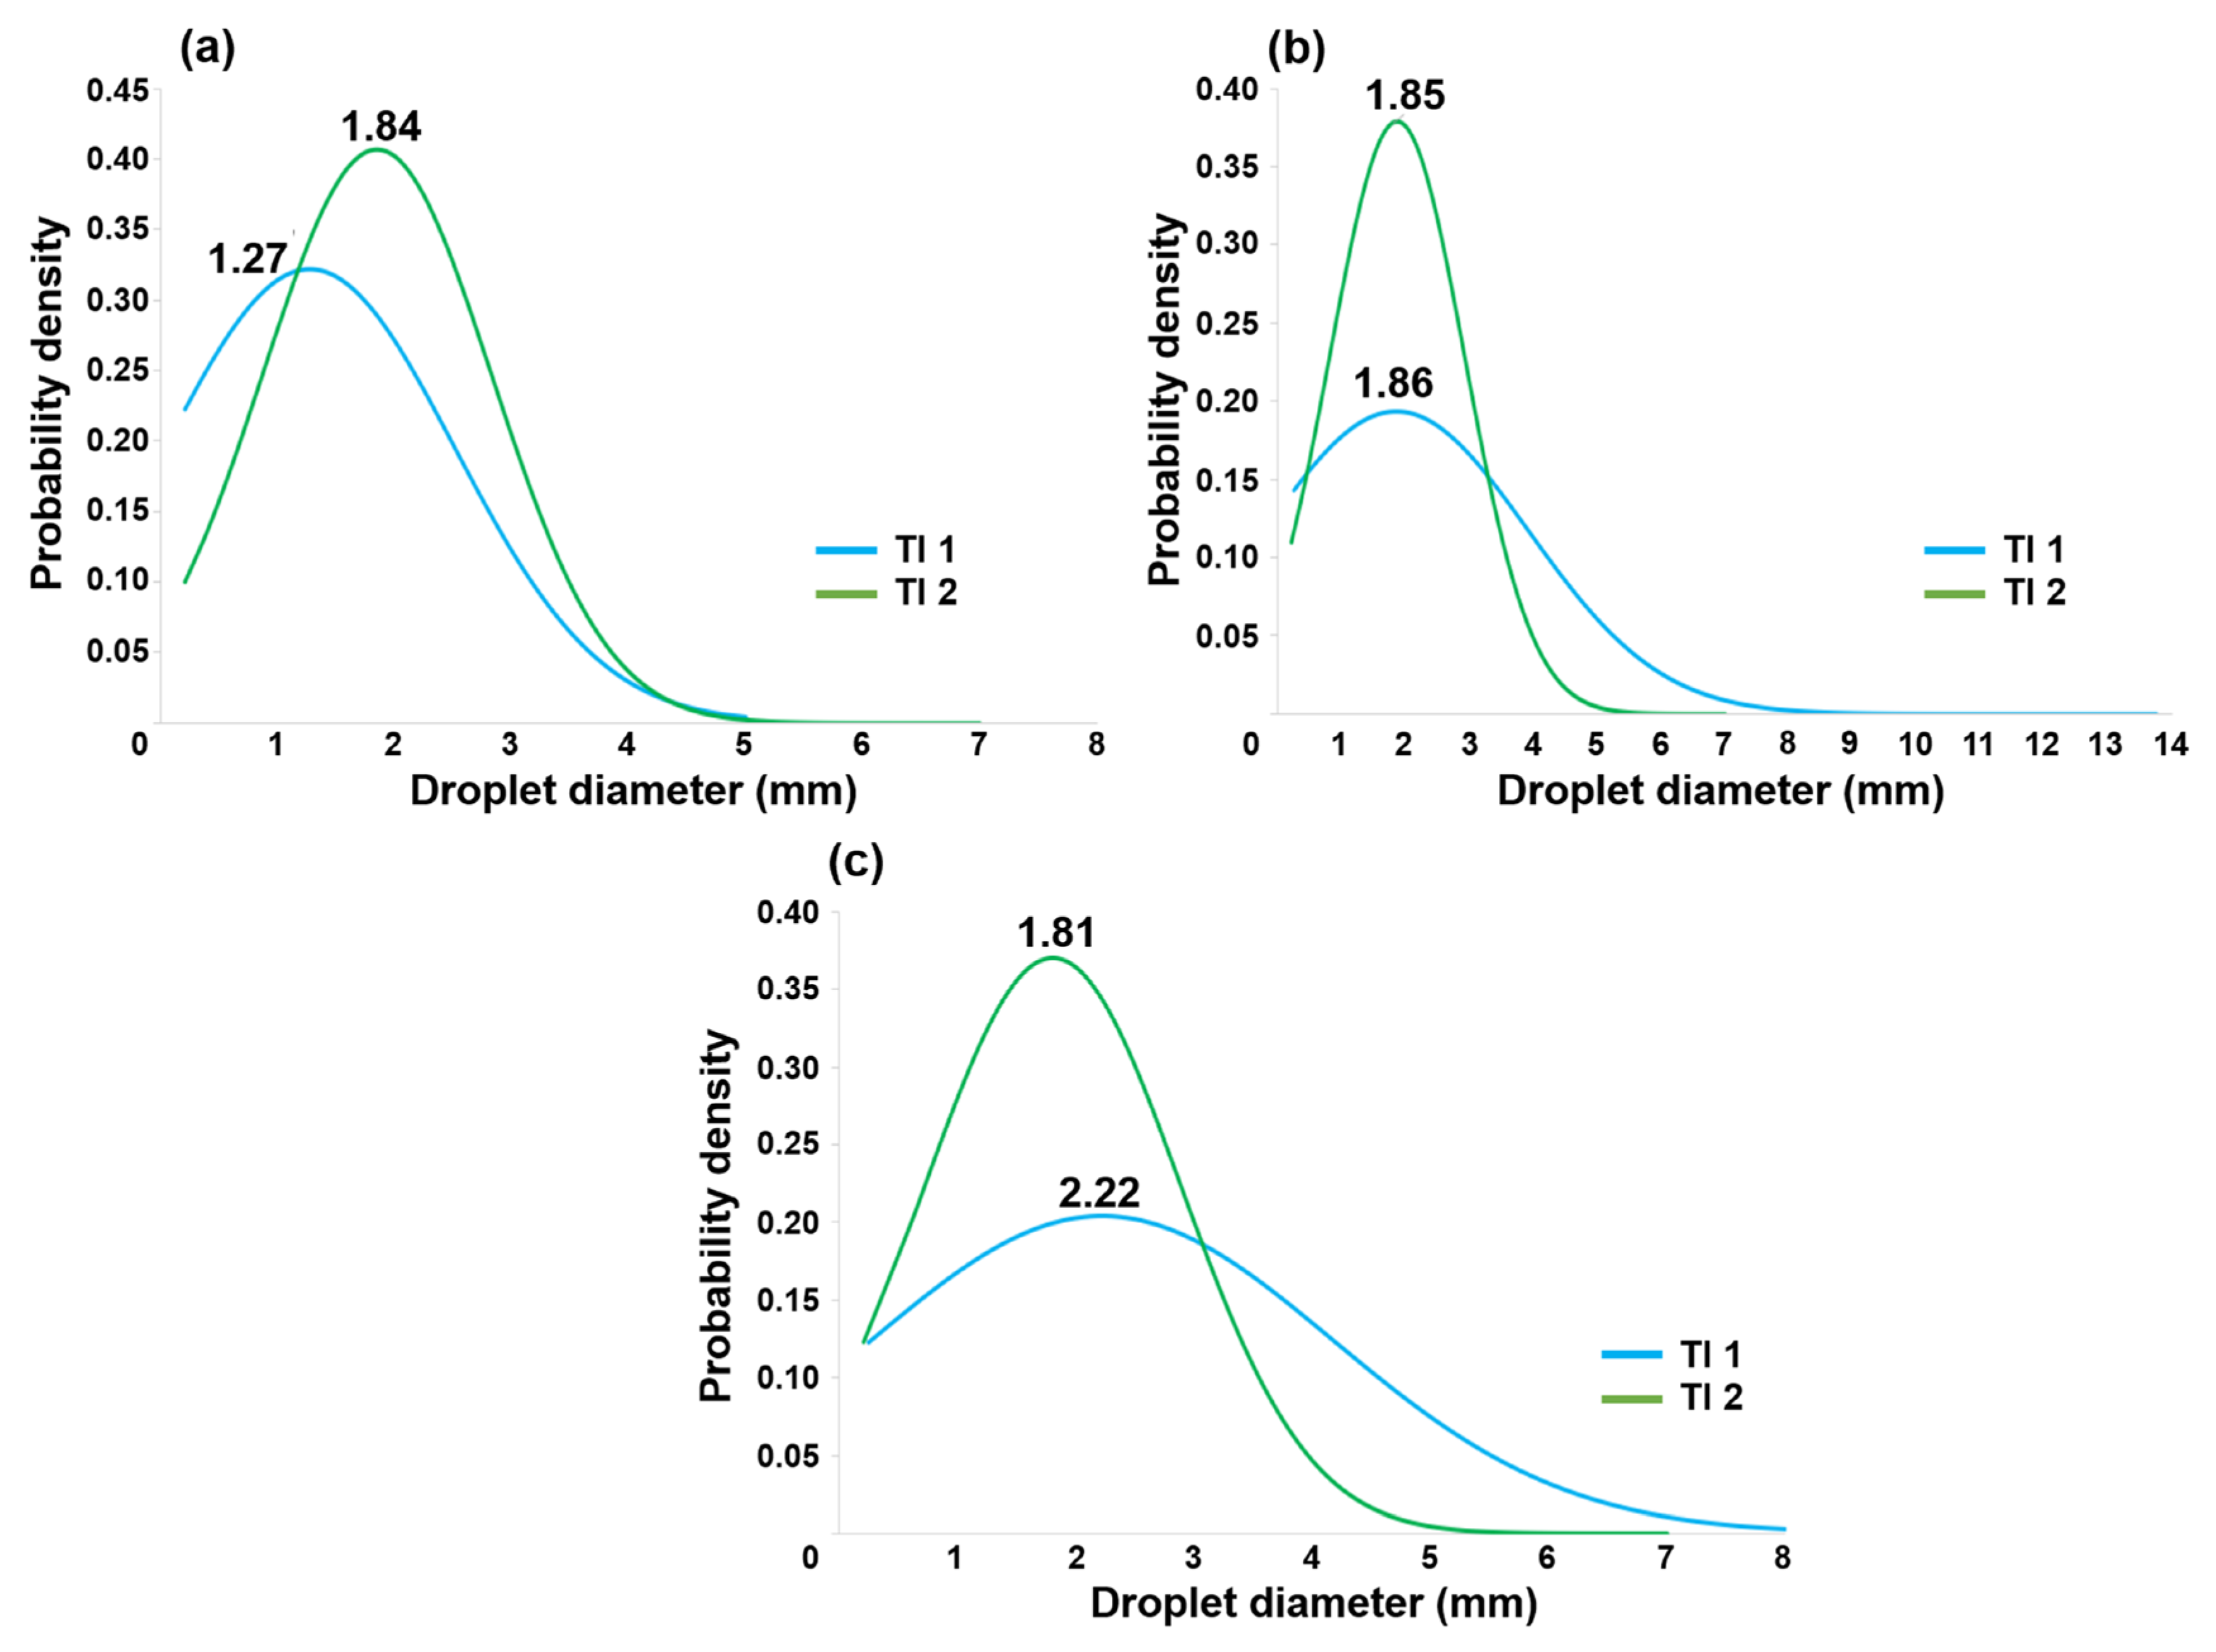
Figure 10.
Normal distribution of droplet size by flow rate: (a) 30 L/min, (b) the working flow rate, and (c) 60 L/min. The X-axis corresponds to the measured diameters, with the upper part of the plot representing the most frequently occurring values. The Y-axis corresponds to the probability percentage of obtaining the diameter values.
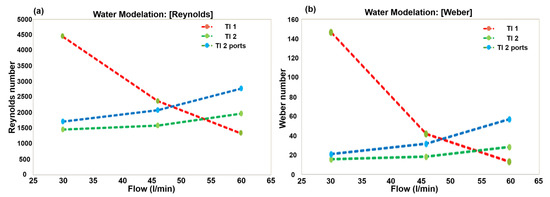
Figure 11.
(a) presents the Reynolds number plot for the flow rates tested: 30 L/min, 46 L/min, 60 L/min. (b) depicts the Weber number for the same flow rates tested. Blue line was measured in the ports zone while green one in the upper mouth zone. Both plots were generated by the average data measured.
Liquid splashing in deep pools, such as TI1, is dominated by the balance of surface, gravitational potential, capillary, and drop kinetic energies. The gravitational-potential energy transforms into kinetic energy, which is employed to deform the pool’s surface, as shown in Figure 12. These three energies are the potential energy (U), the kinetic energy (T), and the surface energy (C), as follows:
where H = 0.0019 m, which is the height of the pool, R is the radius from to , Md is the mass of the droplet, Vi the impact velocity, and γ the surface tension. The velocity is evaluated between 0.86–3.37 (m/s), as a minimum and maximum value, the Table 1 shows the values of density and surface tension. Figure 13 shows these energies using the average drop flying velocities, the drop mass assuming a spherical geometry, the liquid’s surface tension, the dimple depth H, and its radius R, both read from the records of the former reported mathematical model in the steel case [20,21]. This plot shows the energies corresponding to water and liquid steel at 1550 °C and helps compare both splashing dynamics. It is seen that at slow impacts, gravitational and surface values are similar.

Figure 12.
Side view of the typical deformation in a liquid pool. Where H is the dimple depth and R the radius.
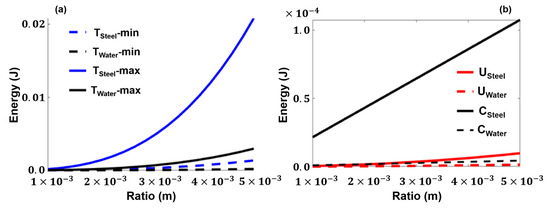
Figure 13.
Collection of plots showing the relationship between the droplet radius and its energies for both steel and water: (a) kinetic energy (T), represented in blue for steel and black for water; (b) potential energy (U), shown as a continuous red line for steel and a dashed red line for water; and surface energy (C), depicted as a black line for steel and a black dashed line for water, in the same figure.
3.3. Splat Dynamics
Once a droplet splashes and is ejected from the tundish, it travels through the air until it impacts one of the tundish walls. In the case of liquid metal, it forms a splat upon contact, whereas in the model, it simply creates an adhered water droplet. Due to its closed geometry, only a few water droplets impact the model walls when using TI1. The population of droplets impacting the walls with TI1, after the water covers the floor (5.3 s on average), is reported in Figure 14a–c for tundish-filling rates of 30, 46, and 60 L/min, respectively. The results indicate that the droplet population is independent of the filling rate and, from the perspective of casting floor safety, TI1 provides a safer environment.
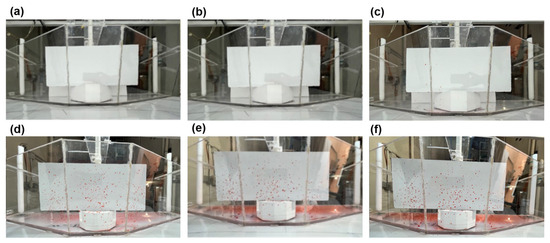
Figure 14.
Collection of images showing the splashing droplet on the back wall model, using both turbulence inhibitors: (a) TI1 at 30 L/min, (b) TI1 at 46 L/min, (c) TI1 at 60 L/min; (d) TI2 at 30 L/min, (e) TI2 at 46 L/min, and (f) TI2 at 60 L/min.
On the other hand, the number of droplets impacting the tundish walls when using TI2 is considerably higher than with TI1, as shown in Figure 14d–f for tundish-filling rates of 30, 46, and 60 L/min, respectively, with an average time of 5.9 s. Although splashing and droplet ejection with TI2 greatly exceed the corresponding splash intensity observed with TI1, most of the droplets impact the tundish back wall. Since the operators are positioned on the opposite side, near the tundish front wall, safety concerns are mitigated. Additionally, having the droplet population concentrated on the back walls ensures that the outlets remain free from blockage due to steel droplet freezing. Figure 15 shows that the droplet population is practically independent of the tundish-filling rate, indicating that TI2 exhibits a more stable behavior under different conditions.

Figure 15.
Plot of the population as a function of the flow rate for both turbulence inhibitors. For TI2, the flow rate does not significantly affect the droplet population, resulting in predictable behavior. In contrast, TI1 exhibits less predictability under the same conditions.
When a droplet impacts a surface, it can either remain intact or break apart due to inertial forces affecting its stability. The stability of the droplet or splat on the tundish wall or model depends on several factors, including the liquid’s physical properties, the system’s temperature, the substrate’s smoothness, and its wettability characteristics.
A droplet, whether water, liquid metal, or any other liquid with intermediate properties, will produce stable impact patterns and shapes, as shown in Figure 16a–c. The conditions leading to these patterns can be evaluated through a balance of the free energy involved, as expressed in the following equation [22]:
where ΔFhole is the free energy change of film with a hole, γlg liquid-gas surface tension, γsl solid-liquid surface tension, Ai surface area of intact liquid film, r1 dimensionless hole radius at solid surface, r2 the hole radius at liquid’s free surface, and S the hole surface area.

Figure 16.
Side view of the typical droplet pattern, characteristic of any liquid impacting a solid rigid surface. r1 represents the ratio measured at the base of the cavity formed by the droplet impact, while r2 corresponds to the ratio in the upper zone of the cavity; h is the high of the liquid film and θ is the contact angle. (a) a small θ and a large S result in a stable film, (b) an intermediate θ with a small S deliver an unstable film and (c) large θ and a large S result in a stable film.
Using the Young’s Equation [23,24] in Equation (9) yields:
If ΔF < 0, the hole formed in an unstable droplet will expand. If ΔF > 0, the hole will spontaneously close, and the film will remain stable. Therefore, S must be greater than the other subtracting terms in parentheses.
The surface area, S, can be calculated using the following expression [25]:
S is large if the angle θ approaches 0° or 180°, which corresponds to the cases of water and well-deoxidized steel. From this perspective, it can be concluded that water can be used to model the splat phenomena of steel droplets. A dimensionless version of Equation (10) is:
The ratio r2/r1 is given by:
The relationship between r2 and r1 is:
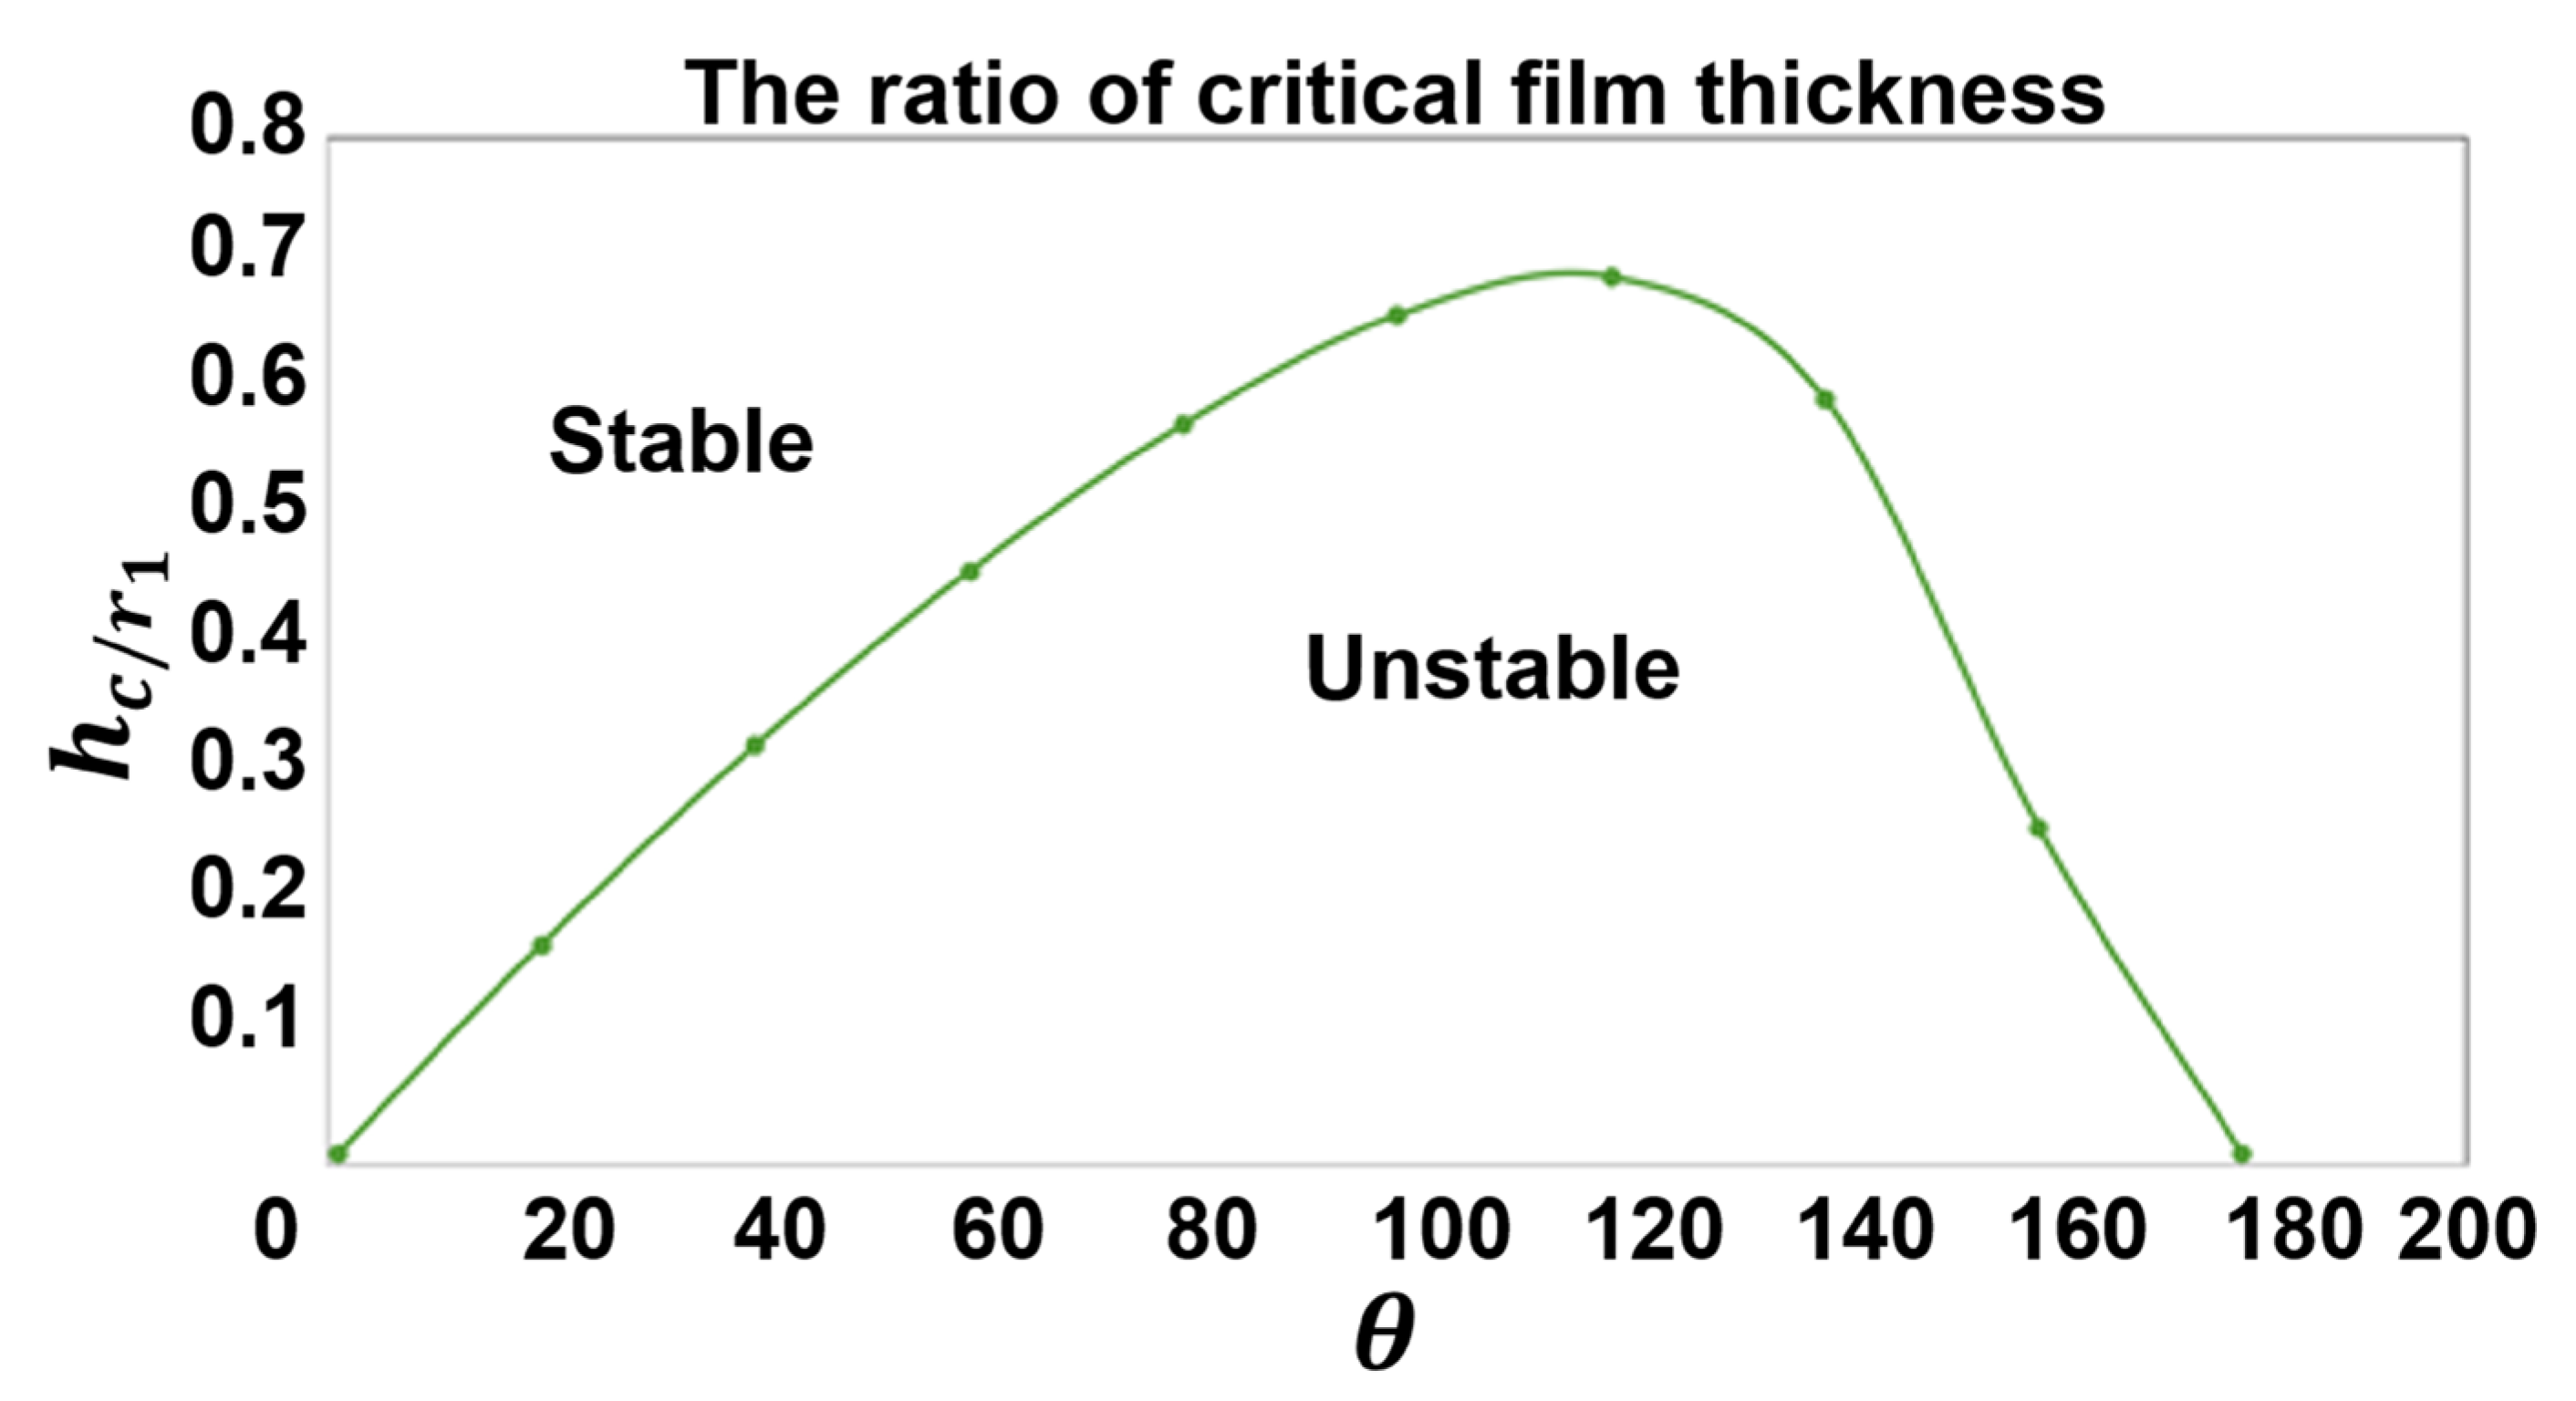
Using Equations (13)–(15) in Equation (12), the dimensionless free energy plot is shown in Figure 17. The film is stable if it is thick, approximately on the order of magnitude of the hole size (h/r1 = 1). However, if the film thickness is small (h/r1 = 0.1), it becomes unstable except at the two extremes of 0° and 180°. The regions of stable and unstable film thickness are determined by setting ΔF = 0 in Equation (12) and combining the result with Equations (13) and (15), allowing the estimation of hc, i.e., the critical film thickness. Figure 18 shows the dimensionless critical film thickness as a function of the contact angle. When this angle is 118°, the critical film thickness reaches its maximum value. Therefore, metal droplets (with large contact angles) and water droplets (with small contact angles) will develop stable films.
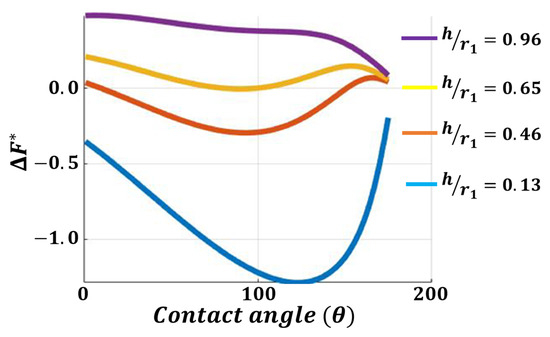
Figure 17.
Dimensionless free energy, ΔF*, associated with the formation of a single hole as a function of the contact angle, θ, for different values of h/r1.
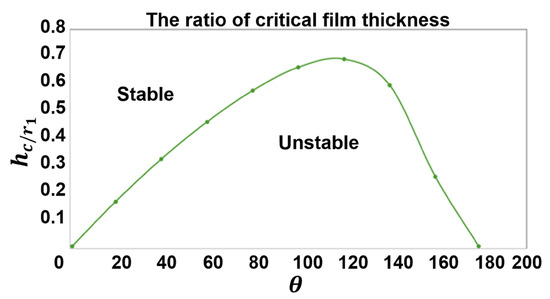
Figure 18.
The stable and unstable region for the critical film thickness as a function of the contact angle.
In the case of molten metals, when a droplet impacts a wall, the liquid spreads, increasing the diameter of the splat. However, under heat transfer conditions, the spreading rate decreases. As the splat cools and solidifies, these processes experience further delays in spreading, resulting in the formation of a solid ring around it. This ring acts as a local barrier, preventing the liquid from spreading further from the splat’s center.
The splat’s spreading and the stability of its film depend on several factors, including the wall’s roughness and temperature, the liquid’s surface tension, and the contact angle between the liquid and the wall. Higher wall temperatures promote droplet spreading, while greater roughness enhances the system’s wettability. The spreading ratio is defined as Rmax/R0, where Rmax is the maximum disk spread radius, and R0 is the original droplet radius. The dynamic effects are expressed through the Reynolds and Weber numbers [26].
where β is the spreading ratio and θd is the dynamic contact angle.
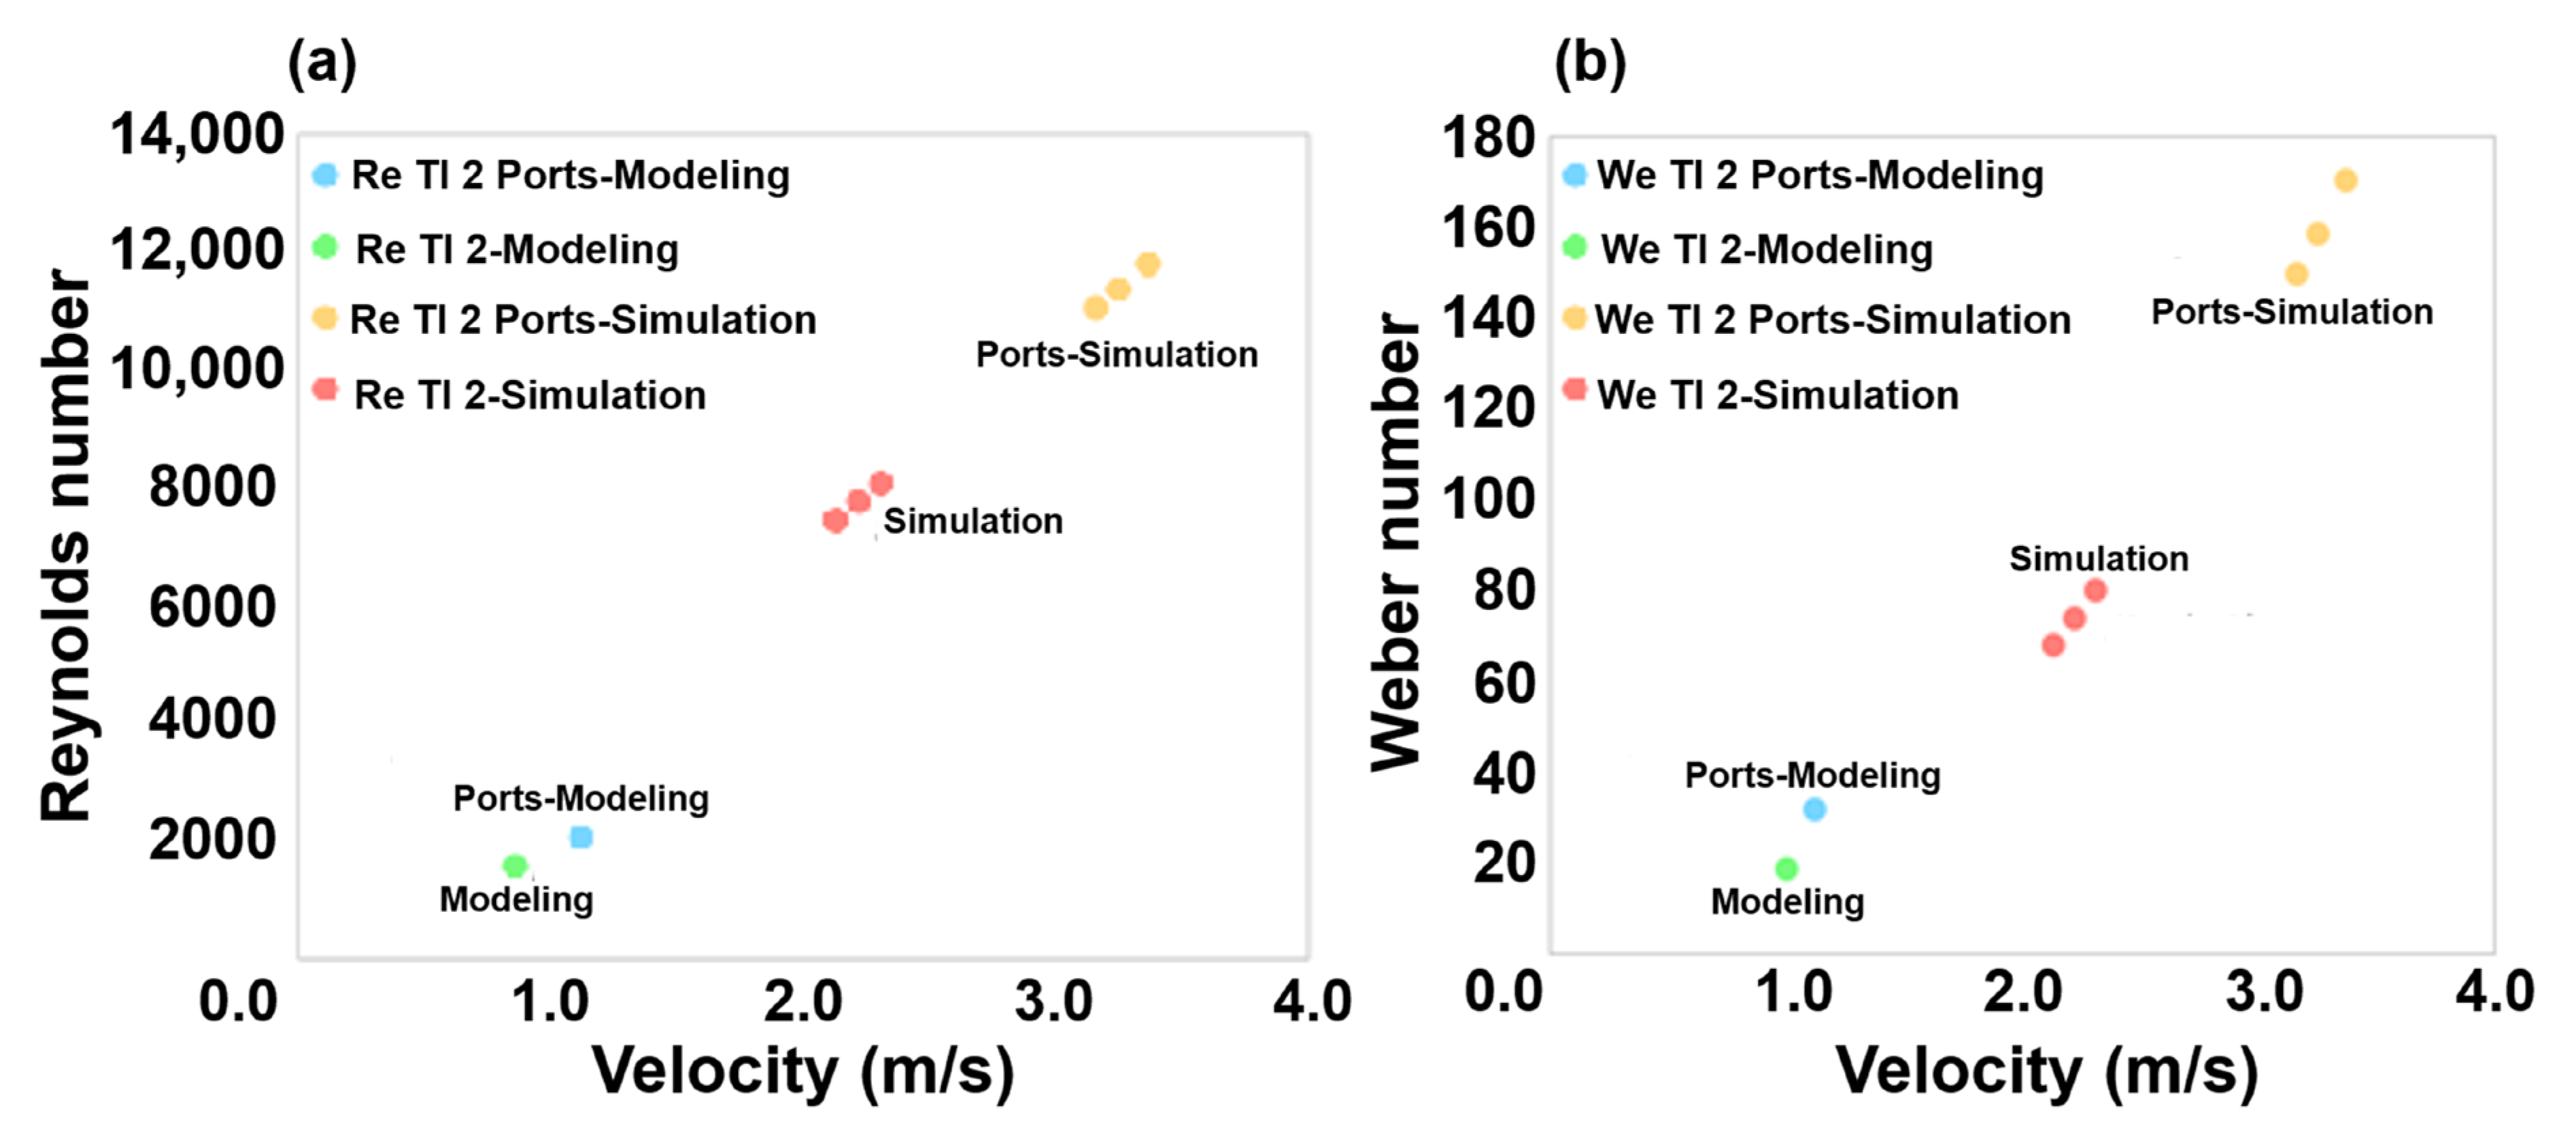
For the case of TI2, the relationships between the Reynolds and Weber numbers and the average droplet velocities through the ports and the upper open mouth, at the conventional tundish filling rate, are shown in Figure 19a and 19b, respectively. The Reynolds and Weber numbers for liquid steel, estimated from the velocities obtained through the mathematical model in the first paper [7], are approximately one order of magnitude higher than those for water. This difference arises because the velocities in the water model are scaled down according to the Froude similarity criterion.
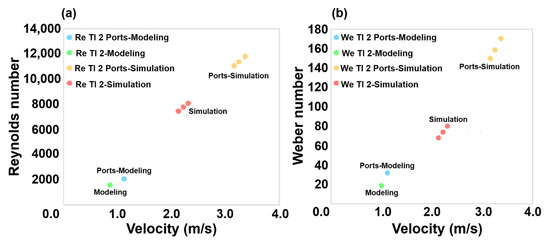
Figure 19.
Comparison of the dimensionless numbers measured for droplets in different zones: (a) Reynolds number in the simulation, where RED represents droplets in the upper mouth zone and YELLOW represents droplets in the ports zone. For the model: GREEN corresponds to measurements in the upper mouth zone, and BLUE corresponds to measurements in the ports zone. On the other hand, (b) shows the comparison of the Weber number for the same droplets. As observed, there is a linear relationship between the behavior of steel droplets and water droplets.
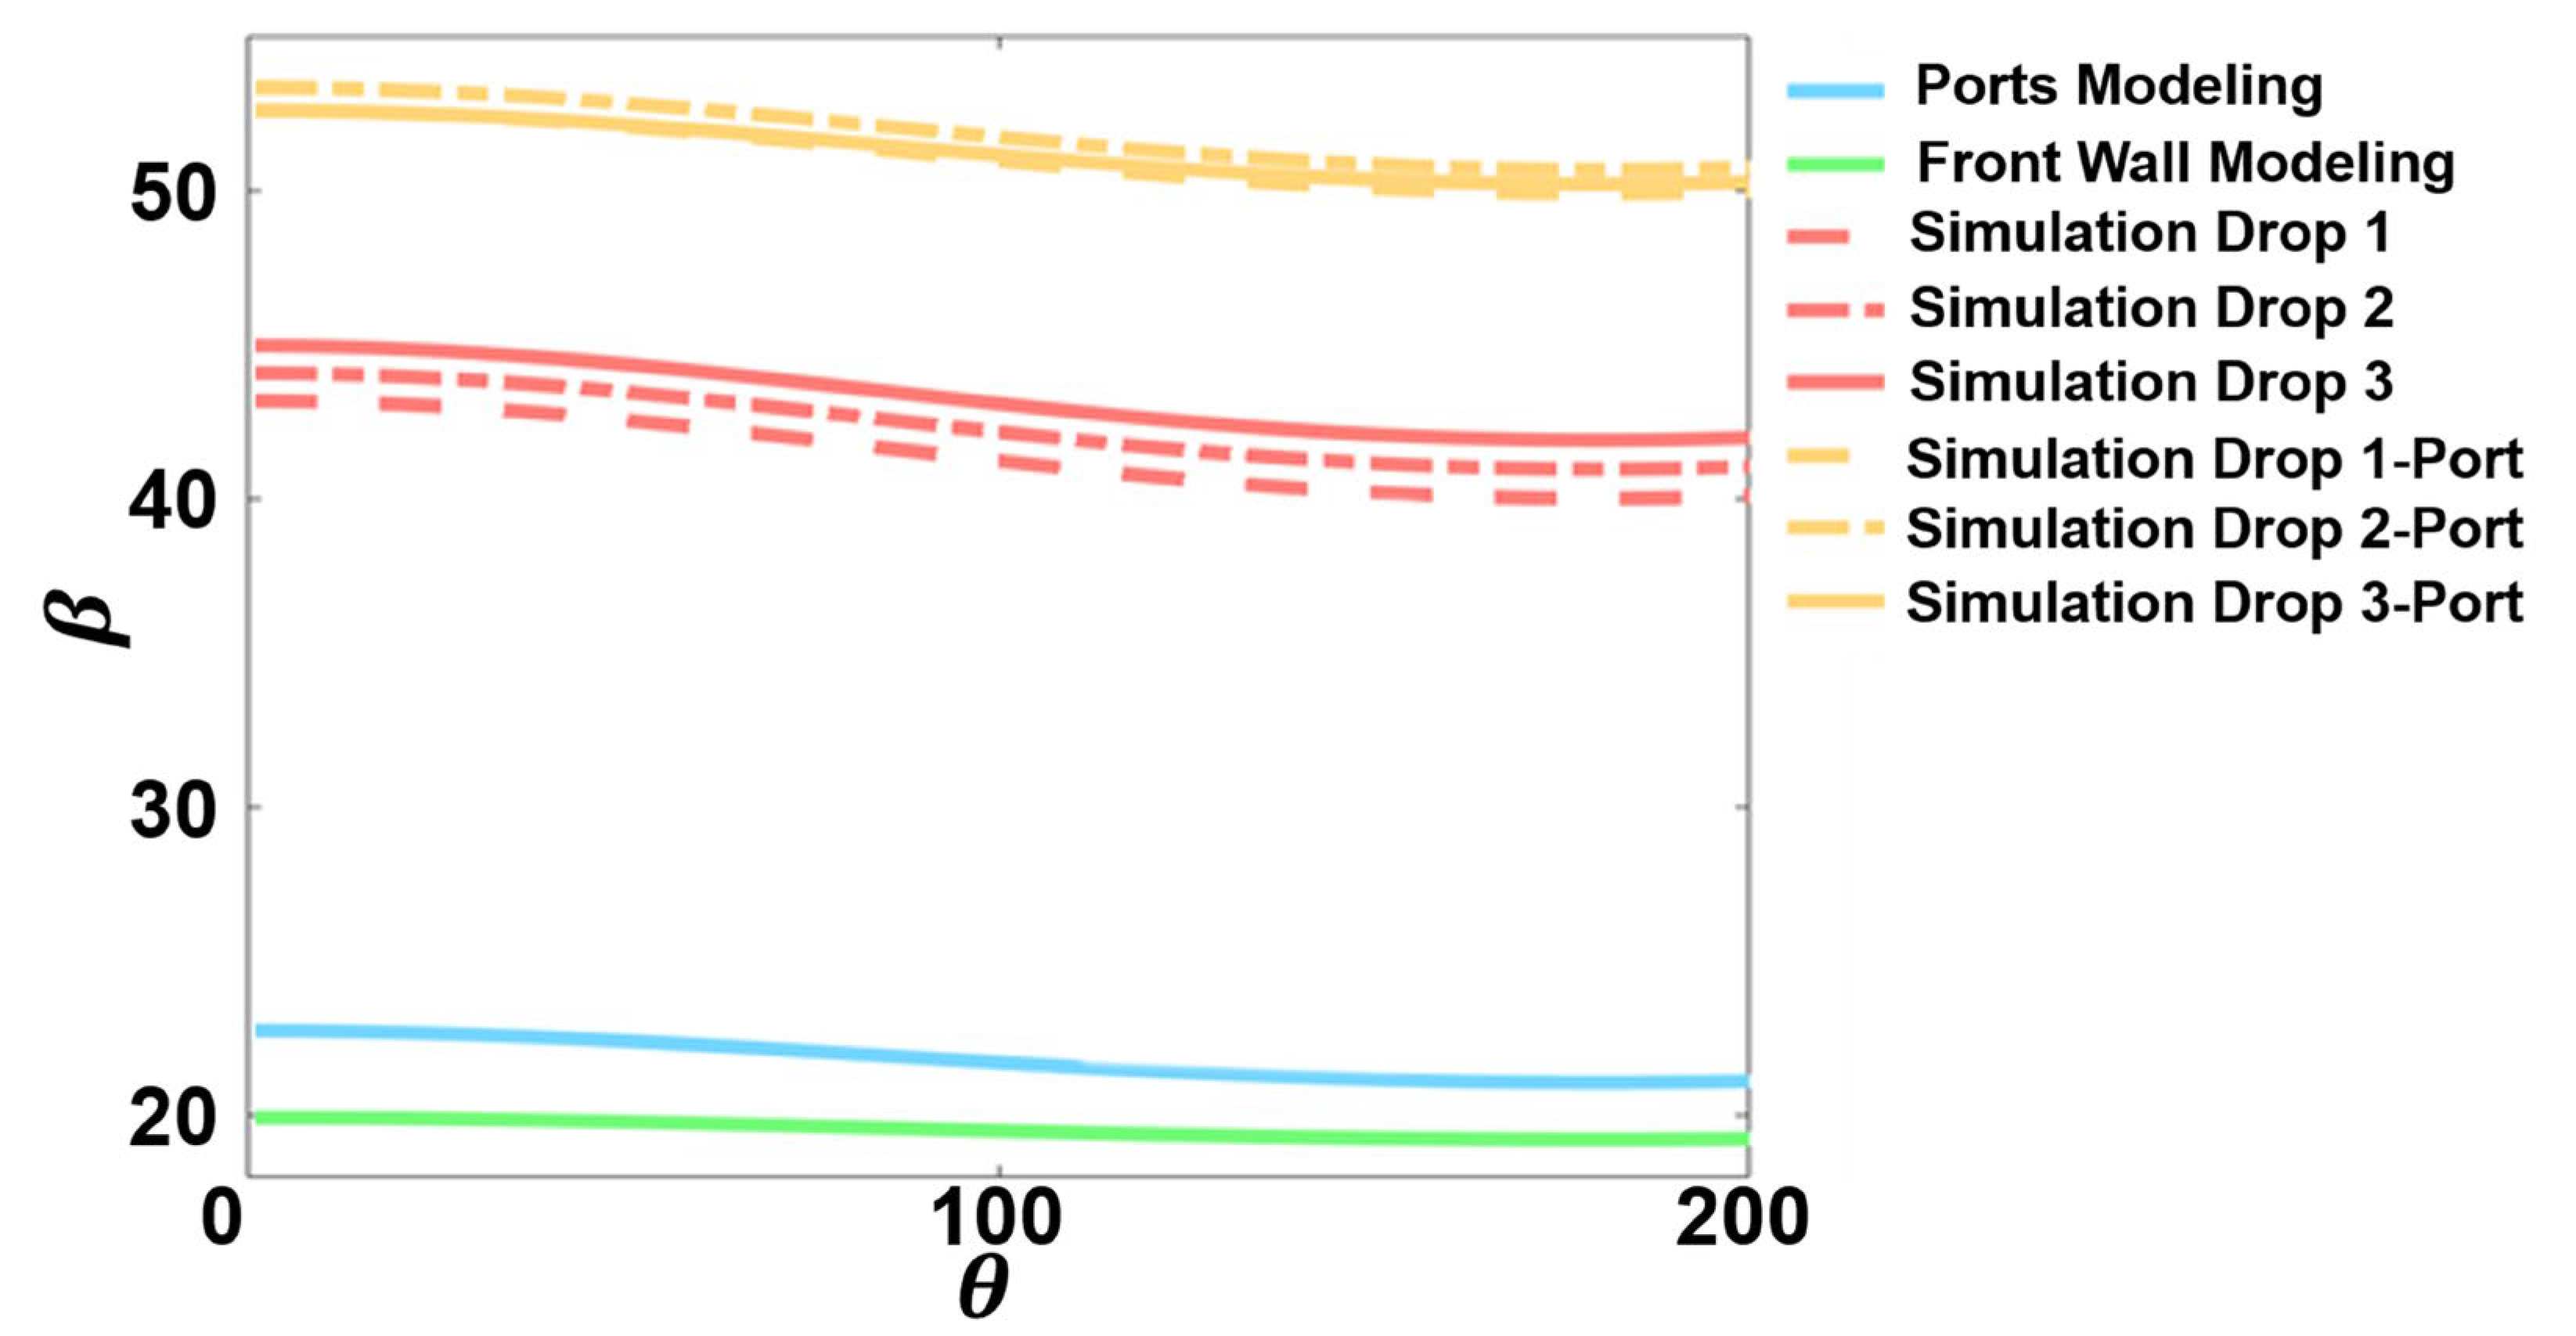
Using these data, the spreading ratios for both liquids, calculated through Equation (16), are presented in Figure 20.
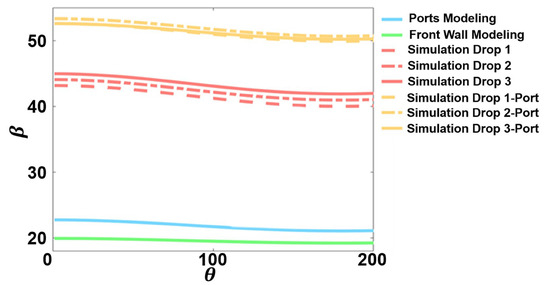
Figure 20.
The spreading ratio as a function of the dynamic contact angle for the same droplets measured in Figure 19. The modeled water droplets (green and blue lines) and the simulated steel droplets (red and yellow lines).
According to the results and their discussion presented above, it can be said that the splat phenomena between liquid and water maintain some similarities regarding film stabilization.
4. Conclusions
The flow dynamics of liquid jets impacting on solid surfaces of two turbulence inhibitors observed during the start of a continuous casting sequence are modeled using a water model, and the conclusions based on the found results are as follows:
The liquid jet impacts the solid surfaces, developing a crown type of fluid flow pattern at the first instant of the start casting operation. TI1 developed a bigger one than the TI2, and the reason for this was the concavity of the floor of each TI.
Due to its geometry, TI1 forms a deep pool in which droplets continuously splash until they reach the overfill. Splashing kinetics is governed by the balance among gravitational, kinetic, and surface energies. TI2 drains the feeding liquid through the two ports implemented in its geometry. Hence, the formation of a pool is not possible, but this way, TI2 used the kinetic energy of the jet to fill the tundish floor.
Despite TI2 generating more splashing on the tundish back wall compared to TI1, it exhibits more stable behavior under different flow rates, whereas TI1 does not. This stability provides greater reliability to the process. A possible redesign of the TI2 bottom could mitigate this phenomenon, opening a new line of research.
In contrast to TI1, TI2 demonstrates better management of the kinetic energy of the steel jet from the ladle. As shown in previous studies, TI2 effectively utilizes the kinetic energy of the jet to initiate tundish floor coverage more efficiently. In contrast, TI1 does not exhibit proper fluid handling.
The splat phenomenon occurs when a liquid impacts on a solid surface, and the surface tensions between the liquid, gas, and solid phases primarily influence it. The free energy involved in this process suggests that liquid-solid systems with poor and high wettability tend to form stable liquid films. This is particularly evident when water meets transparent plastic or when liquid steel interacts with the tundish lining refractories.
The spreading of liquid splats is governed by the fluid flow dynamic factor of the droplet interpreted through the Reynolds and Weber numbers.
The presence of small droplets results in a larger surface area for the same volume, thereby increasing steel reoxidation and consequently leading to the formation of more inclusions. However, in the case of TI2, this disadvantage is less significant due to the way the kinetic energy of the flow is utilized to minimize surface flow areas.
Droplet size is a crucial factor in preventing the reoxidation of molten steel and avoiding the blockage of any strand if a droplet reaches an outlet. In the case of TI2, all droplets were directed toward the back wall, ensuring a safer start to casting. Additionally, the quantity and size of the droplets become less critical if the steel flow has a smaller surface area, as this minimizes the reoxidation process and accelerates cooling. A smaller surface area results in reduced heat loss.
Author Contributions
Conceptualization, O.F.J. and R.M.D.; Data curation, J.R. and A.N.-B.; Formal analysis, J.R. and A.N.-B.; Investigation, O.F.J. and R.M.D.; Methodology, O.F.J., J.R. and R.M.D.; Project administration, J.F.M.V. and J.G.; Resources, J.F.M.V. and R.M.D.; Software, J.R. and J.G.; Supervision, O.F.J. and J.G.; Validation, O.F.J.; Visualization, J.R. and R.M.D.; Writing—original draft, O.F.J. and R.M.D.; Writing—review and editing, O.F.J. and J.F.M.V. All authors have read and agreed to the published version of the manuscript.
Funding
This research received no external funding.
Data Availability Statement
The original contributions presented in the study are included in the article. Further inquiries can be directed to the corresponding authors.
Acknowledgments
The authors thank the institutions Consejo Nacional de Ciencia y Tecnologia (CONACyT), Universidad Autónoma de Coahulila (UAdeC), UPIIZ, and Instituto Politécnico Nacional (IPN) for their support of this research.
Conflicts of Interest
Author Javier Guarneros was employed by the company K&E Technologies. The remaining authors declare that the research was conducted in the absence of any commercial or financial relationships that could be construed as potential conflicts of interest.
References
- Worthington, A. On the Forms Assumed by Drops of Liquids Falling Vertically on a Horizontal Plate. Proc. R. Soc. Lond. 1876, 25, 261–271. [Google Scholar] [CrossRef]
- Grzegorz, T.; Jerzy, P.; Tadeusz, W.; Mariusz, P. Druk Strumieniowy Jako Metoda Wytwarzania Elastycznych Obwodów Drukowanych. In Proceedings of the 38th International Conference of IMAPS-CPMT, Rzeszów-Czarna, Poland, 21–24 September 2014. [Google Scholar]
- Baron, D.; Su, H.; Vaidya, A. Splash Dynamics of Paint on Dry, Wet, and Cooled Surfaces. Fluids 2016, 1, 12. [Google Scholar] [CrossRef]
- Mandalahalli, M.M.; Wagner, E.C.; Portela, L.M.; Mudde, R.F. Electrolyte Effects on Recirculating Dense Bubbly Flow: An Experimental Study Using X-Ray Imaging. AIChE J. 2020, 66, e16696. [Google Scholar] [CrossRef]
- Josserand, C.; Thoroddsen, S.T. Drop Impact on a Solid Surface. Annu. Rev. Fluid Mech. 2016, 48, 365–391. [Google Scholar] [CrossRef]
- Ren, W.; Foltyn, P.; Geppert, A.; Weigand, B. Air Entrapment and Bubble Formation During Droplet Impact onto a Single Cubic Pillar. Sci. Rep. 2021, 11, 18018. [Google Scholar] [CrossRef]
- Wang, B.; Socolofsky, S.A.; Breier, J.A.; Seewald, J.S. Observations of Bubbles in Natural Seep Flares at MC 118 and GC 600 Using in Situ Quantitative Imaging. J. Geophys. Res. Ocean. 2016, 121, 2203–2230. [Google Scholar] [CrossRef]
- Flores, O.J.; Coronado, R.M.C.; Morales, R.D.; Guarneros, J.; Rodriguez, J.; Nájera, A.B.; Servín, R.C. Comparative Analysis of Liquid Steel Fluid Dynamics, Including Spillage and Spreading on the Bottom of a Three-Strand Tundish Between Two Turbulence Inhibitors at the Start of the Casting Sequence. Metals 2024, 14, 1370. [Google Scholar] [CrossRef]
- Michalesk, K.; Gryc, K.; Socha, L.; Tkadleckova, M.; Satermus, M.; Pieprzyca, J.; Merder, T.; Pindor, L. Study of Tundish Slag Entrainment Using Physical Modelling. Arch. Metall. Mater. 2016, 61, 257–260. [Google Scholar] [CrossRef]
- Harnsihacacha, A.; Piyapaneekoon, A.; Kowitwarangkul, P. Physical Water Model and CFD Studies of Fluid Flow in a Single Strand Tundish. Mater. Today Proc. 2018, 5, 9220–9228. [Google Scholar]
- Sujata, D.; Rajeev, K.S.; Amitava, P. Role of Tundish Argon Diffuser in Steelmaking Tundish to Improve Inclusion Flotation with CFD and Water Modelling Studies. Int. J. Eng. Res. Appl. 2015, 4, 213–218. [Google Scholar] [CrossRef]
- Liu, J.; Zhou, P.; Zuo, X.; Wu, D.; Wu, D. Optimization of the Liquid Steel Flow Behavior in the Tundish through Water Model Experiment, Numerical Simulation and Industrial Trial. Metals 2022, 12, 1480. [Google Scholar] [CrossRef]
- Koria, S.C.; Singh, S. Physical Modeling of the Effects of the Flow Modifier on the Dynamics of Molten Steel Flowing in a Tundish Satish. ISIJ Int. 1994, 34, 784–793. [Google Scholar] [CrossRef]
- Cwudziński, A. Numerical, Physical, and Industrial Experiments of Liquid Steel Mixture in One Strand Slab Tundish with Flow Control Devices. Steel Res Int. 2014, 85, 623–631. [Google Scholar] [CrossRef]
- Sheng, D.-Y.; Chen, D. Comparison of Fluid Flow and Temperature Distribution in a Single-Strand Tundish with Different Flow Control Devices. Metals 2021, 11, 796. [Google Scholar] [CrossRef]
- Ding, N.; Bao, Y.P.; Sun, Q.S.; Wang, L.F. Optimization of Flow Control Devices in a Single-Strand Slab Continuous Casting Tundish. Int. J. Miner. Metall. Mater. 2011, 18, 292–296. [Google Scholar] [CrossRef]
- Tkadlečková, M.; Walek, J.; Michalek, K.; Huczala, T. Numerical Analysis of RTD Curves and Inclusions Removal in a Multi-Strand Asymmetric Tundish with Different Configuration of Impact Pad. Metals 2020, 10, 849. [Google Scholar] [CrossRef]
- Li, S.; Zhang, L.; Ren, Y.; Fang, W.; Yang, W.; Shao, S.; Yang, J.; Mao, W. Transient Behavior of Inclusions During Reoxidation of Si-Killed Stainless Steels in Continuous Casting Tundish. ISIJ Int. 2016, 56, 584–593. [Google Scholar] [CrossRef]
- Fruehan, R.J. (Ed.) Surface Tension (Sec. 2.4.7). In The Making, Shaping, and Treating of Steel: Steelmaking and Refining Volume; The AISE Steel Foundation: Pittsburgh, PA, USA, 1998; pp. 72–75. [Google Scholar]
- Michon, G.; Josserand, C.; Seon, T. Jet Dynamics Post Drop Impact on A Deep Pool. Phys. Rev. Fluids 2017, 2, 023601. [Google Scholar] [CrossRef]
- Chen, C.; Zhong, H.; Liu, Z.; Wang, J.; Wang, J.; Liu, G.; Li, Y.; Zhu, P. Asymmetric Jetting During the Impact of Liquid Drops on Superhydrophobic Concave Surfaces. Micromachines 2022, 3, 1521. [Google Scholar] [CrossRef]
- Dhiman, G. Splashing and Breaking of Droplets Impacting on a Solid Surface. Ph.D. Thesis, University of Toronto, Toronto, ON, Canada, 2009. [Google Scholar]
- Young, T. An Essay on The Cohesion of Fluids. Phil. Trans. R. Soc. 1805, 95, 65–87. [Google Scholar] [CrossRef]
- Makkonen, L. Young’s Equation Revisited. J. Phys. Condens. Matter 2016, 28, 135001. [Google Scholar] [CrossRef] [PubMed]
- Sharma, A.; Ruckenstein, E. Dewetting of Solids by the Formation of Holes in Macroscopic Liquid Films. J. Colloid Interface Sci. 1989, 133, 358–368. [Google Scholar] [CrossRef]
- Pasandideh, F.M.; Qiao, Y.M.; Chandra, S.; Mostaghimi, J. Capillary Effects During Droplet Impact on a Solid Surface. Phys. Fluids 1996, 8, 650–659. [Google Scholar] [CrossRef]


Disclaimer/Publisher’s Note: The statements, opinions and data contained in all publications are solely those of the individual author(s) and contributor(s) and not of MDPI and/or the editor(s). MDPI and/or the editor(s) disclaim responsibility for any injury to people or property resulting from any ideas, methods, instructions or products referred to in the content. |
© 2025 by the authors. Licensee MDPI, Basel, Switzerland. This article is an open access article distributed under the terms and conditions of the Creative Commons Attribution (CC BY) license (https://creativecommons.org/licenses/by/4.0/).