Abstract
The corrosion behavior was investigated for three Al-Mg aluminum alloys (i.e., 5052, 5083 and 5182 aluminum alloys) with different alloying contents in 3.5 wt.% NaCl solution at 35 °C by means of potentiodynamic polarization, electrochemical impedance spectroscopy, immersion test, X-ray photoelectron spectroscopy and microscopy techniques. All alloys spontaneously passivate in the test solution, but the pitting corrosion takes place at the intermetallic phases during the long-term immersion test. The comparative analyses indicate that more Mg and less Cr in aluminum alloys result in increases in the passive current density and the pit depth and decreases in the polarization resistance, the pitting potential and the ratio of Al2O3/Al(OH)3 in the product film. However, the differences in the pitting potentials of the three aluminum alloys are smaller than approximately 22 mV. Their pit depth values are less than 110 μm after 120 days of immersion. The three aluminum alloys have relatively high corrosion resistance in the simulated seawater solution.
1. Introduction
Nowadays, Al-Mg (i.e., 5XXX) series aluminum alloys are increasingly adopted to manufacture marine equipment such as ships due to their low density, high strength, excellent formability, good weldability and remarkable corrosion resistance. Nevertheless, seawater environments have the characteristics of high salinity and humidity and usually are strongly corrosive to metal engineering materials. Therefore, metal materials are prone to corrosion and failure in the marine environment. There is inevitably a concern of corrosion failure (e.g., local perforation) [1,2] for the aluminum alloy components of marine equipment.
Localized corrosion of aluminum alloys is mainly related to the intermetallic phases. They often become the initiation sites in the corrosion processes [3,4]. For Al-Mg series aluminum alloys, the main alloying elements Mg, Mn, Fe, Cr and Si may form intermetallic phases including Al6(Fe,Mn), Al(Fe,Mn,Cr), Al7(Cr,Fe), Al3Fe, Al3Mg2 and Mg2Si [5,6,7,8,9]. Engler et al. [5] analyzed the nucleation and growth processes of these intermetallic phases on the basis of classical precipitation theory. Among them, Al6(Fe,Mn) content is the largest, and Mg2Si is relatively rare. Since the electrochemical activities of Mn, Fe and Cr are lower than that of the Al matrix, the intermetallic phases containing these elements usually act as the cathodic sites in the corrosion process. In the marine environment, the oxygen reduction reaction and the adsorption of Cl- ions occurs easily along the cathodic phases, which eventually result in the breakdown of passive films and the local corrosion of Al matrix [10]. On the other hand, Al3Mg2 preferentially dissolves as an anodic phase because its activity is higher than that of the matrix [11,12]. Li et al. [13] investigated the effect of pH on the corrosion behavior of Al3Mg2, and found that both Al and Mg actively dissolve at pH < 2, Mg selectively dissolves at pH = 3.5~12, and Al3Mg2 becomes the cathodic phase at pH > 12. In addition, Mg2Si is also an anodic phase, but may turn into a cathodic phase with the selective dissolution of Mg and the enrichment of Si [14,15,16].
There have been many reports published on the corrosion behavior of Al-Mg series aluminum alloys with different alloying element contents. Mg plays an important role in the corrosion process of the aluminum alloy [17,18,19,20,21,22,23,24,25]. The pitting and repassivation potentials of Al-Mg alloy in 0.1 mol L−1 NaCl solution decrease by about 80 mV with the change in Mg content from 0.33 to 0.88 wt.%, which indicates that the alloying element Mg slightly enhances the pitting susceptibility [26]. It was also reported that Mg contents in the range of 1 to 5 wt.% have an insignificant influence on the pitting potentials of aluminum alloy in the 0.1 and 1.0 mol L−1 NaCl solutions [19,20]. The pitting potential of Al-Mg-0.5Mn alloy decreases by about 60 mV in the 0.1 mol L−1 NaCl solution with the increase in Mg content from 3.4 to 8.9 wt.% [17]. The small amounts of Cr and Mn are favorable for the corrosion resistance of Al-Mg alloys [18]. Hajar et al. [21] showed that the corrosion rate of the 5083 aluminum alloy is about 0.2 mm y−1 after 30 days of salt spray corrosion at room temperature. Xiao et al. [22] found that the corrosion rate of the 5083 aluminum alloy is about 1.3 mm y−1 after 2 days of a 5% neutral salt spray test. Darmawan et al. [23] compared the corrosion rates of 5052 aluminum alloy in salt spray experiments with different salt concentrations, and obtained a value of about 0.558 mm y−1 after 2 days of test with 5% salt. It is seen from these results of neutral salt spray tests that the corrosion rate of the 5083 aluminum alloy is about twice that of the 5052 aluminum alloy after 2 days of the salt spray test.
At present, as mentioned above, most studies are based on the corrosion of experimental Al-Mg alloys in solutions with different chloride contents or salt spray environments. To our knowledge, there is very limited information about the influence of the main alloying elements on the corrosion of commercial Al-Mg series aluminum alloys in seawater. In this work, the corrosion behavior of three commercial Al-Mg aluminum alloys was investigated in 3.5 wt.% NaCl solution. The effects of alloying elements Mg, Cr and Mn were analyzed on the corrosion resistance. The main purpose is to provide basic data support for their applications in the marine environments.
2. Experimental Section
2.1. Materials
Three types of commercial Al-Mg (i.e., 5XXX) series aluminum alloy plates with a thickness of approximately 2 mm were utilized in the experiments. The chemical compositions are given in Table 1, which was determined by an optical emission spectrometer (SPECTRO MAXx LMM16, Kleve, Germany). The Mg, Cr and Mn contents are different, while the Si, Ti and Fe contents are similar for the alloys.

Table 1.
Chemical compositions of the aluminum alloys (wt.%).
2.2. Electrochemical Measurements
The polarization curve and electrochemical impedance spectroscopy were measured using the PARSTAT4000 electrochemical workstation (Princeton, NJ, USA) in a three-electrode cell, where a platinum plate, a saturated calomel electrode (SCE) and a specimen served as the counter electrode, reference electrode and working electrode, respectively. Each square specimen with a side length of 10 mm was cut, connected with a copper wire and embedded in epoxy resin. Prior to the testing, the working surface was polished sequentially with 600# and 800# emery sandpaper, cleaned with alcohol and distilled water, and then dried with cold air. The 3.5 wt.% NaCl solution was used as the simulated seawater, which was prepared by 35 g of analytical grade NaCl and 965 mL of distilled water. The solution temperature was set at 35 °C.
Polarization curve: After the specimen was immersed in a solution, the open circuit potential (Eocp) was monitored for 1 h to obtain a stable state. Subsequently, the anodic or cathodic polarization curve was measured from the Eocp at a scan rate of 10 mV min−1. For the anodic polarization curve, the testing was stopped when the current density reached 1 mA cm−2. The pitting potential was determined at the point where the current density rapidly increased to 10 μA cm−2 on the curve. For the cathodic polarization curve, the testing was stopped when the potential decreased by 300 mV.
Electrochemical impedance spectroscopy (EIS): In order to observe the corrosion evolution process, a long-term immersion test was conducted for 120 days. EIS was measured at the Eocp once every 10 days by using an alternating current signal with an amplitude of 10 mV (rms) in the frequency range from 99 kHz to 10 mHz. The data were fitted by the ZSimpWin 3.60 software.
2.3. Precipitate and Surface Analyses
The precipitate phase analysis was performed for the three alloys by an X-ray diffractometer (XRD) (D/MAX 2500 V, Tokyo, Japan) with Cu Kα radiation (λ = 0.1541) at 45 kV and 200 mA.
After 120 days of immersion, the specimen surface was observed by using a field emission scanning electron microscope (SEM, Hitachi SU-1500, Tokyo, Japan). The composition of the second phase was determined by energy dispersive spectroscopy (EDS). The corrosion products on the specimen surface were analyzed by X-ray photoelectron spectroscopy (XPS) measurement, which was performed on a Thermo ScientificTM K-AlphaTM+ spectrometer (Waltham, MA, USA) with a monochromatic Al Kα X-ray source (1486.6 eV) at 100 W under a vacuum (<10−8 mbar). The pass energy and step size were 50 and 0.1 eV, respectively, for the high-resolution scanning. All peaks were calibrated using the C1s peak with a binding energy of 284.8 eV. The Avantage software (Version 5.5.2) was used to fit the response peaks. According to the international standard ISO 8407-2021 [27], the specimen was rinsed in a 1000 mL solution prepared with 50 mL of phosphoric acid (ρ = 1.69 g mL−1), 20 g of chromium trioxide and distilled water, and then the pit depth was measured on the surface with an Olympus DSX-510 super depth of field microscope (Tokyo, Japan).
3. Results
3.1. Intermetallic Phases
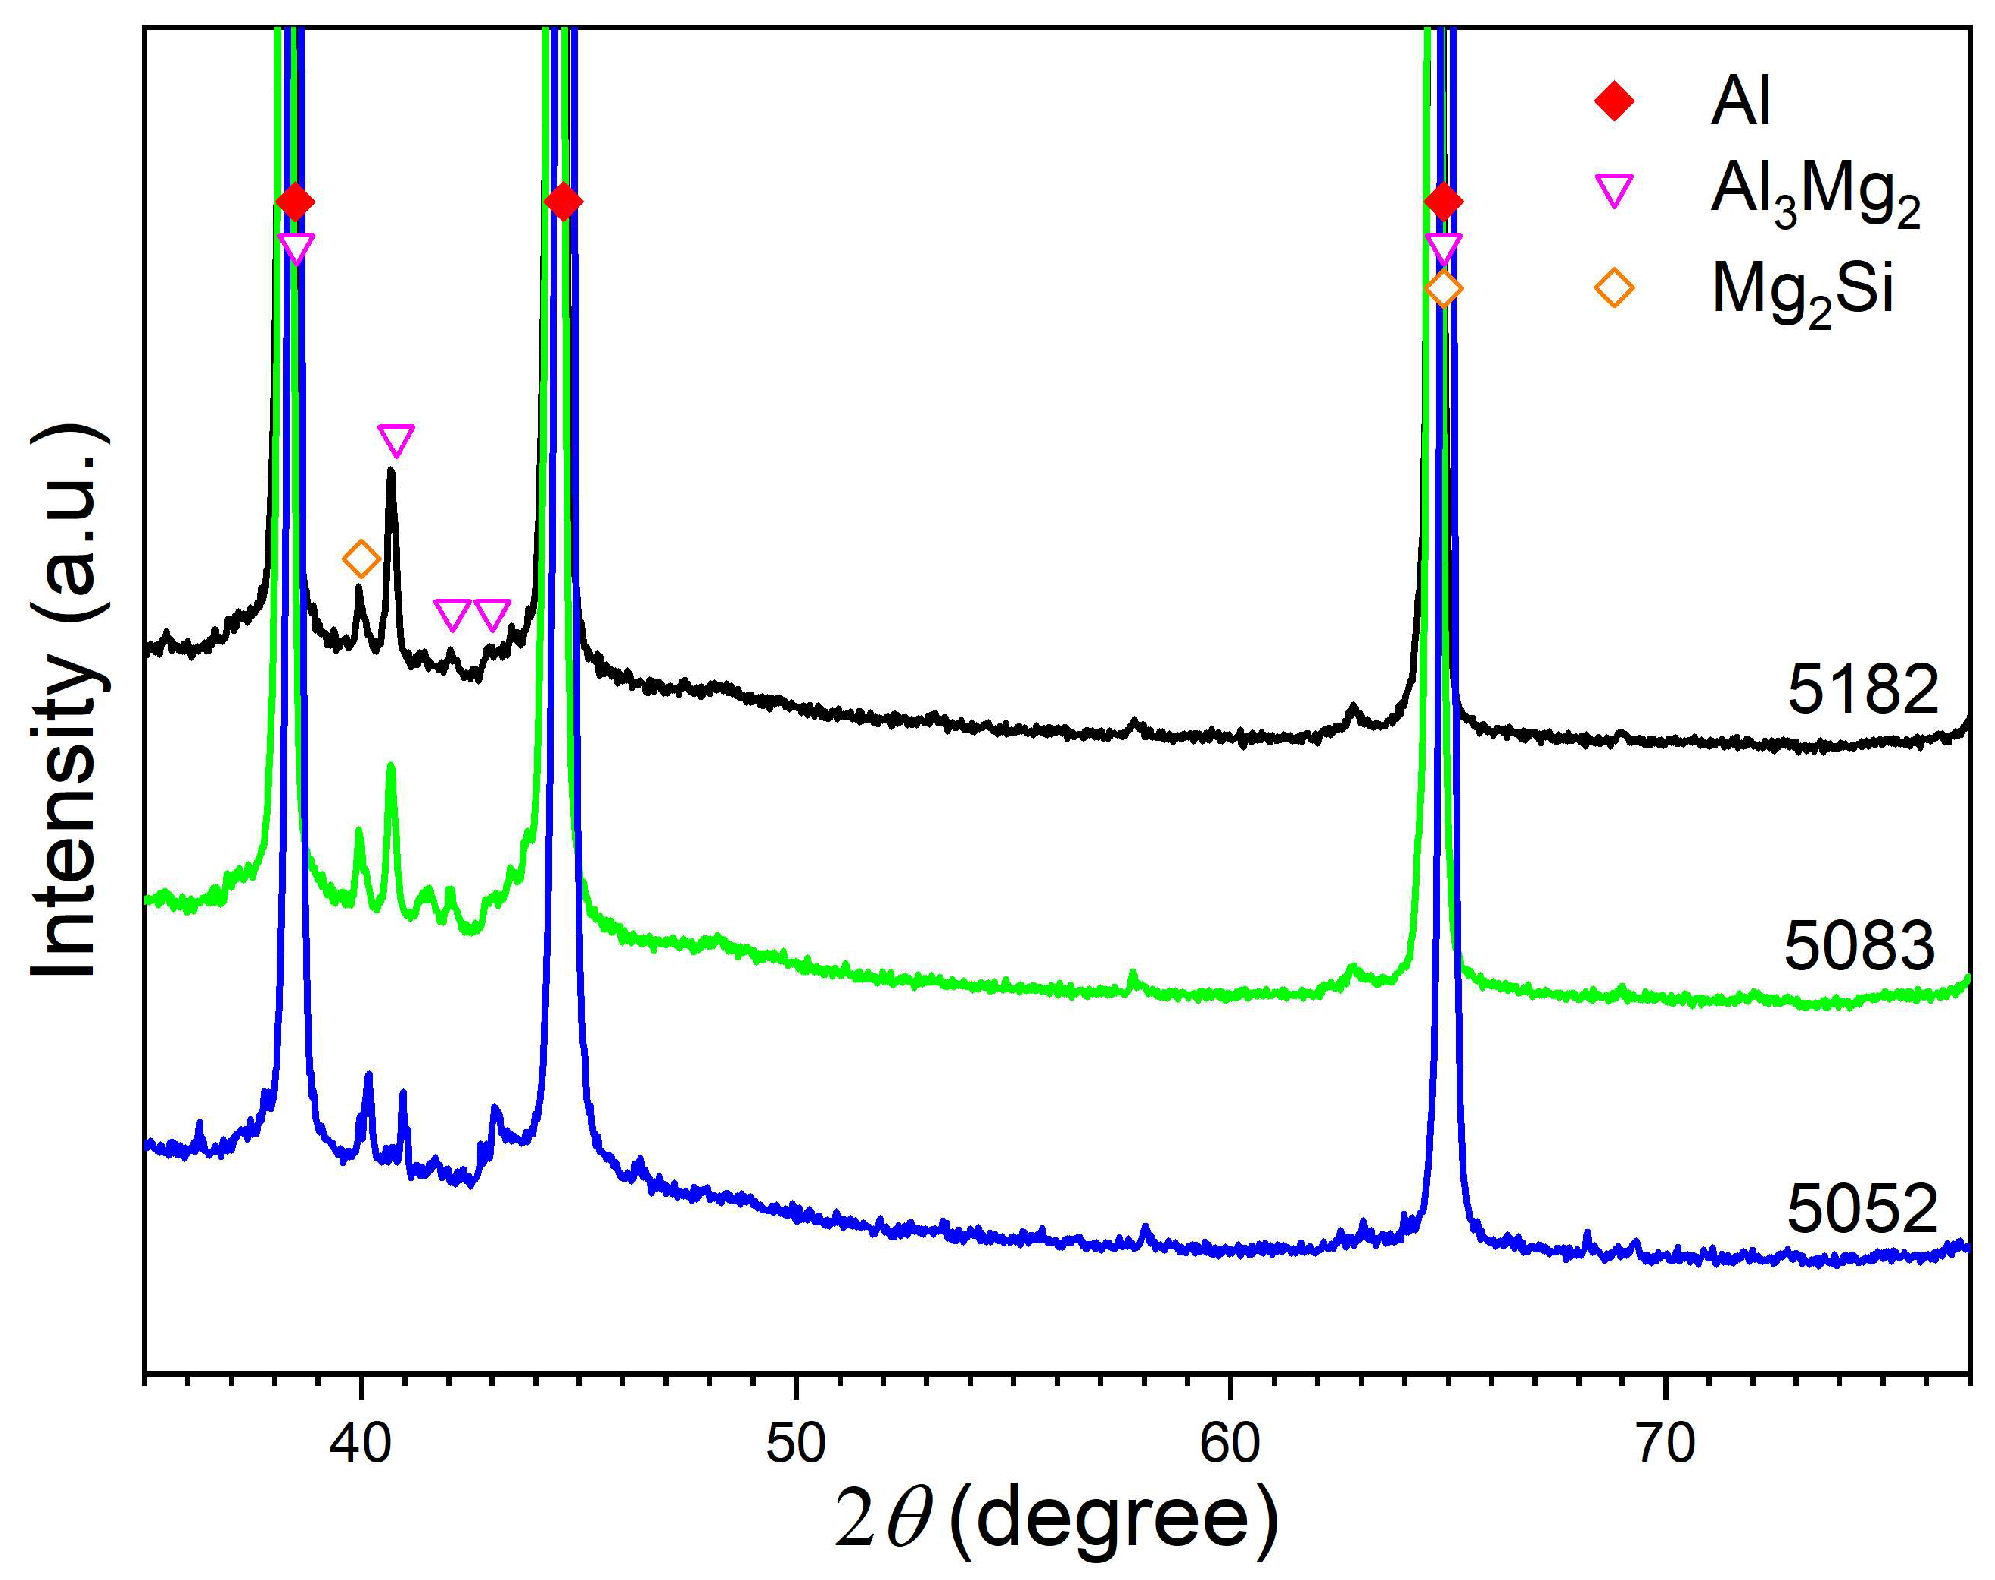
Figure 1 gives the XRD pattens for the three aluminum alloys. It is seen that the main intermetallic phases are Al3Mg2 and Mg2Si in these alloys. There may be small number of other precipitates, which cannot be detected here.
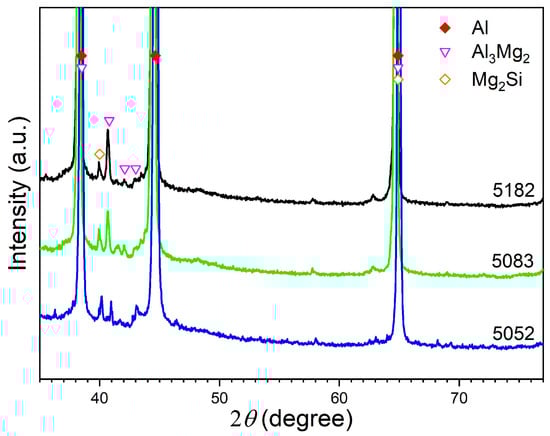
Figure 1.
XRD pattens for the three aluminum alloys.
3.2. Potentiodynamic Polarization Characteristics
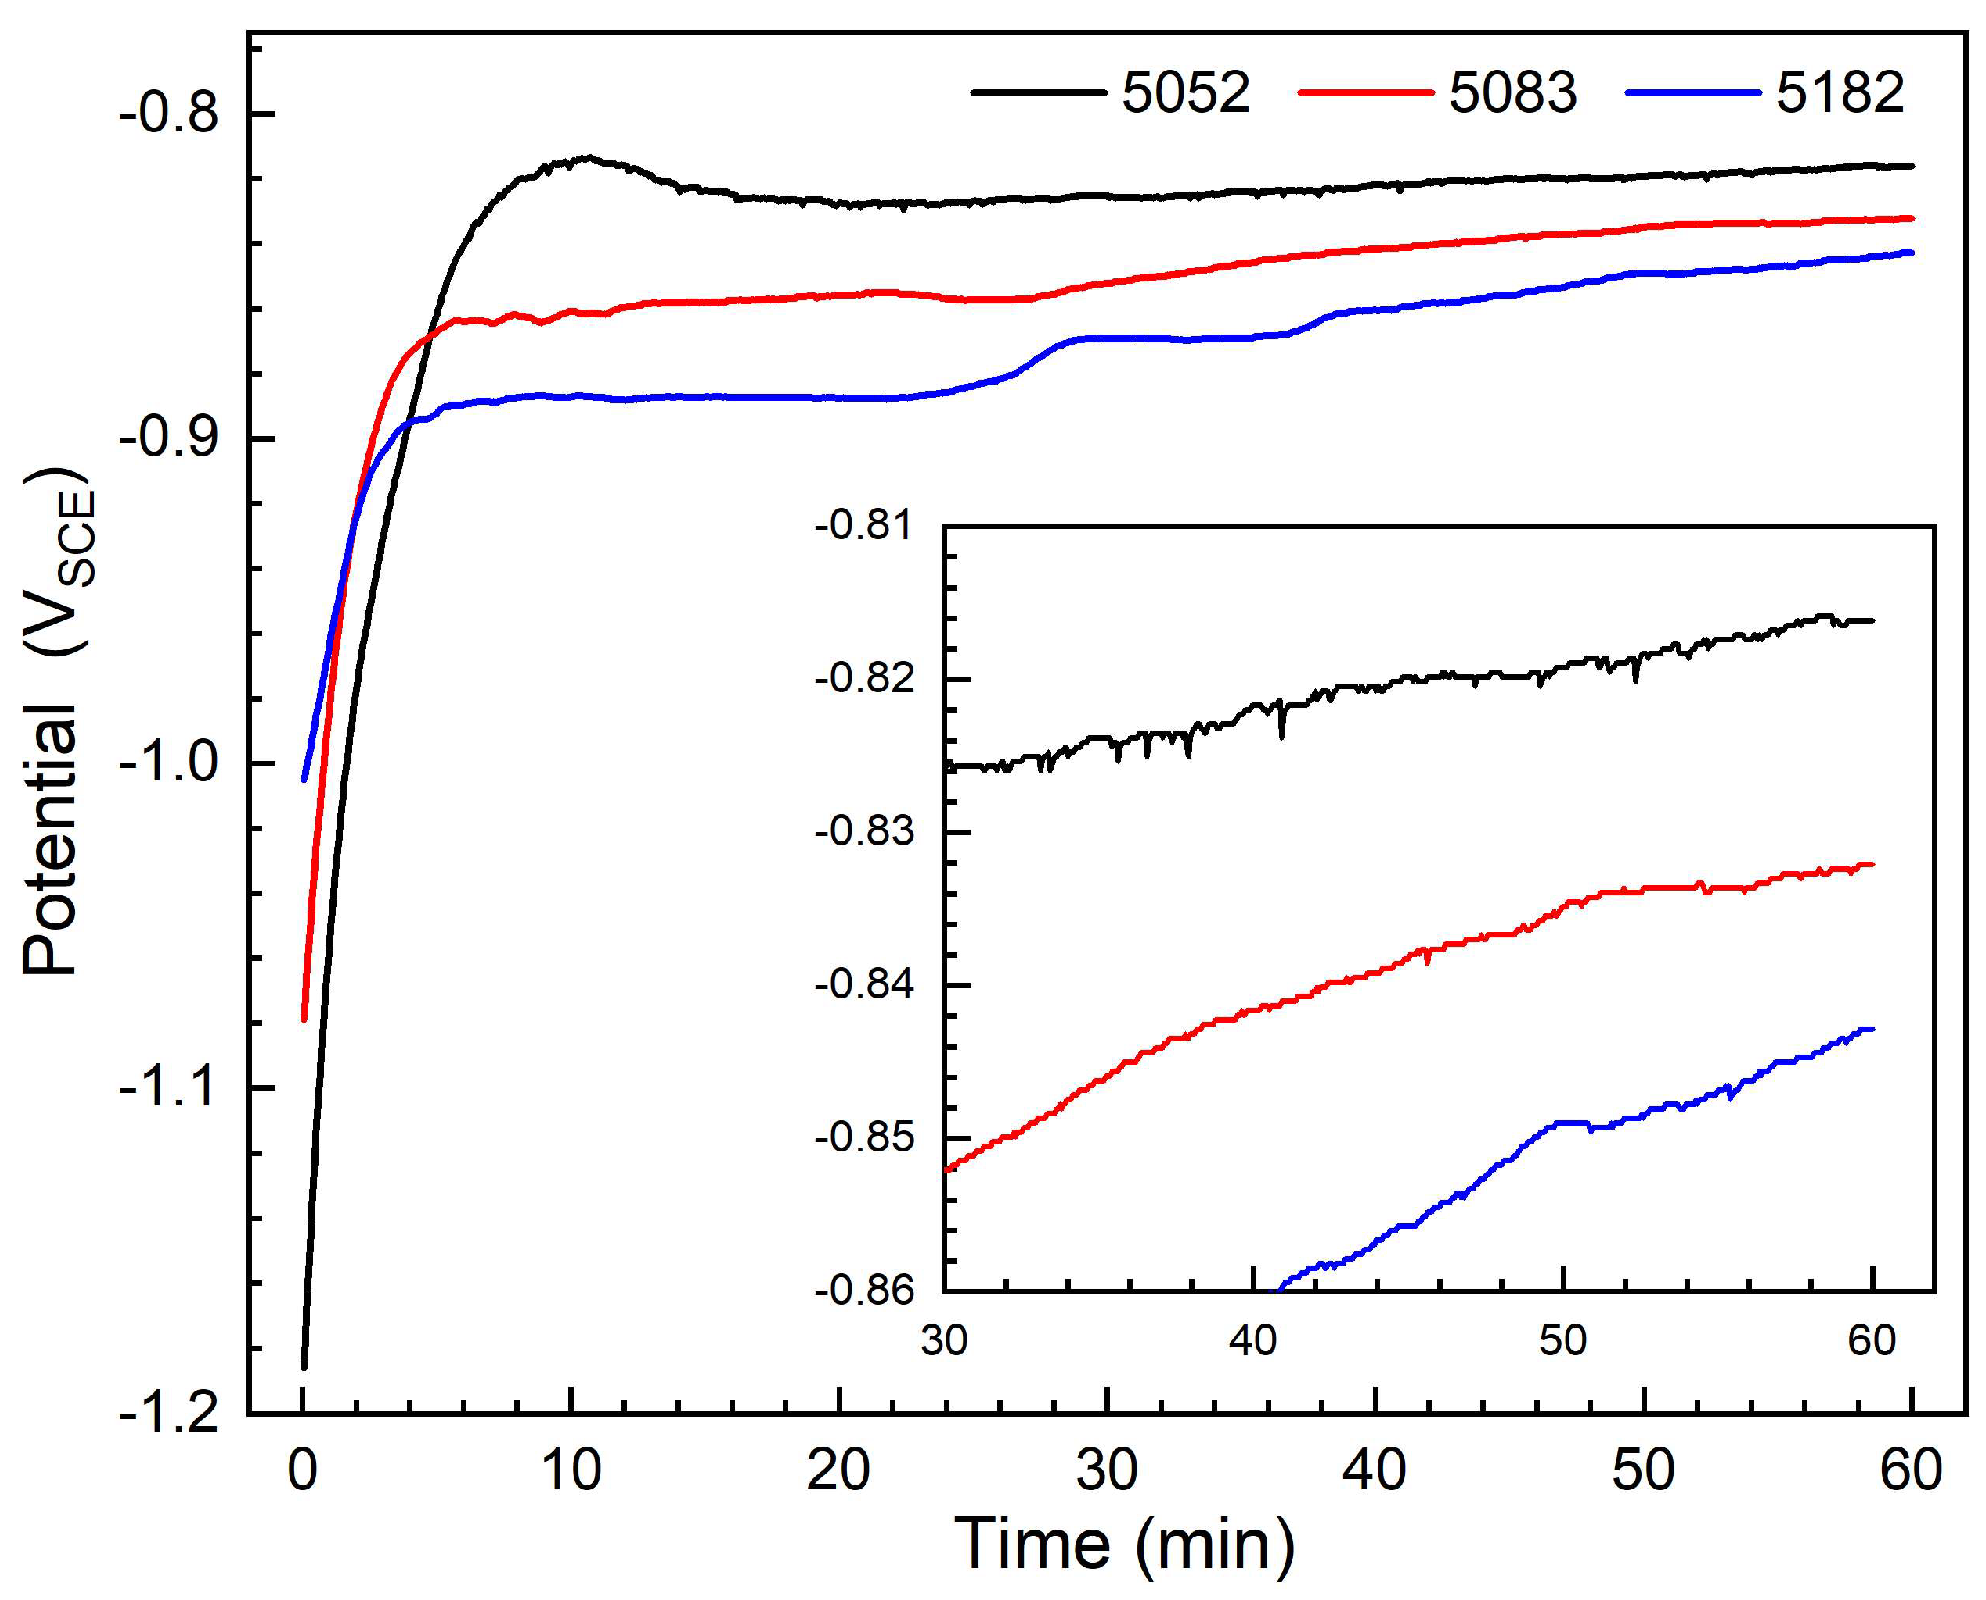
Figure 2 gives the open circuit potentials for the three aluminum alloys in a 3.5 wt.% NaCl solution at 35 °C. The open circuit potentials of all alloys increase rapidly after the immersion in the test solution. This is related to the formation of protective product films (i.e., passive films) on the specimen surfaces. After approximately 5 to 10 min of immersion, the open circuit potentials change slightly for all alloys. After 60 min, the stable open circuit potentials for the 5052, 5083 and 5182 aluminum alloys are approximately −0.817, −0.832, and −0.841 VSCE, respectively. The difference in open circuit potentials is very small, within about 24 mV for the three alloys. This is primarily attributed to the different Mg contents. The potential of the Mg element is more negative (E0(Mg/Mg2+) = −2.34 VSHE), which may cause the negative shift in open circuit potential with increasing Mg content in the aluminum alloy [28]. In addition, the open circuit potentials display some transient fluctuations in the immersion process for all specimens. This can be ascribed to the occurrence of metastable pitting corrosion along the second phases [24]. Of course, except for Mg, the second phases formed by other elements such as Fe also have a certain influence on the open circuit potential [29].

Figure 2.
Open circuit potential curves of the specimens within 60 min of immersion.
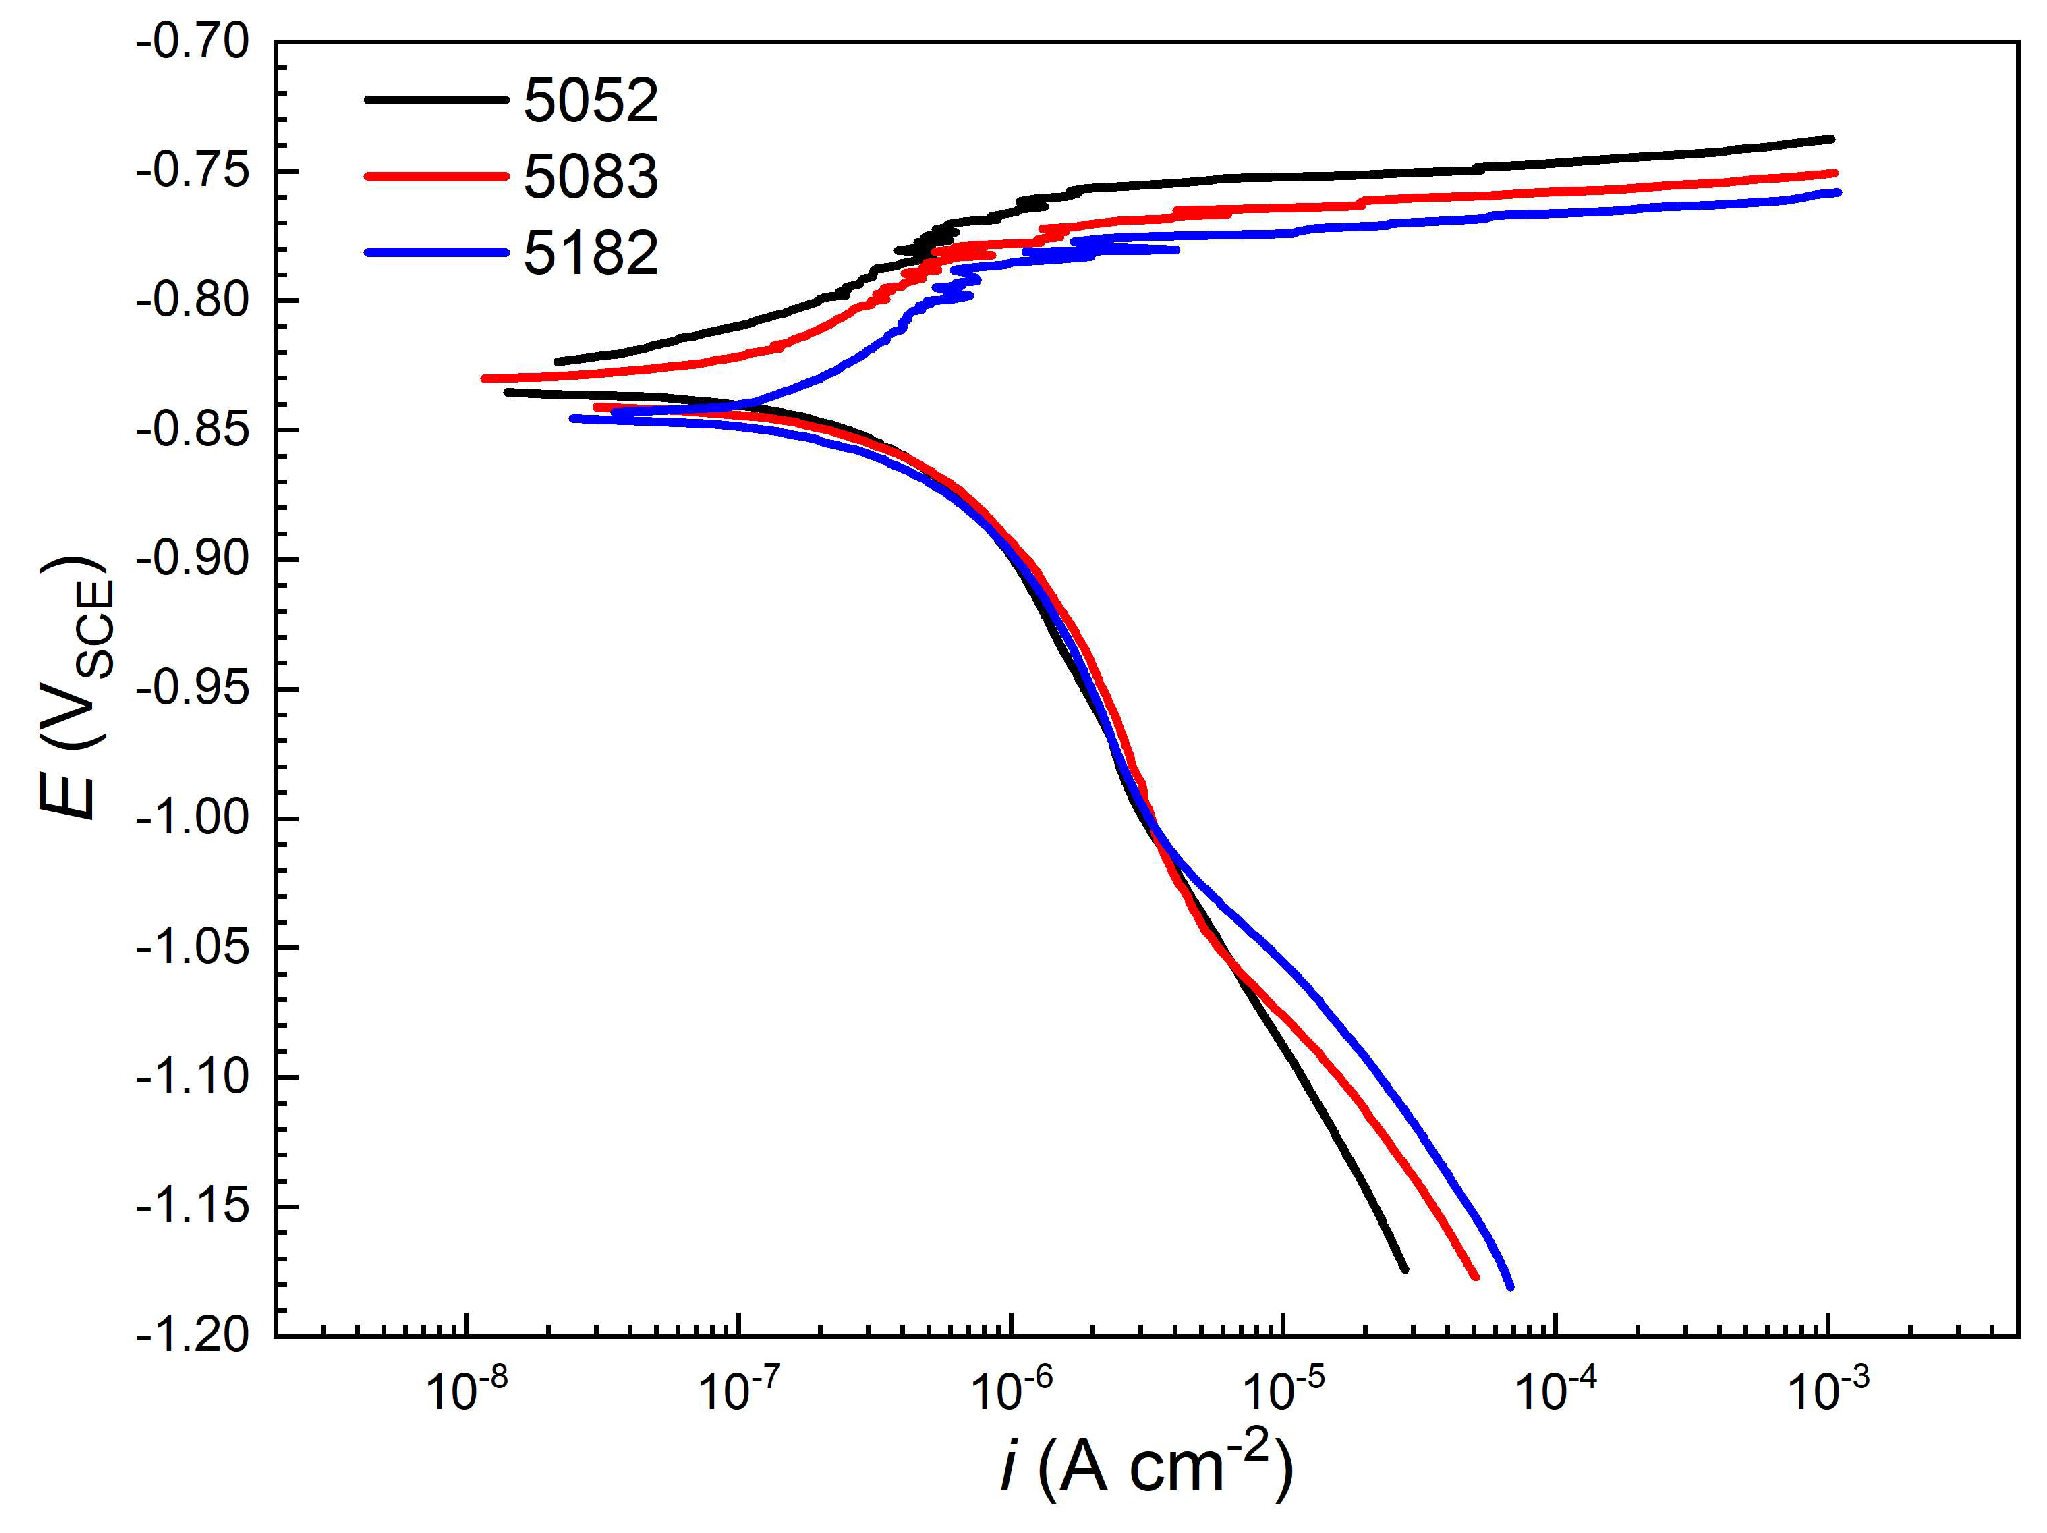
Figure 3 shows the potentiodynamic polarization curves of three aluminum alloys in 3.5 wt.% NaCl solution at 35 °C. Because the anodic and cathodic parts were measured from different specimens, there are very small gaps between them. It can be seen from the anodic polarization curves that the three aluminum alloys spontaneously passivate in the solution, but the passive zones are very narrow, i.e., less than about 70 mV. From the 5052 alloy to 5083 and 5182 alloys, the anodic polarization curve of passive zone shifts slightly to the right because the passive current density sequentially enlarges to some extent. For example, their passive current densities at −0.8 VSCE are about 0.19, 0.31 and 0.47 μA cm−2, respectively. In comparison with the 5052 alloy, the passive current densities of 5083 and 5182 alloys increase by about 63% and 162%. With the increase in electrode potential, the three alloys display some weak current peaks caused by the metastable pitting corrosion. According to the international standard ISO 15158-2014 [30], when the current density continuously increases to 10 μA cm−2, the stable values of pitting potential (Epit) of 5052, 5083 and 5182 alloys are determined as −0.752, −0.764 and −0.774 VSCE, respectively. The pitting potentials of 5083 and 5182 alloys are about 12 and 22 mV lower than that of the 5052 alloy. The pitting corrosion tendency increases slightly in the order of 5052, 5083 and 5182 alloys. It is seen from the cathodic polarization curves that the cathodic reaction is dominated by oxygen reduction for the three aluminum alloys. The cathodic curves almost overlap together above about 1 VSCE, indicating that the oxygen reduction rates are similar on the fresh specimen surfaces of all alloys. For a simple comparison, Table 2 gives the values of electrochemical parameters, i.e., corrosion potential (Ecorr), corrosion current density (icorr) and Epit, obtained from the polarization curves. The Tafel extrapolation was used to determine the icorr value. In comparison with the 5052 alloy, the icorr values of 5083 and 5182 alloys increase by about 34% and 68%. When the electrode potential decreases to about 1 VSCE, the hydrogen evolution reaction clearly takes place, but there is a significant difference in the current density of the hydrogen evolution reaction on the surfaces of the three alloys. In general, the hydrogen evolution rate increases sequentially from 5052 to 5083 and 5182 alloys, which may result from the influence of reduction reactions on the alloy surfaces [31,32].
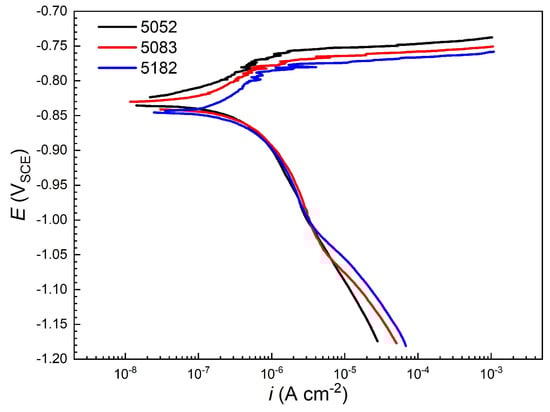
Figure 3.
Polarization curves of the specimens in 3.5 wt.% NaCl solution.
Table 2.
Electrochemical parameter values for the three aluminum alloys.
3.3. Impedance Evolution in the Corrosion Process
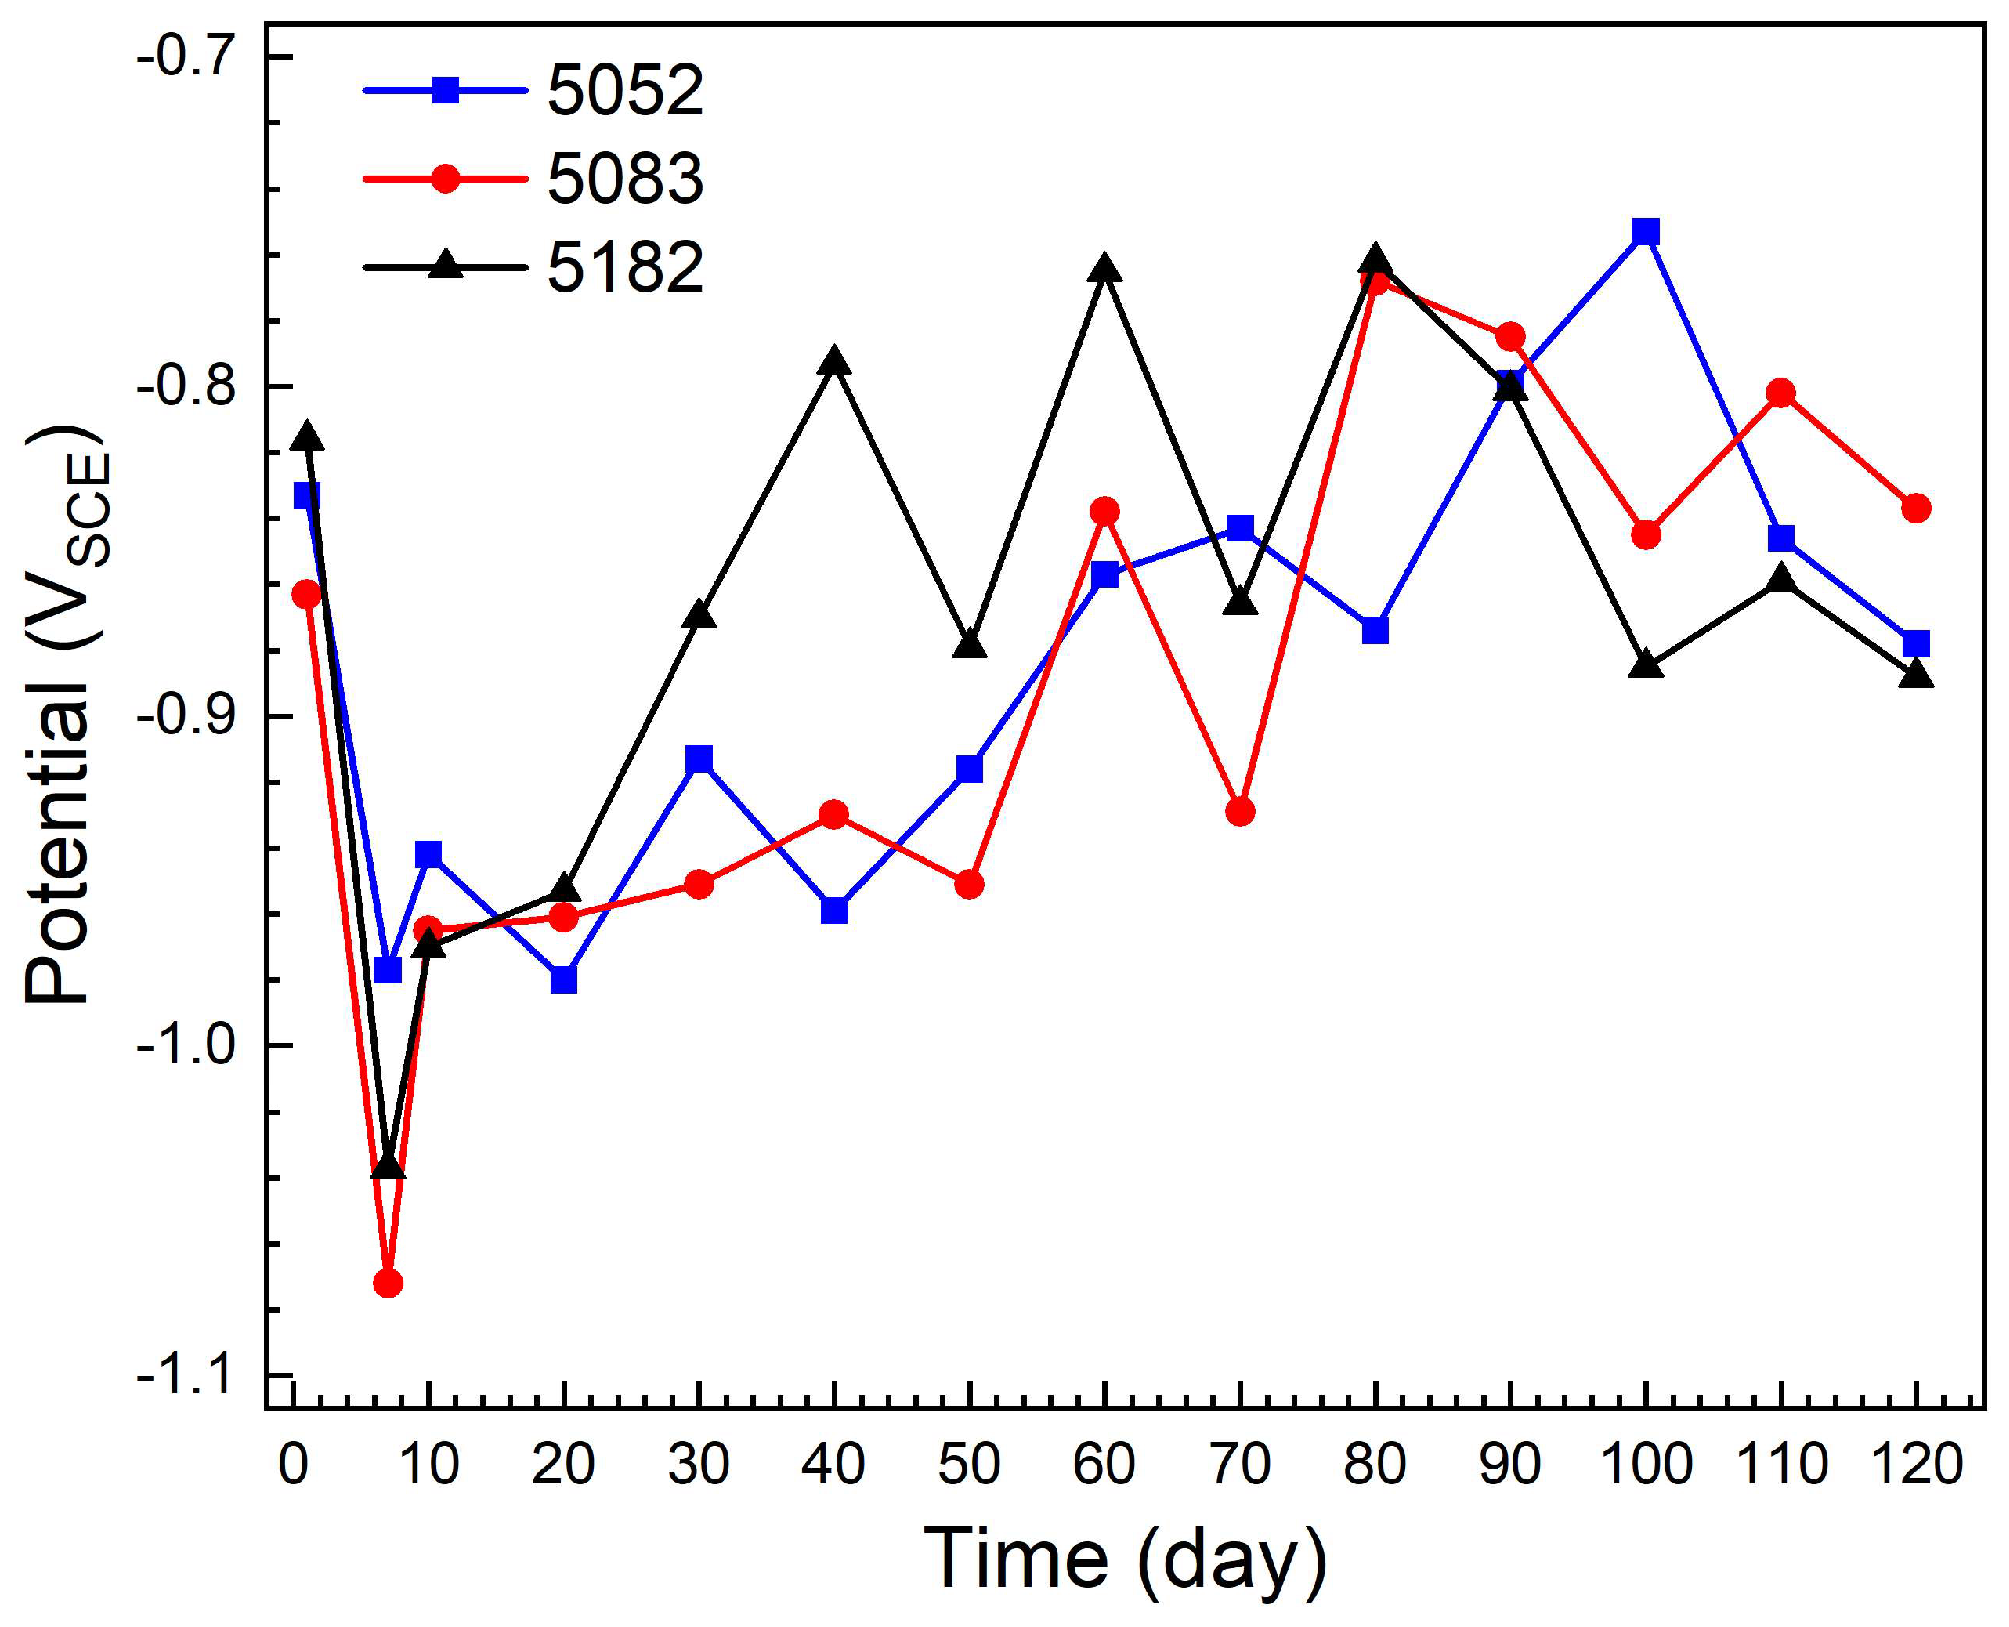
Three aluminum alloys were immersed in 3.5 wt.% NaCl solution at 35 °C for 120 days to observe the evolution of corrosion characteristics. Figure 4 shows the open circuit potentials monitored regularly during the immersion test. The curves have similar features for the three aluminum alloys. Their open circuit potentials are relatively high after 1 day, but significantly decrease after 7 days. During the subsequent immersion process, the open circuit potentials tend to increase, although there are some fluctuations. The open circuit potentials start to decrease again after about 80 days for 5083 and 5182 alloys or 100 days for the 5052 alloy. In general, the open circuit potentials generally display small differences between the three alloys. For each alloy, the open circuit potential fluctuates frequently during the immersion test. These fluctuations are mainly related to the growth of the product film on the specimen surface, and the formation, growth and repassivation of small corrosion pits.

Figure 4.
Open circuit potentials of the specimens immersed in 3.5 wt.% solution for 120 days.
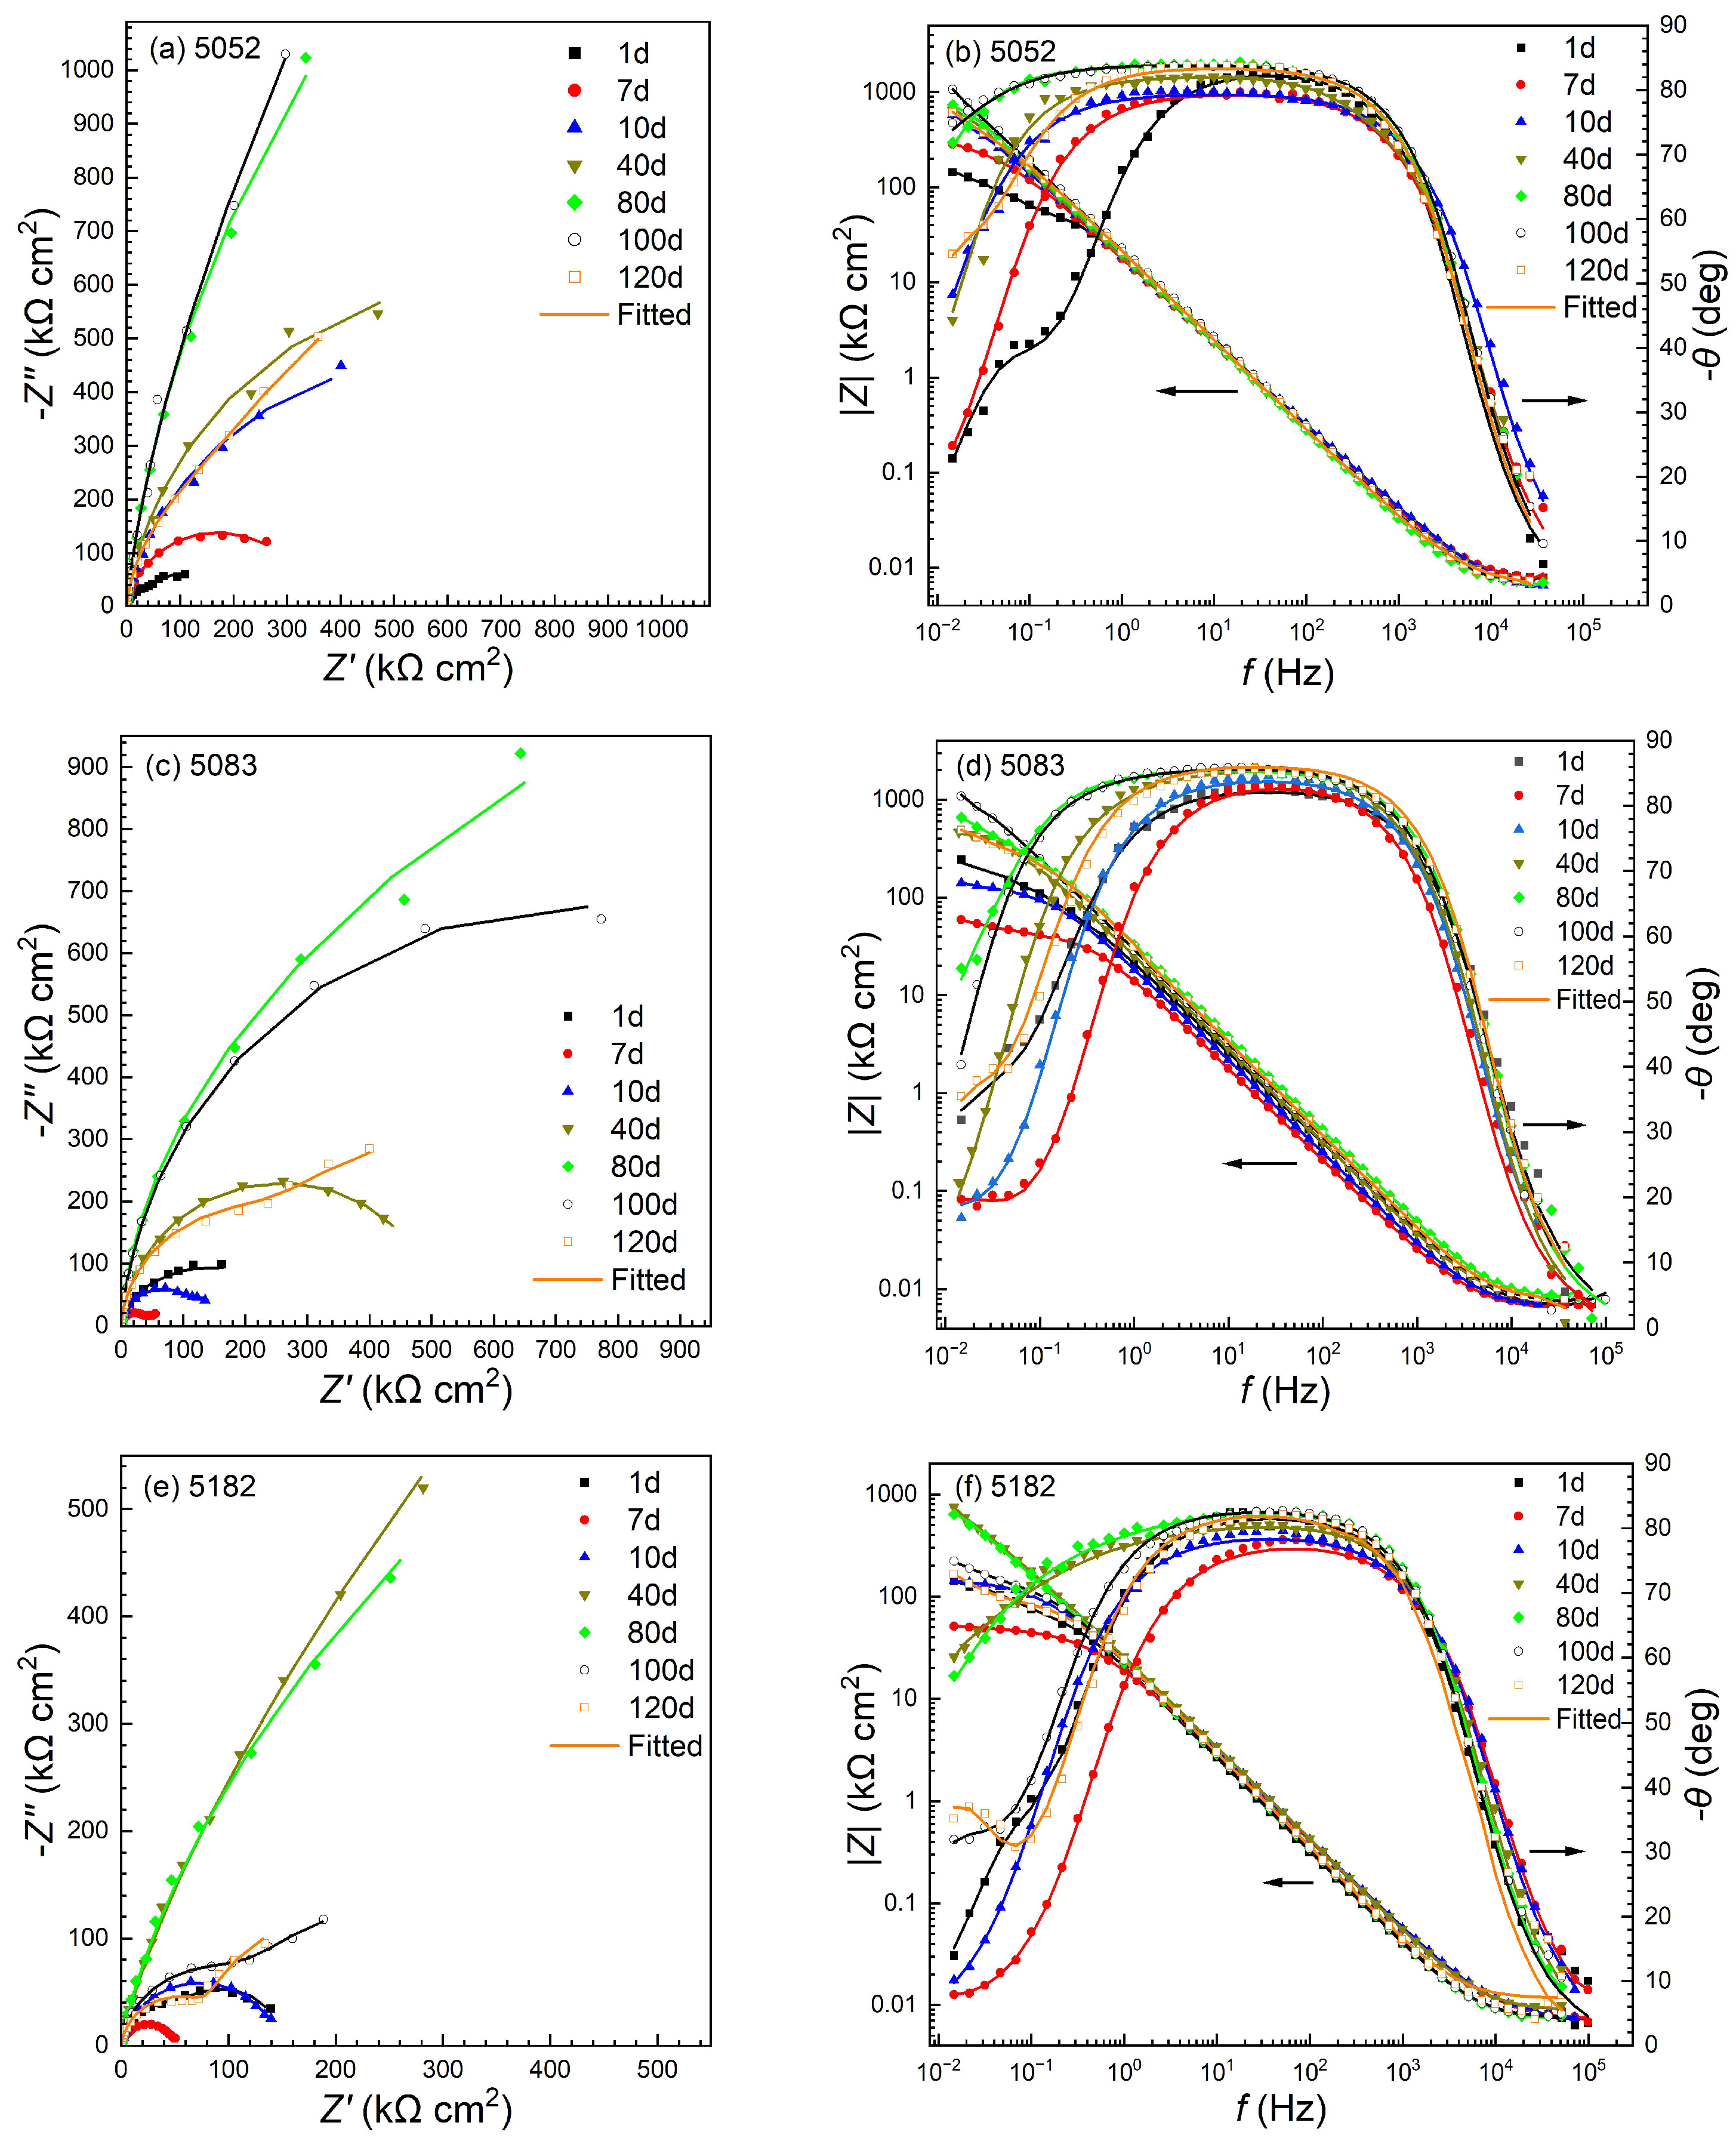
Figure 5 shows the electrochemical impedance spectroscopies measured at different times for the three alloy specimens during 120 days of immersion test in 3.5 wt.% NaCl solution. The experimental data are represented by points and the fitted values are represented by lines. Only some typical curves are given here for the convenience of clear observation. The impedance curves of the three alloys have similar characteristics in the initial immersion stage. The Nyquist curve consists of an incomplete circular capacitive arc, while the Bode curve shows that the phase angle remains almost constant in the medium and low frequency ranges, presenting a platform. As the immersion time increases, the capacitive arc and the phase angle platform generally display an expanding trend, although sometimes there is some shrinkage. However, for the specimens of 5052, 5083 and 5182 alloys, both the capacitive arc and the phase angle platform show a shrinking trend after the immersion for about 100, 80 and 40 days, respectively. This indicates that some pits maintain stable growth in the solution. In addition, for the two specimens of 5083 and 5182 alloys, a short oblique line appears at the low-frequency end in the Nyquist curves after the immersion for about 120 and 100 days, respectively, indicating that the diffusion control feature appears in the corrosion process on the specimen surfaces.
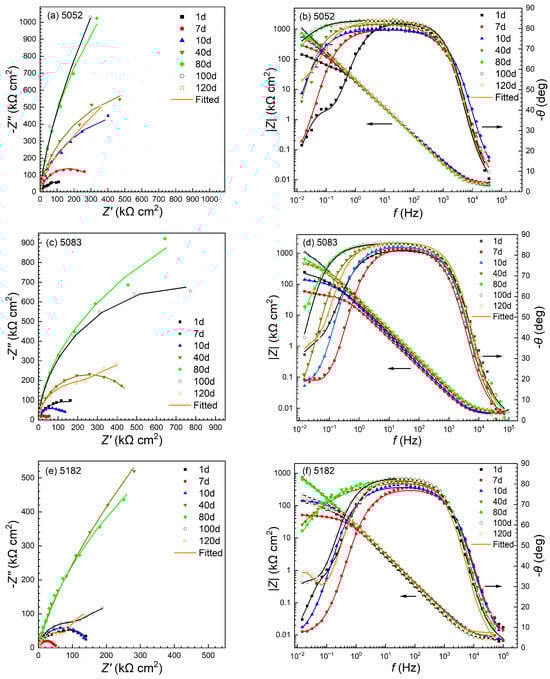
Figure 5.
Typical EIS spectra at different times for the three alloy specimens during 120 days of immersion in 3.5 wt.% NaCl solution: (a,c,e) Nyquist and (b,d,f) Bode plots.
3.4. Surface Morphologies and Corrosion Products
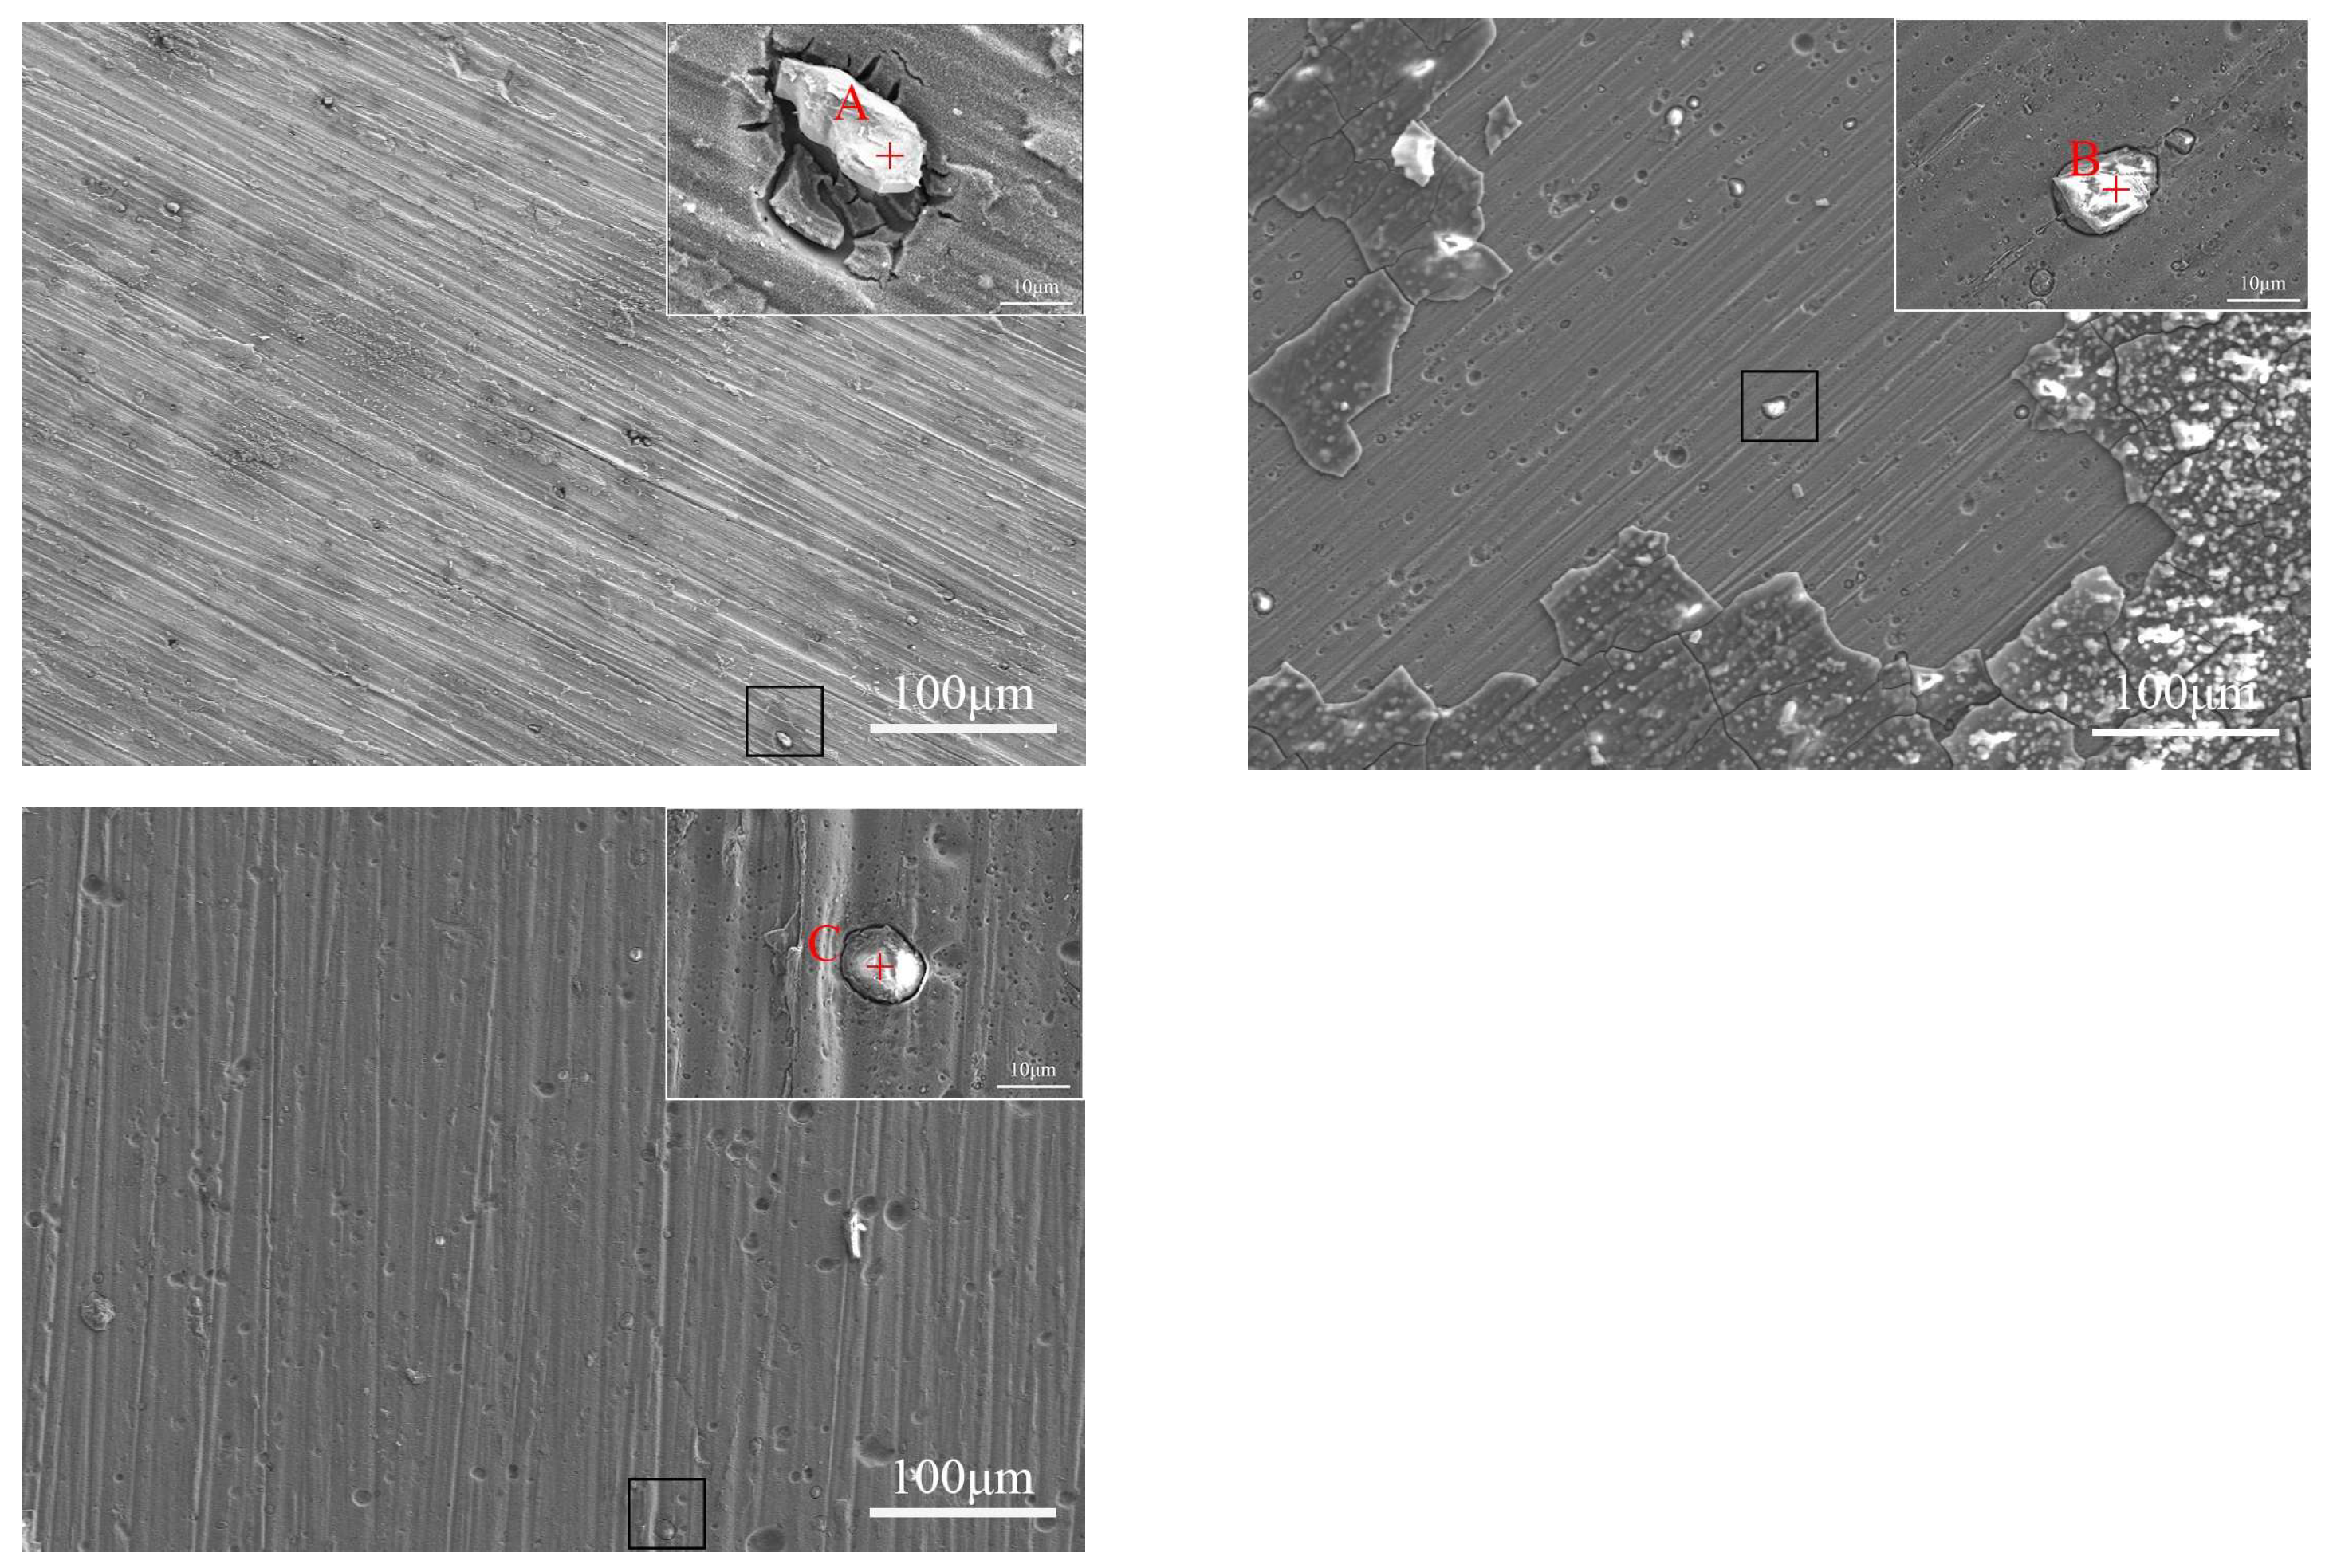
Figure 6 presents the SEM morphologies for the specimen surfaces of the three aluminum alloys after the immersion in 3.5 wt.% NaCl solution at 35 °C for 120 days. The 5052 alloy specimen surface is covered with a very thin product film. The spallation of product film took place on the 5083 alloy specimen surface, which clearly exposes the metal matrix. There is very little residual corrosion product film on the 5182 alloy specimen surface. Many small and shallow pits formed on the specimen surfaces of all three alloys. In particular, there are more small pits on the surfaces of 5083 and 5182 alloys with relatively high Mg contents. This may be formed by the dissolution of anodic precipitates or the detachment of cathodic precipitates. It is seen from the locally enlarged images that some precipitates remain on the specimen surfaces, and the corrosion pit or tiny crevice formed along these precipitates. Table 3 gives the elemental contents of the precipitated phases for the three alloys marked in Figure 6 from the EDS analysis. At point A, it is rich in Fe and Si, which should be the Al(Fe,Si) phase. At point B, it is rich in Fe and Mn, which should be the Al6(Fe,Mn) phase. At point C, there are only Fe and Al, which should be the Al6Fe phase. The points A and B are obviously rich in Cr, indicating that Cr accumulated in these precipitated phases. According to the literature [33], all these are Fe-rich cathodic phases. In addition, the anodic precipitates rich in Mg were not detected, which may have already been dissolved during immersion.
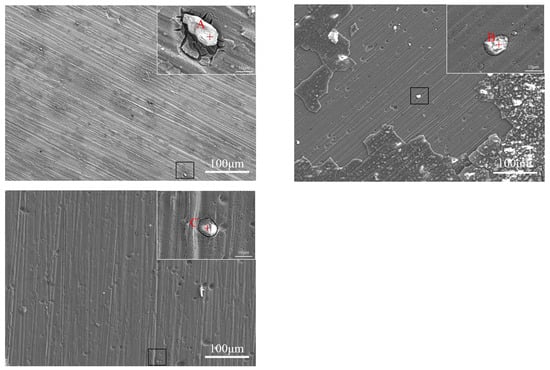
Figure 6.
SEM surface morphologies of the specimens after the immersion in 3.5 wt.% NaCl solution for 120 days: (A) 5052, (B) 5083 and (C) 5182 alloys.
Table 3.
Elemental contents (wt.%) by EDS analysis for the marked positions in Figure 6.
Figure 7 shows the XPS spectra of the corrosion product films on the surfaces of three aluminum alloys after being immersed in 3.5 wt.% NaCl solution at 35 °C for 120 days. The response peak of Al 2p in Figure 7a can be fitted into three components, i.e., metallic state Al (72.8 ± 0.3 eV), Al(OH)3 (75.5 ± 0.83 eV) and Al2O3 (74.40 ± 0.56 eV) [34,35,36]. The response peak of O 1s in Figure 7b mainly contains the components of O2− (529.82 ± 0.75 eV), OH− (531.24 ± 0.60 eV) and H2O (532.61 ± 0.7 eV) [37]. Al(OH)3 is mainly formed by the combination of OH− from the cathode reaction and Al3+ from the anode reaction. As the reactions proceed, Al(OH)3 dehydrates to form the oxide Al2O3. It is clear that the product films are mainly composed of oxides and hydroxides of Al for all the three aluminum alloys. In addition, it is calculated from the peak areas of XPS spectra that the ratio values of Al2O3/Al(OH)3 in the product films are about 0.79, 0.50 and 0.47 for 5052, 5083 and 5182 alloys, respectively. These are consistent with the results obtained from the polarization curves and EIS spectra. The product film with higher Al2O3 content on the specimen surface must be more protective for the metal matrix, which is largely responsible for the better corrosion resistance of the 5052 alloy.
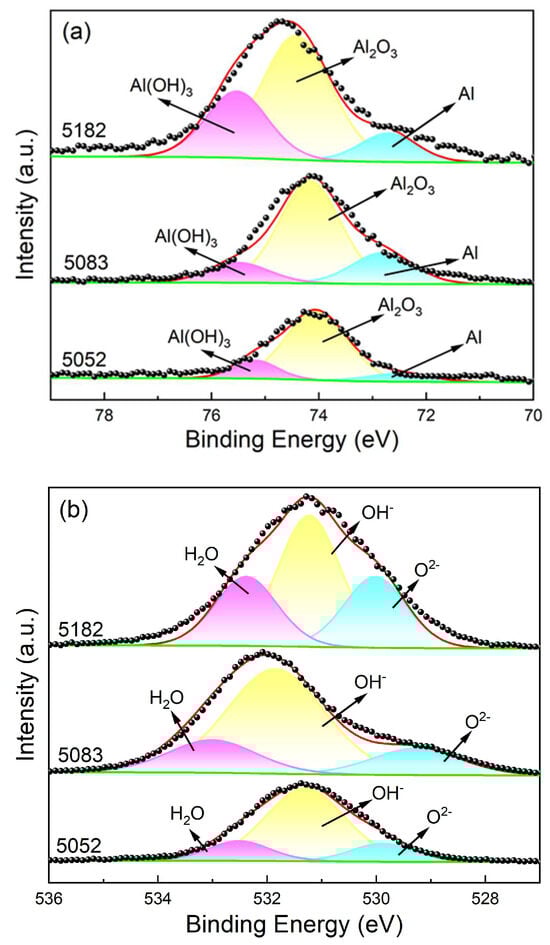
Figure 7.
XPS spectra for the corrosion product films on the specimen surfaces of three aluminum alloys after being immersed in 3.5 wt.% NaCl solution for 120 days: (a) Al 2p and (b) O 1s.
3.5. Pit Depth
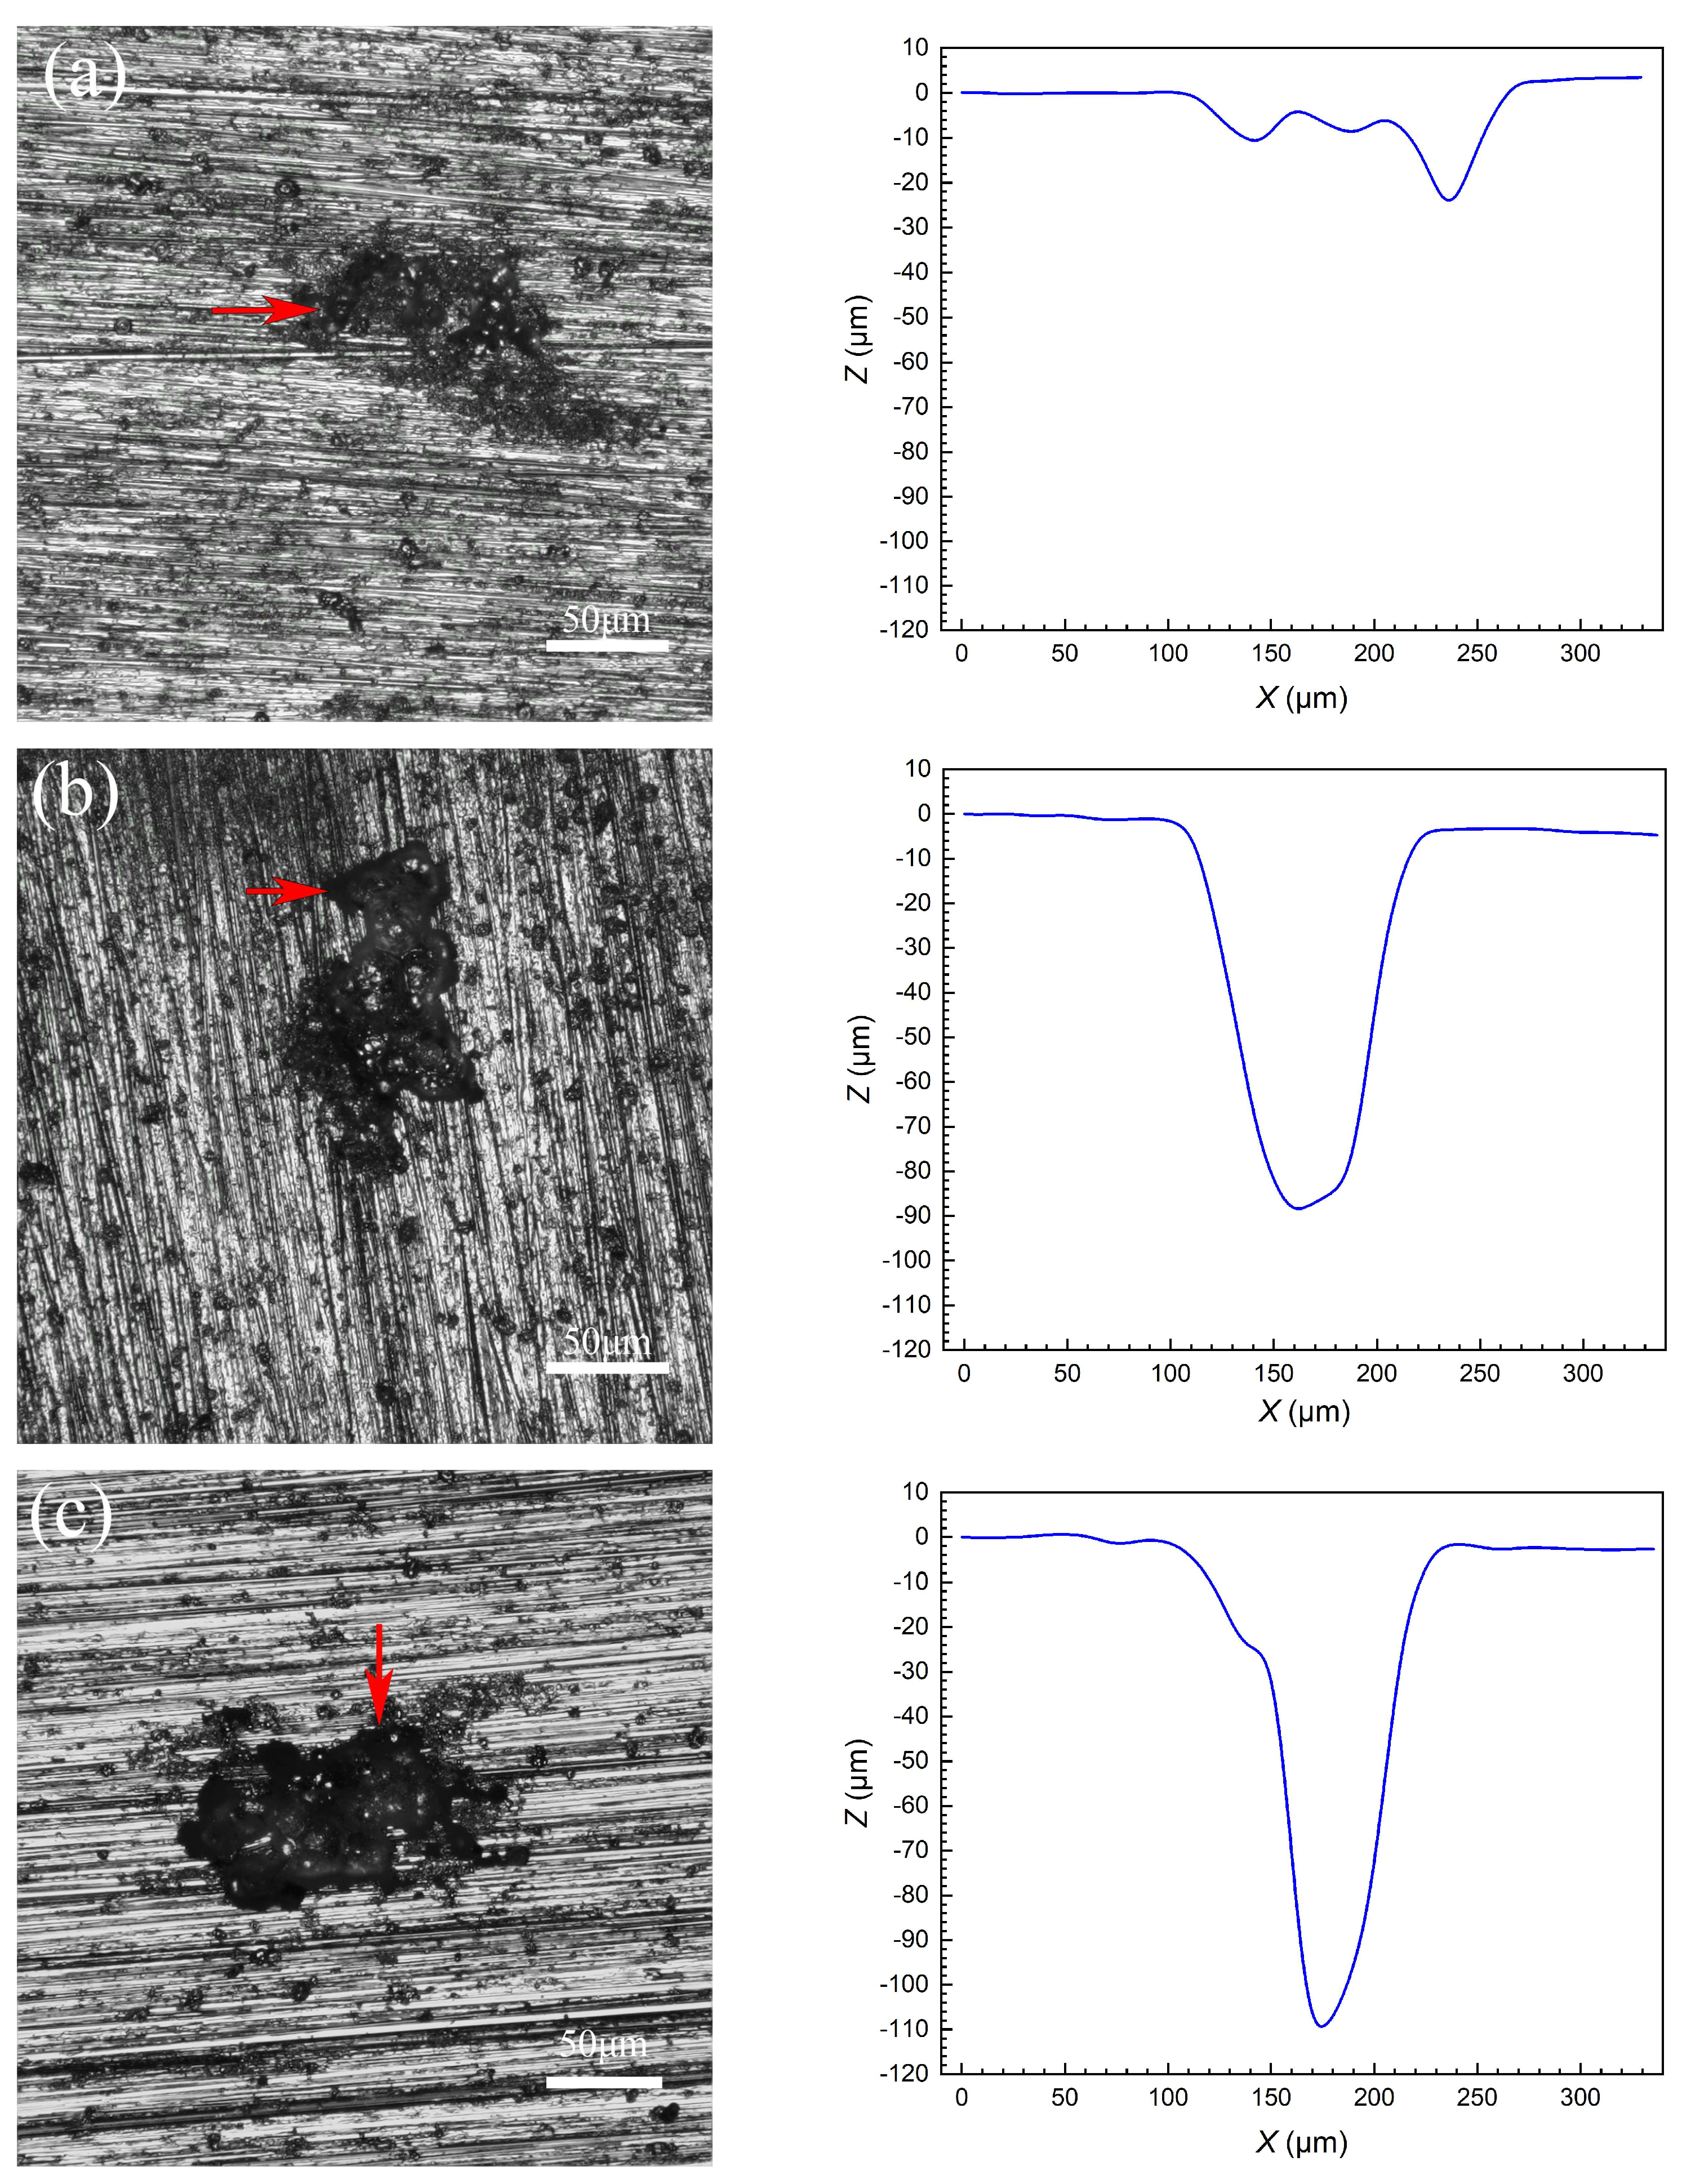
Figure 8 shows the optical images for the deepest pits on the three alloy specimen surfaces after removing the corrosion products and the corresponding pit depth curves measured along the red arrows. After 120 days of immersion, the maximum pit depths are about 110.5, 89.1 and 28.1 μm for 5182, 5083 and 5052 alloy specimens, respectively. The pit depths of 5083 and 5052 alloys are approximately 19.4% and 74.6% smaller than that of the 5182 alloy. However, the pit depths are still small for the three alloys. In addition, there are about three, seven and four pits observed under the optical microscope with minimum depths about 96.9, 26.4 and 14.2 μm on the two parallel specimens of 5182, 5083 and 5052 alloys, respectively. For a clear comparison, Table 4 gives the depth values for all pits on the three alloy specimens.

Figure 8.
Optical images and depth curves for the deepest pits on the specimen surfaces of aluminum alloys after 120 days of immersion in the test solution: (a) 5052, (b) 5083 and (c) 5182 alloys.
Table 4.
Depth values of the pits for the three alloys (μm).
4. Discussion
4.1. Interpretation for EIS Spectra
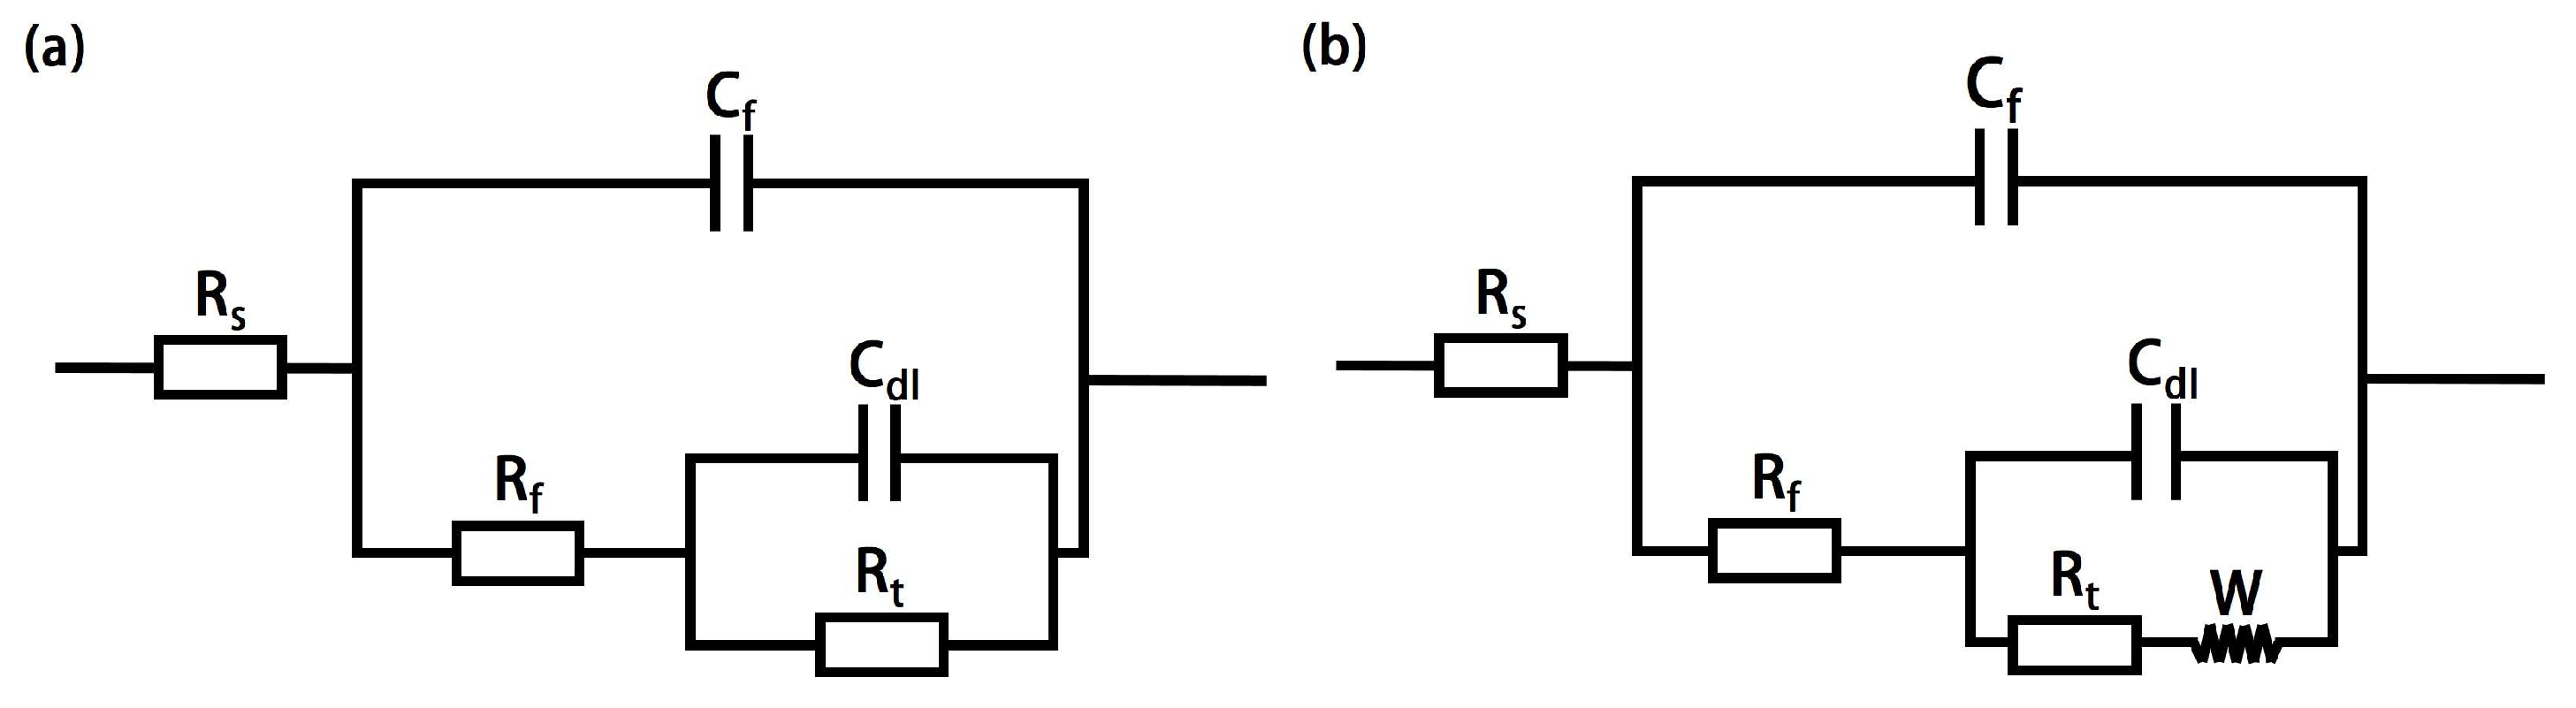
Based on the impedance characteristics in Figure 5, Figure 9 gives the corresponding equivalent circuits for the corrosion systems in the absence and presence of diffusion process, respectively, where Rs represents the solution resistance, Rf and Cf represent the corrosion product film (or passive film) resistance and capacitance, Rt and Cdl represent the charge transfer resistance and double layer capacitance, respectively, and W is the Warburg diffusion impedance inside the pits. Due to the non-ideal capacitive response of the corrosion system, all the capacitive elements are replaced by the constant phase angle elements (CPEs) during the fitting process [4,20,38,39]. It is seen from Figure 5 that the fitted data show good agreement with the experimental data, indicating that these equivalent circuit models can reliably describe the corrosion processes on the specimen surfaces. Since it is difficult to accurately separate the product film resistance and the charge transfer resistance, the polarization resistance (Rp) is used here to evaluate the corrosion resistance, i.e., Rp = Rt + Rf [40]. Figure 10 shows the fitted values of Rp for the three alloy specimens at different immersion times. Rp displays some fluctuation for each alloy specimen during the immersion test. However, due to the growth of the product film (or passive film), Rp tends to increase with the extension of immersion time, especially for the 5052 alloy. After about 40, 80 and 100 days, Rp reaches the extreme values for 5182, 5083 and 5052 alloys, respectively, and then starts to decrease. This is mainly related to the formation of stable pitting corrosion, i.e., the continuous growth of some pits. After the transition point, the Rp values mainly reflect the corrosion resistance inside the active pits on the specimen surfaces, which clearly enlarges from 5182 to 5083 and 5052 alloys. The 5182 alloy has the lowest corrosion resistance, while the 5052 alloy has the highest corrosion resistance. These are principally responsible for the differences in pit depths for the three aluminum alloys in Figure 8. It is noted that the corrosion resistance values are still very high after 120 days, i.e., larger than about 3.1 × 10⁵ Ω cm2.
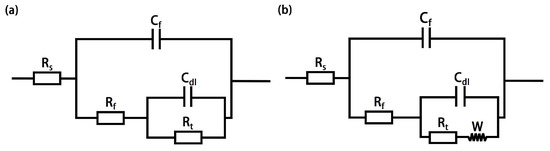
Figure 9.
Equivalent circuit models without (a) and with (b) diffusion process for the corrosion systems of aluminum alloys in the test solution.
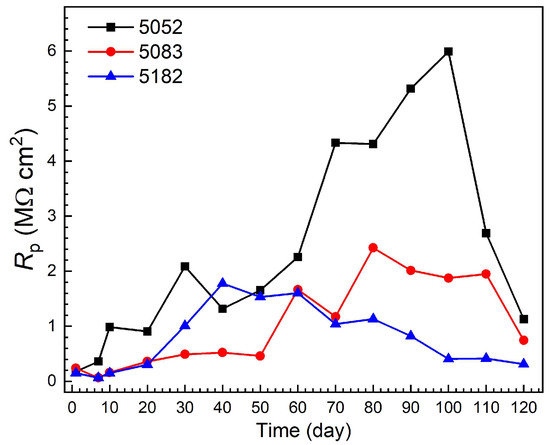
Figure 10.
Rp values of the alloy specimens in 3.5 wt.% NaCl solution for different times.
4.2. Effect of Alloying Elements on Corrosion
It can be seen from Figure 3 that the cathodic corrosion process of aluminum alloys involves the oxygen reduction reaction as follows:
O2 + 2H2O + 4e− → 4OH−
When the potential is low enough, the following hydrogen evolution reaction also occurs:
2H2O + 2e− → H2 + 2OH−
The anodic processes may involve the following aluminum dissolution reactions and secondary reactions [41,42]:
Al → Al3+ + 3e−
Al3+ + 3OH− → Al(OH)3
Al(OH)3 → Al2O3 + 3H2O
The OH− ions formed in reaction (1) may promote the spontaneous passivation of the aluminum alloy. The anodic dissolution of the aluminum matrix generates Al3+ ions in reaction (3), which subsequently form Al(OH)3 films on the alloy surface through reaction (4) [43]. However, the Al(OH)3 film is loose and porous and cannot provide good protection for the Al matrix. The dehydration of Al(OH)3 takes place in reactions (5) and then forms relatively denser Al2O3 film [44,45,46]. The corrosion resistance of the aluminum alloy mainly depends on the protection from the Al2O3 thin film on the surface.
Mg has a relatively high chemical activity and may preferentially undergo the following dissolution and secondary reactions:
Mg → Mg2+
Mg2+ + 2OH− → Mg(OH)2
The product film of Mg is porous [47], which leads to the formation of more defects in the product film (or passive film) on the aluminum alloy surface. This degrades the protective performance of the product film. At the same time, the dissolution of Mg is likely the main reason for the increase in Al(OH)3 content and the decrease in Al2O3 content in the product film. In contrast to Mg, Cr can usually form dense passive films [48,49], which facilitates the formation of protective product films on the Al alloy surface. From 5052 to 5083 and 5182 alloys, the Mg content increases to some extent, while the Cr content decreases slightly. These may be the main reasons for the successive enlargement of passive current density for the three aluminum alloys in Figure 3. It is noted that the solubility products (Ksp) of the hydroxides of Al and Mg are approximately 1.3 × 10⁻³³ and 6.9 × 10⁻¹², respectively. The latter is much larger than the former. In fact, the formation of Mg(OH)2 is very limited. The Cr contents are no higher than 0.22 wt.% in the alloys, which may generate very few products. Therefore, it is very difficult to detect the products of Mg and Cr by the XPS analysis in Figure 7.
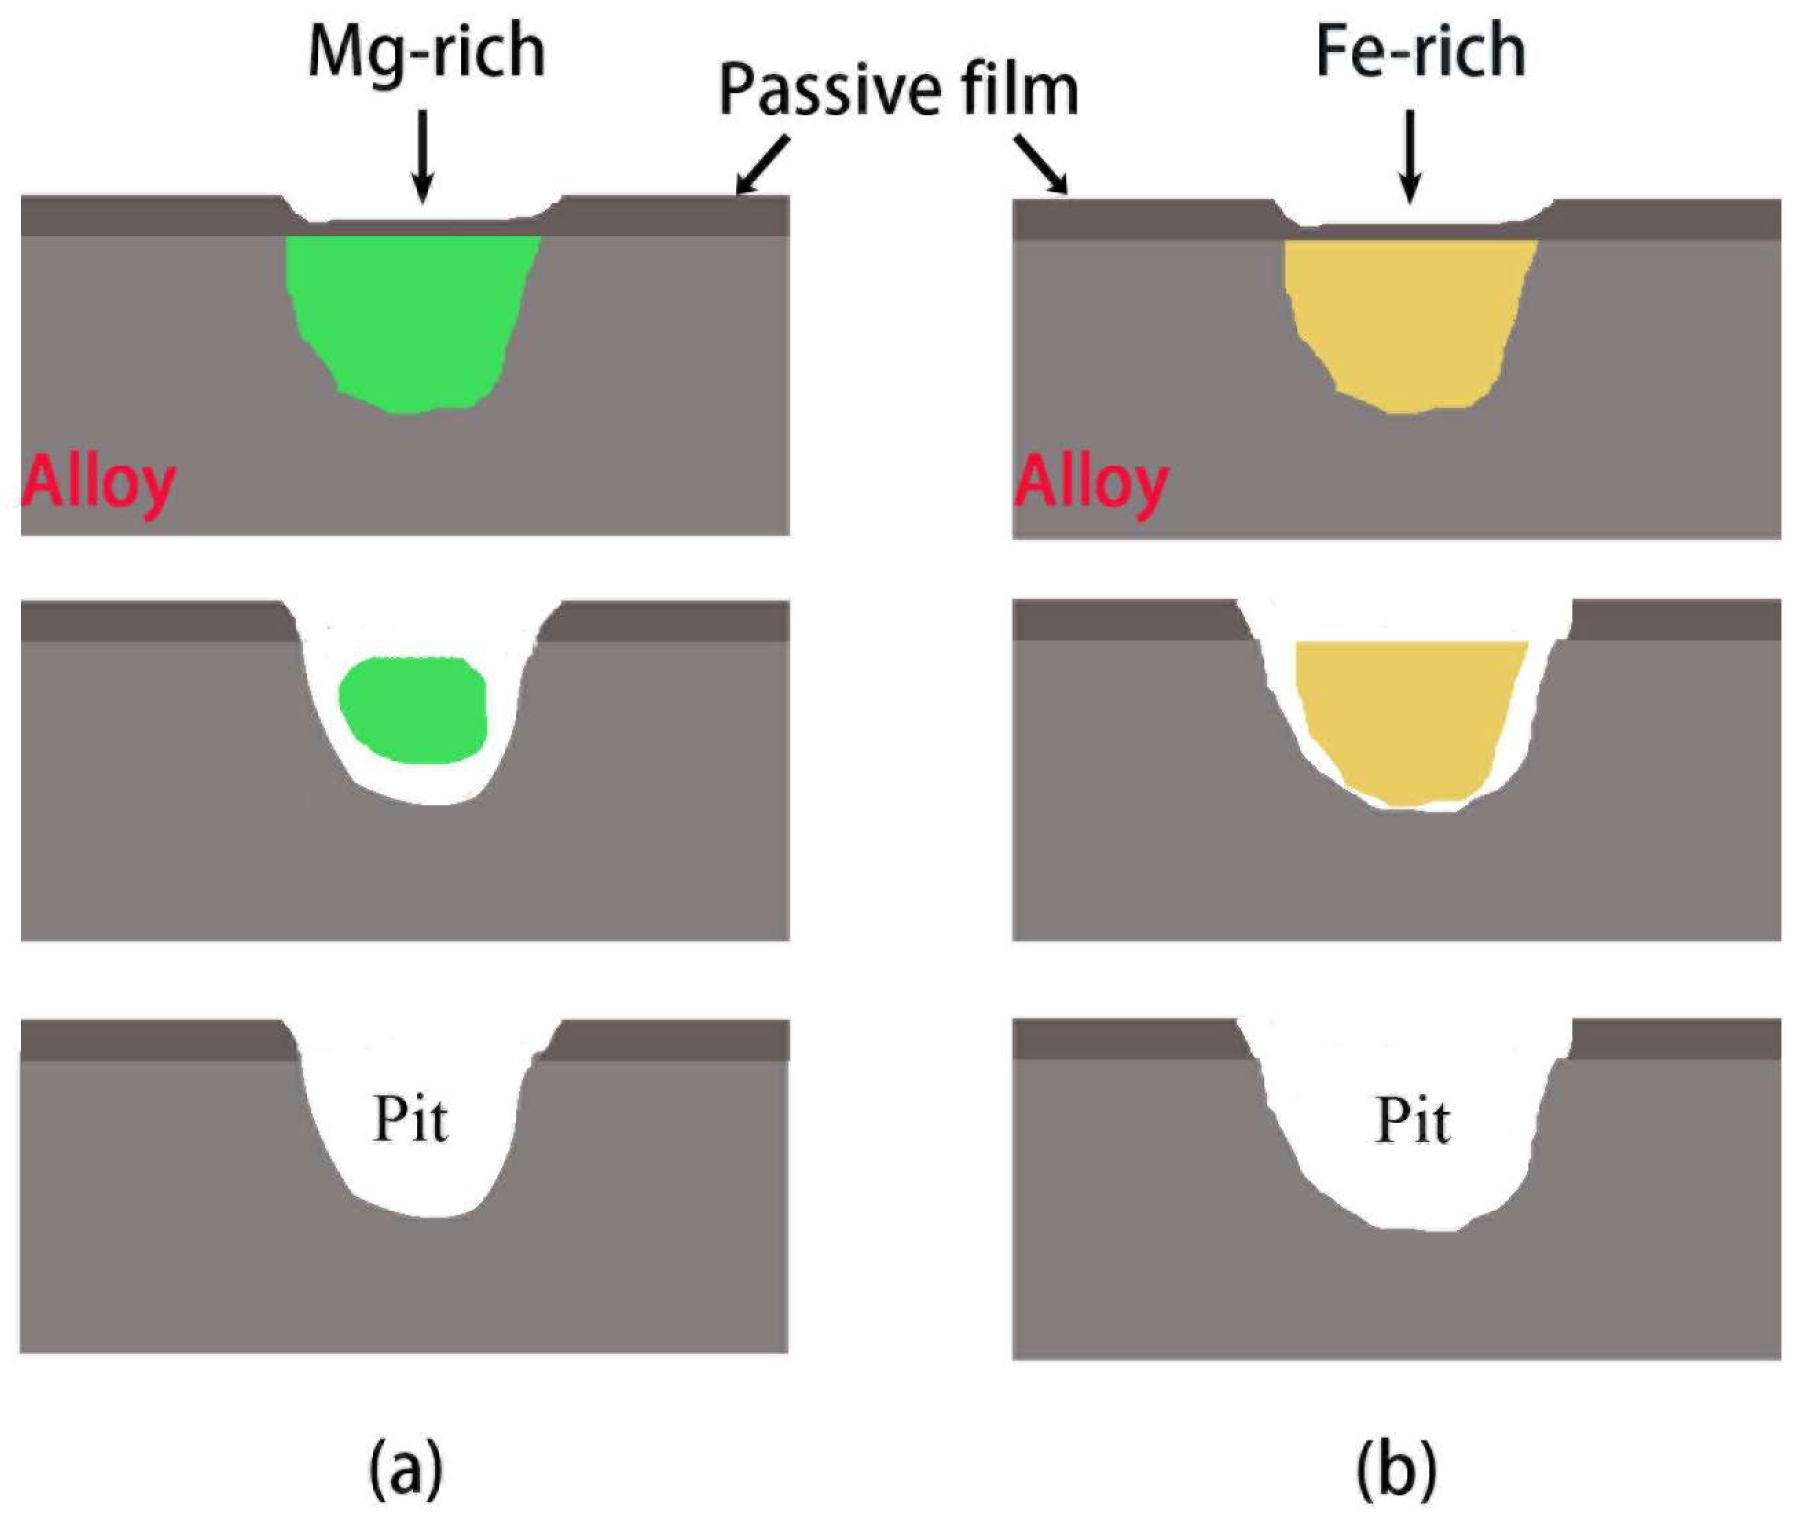
The intermetallic phases in the aluminum alloys and the high concentration of Cl− ions in the test solution may significantly affect the formation and local damage of the passive film on the surfaces [50]. Figure 11 shows the schematic diagrams of the pitting corrosion processes of aluminum alloys in the simulated seawater environment. First, the passive film formed along the intermetallic phases is relatively weak, which can be easily attacked by Cl− ions and then leads to the exposure of the intermetallic phases and the surrounding alloy matrix to the solution. The “galvanic corrosion effect” will appear between the intermetallic phases and the alloy matrix, promoting the active dissolution around the intermetallic phases and the formation of pits [51]. The pitting corrosion process of aluminum alloys is closely related to the potential of the intermetallic phases. According to the EDS test results and the literature [5,6,7,8,9], there are two main types of intermetallic phases, i.e., the Mg-rich and Fe-rich precipitates in the three aluminum alloys. The Mg-rich intermetallic phases (e.g., Al3Mg2 and Mg2Si) usually have lower potentials than the aluminum alloy matrix [52,53]. During the corrosion process, they act as the anodic phases, whose accelerated dissolution will directly form the pits [54], as shown in Figure 11a. This should be the main reason for the appearance of many small pits in Figure 6. In particular, there are significantly more small pits for 5083 and 5182 alloys due to the relatively higher Mg contents in comparison with the 5052 alloy. On the contrary, the Fe-rich intermetallic phases (e.g., Al6(Fe, Mn), Al(Fe,Si) and Al6Fe) usually have higher potentials than the aluminum alloy matrix [55]. During the corrosion process, they act as the cathodic phases and will accelerate the dissolution of the surrounding aluminum matrix. This may lead to the formation of small crevices between them. Eventually, the detachment of Fe-rich phases will form the pits [56,57], as shown in Figure 11b. In addition, as observed from Figure 6, some cathodic particles may still remain on the surfaces of the three aluminum alloys after 120 days of immersion test.
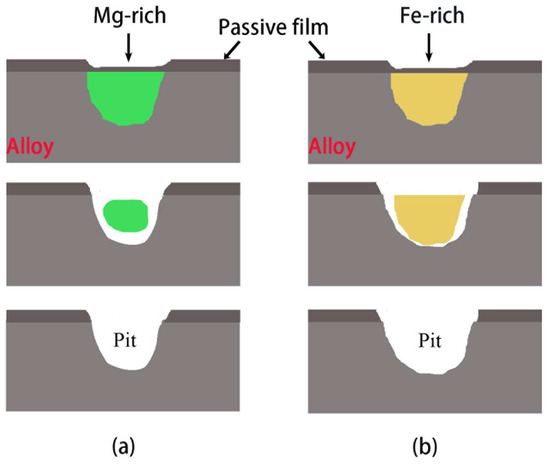
Figure 11.
Schematic diagrams of the pitting corrosion processes along (a) Mg-rich and (b) Fe-rich precipitates on the surface of aluminum alloy.
It can be seen from the EDS analysis data in Table 3 that Cr and Mn elements are incorporated into the Fe-rich intermetallic phases. According to the literature [58,59], they can not only contribute to more uniform distribution for the precipitates but also reduce the potential difference between the precipitates and the alloy matrix to some extent. These are conducive to improving the corrosion resistance of aluminum alloys.
The above analyses indicate that the alloying elements Mg, Cr and Mn in the aluminum alloy matrix and intermetallic phases have a great impact on the corrosion process. From the 5052 alloy to 5083 and 5182 alloys, the increase in Mg content and the decrease in Cr content are the main reasons for the reduction in polarization resistance Rp and the enlargement of passive current density and pit depth. There is almost no Mn and a relatively lower Mg content in the 5052 alloy, so it is still hard to clearly elucidate the effect of Mn on the corrosion of the three alloys. In addition, the Rp value of the 5052 alloy is much larger than those of the other two alloys. This mainly results from its higher charge transfer resistance caused by the less alloying element Mg and Mg-rich anodic phases and the better protectiveness of corrosion product film with a higher Al2O3/Al(OH)3 ratio value of about 0.79. Finally, it should be noted that the “galvanic effect” will disappear in a single pit due to the dissolution or detachment of intermetallic phase with its propagation, as shown in Figure 11. Therefore, the growth rates of pits on the three aluminum alloy surfaces are relatively slow. Their pit depths are approximately less than 110 μm after 120 days of immersion test. It can be concluded that these three alloys have good corrosion resistance in the seawater solution. In particular, the 5052 alloy displays a pit depth less than 30 μm and an Rp value higher than 1.1 MΩ·cm2 after 120 days. In addition, as shown in Figure 5 and Figure 9, with the growth of stable pits, the corrosion processes on the surfaces of 5083 and 5182 alloys are controlled by oxygen diffusion to some extent due to the noticeable decrease in charge transfer resistance.
5. Conclusions
The corrosion behavior of three Al-Mg alloys (i.e., 5052, 5083 and 5182 alloys) with different alloying element contents was studied in 3.5 wt.% solution. The following conclusions can be drawn:
- (1)
- From 5052 alloy to 5083 and 5182 alloys, due to the increase in Mg content and the decrease in Cr content, the passive current density enlarges, while the pitting potential decreases slightly, indicating the slight increase in pitting susceptibility. However, the pitting potential differences are very small, less than about 22 mV.
- (2)
- The Rp values of the three alloys firstly tend to enlarge with the immersion time, and then start to reduce after about 40, 80 and 100 days for 5182, 5083 and 5052 alloys, respectively, with the occurrence of stable pitting corrosion. After 120 days of immersion, the corrosion resistance in the stable pits increases in the order of 5182 alloy < 5083 alloy < 5052 alloy, while the pit depth is exactly the opposite. But the pit depths of the three alloys are relatively small, approximately less than 110 μm.
- (3)
- The corrosion product films on the three alloy surfaces are mainly composed of Al2O3 and Al(OH)3, but the ratio of Al2O3/Al(OH)3 increases in the order of 5182 alloy < 5083 alloy < 5052 alloy. The intermetallic phases are the weak positions for the occurrence of pitting corrosion.
Author Contributions
Conceptualization, W.Z., F.X. and M.L.; methodology, W.Z., F.X. and M.L.; software, W.Z.; validation, W.Z., F.X. and M.L.; formal analysis, W.Z. and M.L.; investigation, W.Z.; resources, F.X.; data curation, M.L.; writing—original draft preparation, W.Z.; writing—review and editing, M.L.; supervision, M.L.; project administration, M.L.; funding acquisition, M.L. All authors have read and agreed to the published version of the manuscript.
Funding
This research received no external funding.
Data Availability Statement
The original contributions presented in this study are included in the article. Further inquiries can be directed to the corresponding author.
Conflicts of Interest
Author Fei Xue was employed by Baoshan Iron & Steel Co., Ltd. The remaining authors declare that the research was conducted in the absence of any commercial or financial relationships that could be construed as a potential conflict of interest.
References
- Al-Moubaraki, A.H.; Al-Rushud, H.H. The red sea as a corrosive environment: Corrosion rates and corrosion mechanism of aluminum alloys 7075, 2024, and 6061. Int. J. Corros. 2018, 2018, 1–15. [Google Scholar] [CrossRef]
- Kuchariková, L.; Liptáková, T.; Tillová, E.; Kajánek, D.; Schmidová, E. Role of Chemical Composition in Corrosion of Aluminum Alloys. Metals 2018, 8, 581. [Google Scholar] [CrossRef]
- Aballe, A.; Bethencourt, M.; Botana, F.J.; Cano, M.; Marcos, M. Influence of the cathodic intermetallics distribution on the reproducibility of the electrochemical measurements on AA5083 alloy in NaCl solutions. Corros. Sci. 2003, 45, 161–180. [Google Scholar] [CrossRef]
- Bethencourt, M.; Botana, F.J.; Cano, M.J.; Marcos, M.; Sánchez-Amaya, J.M.; González-Rovira, L. Using EIS to analyse samples of Al–Mg alloy AA5083 treated by thermal activation in cerium salt baths. Corros. Sci. 2008, 50, 1376–1384. [Google Scholar] [CrossRef]
- Engler, O.; Miller-Jupp, S. Control of second-phase particles in the Al-Mg-Mn alloy AA 5083. J. Alloys Compd. 2016, 689, 998–1010. [Google Scholar] [CrossRef]
- Glenn, A.M.; Muster, T.H.; Luo, C.; Zhou, X.; Thompson, G.E.; Boag, A.; Hughes, A.E. Corrosion of AA2024-T3 Part III: Propagation. Corros. Sci. 2011, 53, 40–50. [Google Scholar] [CrossRef]
- Arthanari, S.; Jang, J.C.; Shin, K.S. Corrosion performance of high pressure die-cast Al-Si-Mg-Zn alloys in 3.5 wt% NaCl solution. J. Alloys Compd. 2019, 783, 494–502. [Google Scholar] [CrossRef]
- Jebaraj, A.V.; Aditya, K.V.V.; Kumar, T.S.; Ajaykumar, L.; Deepak, C.R. Mechanical and corrosion behaviour of aluminum alloy 5083 and its weldment for marine applications. Mater. Today Proc. 2020, 22, 1470–1478. [Google Scholar] [CrossRef]
- Engler, O.; Kuhnke, K.; Westphal, K.; Hasenclever, J. Impact of chromium on the microchemistry evolution during solidification and homogenization of the Al-Mg alloy AA 5052. J. Alloys Compd. 2018, 744, 561–573. [Google Scholar] [CrossRef]
- Reboul, M.C.; Baroux, B. Metallurgical aspects of corrosion resistance of aluminium alloys. Mater. Corros. 2011, 62, 215–233. [Google Scholar] [CrossRef]
- Yang, Y.-K.; Allen, T. Direct visualization of β phase causing intergranular forms of corrosion in Al–Mg alloys. Mater. Charact. 2013, 80, 76–85. [Google Scholar] [CrossRef]
- Liu, M.; Schmutz, P.; Zanna, S.; Seyeux, A.; Ardelean, H.; Song, G.; Atrens, A.; Marcus, P. Electrochemical reactivity, surface composition and corrosion mechanisms of the complex metallic alloy Al3Mg2. Corros. Sci. 2010, 52, 562–578. [Google Scholar] [CrossRef]
- Li, Y.; Cai, J.M.; Guan, L.; Wang, G. pH-dependent electrochemical behaviour of Al3Mg2 in NaCl solution. Appl. Surf. Sci. 2019, 467–468, 619–633. [Google Scholar] [CrossRef]
- Zeng, F.-L.; Wei, Z.-L.; Li, J.-F.; Li, C.-X.; Tan, X.; Zhang, Z.; Zheng, Z.-Q. Corrosion mechanism associated with Mg2Si and Si particles in Al–Mg–Si alloys. Trans. Nonferrous Met. Soc. China 2011, 21, 2559–2567. [Google Scholar] [CrossRef]
- Li, Z.; Li, C.; Gao, Z.; Liu, Y.; Liu, X.; Guo, Q.; Yu, L.; Li, H. Corrosion behavior of Al–Mg2Si alloys with/without addition of Al–P master alloy. Mater. Charact. 2015, 110, 170–174. [Google Scholar] [CrossRef]
- Li, C.; Sun, J.; Li, Z.; Gao, Z.; Liu, Y.; Yu, L.; Li, H. Microstructure and corrosion behavior of Al–10%Mg 2 Si cast alloy after heat treatment. Mater. Charact. 2016, 122, 142–147. [Google Scholar] [CrossRef]
- Gupta, R.K.; Zhang, R.; Davies, C.H.J.; Birbilis, N. Influence of Mg Content on the Sensitization and Corrosion of Al-xMg(-Mn) Alloys. Corrosion 2013, 69, 1081–1087. [Google Scholar] [CrossRef]
- Shuaib, A.N. Mechanical properties of Al–2.5 Mg–0.1 Mn–Si–Cr–Fe alloys. Mater. Des. 2002, 23, 181–187. [Google Scholar] [CrossRef]
- Muller, I.L.; Galvele, J.R. Pitting potential of high purity binary aluminium alloys—II. AlMg and AlZn alloys. Corros. Sci. 1977, 17, 995–1007. [Google Scholar] [CrossRef]
- Brunner, J.G.; May, J.; Höppel, H.W.; Göken, M.; Virtanen, S. Localized corrosion of ultrafine-grained Al–Mg model alloys. Electrochim. Acta 2010, 55, 1966–1970. [Google Scholar] [CrossRef]
- Hajar, H.M.; Zulkifli, F.; Mohd Sabri, M.G.; Wan Nik, W.B. Protection against Corrosion of Aluminum Alloy in Marine Environment by Lawsonia inermis. Int. J. Corros. 2016, 2016, 4891803. [Google Scholar] [CrossRef]
- Xiao, W.; Peng, J.; Zhang, X.; Wu, K. Corrosion Resistance of Two Arc Spraying Coatings on EH36 Steel in Neutral Salt Spray Environment. J. Chin. Soc. Corros. Prot. 2023, 43, 1003–1014. [Google Scholar] [CrossRef]
- Darmawan, A.S.; Siswanto, W.A.; Purboputro, P.I.; Anggono, A.D.; Masyrukan; Hamid, A. Effect of Increasing Salinity to Corrosion Resistance of 5052 Aluminum Alloy in Artificial Seawater. Mater. Sci. Forum 2019, 961, 107–111. [Google Scholar] [CrossRef]
- Yu, L.; Zhang, C.; Liu, Y.; Yan, Y.; Xu, P.; Jiang, Y.; Cao, X. Comparing the Corrosion Resistance of 5083 Al and Al2O3/5083 Al Composite in a Chloride Environment. Materials 2022, 16, 86. [Google Scholar] [CrossRef]
- Zhou, P.; Deng, L.; Guo, P.; Rao, W.; Wang, X.; Zhang, M. Influence of Microstructure Heterogeneity on the Corrosion Resistance and Microhardness of 5052 Al-Mg Alloy. JOM 2020, 72, 4305–4314. [Google Scholar] [CrossRef]
- Brillas, E.; Cabot, P.L.; Centellas, F.; Garrido, J.A.; Pérez, E.; Rodríguez, R.M. Electrochemical oxidation of high-purity and homogeneous Al–Mg alloys with low Mg contents. Electrochim. Acta 1998, 43, 799–812. [Google Scholar] [CrossRef]
- ISO 8407-2021; Corrosion of Metals and Alloys—Removal of Corrosion Products from Corrosion Test Specimens. International Organization for Standardization: Geneva, Switzerland, 2021.
- Liang, W.J.; Rometsch, P.A.; Cao, L.F.; Birbilis, N. General aspects related to the corrosion of 6xxx series aluminium alloys: Exploring the influence of Mg/Si ratio and Cu. Corros. Sci. 2013, 76, 119–128. [Google Scholar] [CrossRef]
- Delijić, K.; Markoli, B.; Naglič, I. The Influence of the Chemical Composition on the Corrosion Performances of Some Al-Fe-Si, Al-Mg-Si and Al-Mg-Mn Type of Alloys. Metall. Mater. Eng. 2014, 20, 217–234. [Google Scholar] [CrossRef]
- ISO 15158-2014; Corrosion of Metals and Alloys—Method of Measuring the Pitting Potential for Stainless Steels by Potentiodynamic Control in Sodium Chloride Solution. International Organization for Standardization: Geneva, Switzerland, 2014.
- Frankel, G.S.; Fajardo, S.; Lynch, B.M. Introductory lecture on corrosion chemistry: A focus on anodic hydrogen evolution on Al and Mg. Faraday Discuss 2015, 180, 11–33. [Google Scholar] [CrossRef]
- Ubeda, C.; Garces, G.; Adeva, P.; Llorente, I.; Frankel, G.S.; Fajardo, S. The role of the beta-Mg17Al12 phase on the anomalous hydrogen evolution and anodic dissolution of AZ magnesium alloys. Corros. Sci. 2020, 165, 108384. [Google Scholar] [CrossRef]
- Yasakau, K.A.; Zheludkevich, M.L.; Lamaka, S.V.; Ferreira, M.G.S. Role of intermetallic phases in localized corrosion of AA5083. Electrochim. Acta 2007, 52, 7651–7659. [Google Scholar] [CrossRef]
- Scotto-Sheriff, S.; Darque-Ceretti, E.; Plassart, G.; Aucouturier, M. Physico-chemical characterisation of native air-formed oxide films on Al-Mg alloys at low temperature. Influence of water. J. Mater. Sci. 1999, 34, 5081–5088. [Google Scholar] [CrossRef]
- Zhang, F.; Zhang, C.; Zeng, R.; Song, L.; Guo, L.; Huang, X. Corrosion Resistance of the Superhydrophobic Mg(OH)2/Mg-Al Layered Double Hydroxide Coatings on Magnesium Alloys. Metals 2016, 6, 85. [Google Scholar] [CrossRef]
- Wu, G.; Dash, K.; Galano, M.L.; O’Reilly, K.A.Q. Oxidation studies of Al alloys: Part II Al-Mg alloy. Corros. Sci. 2019, 155, 97–108. [Google Scholar] [CrossRef]
- Tan, Z.; Xu, R.; Bi, H.; Zhang, Z.; Li, M. Effects of potential on corrosion behavior and contact resistance of 446 stainless steel in simulated proton exchange membrane fuel cell cathode environment. J. Solid State Electrochem. 2023, 27, 1993–2003. [Google Scholar] [CrossRef]
- Wang, L.; Zong, Q.; Sun, W.; Yang, Z.; Liu, G. Chemical modification of hydrotalcite coating for enhanced corrosion resistance. Corros. Sci. 2015, 93, 256–266. [Google Scholar] [CrossRef]
- Trdan, U.; Grum, J. SEM/EDS characterization of laser shock peening effect on localized corrosion of Al alloy in a near natural chloride environment. Corros. Sci. 2014, 82, 328–338. [Google Scholar] [CrossRef]
- Li, M.; Luo, S.; Wu, P.; Shen, J. Photocathodic protection effect of TiO2 films for carbon steel in 3% NaCl solutions. Electrochim. Acta 2005, 50, 3401–3406. [Google Scholar] [CrossRef]
- Abodi, L.C.; DeRose, J.A.; Van Damme, S.; Demeter, A.; Suter, T.; Deconinck, J. Modeling localized aluminum alloy corrosion in chloride solutions under non-equilibrium conditions: Steps toward understanding pitting initiation. Electrochim. Acta 2012, 63, 169–178. [Google Scholar] [CrossRef]
- Seri, O.; Kido, Y. Corrosion Phenomenon and Its Analysis of 6063 Aluminum Alloy in Ethyl Alcohol. Mater. Trans. 2009, 50, 1433–1439. [Google Scholar] [CrossRef]
- Wang, J.; Yang, H.; Du, M.; Hou, J.; Peng, W.; Lin, C. Corrosion Mechanism of 5083 Aluminum Alloy in Seawater Containing Phosphate. J. Ocean Univ. China 2021, 20, 372–382. [Google Scholar] [CrossRef]
- Chandrashekar, A.; Mohanavel, V.; Kaladgi, A.R.; Kumar, V.; Ravichandran, M.; Arunkumar, G.; Basheer, D. The investigation of the effect of nano particles on dry sliding wear and corrosion behavior of Al-Mg/Al2O3 composites. Surf. Topogr. Metrol. Prop. 2021, 9, 045046. [Google Scholar] [CrossRef]
- Huang, X.; Wang, L.-T.; Song, Y.-F.; Ge, F.; Zhang, Y.; Meng, X.-J.; Ge, H.-H.; Zhao, Y.-Z. Effect of Al2O3 nanoparticles on the corrosion behavior of aluminum alloy in simulated vehicle coolant. J. Alloys Compd. 2021, 874, 159807. [Google Scholar] [CrossRef]
- Teng, H.-T.; Lee, T.-Y.; Chen, Y.-K.; Wang, H.-W.; Cao, G. Effect of Al(OH)3 on the hydrogen generation of aluminum–water system. J. Power Sources 2012, 219, 16–21. [Google Scholar] [CrossRef]
- Brady, M.P.; Rother, G.; Anovitz, L.M.; Littrell, K.C.; Unocic, K.A.; Elsentriecy, H.H.; Song, G.L.; Thomson, J.K.; Gallego, N.C.; Davis, B. Film Breakdown and Nano-Porous Mg(OH)2 Formation from Corrosion of Magnesium Alloys in Salt Solutions. J. Electrochem. Soc. 2015, 162, C140–C149. [Google Scholar] [CrossRef]
- Li, B.; Wang, T.; Li, P.; Wang, S.; Wang, L. Selective Laser Melting of 316L Stainless Steel: Influence of Co-Cr-Mo-W Addition on Corrosion Resistance. Metals 2021, 11, 597. [Google Scholar] [CrossRef]
- Li, J.; Shen, W.; Lin, P.; Wang, F.; Yang, Z. Effect of Solution Treatment Temperature on Microstructural Evolution, Precipitation Behavior, and Comprehensive Properties in UNS S32750 Super Duplex Stainless Steel. Metals 2020, 10, 1481. [Google Scholar] [CrossRef]
- McCafferty, E. Sequence of steps in the pitting of aluminum by chloride ions. Corros. Sci. 2003, 45, 1421–1438. [Google Scholar] [CrossRef]
- Zaid, B.; Saidi, D.; Benzaid, A.; Hadji, S. Effects of pH and chloride concentration on pitting corrosion of AA6061 aluminum alloy. Corros. Sci. 2008, 50, 1841–1847. [Google Scholar] [CrossRef]
- Ikeuba, A.I.; Njoku, C.N.; Ekerenam, O.O.; Njoku, D.I.; Udoh, I.I.; Daniel, E.F.; Uzoma, P.C.; Etim, I.-I.N.; Okonkwo, B.O. A review of the electrochemical and galvanic corrosion behavior of important intermetallic compounds in the context of aluminum alloys. RSC Adv. 2024, 14, 31921–31953. [Google Scholar] [CrossRef]
- Birbilis, N.; Buchheit, R.G. Electrochemical Characteristics of Intermetallic Phases in Aluminum Alloys. J. Electrochem. Soc. 2005, 152, B140. [Google Scholar] [CrossRef]
- Zhang, Z.; Xu, Z.; Sun, J.; Zhu, M.; Yao, Q.; Zhang, D.; Zhang, B.; Xiao, K.; Wu, J. Corrosion Behaviors of AA5083 and AA6061 in Artificial Seawater: Effects of Cl−, HSO3− and Temperature. Int. J. Electrochem. Sci. 2020, 15, 1218–1229. [Google Scholar] [CrossRef]
- Kosaba, T.; Nishimoto, M.; Muto, I. Elucidation of the trigger for trenching around Al6(Fe, Mn) on AA5083 aluminum alloy in diluted synthetic seawater. Corros. Sci. 2024, 239, 112362. [Google Scholar] [CrossRef]
- Li, Y.; Yang, B.; Zhang, M.; Wang, H.; Gong, W.; Lai, R.; Li, Y.; Teng, J. The corrosion behavior and mechanical properties of 5083 Al-Mg alloy manufactured by additive friction stir deposition. Corros. Sci. 2023, 213, 110972. [Google Scholar] [CrossRef]
- Wei, R.P. A model for particle-induced pit growth in aluminum alloys. Scr. Mater. 2001, 44, 2647–2652. [Google Scholar] [CrossRef]
- Ahmad, Z.; Aleem, A. Effect of heat treatment on the corrosion resistance of modified aluminum-magnesium alloys in seawater. J. Mater. Eng. Perform. 1993, 2, 739–744. [Google Scholar] [CrossRef]
- Zamin, M. The Role of Mn in the Corrosion Behavior of Al-Mn Alloys. Corrosion 1981, 37, 627–632. [Google Scholar] [CrossRef]


Disclaimer/Publisher’s Note: The statements, opinions and data contained in all publications are solely those of the individual author(s) and contributor(s) and not of MDPI and/or the editor(s). MDPI and/or the editor(s) disclaim responsibility for any injury to people or property resulting from any ideas, methods, instructions or products referred to in the content. |
© 2025 by the authors. Licensee MDPI, Basel, Switzerland. This article is an open access article distributed under the terms and conditions of the Creative Commons Attribution (CC BY) license (https://creativecommons.org/licenses/by/4.0/).