Article

Optimization of Laser Welding Parameters and Fixed Stress Span Design to Minimize Deformation in Ultra-Thin Ferritic Stainless Steel

1
Key Laboratory of Automobile Materials (Ministry of Education), School of Materials Science and Engineering, Jilin University, No. 5988 Renmin Street, Changchun 130022, China
2
State Key Laboratory of Advanced Welding and Joining, Harbin Institute of Technology, Harbin 150001, China
*
Author to whom correspondence should be addressed.
Metals 2025, 15(3), 325; https://doi.org/10.3390/met15030325
Submission received: 7 February 2025 / Revised: 4 March 2025 / Accepted: 12 March 2025 / Published: 17 March 2025
(This article belongs to the Section Welding and Joining)

Abstract

Ultra-thin ferritic stainless steel, essential for applications such as proton exchange membrane fuel cells, presents challenges during pulsed laser welding due to thermal stresses causing deformation. This study explores the effects of welding parameters and clamp design on deformation through finite element simulations and experiments. Key parameters, including laser power (500–700 W), welding speed (6–14 mm/s), and pulse frequency (6–14 Hz), were systematically varied. Results revealed a non-linear relationship between these parameters and weld quality, with the optimal combination identified as a laser power of 600 W, welding speed of 10 mm/s, and pulse frequency of 10 Hz. Additionally, the fixed stress span applied by clamps significantly influenced stress–strain and displacement fields. For instance, residual stress decreased from 267 MPa at a 5 mm span to 189 MPa at a 20 mm span. Displacement values increased from 4.746 × 10⁻3 mm at 5 mm to 8.111 × 10⁻3 mm at 20 mm, while strain initially decreased but rose slightly from 1.648 × 10⁻3 at 10 mm to 1.719 × 10⁻3 at 15 mm. The 5 mm stress span was found optimal, producing a smooth and defect-free weld surface. This study bridges gaps in understanding the deformation mechanics of ultra-thin ferritic stainless steel, offering practical guidelines for optimizing laser welding parameters and clamp designs to achieve superior weld quality.

1. Introduction

Ultra-thin materials, especially ultra-thin stainless steel with a thickness of less than 0.2 mm, find extensive application in high-precision fields requiring high stability and durability, such as proton exchange membrane fuel cells (PEMFCs). The reasons for this include their lightweight design, excellent deformability, and corrosion and oxidation resistance [1,2,3]. In PEMFCs, ultra-thin stainless-steel materials are frequently utilized in the fabrication of flow field plates, end plates, and other critical components. Owing to the paramount importance and stringent requirements of these components, ultra-thin stainless steel must possess superior sealing capabilities, robust mechanical properties, and dimensional stability to ensure the prolonged, reliable operation of the cell [4,5]. The increasing demand for fuel cell technology in the sustainable and clean energy sectors indicates a particular potential for the application of ultra-thin stainless steels in PEMFCs.
In such applications, ultra-thin ferritic stainless steels are regarded as optimal materials due to their exceptional corrosion resistance, cost-effectiveness, and low coefficient of thermal expansion [6,7,8]. The low coefficient of thermal expansion and excellent dimensional stability of these steels enable them to maintain a highly precise geometry during the welding process in devices such as PEMFCs, thereby averting distortion caused by thermal stresses. However, it is important to note that ultra-thin ferritic stainless steels are susceptible to thermal deformation and stress concentration during the welding process, particularly in laser welding, which involves the application of concentrated heat. Consequently, it is essential to regulate the heat input and maintain the integrity and stability of the material during the welding process to ensure optimal performance and durability.
The current joining methods for ultrathin materials include resistance spot welding [9], micro friction stir welding [10], plasma arc welding [11] and laser welding. Laser welding has shown great advantages in welding ultra-thin materials due to its high precision, low heat input and excellent welding quality. Pulsed laser welding technology, in particular, has been shown to ensure complete penetration of the weld and minimize thermal deformation during the welding process by precisely controlling the heat input [12,13]. Several studies have demonstrated that the optimization of welding parameters such as laser power, welding speed, and pulse frequency can significantly improve weld quality, especially in terms of preventing defects and weld distortion [14,15]. In the context of PEMFC manufacturing, the welding process of ultra-thin stainless steel exerts a direct influence on the performance and reliability of the components. Consequently, the application of these research findings to the laser welding process in PEMFC production is pivotal in enhancing the efficiency and quality of fuel cell production.
In order to address the challenges of welding ultrathin materials, many studies have explored the effects of different laser modes and welding paths on the welding process. Zhisen Dong et al. welded 50 μm-thick Ti/Cu pure-metal ultrathin foils by adjusting the laser energy density of a nanosecond laser, and showed that smaller laser energy can reduce the brittle compounds in the welded joints, thus improving the mechanical properties and stability of the welded joints [16]. Jicheng Chen et al. utilized a low-frequency pulsed laser beam and implemented several combinations of process parameters concerning peak laser power, welding speed and pulse frequency to weld ultrathin Inconel 718, and revealed the effect of the pulsed laser power on the cyclic locking holes in the weld and the molten pool through numerical simulations based on an integrated mathematical model [17]. In a separate study, Hailaing Xu et al. utilized ABAQUS simulation software to simulate the pulsed laser welding process of 316L ultra-thin austenitic stainless steel. They investigated the effect of laser power on the deformation of ultra-thin stainless steel pulsed laser welding, predicted the degree of deformation, and carried out experimental verification. The simulation results demonstrate that the temperature of the weld cross-section obtained by simulation and the temperature of the thermal cycle of the welding process are consistent with the experimental results. Furthermore, the welding deformation changes from raised to concave with the increase in input energy, which is consistent with the experimental results [18]. These studies provide important theoretical support for optimizing the welding process of ultra-thin ferritic stainless steels in industrial production, particularly in the manufacture of PEMFCs, where it is essential to ensure high strength and stability of the welded joints. In PEMFCs, the quality of the welded joints is directly related to the overall performance and lifetime of the fuel cell, and welding defects can affect the sealing, current conduction and thermal management of the fuel cell, thus affecting the operational efficiency and reliability of the cell. Therefore, optimizing the melt pool behavior during the welding process not only improves the quality of the weld, but also ensures the stability of the PEMFC over time.
Despite the plethora of laser welding studies conducted on ultrathin austenitic stainless steels [19,20], there remains a paucity of research focusing on the welding of ultrathin ferritic stainless steels for PEMFC applications. The distinctive properties of ultrathin ferritic stainless steels during the welding process, including reduced thermal expansion, enhanced corrosion resistance, and cost-effectiveness, underscore their considerable promise for PEMFC applications that demand high dimensional stability and reliable performance [21]. Exploration of the welding behavior of ultra-thin ferritic stainless steels and optimization of welding process parameters has the potential to enhance the quality of welded joints and to promote the development of manufacturing processes for high-precision equipment components such as PEMFCs. The present study aims to explore the deformation behavior of ultra-thin ferritic stainless steel during pulsed laser welding. This study will employ a combination of experimental methods and finite element simulations to systematically investigate the effects of key process parameters, including laser power, welding speed, and pulse frequency, on the surface morphology and dimensional stability of welded joints. Additionally, the role of clamping constraints, particularly fixed stress spans, in controlling welding deformation will be explored. The outcomes of this study are expected to offer novel insights into the optimization of welding process parameters, the design of welding tools, and the control of welding deformation. The objective is to achieve high-quality, defect-free welds in ultra-thin ferritic stainless steel.

2. Materials and Methods in the Experiment

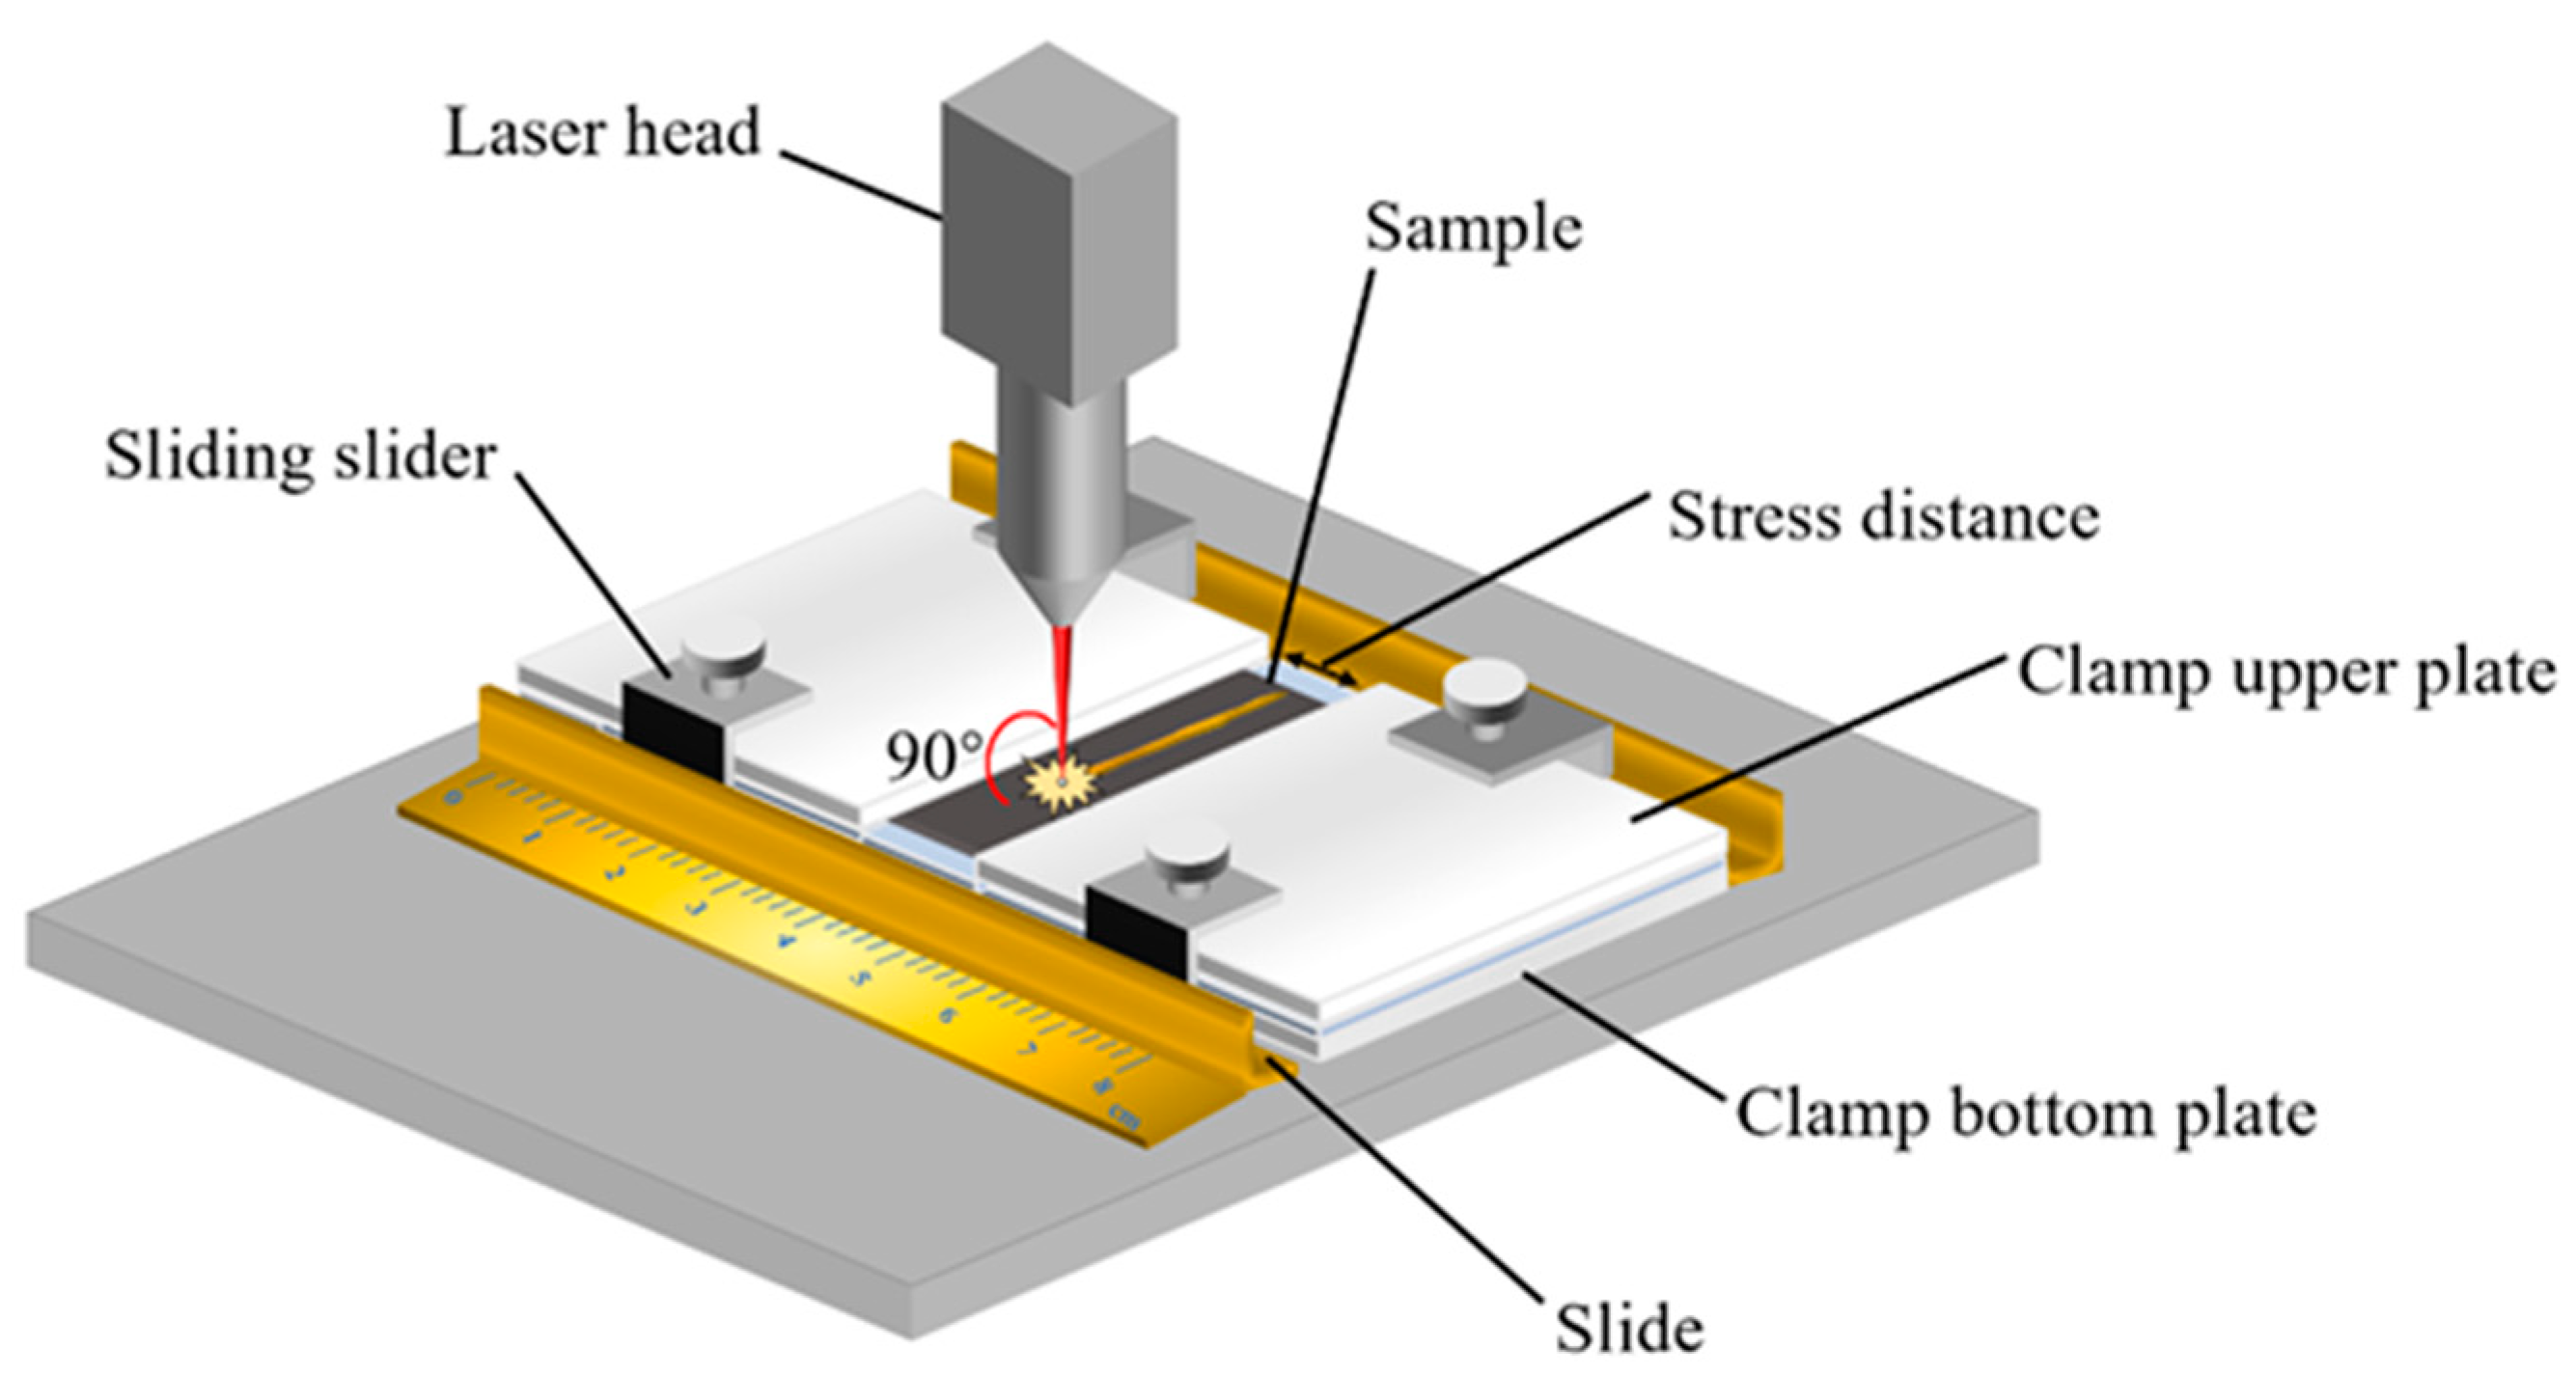
2.1. Experimental Methods

The test material used is 430 ferritic stainless steel, with base material dimensions of 50 mm × 50 mm × 0.2 mm. The robotic laser welding equipment, consisting of a YLR-2000 laser generator from IPG (Marlborough, MA, USA) and a Turing TKB1600 robot from Turing (Shanghai, China), was selected because of its high precision, stable energy output, and suitability to weld ultra-thin materials. The two machines were selected for their high precision, stable energy output and suitability for welding ultra-thin materials. The welding process utilizes 99.99% pure argon gas as the shielding medium, with a flow rate of 15 L/min and a focal position set at the surface of the material to ensure optimal shielding during the process. Table 1 summarizes the welding parameters used in this test, including laser power, welding speed, and pulse frequency, all of which were systematically varied to study their effects on weld quality.
Figure 1 presents a schematic diagram of the custom-made welding clamp. The lower plate is fixed, while the upper plate is connected to a movable slider via bolts. This design enables precise adjustment of the fixed stress span, ensuring accurate positioning and stability during the welding process. The slider is designed to move freely along the slide, enabling the fixed stress span of the clamp to be precisely adjusted. Once adjusted, the slider is locked at the designated test position, as indicated in Table 1, to maintain dimensional stability throughout the welding process. The welding configuration is a lap joint, with the ultra-thin stainless-steel plates overlapping by 50% of their width. The welding path is positioned centrally within the overlap area. Before welding, the base material was ultrasonically cleaned with anhydrous ethanol to remove surface oil and contaminants, ensuring a clean surface for optimal weld quality. During welding, the laser focus was precisely positioned at the center of the lap area of the base material to ensure uniform energy distribution. Additionally, 99.99% pure argon gas was used as a shielding medium to prevent oxidation and contamination of the weld.

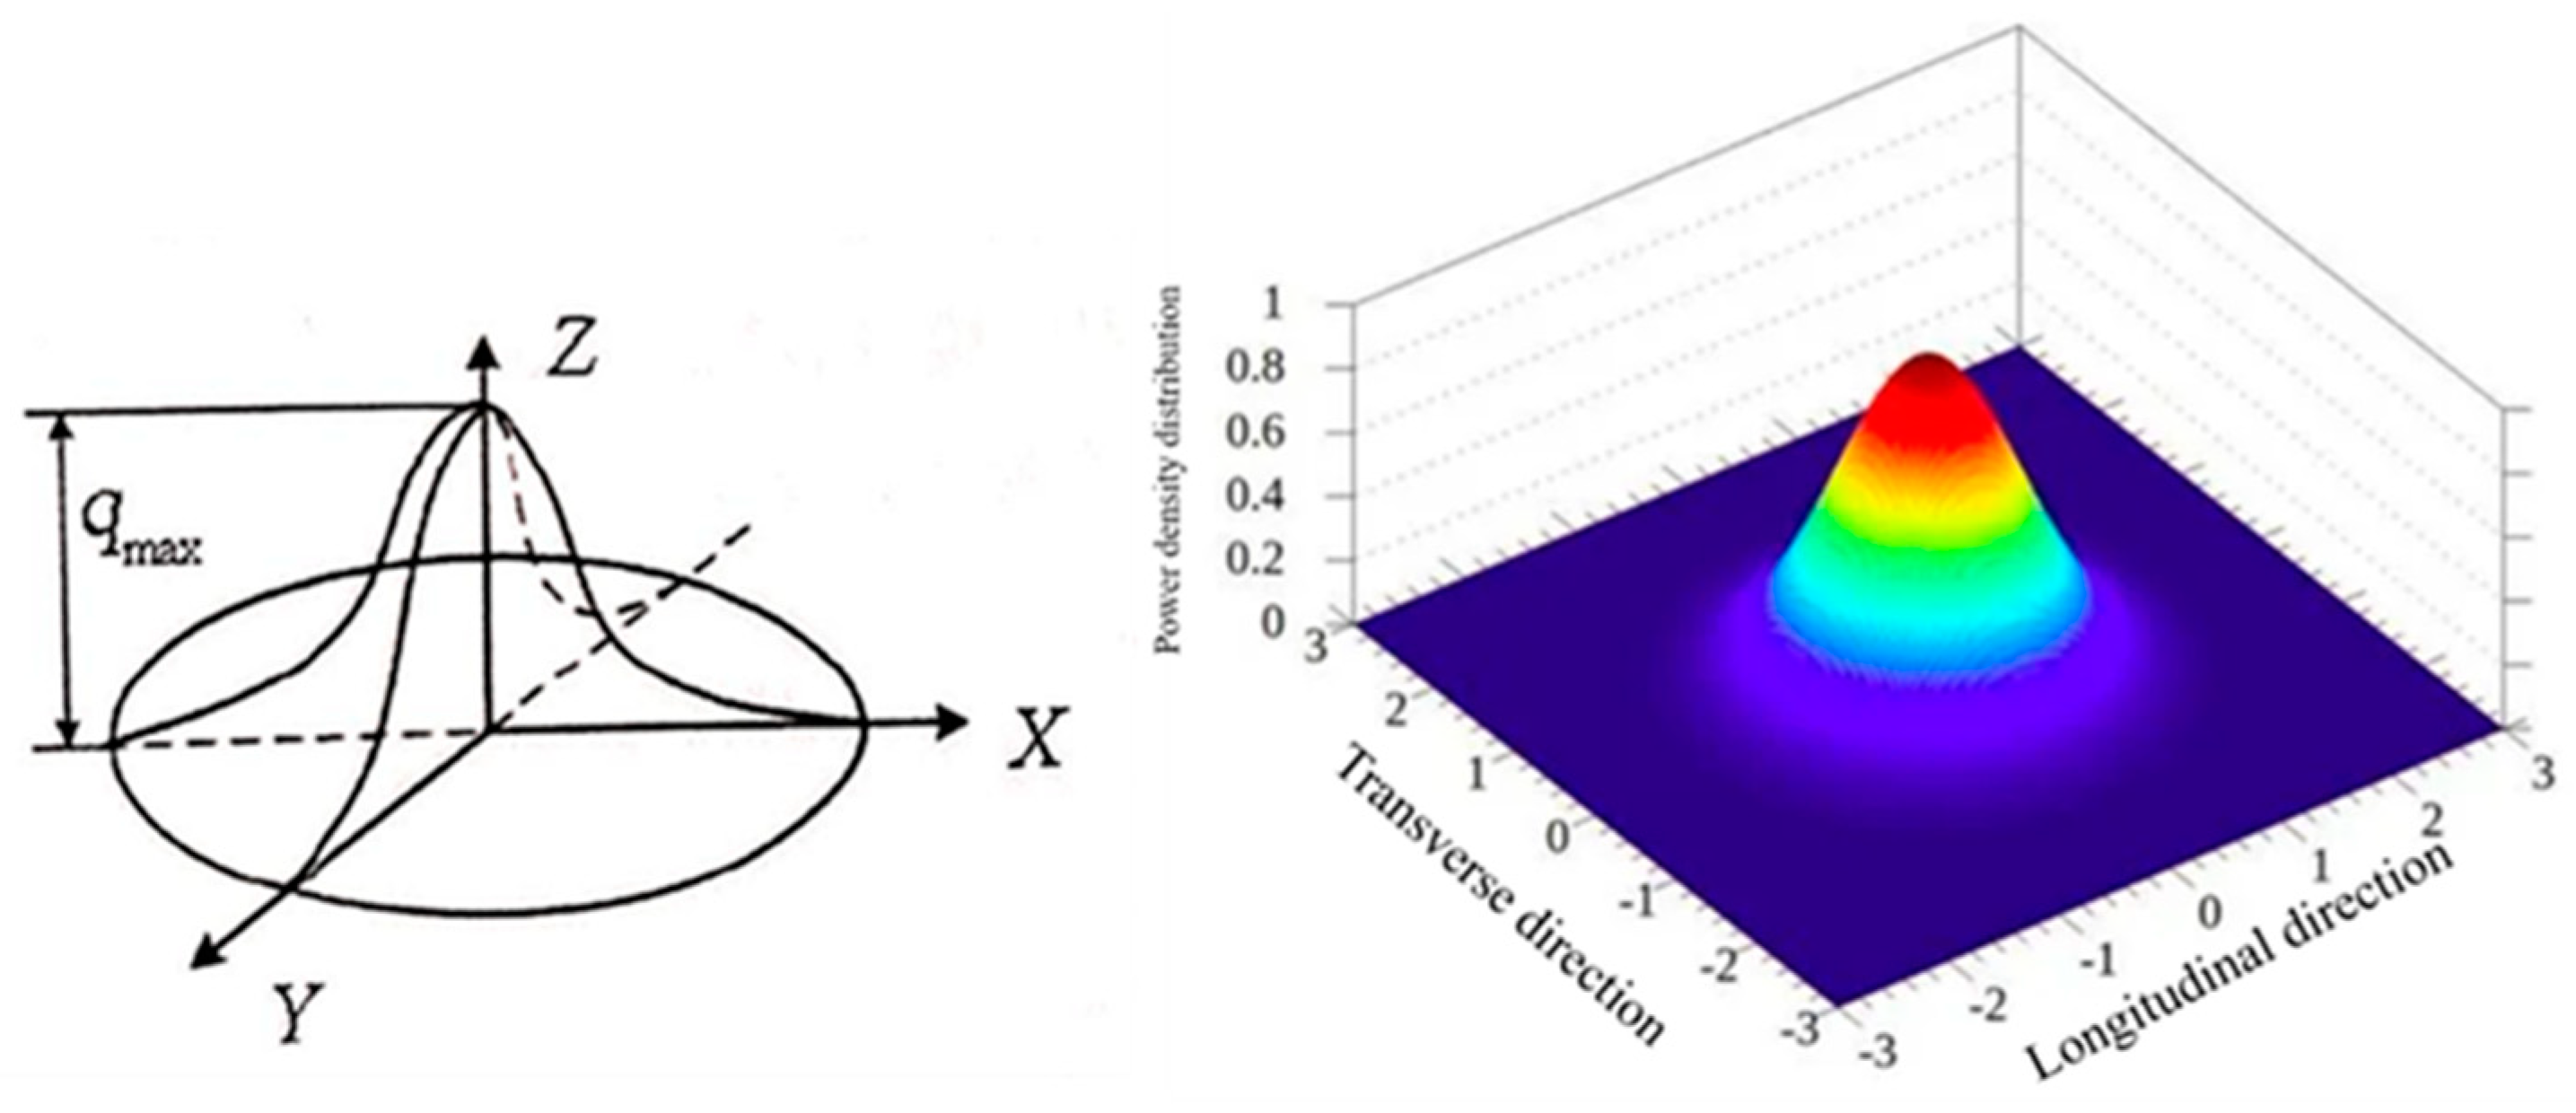
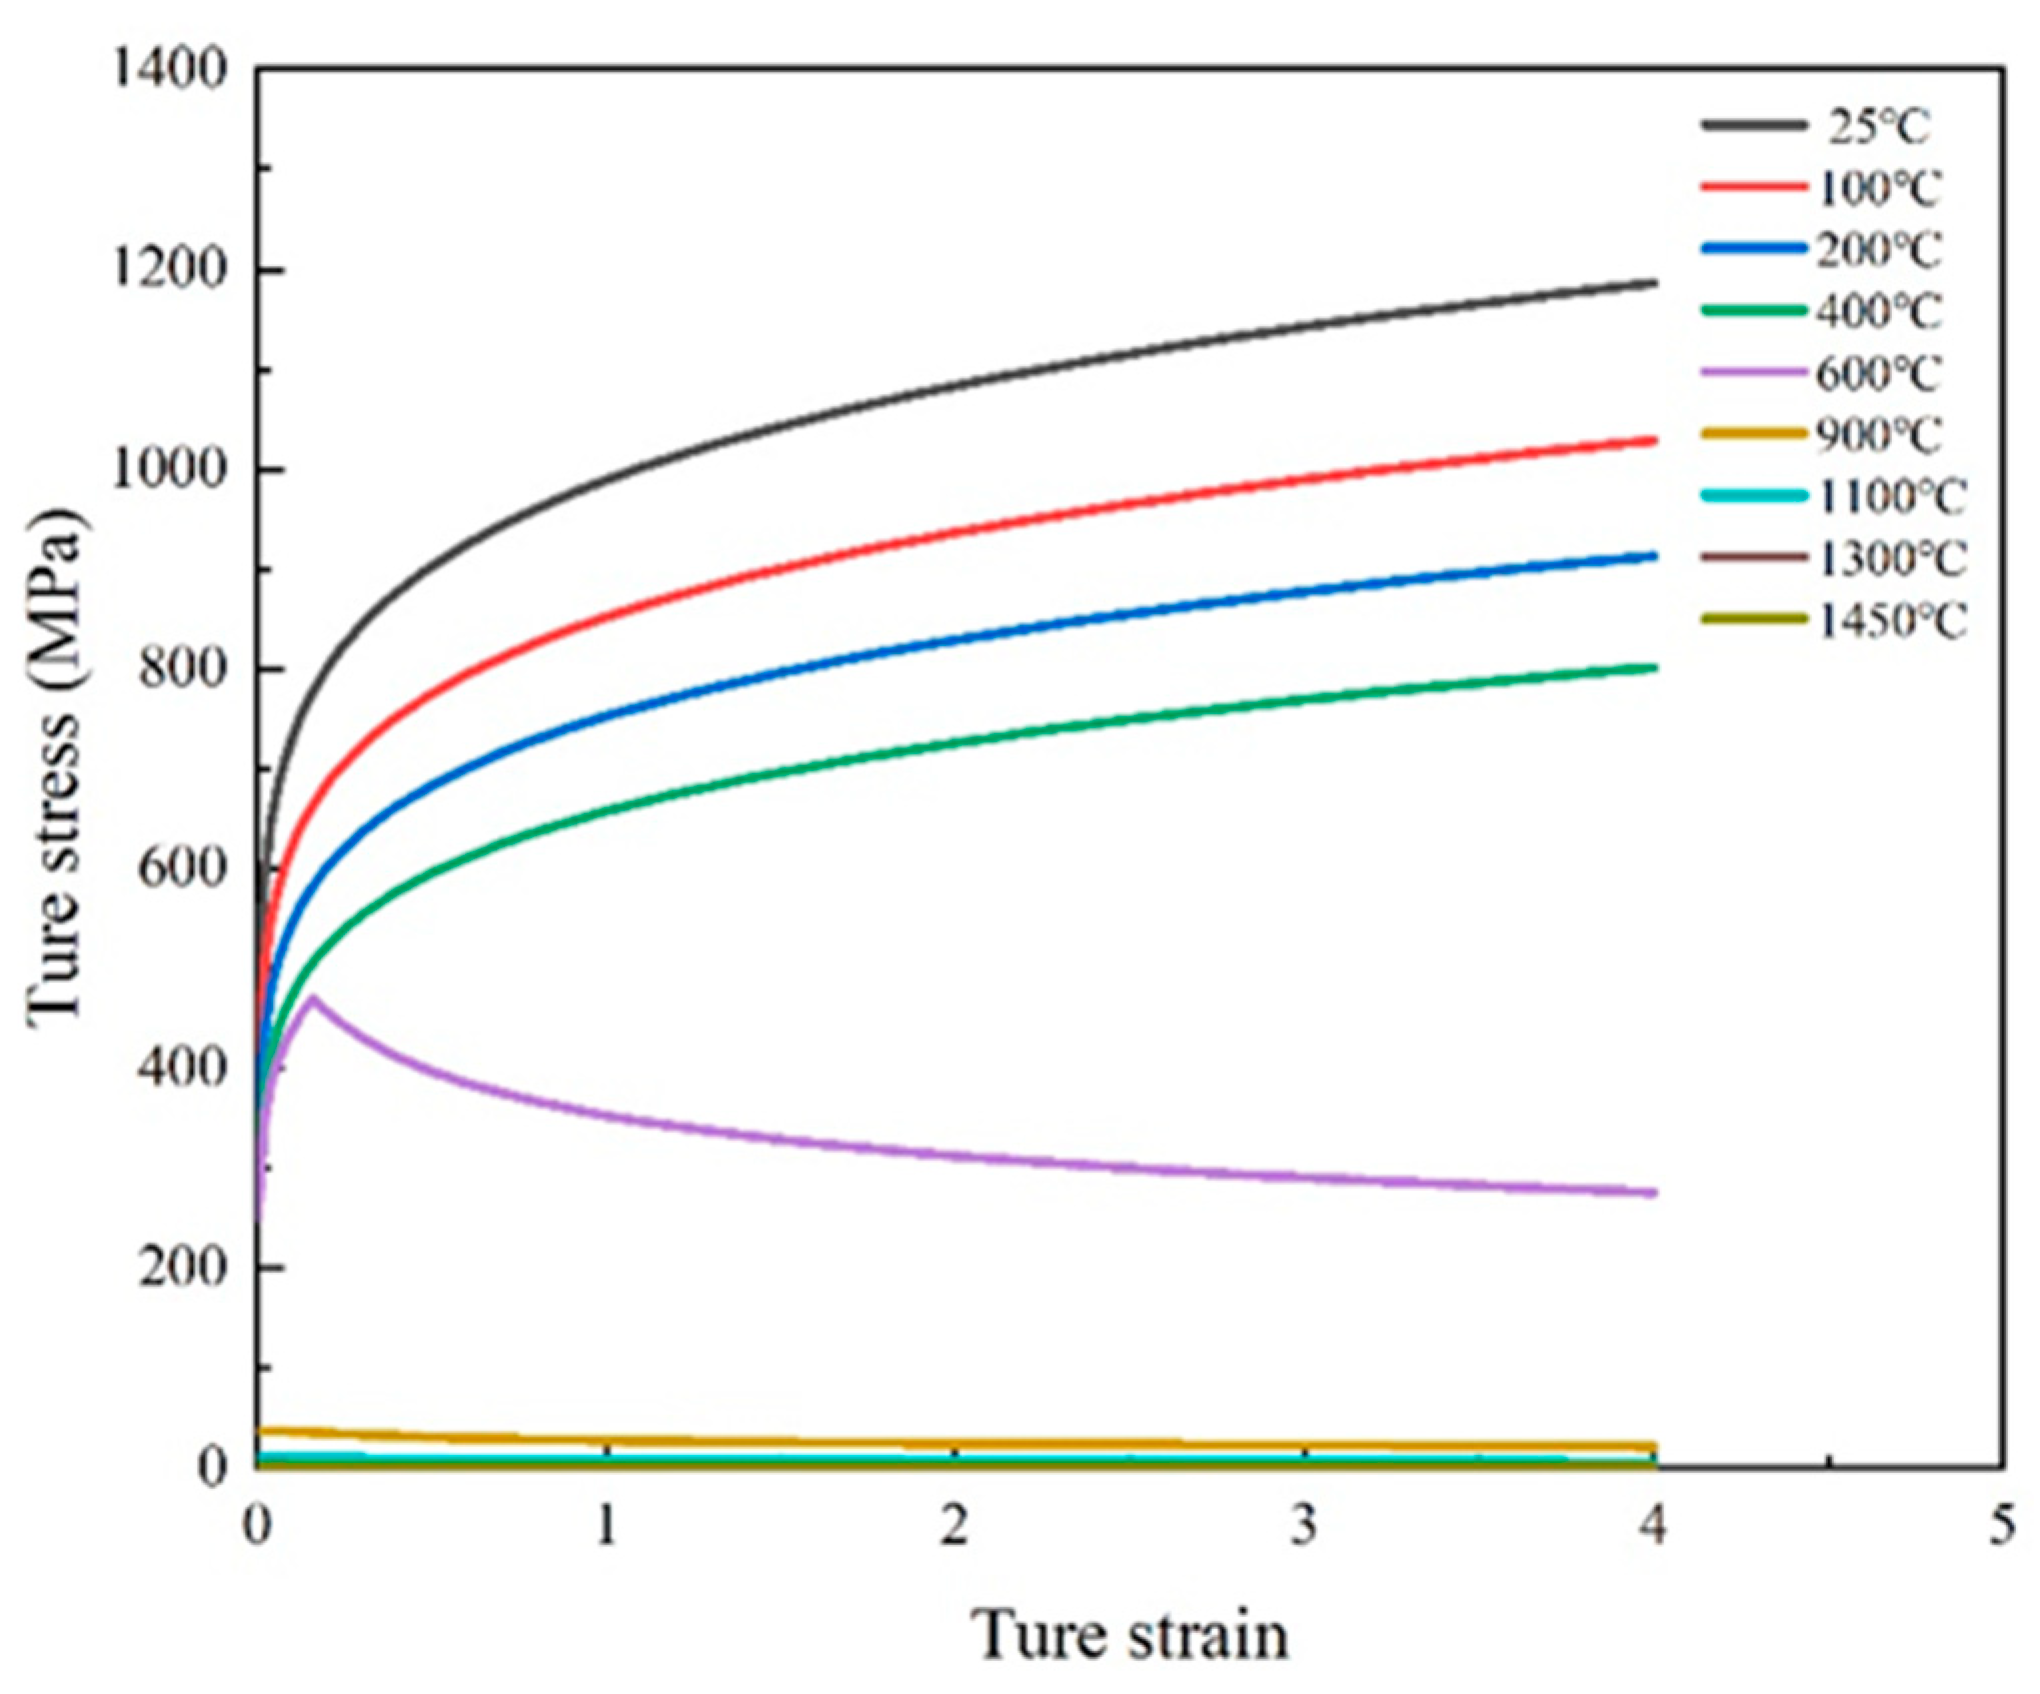
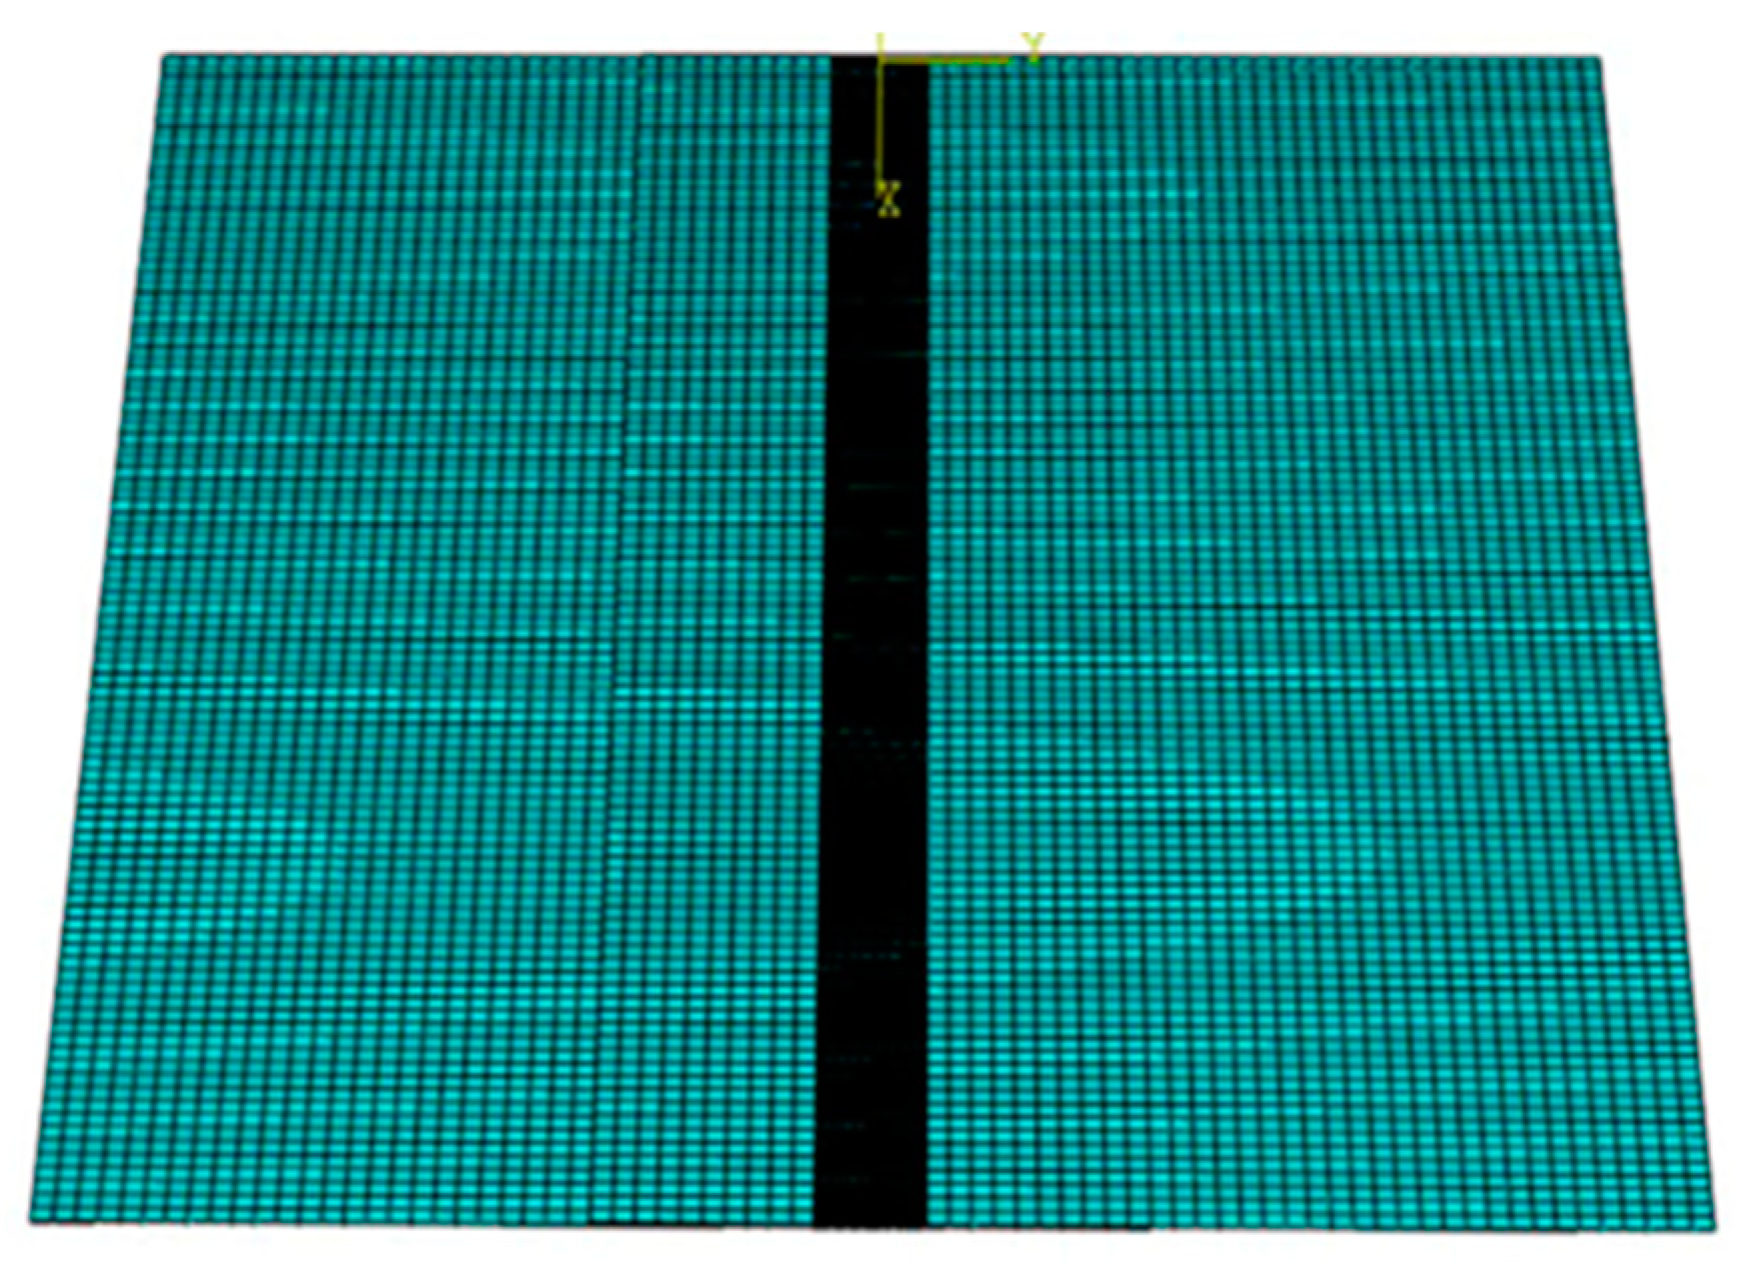
2.2. Simulation Methods

This study adopts the Gaussian heat source model, a widely used approach for simulating the temperature field in welding processes due to its ability to accurately represent the concentrated heat input of laser welding. As depicted in Figure 2, the heat flow distribution function [21,22] is expressed as follows:
q r = q O e c 1 r 2 .
Here, q(r) represents the surface heat flow at a distance r from the center of the heat source; q(O) denotes the maximum heat flow at the center of the heat source; c1 is the concentration coefficient of the heat source, which depends on the welding method; and r is the distance from the center of the heat source to the current calculation point. This model captures the heat intensity decay as a function of distance, accurately reflecting the localized heat input in pulsed laser welding.
The heat transfer, thermal expansion, and contraction of materials during the welding process are governed by their physical properties, such as thermal conductivity, thermal expansion coefficient, and specific heat capacity. These properties are particularly critical in laser welding, where localized heat input creates steep thermal gradients. Because these parameters vary significantly with temperature, obtaining the thermophysical properties of materials across a wide temperature range is essential for accurately simulating the dynamic heat transfer, expansion, and contraction behavior during the welding process. The thermophysical properties of 430 ferritic stainless steel used in this study, including temperature-dependent thermal conductivity, thermal expansion coefficient, and specific heat capacity, are presented in Figure 3 and Table 2.
To address the complex thermal and mechanical behaviors in the welding process, this study employs progressive meshing, as shown in Figure 4, with all cell types designated as C3D8RT elements, which are suitable for coupled temperature-displacement analysis. The weld zone employs a fine mesh with a minimum size of 0.02 mm × 0.05 mm × 0.1 mm, enabling precise resolution of steep thermal gradients and localized deformations, thereby ensuring computational accuracy. In contrast, regions farther from the weld zone use progressively larger mesh sizes to reduce the total number of elements, optimizing computational efficiency without compromising accuracy in critical areas. The stress exerted by the clamp on the weldment is modeled by fully constraining the degrees of freedom in the clamped region, effectively fixing it during the simulation.

3. Results and Discussions

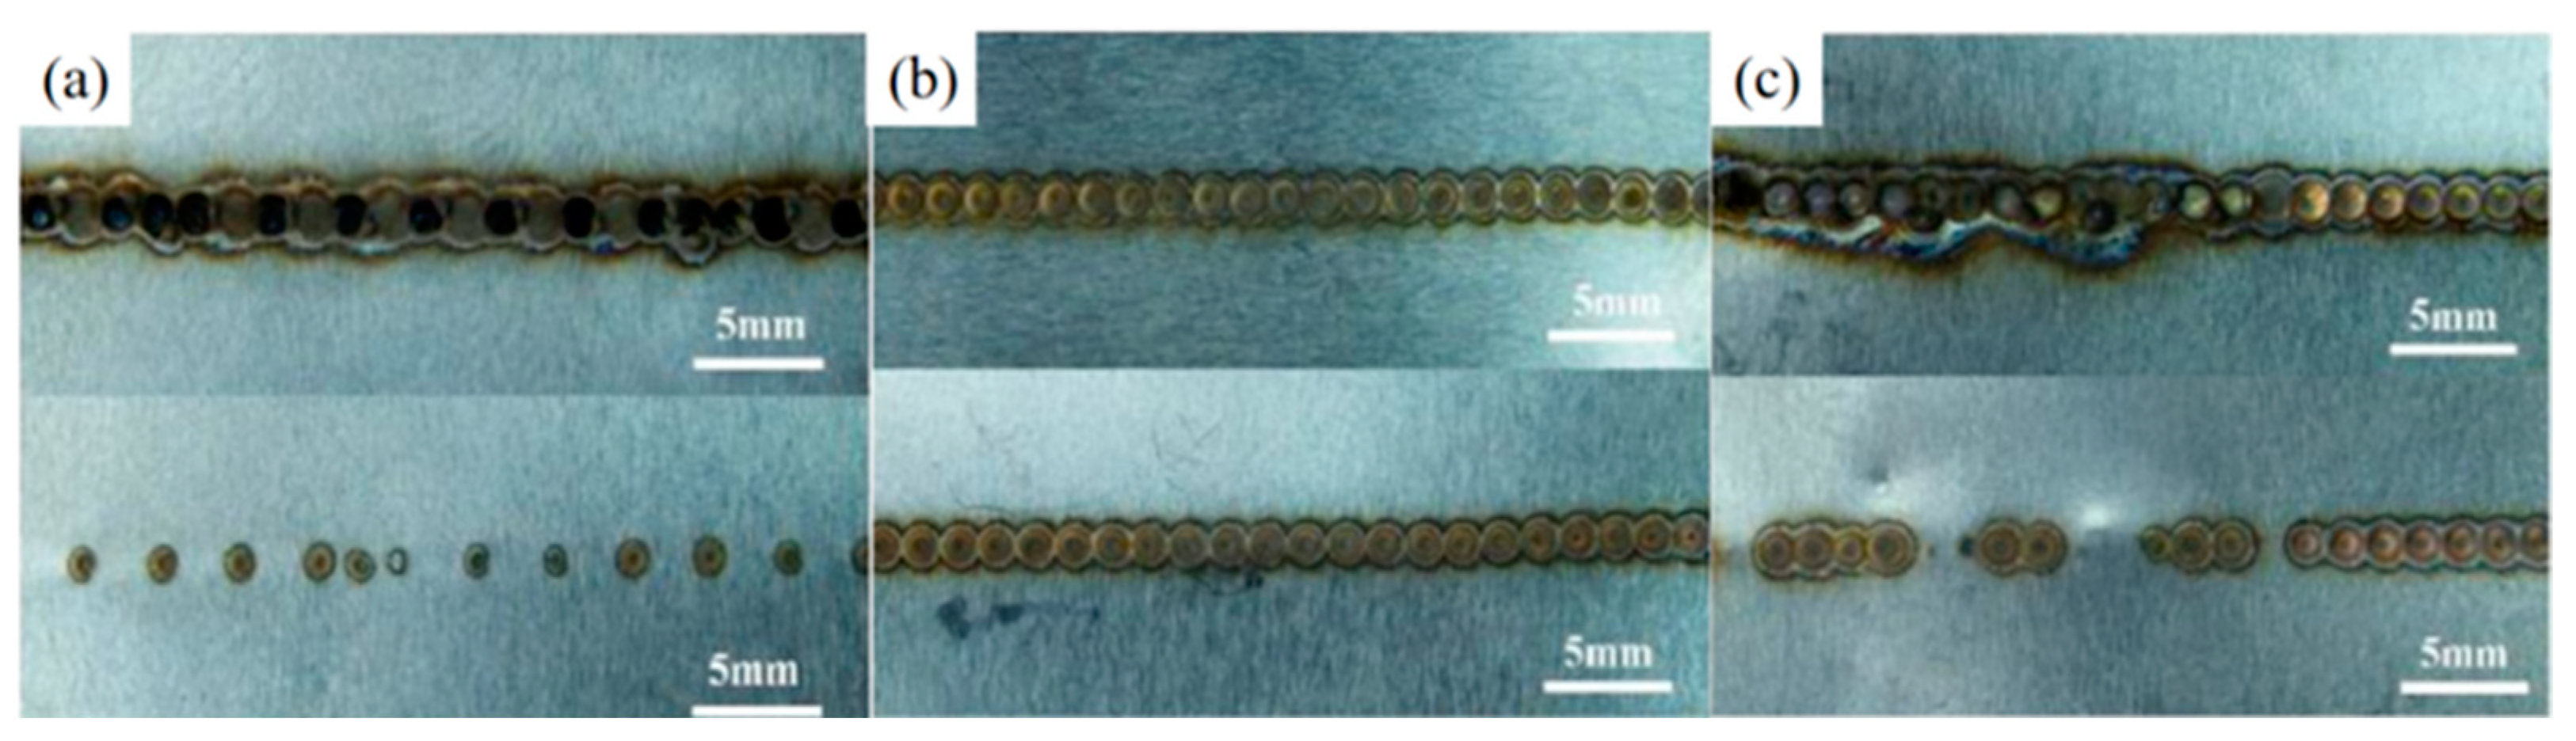
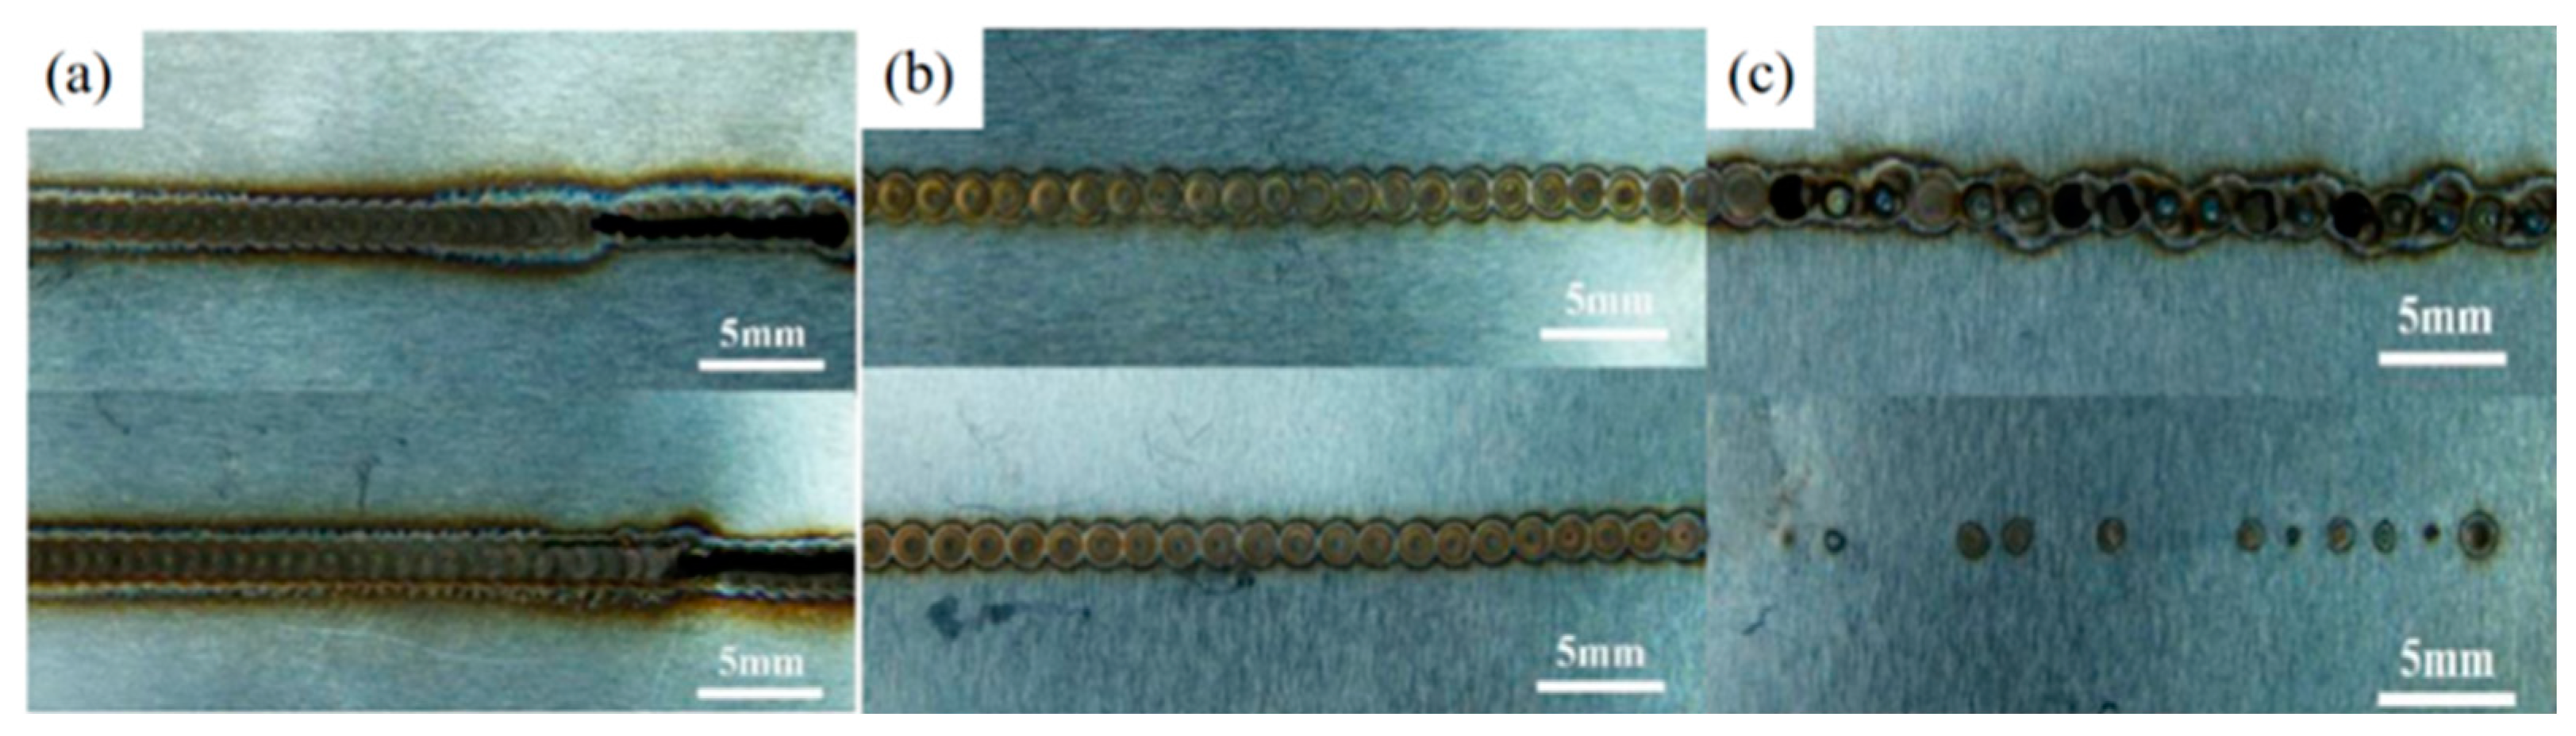
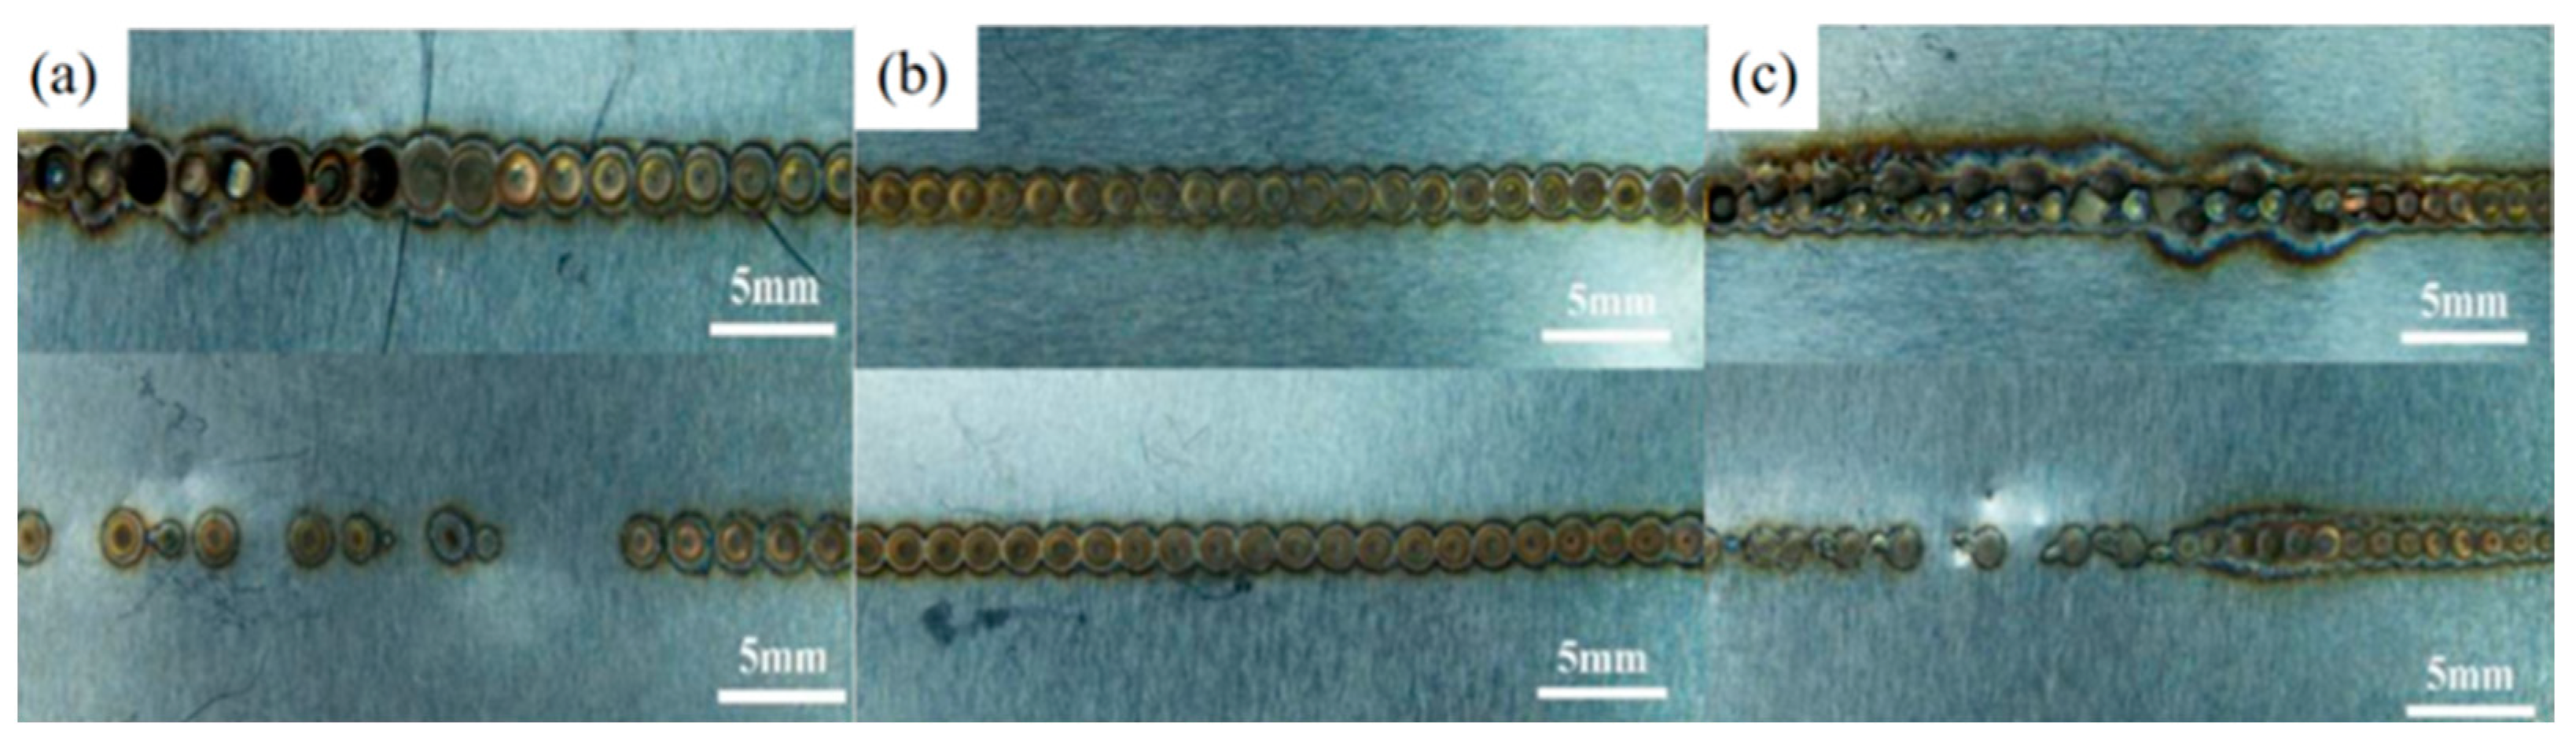
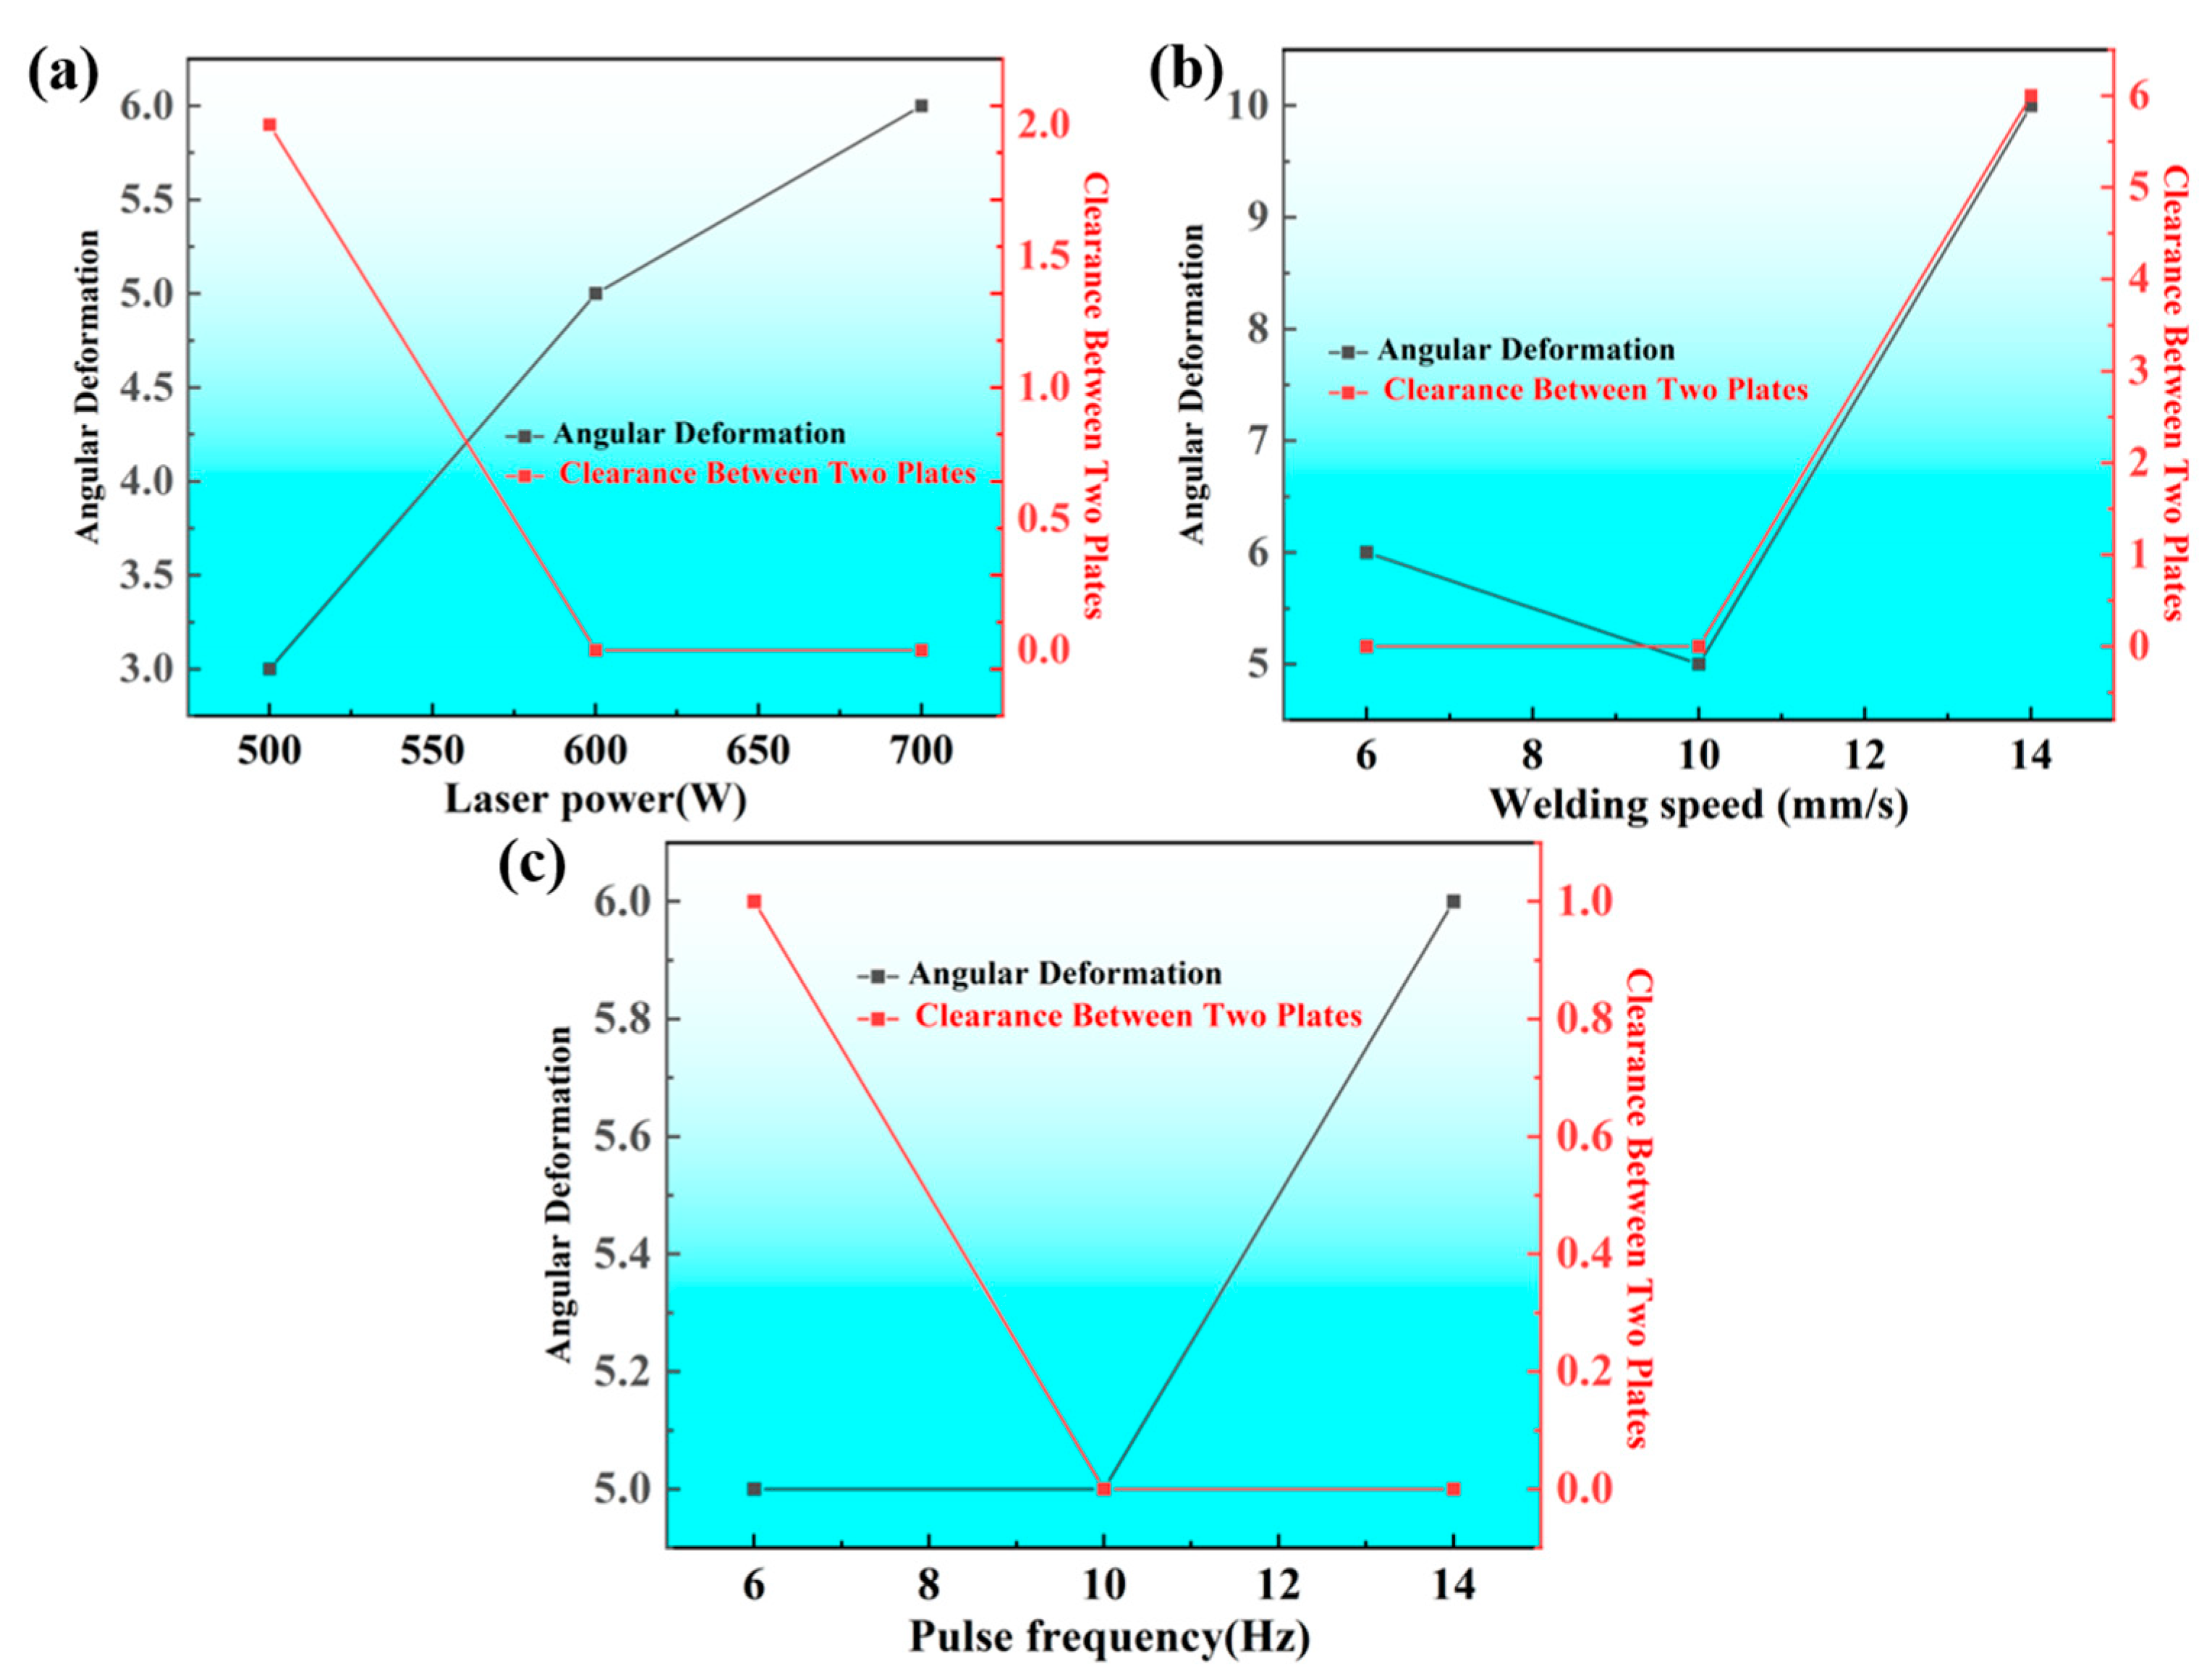
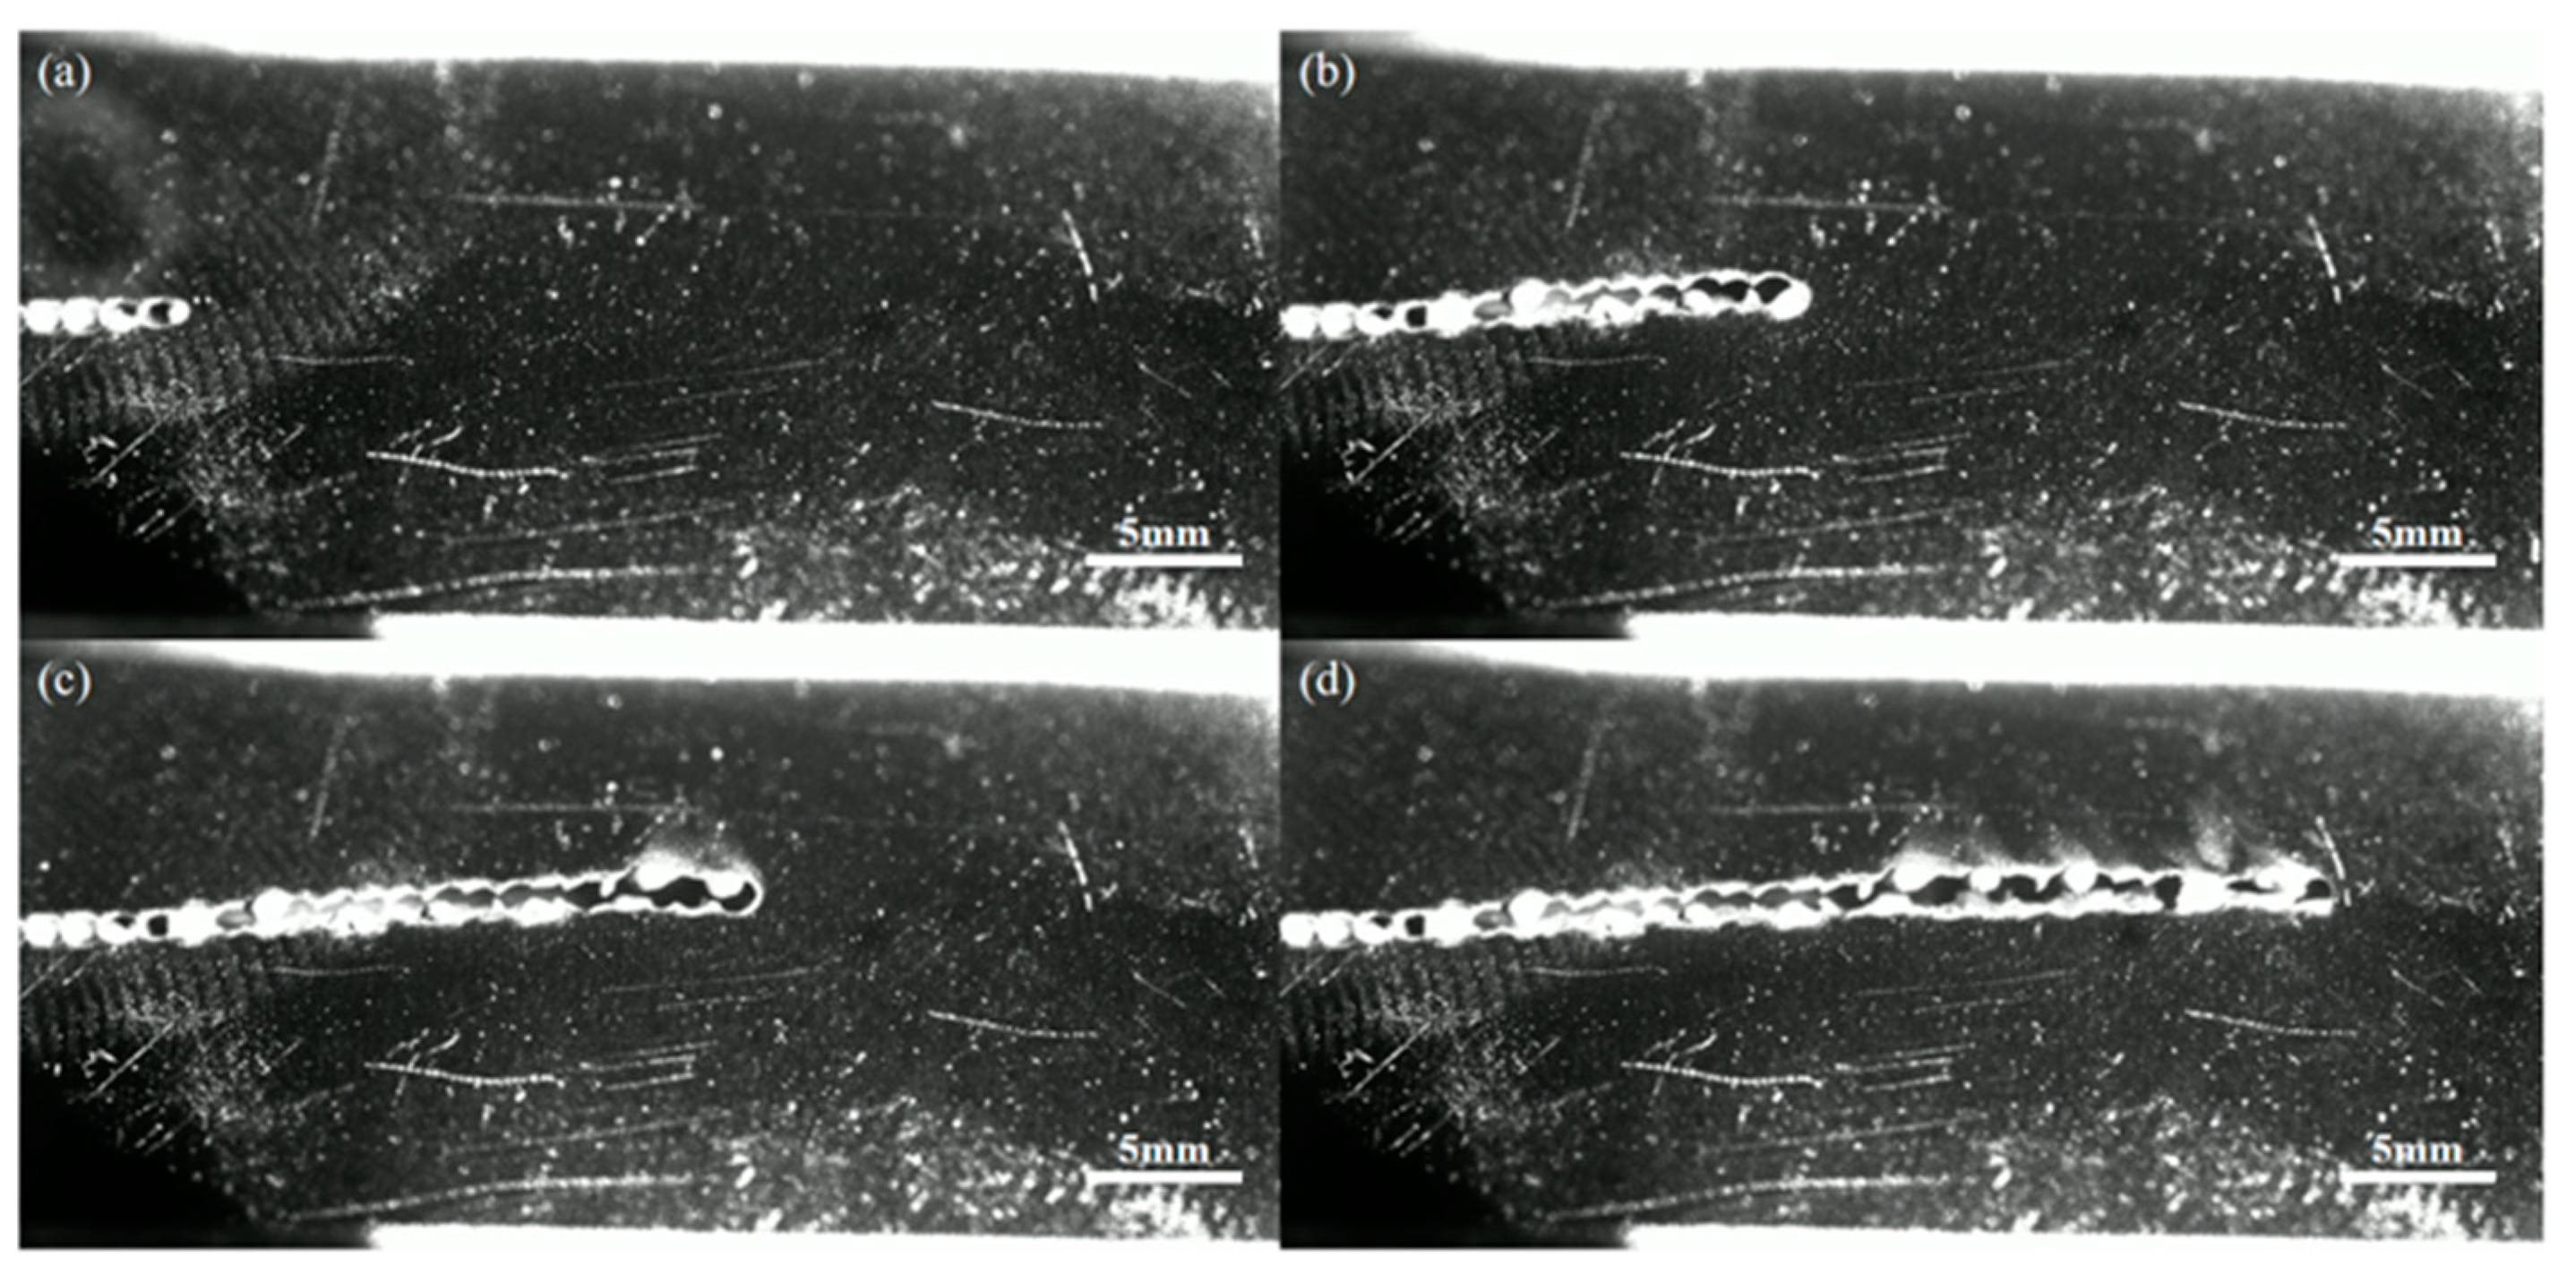
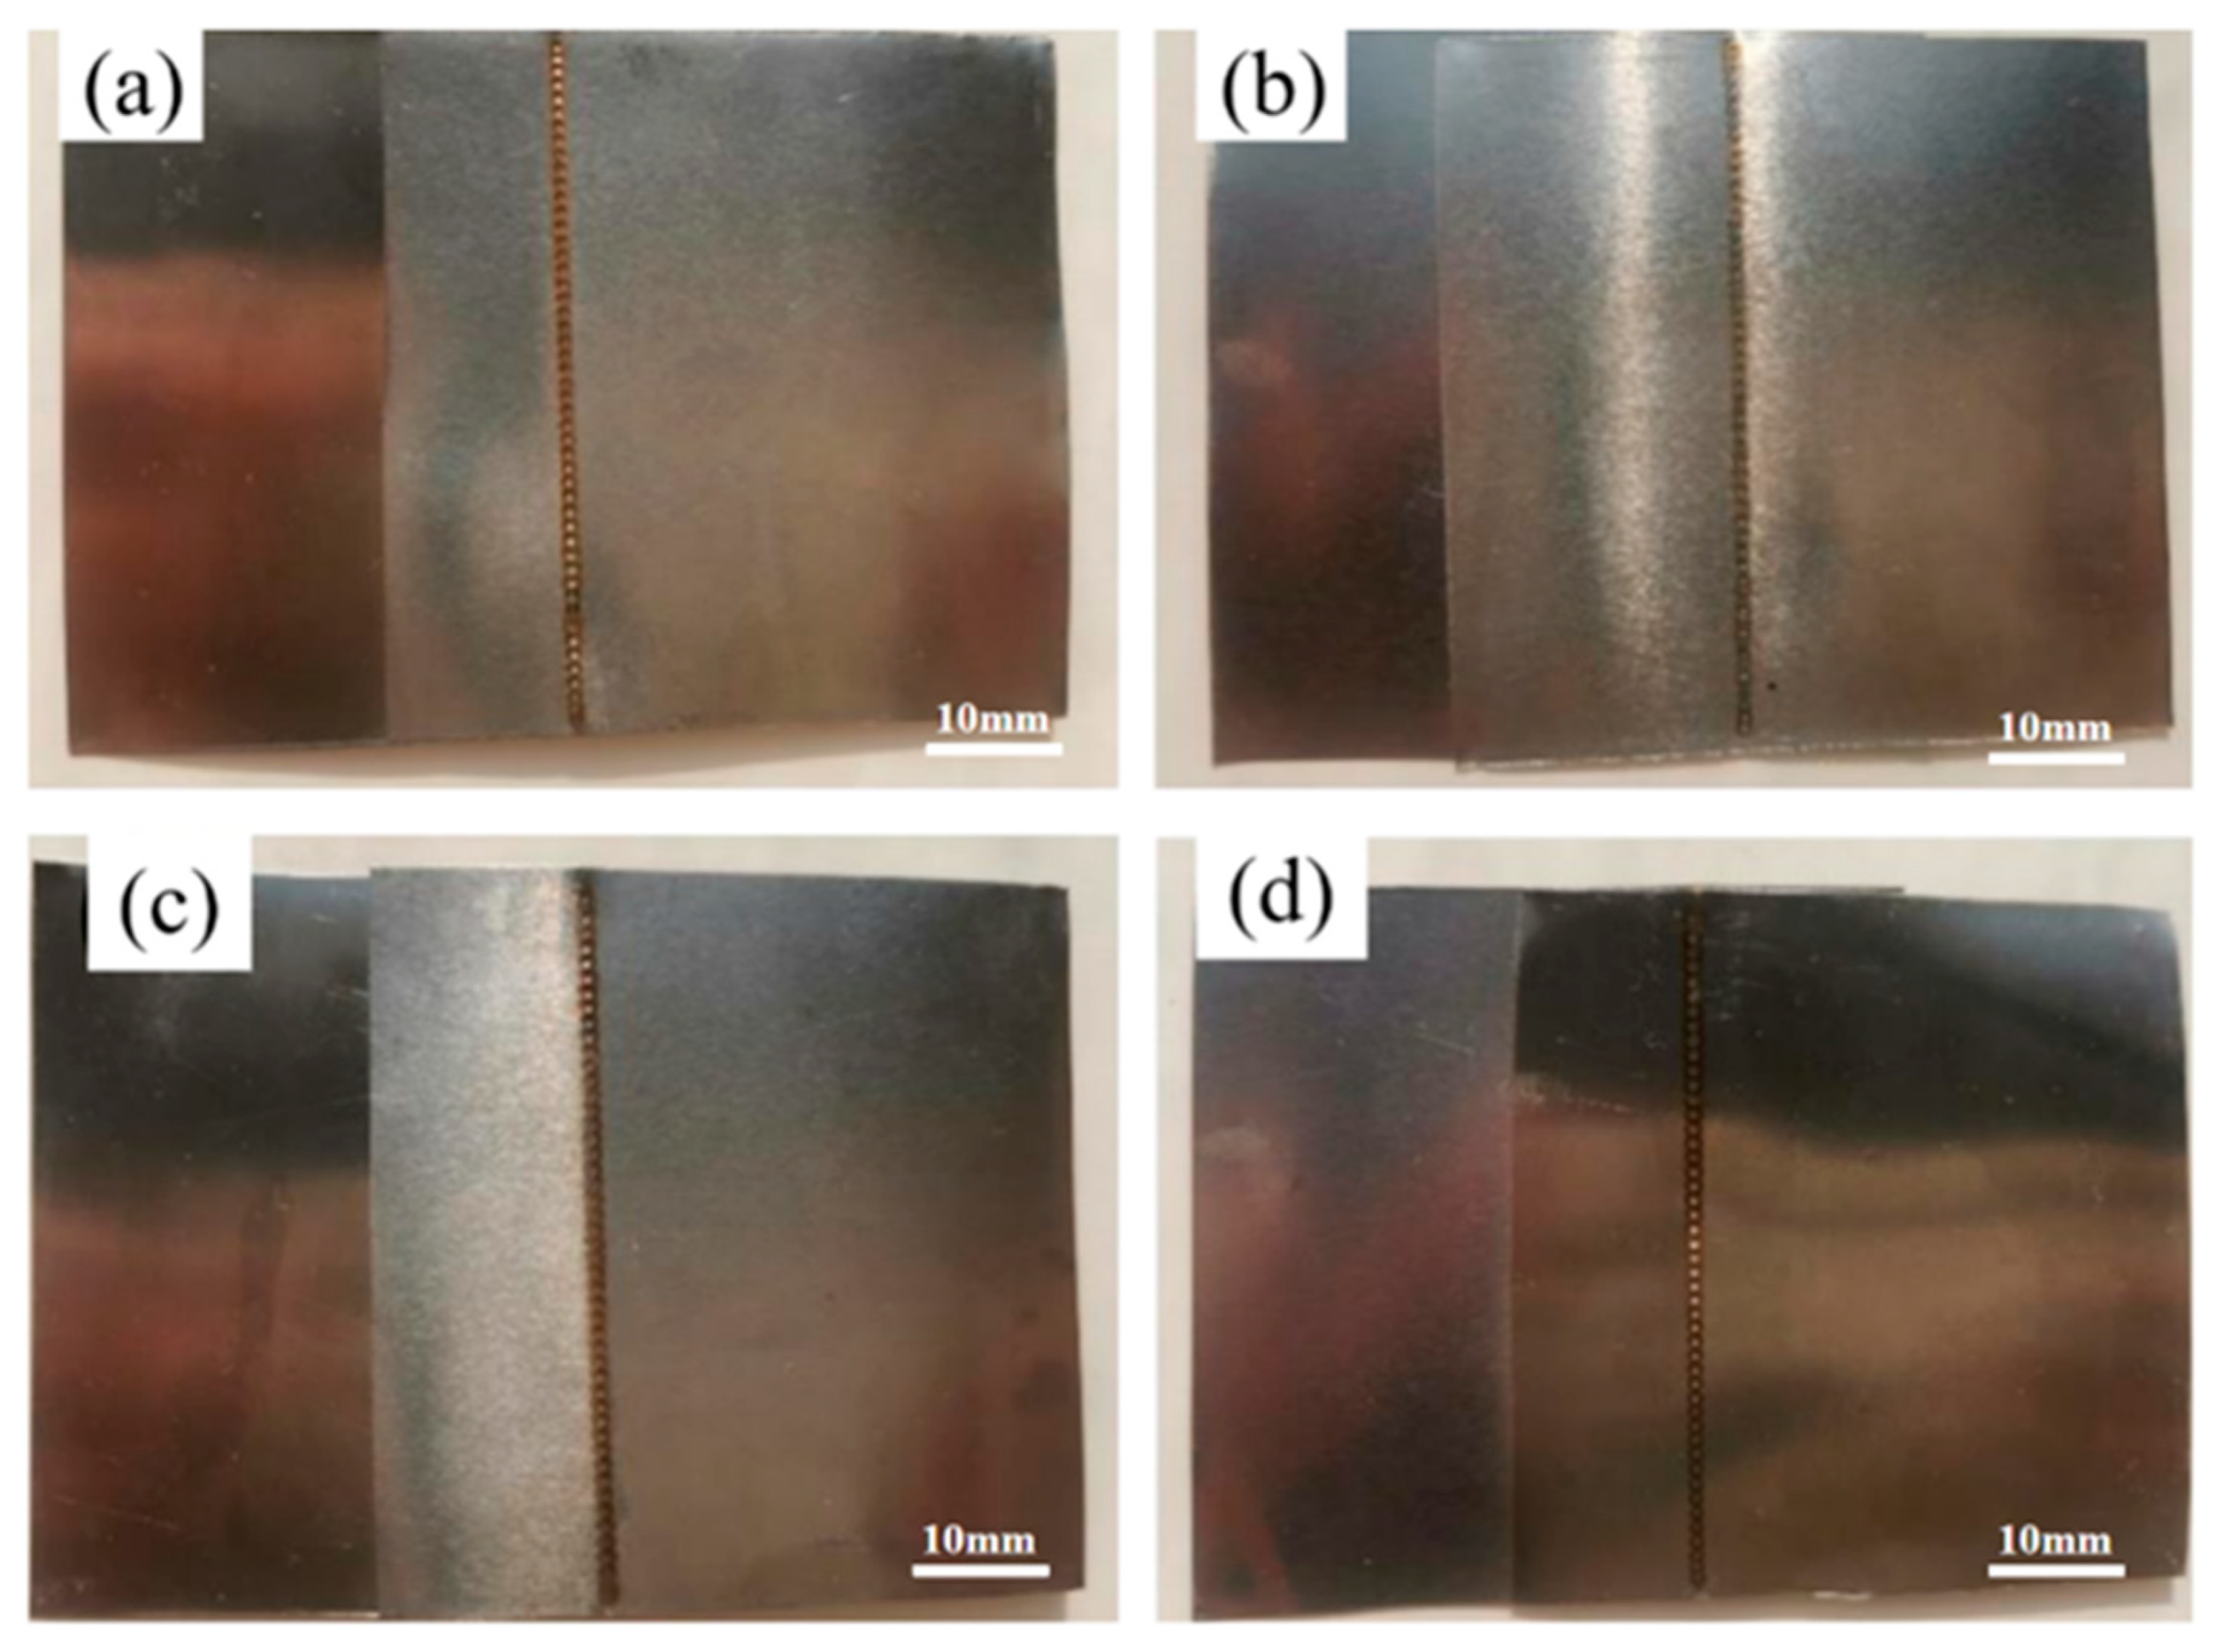
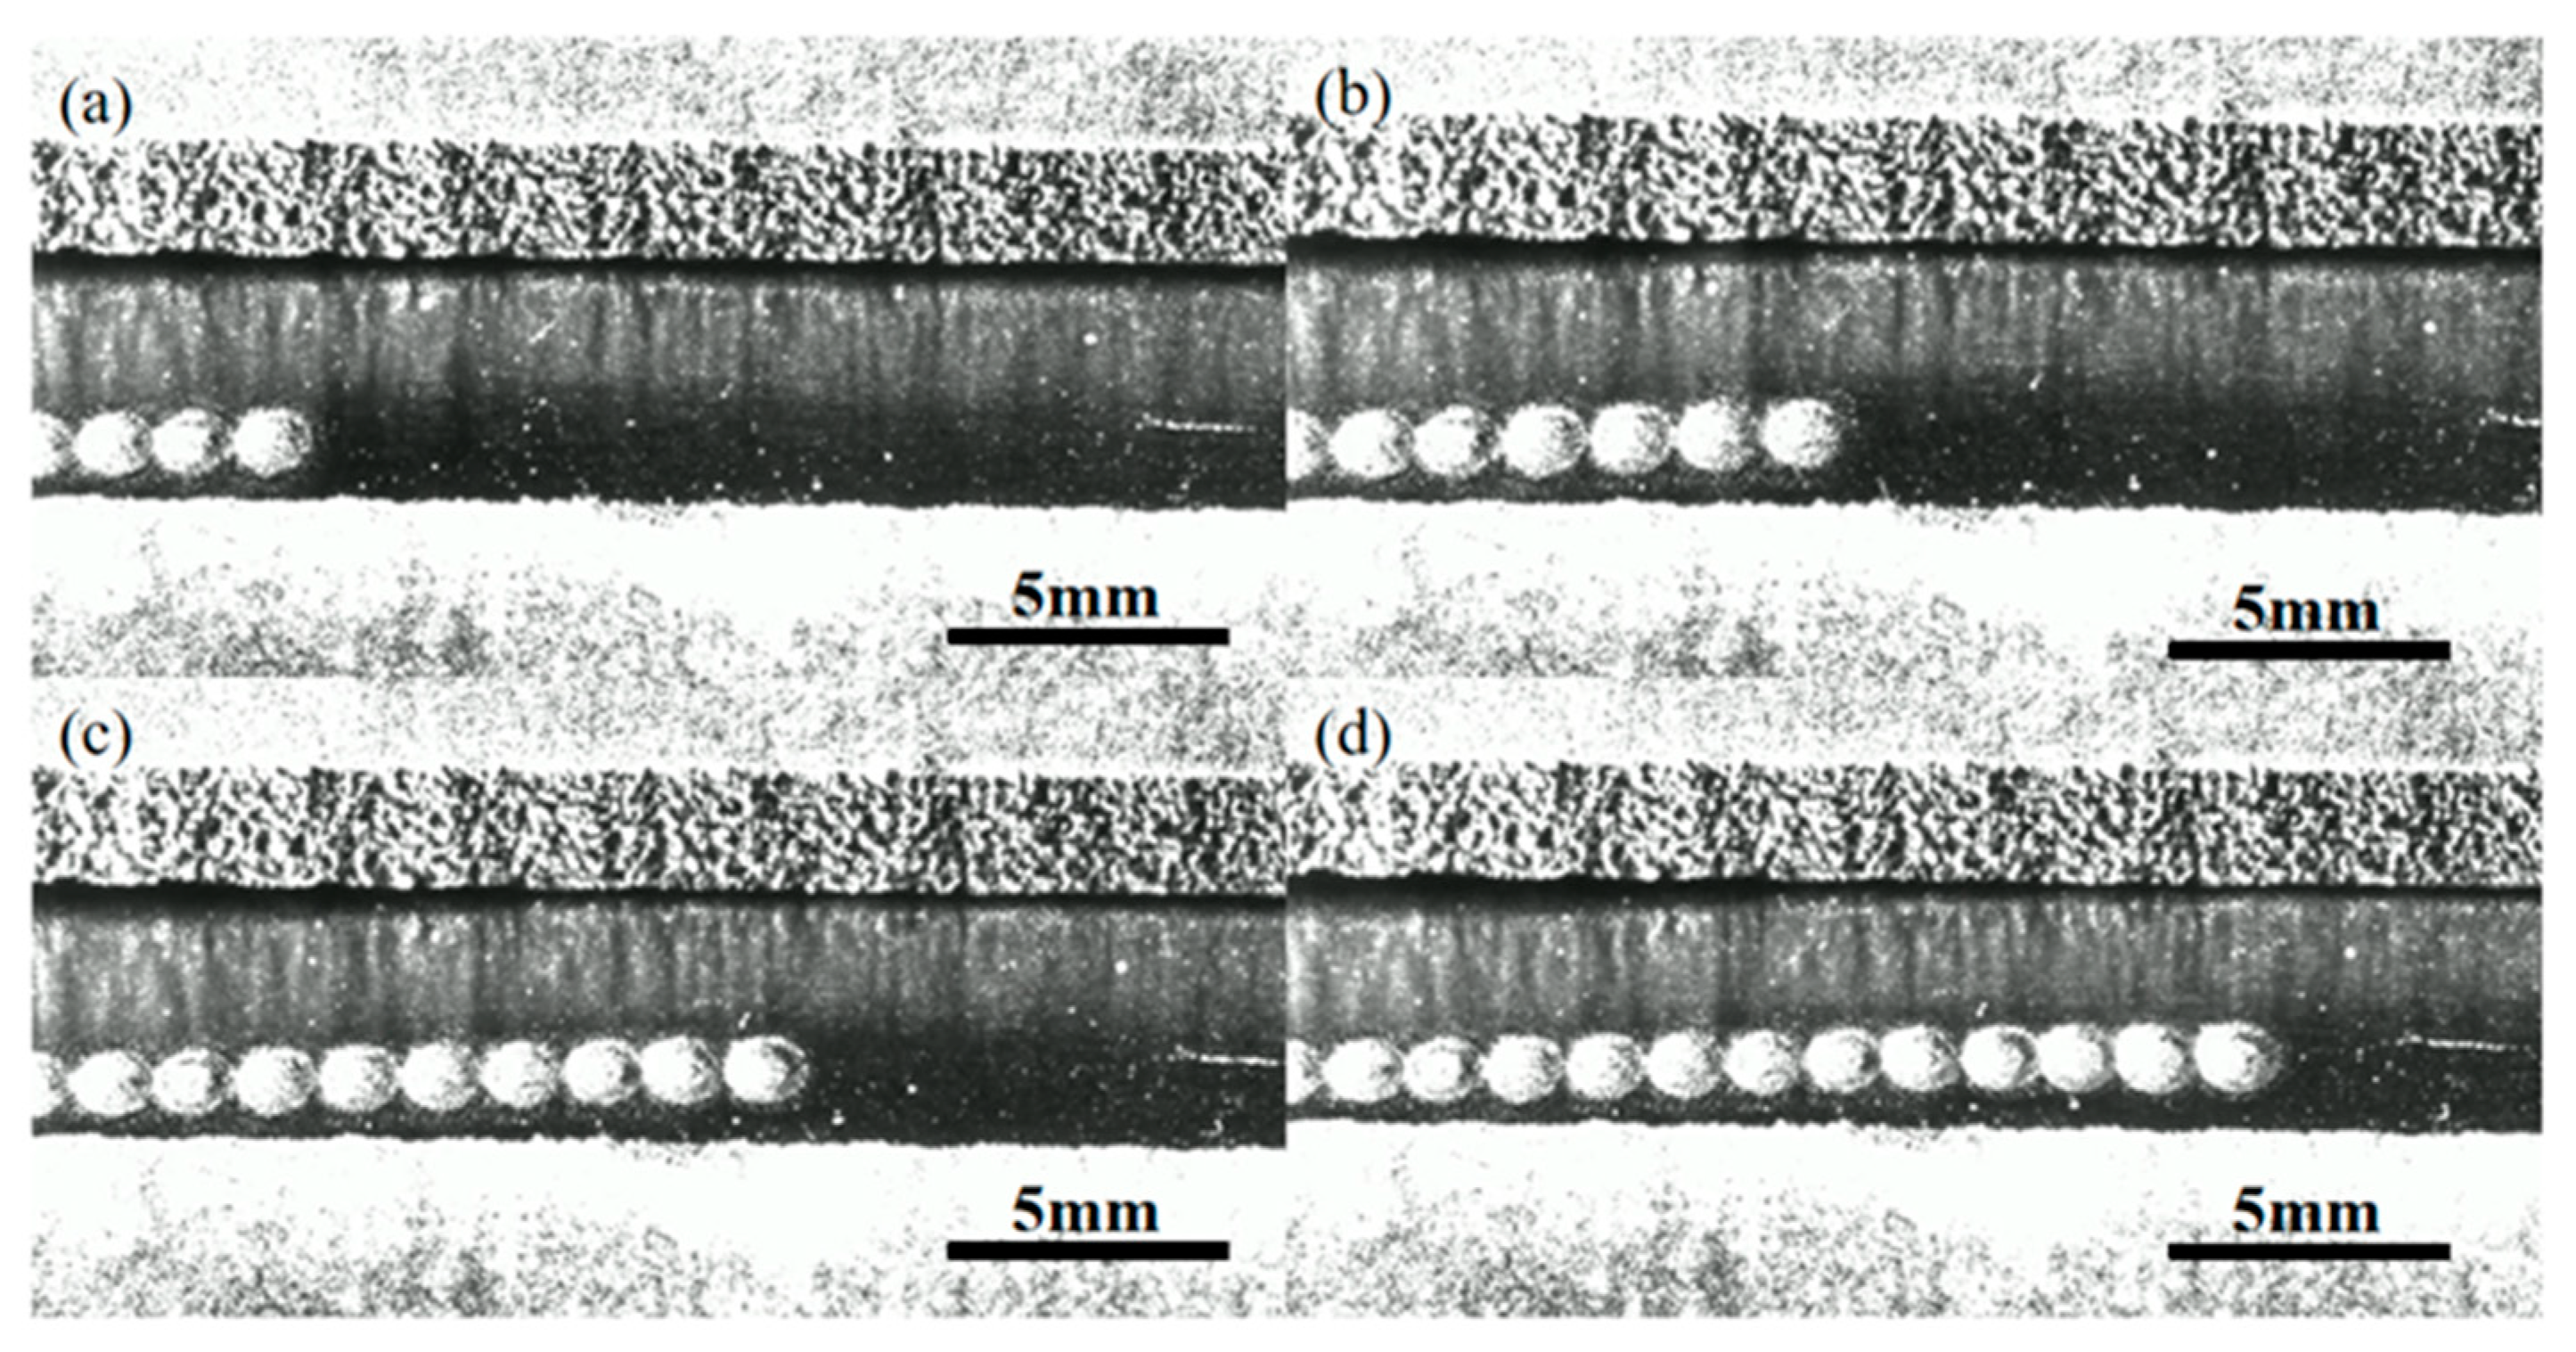
3.1. Effect of Welding Parameters on the Deformation of Ultra-Thin Stainless Steel Welded Joints

Figure 5 illustrates the effect of laser power on the surface morphology of the welded joint, conducted at a welding speed of 10 mm/s and a pulse frequency of 10 Hz. Laser power is a critical parameter influencing energy transfer, heat distribution, and the resulting weld quality. At a laser power of 500 W (Case 1), partial burn-through occurs in the upper plate of the lap joint. This results from the air gap between the plates, where the low thermal conductivity of air impedes heat transfer to the lower plate. Consequently, the upper plate absorbs excessive energy, leading to localized overheating and burn-through. At 600 W (Case 2), the weld seam is fully melted through and well-formed, with no burn-through observed. This laser power level provides sufficient energy for complete weld formation while minimizing overheating. However, slight deformation occurs due to internal stresses generated during the cooling phase, resulting in macroscopic deformation. At 700 W (Case 3), burn-through occurs in the upper plate of the lap joint due to excessive laser power. The surplus energy exceeds the material’s capacity to dissipate heat effectively, resulting in localized overheating and burn-through. This demonstrates the adverse effects of exceeding the optimal power range. Both excessively high and low laser power result in burn-through, highlighting a non-linear relationship between laser power and the weld’s surface morphology. This non-linearity arises from the complex interplay between heat input, thermal conductivity, and the material’s ability to dissipate energy, underscoring the need for precise parameter optimization.
Figure 6 illustrates the effect of welding speed on the surface morphology of welded joints, conducted at a laser power of 600 W and a pulse frequency of 10 Hz. Welding speed is a key parameter that influences heat input, melt width, and deformation behavior during the welding process. At a welding speed of 6 mm/s (Case 4), the front section of the two ultra-thin stainless-steel plates is fully laser welded. This slower speed allows more energy to be absorbed by the material, resulting in an increased melt width and a higher degree of angular deformation compared to Case 2. At a welding speed of 14 mm/s (Case 5), the front section of the overlapping plates is welded together, while the back section remains unwelded. The high welding speed reduces the heat input, preventing sufficient energy transfer to the back section. This leads to a significantly larger melt width in the unwelded regions compared to the welded regions. After removing the clamp, the gap between the back halves of the two plates reaches up to 6 mm due to insufficient bonding in the back section and residual stresses from uneven heat distribution. The resulting deformation is illustrated in Figure 7.
Figure 8 illustrates the effect of pulse frequency on the surface morphology of the welded joints, conducted at a laser power of 600 W and a welding speed of 10 mm/s. Pulse frequency significantly influences the energy delivery and thermal profile during welding, affecting both penetration and deformation. At a pulse frequency of 6 Hz (Case 6), the upper plate of the welded joint is fully penetrated, showing significant warpage deformation. The lower plate exhibits a discontinuous weld joint due to insufficient energy transfer. The extended pulse duration at lower frequencies concentrates heat in the upper plate, leading to overheating, excessive deformation, and a gap of approximately 1 mm between the plates after removing the clamp. At a pulse frequency of 14 Hz (Case 7), the upper plate is fully welded through, exhibiting substantial warpage. The lower plate shows a discontinuous weld joint due to insufficient energy transfer. The shorter pulse duration at higher frequencies reduces the heat input per pulse, leading to incomplete energy transfer to the lower plate and excessive thermal stress in the upper plate.
Table 3 summarizes the effect of laser power, welding speed, and pulse frequency on the surface morphology of the weld. Figure 9 shows the effect of laser power, welding speed, and pulse frequency on the surface morphology of the weld. This analysis provides a comprehensive understanding of how these parameters affect key factors such as angular deformation, interpolate gap, and weld penetration. Table 3 shows that laser power, welding speed and pulse frequency have a non-linear relationship with weld surface morphology, influencing the parameters of angular deformation, inter-plate gap, and weld penetration. This non-linearity highlights the complex interactions between the process parameters and their joint influence on weld quality. It suggests that the effect of these parameters on weld surface morphology is irregular, emphasizing the need for a more holistic approach to optimizing weld quality. Adjustment of welding process parameters alone is not sufficient; other measures, such as optimized tool design and real-time feedback systems, are necessary to achieve consistently high-quality welded joints.

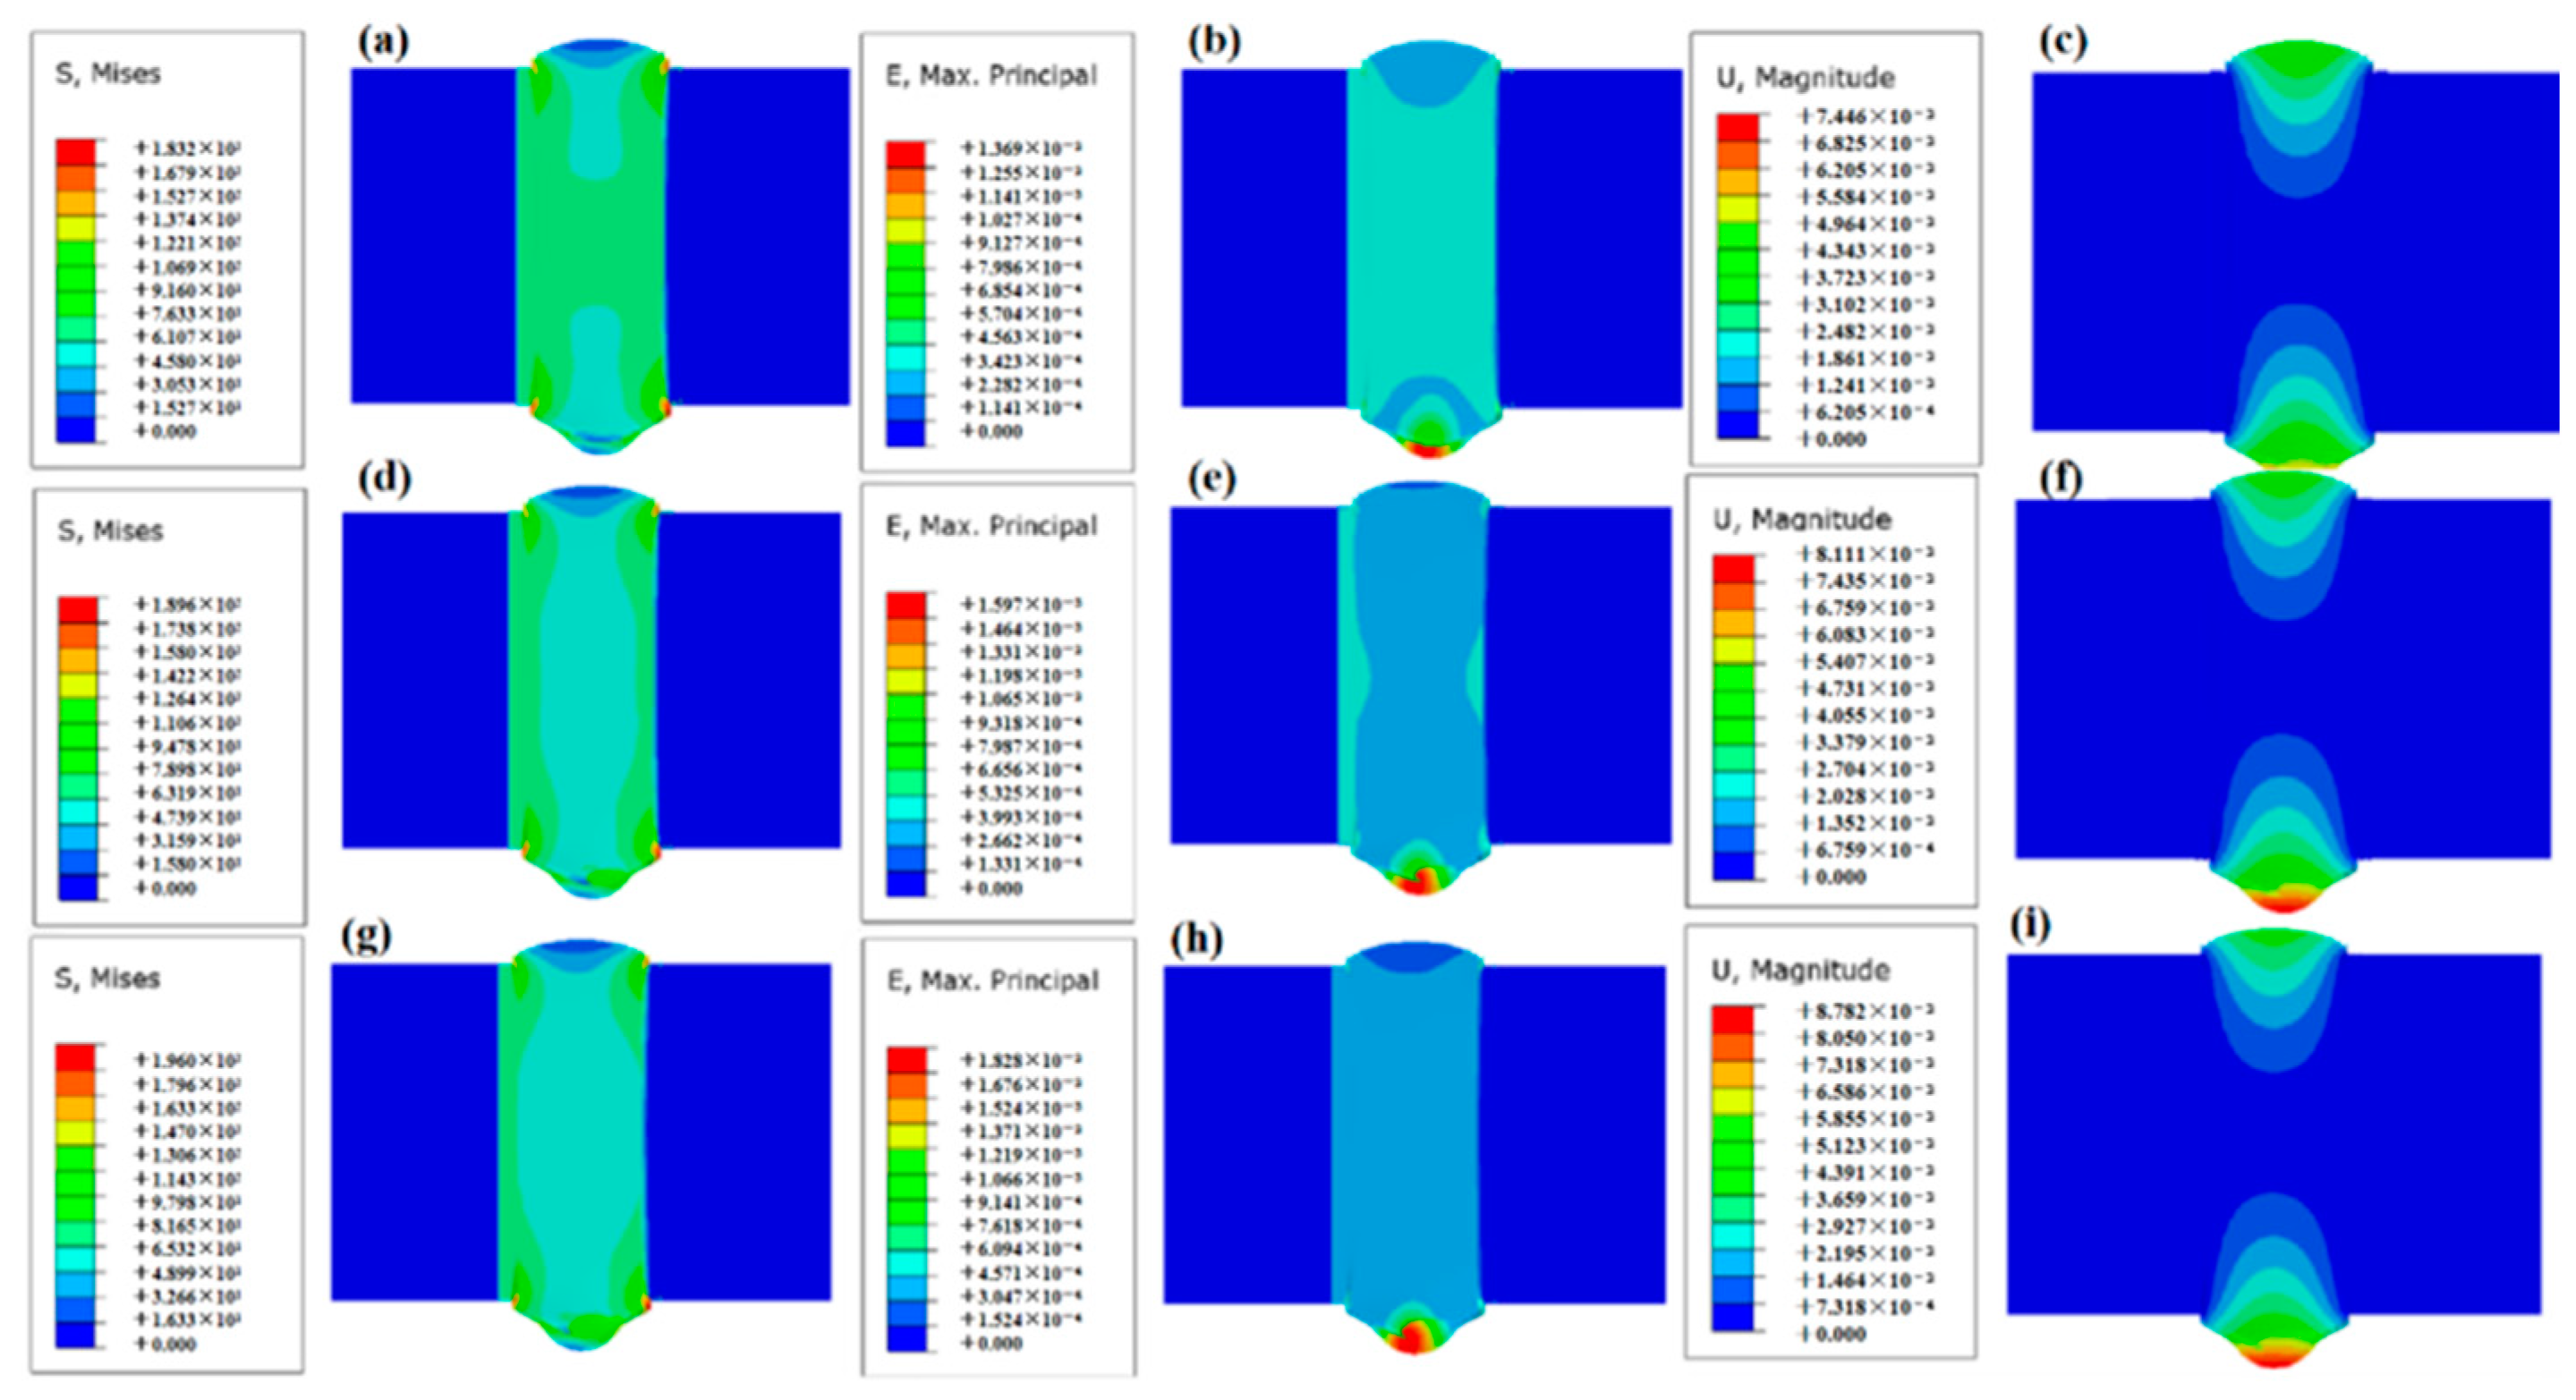
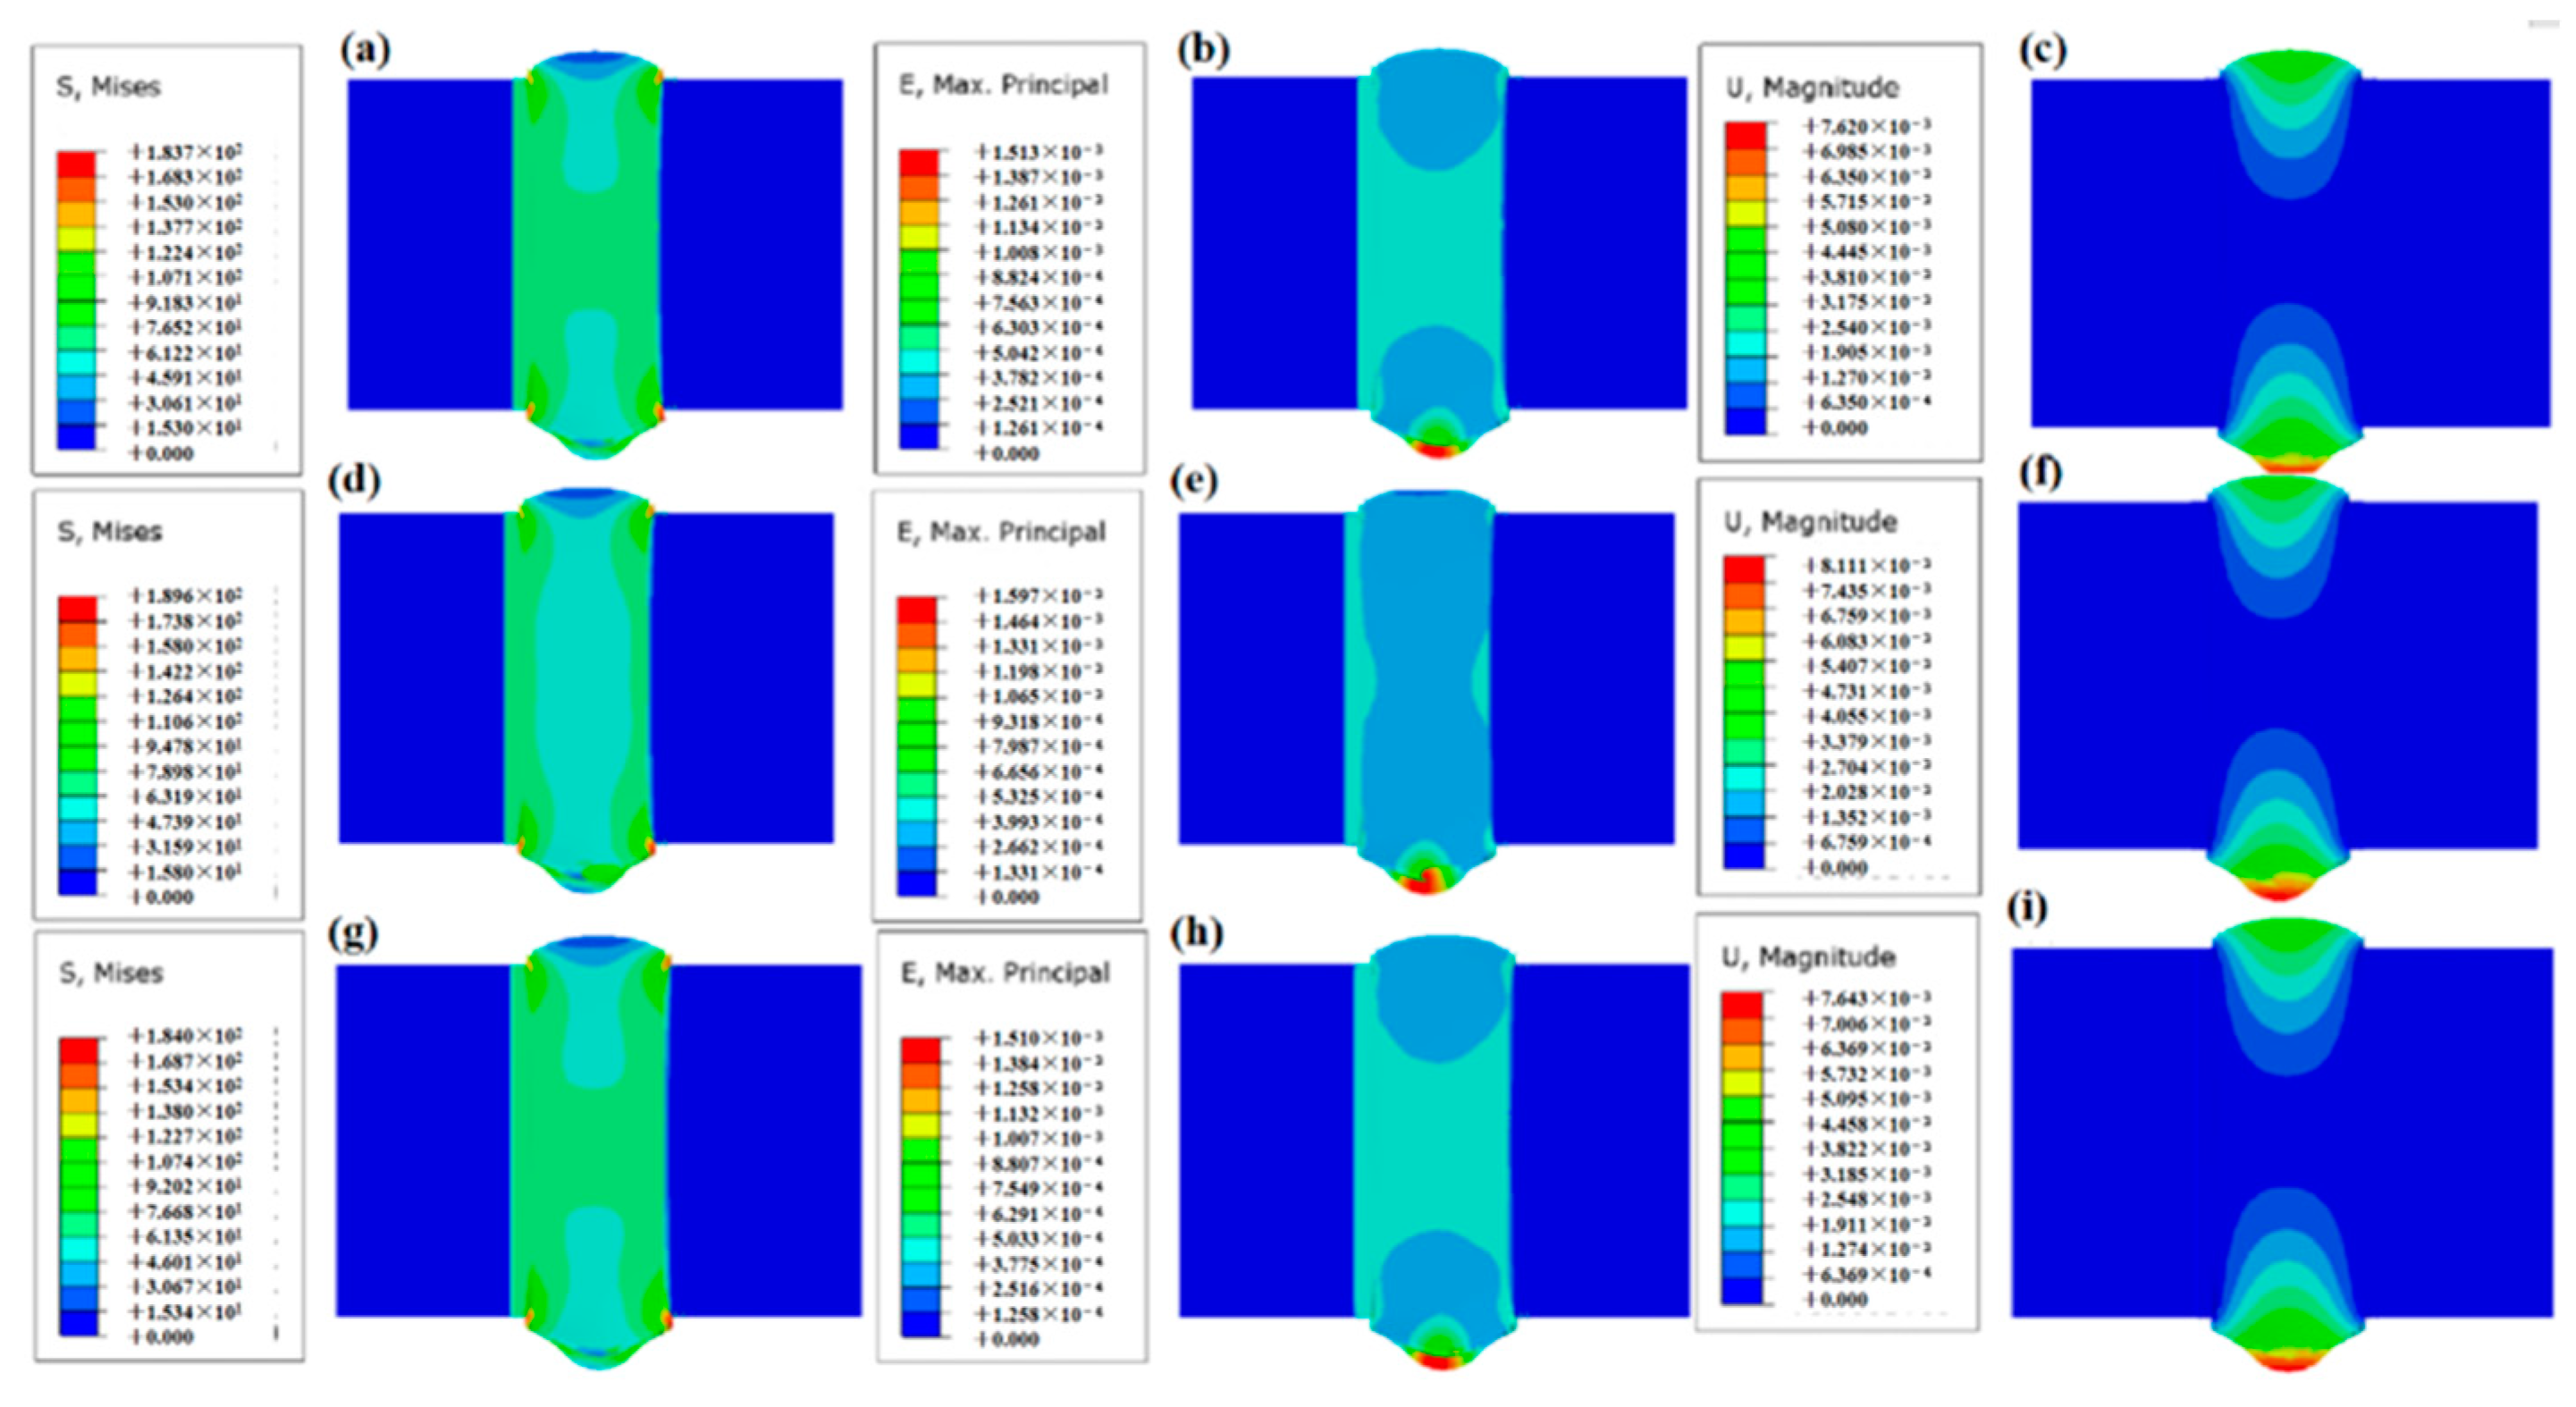
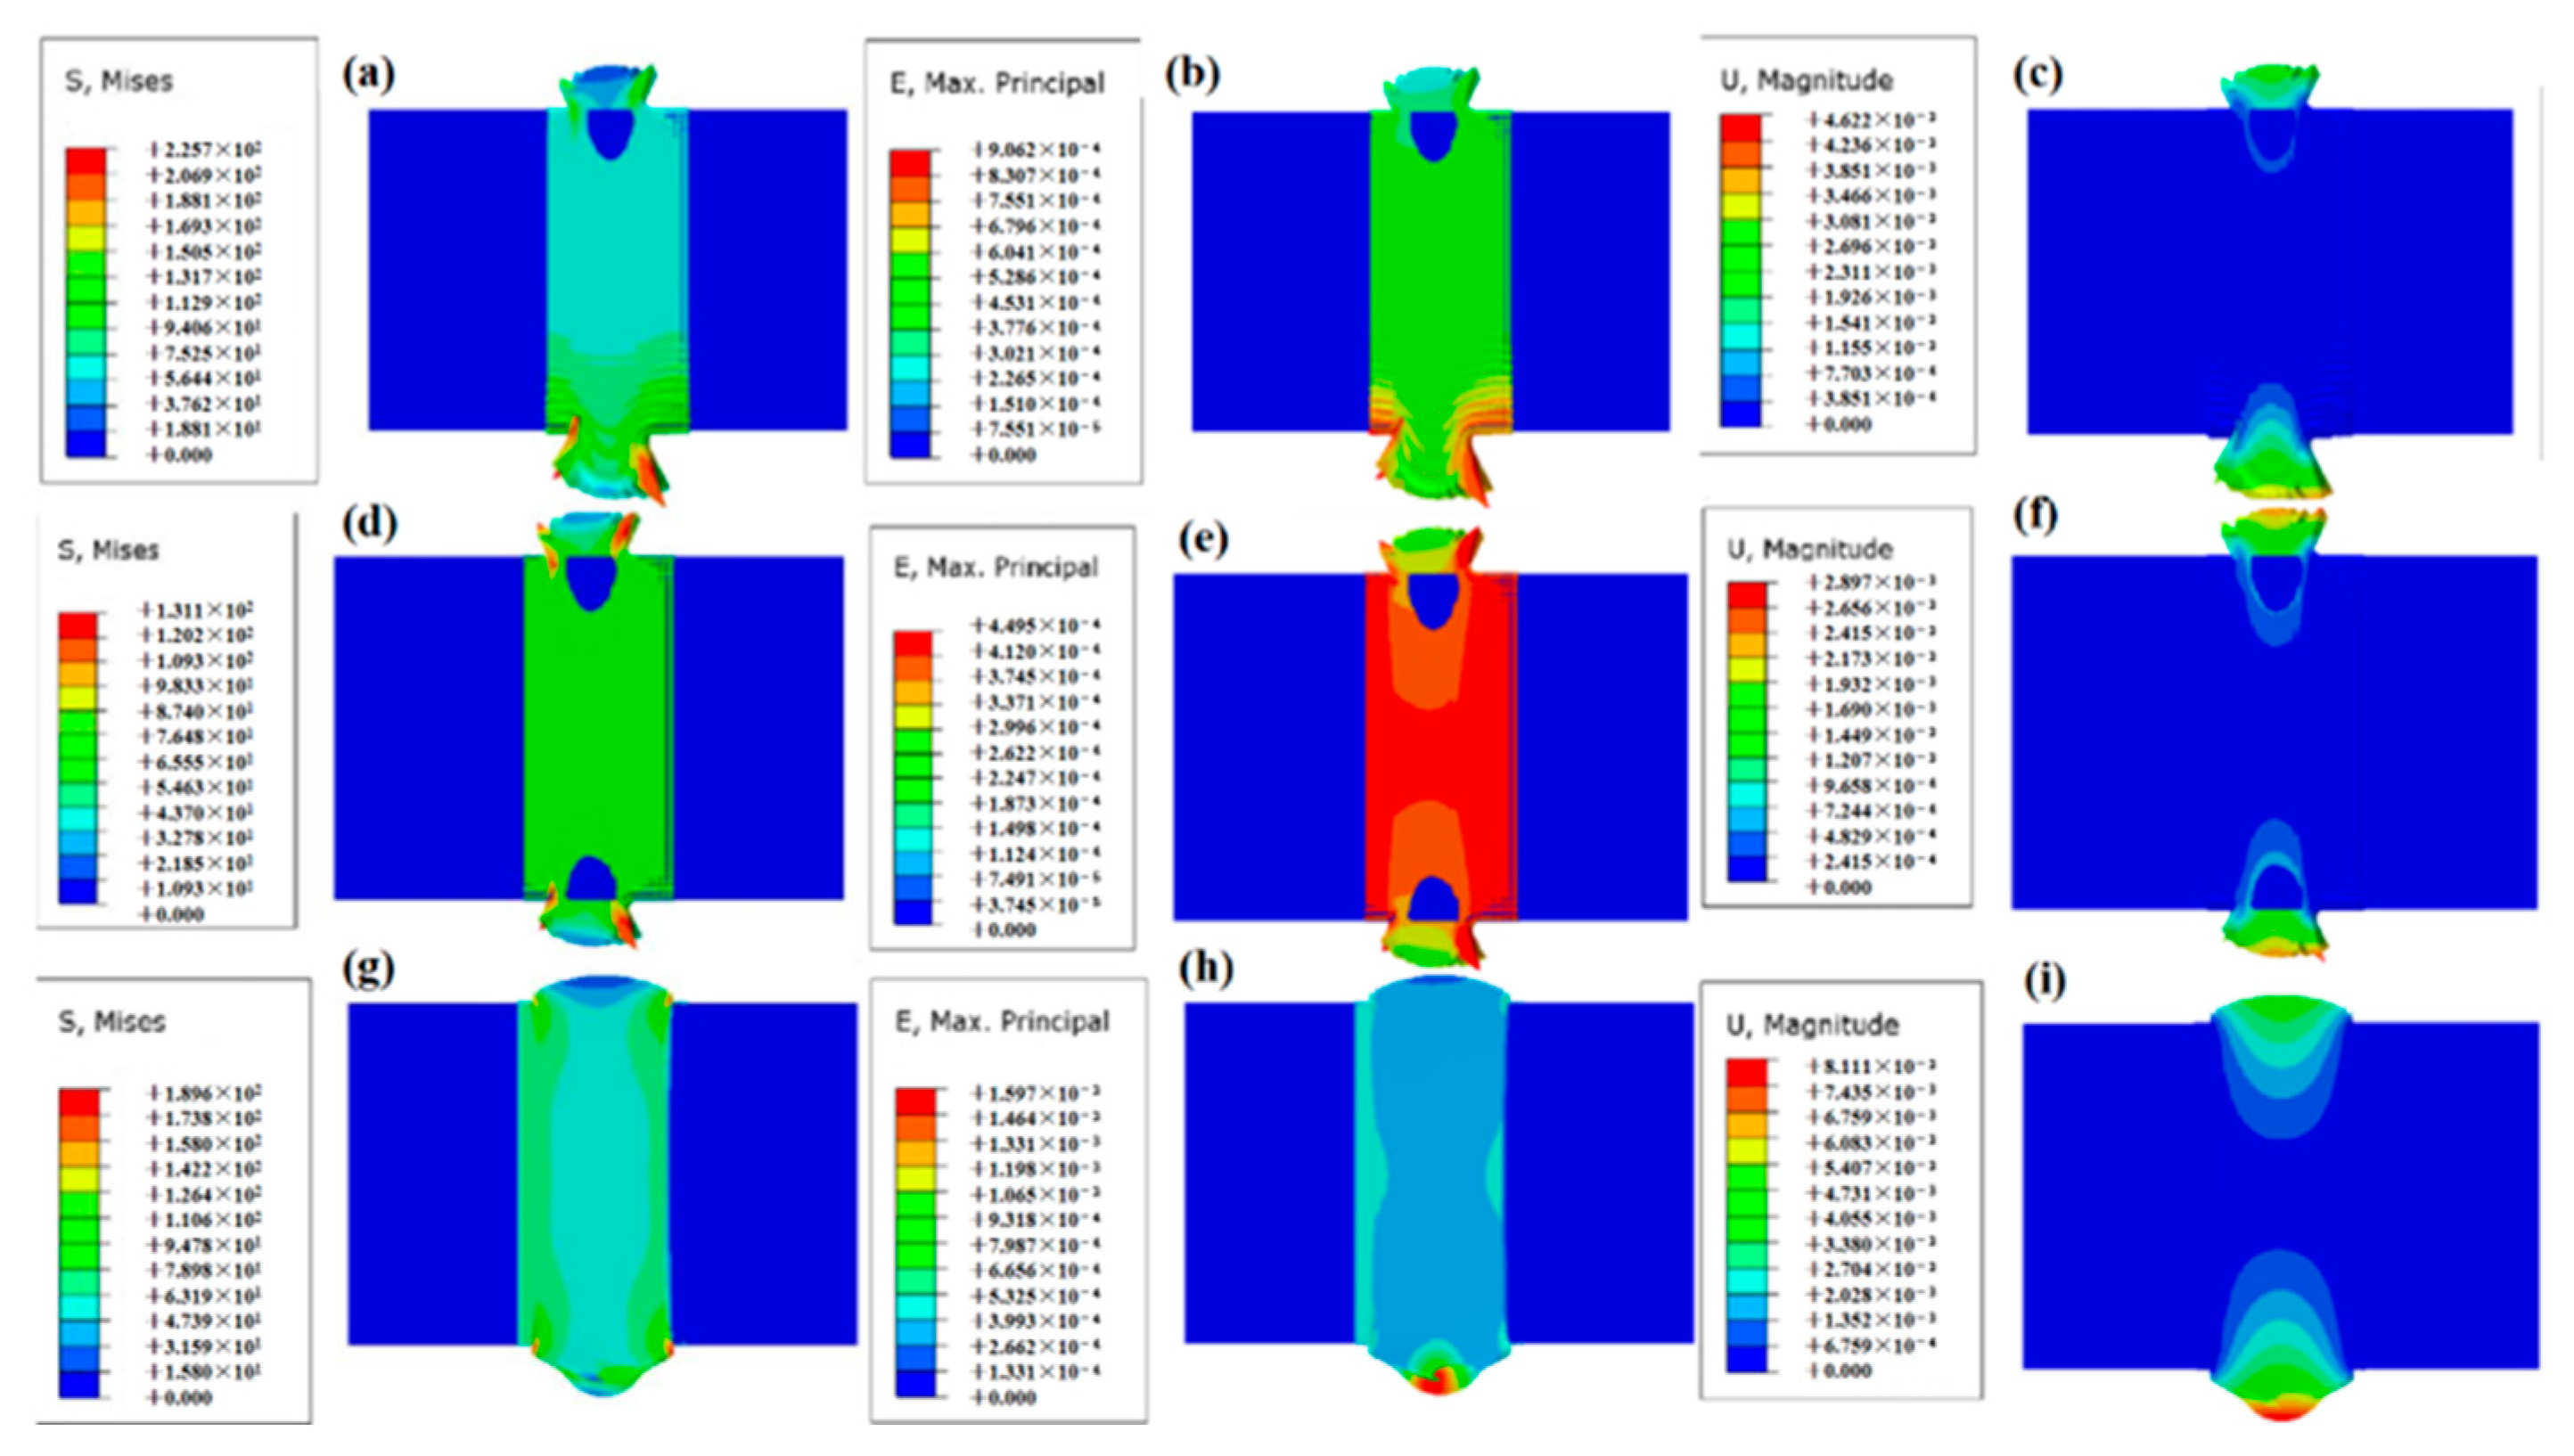
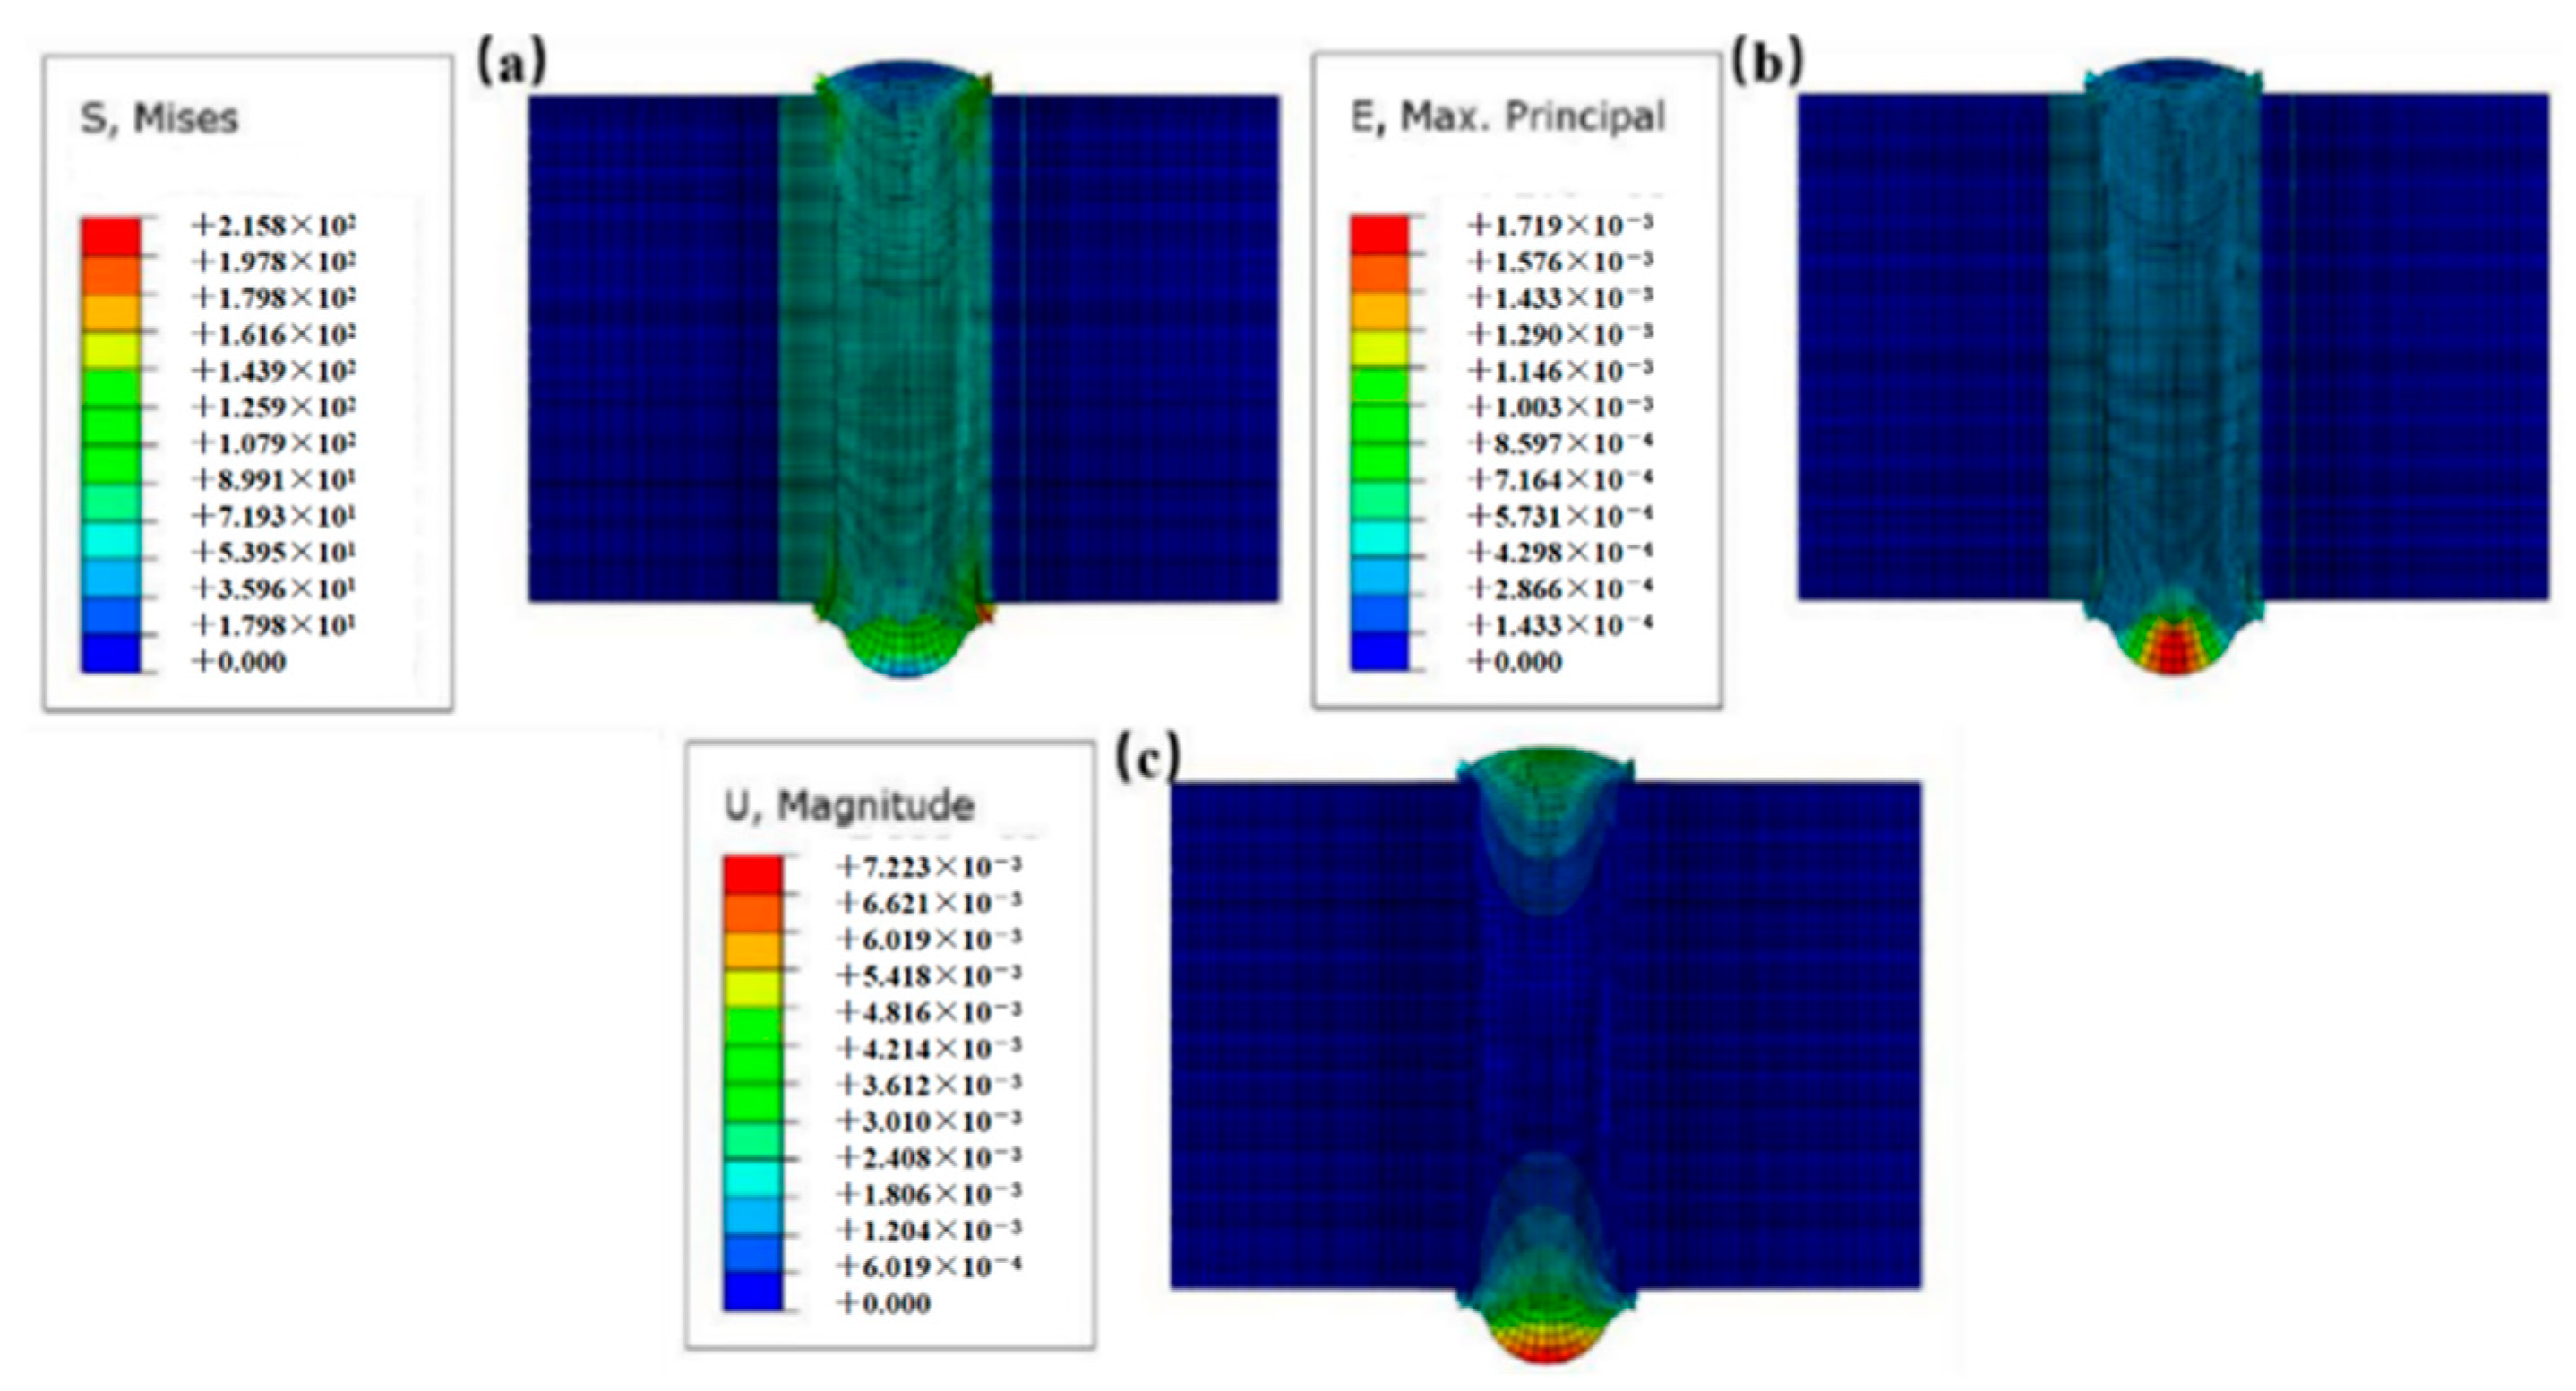
3.2. Analysis of Laser Welding Finite Element Simulation Results

Previous analyses of welding defects primarily rely on observing the welded joint morphology. While this approach identifies visible issues, it does not provide insights into the underlying stress–strain mechanisms during the welding process. These fields cannot be directly obtained through experimental observation, making it difficult to pinpoint the detailed causes of deformation. To address this limitation, finite element analysis (FEA) software is employed to simulate the stress–strain and displacement fields, providing a comprehensive understanding of the welding process and its associated deformations. Figure 10 illustrates the influence of laser power on the distribution of welding stress, strain, and displacement fields.
The maximum stress in the weldment is concentrated at the clamping transitions near the weld start and termination points due to localized constraints that amplify stress accumulation. As the laser power increases, the maximum stress rises from 183.2 MPa at 500 W to 196 MPa at 700 W, attributed to higher heat input causing increased thermal expansion and resulting in greater stress concentrations. However, the residual stress in the weldment decreases with increasing laser power. This reduction is due to the higher heat input facilitating more uniform cooling, which reduces stress gradients. Additionally, the stress concentration shifts from the center of the weldment toward the edges as thermal expansion and contraction redistribute the internal stresses. The maximum strain occurs at the welding termination point due to constraints imposed by the preceding weld, which limit deformation. Thermal expansion and contraction during the welding process generate internal strain that remains unreleased, resulting in higher strain values at this location.
As the laser power increases, the strain value at the weld decreases from the ends to the middle due to more uniform thermal expansion and contraction across the weld, resulting in reduced strain gradients in the middle region. The displacement at the ends of the weld is significantly larger than in the middle due to greater localized thermal expansion at the extremities. This uneven displacement contributes to the observed warpage at the weld extremities, as the ends experience higher thermal gradients and less constraint. Additionally, as the laser power increases, the displacement value at both ends of the weld increases due to the higher heat input causing greater thermal expansion and larger deformation at the extremities.
Figure 11 illustrates the effect of welding speed on the distribution of the weld stress field, strain field, and displacement field. Welding speed significantly affects the heat input and cooling rate, which influence stress concentration, strain distribution, and deformation behavior in the weldment. The figure shows that although the maximum stress value of the weldment varies slightly across different welding speeds, the stress distribution undergoes significant changes due to variations in heat input and cooling rates, which alter the stress gradient along the weldment. As the welding speed increases from 6 mm/s to 10 mm/s, the residual stress of the weldment rises from 183.7 MPa to 189.6 MPa due to increased heat input over a shorter duration, leading to higher thermal expansion. However, the overall stress distribution flattens as higher speeds promote more uniform heat dissipation, reducing stress concentration at the ends of the weldment and aligning stress values closer to those in the middle. When the welding speed increases further to 14 mm/s, the residual stress decreases to 184 MPa as the reduced heat input limits thermal expansion and promotes faster cooling, leading to lower stress accumulation.
The maximum strain value exhibits a trend of increasing and then decreasing with increasing welding speed. This behavior results from the interplay between heat input and the material’s ability to dissipate thermal energy, which influences strain accumulation during the welding process. For welding speeds below 10 mm/s, the maximum strain value increases from 1.51 × 10⁻3 to 1.59 × 10⁻3 due to the greater heat input over longer exposure times, which leads to higher thermal expansion. For speeds above 10 mm/s, the maximum strain value decreases gradually, returning to 1.51 × 10⁻3 at 14 mm/s, as reduced heat input at higher speeds limits thermal expansion and strain accumulation. The maximum displacement value of the weldment follows a similar trend, increasing and then decreasing with increasing welding speed. This trend reflects the balance between heat input and cooling rates, which influence the extent of deformation. As the welding speed increases from 6 mm/s to 10 mm/s, the maximum displacement value rises from 7.620 × 10⁻3 mm to 8.111 × 10⁻3 mm due to higher thermal expansion caused by greater localized heat input. When the speed increases further to 14 mm/s, the maximum displacement value decreases to 7.643 × 10⁻3 mm, as reduced heat input and faster cooling rates limit deformation.
Figure 12 illustrates the effect of pulse frequency on the distribution of weld stress, strain, and displacement fields. As the pulse frequency increases from 6 Hz to 10 Hz, the residual stress of the weldment decreases significantly from 225.7 MPa to 131.1 MPa. This reduction is due to lower energy density per pulse, promoting more uniform heat dissipation and reducing thermal gradients at the weld. However, when the pulse frequency increases further from 10 Hz to 14 Hz, the residual stress rises from 131.1 MPa to 189.6 MPa due to reduced heat penetration and the increased thermal gradient caused by higher pulse rates. In this range, the overall stress distribution at the weld decreases, but stress values at the weld ends are higher than those in the middle due to uneven cooling and localized heat accumulation.
The maximum strain value of the strain field initially decreases and then increases with increasing pulse frequency, mirroring the trend observed in the stress field. For pulse frequencies below 10 Hz, the maximum strain value decreases from 9.06 × 10⁻⁴ to 4.49 × 10⁻⁴ as increased pulse frequency reduces energy density and minimizes heat-induced strain. However, for pulse frequencies above 10 Hz, the maximum strain value gradually increases, reaching 1.597 × 10⁻3 at 14 Hz. This increase occurs because higher pulse frequencies amplify the gap between the two plates, concentrating heat in the upper plate and increasing strain. The maximum displacement of the weldment decreases and then increases with increasing pulse frequency. As the pulse frequency increases from 6 Hz to 10 Hz, the maximum displacement decreases from 4.622 × 10⁻3 mm to 2.897 × 10⁻3 mm due to reduced thermal expansion from lower energy density per pulse. However, when the pulse frequency increases further to 14 Hz, the maximum displacement rises to 8.111 × 10⁻3 mm as concentrated heat in the upper plate exacerbates deformation.
Simulation analysis suggests that changes in laser power, welding speed, and pulse frequency should have a linear influence on the welding deformation behavior of 430 ultra-thin ferritic stainless steel. However, practical observations reveal irregular deformation behavior, likely due to complex interactions between thermal gradients, material properties, and external constraints during welding.
A high-speed camera was employed to investigate the deformation of 430 ultra-thin ferritic stainless steel in greater detail during the welding process. The results, presented in Figure 13, provide real-time visualization of dynamic deformation behavior, capturing critical phenomena such as warping, plasma generation, and cavity formation. Figure 14 presents a schematic diagram illustrating the deformation mechanisms of the ultra-thin stainless-steel plate during welding, offering a conceptual understanding of the dynamic interactions observed in the high-speed camera footage.
During the welding process, the laser melts the upper plate of the ultra-thin stainless steel, causing it to warp and deform due to thermal expansion and contraction. Simultaneously, plasma generated during the melting process exerts pressure on the lower plate, deforming it downward and creating a cavity between the overlapping plates. This cavity forms because the localized heat input and plasma interaction disrupt the uniform thermal profile, leading to uneven expansion and contraction.
The formation of the cavity reduces the laser heat received by the lower plate, causing instability and preventing the formation of a continuous weld joint. Concurrently, the warping of the upper plate disrupts the laser’s ability to maintain a stable focus, leading to uneven heat input and further instability in the deformation of the upper plate.

3.3. Effect of Stress Span on the Deformation of Laser Welded Joints of Ultra-Thin Ferritic Stainless Steel

The aforementioned test revealed that welding process parameters exhibit a non-linear and inconsistent impact on the surface quality of ultra-thin stainless-steel laser-welded joints. While optimizing welding process parameters is critical, achieving consistently high-quality welded joints is difficult due to the inherent challenges in managing heat input and deformation. Therefore, improving the design and application of welding clamps has emerged as an effective complementary approach to enhancing surface quality. Welding clamps secure the weldment during the welding process, counteracting thermal expansion and contraction to minimize deformation. Moreover, reducing the clamping length enhances the localized constraining force applied by the clamp, effectively increasing the rigidity of the weldment and further minimizing deformation caused by welding stresses.
Figure 15 illustrates a simplified model of the fixture constraints, focusing on the elastic deformation and rotational forces influencing welding deformation in an ultra-thin stainless-steel plate. The relationship between the angle of rotation β/2, the applied torque M, and the force F is described mathematically as follows:
F = 12 l 2 E I tan β 2 , M = 2 l E I tan β 2 .
In the absence of clamping, or when the span 2l is large, the deflection at a distance x from the support can be approximated as
f 0 = x tan β 2 ,
where f0 is the deflection, x is the distance from the clamp, and β/2 is the angle of rotation of the bearing section. Consequently, the deflection equation for any cross-section at a distance x from the clamping point is given by
f = x 2 l     x 3 l tg β 2
where f represents the deflection at a distance x, β/2 is the angle of rotation, and l is the distance of the fixture from the weld center. From Equation (4), it is evident that the greater the distance (l) of the clamp from the weld center, the larger the weld opening angle and the greater the deflection at the weld. This suggests that adjusting the stress span of the welding clamps can effectively reduce the welding deformation of 430 ultra-thin ferritic stainless steel.
Figure 16 presents the stress–strain and displacement fields (Case 8) for a fixed stress span of 15 mm applied by the clamp, with a laser power of 600 W, a welding speed of 10 mm/s, and a pulse frequency of 10 Hz. The maximum residual stress after welding in Case 8 is 216 MPa, which is higher than the value observed at a clamp distance of 20 mm, and it occurs at the edge of the tooling clamp pressure transition. The maximum strain is 1.719 × 10⁻³, and it is also higher than that observed at a 20 mm clamp distance, with both the residual stress and strain located at the final position of the weld. The maximum displacement is 7.223 × 10⁻³ mm, which is lower than the value at a 20 mm clamp distance and is similarly located at the final position of the weld.
Figure 17 presents the stress–strain and displacement fields for a fixed stress span of 10 mm applied by the clamp (Case 9). The maximum residual stress after welding in Case 9 is 255 MPa, which is higher than that observed at a clamp distance of 15 mm, and it occurs at the tooling clamp pressure edge transition. The maximum strain is 1.648 × 10⁻³, which is higher than at a 20 mm clamp distance but lower than at a 15 mm clamp distance, and is located at the final position of the weld. The maximum displacement is 6.060 × 10⁻³ mm, which is lower than at a 15 mm clamp distance, and is also located at the final position of the weld.
Figure 18 presents the stress–strain and displacement fields for a fixed stress span of 5 mm applied by the clamp (Case 10). The maximum residual stress after welding in Case 10 is 267 MPa, which is higher than that observed at a clamp distance of 10 mm, and it occurs at the edge transition of the pressure applied by the tooling clamp. The maximum strain is 1.896 × 10⁻³, representing the highest strain among the four fixed stress span conditions, and is located at the final position of the weld. The maximum displacement is 4.746 × 10⁻³ mm, which is lower than that observed at a 10 mm distance, making it the smallest displacement among the four distance conditions, and is also located at the final position of the weld.
The effect of the fixed stress span applied by the clamp on the stress–strain and displacement fields is shown in Figure 19. The residual stress decreases as the fixed stress span applied by the clamp increases, from 267 MPa at 5 mm to 189 MPa at 20 mm. The strain value generally decreases with an increase in the fixed stress span; however, when the span is increased from 10 mm to 15 mm, the strain value rises slightly, from 1.648 × 10⁻³ at 10 mm to 1.719 × 10⁻³ at 15 mm. This is because increasing the span to 15 mm reduces the constraints applied by the tooling clamp on the two ultra-thin stainless-steel plates, thereby decreasing deformation restriction and increasing strain. The displacement value increases with the fixed stress span, from 4.746 × 10⁻³ mm at 5 mm to 8.111 × 10⁻³ mm at 20 mm, which occurs because increasing the fixed stress span reduces the area of the plates held by the tooling clamps, thereby reducing constraints and increasing deformation. The simulation analysis predicts that when the stress span applied by the clamp is 5 mm, the surface morphology of the weld is optimal.
To validate the influence of the fixed stress span applied by the clamp, as determined by finite element analysis, on weld seam formation, actual tests were conducted to simulate the process. The welds obtained from these tests are shown in Figure 20 and Figure 21. When the fixed stress span applied by the clamp is 20 mm, the plates are well-formed, with continuous weld joints and no weld penetration; however, significant angular deformation is observed. At a 15 mm span, the upper plate exhibits severe weld penetration, while the lower plate shows discontinuous weld joints. For a 10 mm span, the plates are well-formed, featuring clear weld joints and no gap between them; however, the overlap rate of weld spots is lower compared to the 20 mm span. Finally, when the fixed stress span is reduced to 5 mm, the weld seam is well-formed with no significant welding deformation.
Figure 22 shows the laser welding process of ultra-thin ferritic stainless steel, recorded using a high-speed camera, with a stress span of 5 mm. As observed in the figure, a reduction in the stress span increases the degree of constraint on the ultra-thin ferritic stainless steel, limiting the deformation of the weldment. This prevents gaps between the two plates and enables the ultra-thin ferritic stainless steel to form a stable and smooth weld morphology.

4. Conclusions

  • The present study has identified optimal welding parameters for ultra-thin ferritic stainless steel, achieving minimal deformation and high-quality welds. The optimal parameters were as follows: a laser power of 600 W, a welding speed of 10 mm/s, and a pulse frequency of 10 Hz. These conditions were found to minimize defects such as burn-through and angular deformation, thus providing essential guidelines for industrial applications like PEMFC manufacturing, where precision and minimal deformation are critical for component integrity.
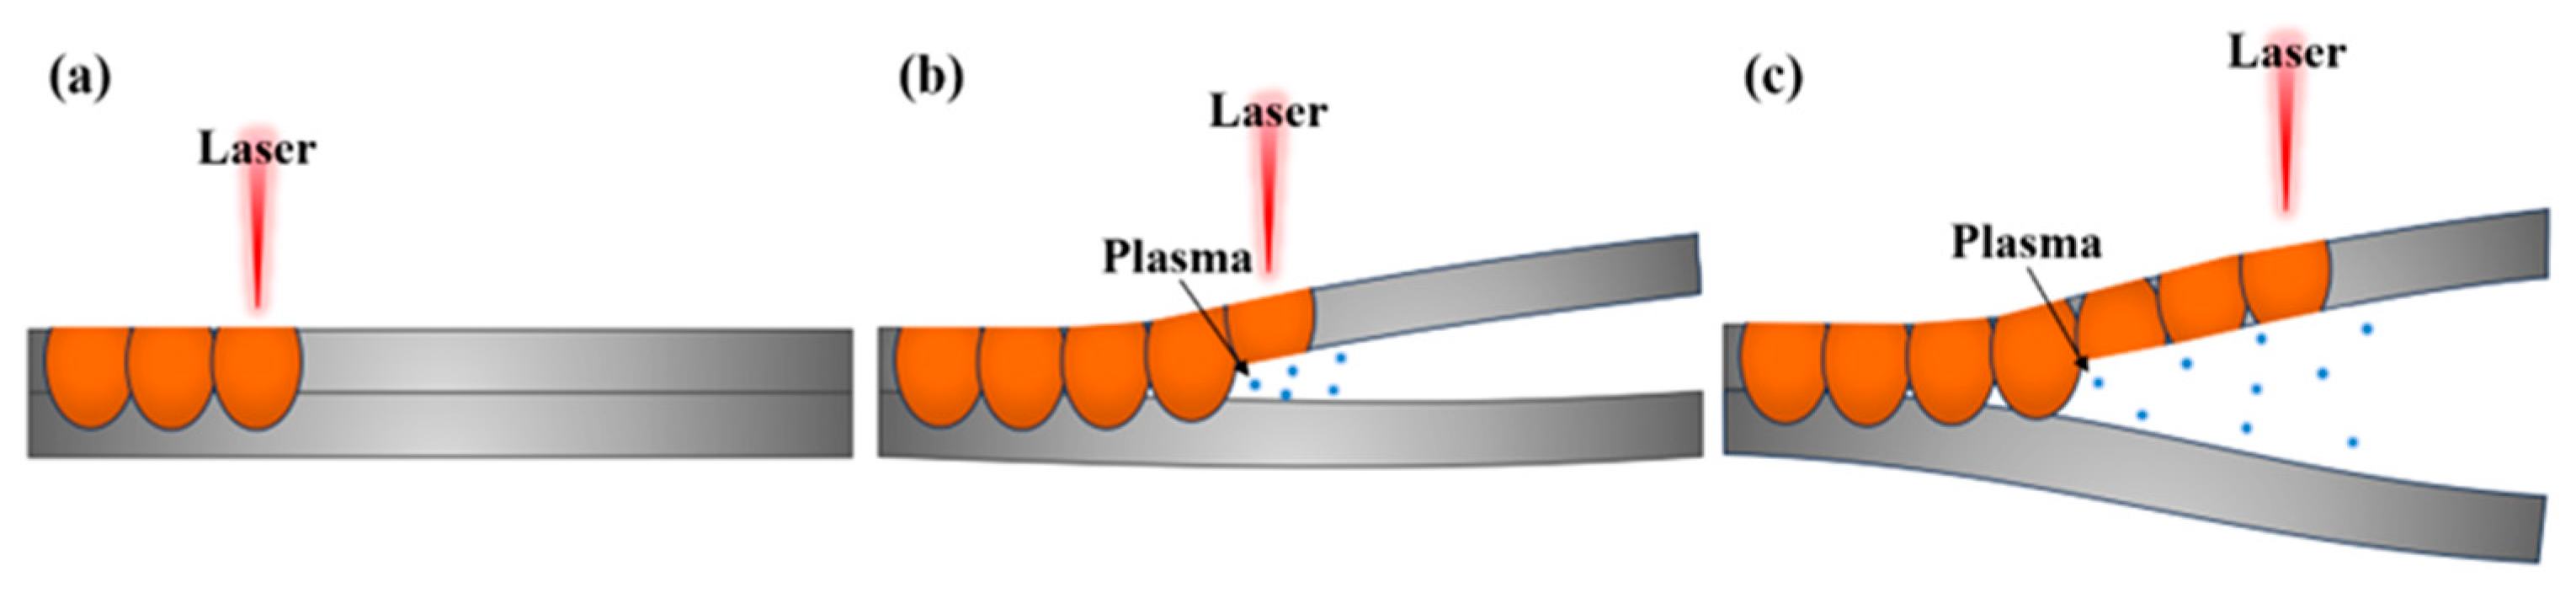
  • The study confirmed a non-linear relationship between welding parameters and deformation. For example, excessive laser power caused burn-through, while low power resulted in incomplete weld penetration. Furthermore, it was demonstrated that variations in welding speed and pulse frequency had a substantial influence on angular deformation and weld discontinuities. These findings emphasize the necessity for precise regulation of welding parameters in industrial processes, particularly in the fabrication of high-precision equipment, where even minor deviations can adversely affect the final product’s performance and reliability.
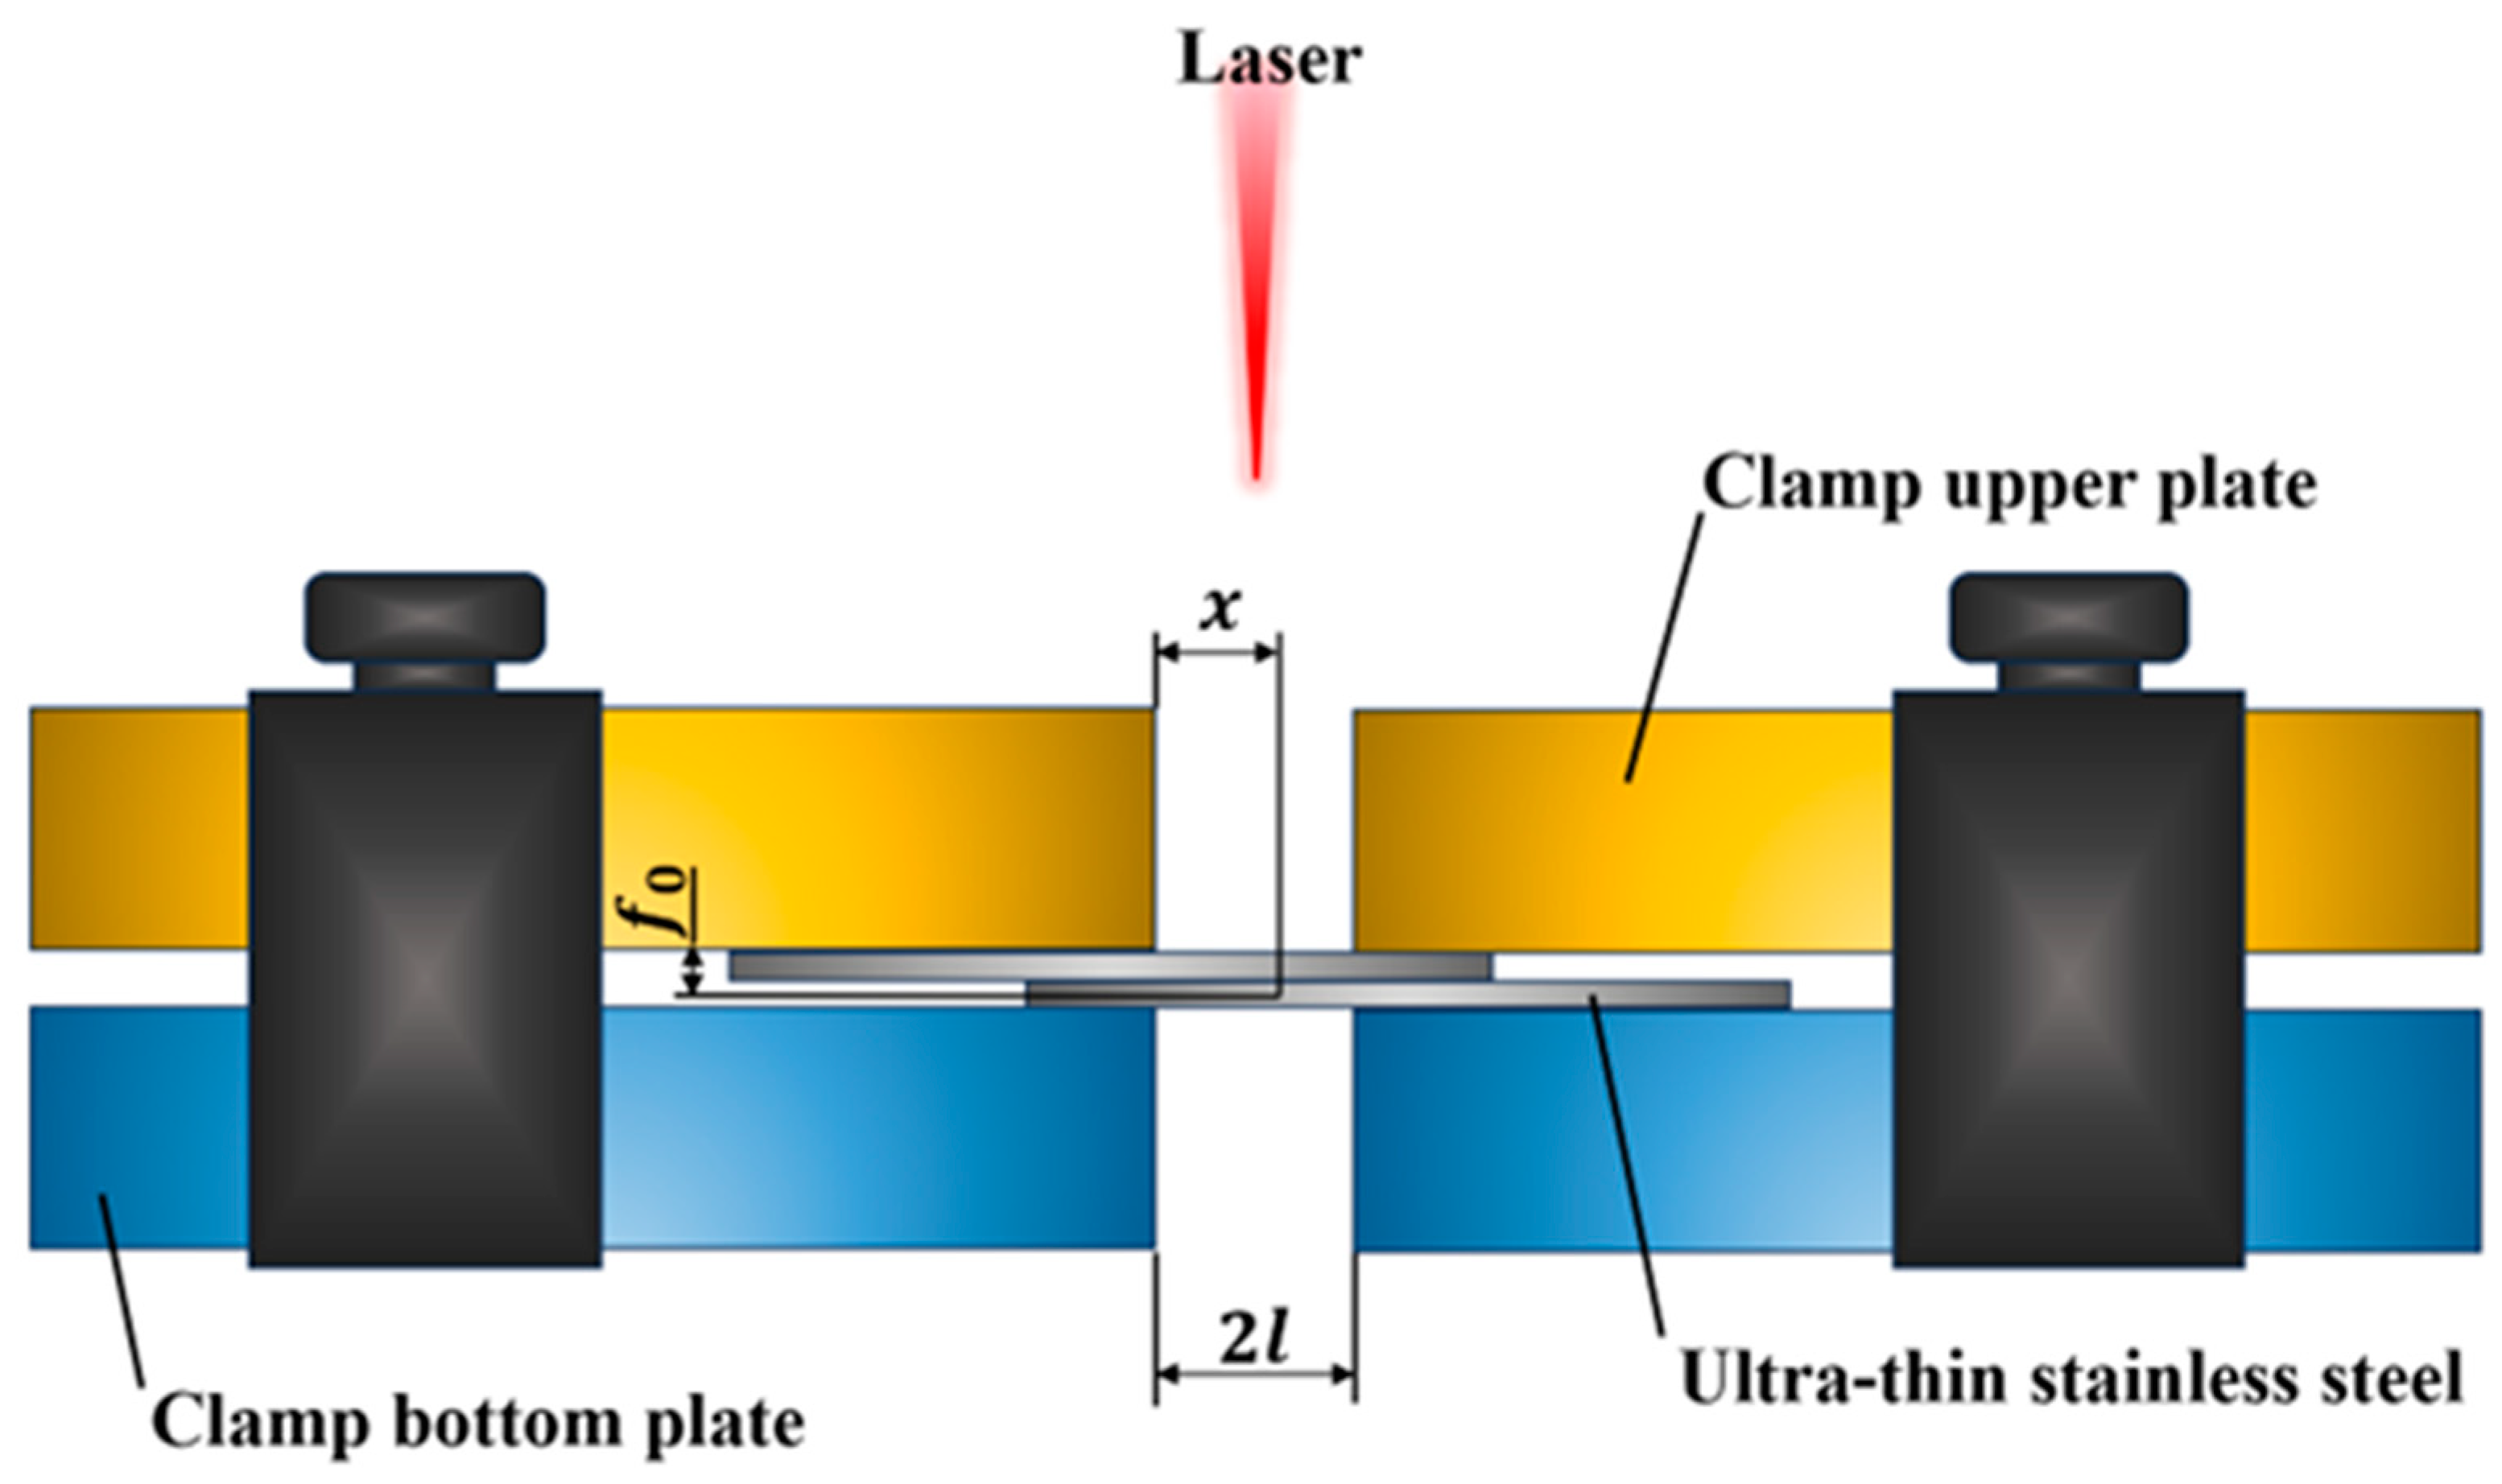
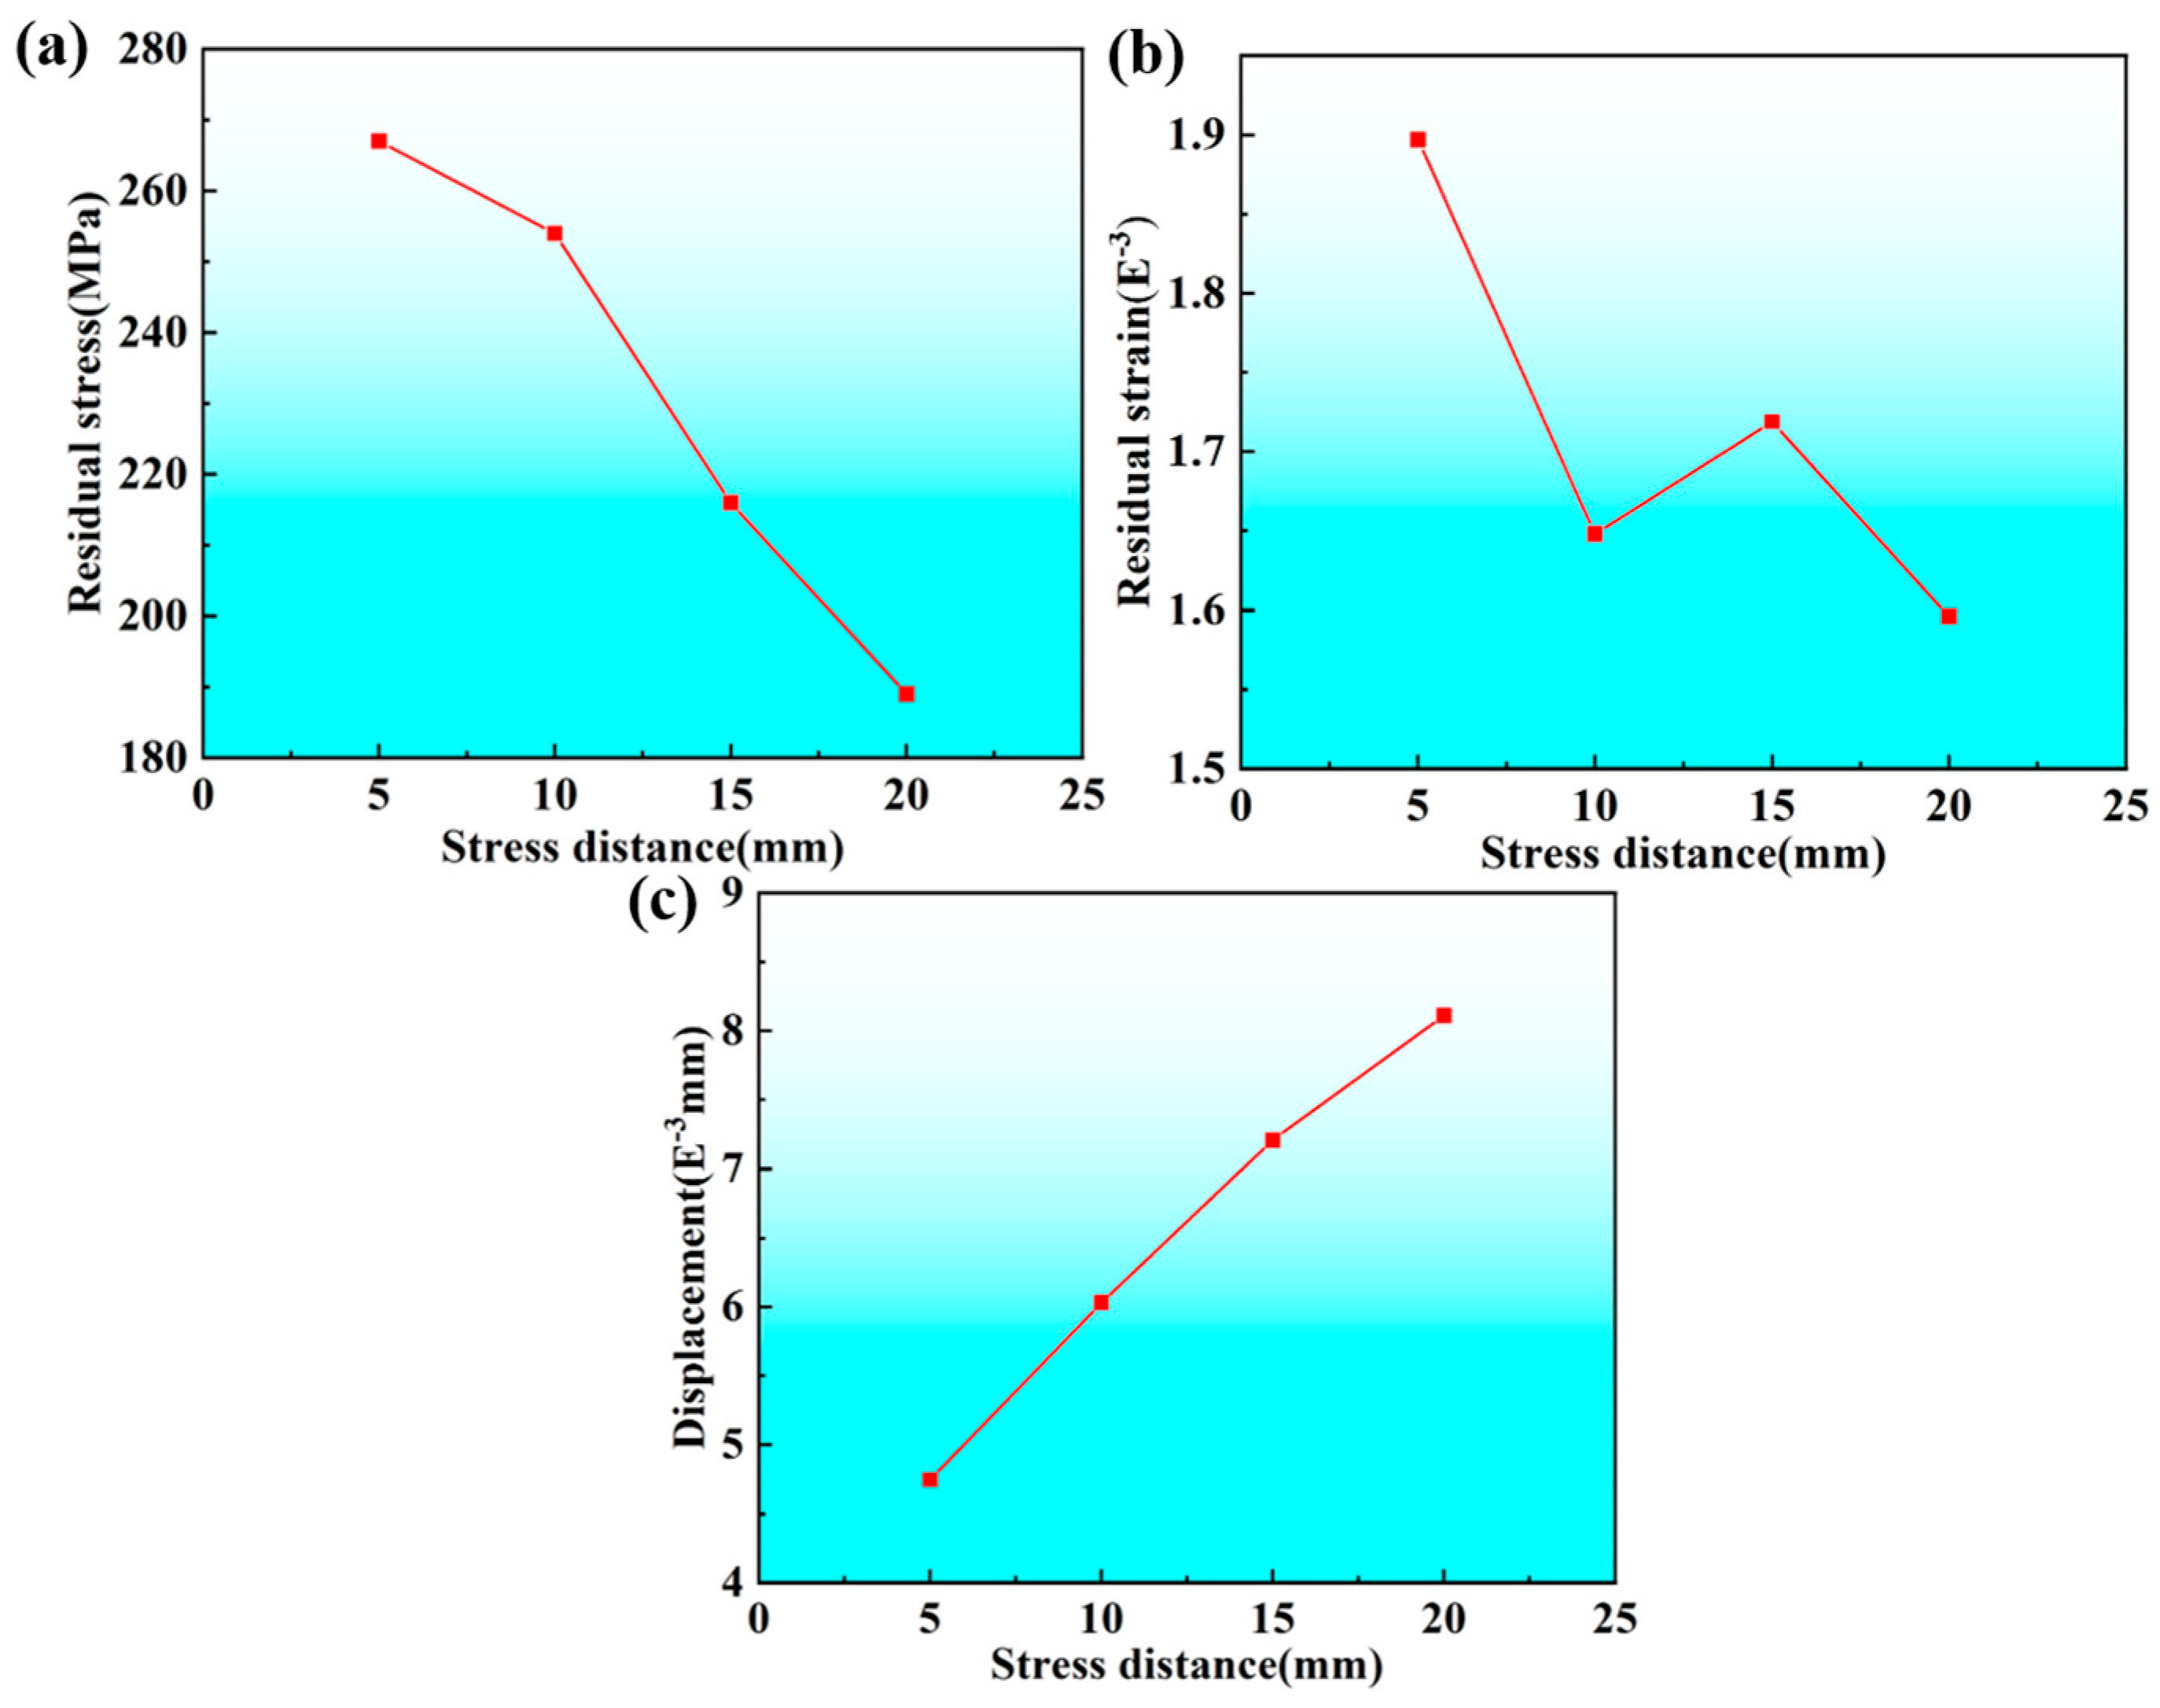
  • The fixed stress span applied by clamps was found to have a considerable impact on residual stress, strain, and displacement. Specifically, residual stress decreased from 267 MPa at a 5 mm span to 189 MPa at 20 mm, while displacement values increased from 4.746 × 10⁻³ mm at 5 mm to 8.111 × 10⁻³ mm at 20 mm. These findings underscore the efficacy of a 5 mm span in ensuring smooth, defect-free weld morphology. These findings can be directly applied to industrial settings, where clamp designs can be optimized to ensure minimal distortion and maintain the structural integrity of sensitive components, such as those used in fuel cell systems.
  • The findings of the study emphasize the importance of two factors in the pursuit of achieving high-quality welds in industrial contexts. Firstly, the optimization of welding parameters is paramount, and secondly, the refinement of clamp designs is essential. The implementation of these insights by industrial entities can engender a substantial reduction in the risks of deformation and welding defects. Consequently, this ensures the reliability and longevity of components utilized in high-precision applications, including fuel cells and other advanced technologies. These pragmatic solutions will assist in enhancing the overall quality and durability of industrial laser welding processes, thereby ensuring that final products meet the exacting standards demanded by precision engineering.

Author Contributions

Conceptualization, J.S. and J.L. (Jingwei Liang); methodology, J.S. and J.L. (Jingwei Liang); software, J.L. (Jingyi Li) and K.Z.; validation, J.S., J.L. (Jingyi Li) and K.Z.; formal analysis, J.S., K.Z. and J.L. (Jingwei Liang); investigation, J.S., J.L. (Jingyi Li); resources, F.X.; data curation, J.L. (Jingyi Li); writing—original draft preparation, J.S., K.Z.; writing—review and editing, J.S., F.X., J.L. (Jingwei Liang) and X.Q.; visualization, J.S.; supervision, J.L. (Jingwei Liang); project administration, F.X.; funding acquisition, X.Q. All authors have read and agreed to the published version of the manuscript.

Funding

This research was funded by Jilin Province Science and Technology Department, grant number 20220101221JC.

Data Availability Statement

The original contributions presented in this study are included in the article. Further inquiries can be directed to the corresponding author.

Conflicts of Interest

The authors declare that they have no known competing financial interests or personal relationships that could have appeared to influence the work reported in this paper.

References

  1. Mine, E.F.; Ito, Y.; Teranishi, Y.; Sato, M.; Shimizu, T. Surface coating and texturing on stainless-steel plates to decrease the contact resistance by using screen printing. Int. J. Hydrogen Energy 2017, 42, 20224–20229. [Google Scholar] [CrossRef]
  2. Xu, Z.; Qiu, D.; Yi, P.; Peng, L.; Lai, X. Towards mass applications: A review on the challenges and developments in metallic bipolar plates for PEMFC. Prog. Nat. Sci. 2020, 30, 815–824. [Google Scholar] [CrossRef]
  3. Zhou, Y.; Wang, M.; Hao, H.; Johnson, L.; Wang, H.; Hao, H. Plug-in electric vehicle market penetration and incentives: A global review. Mitig. Adapt. Strateg. Glob. Change 2015, 20, 777–795. [Google Scholar] [CrossRef]
  4. Kim, K.M.; Park, J.H.; Kim, H.S.; Kim, J.H.; Lee, Y.Y.; Kim, K.Y. Effect of plastic deformation on the corrosion resistance of ferritic stainless steel as a bipolar plate for polymer electrolyte membrane fuel cells. Int. J. Hydrogen Energy 2012, 37, 8459–8464. [Google Scholar] [CrossRef]
  5. Yan, W.M.; Chen, C.Y.; Liang, C.H. Comparison of performance degradation of high temperature PEM fuel cells with different bipolar plates. Energy 2019, 186, 115836. [Google Scholar] [CrossRef]
  6. Leng, Y.; Ming, P.; Yang, D.; Zhang, C. Stainless steel bipolar plates for proton exchange membrane fuel cells: Materials, flow channel design and forming processes. J. Power Sources 2020, 451, 22778. [Google Scholar] [CrossRef]
  7. Bilgin, M.B.; Meran, C. The effect of tool rotational and traverse speed on friction stir weldability of AISI 430 ferritic stainless steels. Mater. Des. 2012, 33, 376–383. [Google Scholar] [CrossRef]
  8. Amrutha, V.; Latha, S.; Bera, P.; John, S.; Srinivas, G.; Barshilia, H.C. Thermal treatment of stainless steel substrates along with a thin silicon layer for high temperature solar thermal applications. Sol. Energy 2023, 262, 111768. [Google Scholar] [CrossRef]
  9. Alizadeh-Sh, M.; Marashi, S.P.H.; Pouranvari, M. Resistance spot welding of AISI 430 ferritic stainless steel: Phase transformations and mechanical properties. Mater. Des. 2014, 56, 258–263. [Google Scholar] [CrossRef]
  10. Jazayerli, M.M.; Kok, C.K.; Sued, K.; Por, K.W.; Ooi, C.C.; Liew, K.W. Effect of welding speed on micro-friction stir lap welding of ultra-thin aluminium and copper sheets. Weld. World 2024, 68, 1853–1867. [Google Scholar] [CrossRef]
  11. Hong, Y.; Gao, J.; Lin, K.; Li, S.; Chang, B.; Du, D. Bridging behavior of molten pool and its effect on defects formation in ultra-thin sheets edge welding by micro-plasma arc. J. Mater. Process. Technol. 2025, 336, 118696. [Google Scholar] [CrossRef]
  12. Arai, T. Simulation of pulse laser welding of a thin metal and comparison with other heat sources. Mater. Werkst. 2013, 44, 462–471. [Google Scholar] [CrossRef]
  13. Kumar, S.; Chouhan, A.S.; Agarwal, H.; Avasthi, S. Perovskite solar cell devices on flexible stainless-steel substrate. In Proceedings of the IEEE 46th Photovoltaic Specialists Conference (PVSC), Chicago, IL, USA, 16–21 June 2019. [Google Scholar]
  14. Wang, J.; Shibahara, M.; Zhang, X.; Murakawa, H. Investigation on twisting distortion of thin plate stiffened structure under welding. J. Mater. Process. Technol. 2012, 212, 1705–1715. [Google Scholar] [CrossRef]
  15. Fan, Y.; Chen, Z.; Zhang, C.H.; Liu, A.M. A comparison of microstructure and mechanical properties of welded thin Ti6Al4V with three different types of laser. Mater. Res. Innov. 2015, 19, S187–S192. [Google Scholar] [CrossRef]
  16. Dong, Z.; Pan, R.; Zhou, T.; Feng, Y.; Yan, Z.; Wang, Y.; Chen, P.; Chen, S. Microstructure and mechanical property of Ti/Cu ultra-thin foil lapped joints with different weld depths by nanosecond laser welding. J. Manuf. Process. 2023, 108, 88–97. [Google Scholar] [CrossRef]
  17. Chen, J.; Chang, Y.; Wei, Y. Building ultra-thin Inconel 718 sheet joints using low-frequency PLBW scheme: Weld bead quality, keyhole dynamics, and solidification characteristics. J. Mater. Res. Technol. 2023, 27, 4145–4156. [Google Scholar] [CrossRef]
  18. Xu, H.; Guo, X.; Lei, Y.; Lin, J.; Fu, H.; Xiao, R.; Huang, T.; Shin, Y.C. Welding deformation of ultra-thin 316 stainless steel plate using pulsed laser welding process. Opt. Laser Technol. 2019, 119, 105583. [Google Scholar] [CrossRef]
  19. Syamak, H.N.; Mehmet, Y.; Abdollah, S. Solidification behaviour of austenitic stainless steels during welding and directed energy deposition. Sci. Technol. Weld. Join. 2023, 28, 1–17. [Google Scholar]
  20. Kumar, N.; Mukherjee, M.; Bandyopadhyay, A. Comparative study of pulsed Nd: YAG laser welding of AISI 304 and AISI 316 stainless steels. Opt. Laser Technol. 2017, 88, 24–39. [Google Scholar] [CrossRef]
  21. Xiong, K.; Wu, W.; Wang, S.; Zhang, L. Modeling, design, materials and fabrication of bipolar plates for proton exchange membrane fuel cell: A review. Appl. Energy 2021, 301, 117443. [Google Scholar] [CrossRef]
  22. Rouquette, S.; Guo, J.; Le Masson, P. Estimation of the parameters of a Gaussian heat source by the Levenberg–Marquardt method: Application to the electron beam welding. Int. J. Therm. Sci. 2007, 46, 128–138. [Google Scholar] [CrossRef]
Figure 1. Welding clamp schematic.
Metals 15 00325 g001
Figure 2. Gaussian heat-source energy distribution. The left diagram illustrates the theoretical model of the heat source, while the right 3D plot represents the power density distribution, with colors indicating intensity (blue: low, red: high).
Metals 15 00325 g002
Figure 3. 430 ferritic stainless steel stress–strain curve.
Metals 15 00325 g003
Figure 4. Model meshing.
Metals 15 00325 g004
Figure 5. Effect of laser power on weld surface morphology at a welding speed of 10 mm/s and a pulse frequency of 10 Hz: (a) 500 W; (b) 600 W; (c) 700 W.
Metals 15 00325 g005
Figure 6. Effect of welding speed on weld surface morphology at a laser power of 600 W and a pulse frequency of 10 Hz: (a) 6 mm/s; (b) 10 mm/s; (c) 14 mm/s.
Metals 15 00325 g006
Figure 7. The end of the welded joint of case 5 is not welded together due to deformation.
Metals 15 00325 g007
Figure 8. Effect of pulse frequency on weld surface morphology at a laser power of 600 W and a welding speed of 10 mm/s (a) 6 mm; (b) 10 mm/s; (c) 14 mm/s.
Metals 15 00325 g008
Figure 9. Effect of welding parameters on angular deformation and two-plate gap of welded joints: (a) laser power; (b) welding speed; (c) pulse frequency.
Metals 15 00325 g009
Figure 10. Effect of laser power on residual stress–strain and displacement distribution: 500 W (a) stress field, (b) strain field, (c) displacement field, 600 W (d) stress field, (e) strain field, (f) displacement field; 700 W (g) stress field, (h) strain field, (i) displacement field.
Metals 15 00325 g010
Figure 11. Effect of welding speed on residual stress–strain and displacement distributions: 6 mm/s (a) stress field, (b) strain field, (c) displacement field; 10 mm/s (d) stress field, (e) strain field, (f) displacement field; 14 mm/s (g) stress field, (h) strain field, (i) displacement field.
Metals 15 00325 g011
Figure 12. Effect of pulse frequency on residual stress–strain and displacement distributions: 6 Hz (a) stress field, (b) strain field, (c) displacement field; 10 Hz (d) stress field, (e) strain field, (f) displacement field; 14 Hz (g) stress field, (h) strain field, (i) displacement field.
Metals 15 00325 g012
Figure 13. Welding deformation process of 430 ultra-thin ferritic stainless steel during pulsed laser welding process (a) t = 0.1 s; (b) t = 0.2 s; (c) t = 0.3 s; (d) t = 0.4 s.
Metals 15 00325 g013
Figure 14. Schematic diagram of welding deformation (a) t = 0.1 s; (b) t = 0.2 s; (c) t = 0.3 s.
Metals 15 00325 g014
Figure 15. Modeling of welding deformation under constraints.
Metals 15 00325 g015
Figure 16. Stress, strain, and displacement fields in Case 8 for ultra-thin stainless steel welding (a) Stress field; (b) Strain field; (c) Displacement field.
Metals 15 00325 g016
Figure 17. Stress, strain, and displacement fields in Case 9 for ultra-thin stainless steel welding: (a) stress field; (b) strain field; (c) displacement field.
Metals 15 00325 g017
Figure 18. Stress, strain, and displacement fields in Case 10 for ultra-thin stainless steel welding: (a) stress field; (b) strain field; (c) displacement field.
Metals 15 00325 g018
Figure 19. Effect of fixed stress span applied by clamps on stress–strain and displacement fields: (a) stress field; (b) strain field; (c) displacement field.
Metals 15 00325 g019
Figure 20. Surface morphology of weld seam with different clamp-applied fixed stress spans: (a) Case 2; (b) Case 8; (c) Case 9; (d) Case 10.
Metals 15 00325 g020
Figure 21. Welding diagrams for different clamp-applied fixed stress spans: (a) Case 2; (b) Case 8; (c) Case 9; (d) Case 10.
Metals 15 00325 g021
Figure 22. Surface morphology of welded seam after clamp optimization: (a) t = 0.1 s; (b) t = 0.2 s; (c) t = 0.3 s; (d) t = 0.4 s.
Metals 15 00325 g022
Table 1. Welding parameters used in this test.
Case No.Laser Power (W)Welding Speed (mm/s)Pulse Frequency (Hz)Duty Cycle (%)Stress Span (mm)
Case 150010101520
Case 260010101520
Case 370010101520
Case 46006101520
Case 560014101520
Case 66001061520
Case 760010141520
Case 860010101515
Case 960010101510
Case 106001010155
Table 2. 430 ferritic stainless steel thermophysical properties.
Temperature (°C)Density (g/cm3)Heat Conductivity (W/(m × K))Young Modulus (GPa)Poisson RatioSpecific Heat (J/(g × K))Thermal Expansivity (10 × 10−6·K−1)
207.7217.42160.290.411.5
2007.6719.52050.30.512.3
4007.6221900.310.613
6007.5424.51650.320.813.6
9007.45281200.330.913.5
11007.3630950.340.814.5
15007.234500.350.816.9
Table 3. The influence of welding parameters on the degree of weld penetration of welded joints.
Case No.Laser Power
(W)
Welding Speed (mm/s)Pulse Frequency
(Hz)
Weld
Penetration
Case 15001010Upper plate
Case 26001010None
Case 37001010Upper plate ●●
Case 4600610Two plates
Case 56001410Upper plate
Case 6600106Upper plate ●●
Case 76001014Upper plate ●●
Case 86001010Upper plate ●●
Indicates slight weld penetration ●● indicates slight weld penetration.
Disclaimer/Publisher’s Note: The statements, opinions and data contained in all publications are solely those of the individual author(s) and contributor(s) and not of MDPI and/or the editor(s). MDPI and/or the editor(s) disclaim responsibility for any injury to people or property resulting from any ideas, methods, instructions or products referred to in the content.

