Article

Microstructure and Properties of Resistance Element Welded Joints of DP780 Steel and 6061 Aluminum Alloy

by
Qinglong Wu
,
Yue Yang
,
Yingzhe Li
,
Qing Guo
,
Shuyue Luo
and
Zhen Luo
*
School of Materials Science and Engineering, Tianjin University, Tianjin 300350, China
*
Author to whom correspondence should be addressed.
Metals 2025, 15(3), 283; https://doi.org/10.3390/met15030283
Submission received: 16 January 2025 / Revised: 23 February 2025 / Accepted: 27 February 2025 / Published: 5 March 2025
(This article belongs to the Special Issue Modeling and Mechanism Analysis of Welding Process for Metals)

Abstract

This study developed a metallurgical and mechanical hybrid resistance element welding (REW) method to fabricate lightweight Al/steel joints between 2.0 mm 6061 aluminum alloy and 1.2 mm DP780 steel, addressing critical challenges of interfacial intermetallic compounds (IMC layer thickness: 4.6–8.3 μm) in dissimilar metal welding. In addition, the scanning electron microscope (SEM), electron backscatter diffraction (EBSD), and electron probe microanalysis (EPMA) were used to observe the microstructure characteristics and element distribution. The lath martensite and solidification microstructure were observed in the steel-nugget zone and Al-nugget zone, respectively. Furthermore, the microhardness distribution, volume fraction of the α phase, tensile–shear load, and failure mode of REWed joint were studied. Process optimization demonstrated welding current’s pivotal role in joint performance, achieving a maximum tensile–shear load of 6914.1 N under 10 kA conditions with a button pull-out failure (BPF) mechanism.

1. Introduction

In recent years, energy efficiency has become a critical metric for assessing vehicle performance, driven by advancements in the automotive industry. The 10% mass reduction in automotive components demonstrates a quantifiable 5.5% decrement in both fuel expenditure and carbon dioxide output [1], making lightweight design a key focus of automotive research. The concept of lightweighting has evolved over time, with strategies differing across industries and products. However, the fundamental principle of multi-material joint structural design remains universally applicable.
The automotive industry employs various lightweight materials, including aluminum alloys, magnesium alloys, and high-strength steels [2]. Aluminum-based composites currently dominate automotive structural applications, achieving 23–28% mass optimization thresholds while maintaining cost-effectiveness. This material selection criterion fundamentally originates from their 98% plastic strain capacity. Steel, the primary structural material in the automotive industry, remains irreplaceable due to its low cost, excellent machinability, and superior impact absorption capabilities [3,4]. High-strength steel, particularly dual-phase (DP) steel, is frequently used in automotive body structures. DP steel is characterized by a microstructure comprising a ductile ferrite matrix with 10–20% of martensite [5,6]. Combining dual-phase steel with aluminum alloys capitalizes on the lightweight and corrosion-resistant properties of aluminum while preserving the structural integrity of steel. This combination is ideal for meeting the automotive industry’s demands for multi-material structures, considering factors such as raw materials, production processes, and cost.
Various joining techniques have been successfully applied to aluminum alloys and steel, including traditional methods such as riveting and adhesive bonding, as well as advanced techniques like solid-state welding [7,8,9,10,11], fusion welding [12,13,14], and hybrid welding [15,16,17,18,19,20]. However, significant differences in the physical metallurgy of aluminum alloys and steel [2] present challenges in achieving high-quality weld joints, even with fusion welding [21]. Defects such as hot cracking and porosity, which occur during the welding process, significantly compromise weld joint integrity. Moreover, the formation of intermetallic compound (IMC) layers at the welding interface further diminishes the mechanical performance of the welds [22,23,24,25,26].
To address the issues mentioned above, the resistance element welding (REW) process was developed based on the RSW technique [27,28,29,30,31]. REW offers an alternative method for joining dissimilar materials. In this process, components made of different materials are embedded into aluminum, magnesium, or other lightweight materials, and then welded using conventional resistance spot welding to produce high-quality joints.
Mohammad Abankar et al. [32] conducted a comprehensive study on the application of resistance element welding (REW) in the joining of steel and nonferrous metals. Cai et al. [33] experimentally investigated the microstructure and properties of the joints between DP780 steel and 5052 aluminum alloy joined by REW with counterbored holes. They analyzed the influence of welding current on the joints, providing a reference for dissimilar metal joining. Ji Yeon Shim et al. [34] comprehensively summarized the research status of REW in automotive metal joining and pointed out the future development directions. Yang et al. [35] studied the microstructure and properties of the joints between DP780 steel and 6061 aluminum alloy joined by REW with frustum-shaped units. While the application of REW has matured over time, the diversity of components makes it challenging to select appropriate elements for welding different materials. For aluminum alloy and steel connections [36,37,38], choosing the right components remains a critical challenge, and gaps persist in understanding the process parameters and bonding mechanisms of specific components.
In this study, resistance element welding (REW) was employed to join dissimilar materials of DP780 steel and 6061-T6 aluminum alloy. By incorporating Q235 structural elements with a through hole as auxiliary components, systematic investigations were conducted under different welding currents. This paper revealed the relationship between nugget diameter and current, identified IMC layer composition at the interface, presented the mechanical properties of REW joints, and examined the failure modes of the weld joints. The interfacial evolution behavior of REW joints at various welding currents was investigated.

2. Materials and Methods

2.1. Materials

This study used 2 mm-thick 6061-T6 aluminum alloy and 1.2 mm-thick cold-rolled DP780 steel as the base materials. The width and length of the base material sheets were 25 × 100 mm. As shown in Figure 1, Q235 steel elements with a bottom diameter of 5 mm and a top diameter of 8 mm were used as auxiliary components for the resistance spot welding between aluminum and steel. The metallurgical characteristics of 6061-T6 aluminum alloy, DP780 dual-phase steel, and Q235 structural steel are systematically documented in Table 1 and Table 2. Prior to welding, the DP780 steel sheets and Q235 elements were cleaned using ultrasonic cleaning in alcohol for 1 h to ensure welding quality. The Al alloy sheets were ground to remove the oxide layer on the surface of the samples. A through hole with a diameter of 5 mm was machined on the surface of the aluminum alloy sheets, followed by inserting the element into the through hole. The length of the element legs was matched to the thickness of the aluminum alloy sheets, which was 2 mm.
Figure 2 shows the OM images and XRD results of the Q235 steel, DP780 dual-phase steel, and 6061 aluminum alloy. As shown in Figure 1, it can be observed that both Q235 steel and DP780 steel contain a significant amount of ferrite, which is represented by a distinct α-phase diffraction peak in the XRD spectra, while the primary characteristic peak in 6061 aluminum alloy is α-Al.

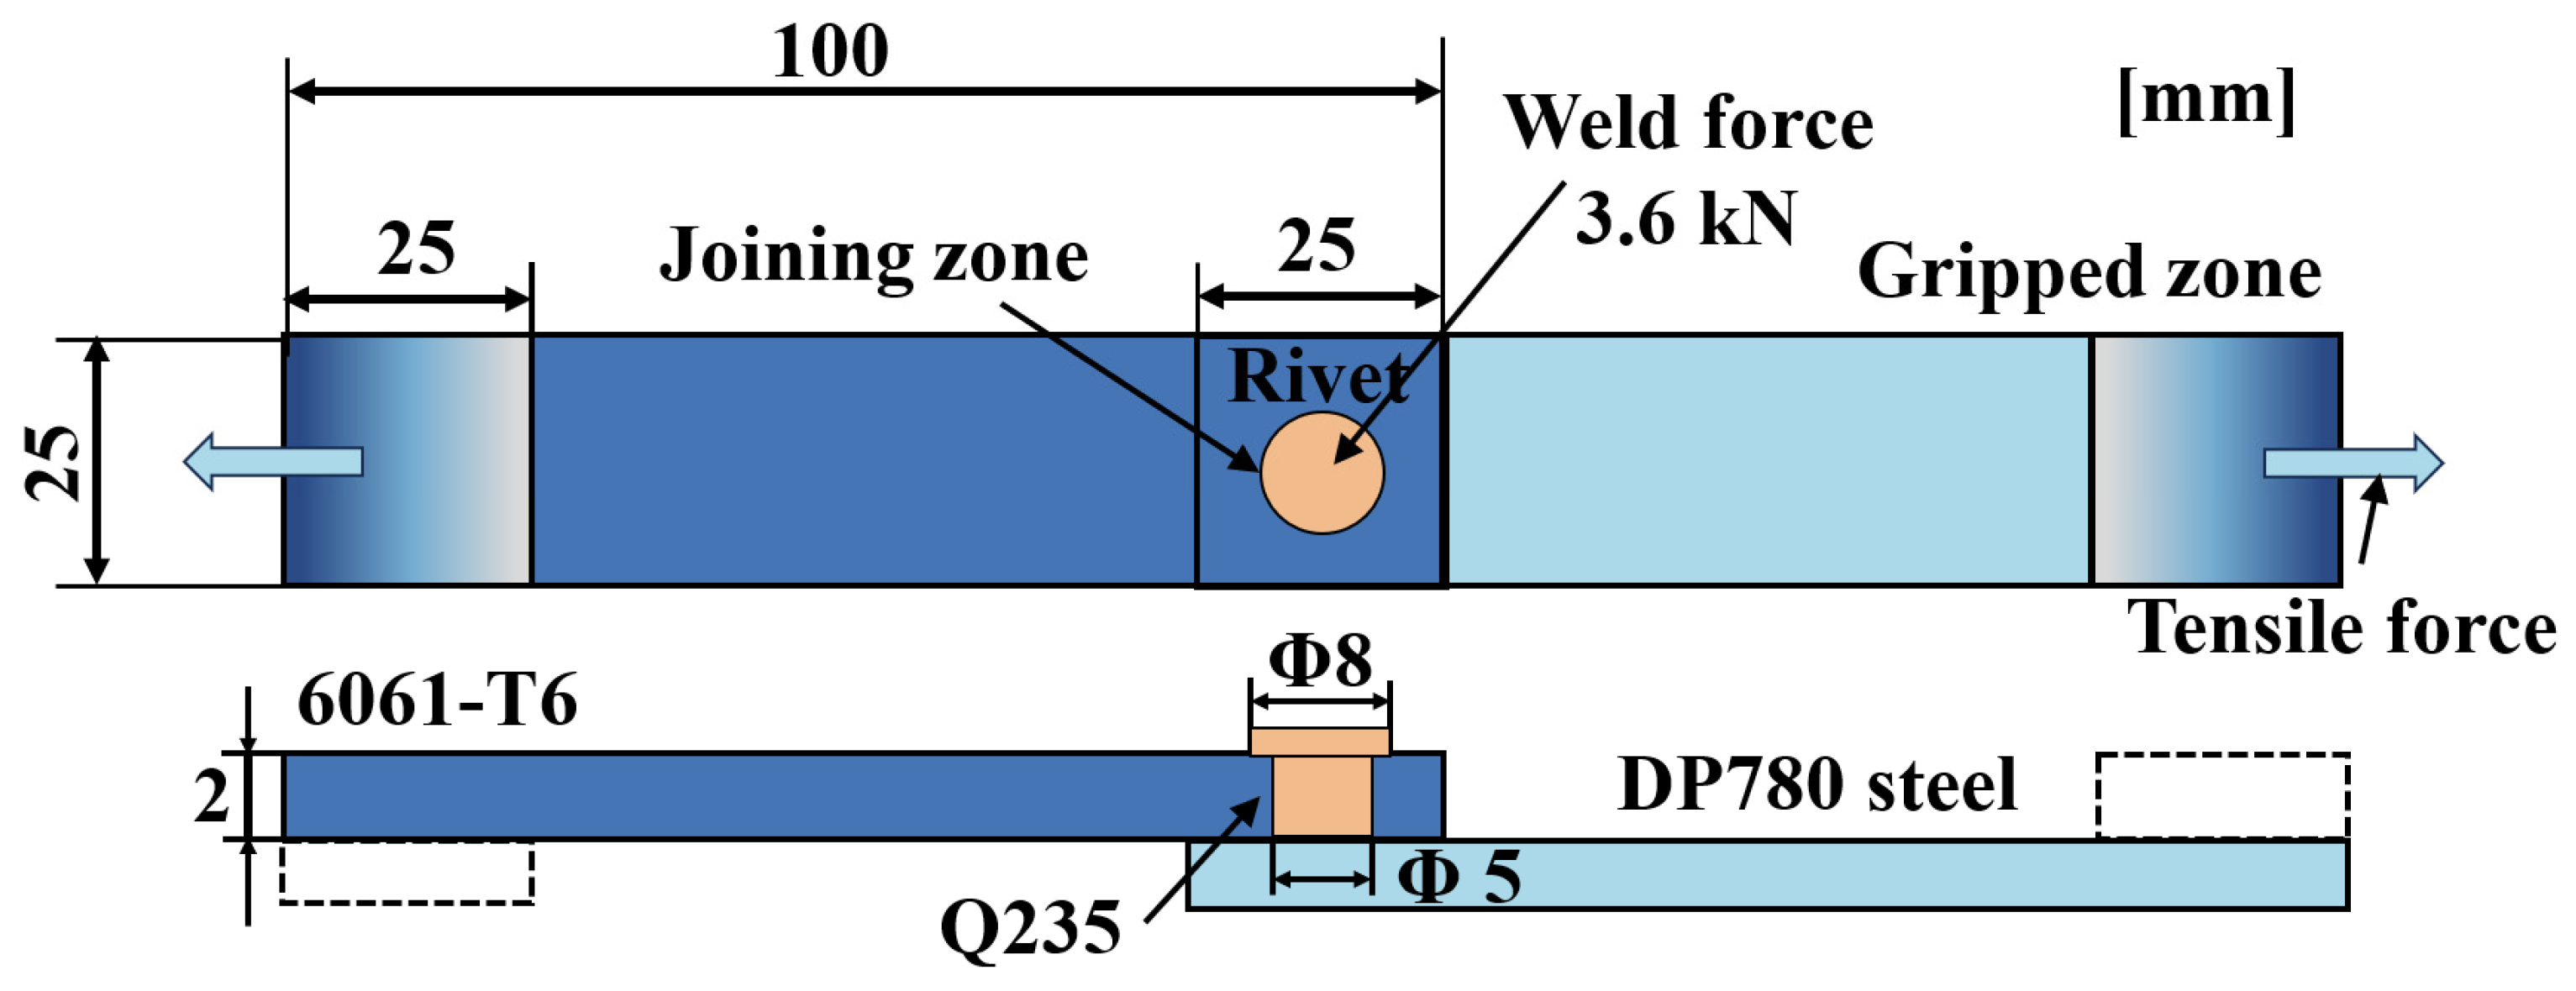
2.2. Experimental Procedure

To ensure good and precise contact between the upper electrode and the center of the element during welding, an R50 curved electrode was used for the upper electrode, and a flat electrode with a diameter of 10 mm was used for the lower electrode. During welding, the electrodes were aligned with the center of the element for resistance spot welding. The experimental parameters were set according to the results of the pre-experiment and some references [35]. The REW process parameters were 6.0–20.0 kA, welding time was 200 ms, welding force was 3600.0 N, squeeze time was 6000 ms, hold time was 1000 ms, preheating time was 6000 ms, and cooling time was 1000 ms.

2.3. Metallographic Observation

After welding, metallographic samples from the center region of the joint were obtained by wire cutting, and the unetched samples were embedded in epoxy resin. The samples were polished using SiC sandpaper of grades 600#, 800#, 1000#, 1500#, and 2000#, followed by three rounds of polishing with diamond spray. The Q235 and DP780 steel surfaces were etched with 4% nitric acid alcohol solution for 7 s, while the aluminum surface was etched with Keller’s reagent for 25 s. Microstructural characterization encompassed multi-scale analysis. Macroscopic joint morphology was observed using an Olympus SZX12 stereomicroscope (Olympus Corporation, Tokyo, Japan), while microscopic features were examined with an Olympus GX51 microscope (Olympus Corporation, Tokyo, Japan), employing Keller’s reagent for aluminum and nital solution for steel. High-resolution imaging and compositional analysis utilized scanning electron microscopy (SEM) equipped with energy-dispersive spectroscopy (EDS) and electron probe microanalysis (EPMA). Crystallographic evaluations were performed via electron backscatter diffraction (EBSD) to obtain grain orientation data.

2.4. Mechanical Properties

Microhardness profiling across the resistance element welded joints was systematically conducted using a Vickers hardness testing apparatus with a load of 200 g and a dwell time of 15 s. All welded joints were subjected to tensile–shear testing at room temperature with a constant stretching rate of 2 mm/min using a WDGDW-100 universal testing machine (Wuhan Zhongke Instrument Co., Ltd., Wuhan, China). Figure 1 shows the schematic diagram of tensile–shear specimens for Al/steel REWed joints. To ensure the reliability of the data, each welding condition was repeated three times. The distribution of α-phase in aluminum/steel REW joints with different component shapes was measured using a Fischer FERITSCOPE(Qingdao Haozheng Keyi Intelligent Technology Co., Ltd., Qingdao, China). This technique measures the ferrite and martensite content in low-carbon and high-strength steels based on magnetic induction.

3. Result

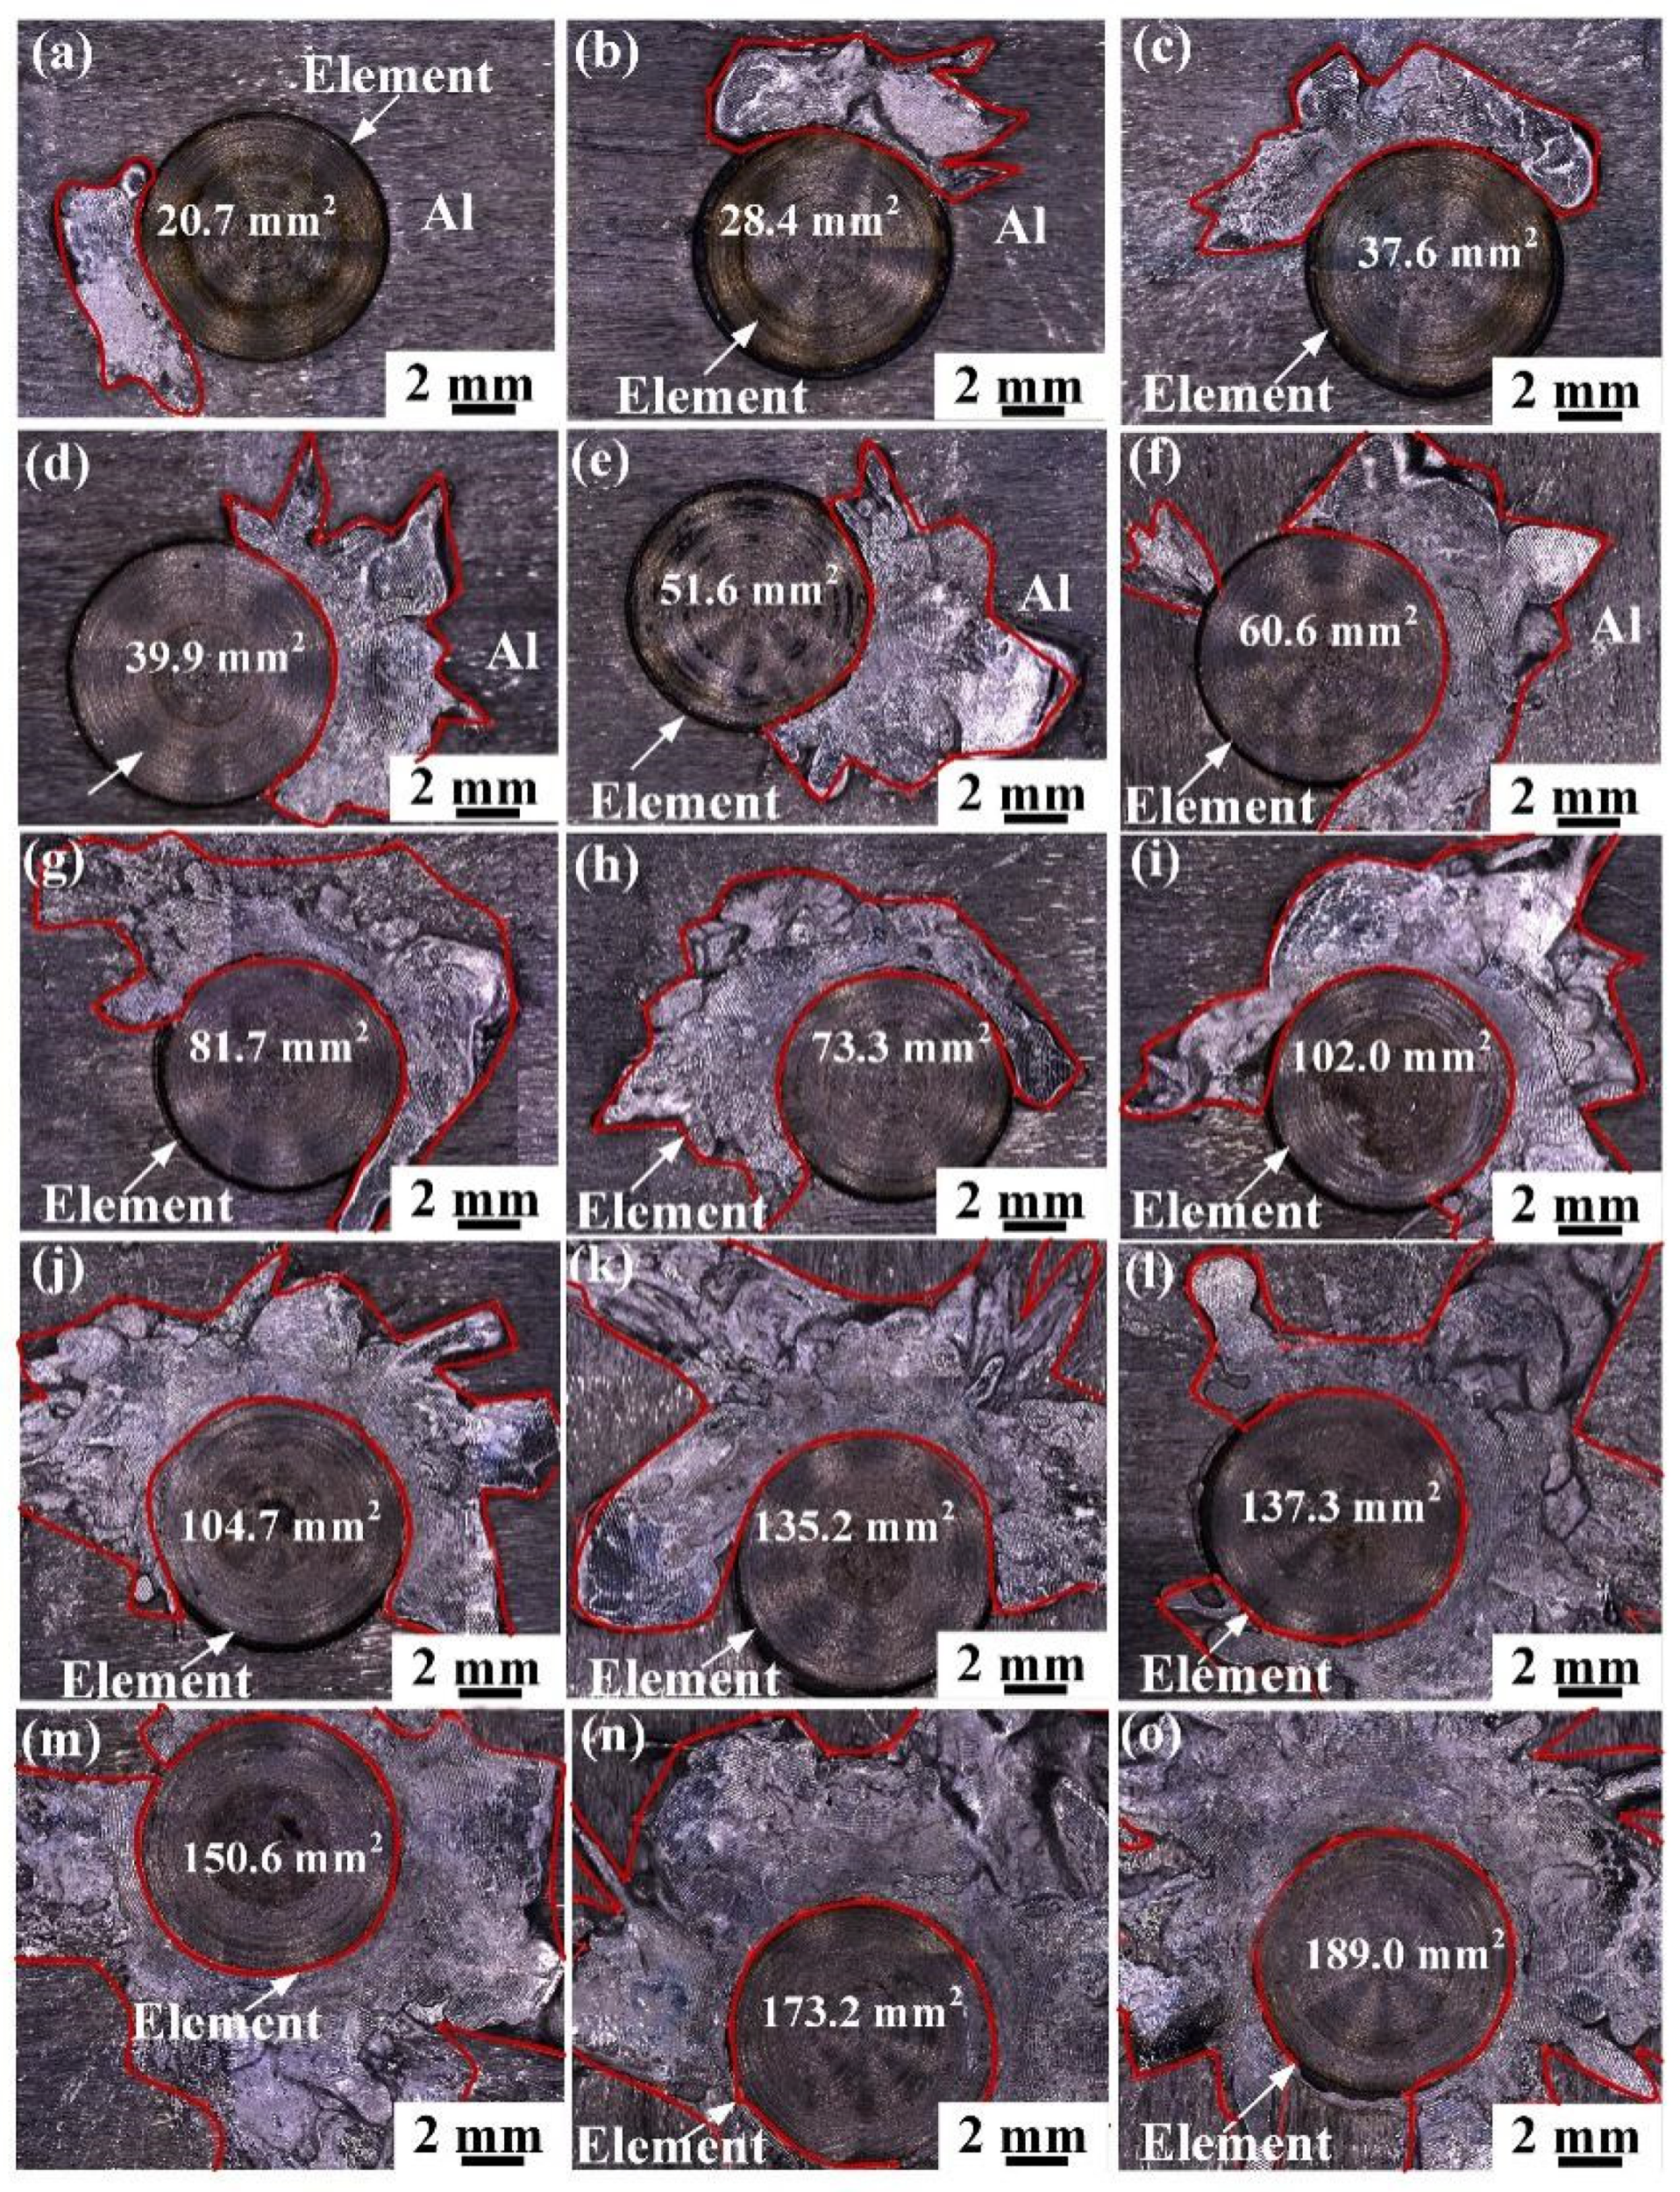
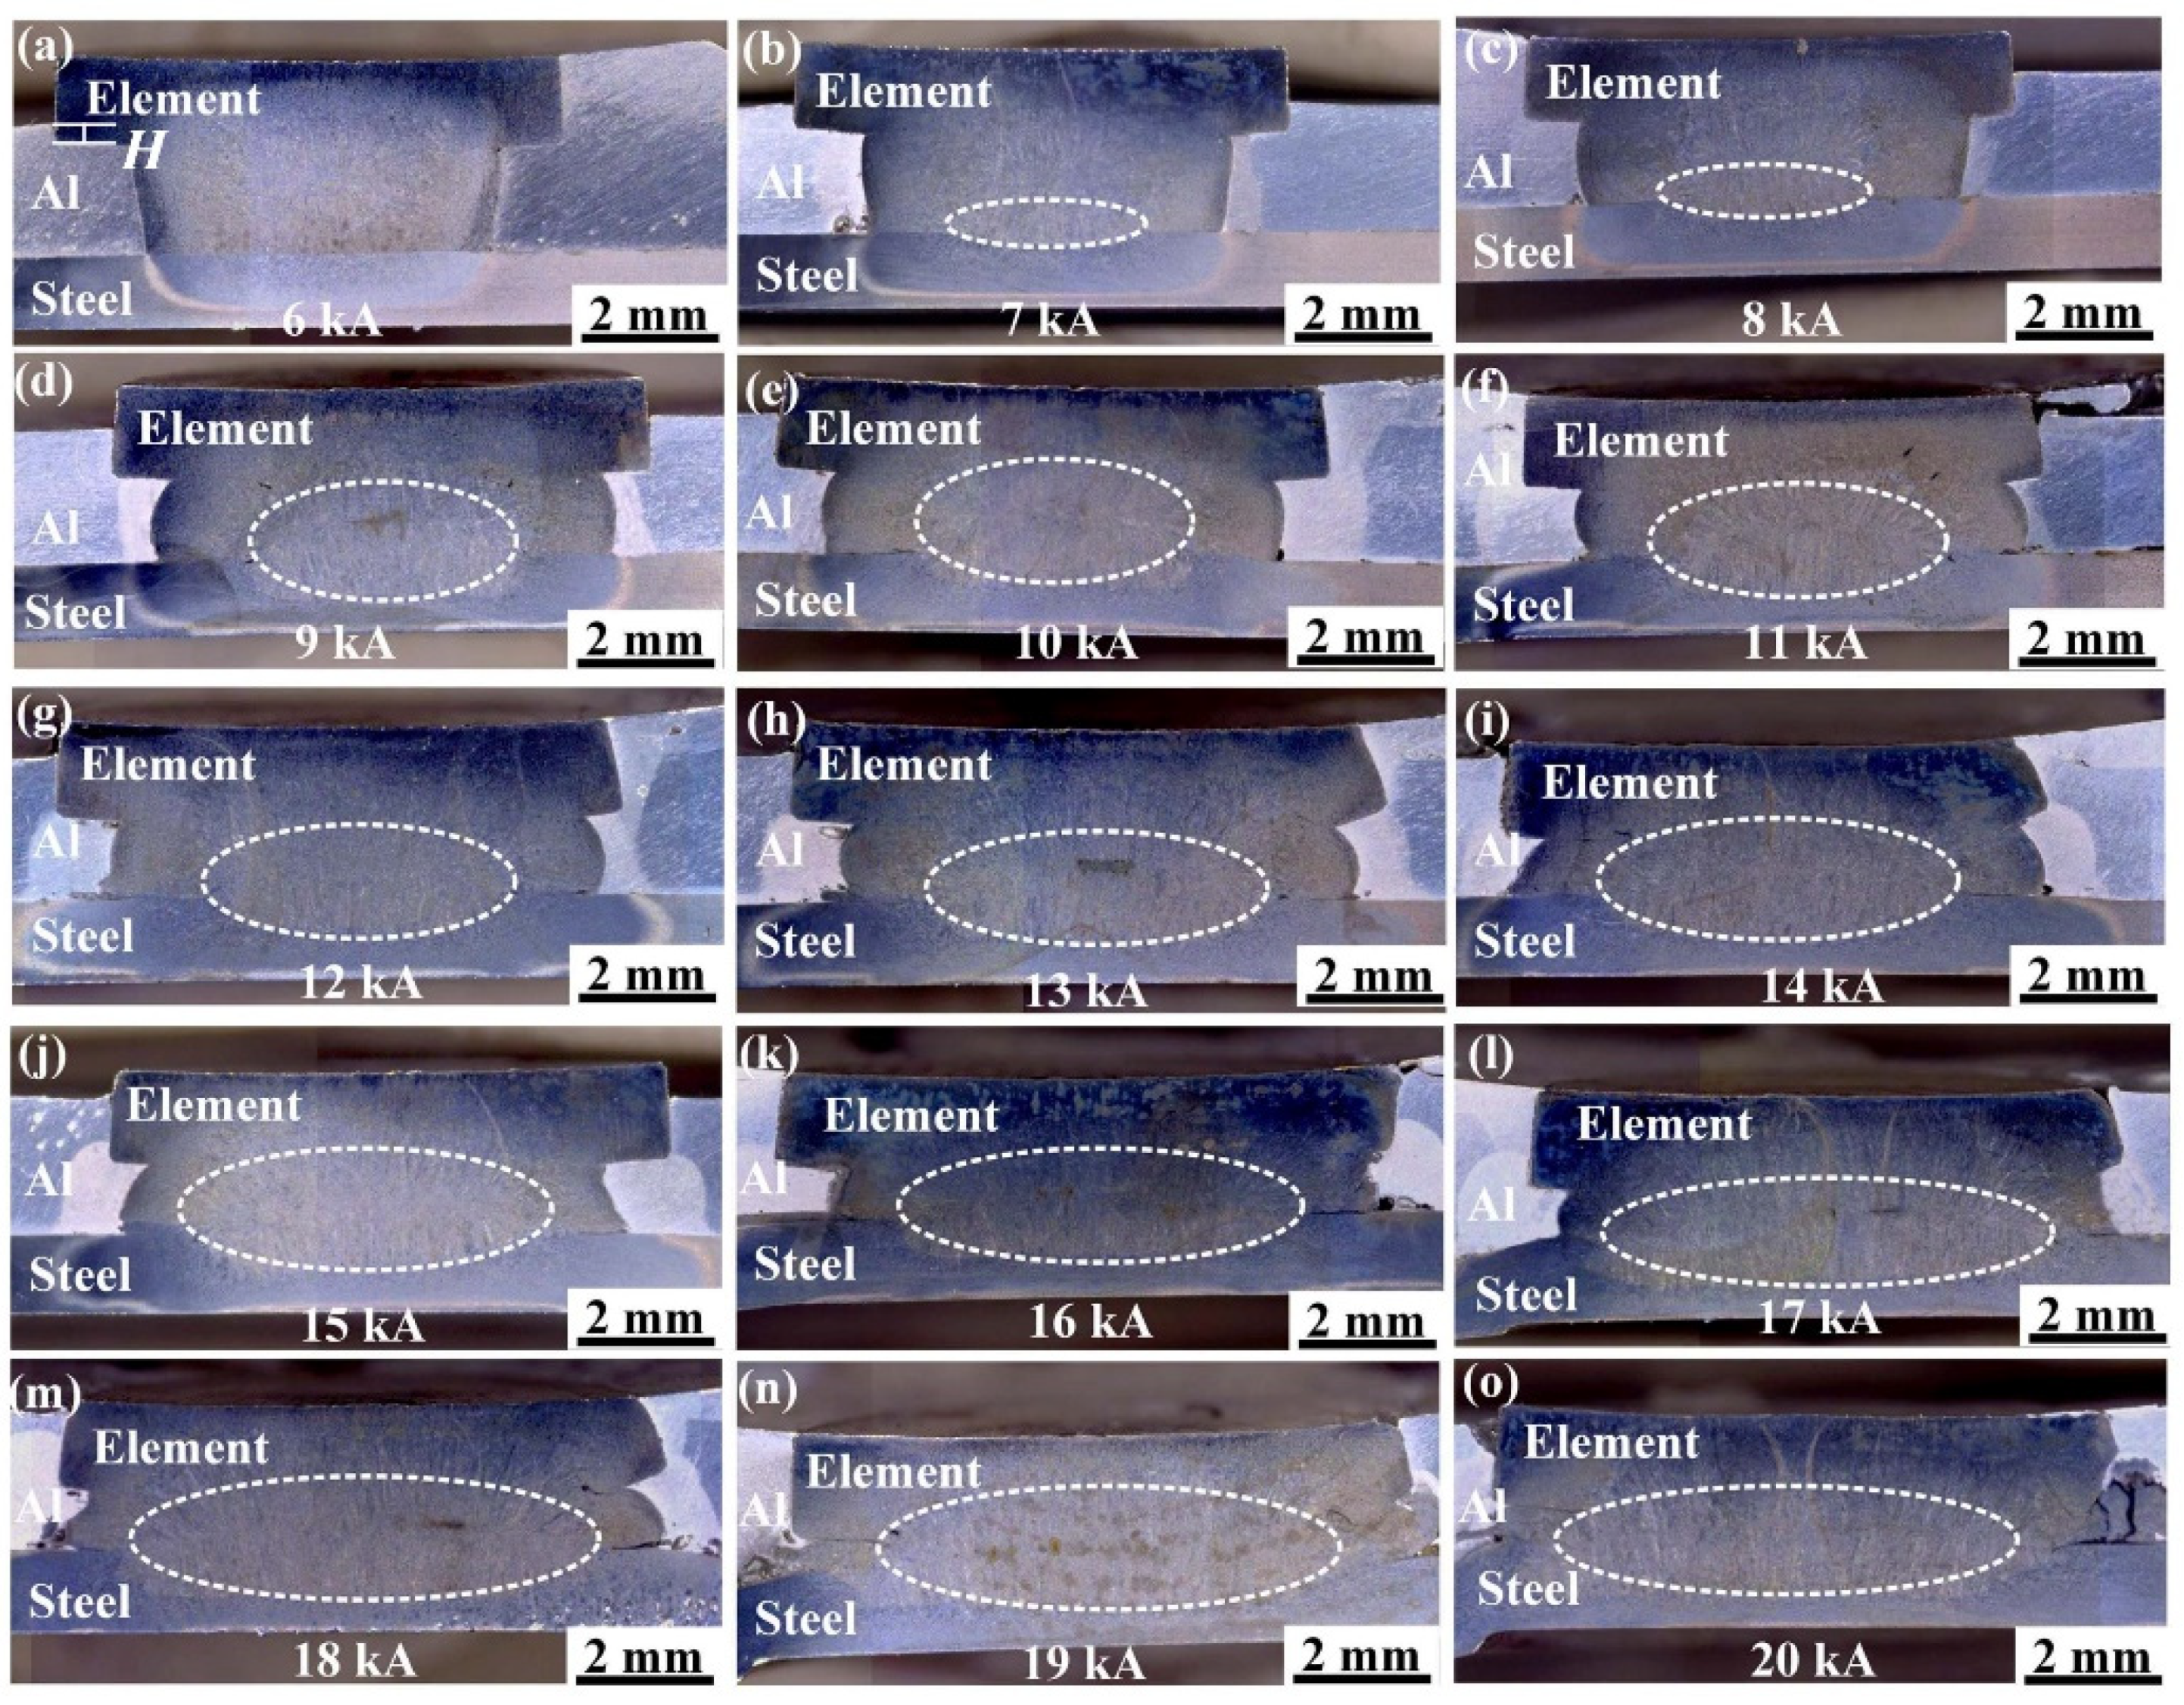
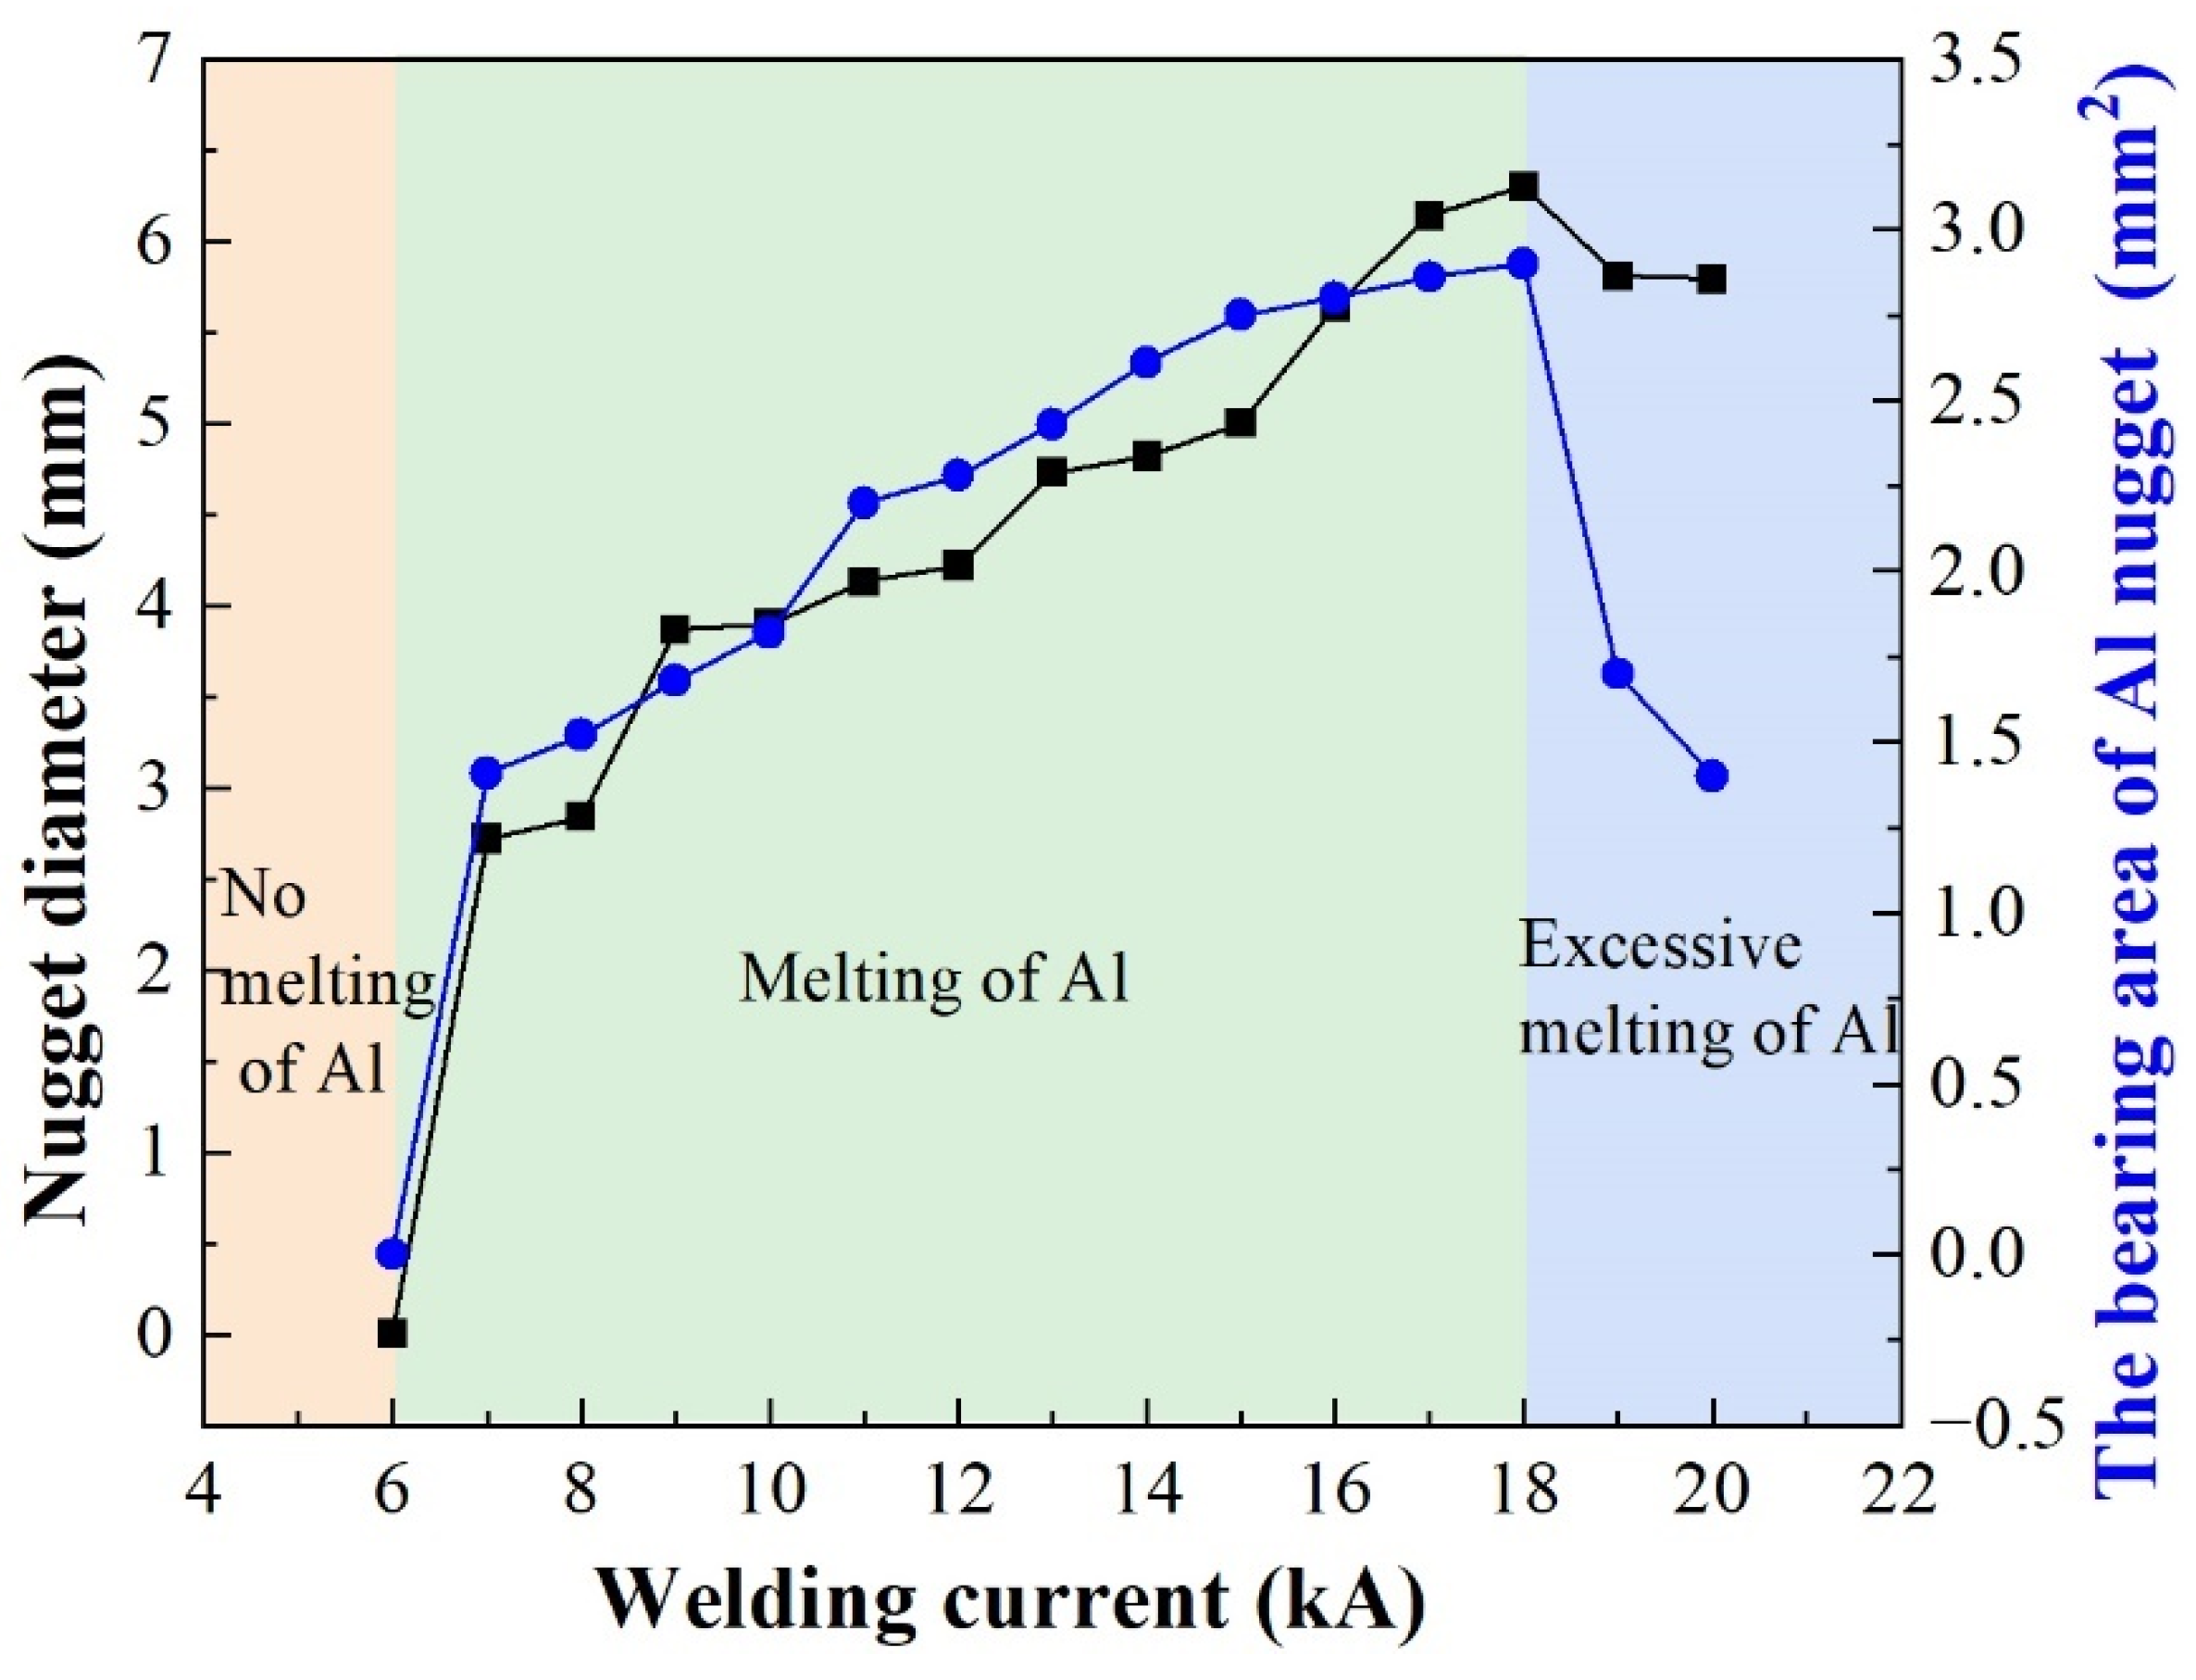
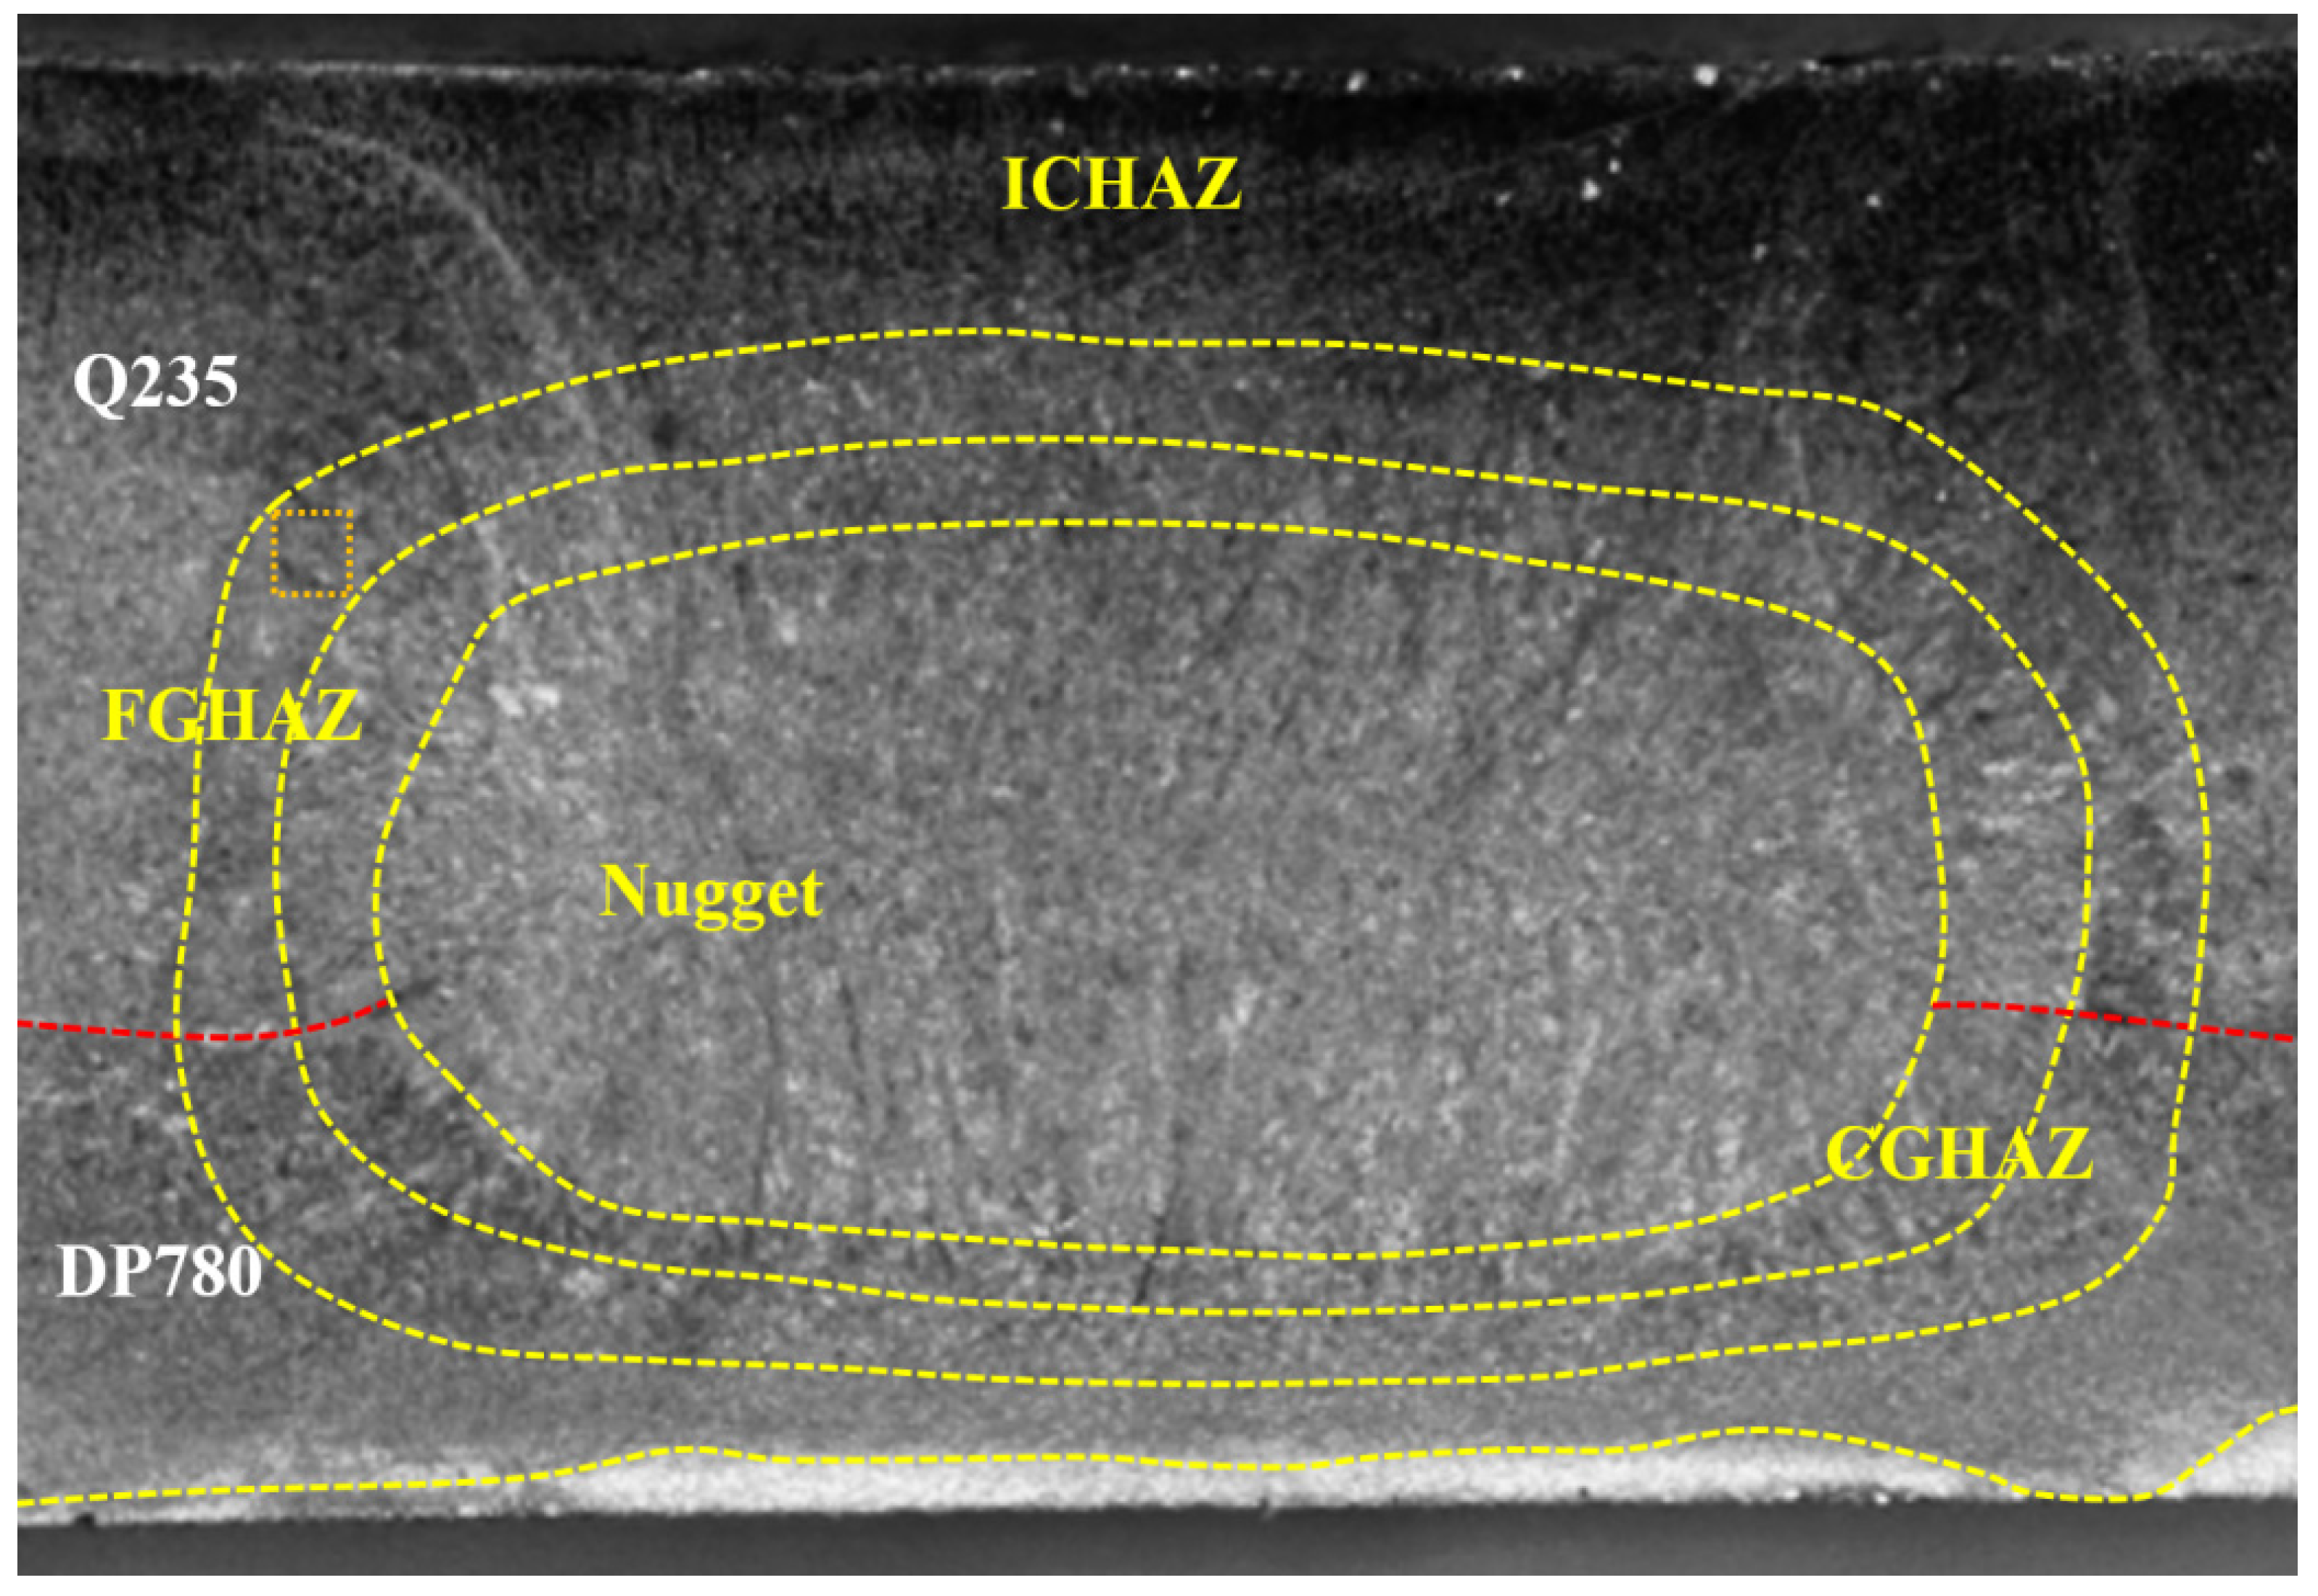
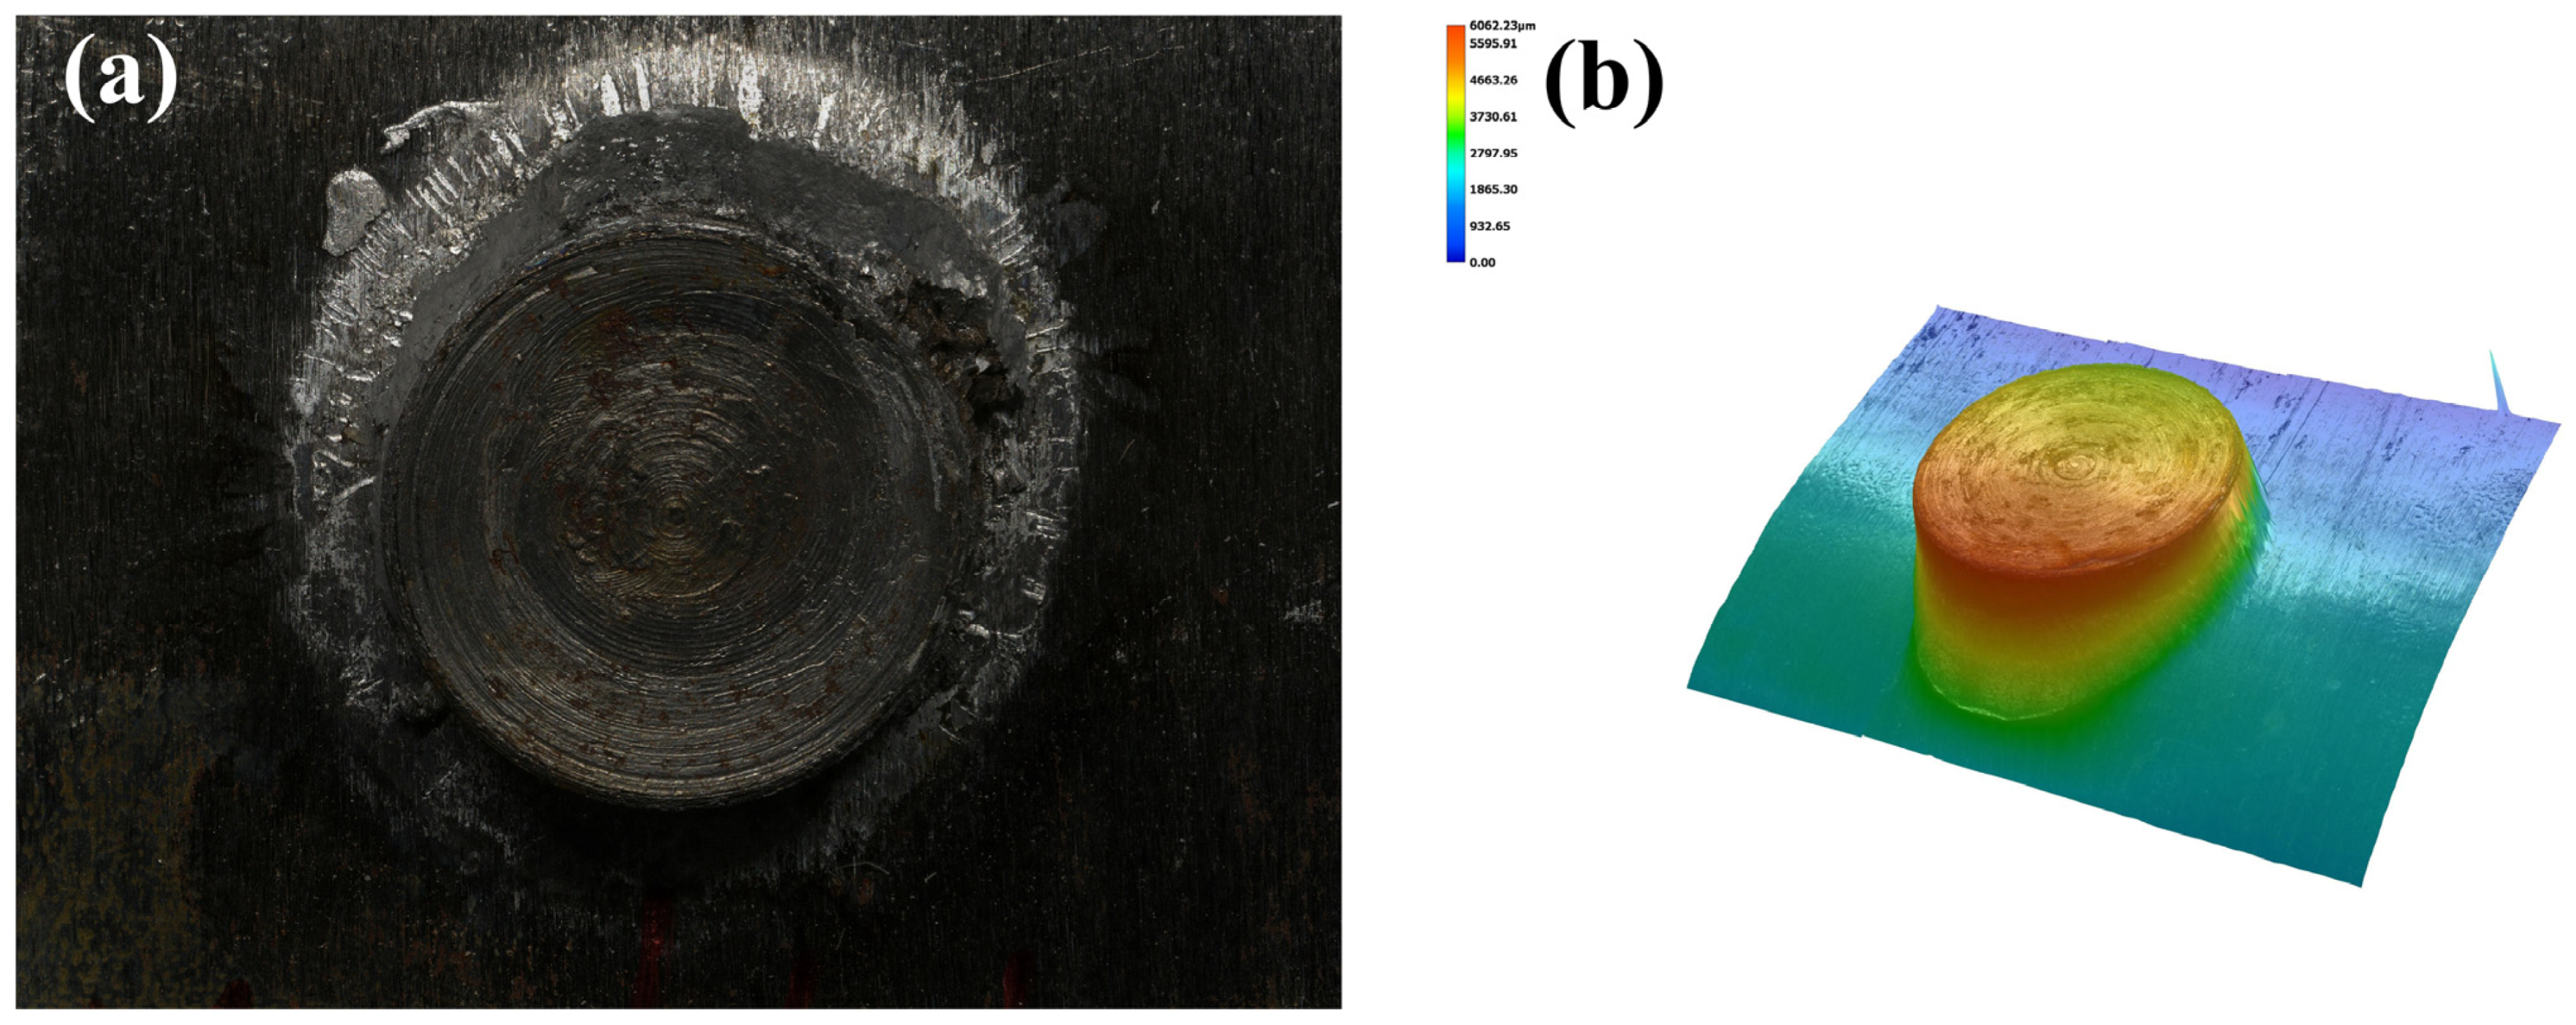
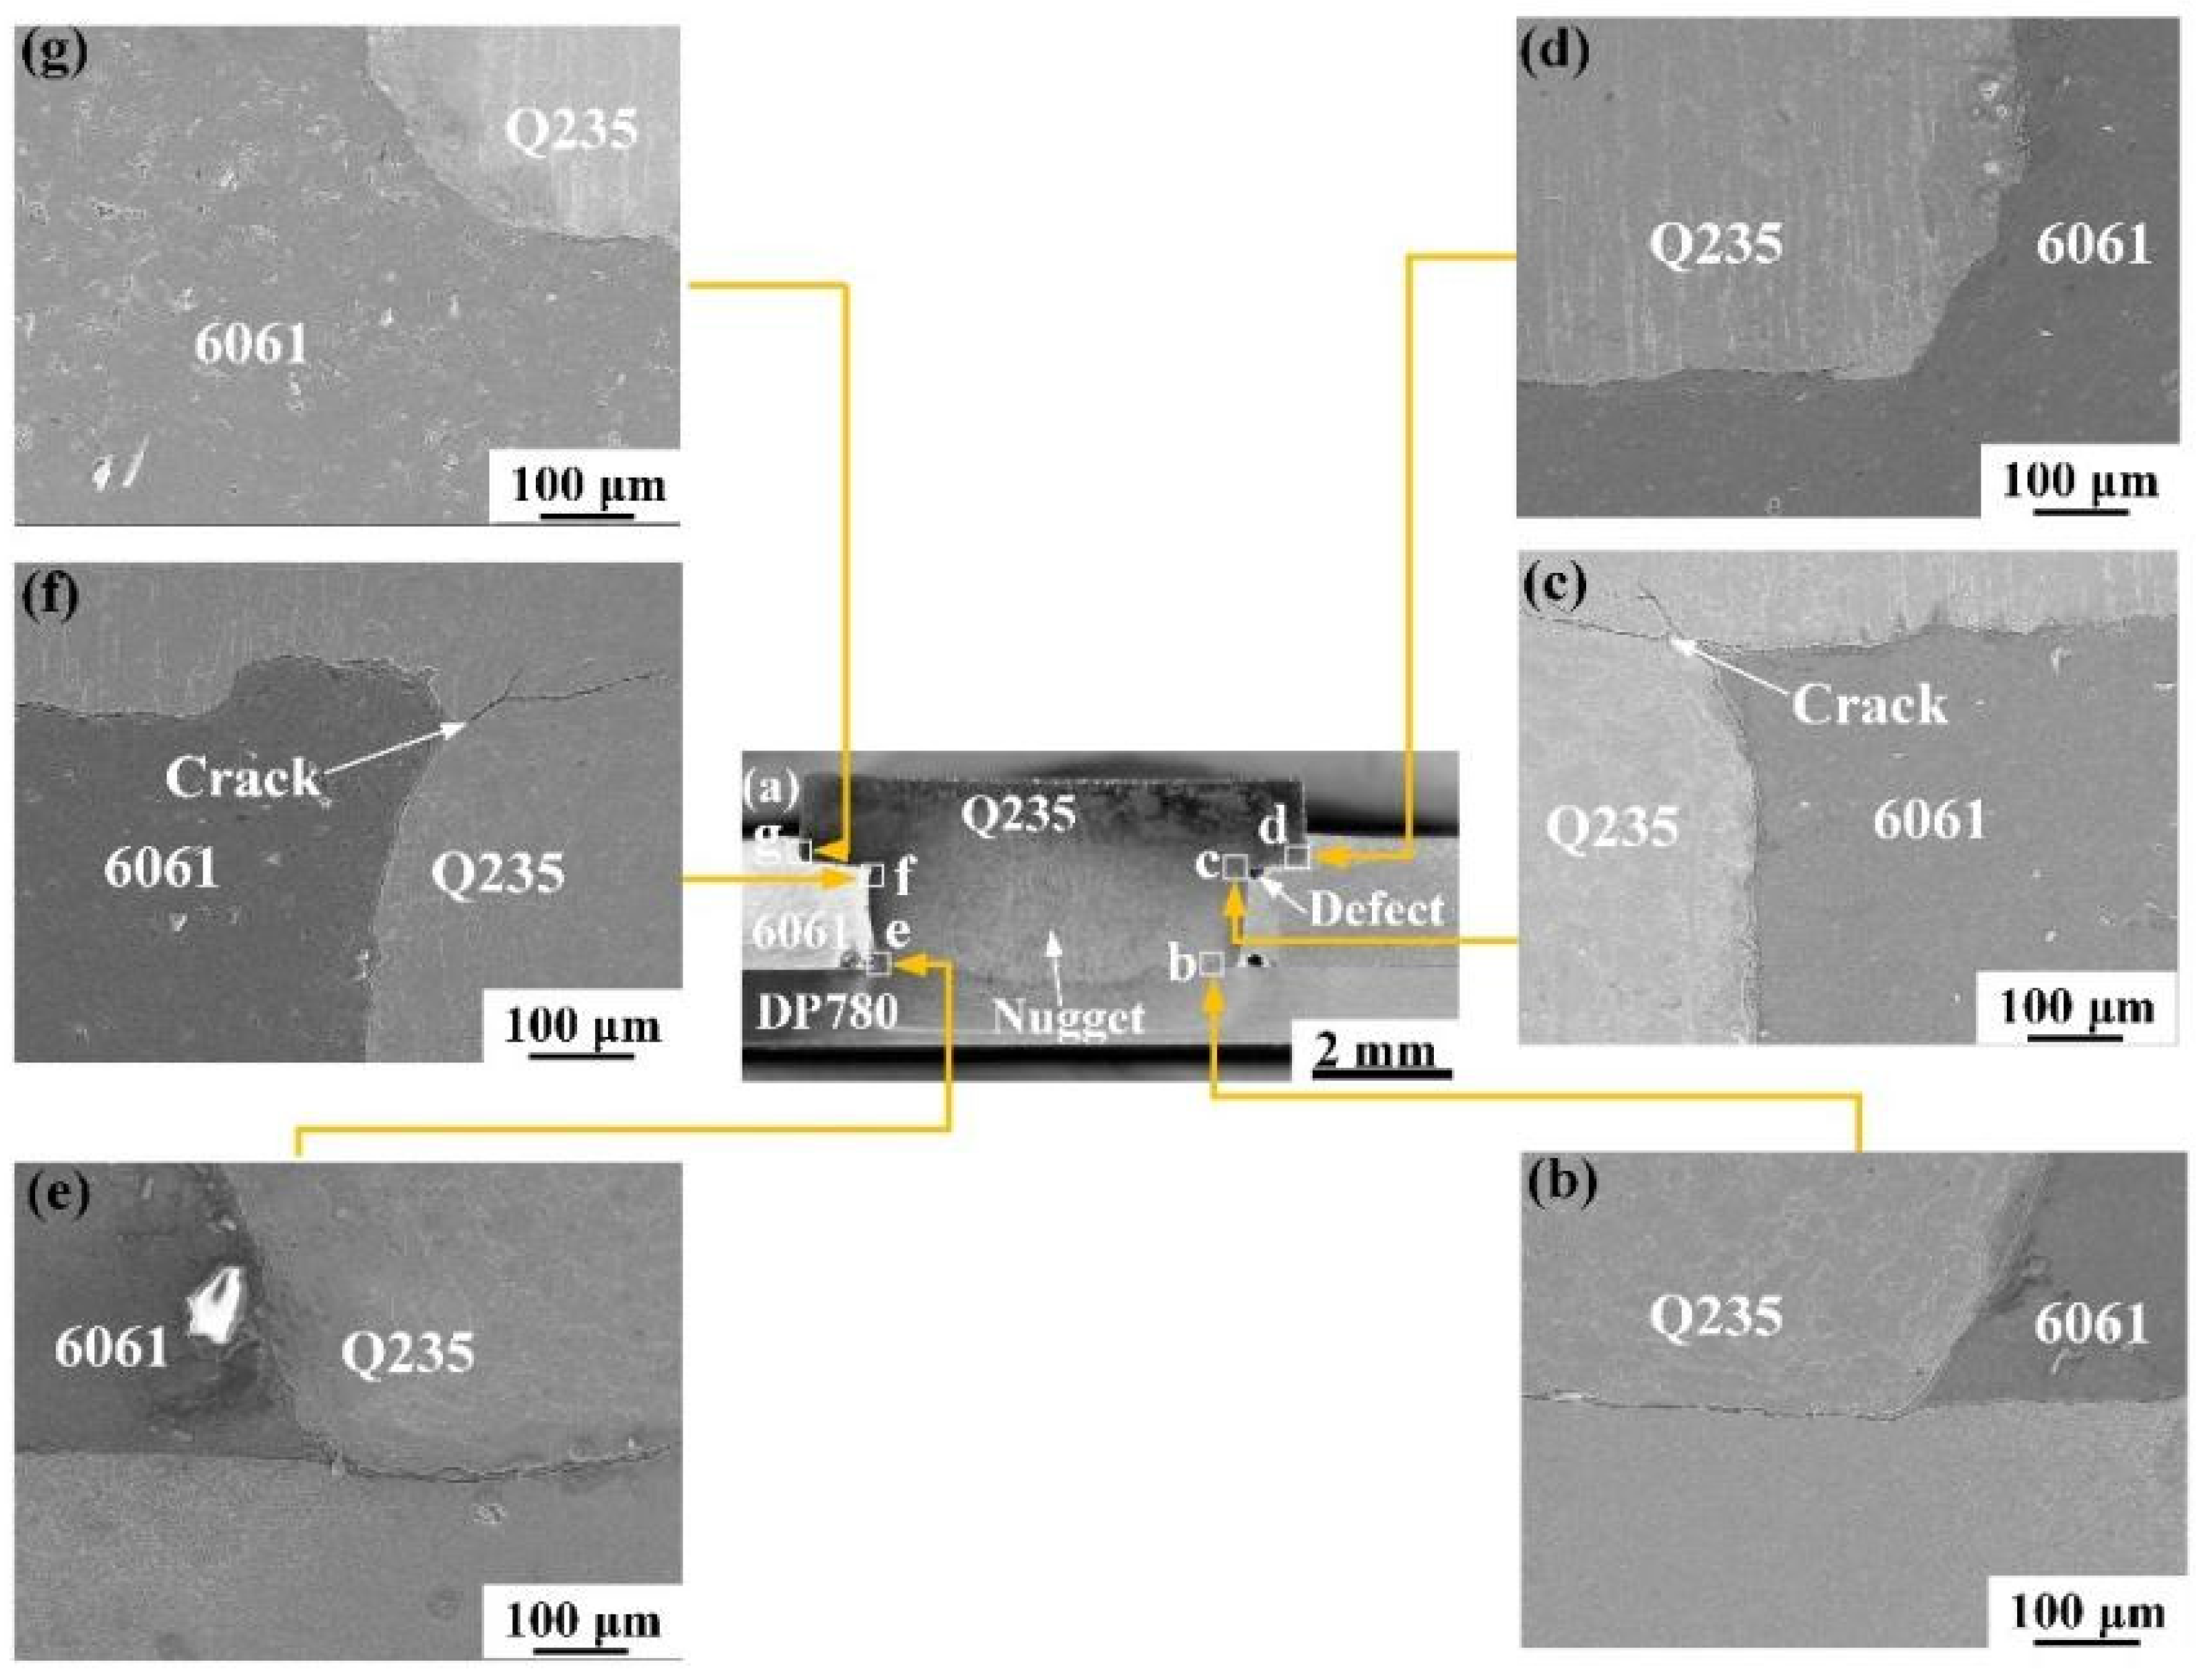
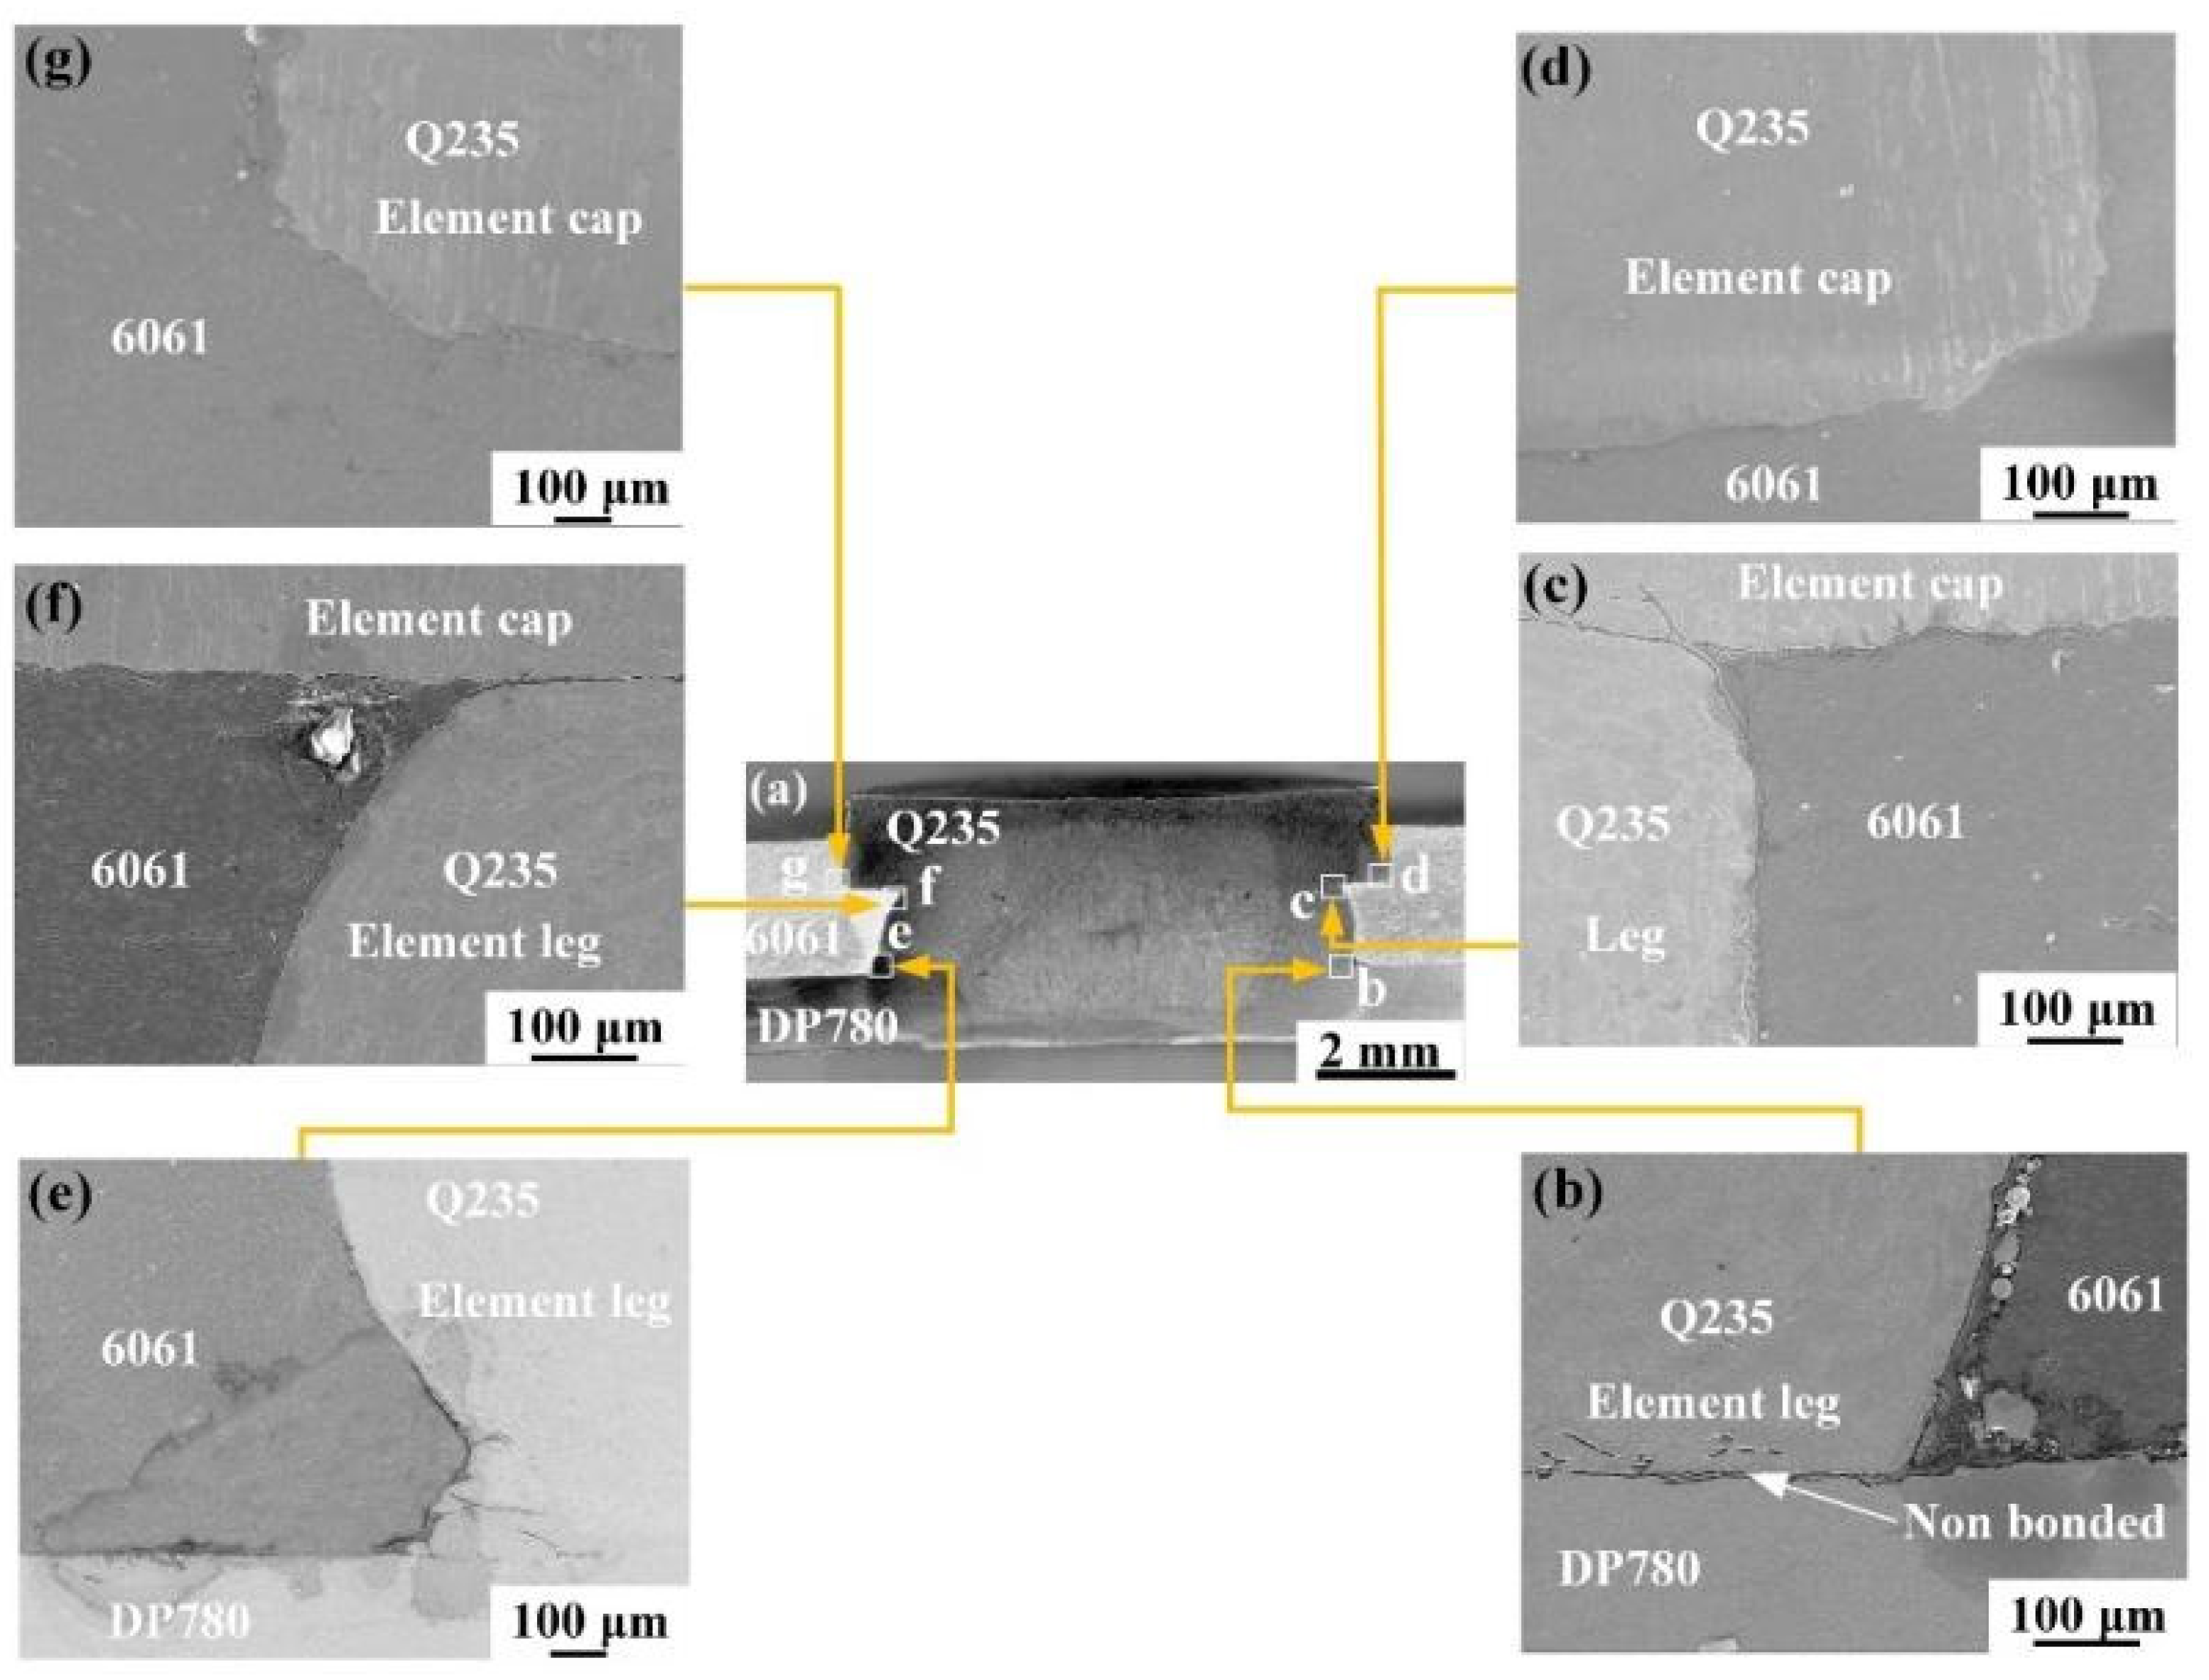
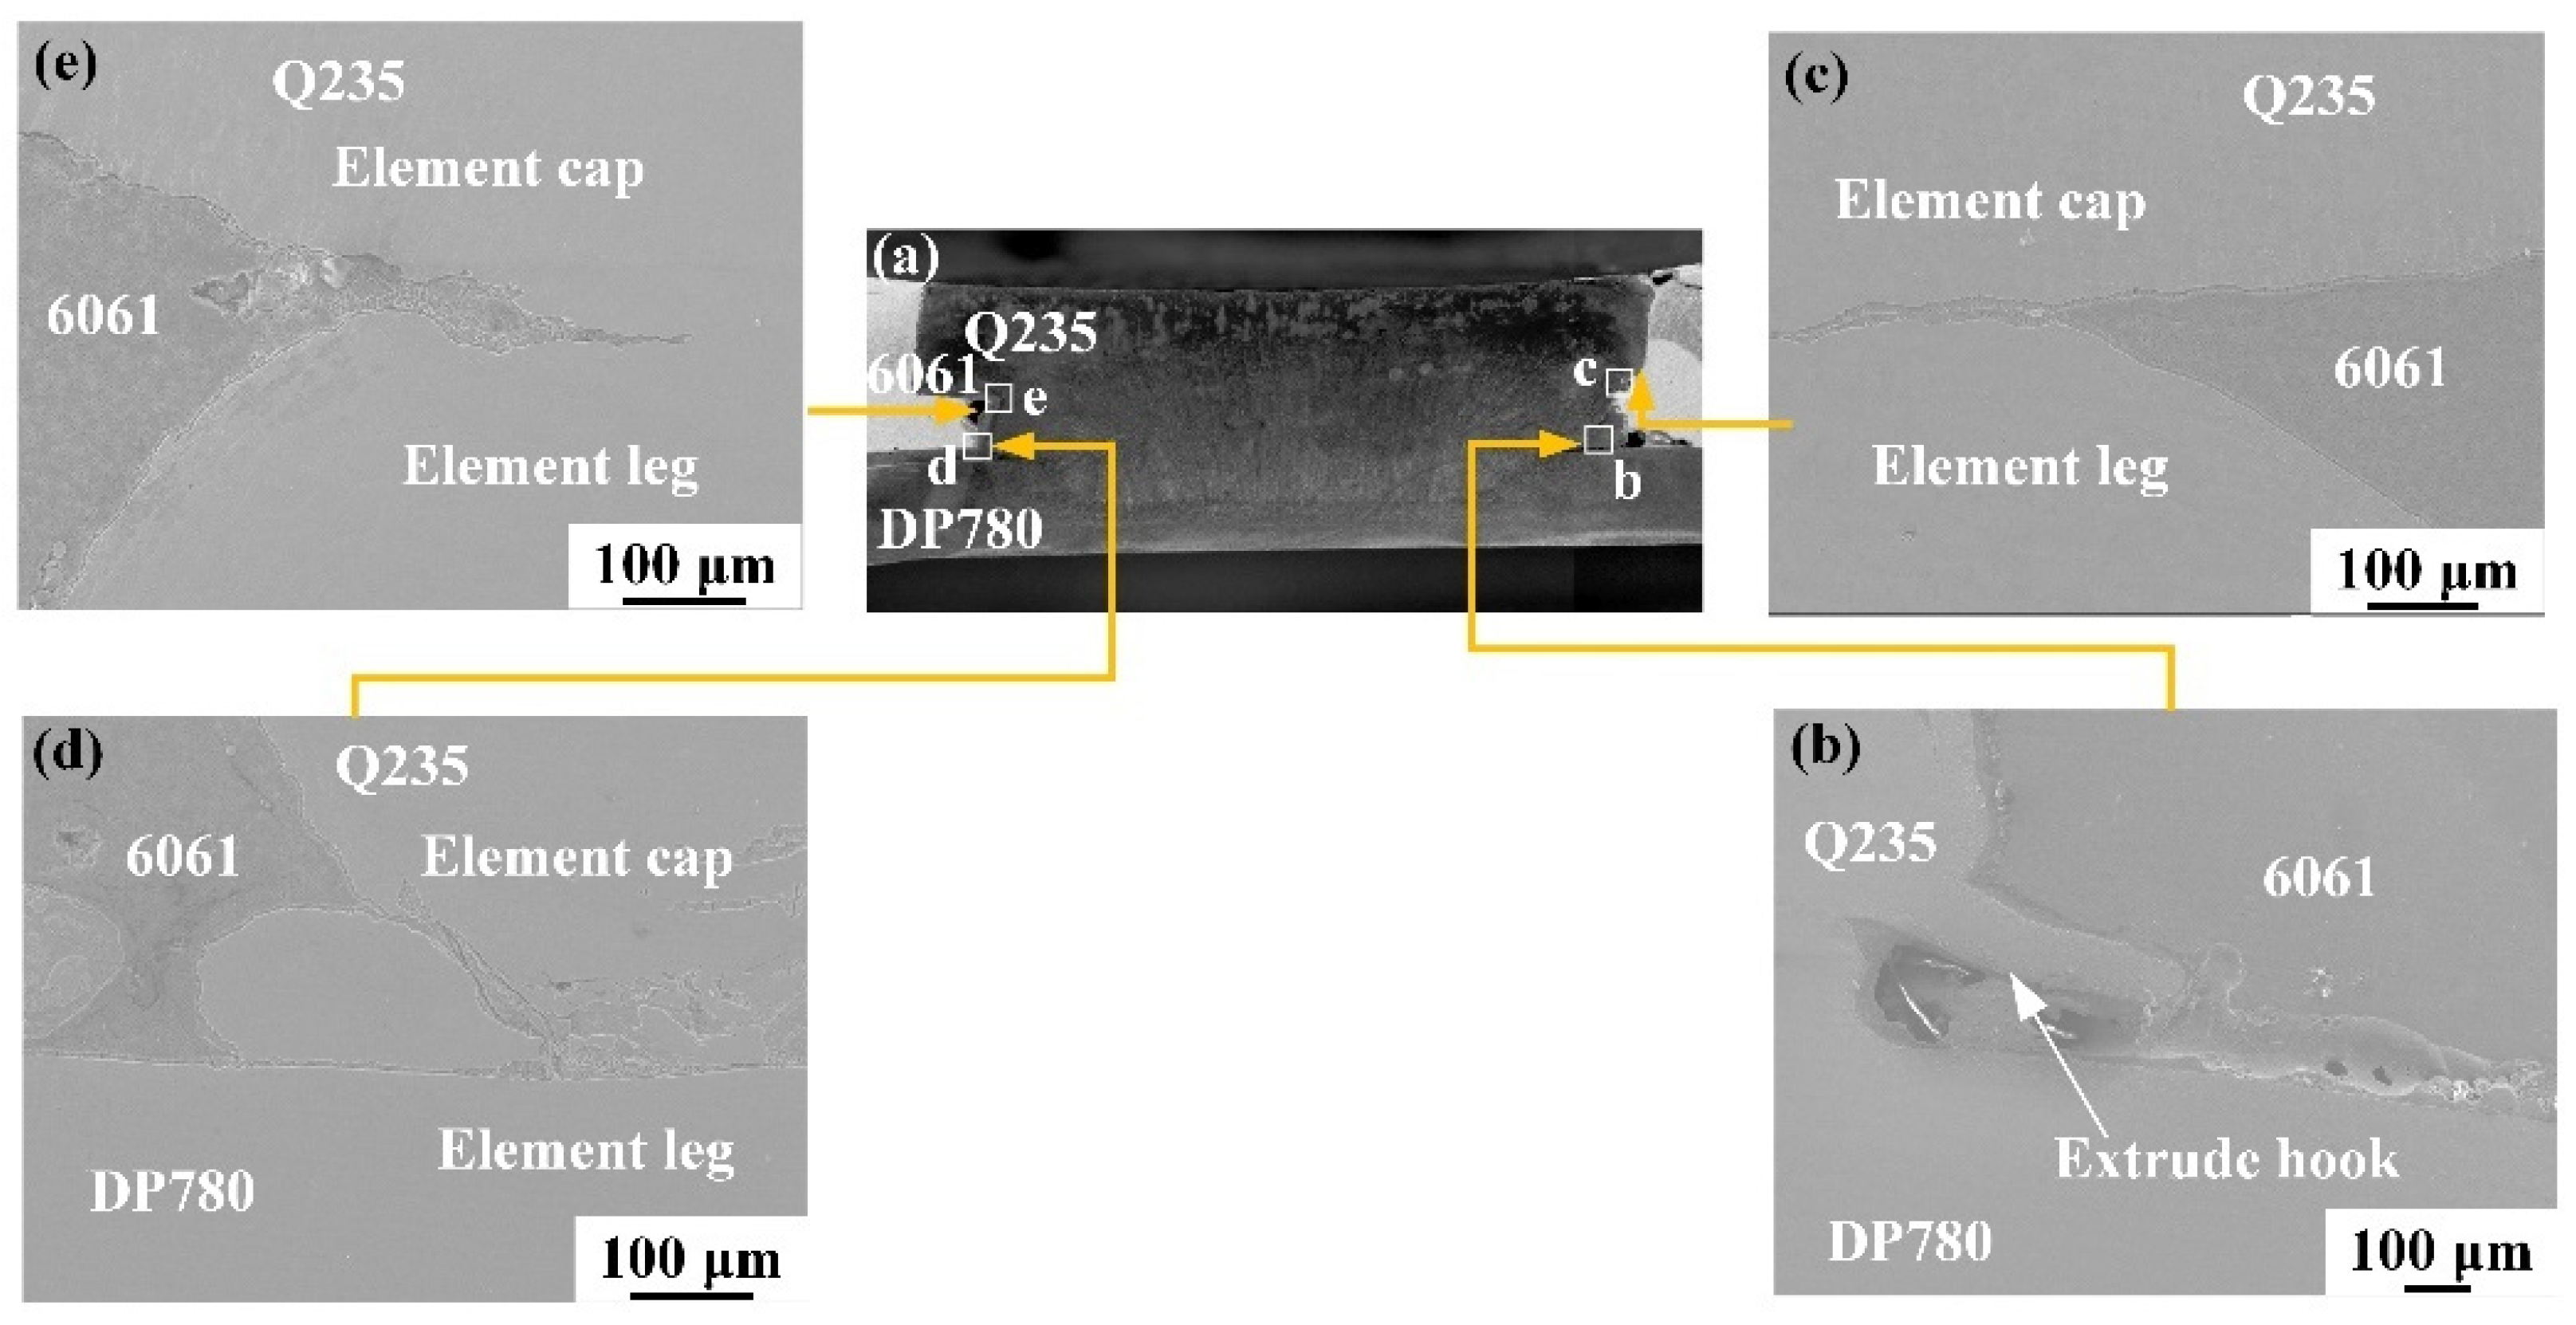
3.1. Macroscopic Morphology of the Joint Surface and Cross-Section

To observe the surface morphology changes of the unit with cap welding, the surface of one side of the unit was examined. Figure 3 shows the surface morphology of the aluminum/steel REW joints with flat-headed units at different welding currents. A significant amount of aluminum alloy spatter is observed around the flat-headed unit cap surface. Spatter was also observed at the contact point between the unit cap and the top plate in Figure 1, which may be due to the unit leg length slightly exceeding the thickness of the pre-drilled hole in the aluminum alloy. When the welding current was between 6 kA and 9 kA, less aluminum melted at the unit–aluminum interface. As the welding current increased from 10 kA to 20 kA, the deformation of the unit and plate increased. During the welding process, insufficient contact occurred between the unit shoulder and the top surface of the plate, leading to higher contact resistance. As the current flowed, the current density at the contact point increased, resulting in the formation of spatter. Gaps appeared at the unit–aluminum alloy interface, and the spatter area increased from 51.6 mm2 to 189.0 mm2.
Figure 4 shows the cross-sectional morphology of aluminum/steel REW joints with flat-headed units at different welding currents. The surface of the flat-headed units is significantly higher than that of the aluminum alloy surface on the top plate. From Figure 4, it can be observed that the nugget primarily shifts toward the Q235 side. The increased resistance caused by the excessive thickness of the Q235 unit results in greater Joule heat on the Q235 steel side compared to the DP780 steel side, causing the nugget to shift toward the aluminum alloy side. As the welding current increases, the lower end face of the element exhibits bulging due to the combined effects of electrode pressure and welding heat input, leading to an increase in the element’s lower end diameter. This also weakens the locking effect of the element cap on the molten aluminum alloy, resulting in welding defects such as thermal cracks at the material interface.
The amount of compression at the head of the flat-headed unit varies with different welding currents. Figure 5 shows the relationship between the welding current and the depth of unit cap penetration (H) into the aluminum plate. The results indicate that as the welding current increases from 6 kA to 19 kA, the depth of unit cap penetration into the aluminum plate increases from 0.26 mm to 1.52 mm. At a welding current of 18 kA, the penetration depth approaches the height of the unit cap, resulting in a good mechanical interlocking effect. Further increasing the welding current to 20 kA leads to excessive heat input, causing some molten aluminum alloy to spatter. As a result, certain areas of the unit cap fail to form effective mechanical interlocking with the aluminum alloy. At a welding current of 6 kA, the heat input is too low, resulting in insufficient metallurgical reaction. The presence of the unit’s lower end and the bottom plate interface can be clearly observed, with no nucleation occurring at the interface (Figure 4a). Due to the lower hardness of Q235 steel compared to DP780 steel, the indentation of the flat-headed unit increases in the thickness direction as the welding current increases. Bulging occurs in the axial direction of the unit, causing the diameter of the unit’s lower end face to gradually increase. The heat generation at the unit leg and the bottom plate interface also increases, leading to an increase in the nugget diameter.
Figure 6 demonstrates a three-stage evolution of joint morphology with increasing welding current. In the initial formation stage (6–14 kA), the nugget diameter expands from 0 mm to 5.8 mm while the aluminum melting area simultaneously develops to 2.4 mm2. The optimal processing window occurs at 14–18 kA, achieving the best parameters with a 6.3 mm nugget diameter and 2.9 mm2 melting area. Beyond the 18 kA threshold, excessive thermal inputs induce inverse phase transformation phenomena: a small reduction in nugget diameter at 20 kA and the formation of little volume fraction shrinkage cavities through rapid solidification processes. This critical overheating condition generates concentrated thermal stresses that degrade load-bearing capacity by 18–22% compared to optimized parameters.
As shown in Figure 7, the nugget region consists entirely of lath martensite. According to the Fe-C phase diagram, the nugget initially solidifies as high-temperature ferrite, which then transforms into austenite as the temperature decreases. Due to the presence of cooling water, under rapid cooling conditions, the austenitic microstructure completely transforms into martensite. Figure 7 further illustrates that the heat-affected zone (HAZ) of DP780 steel can be subdivided into the coarse-grained austenite zone (CGHAZ), fine-grained austenite zone (FGHAZ), intermediate critical zone (ICHAZ), and subcritical zone (SCHAZ). The coarse-grained austenite zone is adjacent to the nugget line where heating temperatures often exceed TKS. Due to the high heat input, the austenite grains rapidly grow, resulting in significant grain coarsening. After rapid cooling, the microstructure predominantly consists of lath martensite, with some coarse bainite. The fine-grained austenite zone experiences temperatures between Ac3 and TKS where the original DP780 grains undergo complete recrystallization. Sufficient thermal energy drives the recrystallization process, and under the influence of cooling water, the microstructure predominantly consists of fine martensite, with some fine ferrite inclusions. The intermediate critical zone is typically heated between Ac1 and Ac3 during the welding thermal cycle. Only partial recrystallization of the original microstructure occurs, with some pearlite transforming into austenite, while ferrite remains in its original state. The subcritical zone experiences peak temperatures below Ac1, where no austenite phase transformation occurs. However, it is affected by the welding heat source, leading to a slight increase in dislocation density.
Figure 8 shows the SEM images of the microstructure of the REW joint under a welding current of 16 kA, including the nugget, the aluminum alloy melting zone, and the heat-affected zone on the Q235 steel side. As shown in Figure 8a, the microstructure of the nugget in the REW joint consists entirely of martensite. However, due to differences in the original microstructure, the thickness range of lath martensite on the Q235 steel side is between 127 and 360 nm. In contrast, the lath martensite width on the DP780 steel side is noticeably smaller, ranging from 125 nm to 210 nm. The lath martensite structure contains numerous dislocations, contributing to its toughness and strength. The size of the martensitic laths is related to the original austenite grain size: the smaller the austenite grains, the finer the generated low-carbon martensite, resulting in better mechanical properties. The fine-grained heat-affected zone (FGHAZ) microstructure on the Q235 steel side, indicated by the orange region in Figure 7 and shown in Figure 8c, consists predominantly of fine martensite with numerous dislocations, which improves the mechanical properties of the joint.

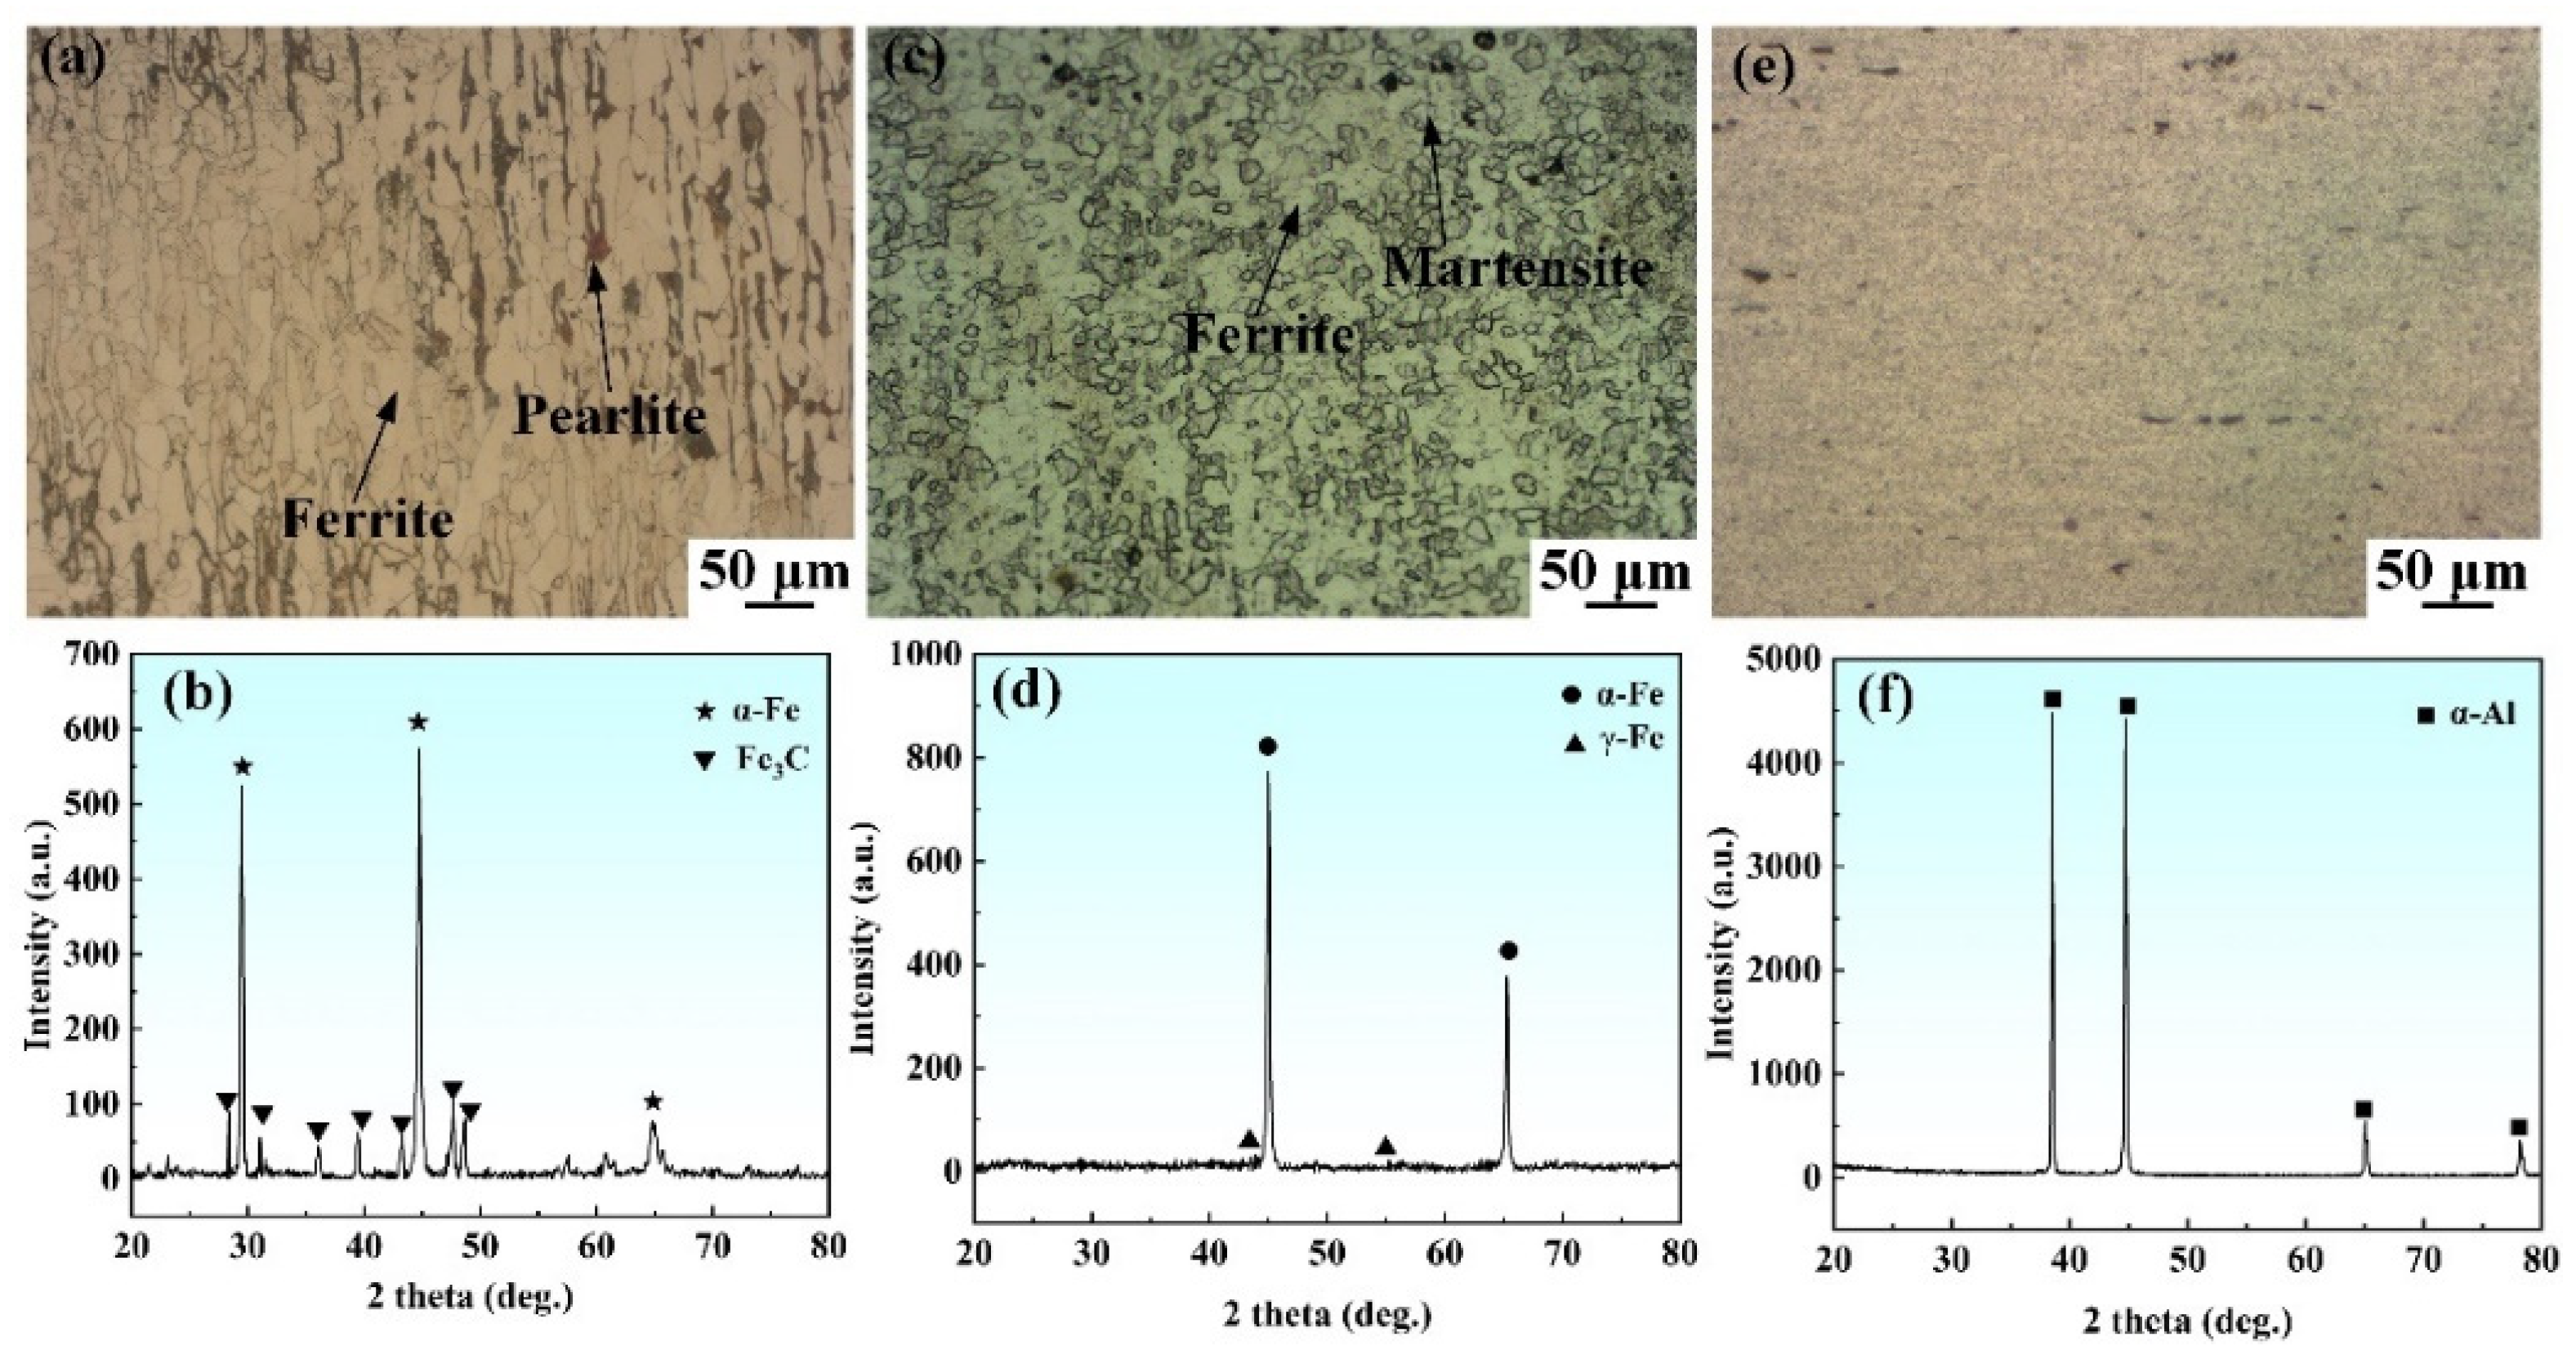
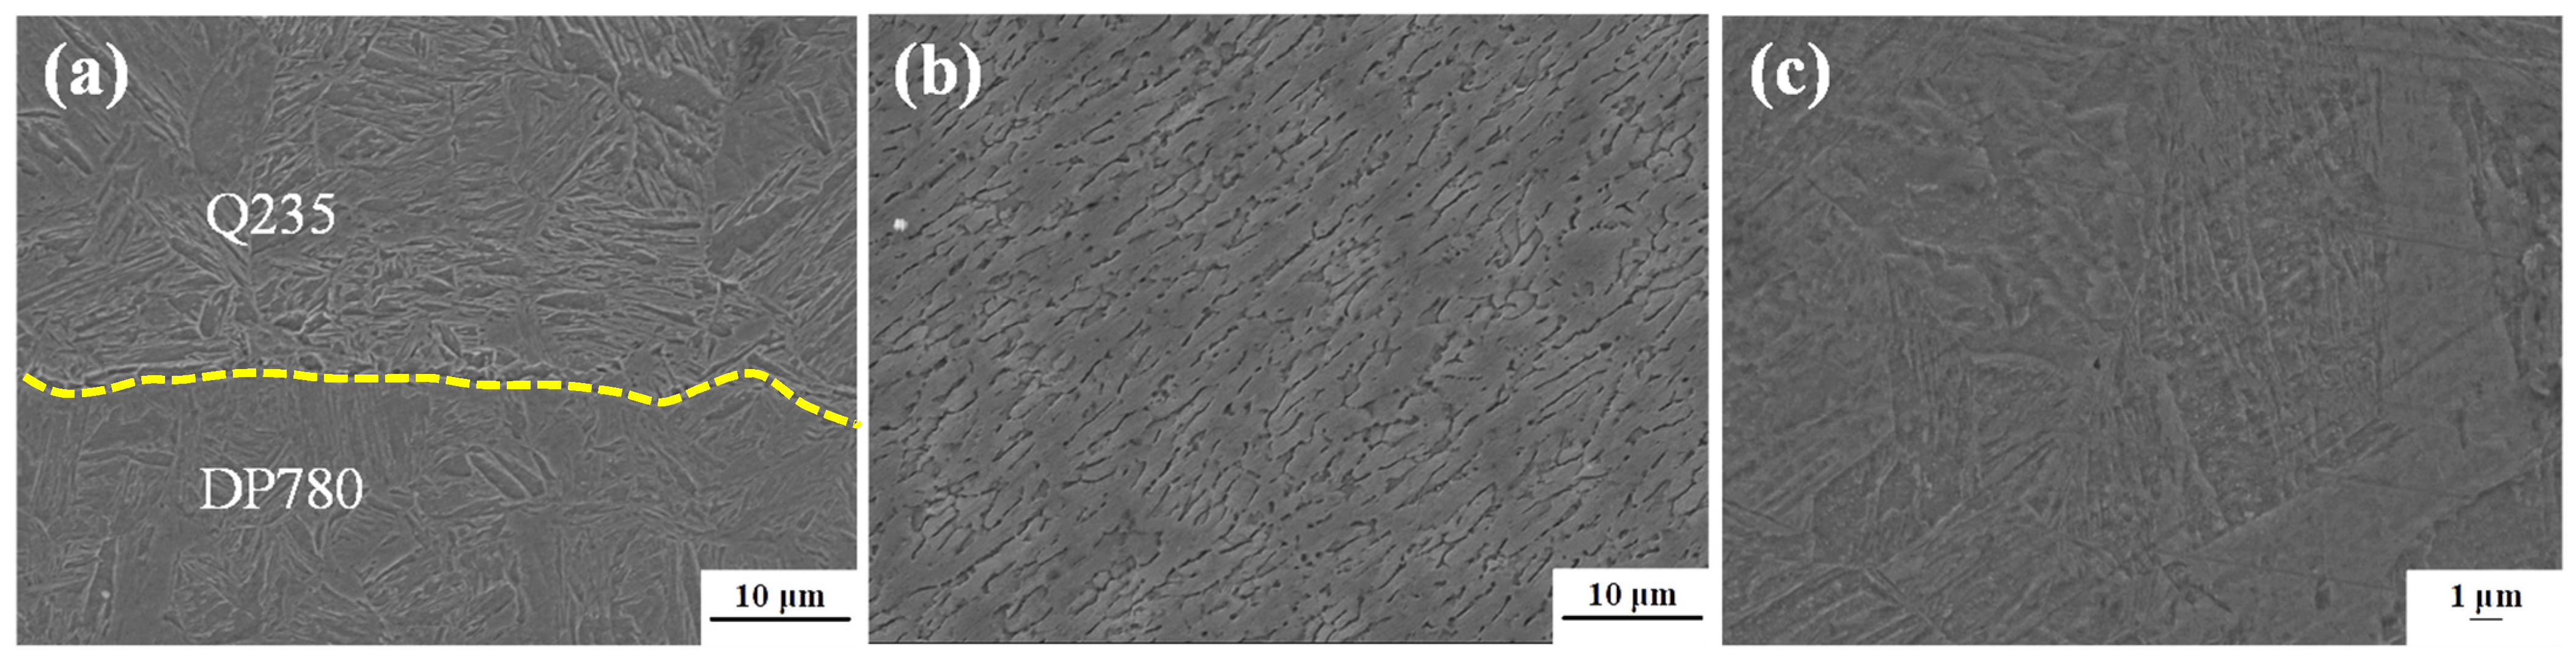
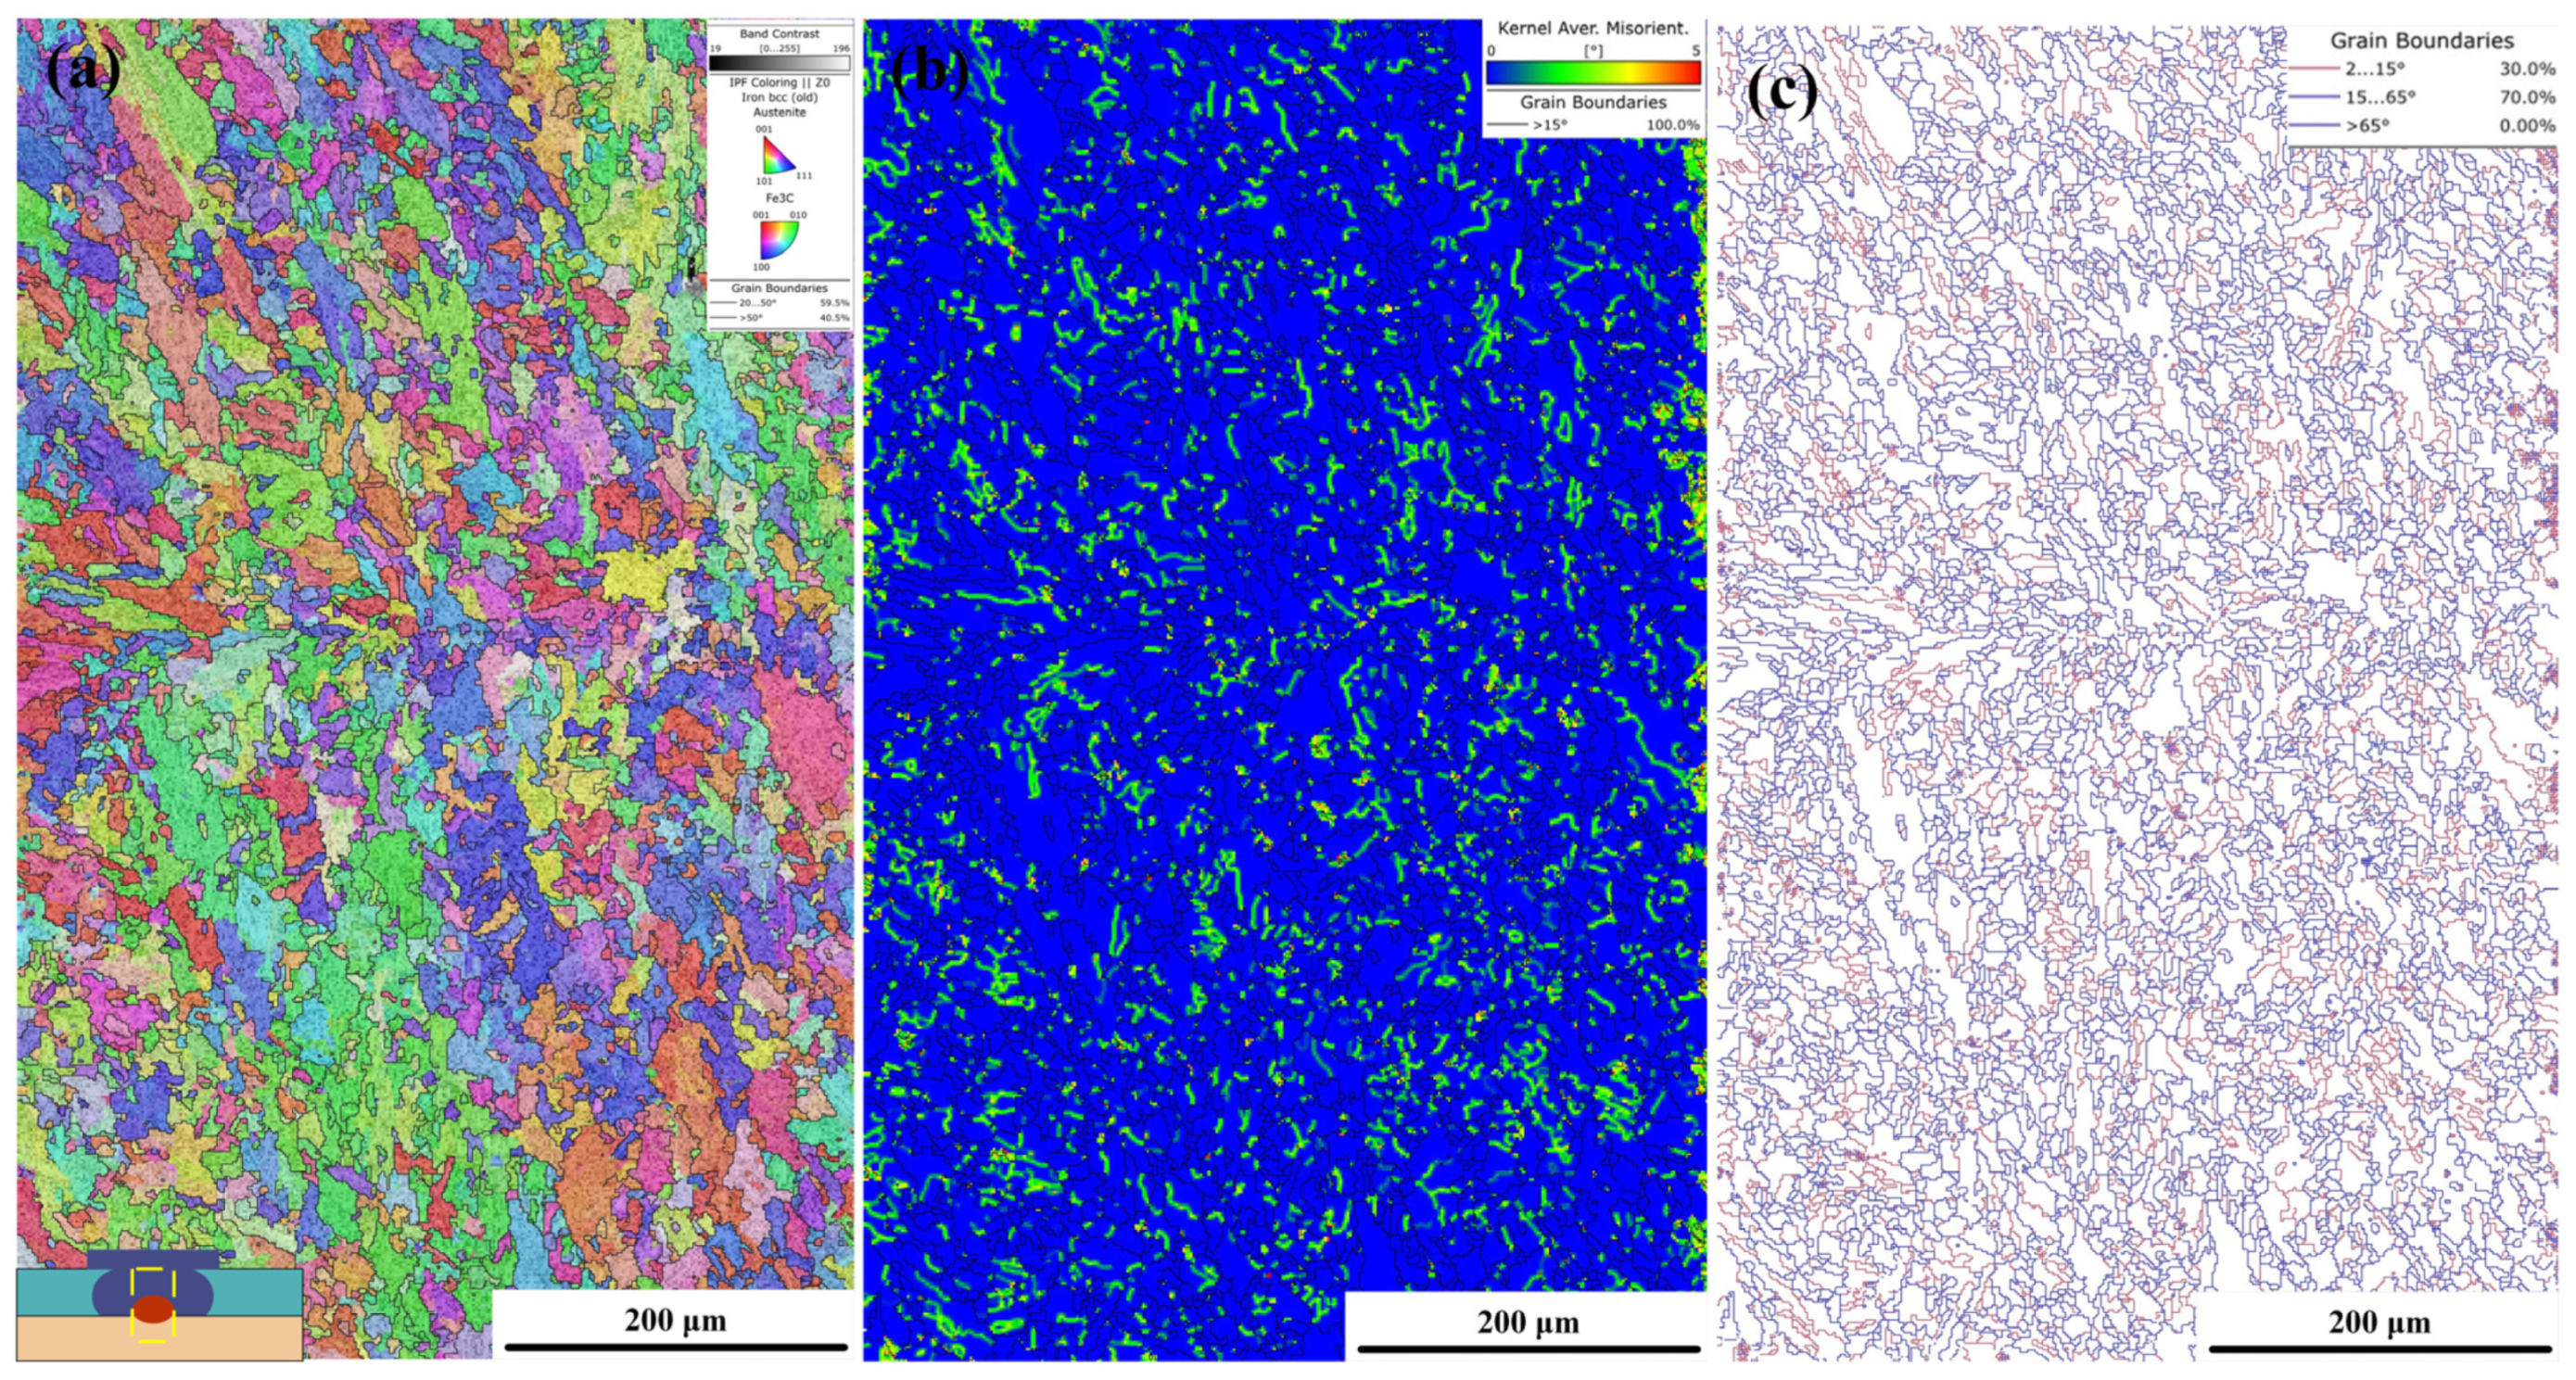
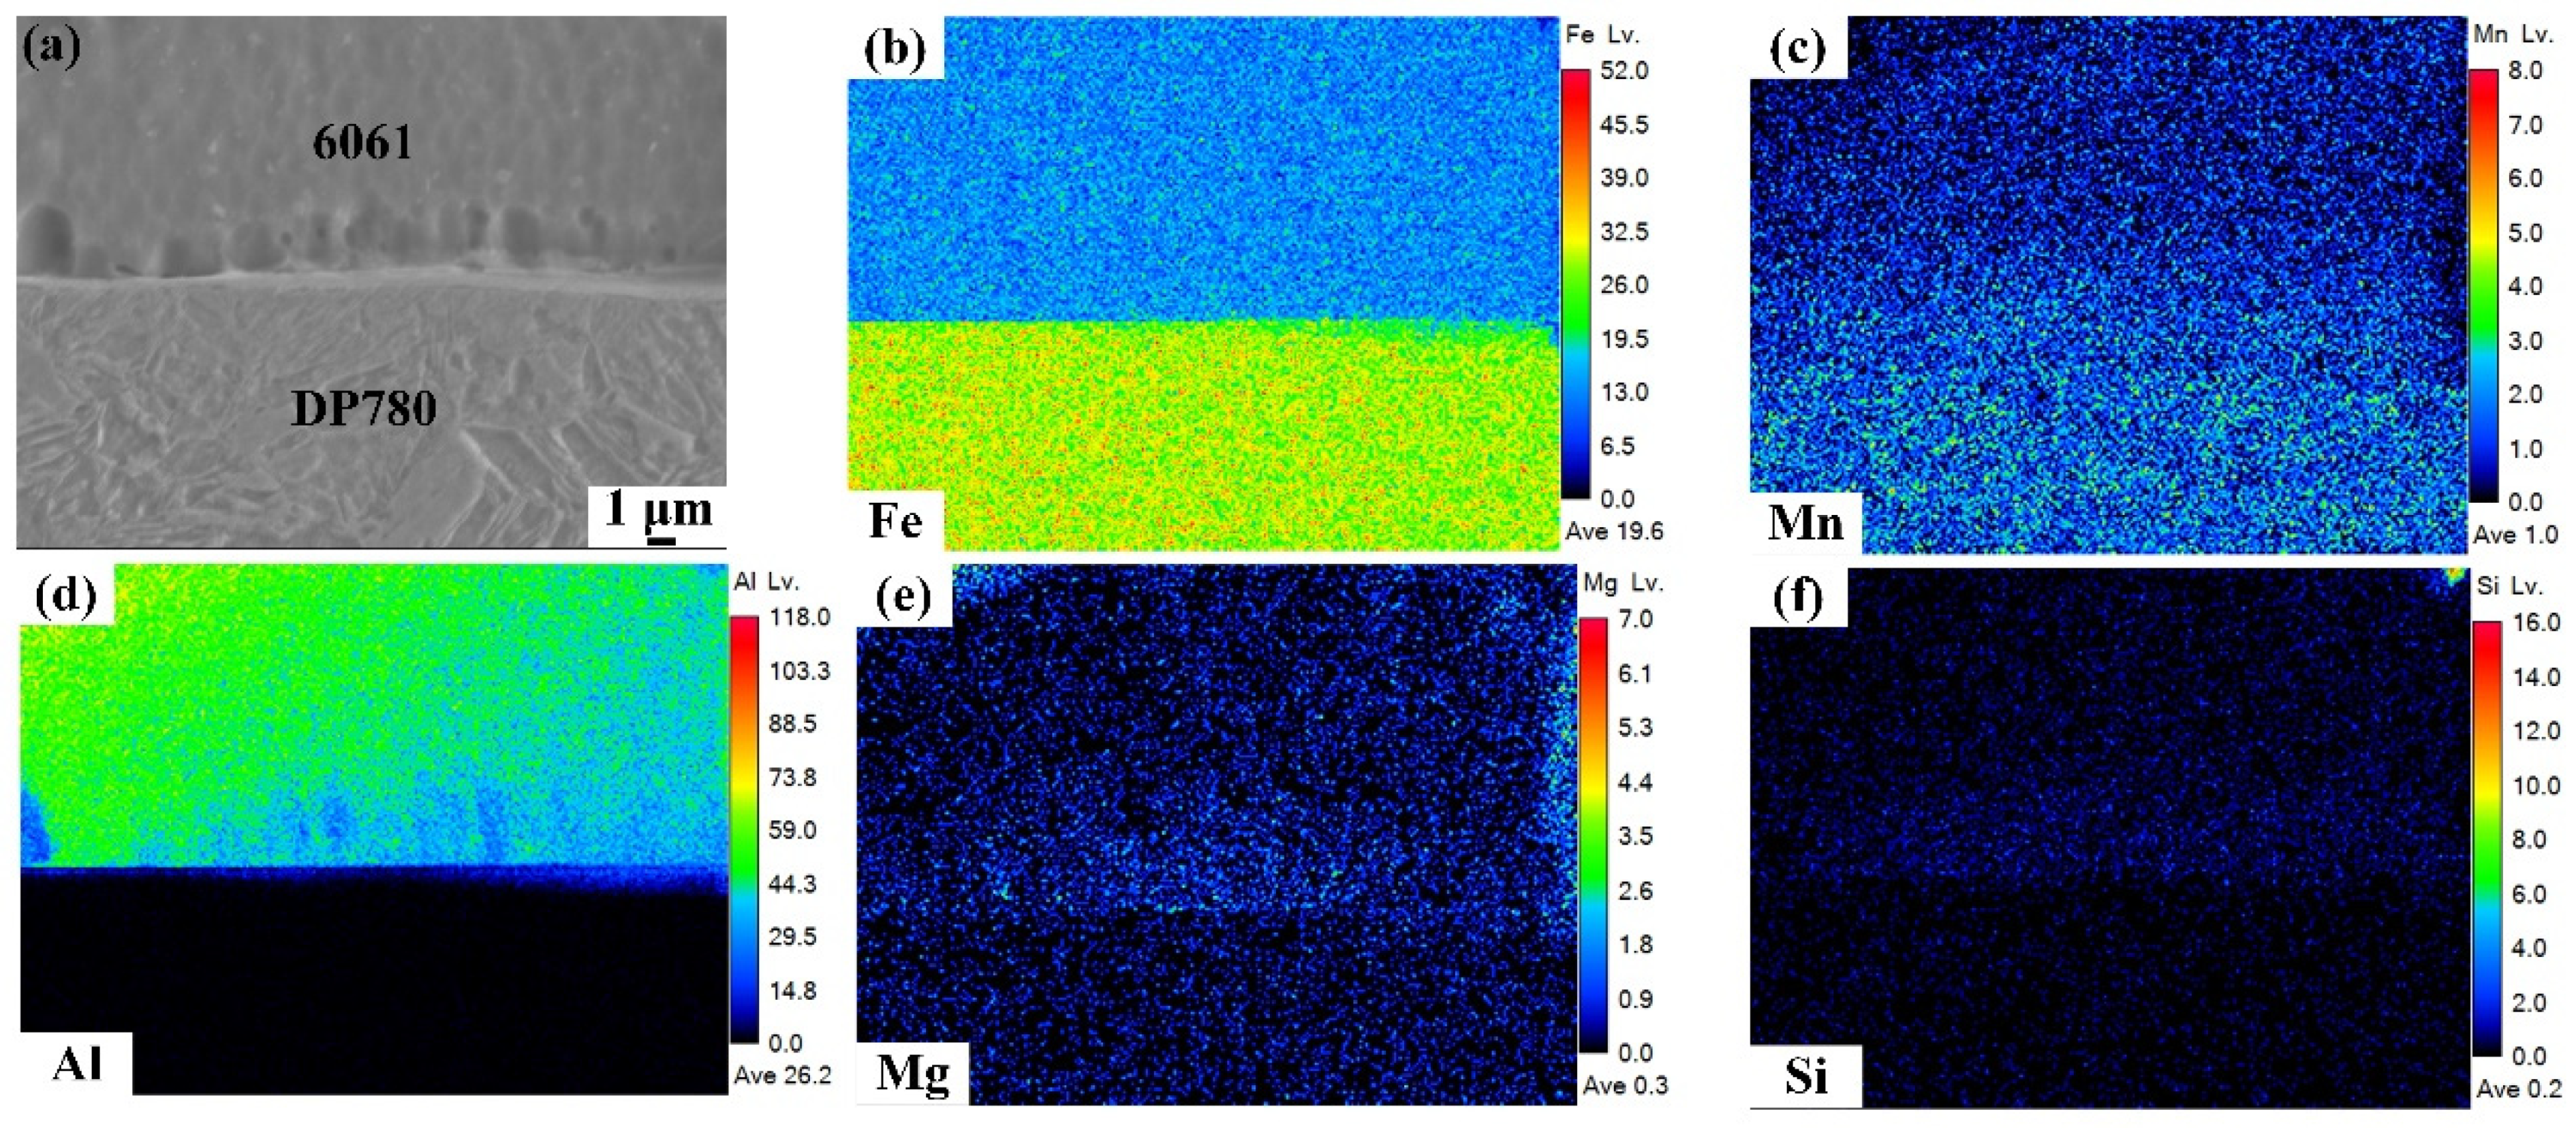
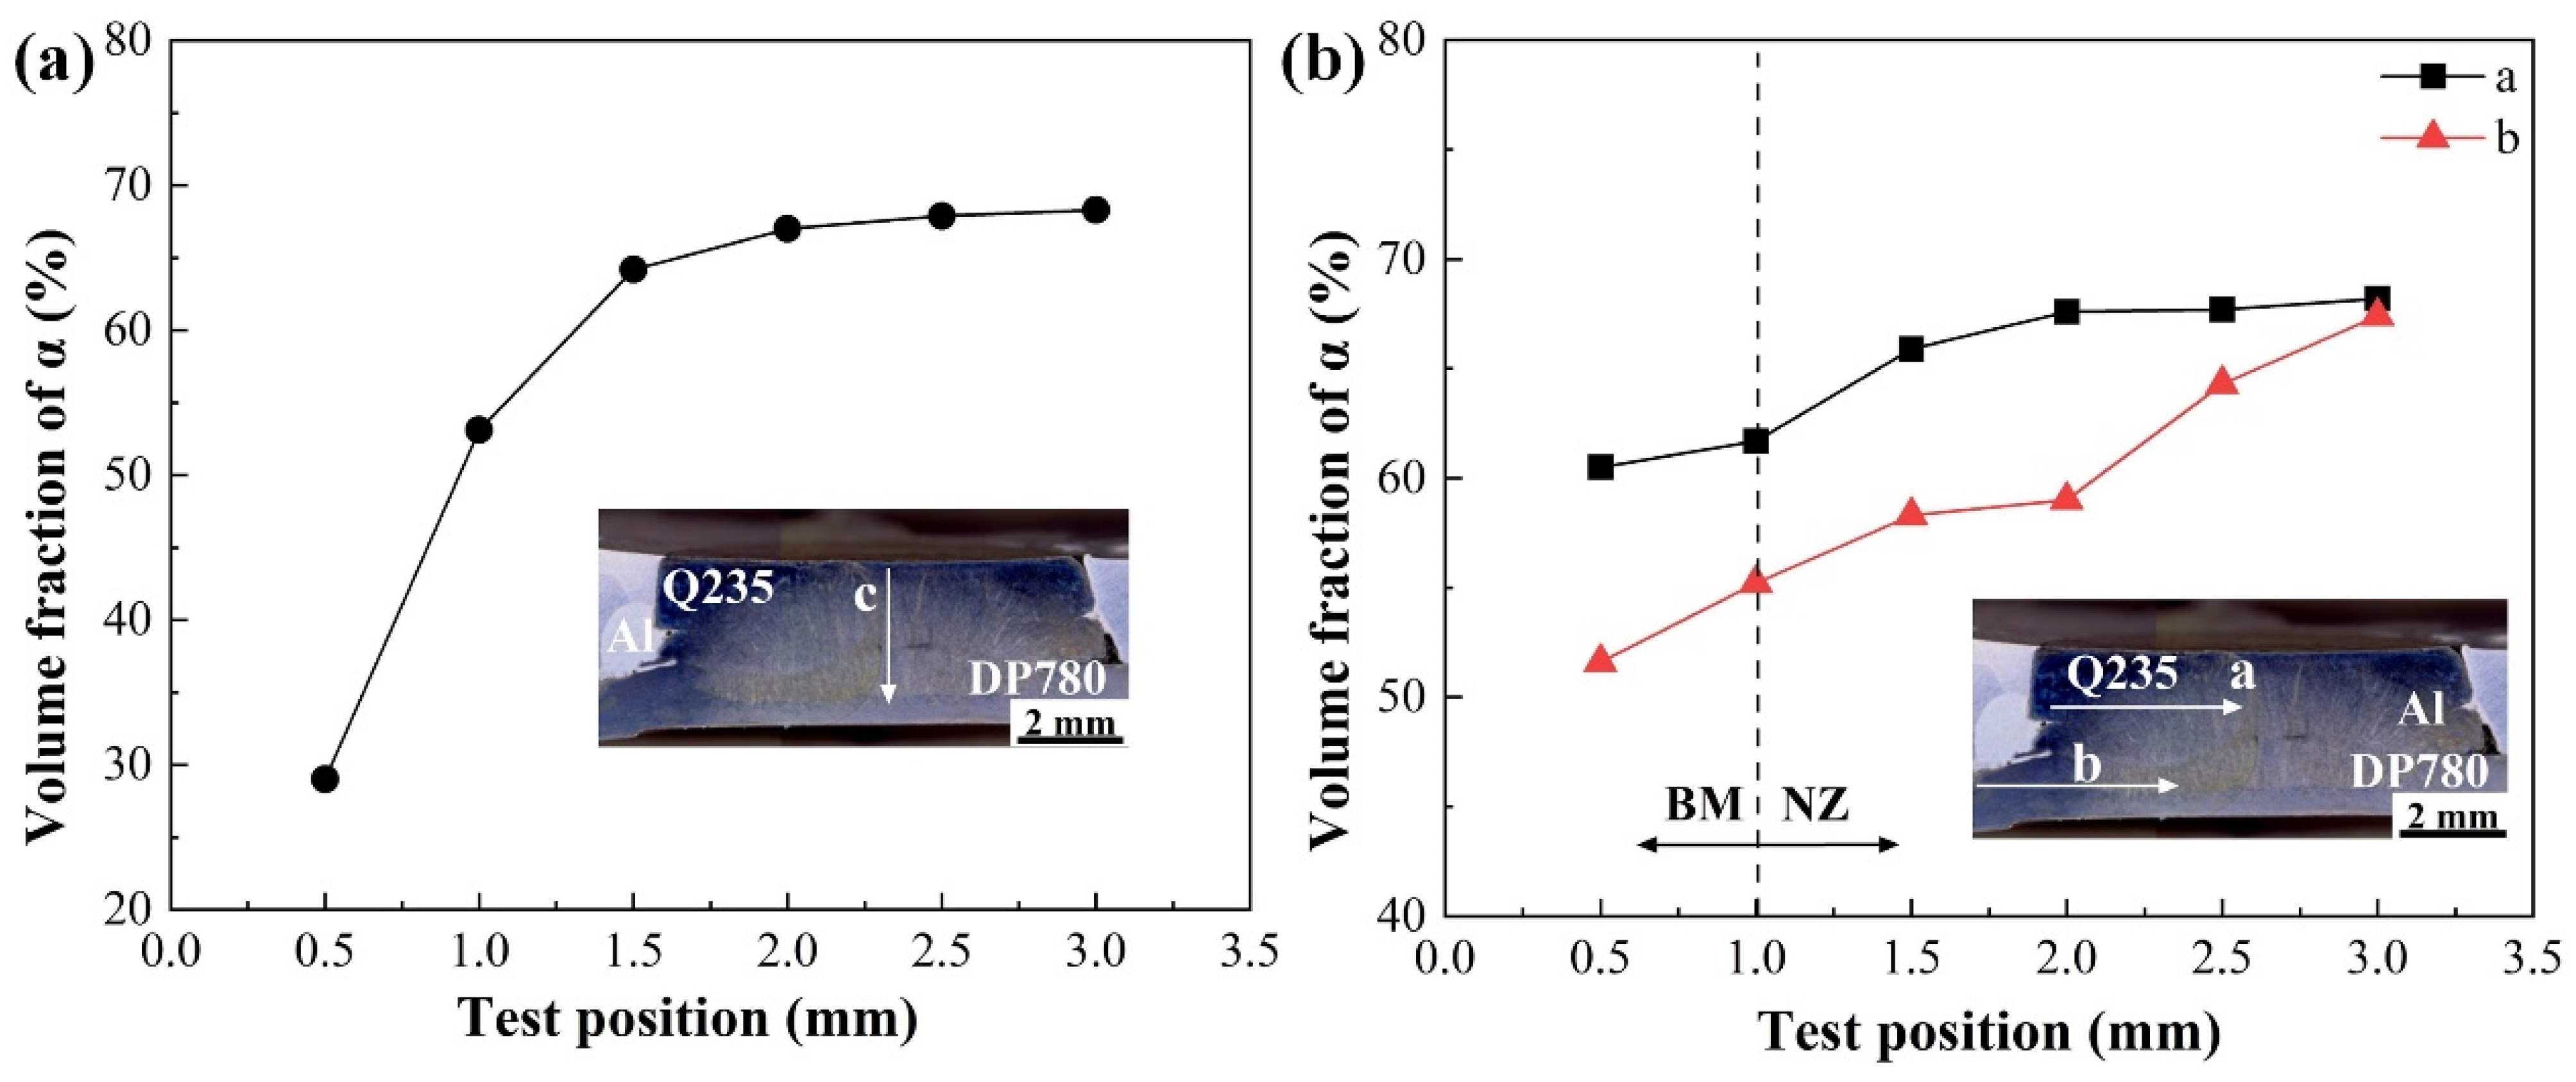
3.2. Grain Structure and Element Distribution in the Steel Fusion Zone

To study the crystallographic features of the fusion zone, the EBSD method was used to analyze the steel fusion zone. Figure 9 shows the EBSD analysis results of the cross-section of the fusion zone under a welding current of 9 kA. From the IPF map in Figure 9a, the grains in the fusion zone exhibit random orientation. Statistically, the average grain size in the steel fusion zone is 12.17 μm, while the average grain size in the aluminum fusion zone is 25.96 μm. Comparing the KAM maps of the base material (BM), heat-affected zone (HAZ), and fusion zone (FZ), it is observed that the KAM values of the BM and FZ are relatively low, while the KAM value in the HAZ lies between those of the FZ and BM. Regions near the FZ have experienced local peak temperatures and cooling rates similar to those in the fusion zone. Variations in temperature and cooling rate have resulted in a nonuniform microstructure in the heat-affected zone. In the HAZ, the fraction of low-angle grain boundaries (LAGBs) increases as one approaches the coarse-grained austenite zone (CGHAZ). A higher number of LAGBs leads to increased dislocation density and thermal stress, resulting in higher KAM values in the HAZ compared to other regions. The temperature in the FZ exceeds the liquidus line, and rapid cooling leads to the formation of elongated grains in the FZ where the KAM values are the lowest.
Figure 10 shows the energy dispersive spectroscopy (EDS) line scan results of the fusion zone in the flat-headed unit REW joint. The EDS results reveal the element distribution in the fusion zone. The contents of Mn, Si, and C remain at consistent levels, with no significant enrichment of any elements. This indicates that element diffusion in the fusion zone is effective and that the composition is nearly uniform.
Figure 11 shows the element distribution in the steel fusion zone of the flat-headed unit. From Figure 11, it can be observed that Q235 and DP780 steels mix uniformly in the fusion zone during the REW process, resulting in a moderate Fe content. In contrast, the contents of solid-solution strengthening elements such as C, Mn, and Si are lower in the fusion zone. The presence of these solid solution elements further supports the high hardness of the fusion zone in the REW joint.

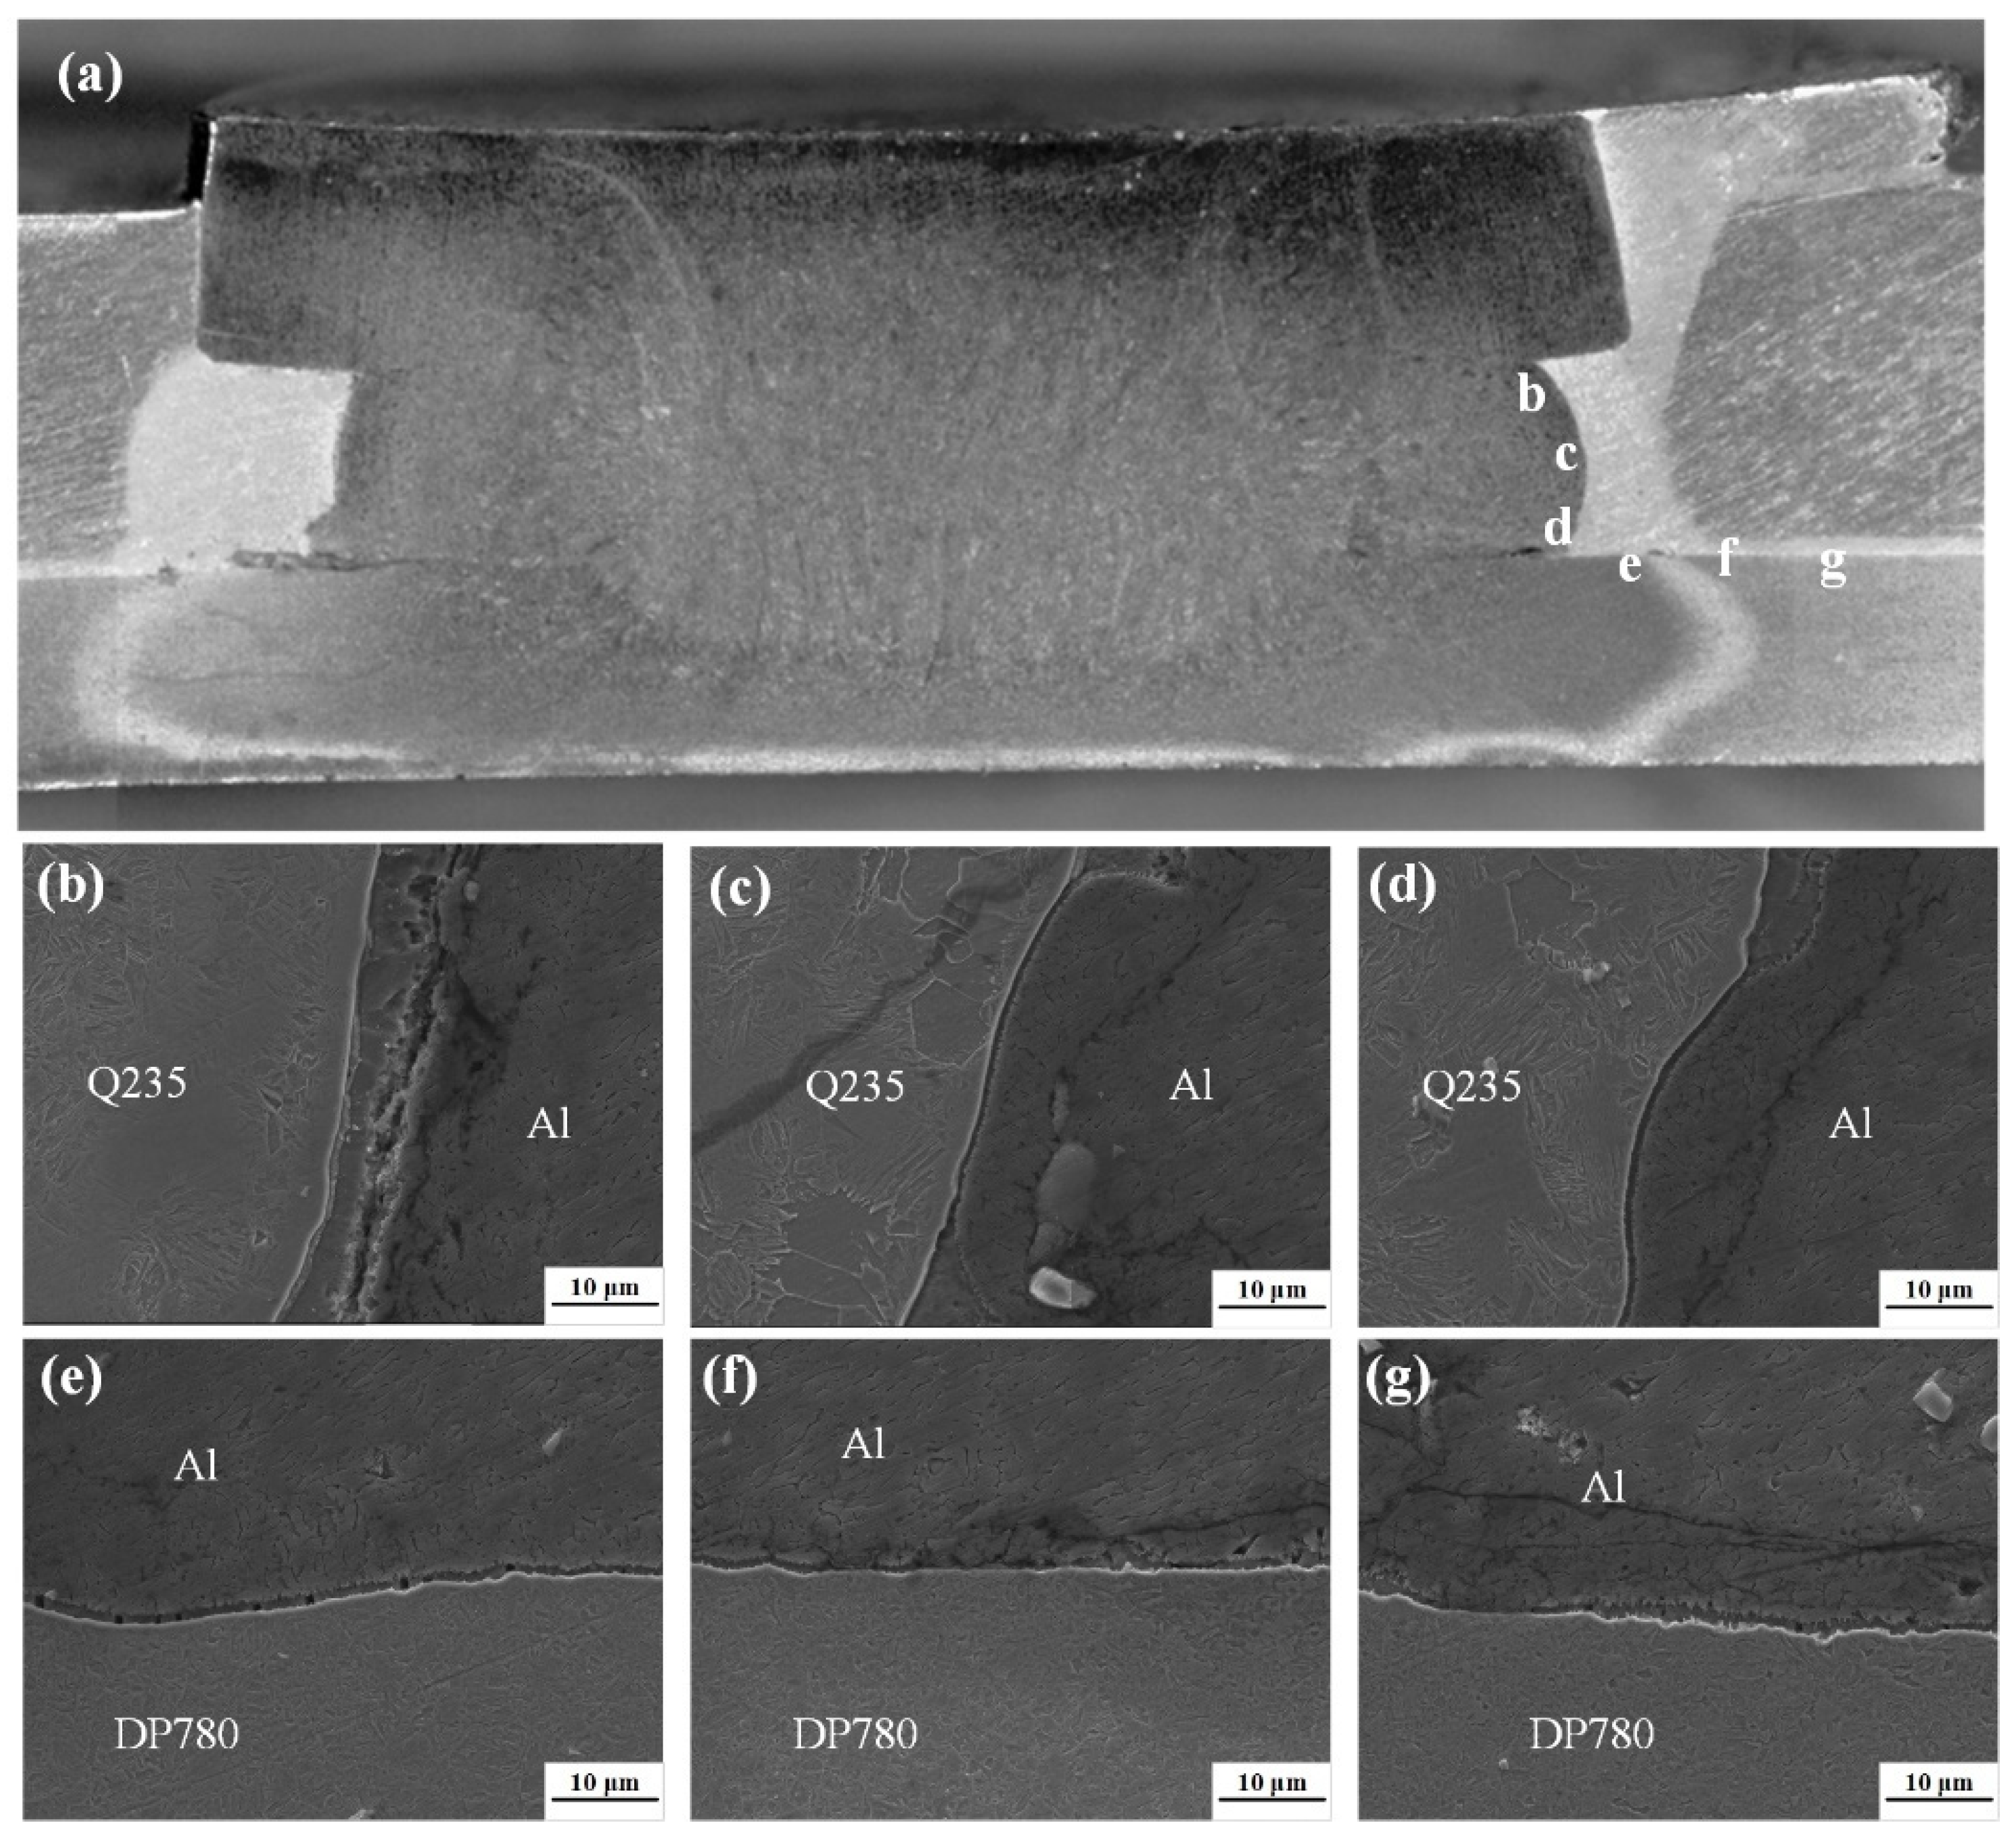
3.3. Intermetallic Compound Layer

Figure 12 shows the interface images of different regions of the joint, with Figure 12a–f displaying SEM images of various interfaces. As shown in Figure 12a, an uneven double-layer compound reaction layer forms at the aluminum alloy/unit interface. The morphology on the Q235 steel side exhibits a tongue-like structure, while the side near the aluminum alloy consists of relatively uneven needle-like structures. Similar results have been observed in various aluminum alloy/steel RSW joints, including 6022 aluminum alloy/340 steel [39], 6063-T6 aluminum alloy/16Mn steel [40], and 6061-T6 aluminum alloy/GA590 steel [41]. At the unit head, molten aluminum alloy splashing causes cracks at the interface between the unit head and 6061 aluminum alloy. Under pressure, the unit leg experiences bulging, which facilitates sufficient metallurgical reactions between the unit leg and 6061 aluminum alloy, as shown in Figure 12b,c. As seen in Figure 12d–f, as the distance from the fusion zone increases, a series of fine cracks gradually develop between DP780 steel and 6061 aluminum alloy, most notably in Figure 12f.
As evidenced by the interfacial characterization in Figure 13a, the weld joint exhibits heterogeneous dimensional distribution of intermetallic compounds (IMCs). The acicular FeAl3 phase displays multi-scale morphological features ranging from 38 nm to 3.49 μm. The lobular Fe2Al5 diffusion layer demonstrates an average thickness of 2.13 μm, with a distinctive graded structure at phase boundaries: the Q235 steel interface region measures 3.02 μm, exceeding the aluminum alloy side by nearly a half. The growth of the two IMC layers is controlled by the mutual diffusion of Fe and Al elements.
The contact pressure between the unit and the aluminum alloy is influenced by the contact area, leading to variations in the heat generation between them. As a result, the thickness of the steel/aluminum intermetallic compound (IMC) layer also varies, which, in turn, affects the secondary load-bearing performance of the joint. Therefore, the thickness of the steel/aluminum intermetallic compound layer in the flat-head unit joint must be considered. To further investigate the characteristics of the steel/aluminum intermetallic compound layer at the interface of the flat-head unit, EPMA surface scanning analysis was conducted. Figure 13 shows the SEM image and EPMA surface scanning results of the interface at the bottom of the flat-head unit’s aluminum alloy and steel. As shown in Figure 13, the interface compounds of Q235 steel/6061 aluminum alloy exhibit different morphological features on both sides. Notably, a steel/aluminum intermetallic compound layer is clearly visible at the Q235 steel/6061 aluminum alloy interface. The formation of the interfacial compounds is due to the mutual diffusion of molten aluminum and the steel matrix. On the 6061 aluminum alloy side, the presence of Fe indicates that the temperature at the interface is relatively high, allowing Fe to diffuse into the molten aluminum. On the Q235 steel side, no Al elements were detected, further suggesting that the diffusion rate of Fe in Al is higher than that of Al in Fe. The enrichment of Fe on the 6061 aluminum alloy side of the flat-head unit is greater than that of the truncated-cone unit. The thickness of the steel/aluminum IMC layer at the interface of the 6061 aluminum alloy/Q235 steel in the flat-head unit is approximately 2.36 μm. The higher the temperature at the interface, the faster the element diffusion, leading to a thicker intermetallic compound layer. Therefore, it can be concluded that the temperature at the bottom of the Q235 steel/6061 aluminum alloy interface in the flat-head unit joint decreases in the following order: flat-head unit. Figure 14 shows the SEM image and EPMA surface scanning results of the bottom interface between the 6061 aluminum alloy and DP780 steel in the flat-head unit. At the 6061 aluminum alloy/DP780 steel interface, the interface in the flat-head unit is relatively straight. The surface scanning results of Fe and Al elements reveal that the interfacial compound layer is thinner and discontinuous.

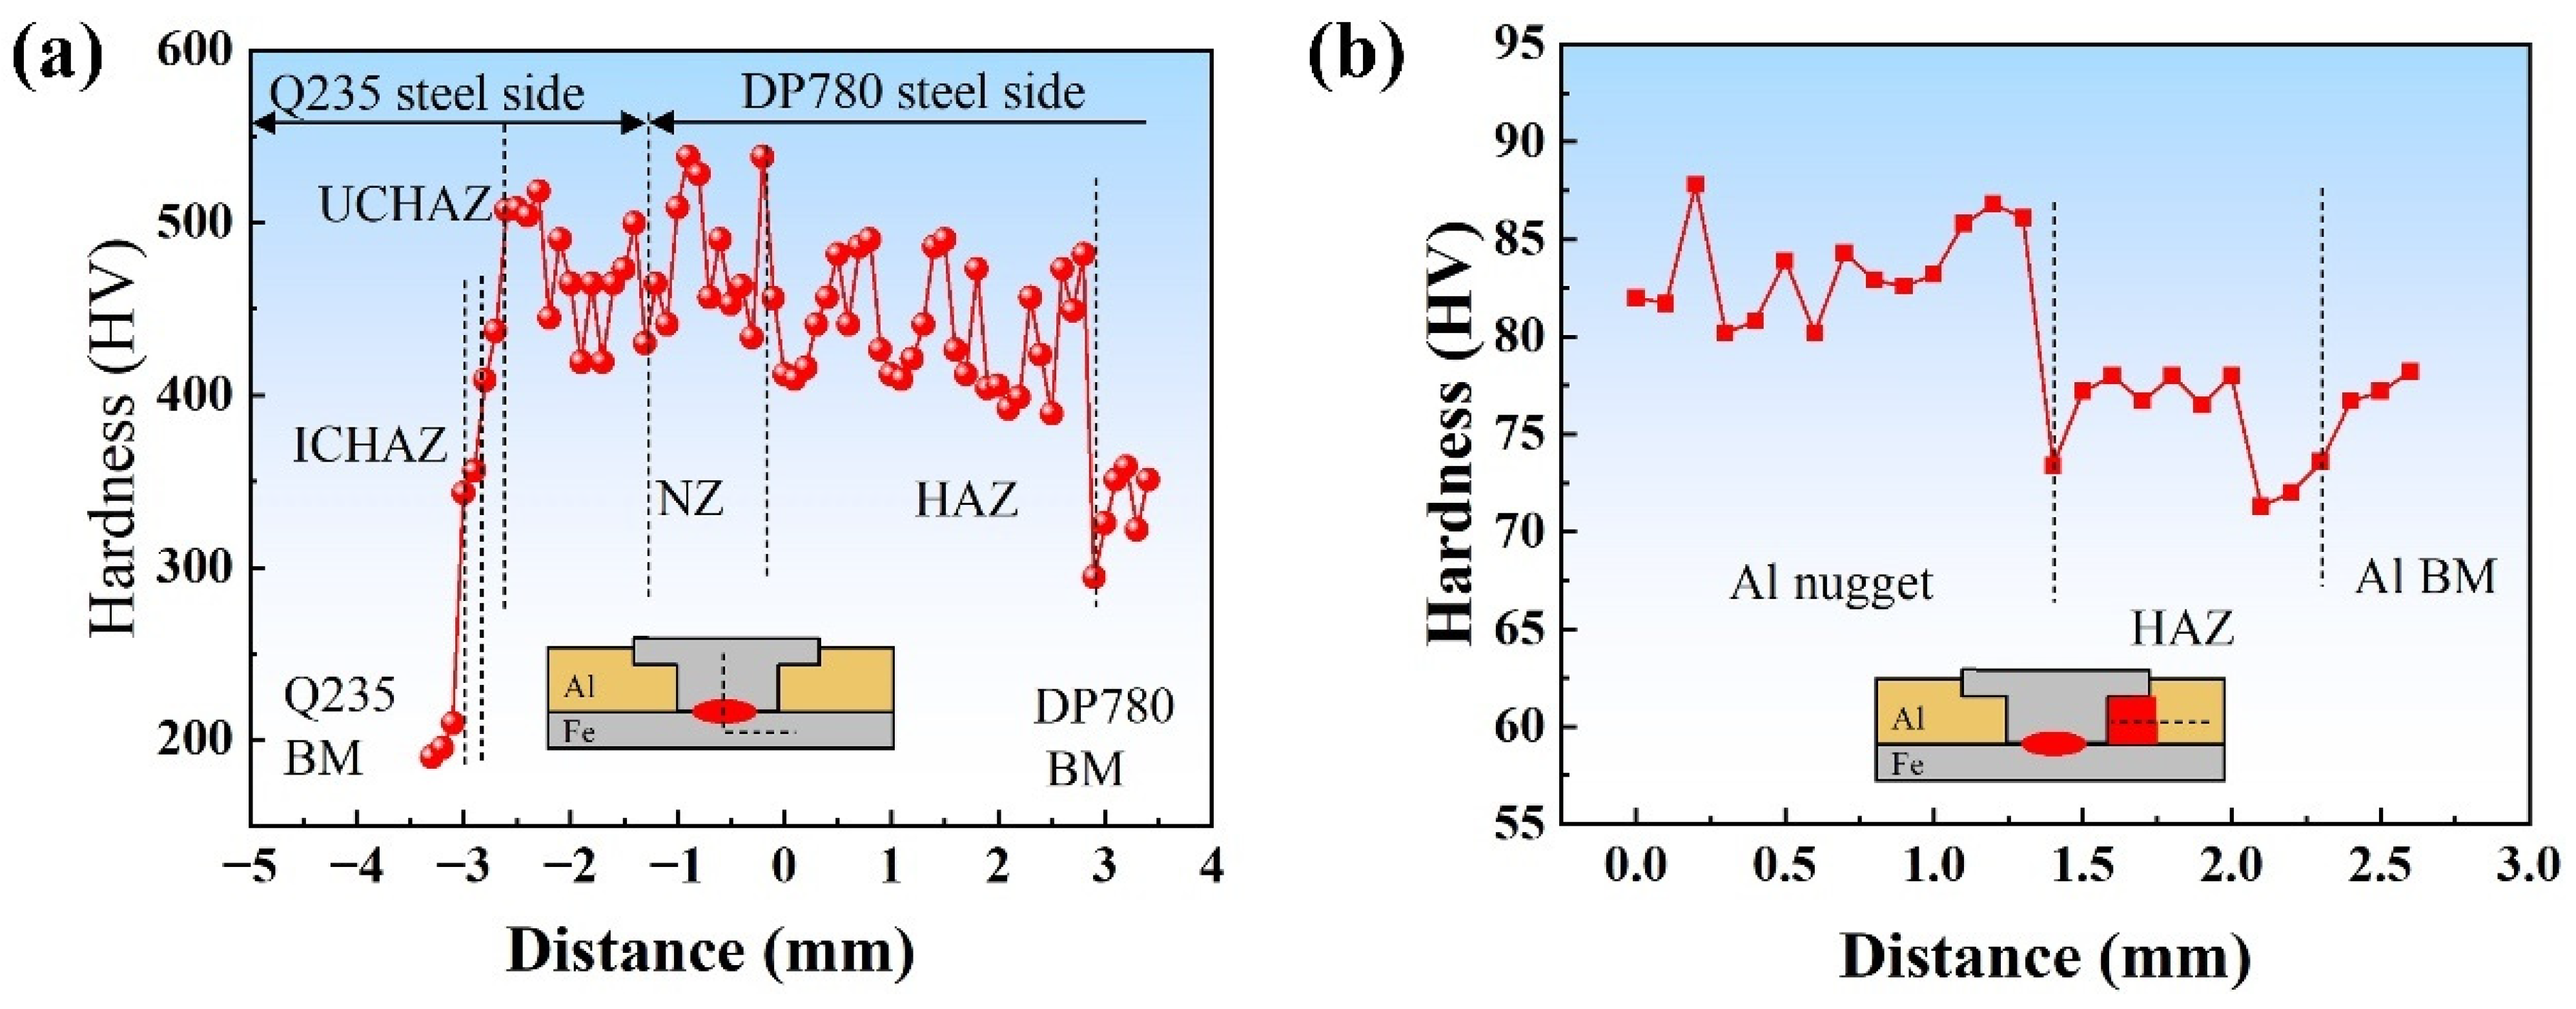
3.4. Microhardness of the Joint

The microhardness profile of the aluminum/steel REW joint (Figure 15) delineates five metallurgically distinct zones: the Q235 base material (198.2 HV); subdivided HAZ on the Q235 side, which comprises inter-critical HAZ with ferrite–martensite mixtures and upper-critical HAZ dominated by coarse martensite at 408.7–508.2 HV; the nugget zone (NZ); DP780-side HAZ; and DP780 base material. Thermal gradients during welding induce progressive phase transformations, with rapid austenite growth near the nugget forming coarse martensite upon cooling, resulting in hardness elevation in upper-critical HAZ compared to inter-critical regions. The nugget zone exhibits superior hardness (429.8–538.2 HV), exceeding adjacent HAZ values, with DP780-side NZ demonstrating marginally higher values than Q235-side due to enhanced martensite formation. Central nugget regions show greater hardness than peripheral zones, attributed to accelerated cooling rates promoting lath martensite development. Critical hardening mechanisms include grain refinement in inter-critical HAZ (ferrite grain size reduced to 8.5 µm versus 24.7 µm in base material) and martensite fraction disparities, collectively governing the microhardness evolution across the joint interface.
Figure 15b delineates the microhardness profile across the aluminum side of the welded joint, partitioned into three distinct regions: the aluminum nugget core, heat-affected zone (HAZ), and base material (BM). The nugget exhibits elevated hardness compared to the HAZ, a phenomenon attributed to the development of a columnar dendritic microstructure formed under rapid solidification conditions. This oriented grain structure, coupled with potential solute segregation during weld pool crystallization, establishes enhanced dislocation pinning effects within the nugget region. The hardness gradient transitions progressively from the refined microstructure of the nugget core to the thermally modified HAZ, ultimately converging toward the undeformed BM properties. The average hardness of the HAZ is slightly lower than that of the aluminum base material as the processing hardening effects and coarse grains in the original base material are eliminated. However, the locking force of the unit head on the HAZ provides secondary strengthening, thereby increasing its hardness.
As shown in Figure 6 and Figure 10, the contents of C, Mn, and Si in the REW nugget region are uniform. The Mn and Si contents help alleviate the decomposition of austenite through delayed eutectoid transformation, which, in turn, promotes the formation of martensite. However, due to the relatively low levels of Mn and Si, the solid solution strengthening effect is moderate. As a result, the hardness of the nugget region is similar to that of the heat-affected zone (HAZ) on the DP780 side.
Additionally, the hardness of the nugget region is influenced by the content of the α-phase. The ferrite/martensite content of the joint was measured using a ferrite tester, and the volume fraction of the α-phase varies along different paths, as shown in Figure 16. This magnetic α-phase is the combined presence of δ-ferrite and α’ martensite. The results indicate that, along the horizontal direction, the α-phase content gradually expands from the Q235 steel base material to the nugget region. Similarly, on the DP780 steel side, the α-phase content expands from the base material to the nugget region, with the highest rate of increase occurring at the nugget boundary. Along the vertical direction, the α-phase fraction on the Q235 steel side is lower than that on the DP780 steel side. It gradually expands from top to bottom and eventually stabilizes. In the vertical direction, the distribution of the α-phase is primarily governed by the solidification of the base metal after melting.

3.5. Mechanical Properties and Failure Modes

As demonstrated in Figure 17, the welding current exhibits a pronounced dual-phase influence on joint performance parameters between 6 and 15 kA. The peak load increases from 4.64 kN at 6 kA to a maximum 6.65 kN at 15 kA, while energy absorption capacity shows progressive amplification across this current range. This behavior is governed by thermal input-dependent nugget diameter evolution where current intensification elevates Joule heating, resulting in expansion of the molten zone. However, microstructural analysis reveals critical threshold effects: beyond 12 kA, aluminum matrix recrystallization is initiated, causing eventual strength decline at higher currents. The optimal 15 kA condition achieves concurrent maximization of mechanical integrity and energy dissipation through balanced thermomechanical coupling. As shown in Figure 17, when the current reaches 15 kA, the peak load of the joint is at approximately 6.65 kN and does not increase further. For energy absorption, the maximum value of approximately 8.47 J is achieved at 10 kA, after which energy absorption starts to decline. This decrease is attributed to spattering observed at higher welding currents, which reduces both the peak load and the joint’s load-bearing capacity. When the welding current is below 15 kA, the head of the element effectively exerts a locking function on the molten aluminum alloy, thereby reducing the spatter of the aluminum alloy. However, when the welding current surpasses 15 kA, the leg of the element undergoes upsetting as a consequence of the high heat input. This leads to a reduction in the bearing area between the steel plate and the element. Simultaneously, the locking capacity of the element head on the molten aluminum alloy declines sharply, giving rise to substantial sputtering. As a result, the mechanical properties of the joint are notably weakened. The optimal welding current is 15 kA, where the nugget diameter reaches 5.05 mm.
Three failure modes were observed in the tensile–shear test: interfacial fracture (IF) mode (Figure 18a), plug-out fracture (POF) mode (Figure 18b), and base material pull-out (BPF) mode (Figure 18c). At 6 kA, insufficient heat generation produces subcritical nugget diameters and weak interfacial bonding, resulting in premature interfacial fracture along the DP780 steel contact surface (Figure 18a). Increasing to 9 kA optimizes thermal input, achieving effective Q235 element–nugget adhesion. Excessive currents (11 kA) induce volumetric overheating, expanding nugget diameter to 7.2 mm yet provoking aluminum spattering and excessive element rotation, which compromises structural continuity. At 17 kA, some material in the DP780 steel transforms into base material pull-out (BPF) mode. The failure mode shifts from POF to BPF, as shown in Figure 18c. The study confirms a tight process window where controlled current parameters mitigate failure mode transitions from interfacial fracture to thermal degradation-induced spattering. Furthermore, under the influence of electrode force and thermal effects, the bearing area of the steel plate decreases.

3.6. Fracture Morphology of the Joint

Figure 19, Figure 20 and Figure 21 show the fracture morphology of the REW joint under three failure modes. As seen in Figure 19b,c, in the interfacial fracture (IF) mode, the nugget is too small to withstand the tensile–shear force. Both the bottom of the unit and the DP780 steel side exhibit deformation, caused by the inability of the metallurgical bond between the aluminum alloy and the unit to resist the shear force. In the plug-out fracture (POF) mode, during the tensile process, once the nugget diameter reaches a certain size, it deforms in a direction deviating from the tensile direction while resisting the tensile–shear force. Simultaneously, the metallurgical bond strength between the aluminum alloy and the unit is comparable to that of the nugget. When the nugget fractures, the bond between the aluminum alloy and the unit also fractures. In the base material pull-out (BPF) mode, as shown in Figure 21a, a significant amount of aluminum alloy remains at the head of the unit. This is because, at this stage, the nugget strength is much higher than the bond strength between the aluminum alloy and the unit. When the unit and aluminum alloy fracture, the unit retains the integrity of the nugget, while some aluminum alloy tears and remains near the unit.

4. Discussion

Figure 22 shows the cross-sectional morphology of the flat-headed unit REW joint under the conditions of 7 kA/300 ms/3.6 kN. Under the 7 kA welding current, due to insufficient heat generation at the interface, a small nugget formation was observed at the interface between the unit bottom and the lower plate (Figure 22a). As shown in Figure 22b,e, there is a large unconnected area at the edge of the unit bottom, which may directly affect the mechanical properties of the joint. Unlike the frustum-shaped unit, flat-step unit, and slanted-step unit, the flat-headed unit exhibits thermal cracks at the corner between the head and legs due to stress concentration under thermal effects (Figure 22c,f). At low welding currents, some areas of the flat-headed unit head are pressed into the aluminum alloy, and no significant gaps are observed in this region (Figure 22d,g).
When the welding current increases to 9 kA, with the increase in welding heat input, the depth of the unit head pressing into the aluminum alloy and the diameter of the joint nugget further increase, resulting in a larger heat generation area. The connection between the 6061 aluminum alloy/unit and 6061 aluminum alloy/DP780 is relatively tight. Comparing with Figure 23, at a welding current of 9 kA, the unconnected area at the bottom of the unit and the lower plate are reduced (Figure 23c,f), but there is still an uncontacted area at the bottom of the unit. The increased welding heat input leads to further propagation of cracks in the corner area of the unit head, and the crack propagation may cause failure at the junction of the unit head and leg.
The increase in welding heat input leads to a higher degree of plastic deformation in the unit. As observed in Figure 24c,e, when the welding current is 16 kA, the crack propagation increases, with the crack extending laterally along the transition corner of the unit shoulder, which may easily lead to unit failure. When the welding current increases from 9 kA to 16 kA, there are no unconnected areas at the interface between the unit leg and the lower plate, and with the increase in current, the heat generation at the interface increases, the molten metal area expands, and the joint’s load-bearing capacity is greatly enhanced. Furthermore, under high welding current conditions, due to the compressive force acting on the unit, protruding deformation forms at the edge of the unit leg, and a hook-shaped structure appears on the aluminum alloy side (Figure 24b).
Figure 25 shows the evolution of the aluminum/steel REW joint with the flat-head unit as the welding current changes. When welding aluminum alloy and steel with the flat-head unit, at low heat input (7 kA), the leg of the unit with a cap has a low degree of softening, and under pressure, the unit leg starts bulging. According to Joule’s law, the welding current is related to the heat generation in the welding area. When the welding current is too low, there is little molten metal, a small nugget diameter, and a small contact area between the unit bottom and the lower plate. Due to insufficient heat away from the nugget center, no effective metallurgical reaction occurs at the edge of the unit leg. When the welding current increases to 12 kA, with the increased heat input, the leg of the unit undergoes further bulging, and protruding deformation occurs at the edge of the unit leg due to the applied force. The radius of the unit leg increases further, the welding contact area with the lower plate expands, and sufficient metallurgical reactions occur, enhancing the joint’s mechanical performance. As the welding current continues to increase, the unit leg expands outward from the bulging shape, and the bulging becomes more pronounced. The unit bottom area further increases, which helps expand the welding area. Under the action of compressive force and reaction force, the unit leg also forms a hook-shaped structure, creating a mechanical interlocking effect with the aluminum alloy.

5. Conclusions

This study systematically investigated the metallurgical and mechanical characteristics of 2.0 mm-thick 6061-T6 aluminum alloy and 1.2 mm DP780 steel joints fabricated via through-hole resistance element welding. Experimental analyses focused on interfacial intermetallic compounds (IMC layer thickness: 4.6–8.3 μm), mechanical performance metrics (shear strength: up to 18.7 kN; failure modes spanning interfacial fracture to aluminum sputtering), and process optimization revealing an ideal current range (9–10 kA) for balancing IMC control with structural integrity.
(1)
The REW joint between 6061 aluminum and DP780 steel can be divided into NZ, HAZ, and BM. The NZ structure is entirely martensite. The CGHAZ on both sides of Q235 steel and DP780 steel is mainly composed of lath martensite and coarse bainite, and the FGHAZ is mainly composed of fine martensite and contains some fine ferrite inclusion.
(2)
The IMC layer is composed of tongue Fe2Al5 adjacent to the steel side and needle Fe4Al13 adjacent to the aluminum alloy side. Fe2Al5 layer thickens toward the base of the rivet. The layers of the two interfacial compounds are thin and discontinuous.
(3)
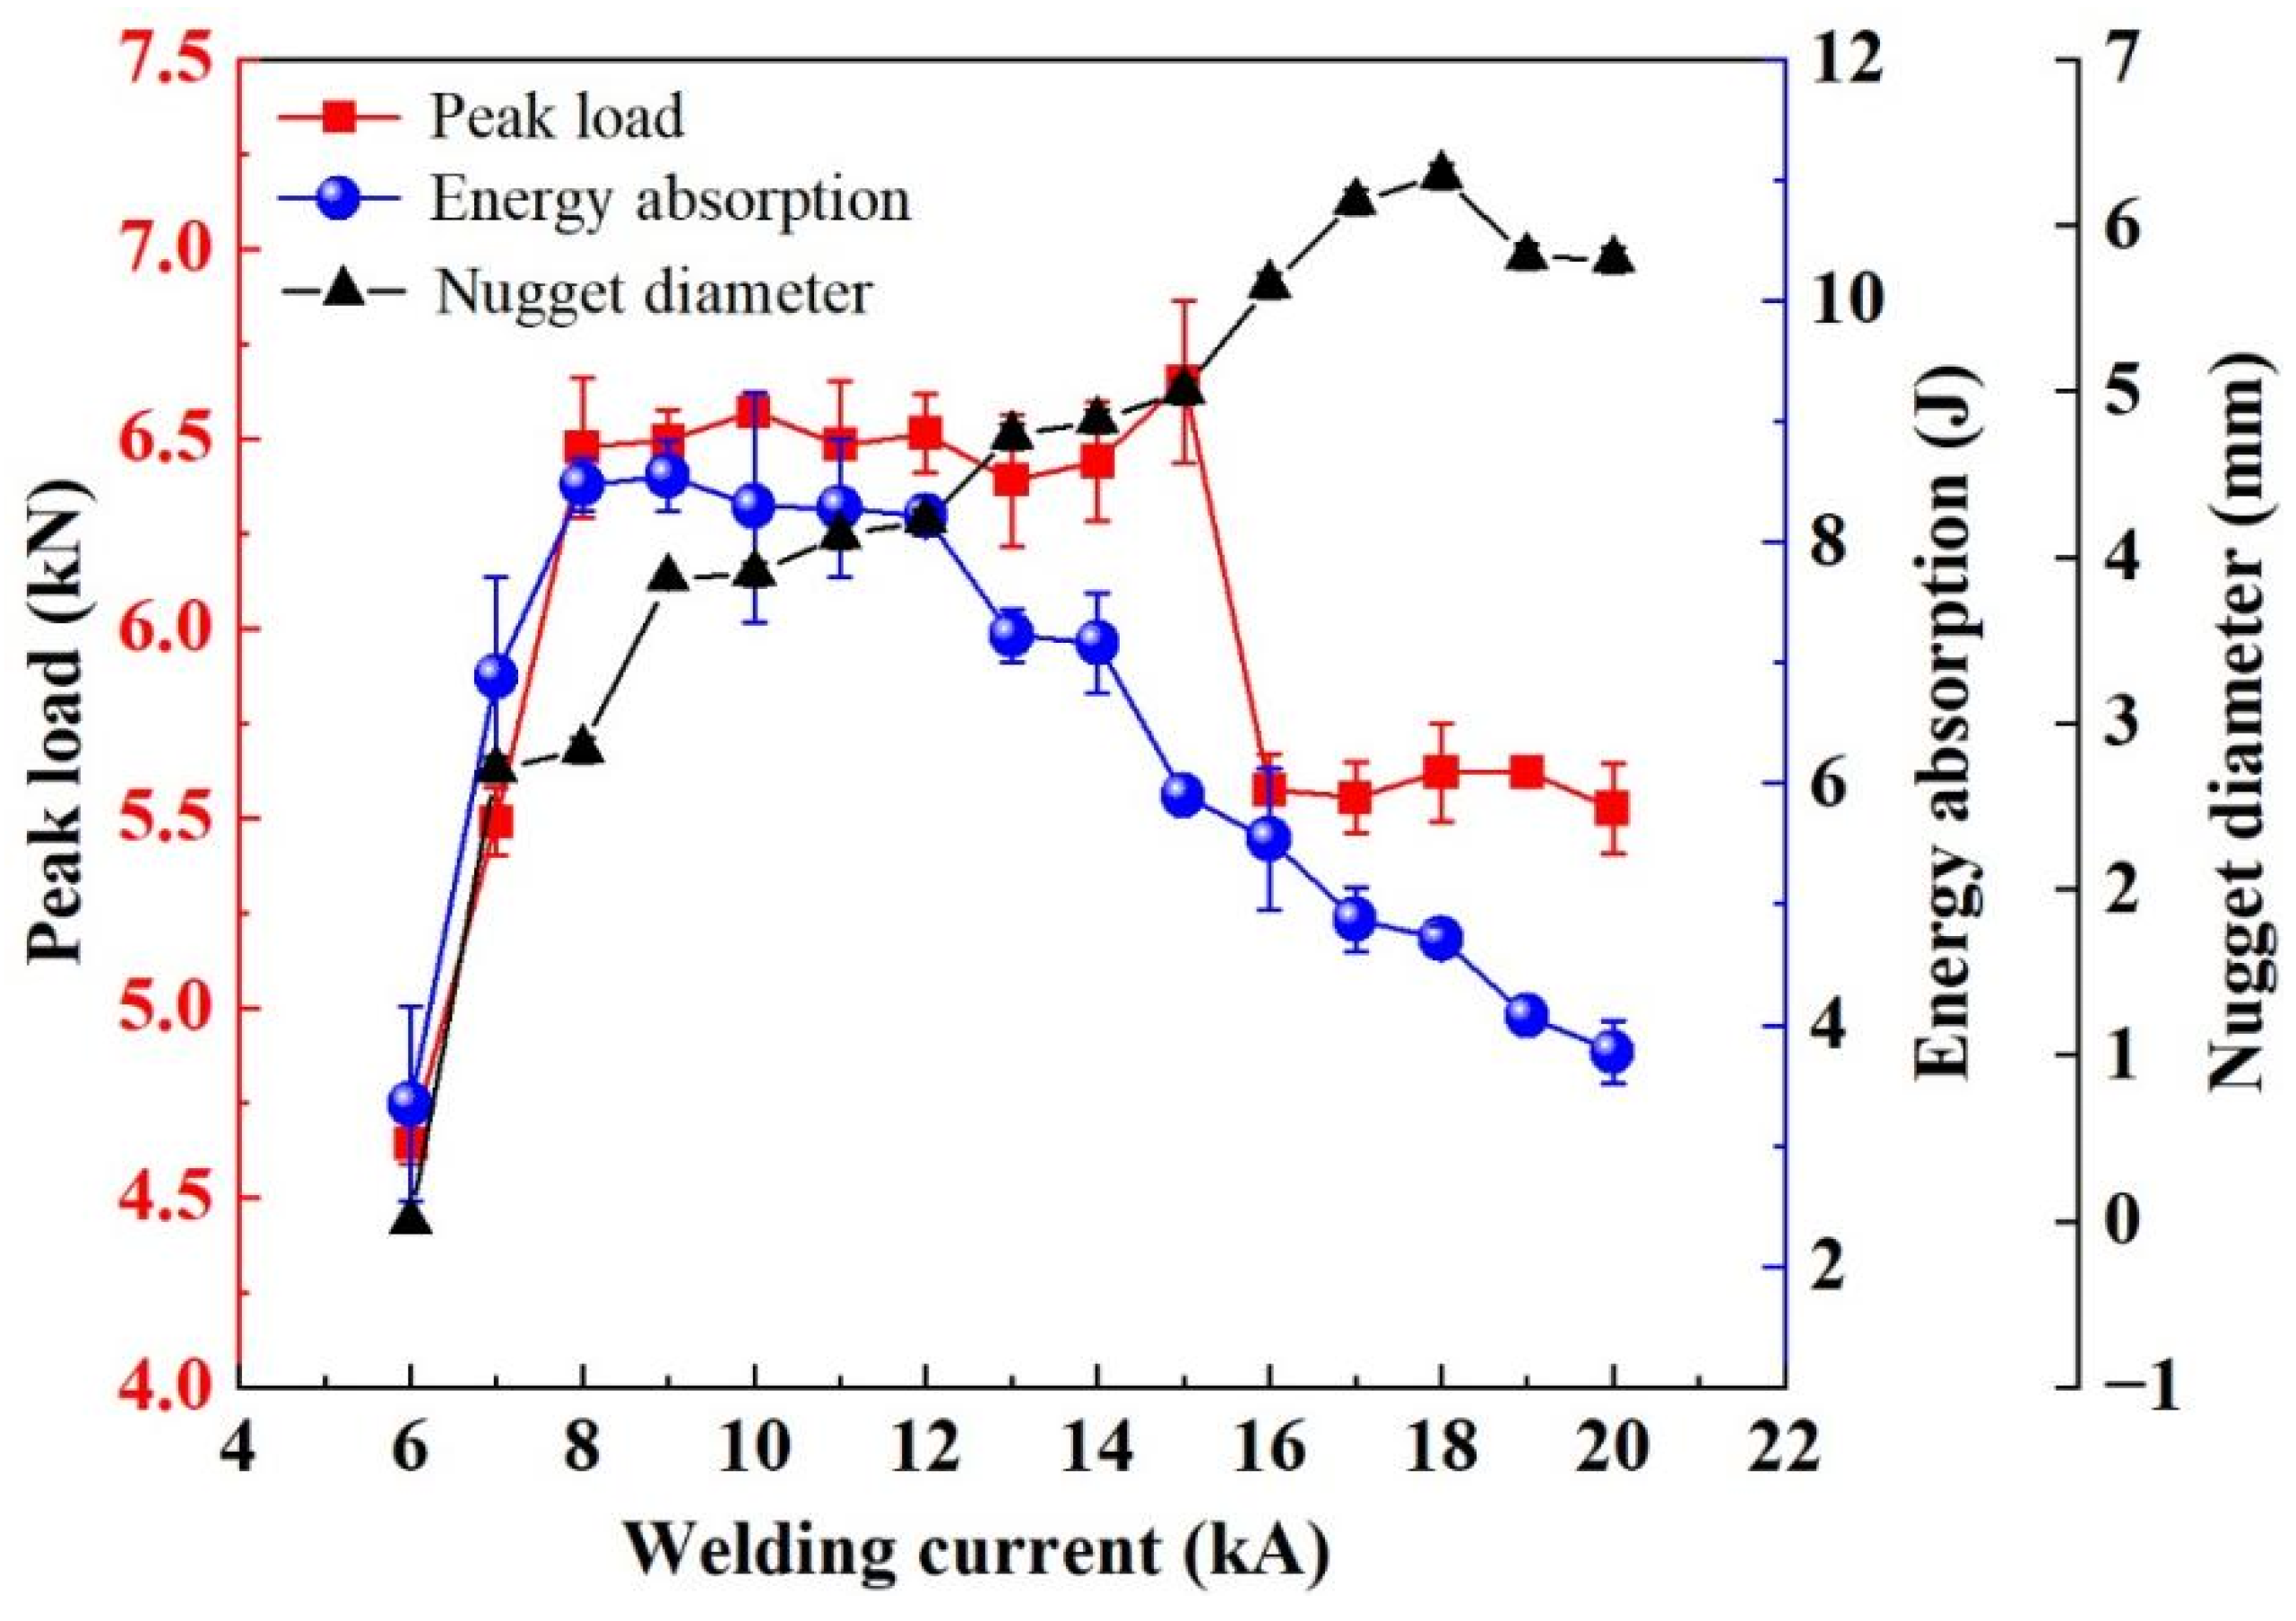
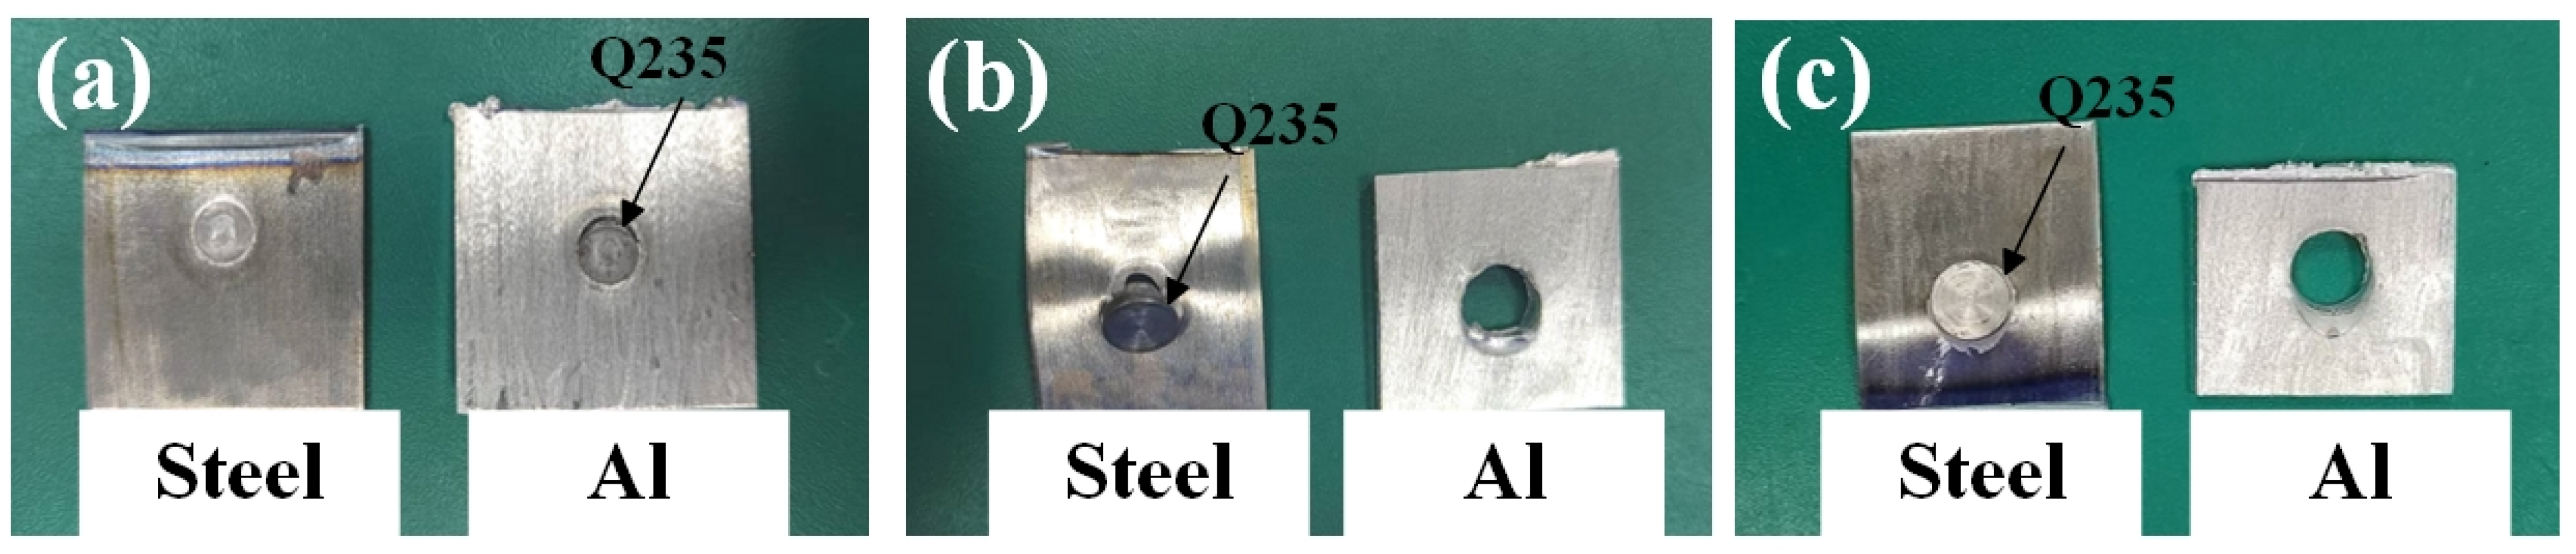
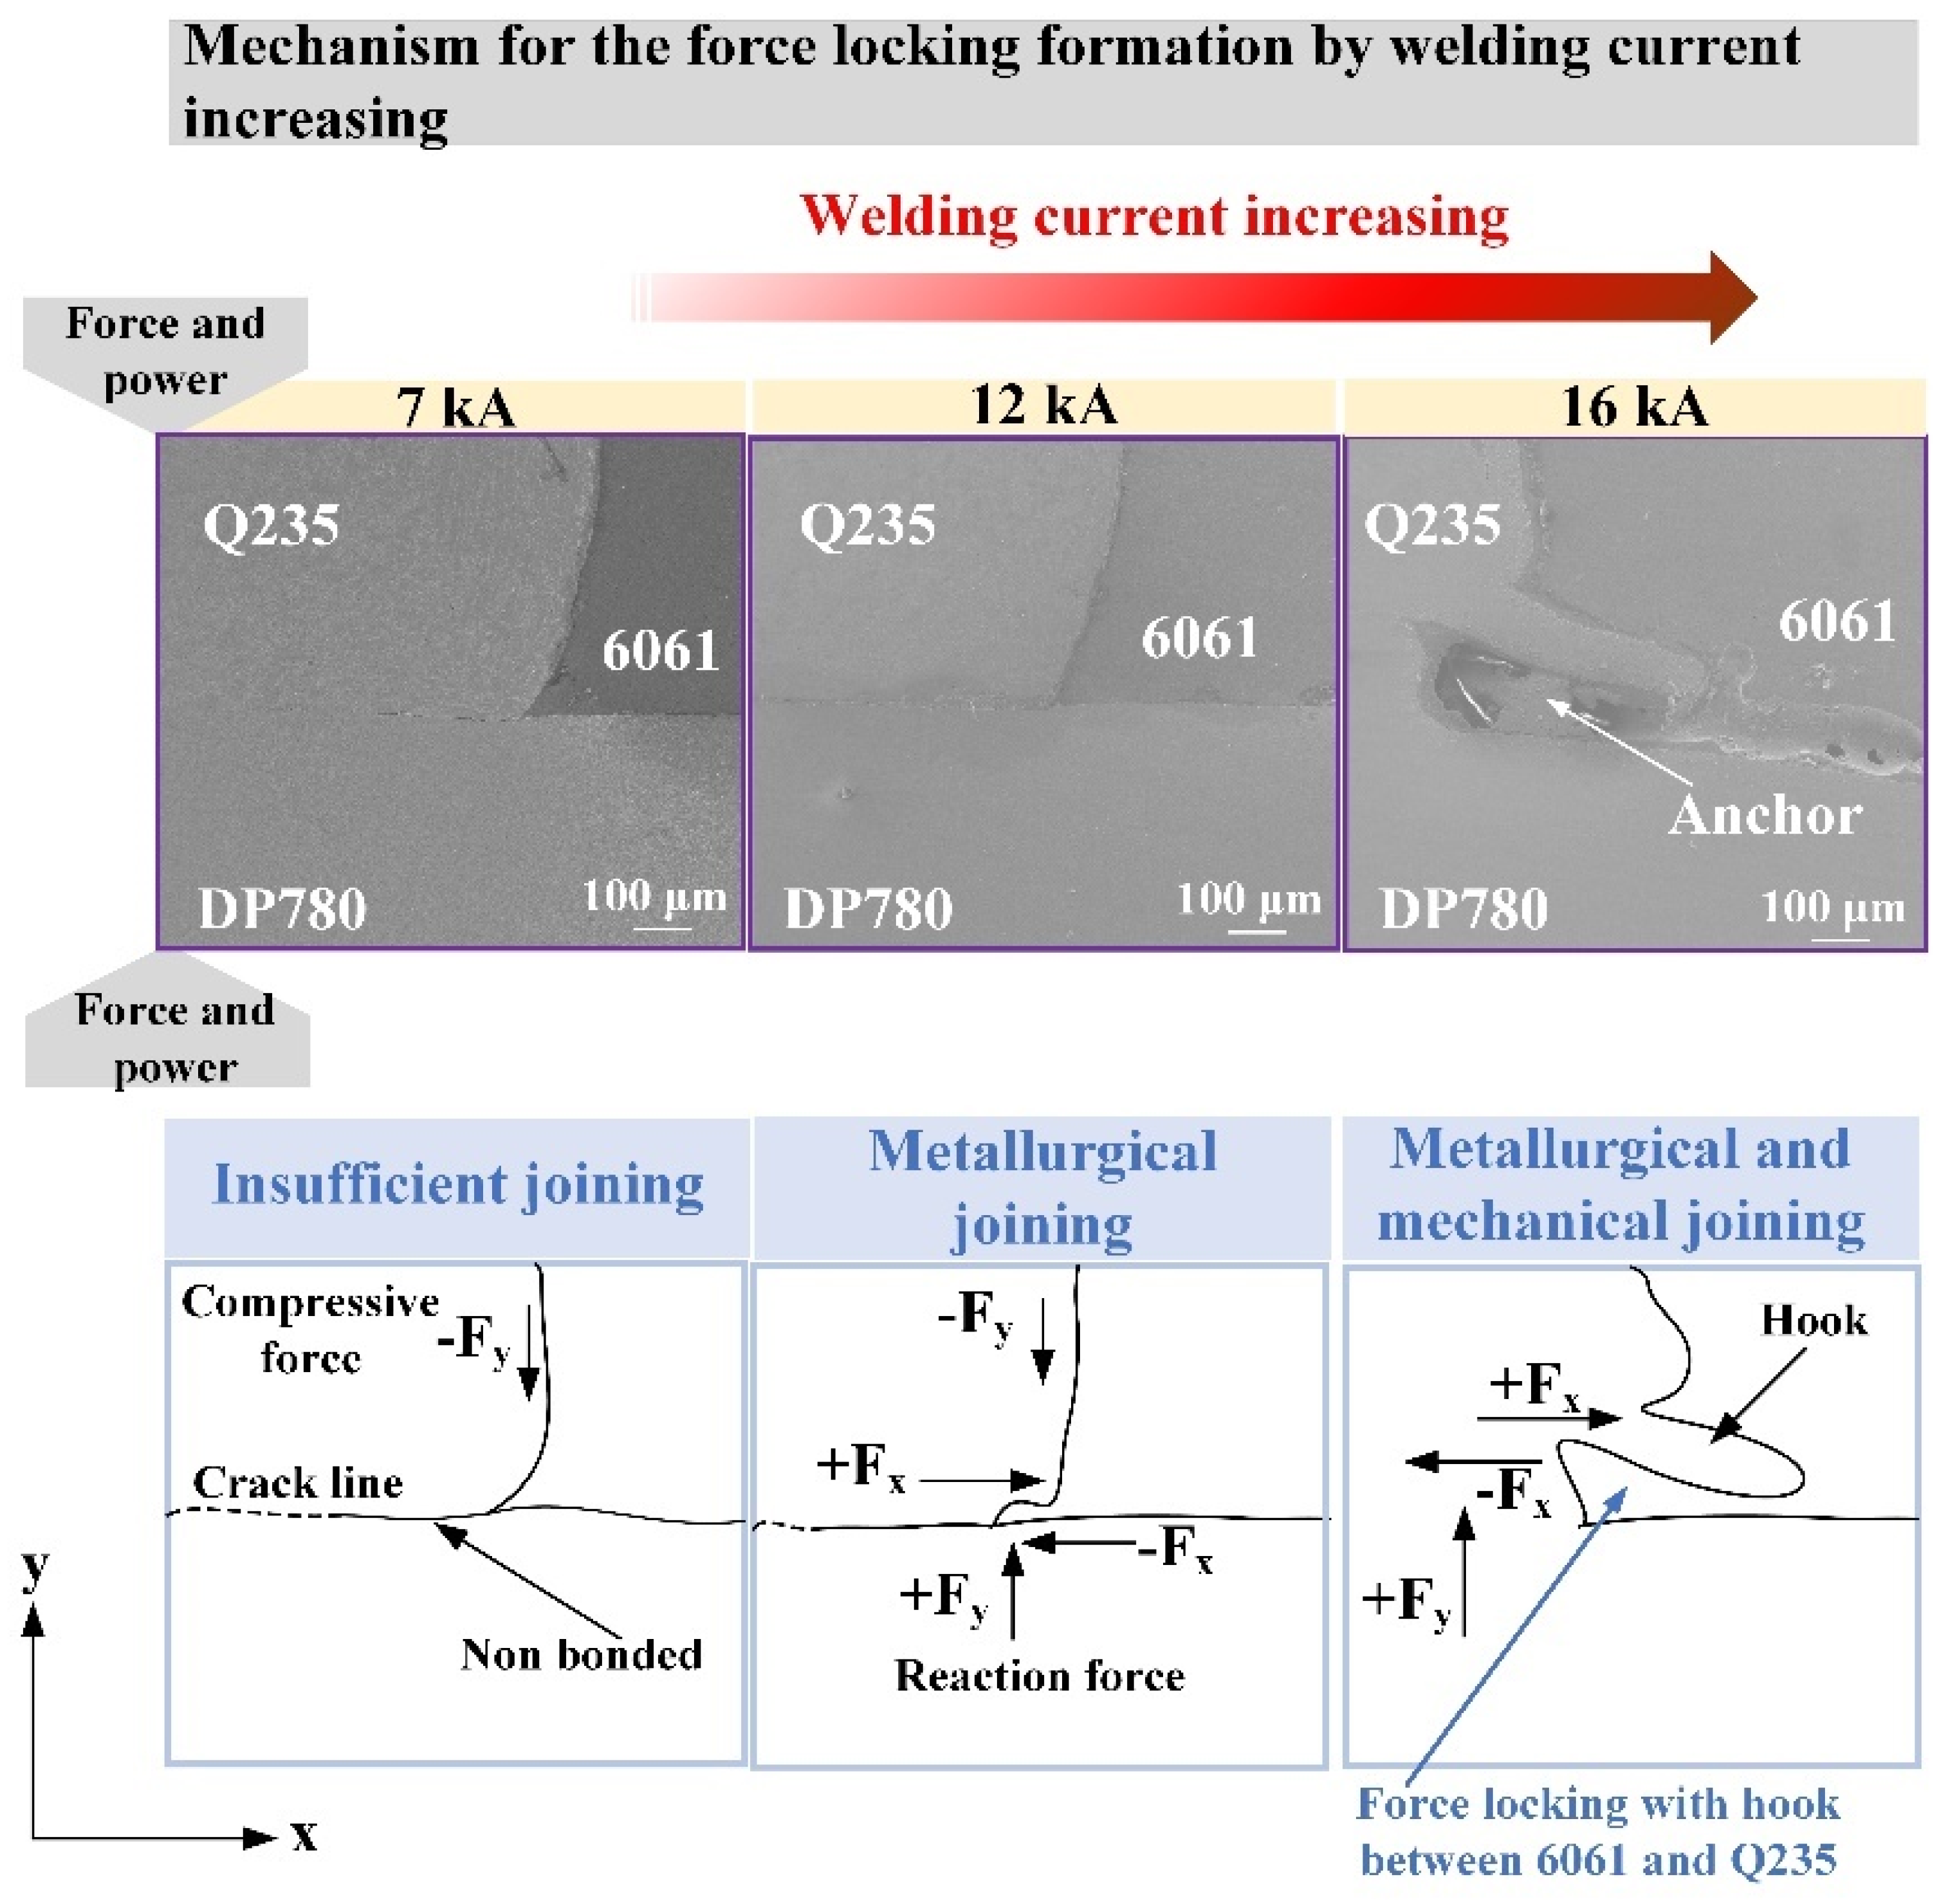
As the welding current increases, the structure of the REW joint evolves into a hooklike structure, which improves the bearing capacity of the joint. When the welding current is less than 7 kA, the failure mode of the REW joint is IF mode. Between 7 and 15 kA, it shows POF mode. Above 15 kA, it shows BPF mode. The maximum core diameter, peak load, and energy absorption of the joint are 5.05 mm, 6.91 kN, and 8.47 J, respectively.

Author Contributions

Methodology, Y.Y. and Y.L.; software, Q.G. and S.L.; validation, Q.G.; formal analysis, Q.W., Y.Y., S.L. and Z.L.; investigation, Y.L.; resources, Q.G., S.L. and Z.L.; data curation, Q.W. and Y.L.; writing—original draft, Q.W.; writing—review and editing, Q.W. and Y.Y.; visualization, S.L.; supervision, Y.Y., Y.L. and Q.G.; project administration, Z.L.; funding acquisition, Z.L. All authors have read and agreed to the published version of the manuscript.

Funding

This article is supported by the National Natural Science Foundation of China (No. 52075378).

Data Availability Statement

The original contributions presented in this study are included in the article. Further inquiries can be directed to the corresponding author.

Conflicts of Interest

The authors declare no conflict of interest.

References

  1. Akhshik, M.; Panthapulakkal, S.; Tjong, J.; Sain, M. The effect of lightweighting on greenhouse gas emissions and life cycle energy for automotive composite parts. Clean. Technol. Environ. Policy 2019, 21, 625–636. [Google Scholar] [CrossRef]
  2. Wang, T.T.; Sidhar, H.; Mishra, R.S.; Hovanski, Y.; Upadhyay, P.; Carlson, B. Evaluation of intermetallic compound layer at aluminum/steel interface joined by friction stir scribe technology. Mater. Des. 2019, 174, 107795. [Google Scholar] [CrossRef]
  3. Bao, Y.; Zhou, J.P.; Zhang, Y.; Xu, Y.; Liu, H.S. Microstructural and mechanical characteristics of direct laser welding 7075 super hard aluminum alloy/D6AC ultra-high strength alloy structural steel. Mater. Lett. 2021, 287, 129312. [Google Scholar] [CrossRef]
  4. Ding, K.; Hu, T.H.; Wu, T.H.; Dong, W.F.; Zhu, P.; Wang, S.J.; Pan, H.; Gao, Y.L. Role of the position of the laser spot in the failure transition during the tensile test for the laser welding-brazing of galvanized CRRA1000 steel to 5754 aluminum alloy in an overlapped joint. Mater. Sci. Eng. A 2023, 880, 145314. [Google Scholar] [CrossRef]
  5. Meschut, G.; Janzen, V.; Olfermann, T. Innovative and Highly Productive Joining Technologies for Multi-Material Lightweight Car Body Structures. J. Mater. Eng. Perform. 2014, 23, 1515–1523. [Google Scholar] [CrossRef]
  6. Fang, X.Z. Hybrid joining of a modular multi-material body-in-white structure. J. Mater. Process. Technol. 2020, 275, 116351. [Google Scholar] [CrossRef]
  7. Chen, J.B.; Yuan, X.J.; Hu, Z.; Li, T.; Wu, K.L.; Li, C. Improvement of resistance-spot-welded joints for DP600 steel and A5052 aluminum alloy with Zn slice interlayer. J. Manuf. Process. 2017, 30, 396–405. [Google Scholar] [CrossRef]
  8. Liu, X.C.; Ye, T.; Li, Y.Z.; Pei, X.J.; Sun, Z. Quasi-in-situ characterization of microstructure evolution in friction stir welding of aluminum alloy. J. Mater. Res. Technol. 2023, 25, 6380–6394. [Google Scholar] [CrossRef]
  9. Yang, Y.; Bi, J.; Liu, H.W.; Li, Y.; Li, M.Y.; Ao, S.S.; Luo, Z. Research progress on the microstructure and mechanical properties of friction stir welded Al-Li alloy joints. J. Manuf. Process. 2022, 82, 230–244. [Google Scholar] [CrossRef]
  10. Talebizadehsardari, P.; Musharavati, F.; Khan, A.; Sebaey, T.A.; Derazkola, H.A. Underwater friction stir welding of Al-Mg alloy: Thermo-mechanical modeling and validation. Mater. Today Commun. 2021, 26, 101965. [Google Scholar] [CrossRef]
  11. Singh, K.; Singh, G.; Singh, H. Investigation on the microstructure and mechanical properties of a dissimilar friction stir welded joint of magnesium alloys. J. Mater. Des. Appl. 2019, 233, 2444–2454. [Google Scholar] [CrossRef]
  12. Yang, J.; Su, J.H.; Gao, C.K.; Zhao, Y.X.; Liu, H.B.; Oliveira, J.P.; Tan, C.W.; Yu, Z.S. Effect of heat input on interfacial microstructure, tensile and bending properties of dissimilar Al/steel lap joints by laser welding-brazing. Opt. Laser Technol. 2021, 142, 107218. [Google Scholar]
  13. Zhao, Y.W.; Long, Y.H.; Li, Z.Y. Research progress of transition layer and filler wire for laser welding of steel and aluminum dissimilar metals. Int. J. Adv. Manuf. Technol. 2022, 119, 4149–4158. [Google Scholar] [CrossRef]
  14. Zhang, Y.; Guo, G.L.; Li, F.N.; Wang, G.; Wei, H.Y. The interface control of butt joints in laser braze welding of aluminium-steel with coaxial powder feeding. J. Mater. Process Technol. 2017, 246, 313–320. [Google Scholar] [CrossRef]
  15. Oliveira, J.P.; Ponder, K.; Brizes, E.; Abke, T.; Ramirez, A.J. Combining resistance spot welding and friction element welding for dissimilar joining of aluminum to high strength steels. J. Mater. Process. Technol. 2019, 273, 116192. [Google Scholar] [CrossRef]
  16. Absar, S.; Ruszkiewicz, B.J.; Skovron, J.D.; Mears, L.; Abke, T.; Xin, Z.; Choi, H. Temperature measurement in friction element welding process with micro thin film thermocouples. Procedia Manuf. 2018, 26, 485–494. [Google Scholar] [CrossRef]
  17. Varma, A.; Nassiri, A.; Mears, L.; Choi, H.; Xin, Z. Numerical study of chipping during friction element welding. Manuf. Lett. 2022, 34, 75–77. [Google Scholar] [CrossRef]
  18. Wang, H.Y.; Han, R.B.; Zhang, Z.X.; Zhu, M.L.; Liu, L.M. Riveting-welding hybrid bonding of high-strength steel and aluminum alloy. Mater. Manuf. Process. 2019, 34, 1671–1680. [Google Scholar] [CrossRef]
  19. Han, R.B.; Wang, H.Y.; Fan, Y.; Liu, L.M.; Zhu, M.L. Research on riveting-laser arc welding hybrid joining mechanism of aluminum alloy and high strength steel. J. Mech. Eng. 2020, 56, 57–70. [Google Scholar]
  20. Wang, D.S.; Dong, Y.C.; Liu, L.M.; Zhu, M.L.; Wang, H.Y.; Liu, C.B. Effect of pulsed laser and laser-arc hybrid on aluminum/steel riveting-welding hybrid bonding technology. J. Mater. Res. Technol. 2022, 17, 1043–1053. [Google Scholar] [CrossRef]
  21. Shen, Z.; Chen, Y.; Haghshenas, M.; Gerlich, A.P. Role of welding parameters on interfacial bonding in dissimilar steel/aluminum friction stir welds. Eng. Sci. Technol. 2015, 18, 270–277. [Google Scholar] [CrossRef]
  22. Zhang, K.; Shamsolhodaei, A.; Ghatei-Kalashami, A.; Oliveira, J.P.; Zang, C.; Schell, N.; Li, J.; Midawi, A.R.H.; Lopes, J.G.; Yan, J.; et al. Revealing microstructural evolutions and mechanical properties of resistance spot welded NiTi-stainless steel with Ni or Nb interlayer. J. Mater. Sci. Technol. 2024, 180, 160–173. [Google Scholar] [CrossRef]
  23. Rajak, B.; Kishore, K.; Mishra, V. Investigation of a novel TIG-spot welding vis-à-vis resistance spot welding of dual-phase 590 (DP590) steel: Processing-microstructure-mechanical properties correlation. Mater. Chem. Phys. 2023, 296, 127254. [Google Scholar] [CrossRef]
  24. Qiu, R.F.; Iwamoto, C.; Satonaka, S. Interfacial microstructure and strength of steel/aluminum alloy joints welded by resistance spot welding with cover plate. J. Mater. Process. Technol. 2009, 209, 4186–4193. [Google Scholar] [CrossRef]
  25. Chen, N.N.; Wang, H.P.; Wang, M.; Carlson, B.E.; Sigler, D.R. Schedule and electrode design for resistance spot weld bonding Al to steels. J. Mater. Process. Technol. 2019, 265, 158–172. [Google Scholar] [CrossRef]
  26. Hu, S.Q.; Ma, Y.W.; Li, Y.B.; Lin, Z.Q.; Haselhuhn, A.S.; CarlSon, B.E. Comparison of the resistance spot weldability of AA5754 and AA6022 aluminum to steels. Weld. J. 2020, 99, 224–238. [Google Scholar] [CrossRef]
  27. Seungyeop, B.; Jongho, S.; Lee, H.; Park, S.; Song, K.-H.; Lee, S.; Lee, S.-J.; Chen, C.T.; Kim, D. Robust bonding and microstructure behavior of aluminum/high-strength steel lap joints using resistance element welding process for lightweight vehicles: Experimental and numerical investigation. Mater. Sci. Eng. A 2021, 833, 142378. [Google Scholar]
  28. Manladan, S.M.; Zhang, Y.; Ramesh, S.; Cai, Y.; Ao, S.S.; Luo, Z. Resistance element welding of magnesium alloy and austenitic stainless steel in three-sheet configurations. J. Mater. Process. Technol. 2019, 274, 116292. [Google Scholar] [CrossRef]
  29. Baek, S.; Go, G.Y.; Park, J.-W.; Jongho, S.; Lee, H.; Lee, S.-J.; Lee, S.; Chen, C.T.; Kim, M.-S.; Kim, D. Microstructural and interface geometrical influence on the mechanical fatigue property of aluminum/high-strength steel lap joints using resistance element welding for lightweight vehicles: Experimental and computational investigation. J. Mater. Res. Technol. 2022, 17, 658. [Google Scholar] [CrossRef]
  30. Günter, H.; Meschut, G. Joining of ultra-high-strength steels using resistance element welding on conventional resistance spot welding guns. Weld. World 2021, 65, 1899–1914. [Google Scholar] [CrossRef]
  31. Rao, Z.; Liu, L.; Wang, Y.; Ou, L.; Liu, J.W. Preventing nugget shifting in joining of dissimilar steels via resistance element welding: A numerical simulation. Int. J. Adv. Manuf. Technol. 2021, 117, 227–241. [Google Scholar] [CrossRef]
  32. Abankar, M.; De Maddis, M.; Razza, V.; Spena, P.R. Resistance Element Welding (REW) of Steels with Non-Ferrous Materials: Potentials, Challenges, and Properties. Metals 2024, 14, 1448. [Google Scholar] [CrossRef]
  33. Cai, W.Y.; Chen, Q.; Wang, Y.J.; Dong, S.J.; Luo, P. Microstructural and mechanical characterization of steel-DP780/Al-5052 joints formed using resistance element welding with concealed rivet cover. Compos. Adv. Mater. 2022, 31, 1–9. [Google Scholar] [CrossRef]
  34. Shim, J.; Park, M.; Kim, I.S. An Overview of Resistance Element Welding with Focus on Mechanical and Microstructure Joint and Optimization in Automotive Metal Joints. J. Weld. Join. 2023, 41, 37–48. [Google Scholar] [CrossRef]
  35. Yang, Y.; Bi, Y.B.; Zhang, Y.X.; Su, J.; Luo, Z. Microstructure and Mechanical Properties of Resistance Element Welded Joints for DP780 Steel and 6061 Aluminum Alloy. Adv. Eng. Mater. 2023, 25, 2201795. [Google Scholar] [CrossRef]
  36. Schmal, C.; Meschut, G. Process characteristics and influences of production-related disturbances in resistance element welding of hybrid materials with steel cover sheets and polymer core. Weld. World 2020, 64, 437–448. [Google Scholar] [CrossRef]
  37. Meschut, G.; Hahn, O.; Janzen, V.; Olfermann, T. Innovative joining technologies for multi-material structures. Weld. World 2013, 58, 65. [Google Scholar] [CrossRef]
  38. Meschut, G.; Schmal, C.; Olfermann, T. Process characteristics and load-bearing capacities of joints welded with elements for the application in multi-material design. Weld. World 2017, 61, 435–442. [Google Scholar] [CrossRef]
  39. Pan, B.; Sun, H.; Shang, S.L.; Banu, M.; Wang, P.C.; Carlson, B.E.; Liu, Z.K.; Li, J.J. Understanding formation mechanisms of intermetallic compounds in dissimilar Al/steel joint processed by resistance spot welding. J. Manuf. Process. 2022, 83, 212–222. [Google Scholar] [CrossRef]
  40. Sun, D.Q.; Zhang, Y.Y.; Liu, Y.J.; Gu, X.Y.; Li, H.M. Microstructures and mechanical properties of resistance spot welded joints of 16Mn steel and 6063-T6 aluminum alloy with different electrodes. Mater. Des. 2022, 109, 596–608. [Google Scholar] [CrossRef]
  41. Funabiki, Y.; Iyota, M.; Shobu, T.; Matsuda, T.; Yumoto, H.; Koyama, T.; Yamazaki, H.; Senba, Y.; Ohashi, H.; Inoue, I. Convection and joint characteristics in aluminum alloy melting zone during resistance spot welding of dissimilar Fe-Al material in external magnetic field. J. Manuf. Process. 2024, 115, 40–55. [Google Scholar] [CrossRef]
Figure 1. A schematic diagram of tensile–shear specimens for Al/steel REWed joints.
Metals 15 00283 g001
Figure 2. Microstructure and XRD results of base metals: (a) microstructure of Q235 steel, (b) XRD results of Q235 steel, (c) microstructure of DP780 steel, (d) XRD results of DP780 steel, (e) microstructure of 6061-T6 Al alloy, and (f) XRD results of 6061-T6 Al alloy.
Metals 15 00283 g002
Figure 3. Influence of welding currents on Al/steel REWed joints formed with flat head-shaped element weld formation: (ao) 6 kA~20 kA.
Metals 15 00283 g003
Figure 4. Cross-section morphology of the Al/steel REWed joints using the flat element with cap at various welding currents: (ao) 6 kA~20 kA.
Metals 15 00283 g004
Figure 5. Effect of welding current on the depth of cap penetration into the Al sheet.
Metals 15 00283 g005
Figure 6. Nugget diameter and the bearing area of Al/steel REWed joints using the flat element with cap as a function of welding current.
Metals 15 00283 g006
Figure 7. Cross-sectional morphologies of REW joints with the distribution of HAZ.
Metals 15 00283 g007
Figure 8. SEM images of the REW joint: (a) NZ, (b) FZ of 6061-T6 Al alloy, and (c) FGHAZ near element side.
Metals 15 00283 g008
Figure 9. EBSD analysis results of the NZ of the REWed welding joint by 8 kA: (a) IPF map, (b) KAM map, and (c) GB map.
Metals 15 00283 g009
Figure 10. Results of flat-head unit fusion energy spectrum (EDS) line scanning.
Metals 15 00283 g010
Figure 11. Element distribution in the steel-NZ with flat head-shaped element with cap: (a) SEM image showing steel-NZ of joint; (bf) elemental distributions of Fe, Mn, Al, C and Si, respectively.
Metals 15 00283 g011
Figure 12. SEM images of the interfaces in different regions of the REW joint: (a) macroscopic morphology of the unit cross-section, (b) region b in (a), (c) region c in (a), (d) region d in (a), (e) region e in (a), (f) region f in (a), and (g) region g in (a).
Metals 15 00283 g012
Figure 13. Interfacial compound of 6061 Al alloy/Q235 steel with a flat-head element shape: (a) SEM image of the interface between the element and aluminum alloy, (b) Iron distribution at (a), (c) Manganese distribution at (a), (d) Aluminum distribution at (a), (e) Magnesium distribution at (a), and (f) Silicon distribution at (a).
Metals 15 00283 g013
Figure 14. Interfacial compound of 6061 Al alloy/DP780 steel with a flat-head element shape: (a) SEM image of the interface between the element and DP780 steel, (b) Iron distribution at (a), (c) Manganese distribution at (a), (d) Aluminum distribution at (a), (e) Magnesium distribution at (a), and (f) Silicon distribution at (a).
Metals 15 00283 g014
Figure 15. Microhardness distribution of the joint: (a) nugget and steel, (b) aluminum.
Metals 15 00283 g015
Figure 16. Variation of α-phase fraction: (a) vertical direction path, (b) horizontal direction path.
Metals 15 00283 g016
Figure 17. The relationship between the nugget diameter, peak load, and energy absorption with welding current.
Metals 15 00283 g017
Figure 18. Failure modes of the REW joint: (a) IF, (b) POF, and (c) BPF.
Metals 15 00283 g018
Figure 19. Fracture morphology in IF mode: (a) macroscopic morphology, (b) 3D image of the steel side surface, and (c) 3D image of the aluminum side surface.
Metals 15 00283 g019
Figure 20. Fracture morphology in POF mode: (a) macroscopic morphology, (b) 3D surface image.
Metals 15 00283 g020
Figure 21. Fracture morphology in BPF mode: (a) macroscopic morphology, (b) 3D surface image.
Metals 15 00283 g021
Figure 22. Cross-sectional images of different areas of the Al/steel REWed joint using the flat element with a cap by 7 kA welding current: (a) OM image, (b) B region, (c) C region, (d) D region, (e) E region, (f) F region, and (g) G region.
Metals 15 00283 g022
Figure 23. Cross-sectional images of different areas of the Al/steel REWed joint using the flat element with a cap by 9 kA welding current: (a) OM image, (b) B region, (c) C region, (d) D region, (e) E region, (f) F region, and (g) G region.
Metals 15 00283 g023
Figure 24. Cross-sectional images of different areas of the Al/steel element welded joint using the flat element with a cap by 16 kA welding current: (a) optical microscope image, (b) B region, (c) C region, (d) D region, and (e) E region.
Metals 15 00283 g024
Figure 25. Evolution behavior of Al/steel REWed joint using the flat element with a cap at various welding current.
Metals 15 00283 g025
Table 1. Chemical composition (wt.%) of base materials.
MaterialsCCrSiMnPFeSMgAlCu
DP7800.100.490.192.10Bal.0.04
6061-T60.230.650.120.171.07Bal.0.27
Q2350.16 0.260.480.03Bal.0.02
Table 2. Mechanical properties of base materials.
MaterialsYield Strength (MPa)Tensile Strength (MPa)Elongation (%)
DP780826.71838.3223.88
6061-T6280.00311.0012.50
Q235331.00458.0030.50
Disclaimer/Publisher’s Note: The statements, opinions and data contained in all publications are solely those of the individual author(s) and contributor(s) and not of MDPI and/or the editor(s). MDPI and/or the editor(s) disclaim responsibility for any injury to people or property resulting from any ideas, methods, instructions or products referred to in the content.

