Article

Optimizing FSP Parameters for AA5083/SiC Composites: A Comparative Analysis of Taguchi and Regression

by
Oritonda Muribwathoho
1,*,
Velaphi Msomi
2 and
Sipokazi Mabuwa
3
1
Mechanical and Mechatronics Engineering Department, Cape Peninsula University of Technology, Cape Town 7535, South Africa
2
Mechanical, Bioresources and Biomedical Engineering Department, School of Engineering and Built Environment, College of Science, Engineering and Technology, University of South Africa, Roodepoort 1724, South Africa
3
Mechanical Engineering Department, Durban University of Technology, Durban 4000, South Africa
*
Author to whom correspondence should be addressed.
Metals 2025, 15(3), 280; https://doi.org/10.3390/met15030280
Submission received: 18 January 2025 / Revised: 19 February 2025 / Accepted: 3 March 2025 / Published: 5 March 2025

Abstract

The fabrication of AA5083/SiC composites by the friction stir processing (FSP) method is the main objective of this study. The study looks at how the mechanical properties of the composites are affected by three important process parameters: traversal speed, rotational speed, and tilt angle. The Taguchi L9 design matrix was used to effectively investigate parameter effects, decreasing experimental trials and cutting expenses. Tensile testing measured tensile strength, whereas microhardness tests evaluated hardness. The findings showed that a maximum tensile strength of 243 MPa and a maximum microhardness of 94.80 HV were attained. The findings also showed that the optimal ultimate tensile strength (UTS) and percentage elongation (PE) were achieved at a tilt angle of 2°, a traverse speed of 30 mm per minute, and a rotating speed of 900 rev/min. On the other hand, a slightly greater traverse speed of 45 mm per minute was required to reach maximal microhardness (MH) with the same rotational speed and tilt angle. Analysis of variance (ANOVA) showed that rotational speed has a substantial impact on all mechanical properties, highlighting how important it is for particle dispersion and grain refining. This work is unique in that it systematically optimizes FSP parameters by using regression analysis and the Taguchi technique in addition to ANOVA. This allows for a better understanding of how these factors affect the mechanical properties of SiC-reinforced composites. The findings contribute to advancing the cost-effective fabrication of high-performance metal matrix composites for industrial applications requiring enhanced strength and durability.

1. Introduction

Aluminum matrix composites (AMMCs) have been recognized as a suitable material in several applications because they possess impressive mechanical, thermal, and tribological properties. Relative to conventional lightweight materials such as aluminum alloys and monolithic material classes, AMMCs possess greater specific stiffness and strength, higher operating temperature tolerance, reduced creep rates, and better wear characteristics [1]. AMMCs are widespread and use of AMMCs may range from bicycles to spacecraft, medical equipment to electronic packaging, and home appliances to space vehicles. Because of their superior surface contact characteristics, high strength-to-mass ratio, and improved corrosion potential, ceramic-reinforced aluminum matrix composites are gradually taking the place of monolithic alloys in the automotive, marine, and aviation sectors [2,3,4].
AMMC manufacturing techniques fall into two main categories: liquid phase processing techniques including squeeze casting, stir casting, and compo casting, and solid-state processing techniques like FSP, physical vapor deposition, diffusion bonding, and powder metallurgy. During the liquid stage, unwanted intermetallic compounds are produced that are detrimental to the material’s mechanical properties. However, the conventional methods of solid-state processing have excluded the formation of intermetallic besides reducing distortion, defects on the material, and hydrogen porosity that was evident during the fabrication of aluminum alloy through liquid phase processing [5].
FSP offers numerous advantages over other fabrication techniques, including low environmental impact, high energy efficiency, minimal processing steps, and no required heat treatment. Primary FSP applications for microstructure alteration in various metallic materials include homogenization of Al alloys [6] and AMMCs [7,8], superplasticity enhancement [9,10], fatigue life improvement in arc-welded steel [11,12], improvement of as-cast Al alloys [13,14], fabrication of ex situ [15,16,17,18] and in situ composites [19,20,21,22,23], and metal foam fabrication [24].
FSP is a cutting-edge technique for surface modification and composite fabrication, controlling material microstructure and mechanical properties. It functions as a surface modification technique without reinforcement and as a composite fabrication technique when reinforcements are included. It alters material properties by inducing high levels of localized plastic deformation [25]. While inspired by friction stir welding (FSW), developed in 1991 at a welding institute [26,27], FSP does not join metals.
When performing FSP, a one-of-a-kind tool that cannot be removed is employed. This tool has a pin with a small diameter and a shoulder with a concentric, larger diameter. The tool pin and shoulder work together to control the depth of material penetration. The process begins with the tool rotating at high speed while exerting a downward force. As the rotating pin engages with the workpiece surface, frictional heat is generated. This localized heating softens the material, allowing the pin to penetrate deeper into the workpiece. Once the pin penetrates the material, the shoulder comes into contact with the workpiece surface, generating further frictional heat. This combination of pin rotation, downward force, and frictional heat leads to localized heating, material softening, and plastic deformation within the workpiece [28].
The impact of plastic deformation processes on the mechanical properties of the composites was examined, and the results showed that there was a substantial link between plastic deformation and mechanical properties. Recent research has emphasized the critical role of these mechanisms in overall performance. Studies on particle-reinforced metal matrix composites (MMCs) [29,30] have highlighted the importance of interface bonding and particle distribution for strength and ductility. Strong interfacial bonding facilitates effective load transfer, whereas uniform particle distribution minimizes stress concentrations. Several studies [31,32] show that FSP can significantly influence these factors by promoting homogeneous particle distribution and improving interfacial bonding through localized plastic deformation and heat input. However, the specific mechanisms vary depending on the processing parameters and the composite system.
Some studies [33] suggested that high rotational speeds can cause excessive heat and detrimental interfacial reactions, whereas others [34] showed that optimized FSP parameters can significantly improve strength and ductility by refining the microstructure and promoting uniform deformation. The role of dislocation activity in the matrix and its interaction with reinforcement particles have also been extensively studied [35,36]. These studies demonstrate that reinforcement particles can impede dislocation motion, leading to strengthening, but can also introduce stress concentrations that affect fracture behavior. Therefore, understanding the interplay between the FSP parameters, plastic deformation mechanisms, and resulting mechanical properties is crucial for tailoring composite materials.
The process parameters, such as the tool rotating speed, tool profile, traverse speed, preheat temperature, pressure applied, and so on, are subject to significant variation and change depending on the material that is utilized, the composite property that is required, and the availability of equipment that is utilized during the fabrication process utilizing FSP. These parameters require optimization through experimentation and process development to achieve desired AMMC characteristics. Many researchers use Design of Experiments (DOE) to determine the impact of multiple parameters on aluminum matrix composite mechanical properties [26].
The Taguchi approach, mathematical programming, response surface design, simulated annealing, tabu search, and genetic algorithms are further techniques used for this purpose [37]. Among all these, the Taguchi method is one of the most used Design of Experiments techniques for optimizing the control aspects in a real approach in addition to the result analysis of various control factors on performance behavior [38]. Taguchi’s technique is applied to investigate the rank of each process parameter of an alloy or composites for the performance features [39,40]. ANOVA, or analysis of variance, is one of the models used to build and evaluate experiment data when the least squares approach is applied.
There has been a limited amount of research conducted on improving the process parameters in order to improve the mechanical properties of AA5083/SiC composites, despite the fact that FSP is used extensively. Specifically, in AA5083/SiC composites, understanding how FSP influences SiC particle distribution, interfacial bonding with the AA5083 matrix, and the resulting plastic deformation is crucial for optimizing properties like ultimate tensile strength (UTS), percentage elongation (PE), and microhardness (MH). This work seeks to close this gap by carefully investigating the impacts of rotational speed, traverse speed, and tilt angle on UTS, PE, and MH. This study is unique in that it uses both the Taguchi technique and regression analysis, as well as ANOVA, to determine the contributions of these factors to the mechanical performance of SiC-reinforced composites. By filling this gap, the study helps to create cost-effective production methods for high-strength composites designed for industrial applications.

2. Experimental Procedure

2.1. Material Used

The base alloy used in this study, AA5083, has the following specific composition: 0.05% chromium, 0.02% copper, 0.16% iron, 4.03% magnesium, 0.69% manganese, 0.15% silicon, 0.02% titanium, and 0.01% zinc [41]. The chemical composition of the base material was analyzed using a Belec Compact Spectrometer HLC, manufactured by Belec Spectrometry Opto-Electronics GmbH (Georgsmarienhütte, Germany). Aluminum plates measuring 250 mm × 50 mm × 6 mm were used. Table 1 displays the mechanical properties of AA5083. The reinforcement in this study was silicon carbide particle powder, which makes up 5% of the composite’s volume.

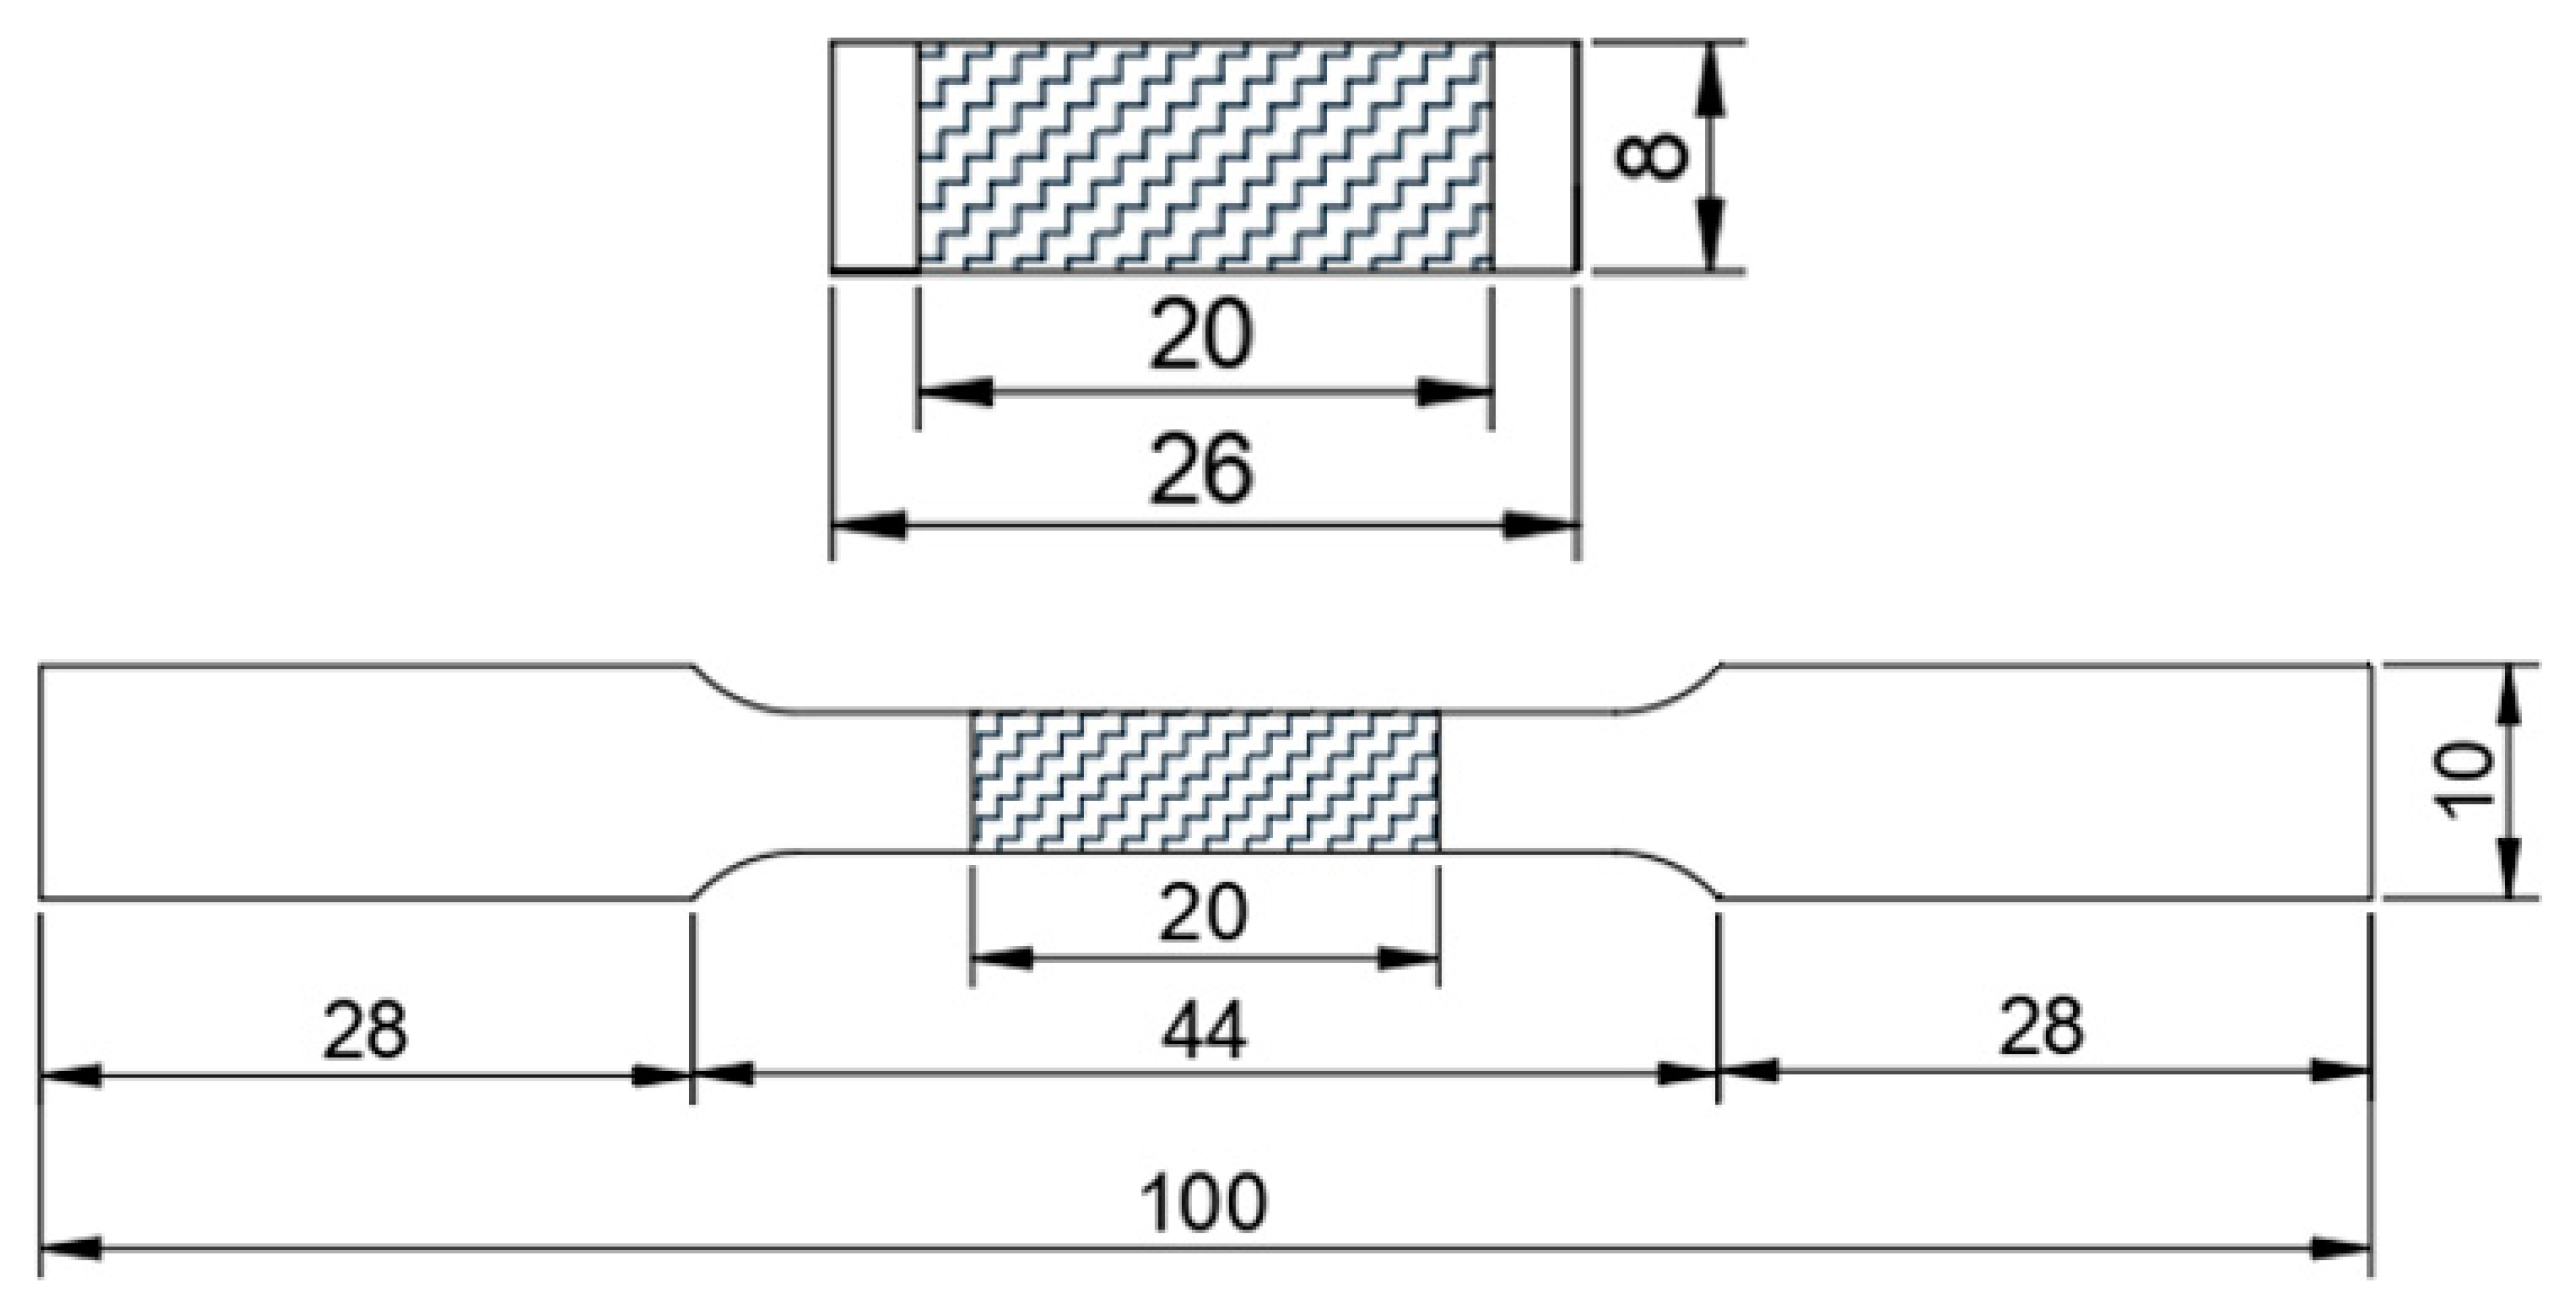
2.2. Parameter Selection for Fabrication of AMMCs

A Taguchi L9 orthogonal array was employed to optimize friction stir processing (FSP) parameters and minimize experimental runs. This design efficiently investigates three factors at three levels with only nine trials, significantly reducing the 27 runs required for a full factorial design. The chosen parameters were traverse speed (30, 45, 60 mm per min), rotational speed (600, 900, 1200 rev/min), and tilt angle (1°, 1.75°, 2°). The L9 matrix systematically assigns parameter levels across the nine trials, ensuring unbiased analysis using the Minitab 18 software. This approach offers substantial time and resource savings, enables statistical analysis via signal-to-noise (S/N) ratios and ANOVA, and facilitates the identification of optimal conditions for improved AA5083/SiC composite mechanical properties. Table 2 details the factors and levels, while Table 3 presents the resulting nine-run design matrix generated using the Minitab 18 program.

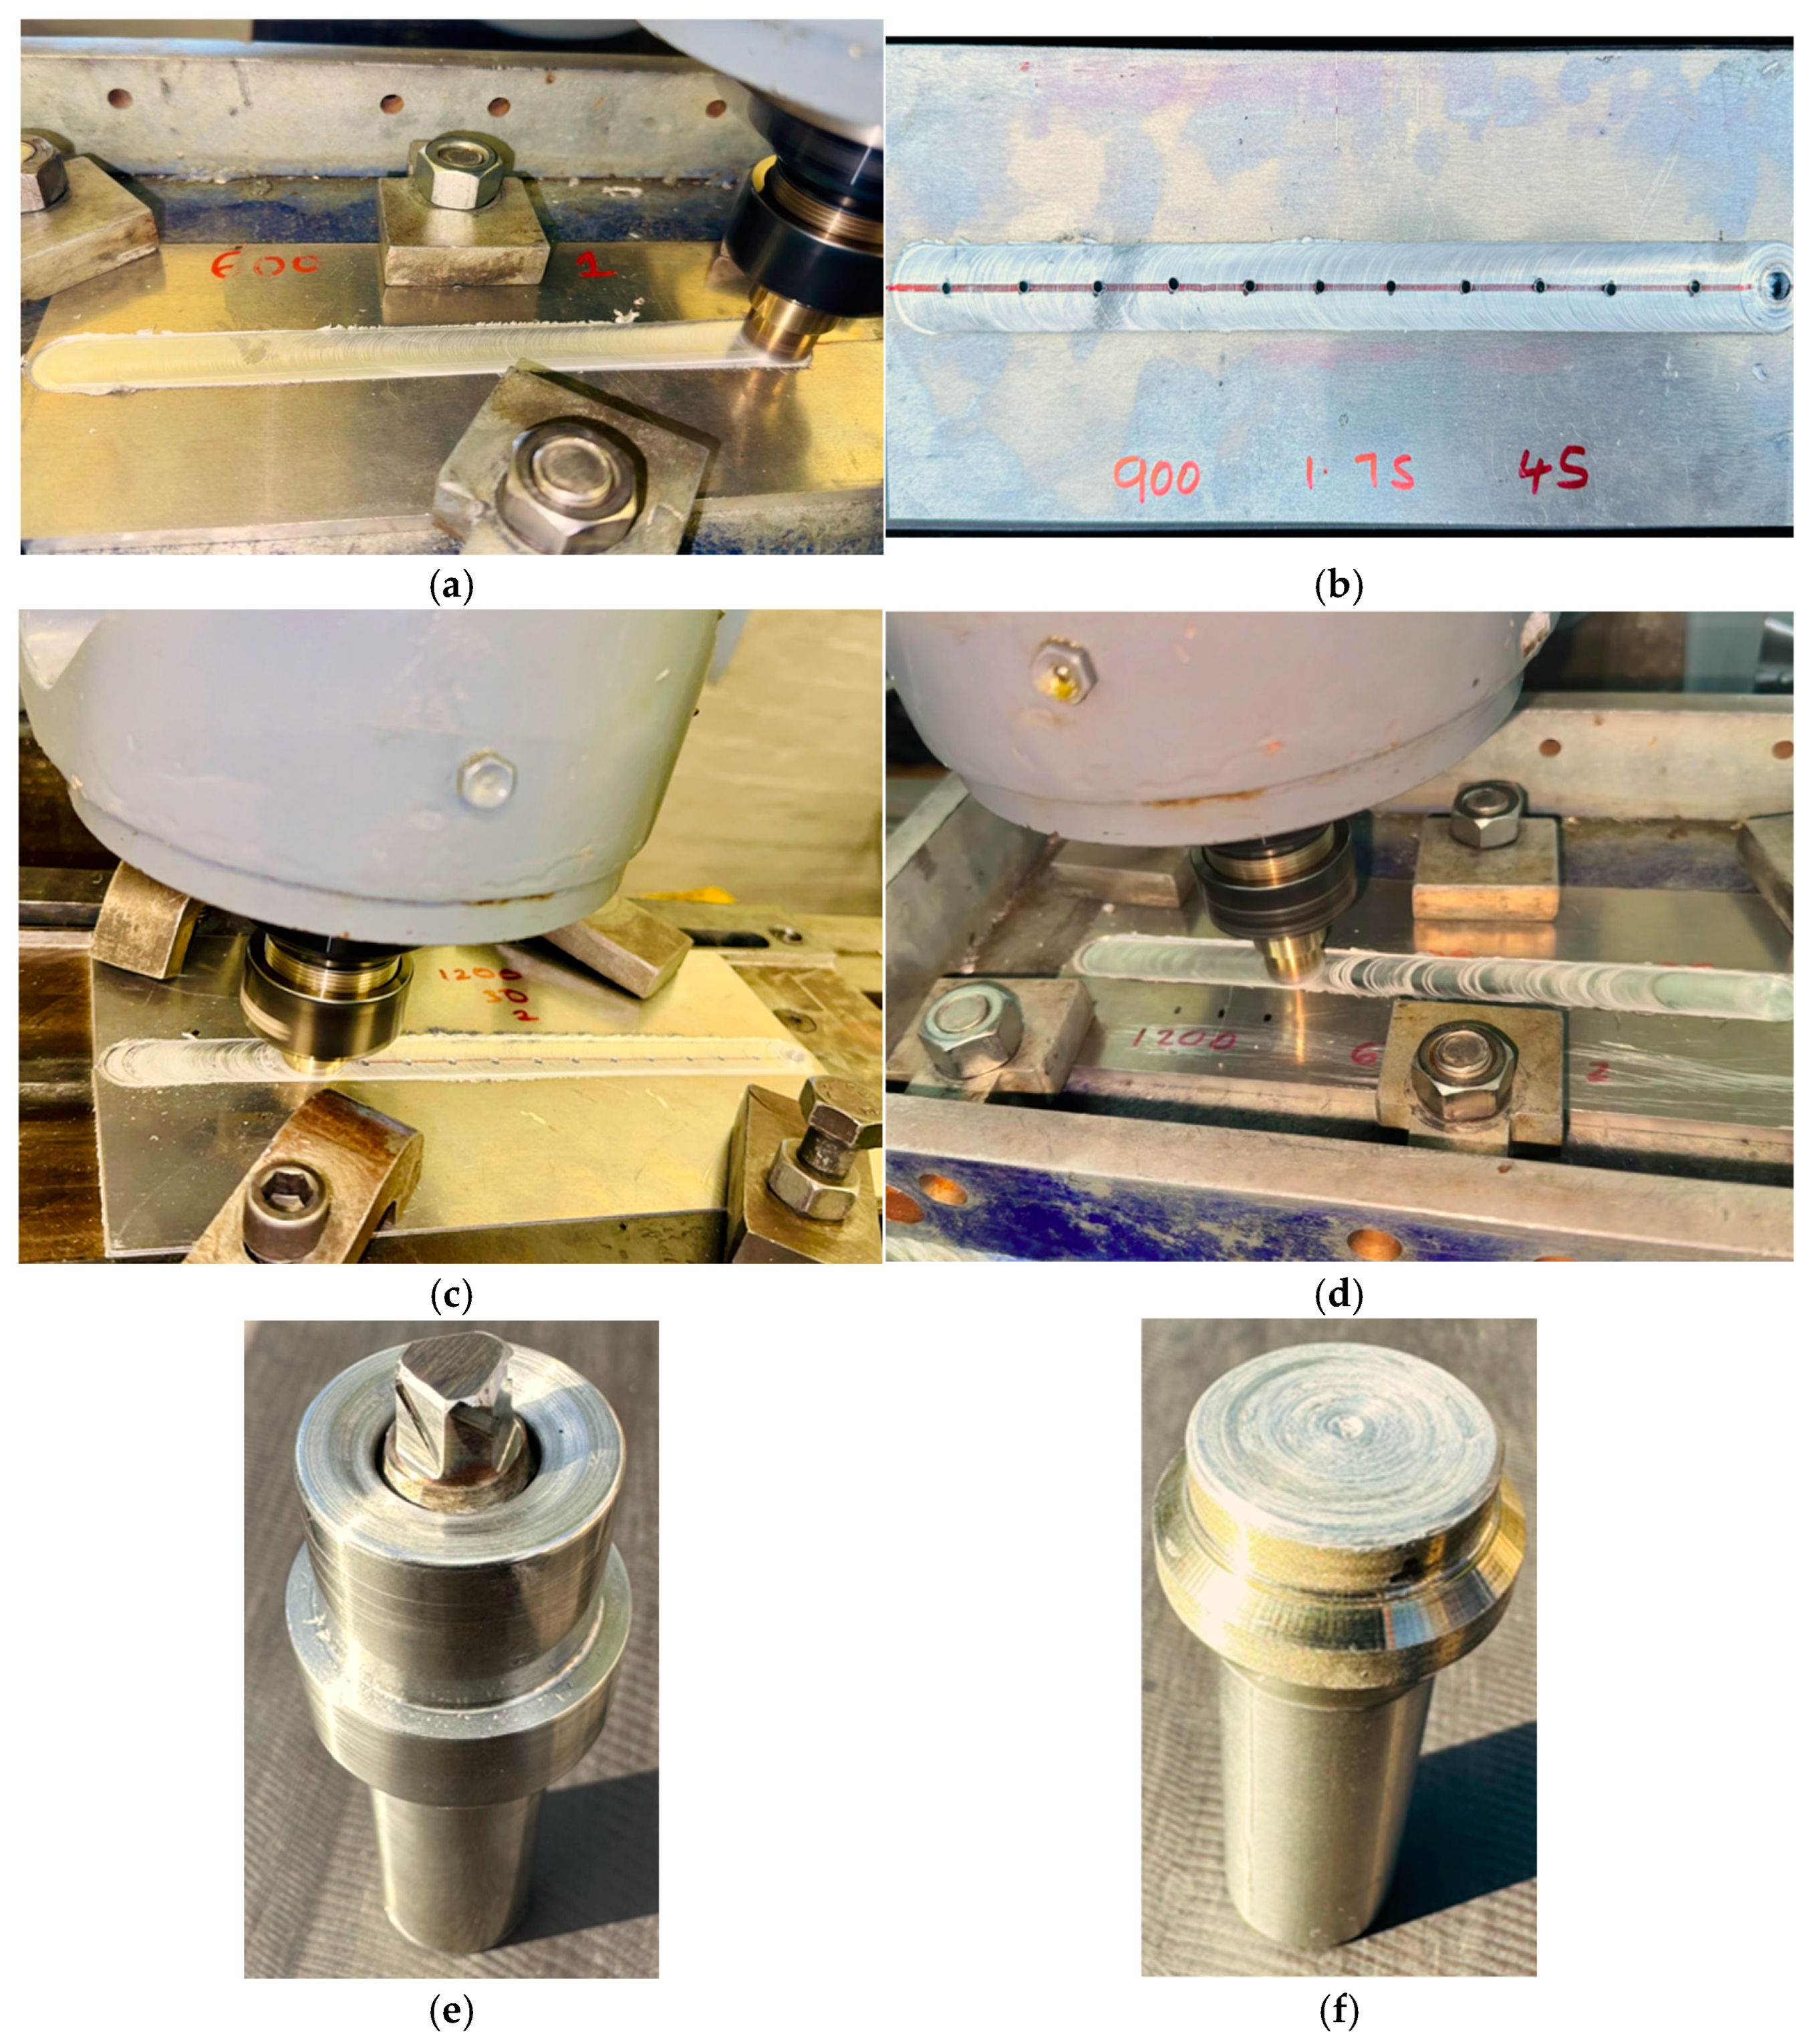
2.3. Fabrication of AMMCs

The fabrication of AA5083/SiC composites was carried out using friction stir processing (FSP), with the AA5083 aluminum alloy as the base material and silicon carbide (SiC) particles as the reinforcement. Initially, two AA5083 plates (250 mm × 50 mm × 6 mm) were joined using friction stir welding (FSW) to create a stable workpiece as shown in Figure 1a. A series of 2.5 mm diameter holes, spaced 15 mm apart and drilled to a depth of 4 mm, were prepared along the weld line. These holes were filled with SiC particle powder (5% volume fraction) as shown in Figure 1b and sealed using a pinless FSP tool to prevent particle loss before processing as shown in Figure 1c. Finally, the last FSP pass is performed as shown in Figure 1d at room temperature.
The FSW/FSP was performed using a Lagun FU.1-LA universal milling machine manufactured by the Lagun Machine Tools S.L.U. in Gipuzkoa in Spain and a custom-designed tool made of AISI 4140 high-speed steel, with a shoulder diameter of 20 mm, probe diameter of 7 mm, and a triangular pin of 5.8 mm. The pin-equipped tool and pinless tool are displayed in Figure 1e,f, respectively. It should be noted that the processing parameters used were determined through the Taguchi L9 orthogonal array, as described in Section 2.2, ensuring an optimized and systematic approach to parameter selection. Traverse speed (30, 45, and 60 mm per min), rotational speed (600, 900, and 1200 rev/min), and tilt angle (1°, 1.75°, and 2°) were the final parameters that varied with each run.
In the end, nine AA5083/SiC composite joints were successfully constructed and tested for tensile and hardness. Tensile specimens were extracted perpendicular to the processing direction following ASTM-E8M-04 [42] standards to ensure uniform sampling, and one specimen per condition was used to evaluate the mechanical performance. The Hounsfield tensile test machine was employed for specimen preparation and tensile testing. For hardness evaluation, microhardness specimens were also extracted perpendicular to the processing direction, and measurements were conducted using the Innova Test Falcon 500 (manufactured by the INNOVATEST Europe BV Manufacturing Maastricht in the Netherlands). Hardness testing followed ASTM-E384 standard [43]. It should also be noted that one specimen was used to assess the microhardness in each condition.
The tensile specimen dimensions and microhardness dimensions are shown in Figure 2, while Table 4 presents the measured values of the ultimate tensile strength (UTS), yield strength (YS), percentage elongation (PE), and microhardness (MH) for each experimental run.

3. Results and Discussion

3.1. Mechanical Properties

3.1.1. Hardness

The microhardness of the developed AA5083/SiC composites was higher than the base metal AA5083, having an average value of 93.07 HV. The outcome shows that hardness values presented here have marked differences under various FSP parameters from that of the base material. The improved microhardness is due to phenomena like recrystallization, grain refinement, distribution of particles, and intermetallic particle fragmentation [44,45]. These findings align with previous studies [46].

3.1.2. Tensile Strength

The produced AA5083/SiC composites were found to have a UTS that was comparable to the AA5083 base material. However, as compared to the base material, the produced AA5083/SiC composites showed a slight reduction in ultimate tensile strength. The reduced tensile strength is due to SiC particle agglomeration and poor interfacial bonding between the reinforcement and the AA5083 matrix. Agglomeration creates stress concentrations that initiate cracks, weakening the composite. Poor bonding hinders effective load transfer, further reducing strength. This aligns with previous research [47,48,49,50] showing lower tensile strength in single-pass FSP composites compared to the base material, attributed to particle aggregation and resulting stress concentrations. This suggests that further optimization of processing parameters, such as multi-pass FSP or improved tool design, may be necessary to enhance particle distribution and bonding, ultimately improving tensile properties.

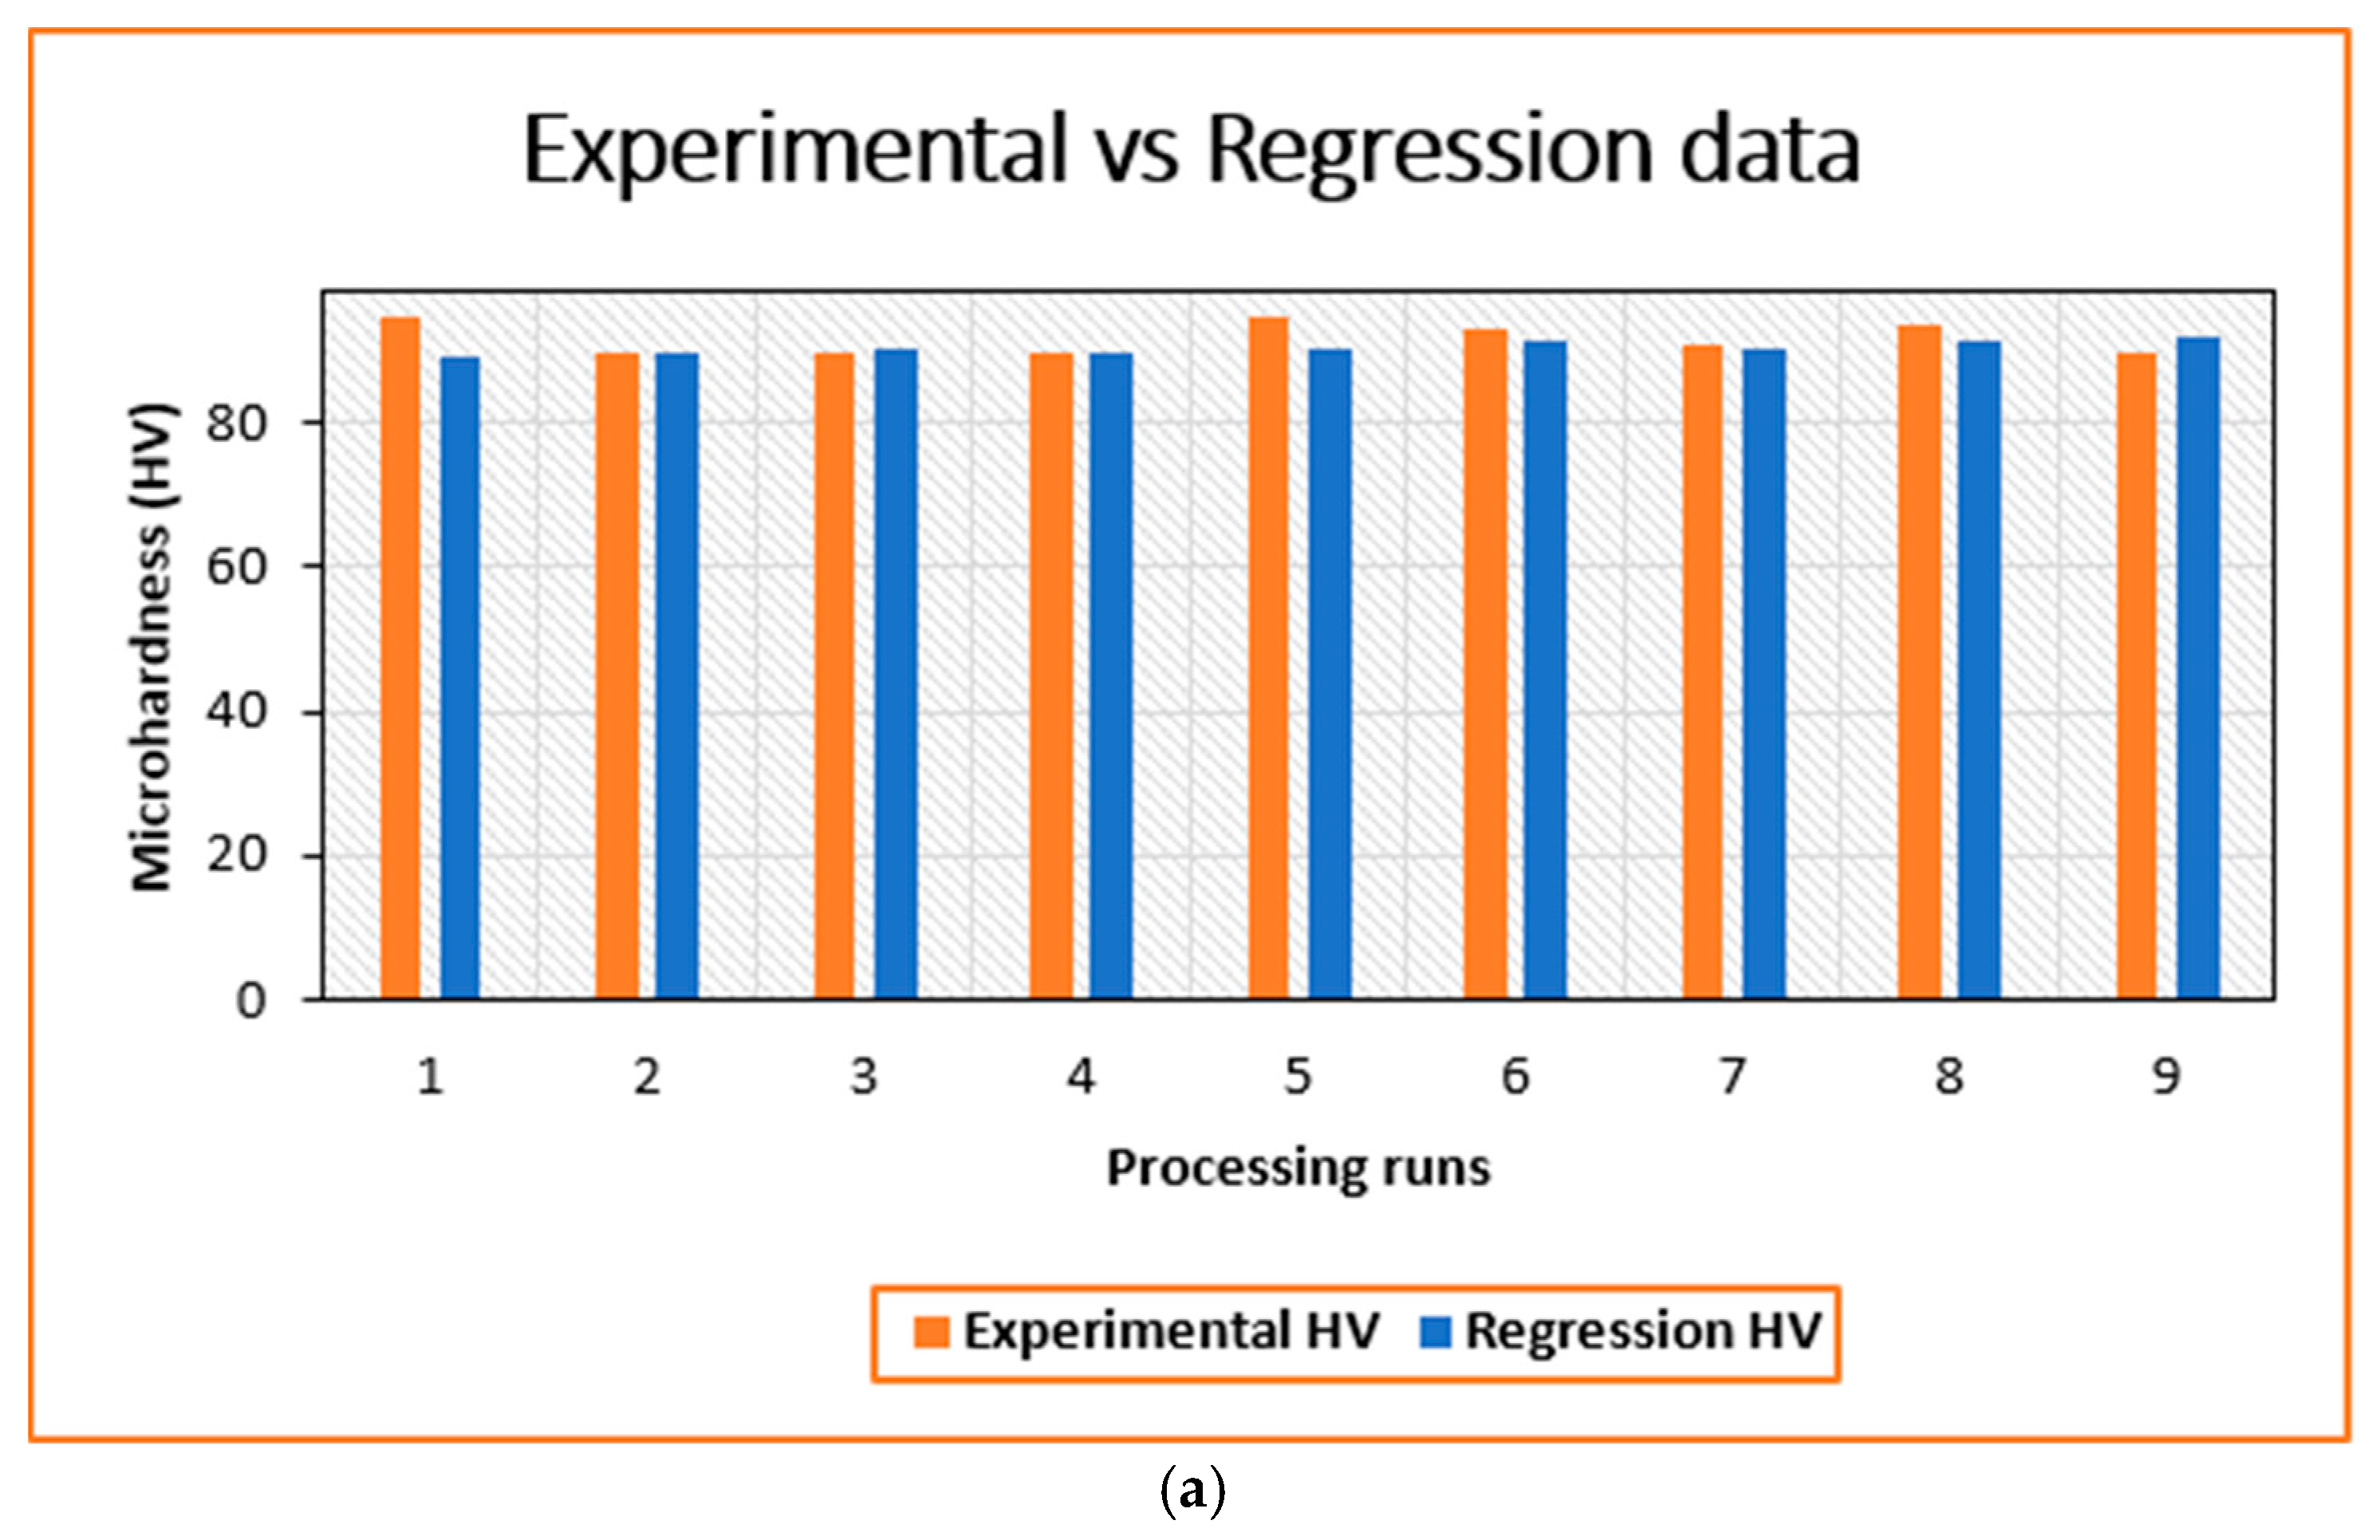
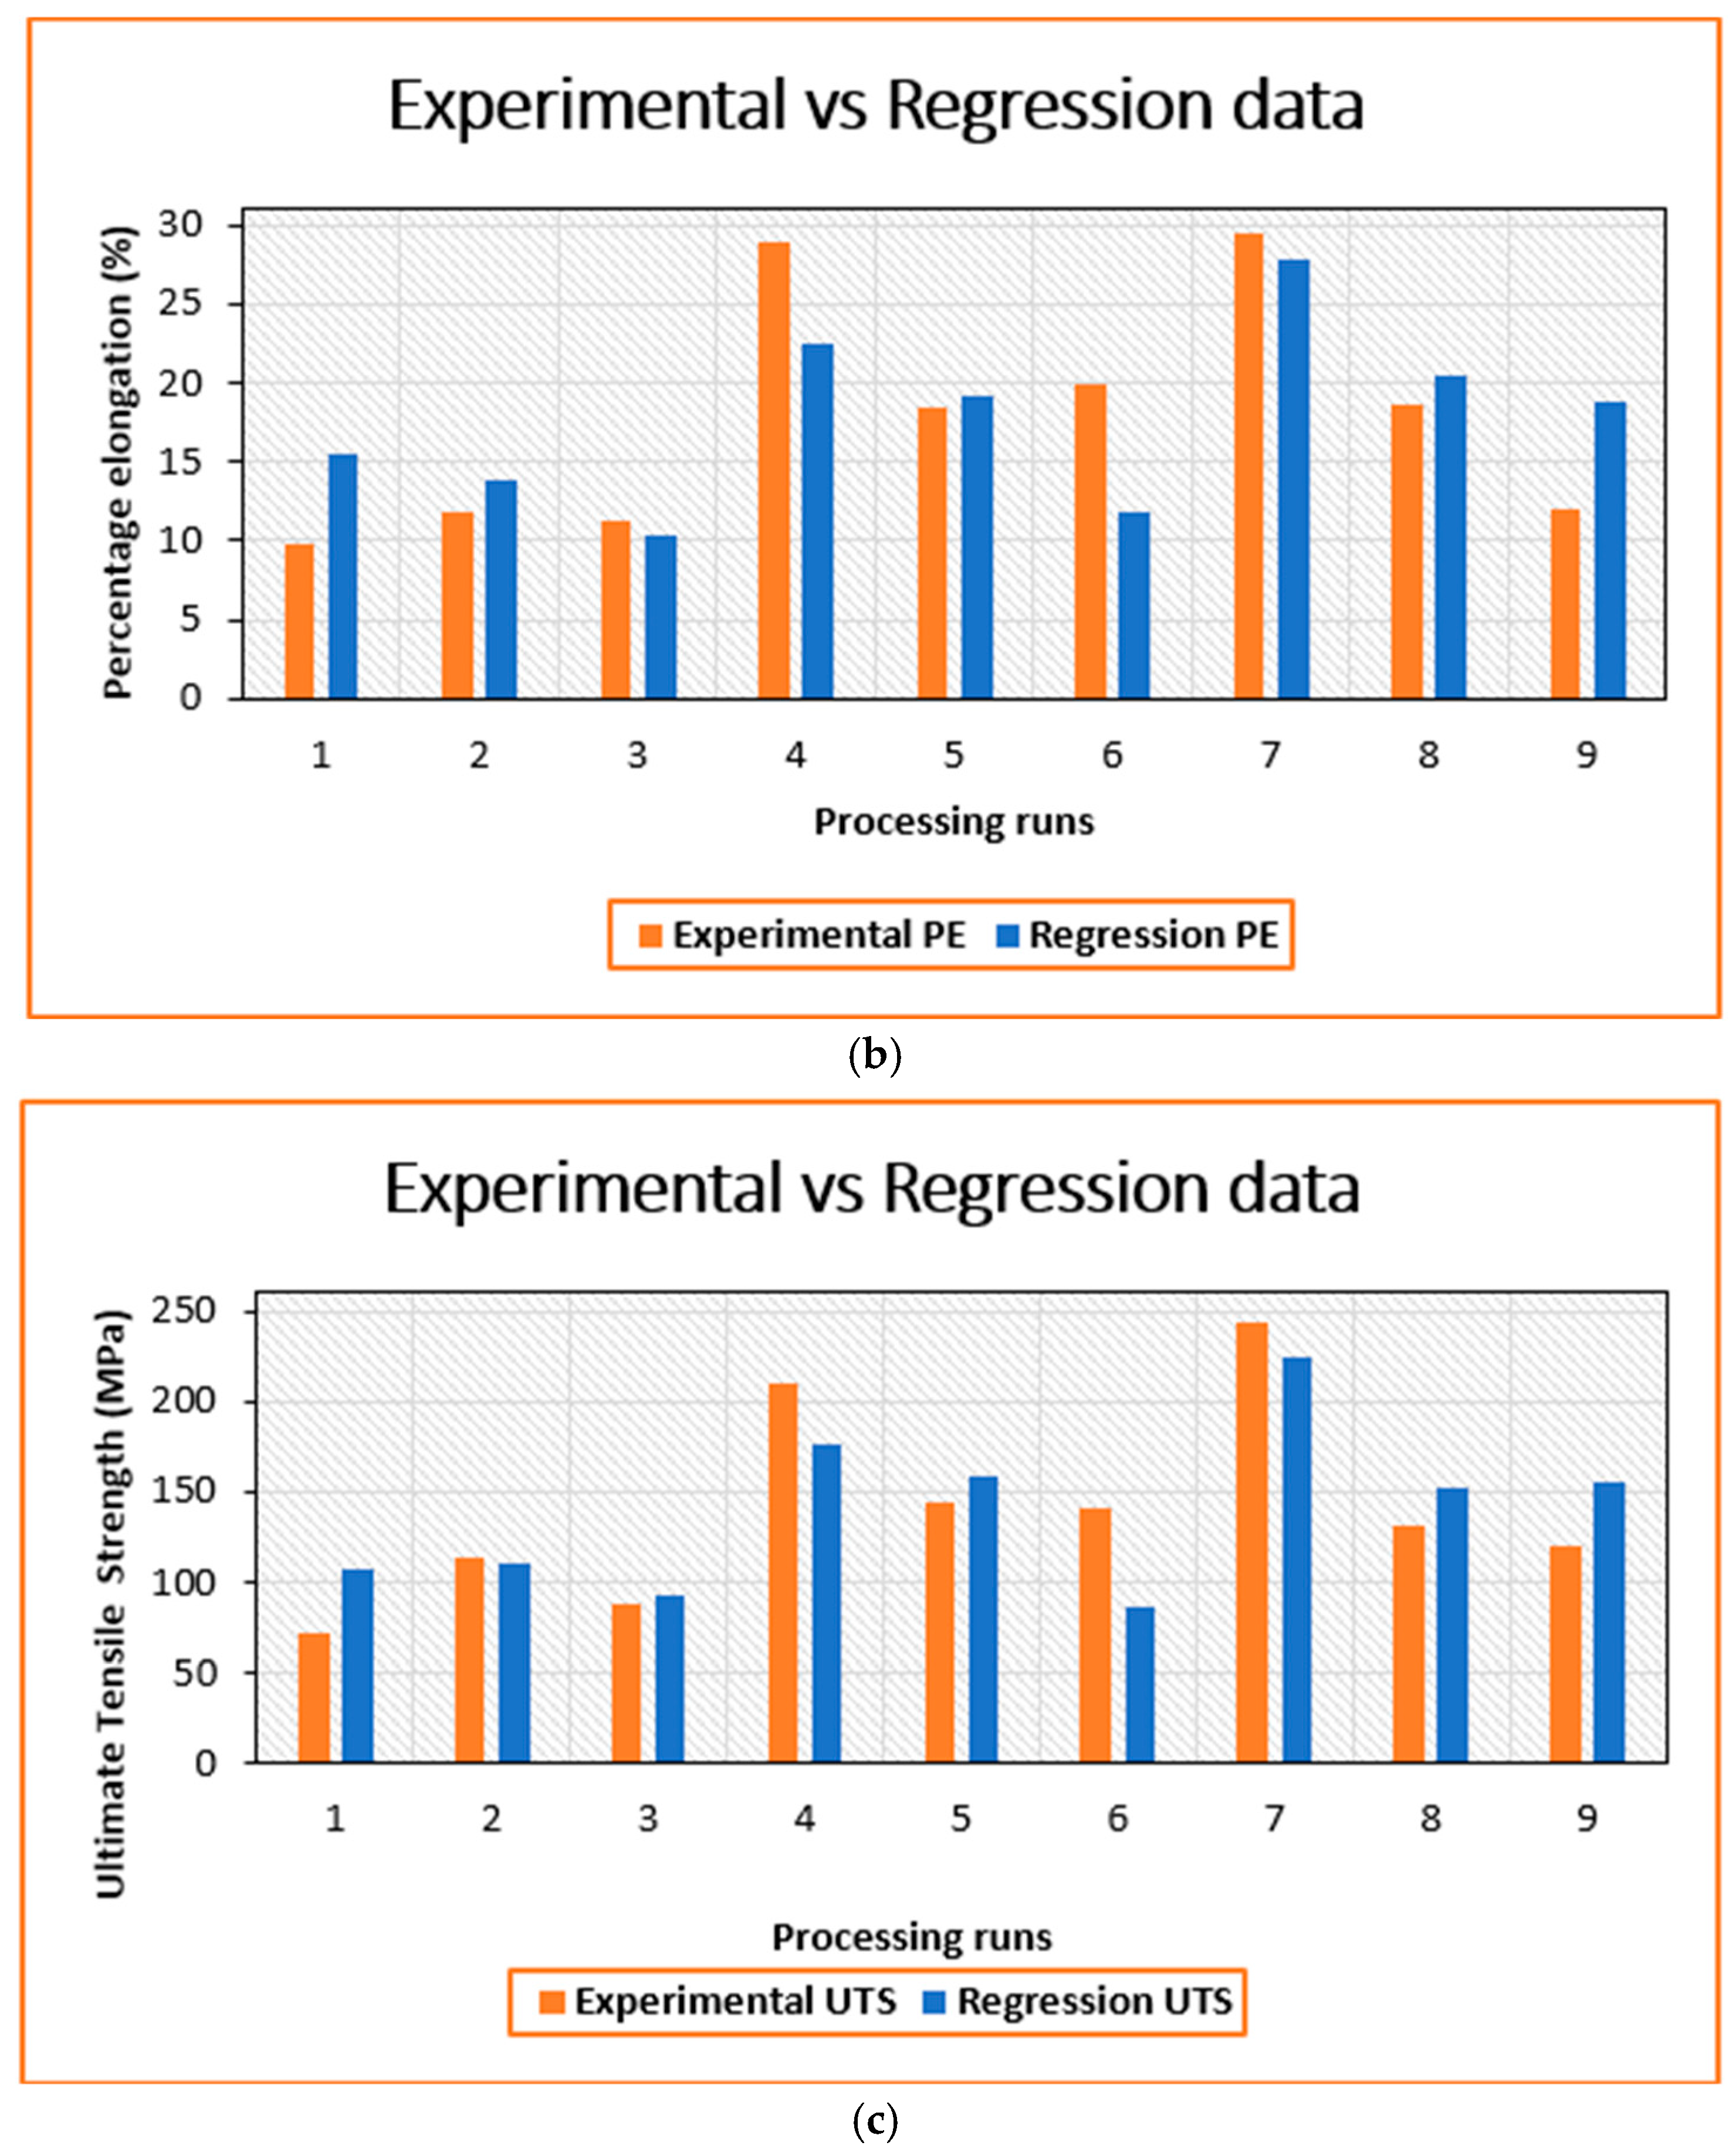
3.1.3. Comparison Plots of Regression-Predicted Values and Investigational Values

The investigative output answers are used to develop the regression equation, which ensures the equivalence between the observed process parameters for FSP. Equations (1)–(3) display the regression equations that yield the maximum hardness, tensile strength, and percentage elongation.
Microhardness (HV): 86.60 + 0.00244 RS (rev/min) + 0.0453 TS (mm per min) − 0.24 TA (deg).
Microhardness shows a positive relationship with both rotational speed (RS) and traverse speed (TS). Higher RS promotes fine grain structures and better dispersion of reinforcements, increasing hardness. Similarly, increased TS results in rapid cooling and refined grains, positively impacting hardness. Conversely, the negative effect of tool tilt angle (TA) suggests that steeper angles may reduce contact pressure or material mixing, slightly compromising hardness. These relationships align with the Hall–Petch effect, where finer grains enhance hardness.
Percentage Elongation (%): 11.7 + 0.01523 RS (rev/min) − 0.280 TS (mm per min) + 3.19 TA (deg).
Percentage elongation, a measure of ductility, increases with rotational speed (RS), albeit at a smaller coefficient than tensile strength. This reflects improved material ductility due to better mixing and reduced defects at higher RS. A negative relationship with traverse speed (TS) suggests that faster tool movement compromises material homogeneity, reducing ductility. The positive impact of tool angle (TA) indicates enhanced material flow and grain refinement, contributing to greater elongation. These trends align with the expected relationship between processing parameters and ductility.
Tensile strength (MPa): 46.9 + 0.1236 RS (rev/min) − 1.94 TS (mm per min) + 44.0 TA (deg).
The model indicates that rotational speed (RS) positively contributes to tensile strength, aligning with the expectation that higher rotational speeds promote better mixing of materials and defect reduction, enhancing strength. Traverse speed (TS) negatively affects tensile strength, likely due to reduced heat input and mixing time at higher speeds, leading to weaker bonding. The tool angle (TA) significantly increases tensile strength, as a higher tool angle improves material flow and consolidation. These effects align with the physical principles governing friction stir processing.
Alignment with Physical Expectations
The developed models effectively represent the known effects of friction stir processing (FSP) parameters on the mechanical characteristics of the material. This consistency with established physical assumptions enhances the credibility and reliability of the models. Higher rotational speeds (RSs) improve material properties by increasing heat input and enhancing mixing, leading to better bonding and defect reduction. Lower traverse speeds (TSs) contribute to improved material homogeneity and bonding but may reduce hardness due to slower cooling rates. Tool tilt angle (TA) plays a critical role in optimizing material flow and grain refinement, significantly enhancing tensile strength and elongation, although it may slightly compromise hardness in certain cases. By accurately capturing these relationships, the models demonstrate their reliability and consistency with established principles in mechanical and materials science, making them effective tools for predicting the properties of SiC composites.
Table 5 displays the results obtained from the regression equations established to examine the mechanical properties of composites made of AA5083 and SiC. This study is further demonstrated in Figure 3, which compares the regression equation predictions with the experimental results for microhardness, % elongation, and tensile strength.

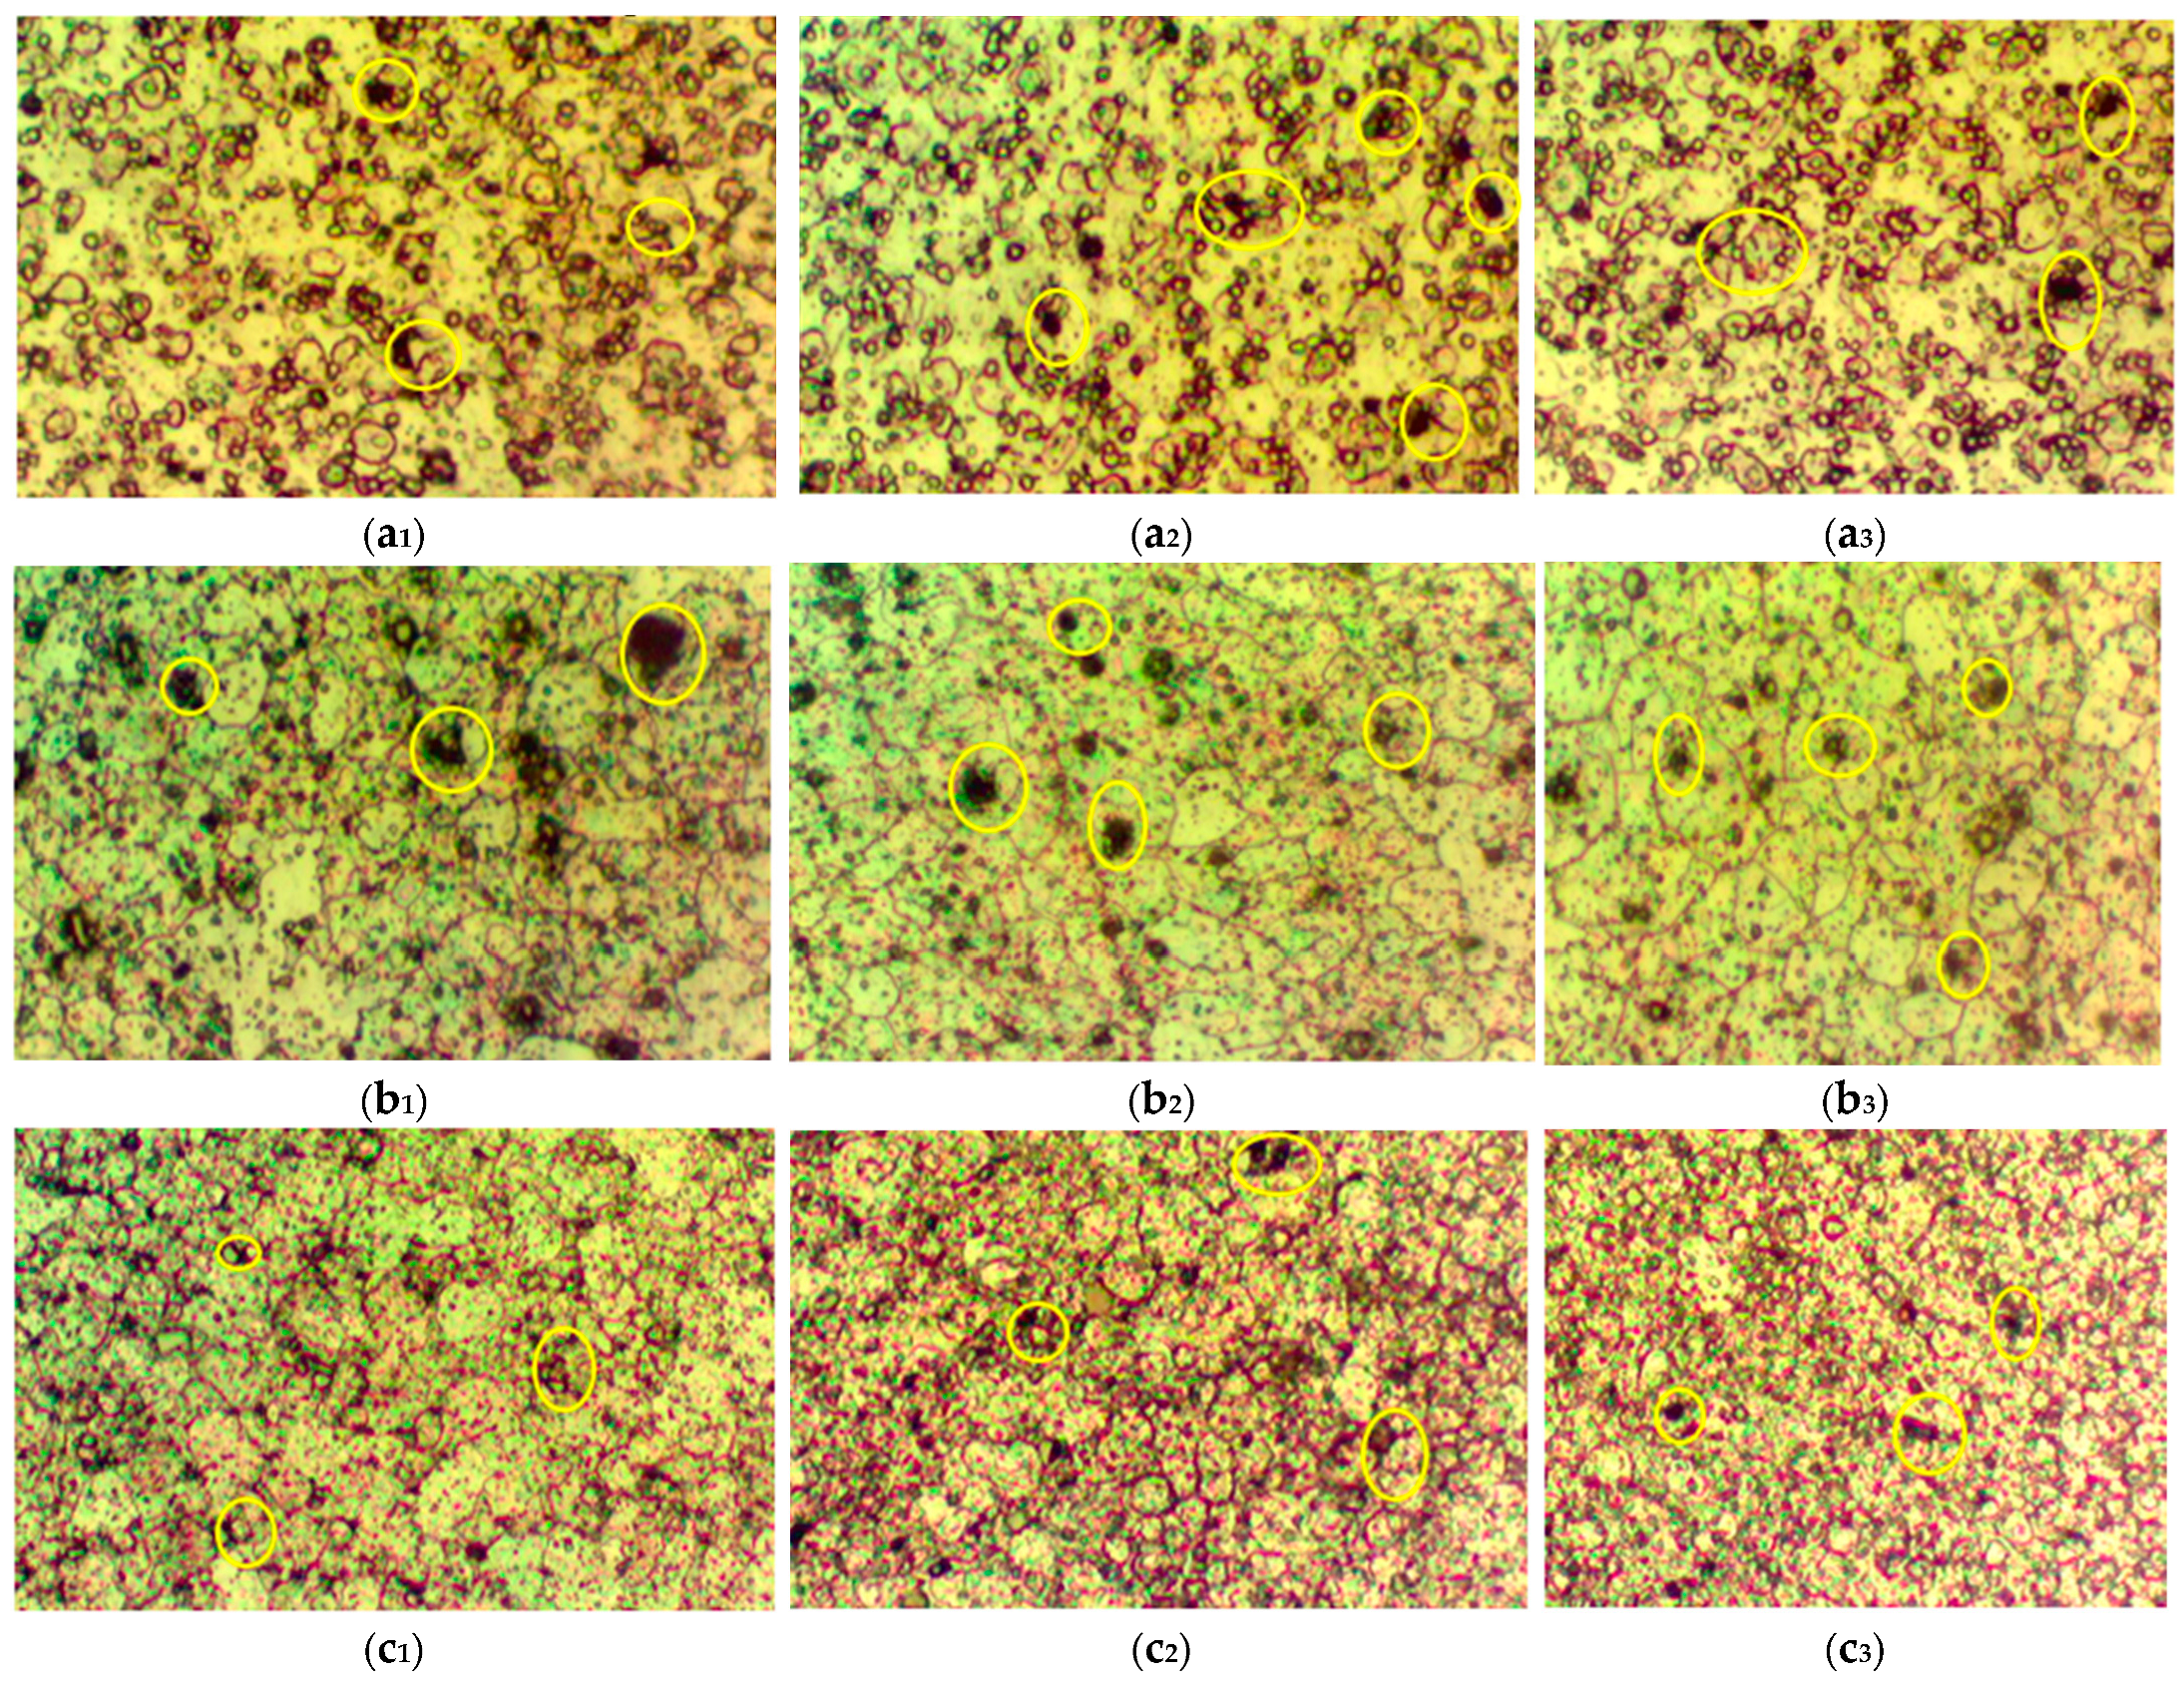
3.2. Microstructural Analysis

The microstructures of the AA5083/SiC composites are illustrated in Figure 4, highlighting the effects of different processing parameters. Figure 4(a1–a3) display the microstructures of composites processed at a rotational speed of 600 rev/min, with traverse speeds of 30, 45, and 60 mm per min and tilt angles of 1°, 1.75°, and 2°, respectively. Similarly, Figure 4(b1–b3) show the microstructures at a higher rotational speed of 900 rev/min, using the same traverse speeds of 30, 45, and 60 mm per min but with tilt angles of 1.75°, 2°, and 1°. Lastly, Figure 4(c1–c3) present the microstructures obtained at 1200 rev/min, where the traverse speeds remain 30, 45, and 60 mm per min but the tilt angles are set at 2°, 1°, and 1.75°, respectively. This systematic comparison provides insight into how variations in rotational speed, traverse speed, and tilt angle influence the microstructural characteristics of the composite material.
Post-weld microstructural analysis, as evidenced by the highlighted regions in Figure 4 (yellow circles), confirmimed the presence of silicon carbide (SiC) particles within the nugget zone; however, only a small fraction of these particles exhibit proper metallurgical bonding with the AA5083 matrix. The weak interfacial bonding also indicated by the yellow circles, can be attributed to insufficient heat generation and material flow constraints during friction stir processing (FSP), which limit the full incorporation of SiC particles into the matrix. This inadequate bonding reduces effective load transfer between the reinforcement and the matrix, ultimately compromising tensile strength and ductility [51,52,53,54,55].
A closer examination of secondary phase particle distribution reveals that SiC particles are not uniformly dispersed throughout the nugget zone, and these results are consistent with observations by [56,57,58]. Instead, regions of agglomeration are observed, where clusters of reinforcement particles accumulate. This nonuniform particle movement creates stress concentration sites that can initiate microcracks, further weakening the composite structure [56,59].
Overall, the images provide insight into the degree of interfacial bonding and particle distribution. In some regions, strong metallurgical bonding between SiC particles and the AA5083 matrix is observed, suggesting effective diffusion at the interface. However, in other areas, gaps and voids exist at the interface, indicating poor adhesion between the matrix and the reinforcement. This suggests that further optimization of FSP parameters, such as multi-pass processing or controlled heat input, may be necessary to achieve a more uniform dispersion and stronger interfacial bonding.

3.3. Interpretation of Experimental Results

3.3.1. Signal-to-Noise (S/N) Ratio Analysis

In single-response optimization, Taguchi’s method is employed for converting the experiment’s result into an evaluation characteristic value for optimal setting analysis. During the operation of any engineering system or process, performance properties are defined as observable responses to the analytical output [60]. To evaluate the effect of each process parameter on these response factors, this study utilized the S/N ratio. The S/N ratio is a key metric in Taguchi’s robust design methodology. It provides a quantitative measure of the signal (desired output) relative to the noise (undesirable variations). By maximizing the S/N ratio, engineers can optimize the process to achieve consistent and robust performance. In this study, the “higher the better” equation was selected as the ideal response for all performance properties (HV, PE, and UTS). This characteristic is appropriate when the objective is to maximize the desired output. The specific formula for calculating the signal-to-noise ratio for the “higher the better” characteristic is given in Equation (4) [61,62]:
S N = 10 log 1 n i 1 3 1 y 2
This may be written as follows: y is the response factor at the experiment’s i-th level, and n is the number of experiment repetitions. Table 6 shows the relationship between the S/N ratios and the mechanical properties test results for the AA5083/SiC composite’s parameter settings. The S/N ratio plotted data are shown in Figure 5.
Figure 5a reveals that the highest microhardness (MH) for the AA5083/SiC composite joints was obtained at a tool tilt angle of 2° (Level 3), a tool traverse speed of 45 mm per min (Level 2), and a tool rotational speed of 900 rev/min (Level 2). Furthermore, Figure 5b demonstrates that the maximum percentage elongation was achieved at a tool tilt angle of 2° (Level 3), a tool traverse speed of 30 mm per min (Level 1), and a tool rotational speed of 900 rev/min (Level 2). Notably, this combination of parameters also resulted in the highest ultimate tensile strength, as depicted in Figure 5c. For UTS and PE, the best results were achieved at 900 rpm tool rotational speed, 30 mm per min tool traverse speed, and a 2° tool tilt angle. For MH, a slightly higher traverse speed of 45 mm per min was required at the same rotational speed and tilt angle. These findings align with previous research [63,64] that has demonstrated improved mechanical properties in metal matrix composites by employing a “larger-is-better” strategy for certain processing parameters.

3.3.2. Determining Optimum Process Parameters and Ranking of Critical Factors

The study used Minitab 18 software to identify the most significant variable influencing the response factor of the manufactured AA5083/SiC composite joint. This program made it possible to determine the mean S/N ratio for each of the three process parameter levels. According to the investigation, the most important factor affecting the three mechanical parameters of microhardness (MH), percentage elongation (PE), and ultimate tensile strength (UTS) was rotating speed. This is evident in Table 7, where rotational speed consistently ranks first in significance. Traverse speed consistently ranked second in influence on all three properties, while tilt angle generally exhibited the least (rank 3) influence. These findings strongly suggest that rotational speed has a significant influence on the mechanical properties of the fabricated composites. This is likely attributed to the crucial role of heat generation during FSP, which influences particle distribution and grain refinement within the material [65,66,67]. The FSP parameters were fine-tuned based on S/N ratio analysis for each parameter. The results of this investigation showed that a tool tilt angle of 2 degrees, a tool traverse speed of 45 mm per minute, and a tool rotational speed of 900 rev/min were the ideal values for optimizing microhardness (MH). However, a slightly lower traverse speed of 30 mm per minute was needed to achieve maximum ultimate tensile strength (UTS) and percentage elongation (PE) while keeping the tool tilt angle (2 degrees) and rotating speed (900 rev/min) constant.

3.3.3. Analysis of Variance (ANOVA)

To determine the statistically significant process parameters, analysis of variance was carried out. Using the percentages and the probability distribution (F-value) of each of the factors allows the extent of influence of each of the parameters on the output responses to be established. The frequency test is carried out in statistics to assess the significance of parameters, which in turn defines the quality of the properties [68]. The results of the ANOVA for the S/N ratios of percentage elongation, ultimate tensile strength, and microhardness are presented in Table 8, Table 9 and Table 10, respectively. From the estimated percentages in Table 8, tool rotational speed was found to contribute significantly to UTS at 57.55%, tilt angle contributed 12.58%, and traverse speed contributed 11.32%. The authors also observed some differences between the rankings provided in Table 7 and the percentage contributions in Table 8. This could help address the aforementioned inconsistencies with more specific statistics, specifically confidence intervals and replicate experiments. This means that, when it comes to the choice of methods for analysis, objectivity should be paired with the characteristics of the collected data.
Percentage elongation (PE) depends on tool rotational speed, traverse rate, and tool tilt angle with contribution percentages of 60.36, 16.62, and 3.54 percent, respectively, as seen in Table 9. These contributions are in the same percentages as supported by the F-value analysis. Further, Table 10 demonstrates that the factors—tool rotational speed, traverse rate, and tool tilt angle—significantly influence microhardness. Collectively, these factors account for 93.51% of the observed variations in microhardness, with rotational speed contributing 48.17%, traverse speed contributing 27.54%, and tilt angle contributing 17.78%. According to these findings, the most important element influencing the final material’s UTS, PE, and MH is the tool’s rotating speed.
Accordingly, other researchers have reported that the tool rotational speed has the most significant influence on the microhardness, which is consistent with this work. These researchers include Chanakyan et al. [66], Syed et al. [67], and Butola et al. [68]. Chanakyan et al. [66], Syed et al. [67], Salehi et al. [69], and Puviyarasan et al. [70] also found that the key element influencing microhardness was the tool’s rotational speed. Because of the significant impact that rotating speed has on mechanical characteristics, heat production is essential for promoting grain refining and maintaining particle uniformity. According to ANOVA, it was also shown that rotating speed had the greatest impact on the alloy’s UTS, PE, and MH, demonstrating the rotational speed’s practical influence on the alloy’s mechanical properties. Additionally, in comparison to random error, a parameter that has a larger F-value contributes more significantly to the variance in mechanical properties. A high F-value for rotational speed indicated that it had a significant impact on these properties.
Interpretation of ANOVA Data
The amount of overall variance in an experiment that can be attributed to each significant component is shown by the percentage contribution. The ability of each element to reduce variance is demonstrated by this, which is derived from the sum of squares of the major factors. Consequently, by controlling the factor levels with measurement precision, the research can decrease the total spread by the percentage of the contribution [71]. The contribution based on ANOVA is represented in percentage in Figure 6. Rotational speed has a considerable impact on UTS, PE, and MH with a percentage contribution of 58%, 60%, and 48% according to the ANOVA findings of the signal-to-noise ratio displayed in the crosstab. The ranking based on the table and the contribution percentages are also correlated with the F-value analysis. These findings demonstrate the significant impact of tool rotation speed on output reactions. Grain refining and achieving the required particle distribution both benefit from heat production because of the relative significance of rotating speed in microhardness [65,66,67].
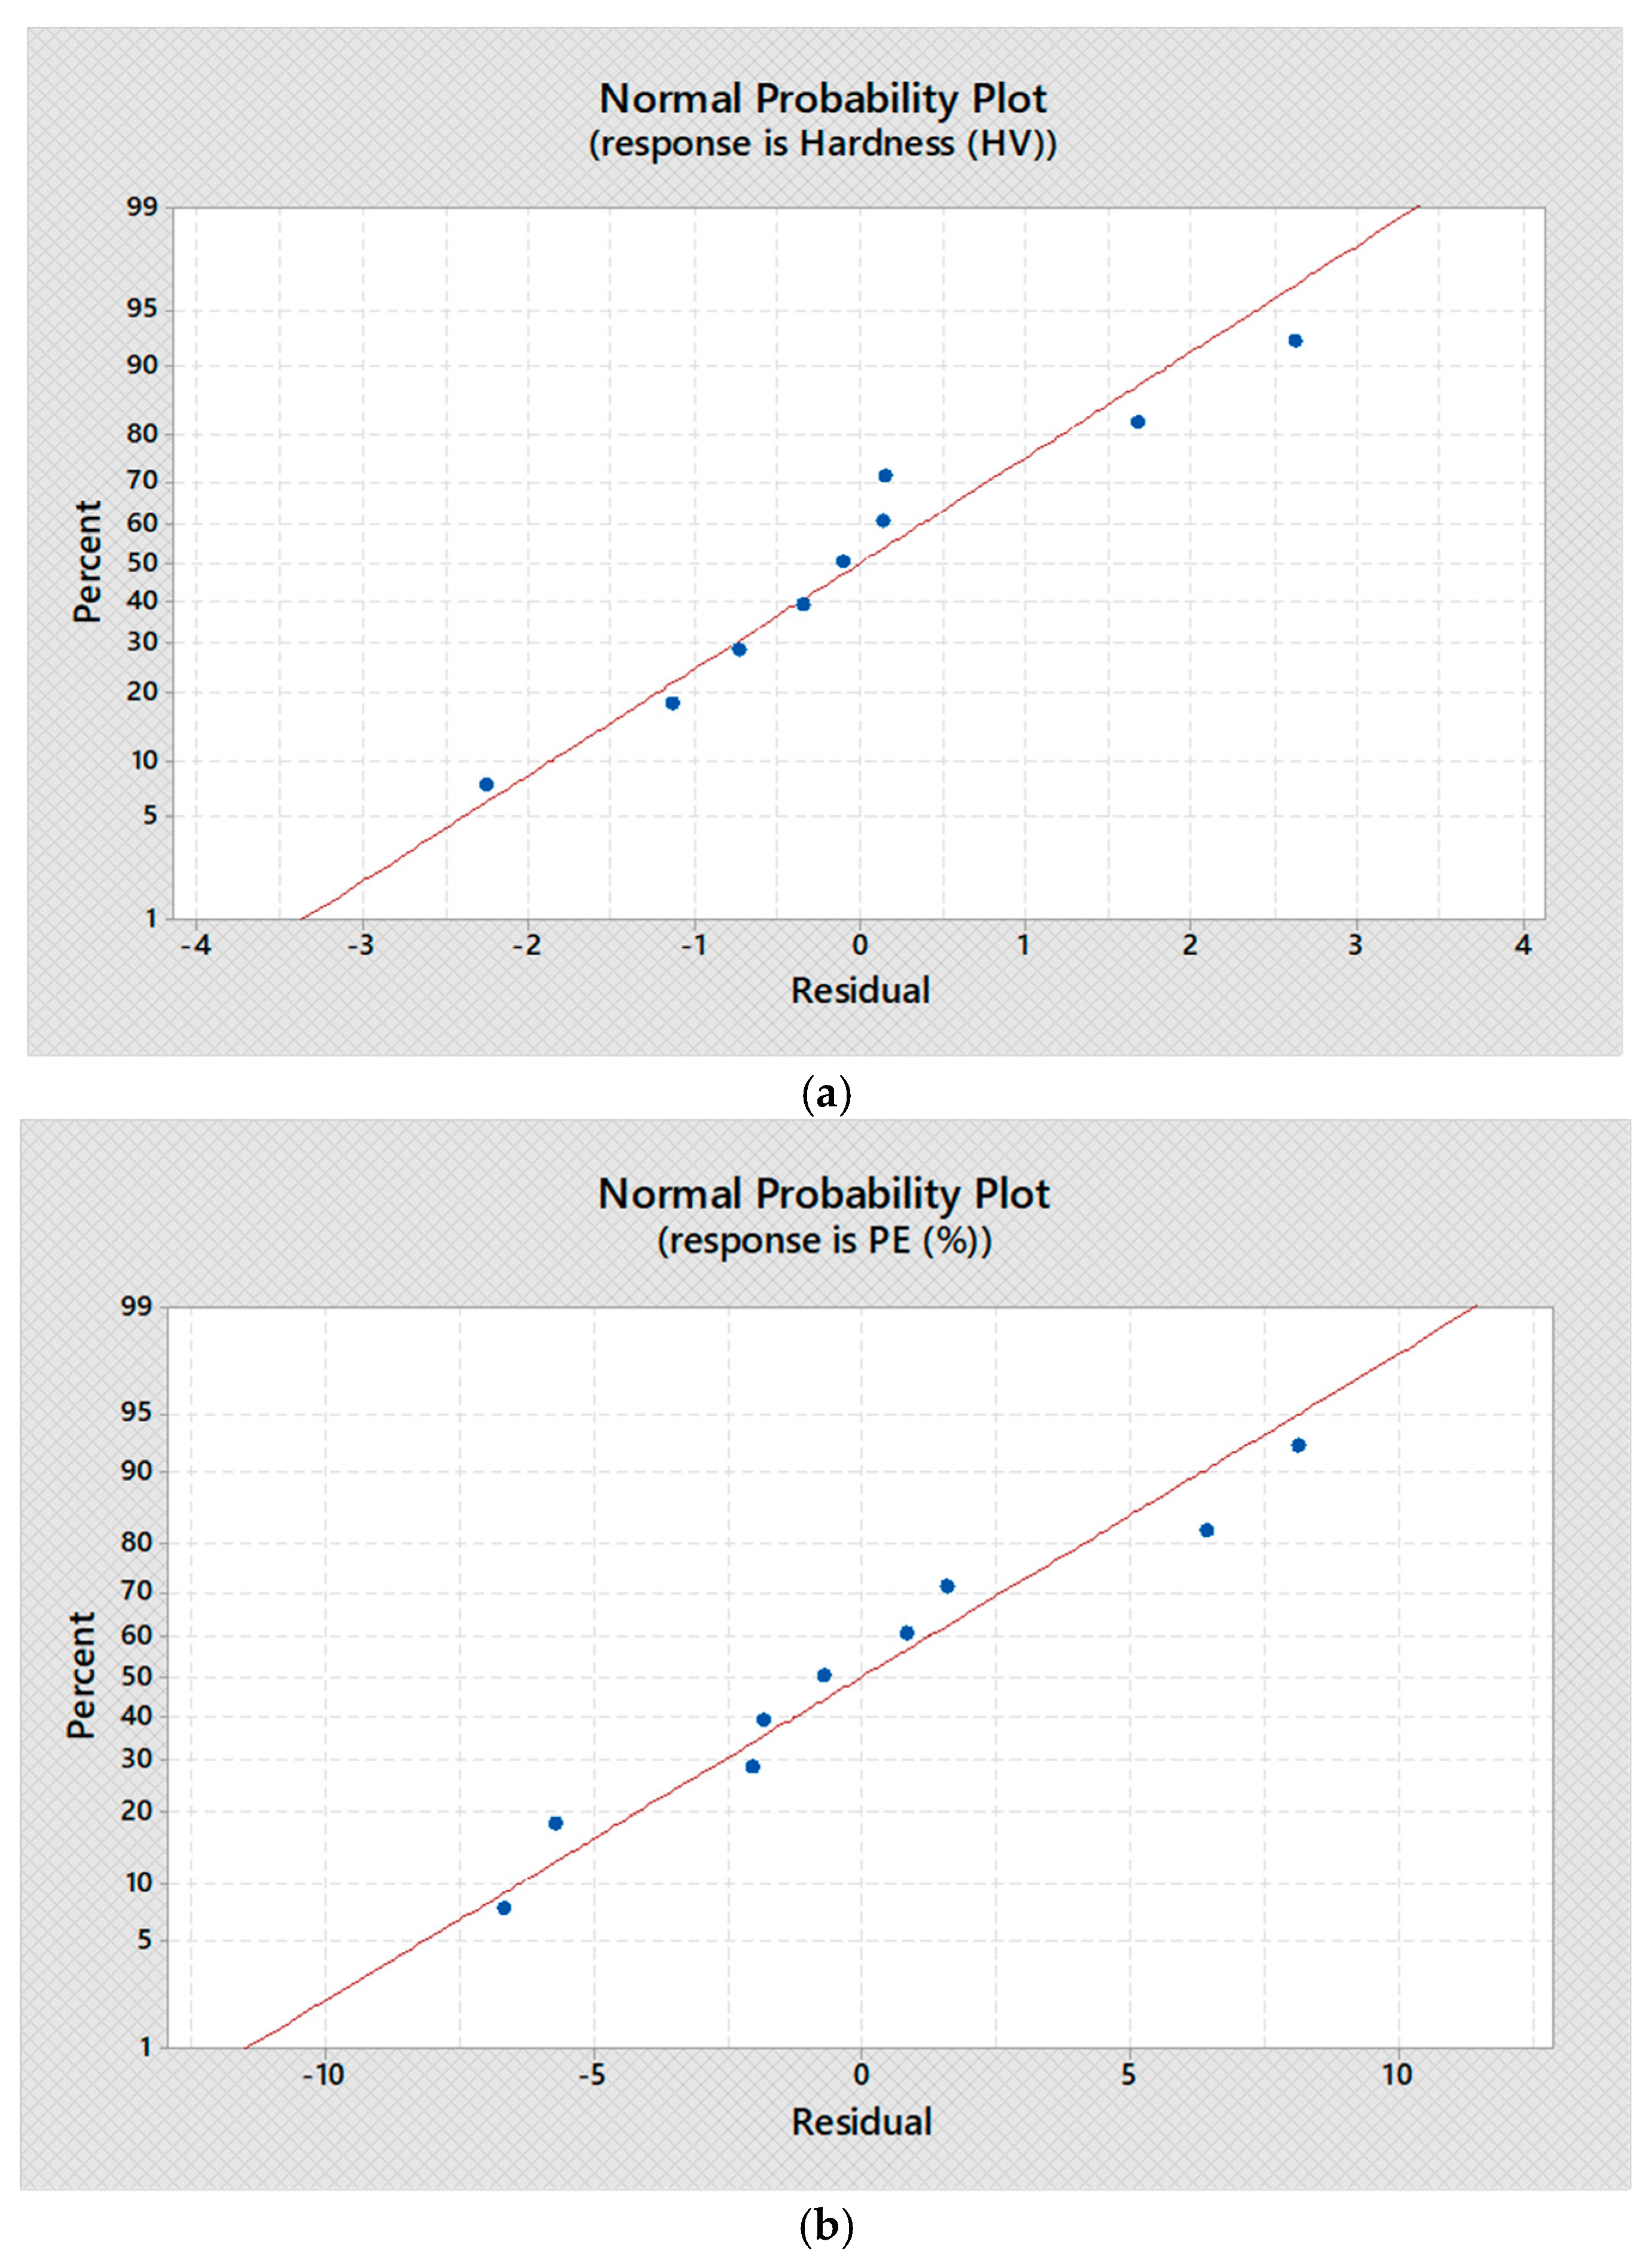
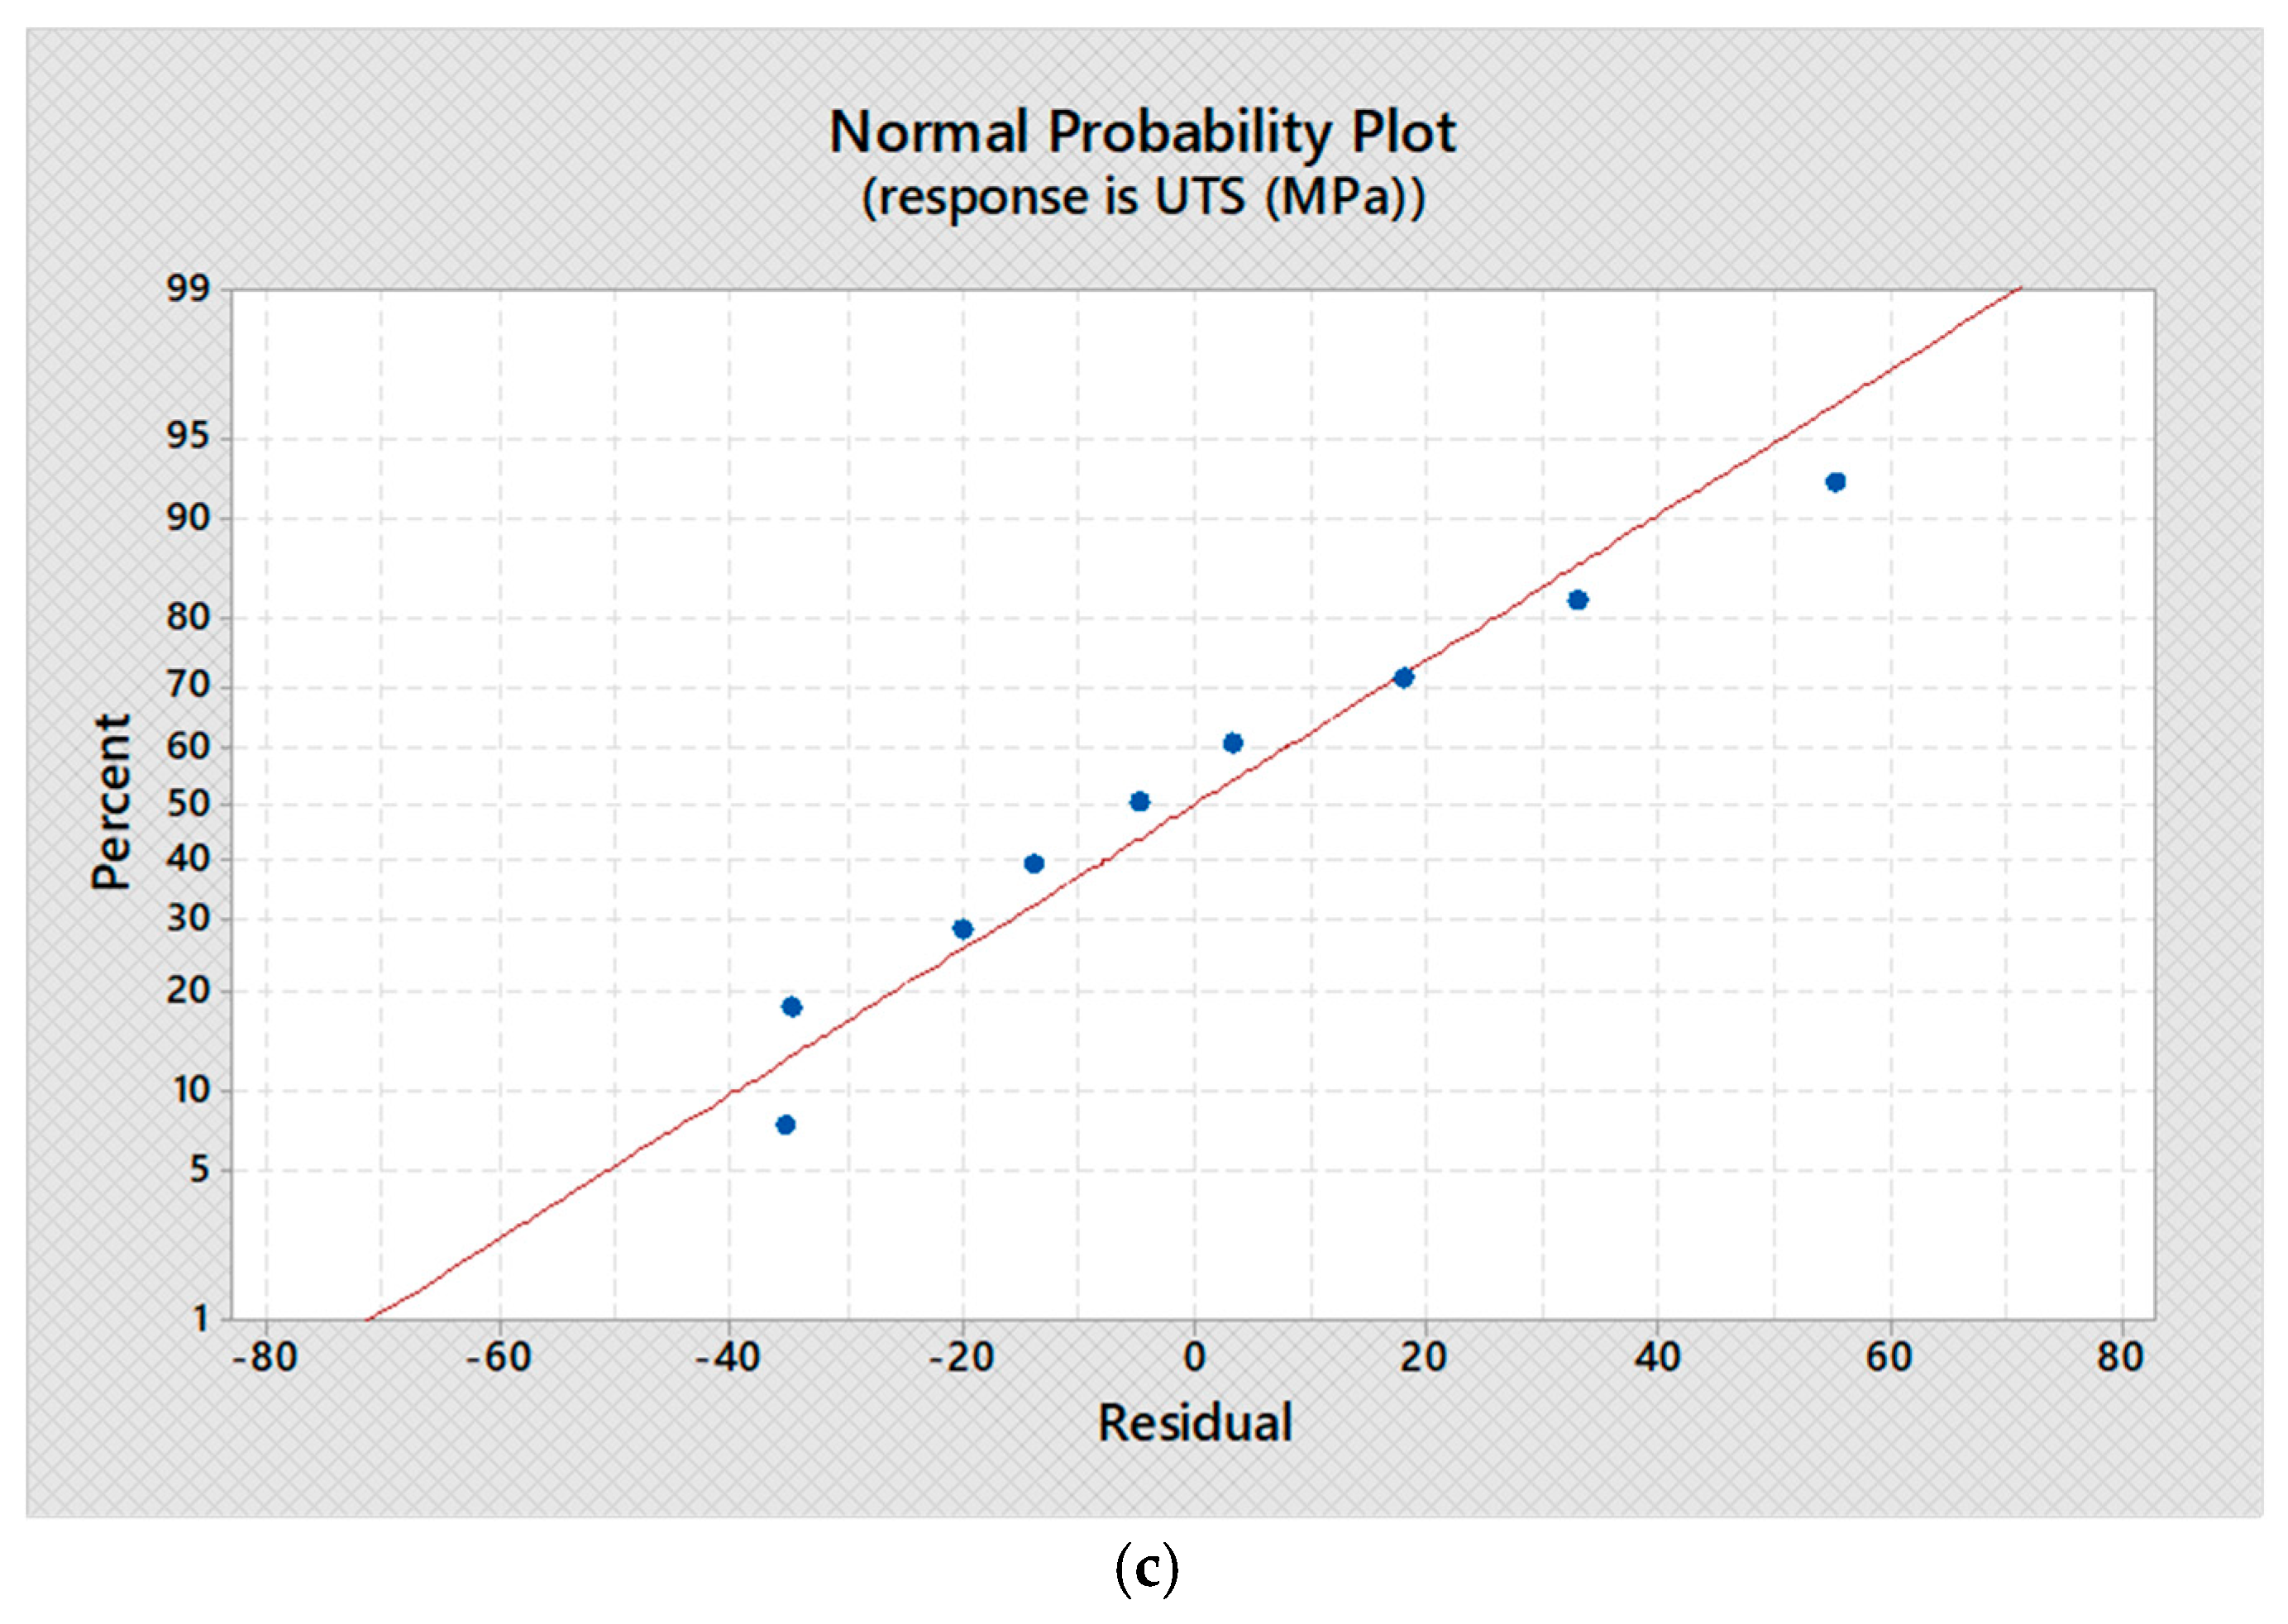
Normal Probability Plot
To assess the prediction accuracy of models created for AA5083/SiC composites’ microhardness (MH), percentage elongation (PE), and ultimate tensile strength (UTS), residual analysis is essential (see Figure 7). Researchers can evaluate the validity and dependability of their models by looking at the residuals, or the disparities between the values predicted by the model and the experimental values. In MH, a well-distributed residual pattern reflects effective hardness predictions, while significant deviations may signal experimental or modeling errors. For PE, randomly scattered residuals suggest accurate ductility predictions, with deviations highlighting biases or unaccounted factors. For UTS, a straight-line pattern in the normal probability plot confirms normality and reliable predictions, while deviations may indicate outliers or model inaccuracies. This analysis ensures model robustness and reliable predictions for critical mechanical properties.
In conclusion, the residual analysis conducted for MH, PE, and UTS provides strong evidence for the reliability and validity of the predictive models used in this study. A close alignment of residuals with the assumptions of normality and randomness enhances confidence in the experimental results. Any deviations observed in the residuals provide valuable insights for refining the model, addressing experimental anomalies, and improving the overall predictive accuracy of the research. These results are consistent with earlier research [72,73,74,75,76] that highlighted the use of normal probability plots to guarantee the reliability and validity of statistical models.

3.4. Confirmation Test

The identified optimal process parameters-a tool rotational speed of 900 rev/min, a tool traverse speed of 30 mm per min, and a tool tilt angle of 2 degrees [77]-were validated through a series of confirmation tests. Three confirmation tests were conducted on AA5083/SiC composites using these optimal settings. The average UTS obtained in these tests was 275 MPa, with the highest ultimate force recorded at 10,000 N. To investigate the influence of traverse speed on MH, additional confirmation tests were performed using a tool traverse speed of 45 mm per minute while maintaining a tool rotational speed of 900 rev/min and a tool tilt angle of 2 degrees [77]. Three confirmation tests were also conducted under these conditions. The average UTS in this case was found to be 260 MPa. with the highest ultimate force recorded at 9000 N. All of the obtained average UTS values were higher than the UTS in Table 4 but remained marginally lower than the base material.
Based on average response values, a tool tilt angle of 2°, traverse speed of 30 mm/min, and rotational speed of 900 rpm were identified as optimal for producing AA5083/SiC composites. Confirmation tests validated the initial experimental results, demonstrating improved mechanical properties with these optimized parameters. While the Taguchi method aims to identify the best-performing parameter combination and typically yields improved UTS, achieving values exceeding the base material’s strength often requires further refinement. The optimization process, utilizing S/N ratio analysis and ANOVA, pinpoints factor levels positively influencing UTS, and experimental validation at these settings confirms the model’s predictive accuracy in achieving enhanced properties.

4. Conclusions

Friction stir processing and the Taguchi L9 factorial approach were successfully applied in this work to maximize AMMC fabrication. An aluminum metal matrix composite (AMMC) was effectively created in this study by reinforcing an AA5083 aluminum matrix with silicon carbide particle powder. To maximize the tensile strength and hardness of the final AA5083/SiC composite, the Taguchi approach was utilized to determine the ideal process parameters. The Taguchi approach enabled the following discoveries:
  • The ultimate tensile strength of 311 MPa for the base AA5083 material was higher than the greatest experimental tensile strength of 243 MPa for the AA5083/SiC composite. The inclusion of reinforcing silicon carbide particle powder reduced the composite’s ductility, even though it showed other mechanical properties that were higher than those of the base material, and this was due to particle agglomeration.
  • The base material AA5083’s hardness of 93.07 HV was surpassed by the experimental microhardness of the AA5083/SiC composite, which maxed at 94.80 HV. By adding reinforcements, the composite’s hardness increased above that of the base material. Grain refinement, particle dispersion, intermetallic particle fracture, and recrystallization are some of the factors that are attributed to the increase.
  • According to the investigation, when the AA5083/silicon carbide composite joints were operated at 900 rev/min, 45 mm per minute traverse speed, and a tilt angle of 2 degrees, the greatest microhardness (MH) was generated. However, to maximize both ultimate tensile strength (UTS) and percentage elongation (PE), a slightly lower traverse speed of 30 mm per minute at the same rotational speed and tilt angle is needed.
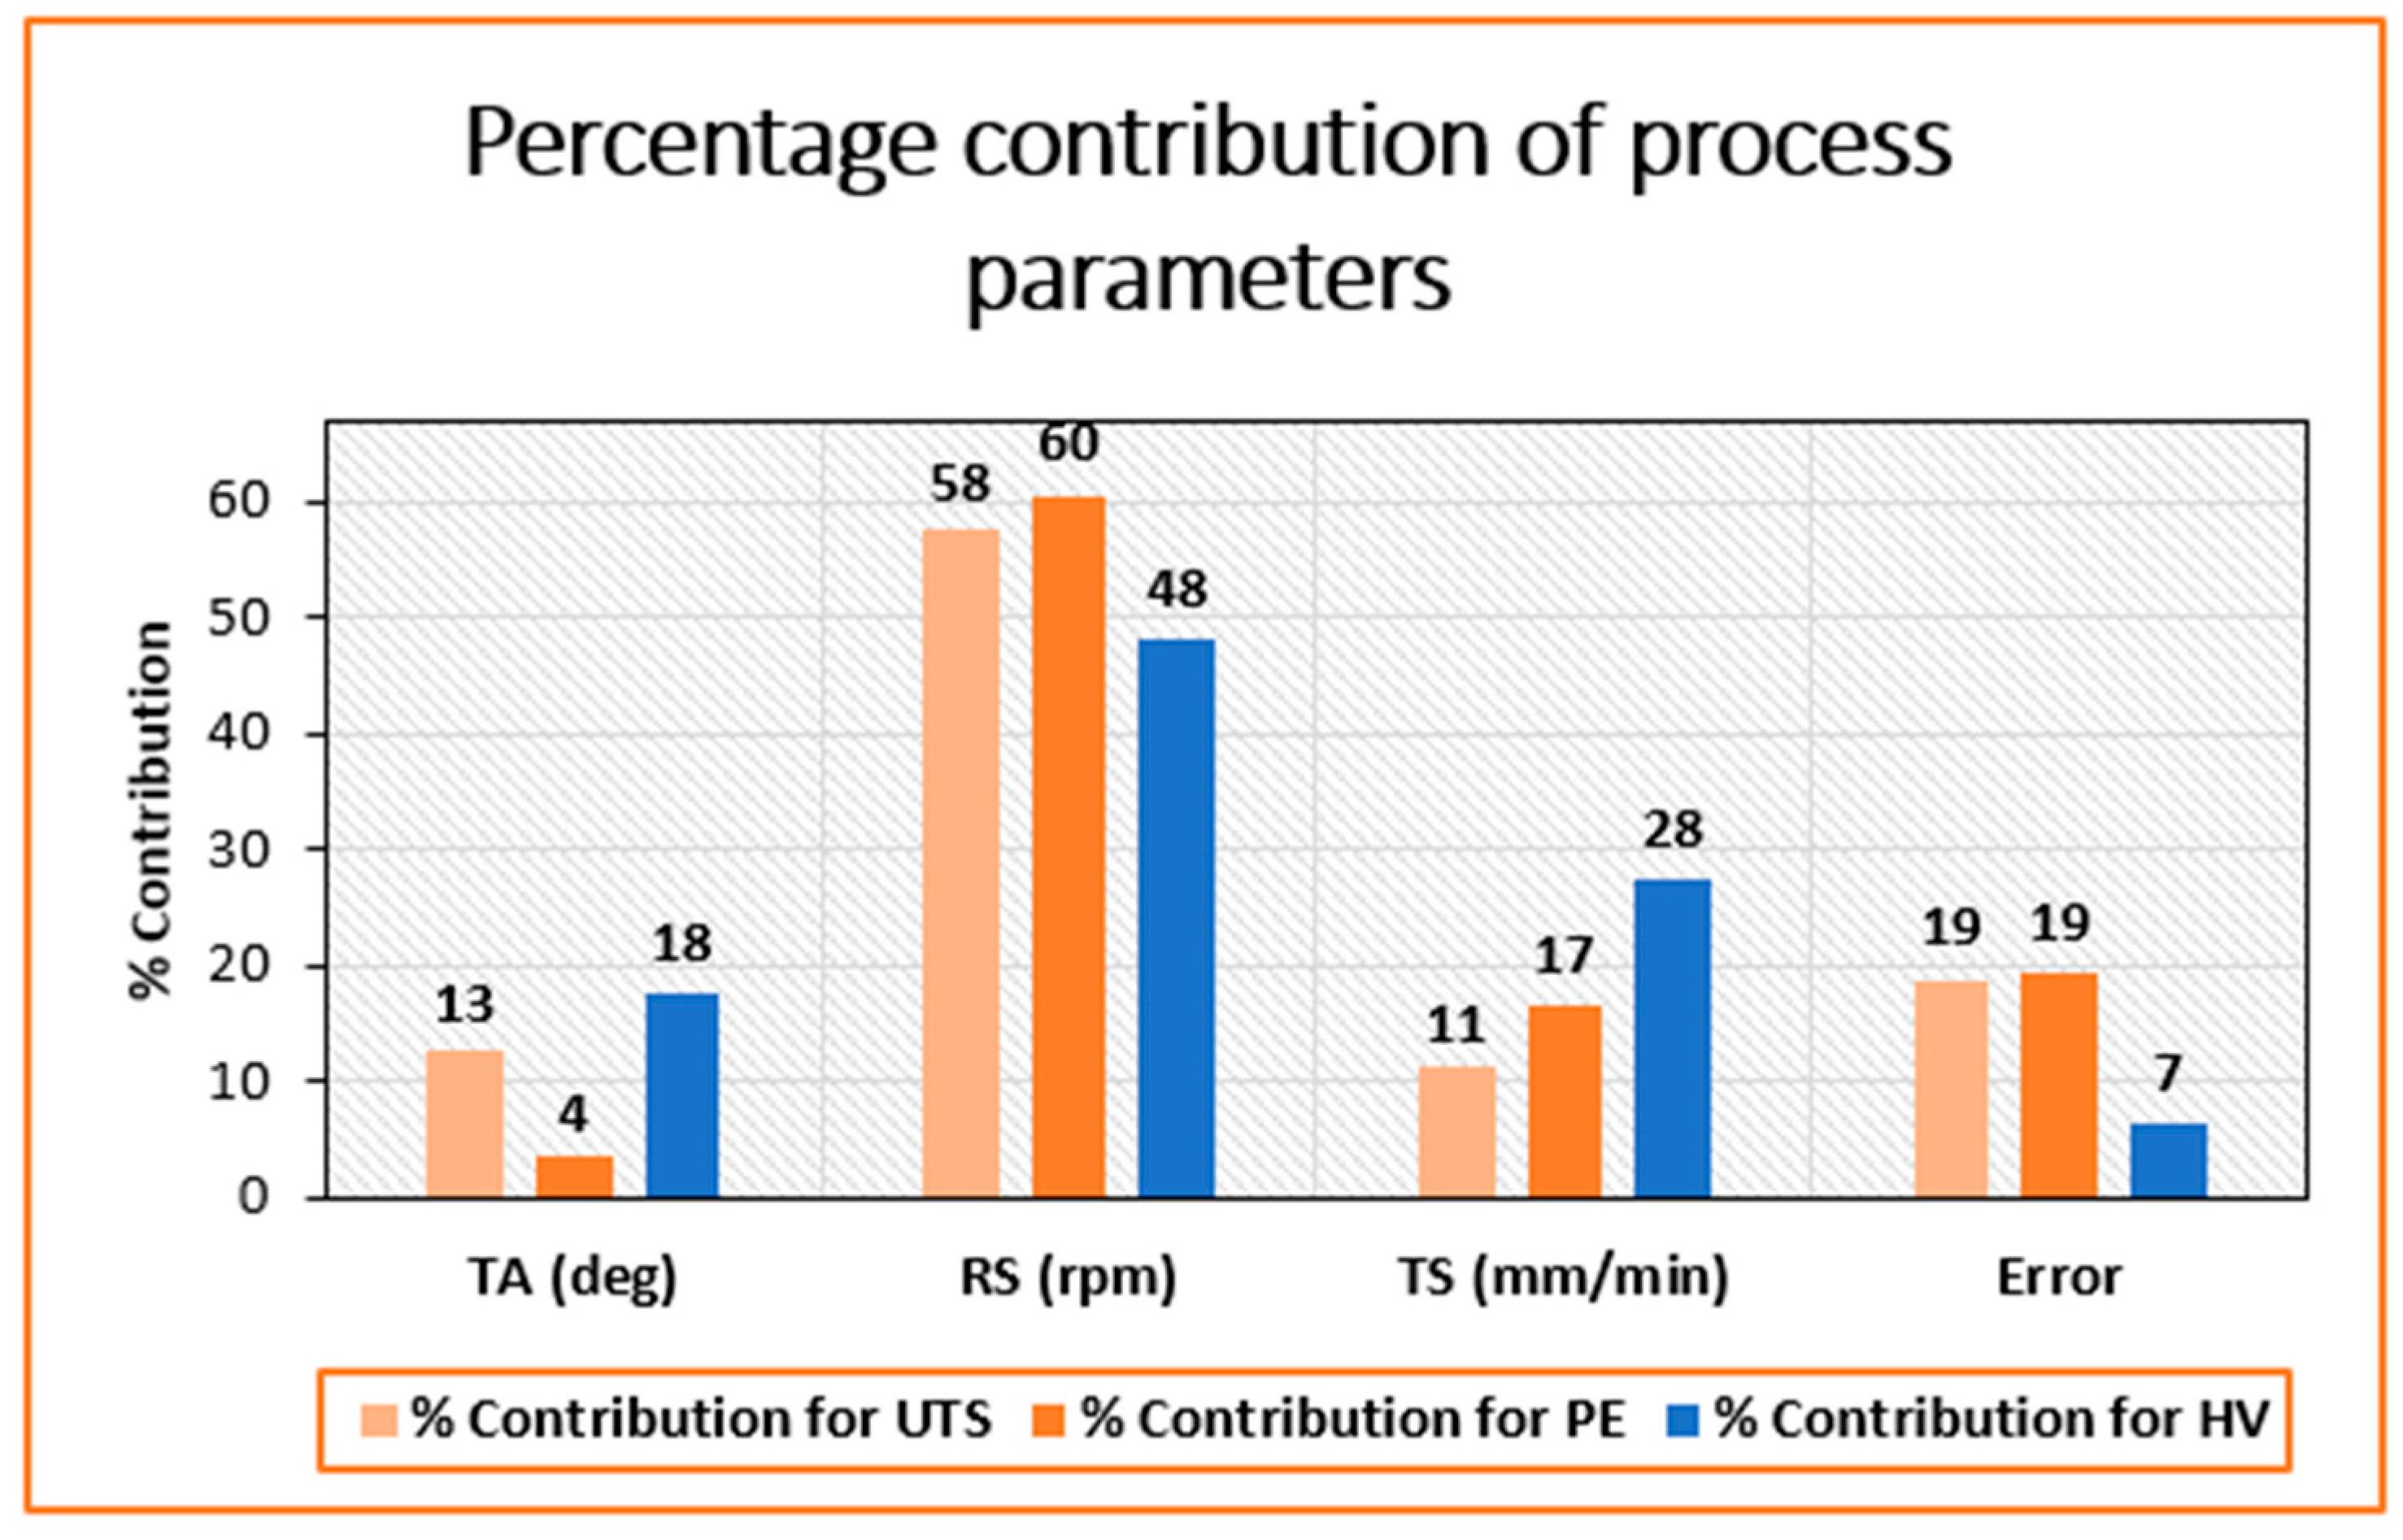
  • According to the ANOVA results of the S/N ratio shown in the crosstab, rotational speed significantly affects UTS, PE, and MH, contributing 58%, 60%, and 48% of the total. These results show that tool rotation speed has a major effect on output responses.
  • The experimental design and the range of parameters utilized in this study may limit the generalizability of the developed regression models. However, despite these limitations, the models still provide valuable predictive estimations. Future studies should investigate adding interaction factors to the regression models to better understand the complex relationships between FSP parameters and mechanical properties. Additionally, more sophisticated regression techniques, such as response surface methodology, could be employed to provide more comprehensive and accurate predictions.

5. Limitations of the Study

While this study successfully optimized friction stir processing (FSP) parameters for AA5083/SiC composites using the Taguchi L9 method, several limitations must be acknowledged. Firstly, the study focused on single-pass FSP, which may have limited the uniform dispersion of SiC reinforcement particles, leading to agglomeration and weak interfacial bonding in certain regions. A multi-pass approach could further refine the microstructure and improve mechanical properties.
Secondly, the absence of high-magnification SEM analysis of the fractured surfaces limits a deeper understanding of fracture mechanisms, particularly how particle–matrix bonding failure influences mechanical performance. Additionally, this study primarily evaluated tensile strength, microhardness, and elongation, but impact toughness, fatigue strength, and wear resistance were not examined, which are crucial for industrial applications.
Furthermore, while yield strength (YS) and percentage elongation (PE) were included in Table 4, other important performance indicators, such as elastic modulus, were not assessed due to experimental constraints. The elastic modulus is a key parameter for understanding the composite’s load-bearing capacity and stiffness, and its absence may limit the comprehensive evaluation of the material’s mechanical behavior.

6. Future Prospects

Future research should explore multi-pass FSP to enhance particle dispersion and improve mechanical properties. Additionally, incorporating different reinforcement materials, such as hybrid ceramic reinforcements, could be investigated to achieve a better balance of strength, toughness, and wear resistance.
Further studies should also examine the fatigue behavior, corrosion resistance, and tribological performance of the composites to assess their suitability for real-world engineering applications. The effect of postprocessing heat treatments and alternative SiC volume fractions should be explored to optimize the microstructural characteristics further.
Moreover, future work should include elastic modulus measurements through nanoindentation testing or dynamic mechanical analysis (DMA) to provide a complete assessment of the composite’s stiffness and energy absorption properties. Additionally, a more detailed fracture mechanics study, including fracture toughness and impact strength, would further enhance the understanding of the material’s structural integrity under different loading conditions.

Author Contributions

Conceptualization, V.M.; methodology, S.M.; software, O.M.; validation, O.M., V.M. and S.M.; formal analysis, S.M.; investigation, O.M.; resources, V.M.; data curation, S.M. and O.M.; writing original draft, O.M.; writing—review and editing, S.M. and V.M.; visualization, O.M.; supervision, V.M. and S.M.; project administration, V.M. All authors have read and agreed to the published version of the manuscript.

Funding

This research received no external funding.

Data Availability Statement

The original contributions presented in this study are included in the article. Further inquiries can be directed to the corresponding author.

Acknowledgments

Sincere thanks are extended by the authors to the Cape Peninsula University of Technology (CPUT) for kindly granting them unrestricted access to the tools required for this study.

Conflicts of Interest

The authors declare no conflicts of interest.

References

  1. Idusuyi, N.; Olayinka, J.I. Dry sliding wear characteristics of aluminium metal matrix composites: A brief overview. J. Mater. Res. Technol. 2019, 8, 3338–3346. [Google Scholar] [CrossRef]
  2. Senthilkumar, M.; Saravanan, S.D.; Shankar, S. Dry sliding wear and friction behavior of aluminum–rice husk ash composite using Taguchi’s technique. J. Compos. Mater. 2015, 49, 2241–2250. [Google Scholar] [CrossRef]
  3. Reeb, A.; Walter, V.; Schulze, V.; Weidenmann, K.A. Characterization of a hybrid Al2O3–aluminum matrix composite manufactured via composite extrusion. J. Compos. Mater. 2016, 50, 1099–1108. [Google Scholar] [CrossRef]
  4. Mistry, J.M.; Gohil, P.P. An overview of diversified reinforcement on aluminum metal matrix composites: Tribological aspects. Proc. Inst. Mech. Eng. Part J J. Eng. Tribol. 2017, 231, 399–421. [Google Scholar] [CrossRef]
  5. Nathan, S.R.; Suganeswaran, K.; Kumar, S.; Thangavel, P.; Gobinath, V.K. Investigations on microstructure, thermo-mechanical and tribological behavior of graphene oxide reinforced AA7075 surface composites developed via friction stir processing. J. Manuf. Process. 2023, 90, 139–150. [Google Scholar] [CrossRef]
  6. Gan, W.Y.; Zheng, Z.; Zhang, H.; Tao, P. Evolution of microstructure and hardness of aluminum after friction stir processing. Trans. Nonferrous Met. Soc. China 2014, 24, 975–981. [Google Scholar] [CrossRef]
  7. Sohn, Y.H.; Patterson, T.; Hofmeister, C.; Kammerer, C.; Mohr, W.; Van Den Bergh, M.; Shaeffer, M.; Seaman, J.; Cho, K. Tailoring microstructure and properties of hierarchical aluminum metal matrix composites through friction stir processing. JOM 2012, 64, 234–238. [Google Scholar] [CrossRef]
  8. Liu, Z.Y.; Xiao, B.L.; Wang, W.G.; Ma, Z.Y. Singly dispersed carbon nanotube/aluminum composites fabricated by powder metallurgy combined with friction stir processing. Carbon 2012, 50, 1843–1852. [Google Scholar] [CrossRef]
  9. El Rayes, M.M.; El Danaf, E.A.; Soliman, M.S. High-temperature deformation and enhanced ductility of friction stir processed-7010 Aluminum Alloy. Mater. Des. 2011, 32, 1916–1922. [Google Scholar] [CrossRef]
  10. Pradeep, S.; Pancholi, V. Effect of microstructural inhomogeneity on superplastic behaviour of multipass friction stir processed aluminium alloy. Mater. Sci. Eng. A 2013, 561, 78–87. [Google Scholar] [CrossRef]
  11. Borrego, L.P.; Costa, J.D.; Jesus, J.S.; Loureiro, A.R.; Ferreira, J.M. Fatigue life improvement by friction stir processing of 5083 aluminium alloy MIG butt welds. Theor. Appl. Fract. Mech. 2014, 70, 68–74. [Google Scholar] [CrossRef]
  12. Costa, J.D.M.; Jesus, J.S.; Loureiro, A.; Ferreira, J.A.M.; Borrego, L.P. Fatigue life improvement of mig welded aluminium T-joints by friction stir processing. Int. J. Fatigue. 2014, 61, 244–254. [Google Scholar] [CrossRef]
  13. Karthikeyan, L.; Senthilkumar, V.S.; Padmanabhan, K.A. On the role of process variables in the friction stir processing of cast aluminum A319 alloy. Mater. Des. 2010, 31, 761–771. [Google Scholar] [CrossRef]
  14. Mahmoud, T.S. Surface modification of A390 hypereutectic Al–Si cast alloys using friction stir processing. Surf. Coat. Technol. 2013, 228, 209–220. [Google Scholar] [CrossRef]
  15. Mishra, R.S.; Ma, Z.Y.; Charit, I. Friction stir processing: A novel technique for fabrication of surface composite. Mater. Sci. Eng. A 2003, 341, 307–310. [Google Scholar] [CrossRef]
  16. Dinaharan, I.; Murugan, N.; Thangarasu, A. Development of empirical relationships for prediction of mechanical and wear properties of AA6082 aluminum matrix composites produced using friction stir processing. Eng. Sci. Technol. Int. J. 2016, 19, 1132–1144. [Google Scholar] [CrossRef]
  17. Narimani, M.; Lotfi, B.; Sadeghian, Z. Evaluation of the microstructure and wear behaviour of AA6063-B4C/TiB2 mono and hybrid composite layers produced by friction stir processing. Surf. Coat. Technol. 2016, 285, 1–10. [Google Scholar] [CrossRef]
  18. Selvakumar, S.; Dinaharan, I.; Palanivel, R.; Babu, B.G. Characterization of molybdenum particles reinforced Al6082 aluminum matrix composites with improved ductility produced using friction stir processing. Mater. Charact. 2017, 125, 13–22. [Google Scholar] [CrossRef]
  19. Khodabakhshi, F.; Gerlich, A.P.; Simchi, A.; Kokabi, A.H. Hot deformation behavior of an aluminum-matrix hybrid nanocomposite fabricated by friction stir processing. Mater. Sci. Eng. A 2015, 626, 458–466. [Google Scholar] [CrossRef]
  20. Adel Mehraban, F.; Karimzadeh, F.; Abbasi, M.H. Development of surface nanocomposite based on Al-Ni-O ternary system on Al6061 alloy by friction-stir processing and evaluation of its properties. JOM 2015, 67, 998–1006. [Google Scholar] [CrossRef]
  21. Yadav, D.; Bauri, R. Friction stir processing of Al-TiB 2 in situ composite: Effect on particle distribution, microstructure and properties. J. Mater. Eng. Perform. 2015, 24, 1116–1124. [Google Scholar] [CrossRef]
  22. Chen, Z.; Li, J.; Borbely, A.; Ji, G.; Zhong, S.Y.; Wu, Y.; Wang, M.L.; Wang, H.W. The effects of nanosized particles on microstructural evolution of an in-situ TiB2/6063Al composite produced by friction stir processing. Mater. Des. 2015, 88, 999–1007. [Google Scholar] [CrossRef]
  23. Rajan, H.M.; Dinaharan, I.; Ramabalan, S.; Akinlabi, E.T. Influence of friction stir processing on microstructure and properties of AA7075/TiB2 in situ composite. J. Alloys Compd. 2016, 657, 250–260. [Google Scholar] [CrossRef]
  24. Hangai, Y.; Nakano, Y.; Utsunomiya, T.; Kuwazuru, O.; Yoshikawa, N. Drop weight impact behavior of Al-Si-Cu alloy foam-filled thin-walled steel pipe fabricated by friction stir back extrusion. J. Mater. Eng. Perform. 2017, 26, 894–900. [Google Scholar] [CrossRef]
  25. Zangabad, P.S.; Khodabakhshi, F.; Simchi, A.; Kokabi, A.H. Fatigue fracture of friction-stir processed Al–Al3Ti–MgO hybrid nanocomposites. Int. J. Fatigue. 2016, 87, 266–278. [Google Scholar] [CrossRef]
  26. Saini, N.; Dwivedi, D.K.; Jain, P.K.; Singh, H. Surface modification of cast Al-17% Si alloys using friction stir processing. Procedia Eng. 2015, 100, 1522–1531. [Google Scholar] [CrossRef]
  27. Dolatkhah, A.; Golbabaei, P.; Givi, M.B.; Molaiekiya, F. Investigating effects of process parameters on microstructural and mechanical properties of Al5052/SiC metal matrix composite fabricated via friction stir processing. Mater. Des. 2012, 37, 458–464. [Google Scholar] [CrossRef]
  28. Prabhakar, D.A.P.; Shettigar, A.K.; Herbert, M.A.; GC, M.P.; Pimenov, D.Y.; Giasin, K.; Prakash, C. A comprehensive review of friction stir techniques in structural materials and alloys: Challenges and trends. J. Mater. Res. Technol. 2022, 20, 3025–3060. [Google Scholar] [CrossRef]
  29. Yang, Z.; Fan, J.; Liu, Y.; Nie, J.; Yang, Z.; Kang, Y. Strengthening and weakening effects of particles on strength and ductility of SiC particle reinforced Al-Cu-Mg alloys matrix composites. Materials 2021, 14, 1219. [Google Scholar] [CrossRef]
  30. Ye, J.; Chen, X.; Luo, H.; Zhao, J.; Li, J.; Tan, J.; Yang, H.; Feng, B.; Zheng, K.; Pan, F. Microstructure, mechanical properties and wear resistance of Ti particles reinforced AZ31 magnesium matrix composites. J. Magnes. Alloy. 2022, 10, 2266–2279. [Google Scholar] [CrossRef]
  31. Kumaravel, S.; Suresh, P. Optimization of friction stir processing parameters to improve mechanical properties and microstructure of Al5083 aluminum alloy reinforced with AlCoCrFeNiSi high-entropy alloy. Phys. Scr. 2024, 99, 105903. [Google Scholar]
  32. Hang, Z.Y.; Jones, M.E.; Brady, G.W.; Griffiths, R.J.; Garcia, D.; Rauch, H.A.; Cox, C.D.; Hardwick, N. Non-beam-based metal additive manufacturing enabled by additive friction stir deposition. Scr. Mater. 2018, 153, 122–130. [Google Scholar]
  33. Mohan, R.; Jayadeep, U.B.; Manu, R. CFD modelling of ultra-high rotational speed micro friction stir welding. J. Manuf. Process. 2021, 64, 1377–1386. [Google Scholar] [CrossRef]
  34. Rana, H.; Badheka, V. Influence of friction stir processing conditions on the manufacturing of Al-Mg-Zn-Cu alloy/boron carbide surface composite. J. Mater. Process. Technol. 2018, 255, 795–807. [Google Scholar] [CrossRef]
  35. Wang, L.; Jin, J.; Cao, J.; Yang, P.; Peng, Q. Interaction of edge dislocations with graphene nanosheets in graphene/Fe composites. Crystals 2018, 8, 160. [Google Scholar] [CrossRef]
  36. Zhang, Z.; Urbassek, H.M. Dislocation-based strengthening mechanisms in metal-matrix nanocomposites: A molecular dynamics study of the influence of reinforcement shape in the Al-Si system. Comput. Mater. Sci. 2018, 145, 109–115. [Google Scholar] [CrossRef]
  37. Mukherjee, I.; Ray, P.K. A review of optimization techniques in metal cutting processes. CAIE 2006, 50, 15–34. [Google Scholar] [CrossRef]
  38. Besharati-Givi, M.K.; Asadi, P. Advances in Friction-Stir Welding and Processing; Woodhead Publishing: Sawston, UK; Elsevier: Amsterdam, The Netherlands, 2014. [Google Scholar]
  39. Siddiquee, A.N.; Pandey, S. Experimental investigation on deformation and wear of WC tool during friction stir welding (FSW) of stainless steel. Int. J. Adv. Manuf. Technol. 2014, 73, 479–486. [Google Scholar] [CrossRef]
  40. Siddiquee, A.N.; Khan, N.Z. Friction stir welding of austenitic stainless steel: A study on microstructure and effect of parameters on tensile strength. Mater. Today 2015, 2, 1388–1397. [Google Scholar] [CrossRef]
  41. Zass, K.; Mabuwa, S.; Msomi, V. Introduction of Coal Reinforcing Particles on the Dissimilar FSW AA608/AA5083 Joint via Friction Stir Processing. Metals 2023, 13, 1981. [Google Scholar] [CrossRef]
  42. ASTM E8M-04; Standard Test Methods for Tension Testing of Metallic Materials. ASTM International: West Conshohocken, PA, USA, 2004; pp. 1–24.
  43. ASTM E384-11; Standard Test Method for Microindentation Hardness of Materials. ASTM International: West Conshohocken, PA, USA, 2011; pp. 1–24. Available online: https://www.astm.org/Standards/E384.htm (accessed on 10 January 2025).
  44. Li, Q.; Huang, G.; Cao, Y.; Zhang, C.; He, J.; Jiang, H.; Lin, L.; Liu, Q. Microstructure refinement, strengthening and ductilization mechanisms in Al–Mg–Mn–Er–Zr alloy with high Mn content by friction stir processing. Mater. Charact. 2022, 189, 111939. [Google Scholar] [CrossRef]
  45. Amra, M.; Ranjbar, K.; Hosseini, S.A. Microstructure and wear performance of Al5083/CeO2/SiC mono and hybrid surface composites fabricated by friction stir processing. Trans. Nonferrous Met. Soc. China 2018, 28, 866–878. [Google Scholar] [CrossRef]
  46. Faraji, G.; Dastani, O.; Mousavi, S.A.A.A. Effect of process parameters on microstructure and micro-hardness of AZ91/Al2O3 surface composite produced by FSP. J. Mater. Eng. Perform. 2011, 20, 1583–1590. [Google Scholar] [CrossRef]
  47. Ayvaz, S.I.; Arslan, D.; Ayvaz, M. Investigation of mechanical and tribological behavior of SiC and B4C reinforced Al-Zn-Mg-Si-Cu alloy matrix surface composites fabricated via friction stir processing. Mater. Today Commun. 2022, 31, 103419. [Google Scholar] [CrossRef]
  48. Yuvaraj, N.; Aravindan, S. Fabrication of Al5083/B4C surface composite by friction stir processing and its tribological characterization. J. Mater. Res. Technol. 2015, 4, 398–410. [Google Scholar] [CrossRef]
  49. Srivastava, M.; Rathee, S.; Maheshwari, S.; Siddiquee, A.N. Influence of multiple-passes on microstructure and mechanical properties of Al-Mg/SiC surface composites fabricated via underwater friction stir processing. Mater. Res. Express. 2018, 5, 066511. [Google Scholar] [CrossRef]
  50. Srivastava, M.; Rathee, S.; Siddiquee, A.N.; Maheshwari, S. Investigation on the effects of silicon carbide and cooling medium during multi-pass FSP of Al-Mg/SiC surface composites. Silicon 2019, 11, 2149–2157. [Google Scholar] [CrossRef]
  51. Bharathikanna, R.; Elatharasan, G. An investigation on microstructures and mechanical properties of AA1050 in friction stir processing technique. Adv. Nat. Appl. Sci. 2017, 11, 316–322. [Google Scholar]
  52. Huang, G.; Wu, J.; Hou, W.; Shen, Y. Microstructure, mechanical properties and strengthening mechanism of titanium particle reinforced aluminum matrix composites produced by submerged friction stir processing. Mater. Sci. Eng. A 2018, 734, 353–363. [Google Scholar] [CrossRef]
  53. Agha Amini Fashami, H.; Bani Mostafa Arab, N.; Hoseinpour Gollo, M.; Nami, B. Numerical and experimental investigation of defects formation during friction stir processing on AZ91. SN Appl. Sci. 2021, 3, 108. [Google Scholar] [CrossRef]
  54. Habibnia, M.; Shakeri, M.; Nourouzi, S.; Givi, M.B. Microstructural and mechanical properties of friction stir welded 5050 Al alloy and 304 stainless steel plates. Int. J. Adv. Manuf. Technol. 2015, 76, 819–829. [Google Scholar] [CrossRef]
  55. Zandsalimi, S.; Heidarzadeh, A.; Saeid, T. Dissimilar friction-stir welding of 430 stainless steel and 6061 aluminum alloy: Microstructure and mechanical properties of the joints. Proc. Inst. Mech. Eng. Part L J. Mater. Des. Appl. 2019, 233, 1791–1801. [Google Scholar] [CrossRef]
  56. Akbari, M.; Ezzati, M.; Asadi, P. Investigation of the effect of tool probe profile on reinforced particles distribution using experimental and CEL approaches. Int. J. Lightweight Mater. Manuf. 2022, 5, 213–223. [Google Scholar] [CrossRef]
  57. Hamilton, C.; Kopyściański, M.; Senkov, O.; Dymek, S. A coupled thermal/material flow model of friction stir welding applied to Sc-modified aluminum alloys. Metall. Mater. Trans. A 2013, 44, 1730–1740. [Google Scholar] [CrossRef]
  58. Hamilton, C.; Węglowski, M.S.; Dymek, S. A simulation of friction-stir processing for temperature and material flow. Metall. Mater. Trans. B 2015, 46, 1409–1418. [Google Scholar] [CrossRef]
  59. Khan, N.Z.; Siddiquee, A.N.; Khan, Z.A.; Shihab, S.K. Investigations on tunneling and kissing bond defects in FSW joints for dissimilar aluminum alloys. J. Alloys Compd. 2015, 648, 360–367. [Google Scholar] [CrossRef]
  60. Bozkurt, Y. The optimization of friction stir welding process parameters to achieve maximum tensile strength in polyethylene sheets. Mater. Des. 2012, 35, 440–445. [Google Scholar] [CrossRef]
  61. Srivastava, M.; Rathee, S.; Maheshwari, S.; Siddiquee, A.N. Optimisation of friction stir processing parameters to fabricate AA6063/SiC surface composites using Taguchi technique. Int. J. Mater. Prod. Technol. 2019, 58, 16–31. [Google Scholar] [CrossRef]
  62. Ahmadkhaniha, D.; Sohi, M.H.; Zarei-Hanzaki, A.; Bayazid, S.M.; Saba, M. Taguchi optimization of process parameters in friction stir processing of pure Mg. J. Magnes. Alloy. 2015, 3, 168–172. [Google Scholar] [CrossRef]
  63. Jain, V.K.; Yadav, M.K.; Siddiquee, A.N.; Khan, Z.A. Optimization of friction stir processing parameters for enhanced microhardness of AA5083/Al-Fe in-situ composites via Taguchi technique. Mater. Sci. Eng. Appl. 2021, 1, 55–61. [Google Scholar] [CrossRef]
  64. Kolli, M.; Naresh, D.S.; Devaraju, A.; Satyanarayana, K. Investigation of mechanical properties in friction stir processing parameters of Cu-TiB2 composite using Taguchi approach. Int. J. Interact. Des. Manuf. 2023, 19, 153–164. [Google Scholar] [CrossRef]
  65. Muthukrishnan, N.; Davim, J.P. Optimization of machining parameters of Al/SiC-MMC with ANOVA and ANN analysis. J. Mater. Process. Technol. 2009, 209, 225–232. [Google Scholar] [CrossRef]
  66. Chanakyan, C.; Sivasankar, S.; Meignanamoorthy, M.; Ravichandran, M.; Mohanavel, V.; Alfarraj, S.; Almoallim, H.S.; Manikandan, V.; Isaac JoshuaRamesh Lalvani, J. Optimization of FSP process parameters on AA5052 employing the S/N ratio and ANOVA method. Adv. Mater. Sci. Eng. 2021, 2021, 6450251. [Google Scholar] [CrossRef]
  67. Syed, K.; Ali, M.A.; Reddy, K.P.K.; Rao, B.N. Analyzing the Influence of Tool Profile on Friction Stir Process with Taguchi Optimization and Tungsten Nano Powder. Int. J. Veh. Struct. Syst. 2023, 15, 802–807. [Google Scholar]
  68. Butola, R.; Ranganath, M.S.; Murtaza, Q. Fabrication and optimization of AA7075 matrix surface composites using Taguchi technique via friction stir processing (FSP). Eng. Res. Express 2019, 1, 025015. [Google Scholar] [CrossRef]
  69. Salehi, M.; Saadatmand, M.; Mohandesi, J.A. Optimization of process parameters for producing AA6061/SiC nanocomposites by friction stir processing. Trans. Nonferrous Met. Soc. China 2012, 22, 1055–1063. [Google Scholar] [CrossRef]
  70. Puviyarasan, M.; Kumar, V.S. Optimization of friction stir process parameters in fabricating AA6061/SiCp composites. Procedia Eng. 2012, 38, 1094–1103. [Google Scholar] [CrossRef]
  71. Ross, P.J. Taguchi Techniques for Quality Engineering: Loss Function, Orthogonal Experiments, Parameter and Tolerance Design; McGraw-Hill: New York, NY, USA, 1998; pp. 1–279. [Google Scholar]
  72. Akinlabi, E.T.; Mahamood, R.M.; Akinlabi, S.A.; Ogunmuyiwa, E. Processing parameters influence on wear resistance behaviour of friction stir processed Al-TiC composites. Adv. Mater. Sci. Eng. 2014, 2014, 724590. [Google Scholar] [CrossRef]
  73. Swain, P.K.; Mohapatra, K.D.; Das, R.; Sahoo, A.K.; Panda, A. Experimental investigation into characterization and machining of Al+ SiCp nano-composites using coated carbide tool. Mech. Ind. 2020, 21, 307. [Google Scholar] [CrossRef]
  74. Gunasekaran, J.; Sevvel, P.; Roy, J.V.; Sivaramakrishnan, A. Analysis of sensitivity and formulation of empirical relationship between parameters of FSW process and tensile strength of AZ80A Mg alloy joints. Mater. Res. Express 2023, 10, 056513. [Google Scholar] [CrossRef]
  75. Gunasekaran, J.; Sevvel, P.; John Solomon, I.; Vasanthe Roy, J. Multi objective optimization of parameters during FSW of AZ80A-AZ31B Mg alloys using grey relational analysis. J. Mech. Sci. Technol. 2024, 38, 4971–4982. [Google Scholar] [CrossRef]
  76. Adiga, K.; Herbert, M.A.; Rao, S.S.; Shettigar, A.K. Optimization of process parameters for friction stir processing (FSP) of AA8090/boron carbide surface composites. Weld. World 2024, 68, 2683–2700. [Google Scholar] [CrossRef]
  77. Muribwathoho, O.; Msomi, V.; Mabuwa, S. An Analysis Comparing the Taguchi Method for Optimizing the Process Param-eters of AA5083/Silicon Carbide and AA5083/Coal Composites That Are Fabricated via Friction Stir Processing. Appl. Sci. 2024, 14, 9616. [Google Scholar] [CrossRef]
Figure 1. (a) FSW procedure; (b) Drilling of holes and filling them with SiC particles; (c) Using a pinless tool to close the hole; (d) FSP single-pass procedure; (e) Tool with pin tool; (f) Pinless.
Metals 15 00280 g001
Figure 2. Dimensions and arrangement of the hardness and tensile specimens.
Metals 15 00280 g002
Figure 3. Results from experiments and regressions for (a) Microhardness (MH), (b) Percentage elongation (PE), and (c) Ultimate tensile strength (UTS).
Metals 15 00280 g003aMetals 15 00280 g003b
Figure 4. AA5083/SiC composite optical microstructures photographed at 20 × 100 µm magnification with a 100 µm scale bar. (a1a3) Microstructures at 600 rev/min with traverse rates of 30 mm per min, 45 mm per min, and 60 mm per min, respectively, and tilt angles of 1°, 1.75°, and 2°. (b1b3) Microstructures at 900 rev/min with traverse rates of 30 mm per min, 45 mm per min, and 60 mm per min, respectively, and tilt angles of 1.75°, 2°, and 1°. (c1c3) Microstructures having traverse rates of 30 mm per min, 45 mm per min, and 60 mm per min at 1200 rev/min with tilt angles of 2°, 1°, and 1.75°, respectively.
Metals 15 00280 g004
Figure 5. AA5083/SiC composite S/N ratio and mean plot: (a) Microhardness; (b) Percentage elongation; (c) Ultimate tensile strength.
Metals 15 00280 g005
Figure 6. Percentage contribution for process parameters.
Metals 15 00280 g006
Figure 7. Probability Plots; (a) Microhardness, (b) Percentage elongation, (c) Ultimate tensile strength.
Metals 15 00280 g007aMetals 15 00280 g007b
Table 1. The base material AA5083’s mechanical properties.
Mechanical Properties
Ultimate Tensile Strength311 MPa
Percentage Elongation58.65%
Microhardness93.07 HV
Table 2. Parameters of Processing and Their Levels.
Process ParametersFactor SymbolUnitLevel of Parameters
123
Traverse speed(TS)[mm per min]304560
Rotational speed(RS)[rev/min]6009001200
Tilt angle(TA)[°]11.752
Table 3. The design matrix of Taguchi L9.
No of ExperimentsTilt Angle
[°]
Rotational Speed
[rev/min]
Traverse Speed
[mm per min]
1.160030
2.1.7560045
3.260060
4.1.7590030
5.290045
6.190060
7.2120030
8.1120045
9.1.75120060
Table 4. AA5083/SiC Composite Mechanical Properties.
Trial No.UTS (MPa)YS (MPa)PE (%)MH (HV)
1.71.557.209.8894.78
2.11491.2011.7589.57
3.8870.4011.2389.57
4.210168.02989.39
5.145116.018.4594.80
6.141112.819.992.95
7.243194.429.590.56
8.132105.618.793.65
9.12196.8012.0889.56
Table 5. Experimental values vs. regression.
TA
(°)
TS
(mm per min)
RS
(rev/min)
UTS
(MPa)
Fits
UTS
%
Error
PE (%)Fits
PE
%
Error
MH (HV)Fits HV%
Error
13060071.5106.92949.69.8815.596557.994.7889.18135.90
1.7545600114110.8652.7511.7513.793817.489.5789.68320.13
2606008892.7885.4411.2310.39637.4389.5790.30380.82
1.7530900210177.03215.72922.558822.289.3989.73490.39
245900145158.9559.5918.4519.16133.8594.8090.35554.69
16090014185.84639.119.911.776540.892.9591.27291.81
2301200243225.1227.3729.527.92635.3390.5690.40720.17
1451200132152.01315.118.720.54159.8793.6591.32462.48
1.75601200121155.94928.812.0818.738855.289.5691.82652.53
Table 6. Experimental results for the AA5083/SiC composite with the relevant S/N ratio.
TA (°)RS (rev/min)TS (mm per min)MH (HV)S/N Ratio
(HV)
UTS (MPa)S/N Ratio
(UTS)
PE (%)S/N Ratio
(PE)
16003088.0538.89571.537.0869.8819.895
1.756004589.5739.04311441.13811.7521.401
26006089.5739.0438838.88911.2321.008
1.759003089.3939.02621046.44429.0029.248
29004592.9839.36814543.22718.4525.319
19006092.9539.36514142.98419.9025.977
212003090.5639.13924347.71229.5029.396
112004591.4639.22513242.41218.7025.437
1.7512006089.5639.04212141.65612.0821.641
Table 7. Main Effects Response Table for S/N ratio.
LevelTilt Angle (°)Rotational Speed (rev/min)Traverse Speed (mm per min)
For UTS
S/N ratio
140.8339.0443.75
243.0844.2242.26
343.2843.9341.18
Delta2.4505.1802.570
Rank312
Means
1114.8391.17174.83
2148.33165.34130.33
3158.67165.33116.67
Delta43.83074.17058.170
Rank312
For PE
S/N ratio
123.7720.7726.18
224.1026.8524.05
325.2425.4922.88
Delta1.4706.0803.300
Rank312
Means
116.1610.9522.79
217.6122.4516.30
319.7320.0914.40
Delta3.57011.508.390
Rank312
For HV
S/N ratio
139.1638.9939.02
239.0439.2539.21
339.1839.1439.15
Delta0.1500.2600.190
Rank312
Means
190.8289.0689.33
289.5191.7791.34
391.0490.5390.69
Delta1.5302.7102.000
Rank312
Table 8. Factors that affect how much the UTS varies.
SourceDegree of Freedom (DF)Seq SSAdj SSAdj MSF-Valuep-Value% Contribution
S/N ratio
TA (°)211.11011.1085.55400.680.59612.581
RS (rev/min)250.82350.82325.4113.100.24457.552
TS (mm per min)29.99709.99704.99900.610.62111.321
Error216.37916.3798.1900 18.548
Total888.308
Means
TA (°)23150315015750.730.57913.109
RS (rev/min)2110011100155012.540.28245.782
TS (mm per min)25550555027751.280.43823.097
Error2432743272163 18.007
Total824029
Table 9. Factors that affect how much the PE varies.
SourceDegree of Freedom (DF)Seq SSAdj SSAdj MSF-Valuep-Value% Contribution
S/N ratio
TA (°)23.58303.58301.79100.180.8463.5378
RS (rev/min)261.12761.12730.5633.100.24460.357
TS (mm per min)216.83116.8318.41600.850.54016.619
Error219.73419.7349.8670 19.486
Total8101.275
Means
TA (°)219.30019.3009.65200.220.8174.3549
RS (rev/min)2221.27221.27110.6332.560.28149.928
TS (mm per min)2116.15116.1558.07601.340.42726.208
Error286.45086.45043.2260 19.507
Total8443.18
Table 10. Factors that affect how much the MTS varies.
SourceDegree of Freedom (DF)Seq SSAdj SSAdj MSF-Valuep-Value% Contribution
S/N ratio
TA (°)20.037290.037290.0186442.730.26817.778
RS (rev/min)20.101030.101030.0505147.390.11948.167
TS (mm per min)20.057770.057770.0288854.230.19127.542
Error20.013670.013670.006833 6.5173
Total80.20975
Means
TA (°)24.11304.11302.05632.780.26417.955
RS (rev/min)211.04011.0405.51987.470.11848.195
TS (mm per min)26.27706.27703.13844.250.19127.402
Error21.47801.47800.7391 6.4522
Total822.907
Disclaimer/Publisher’s Note: The statements, opinions and data contained in all publications are solely those of the individual author(s) and contributor(s) and not of MDPI and/or the editor(s). MDPI and/or the editor(s) disclaim responsibility for any injury to people or property resulting from any ideas, methods, instructions or products referred to in the content.

