Article

Effect of Leaching of Ionic Rare Earth Ores on the Permeability Coefficient of Mineral Soil and Its Correlation with the State Parameter

1
School of Resources and Environmental Engineering, Jiangxi University of Science and Technology, Ganzhou 341000, China
2
Jiangxi Provincial Key Laboratory of Low-Carbon Processing and Utilization of Strategic Metal Mineral Resources, Jiangxi University of Science and Technology, Ganzhou 341000, China
3
School of Architectural and Surveying & Mapping Engineering, Jiangxi University of Science and Technology, Ganzhou 341000, China
*
Author to whom correspondence should be addressed.
Metals 2025, 15(3), 258; https://doi.org/10.3390/met15030258
Submission received: 28 November 2024 / Revised: 13 February 2025 / Accepted: 17 February 2025 / Published: 27 February 2025

Abstract

The permeability of ionic rare is a crucial factor influencing the leaching rate of rare earth elements. In the Gannan region, many ionic rare earth ores exhibit poor permeability and high compressibility compared to sandy soils. The permeability coefficient is a key indicator of the hydraulic performance of these ores. Thus, this study investigates the permeability coefficients of ionic rare earth ores with varying fines contents during the leaching process, with a specific focus on analyzing the impact of fines on permeability performance. To provide a comprehensive assessment of the influence of fines, we prepared ionic rare earth ore samples with fines contents of 5%, 10%, 15%, 20%, 25%, and 30%, ensuring that the overall particle size distributions remained consistent with the original gradation. A constant head permeability test was employed to measure the permeability coefficients of these ore samples throughout the leaching process. We specifically examined how varying fines contents influenced permeability across the upper, middle, and lower layers of the ore body, as well as the overall permeability when subjected to both distilled water and magnesium sulfate solutions. To further elucidate the differences in permeability performance among the various rare earth ore samples, we performed a data fitting analysis of the initial permeability coefficients against fines content, uniformity coefficient, average particle diameter, and void ratio. This analysis aims to quantify the fines effect across different rare earth ores and establish correlations among state parameters, such as fines content, and the initial permeability coefficient.

1. Introduction

The permeability of ionic rare earth elements is a critical factor in determining their leaching rate. The permeability coefficient serves as an essential index for characterizing the permeability during the leaching process of ore bodies. This coefficient not only influences the leaching rate of rare earth ions and the recovery rate of cations in the leaching solution but also significantly affects the stability of the ore body.
During leaching, changes in pore structure, migration of micro-particles, and movement of rare earth ions can substantially impact the permeability coefficient [1]. The researchers conducted permeability experiments on sandy soil with different fine-grain content using a conventional permeameter as the experimental object and found that the overall permeability coefficient of sandy soil decreased continuously with the increase in fine-grain content in rare earth ores [2]. Other researchers performed permeability experiments on three types of fully weathered coarse-grained granite soils with varying fine-grain contents and found that ammonium sulfate solution had a greater and more pronounced effect on the permeability of the rare earth ores compared to water leaching [3]. Additionally, a group of researchers focused on ionic rare earths as the experimental subject, employing ammonium sulfate as the leaching agent. They carried out indoor column leaching experiments to study the variation of the permeability coefficient of both raw and screened samples during the leaching process with an ammonium sulfate solution. Their results indicated that during leaching, there was migration of microscopic soil particles as well as migration of ions, with the effects of these migratory behaviors on the permeability coefficient of the ore body being opposite [4]. Another set of researchers utilized a variable head permeability device to conduct permeation experiments, studying the permeability characteristics of six groups of rare earth ores with different grade ratios. They discovered that the permeability coefficient of rare earth ores with different particle grades varied significantly, with porosity and permeability coefficients showing “exponential” changes. The mechanism behind this result was analyzed, concluding that when the pore space of rare earth minerals was small, bound water occupying more effective pores had a pronounced blocking effect on the leaching solution, thereby affecting the permeability performance of rare earth minerals [5]. Furthermore, researchers studying ionic rare earths selected various concentrations of soluble leaching solutions for indoor column leaching experiments and found that an increase in the concentration of the leaching solution led to an increase in the permeability coefficient of rare earths [6]. Another group conducted indoor infiltration experiments using fine-grained graded soils, demonstrating that the variation range of the infiltration coefficient was closely related to the ionic concentration in the soil pore space and the potential on the surface of soil microparticles, influenced by the microelectric field [7]. The permeability coefficients of rare earth ores with different fine-grain contents exhibit complex variation patterns during the leaching process. This characteristic has profound implications for the efficiency and quality of leaching operations. A thorough study of the changes in permeability coefficients of rare earth ores with varying fine-grain contents during leaching can aid in optimizing leaching processes, thereby enhancing the extraction efficiency and recovery rate of rare earth resources [8].
In this study, samples of rare earth minerals with fine particle contents of 5%, 10%, 15%, 20%, 25%, and 30% were prepared, along with other particle size ranges similar to the cumulative grading curves of original particles. Infiltration experiments were conducted using water and magnesium sulfate solutions to determine the overall and stratified (upper, middle, and lower) permeability coefficients during the column leaching process [9]. Data fitting was employed to analyze state parameters and initial permeability coefficients.

2. Materials and Methods

2.1. Properties of Experimental Materials

The rare earth samples for all the experiments were taken from a rare earth mine in Dingnan County, Jiangxi Province, China. In order to obtain the basic physical parameters of the mine more accurately, the samples for this experiment were taken from three different ore blocks in the mine without in-situ leaching, with a sampling depth of 2~3 m. The sampling type was divided into in-situ soil samples and bulk soil samples. The sampling type was divided into in-situ soil samples and bulk soil samples. After the sampling location was selected, the surface decayed layer was plowed away first, and then a 16 cm diameter Luoyang shovel was used to drill holes to a position of 2~3 m. A number of bulk natural mineral soils were bagged and packaged, and a number of ring-knife samples were taken by the ring-knife method and sealed with plastic wrap [10]. The final step is to determine the moisture content, density, particle specific gravity, particle gradation, void ratio, and porosity of the soil sample in the laboratory. XRD (Empyream PANalytical) patterns can be seen in Figure 1. Table 1 shows the basic physical parameters of rare earth minerals, Table 2 presents the percentage content of various particle sizes in the ore soil, and Table 3 lists the oxide content in the ore soil.

2.2. Experimental Process

Sample preparation: The rare earth sample was reshaped according to the physical properties of the original material. After drying and sieving, the raw ore particles were classified into the following size fractions: 10–5 mm, 5–2 mm, 2–1 mm, 1–0.5 mm, 0.5–0.25 mm, 0.25–0.075 mm, and <0.075 mm [11]. Each fraction was stored separately. Rare earth samples with fine particle contents (as a percentage of total sample mass) of 5%, 10%, 15%, 20%, 25%, and 30% were prepared by mixing these fractions in proportions that mimic the coarse grain distribution of the raw ore soil [12]. These experimental soils are denoted as FC05, FC10, FC15, FC20, FC25, and FC30, where “FC” stands for fines content and the number represents the specific percentage. The basic physical properties of rare earth minerals with varying fine particle content are summarized in Table 4.
Loading sample: The experimental setup primarily consists of a transparent PVC cylinder (diameter 110 mm), pressure measuring tubes, a plastic base plate, and a liquid supply system. The cylinder has openings at the bottom, sides, and top for drainage, overflow, and installation of pressure measuring tubes, respectively. The base plate and pressure measuring tubes are sealed with hot melt adhesive to ensure the air-tightness required for the permeability test. The dimensions and structure of the experimental device are detailed in Figure 2. For each fine particle content, approximately 3–4 kg of rare earth samples were weighed accurately to 1.0 g. Based on the natural moisture content of the raw ore, the samples were mixed with water and placed in sealed bags for 24 h to ensure uniform moisture distribution. During loading, to prevent the loss of fine particles, a 20 mm thick layer of coarse sand (particle size 10 mm) was added to the base plate as a transition layer [13]. Subsequently, a 2566 g sample was divided into six equal portions of 427.7 g each and loaded into the PVC cylinder. Each layer was gently compacted with a wooden hammer until it reached a thickness of 3 cm. To avoid distinct layering, the surface of the soil sample was treated with a “hair” texture before adding the next layer. After loading, a layer of qualitative filter paper was placed on top as a buffer layer [14].
The entire rare earth permeability experiment was divided into two groups: a water group and a magnesium sulfate solution group. Each group of experiments was independently repeated three times. The data is presented as mean ± standard error. Experimental errors mainly arise from minor variations in sample preparation and measurement precision of the instruments. Each rare earth sample’s leaching experiment consisted of two stages. In the first stage, the sample was saturated by slowly injecting water from the bottom outlet, displacing air from the bottom to the top. Once saturation was achieved, the second stage commenced, during which water and a 3% magnesium sulfate solution were injected to initiate the leaching process [15]. At the beginning of the experiment, when the water level in the pressure measuring tube stabilized for the first time, the initial permeability coefficient was calculated and recorded using the data from the pressure measuring tubes. Thereafter, the pressure measuring tube data for each sample were recorded every other day [16].

3. Result

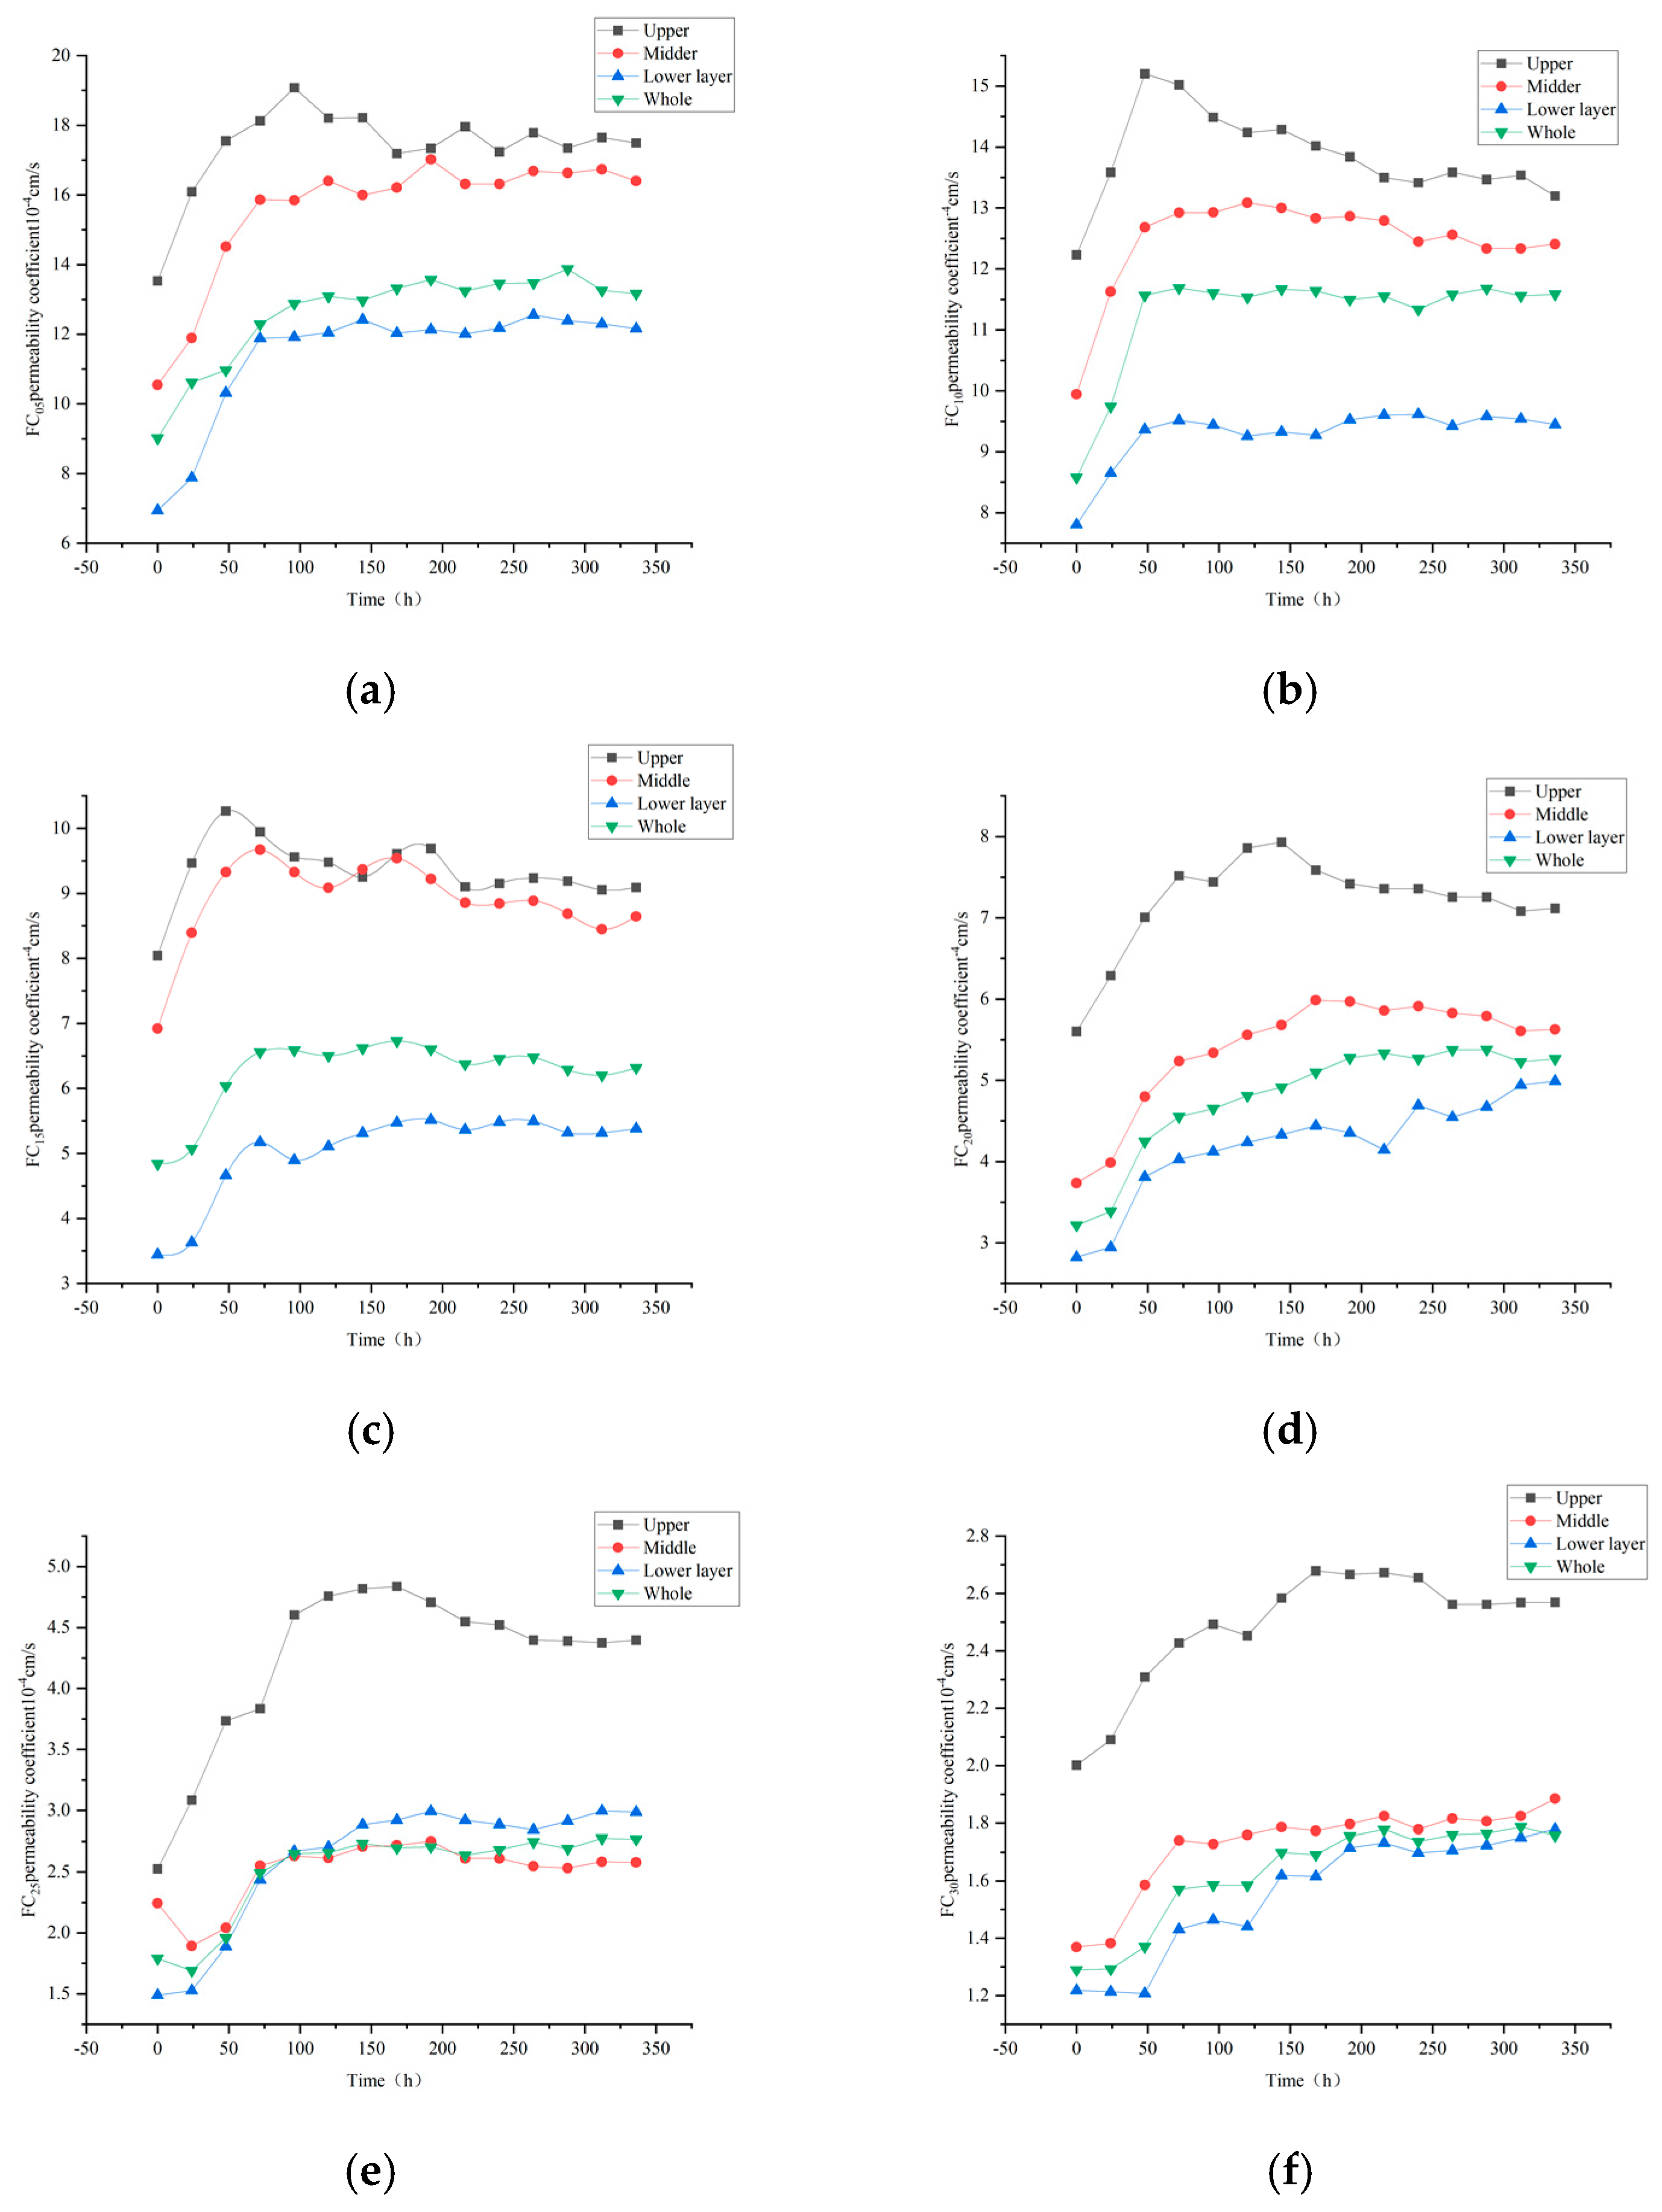
3.1. Effect of Clear Water Seepage on Permeability Coefficient of Different Layers of Rare Earth Ore with Different Fines Content

The permeability coefficient of each layer during the water leaching process of rare earth ore with different fine particle contents is shown in Figure 3a–f. It can be observed that the permeability coefficients follow the relationship: upper layer > middle layer > whole > lower layer. This trend is attributed to the decreasing hydraulic gradient with depth [17]. The upper layer experiences a larger hydraulic gradient, which facilitates the migration of micro-particles and enhances pore connectivity, leading to a rapid and substantial increase in the permeability coefficient. Conversely, the lower layer has a smaller hydraulic gradient, resulting in limited fine particle migration, reduced pore connectivity, and, consequently, a lower permeability coefficient. The overall permeability coefficient is theoretically the average value of the individual layers, placing it between the extremes [18]. Generally, the permeability coefficient of each layer shows an upward trend due to enhanced pore connectivity caused by water seepage, but variations exist based on the degree of porosity connectivity.
From the comparison of the permeability coefficients of each layer at different fine particle contents, it is evident that higher fine particle content results in more compact permeability coefficient curves for the middle and lower layers. This is because a higher fine particle content leads to fewer coarse particles, a more complex pore structure, fewer pore throats, and hindered fine particle migration, obstructing pore connectivity [19]. Additionally, the lower layer has a smaller hydraulic gradient, weaker hydrodynamic force, and lower porosity connectivity, resulting in a smaller difference in permeability coefficients between the middle and lower layers and a more compact curve [20].

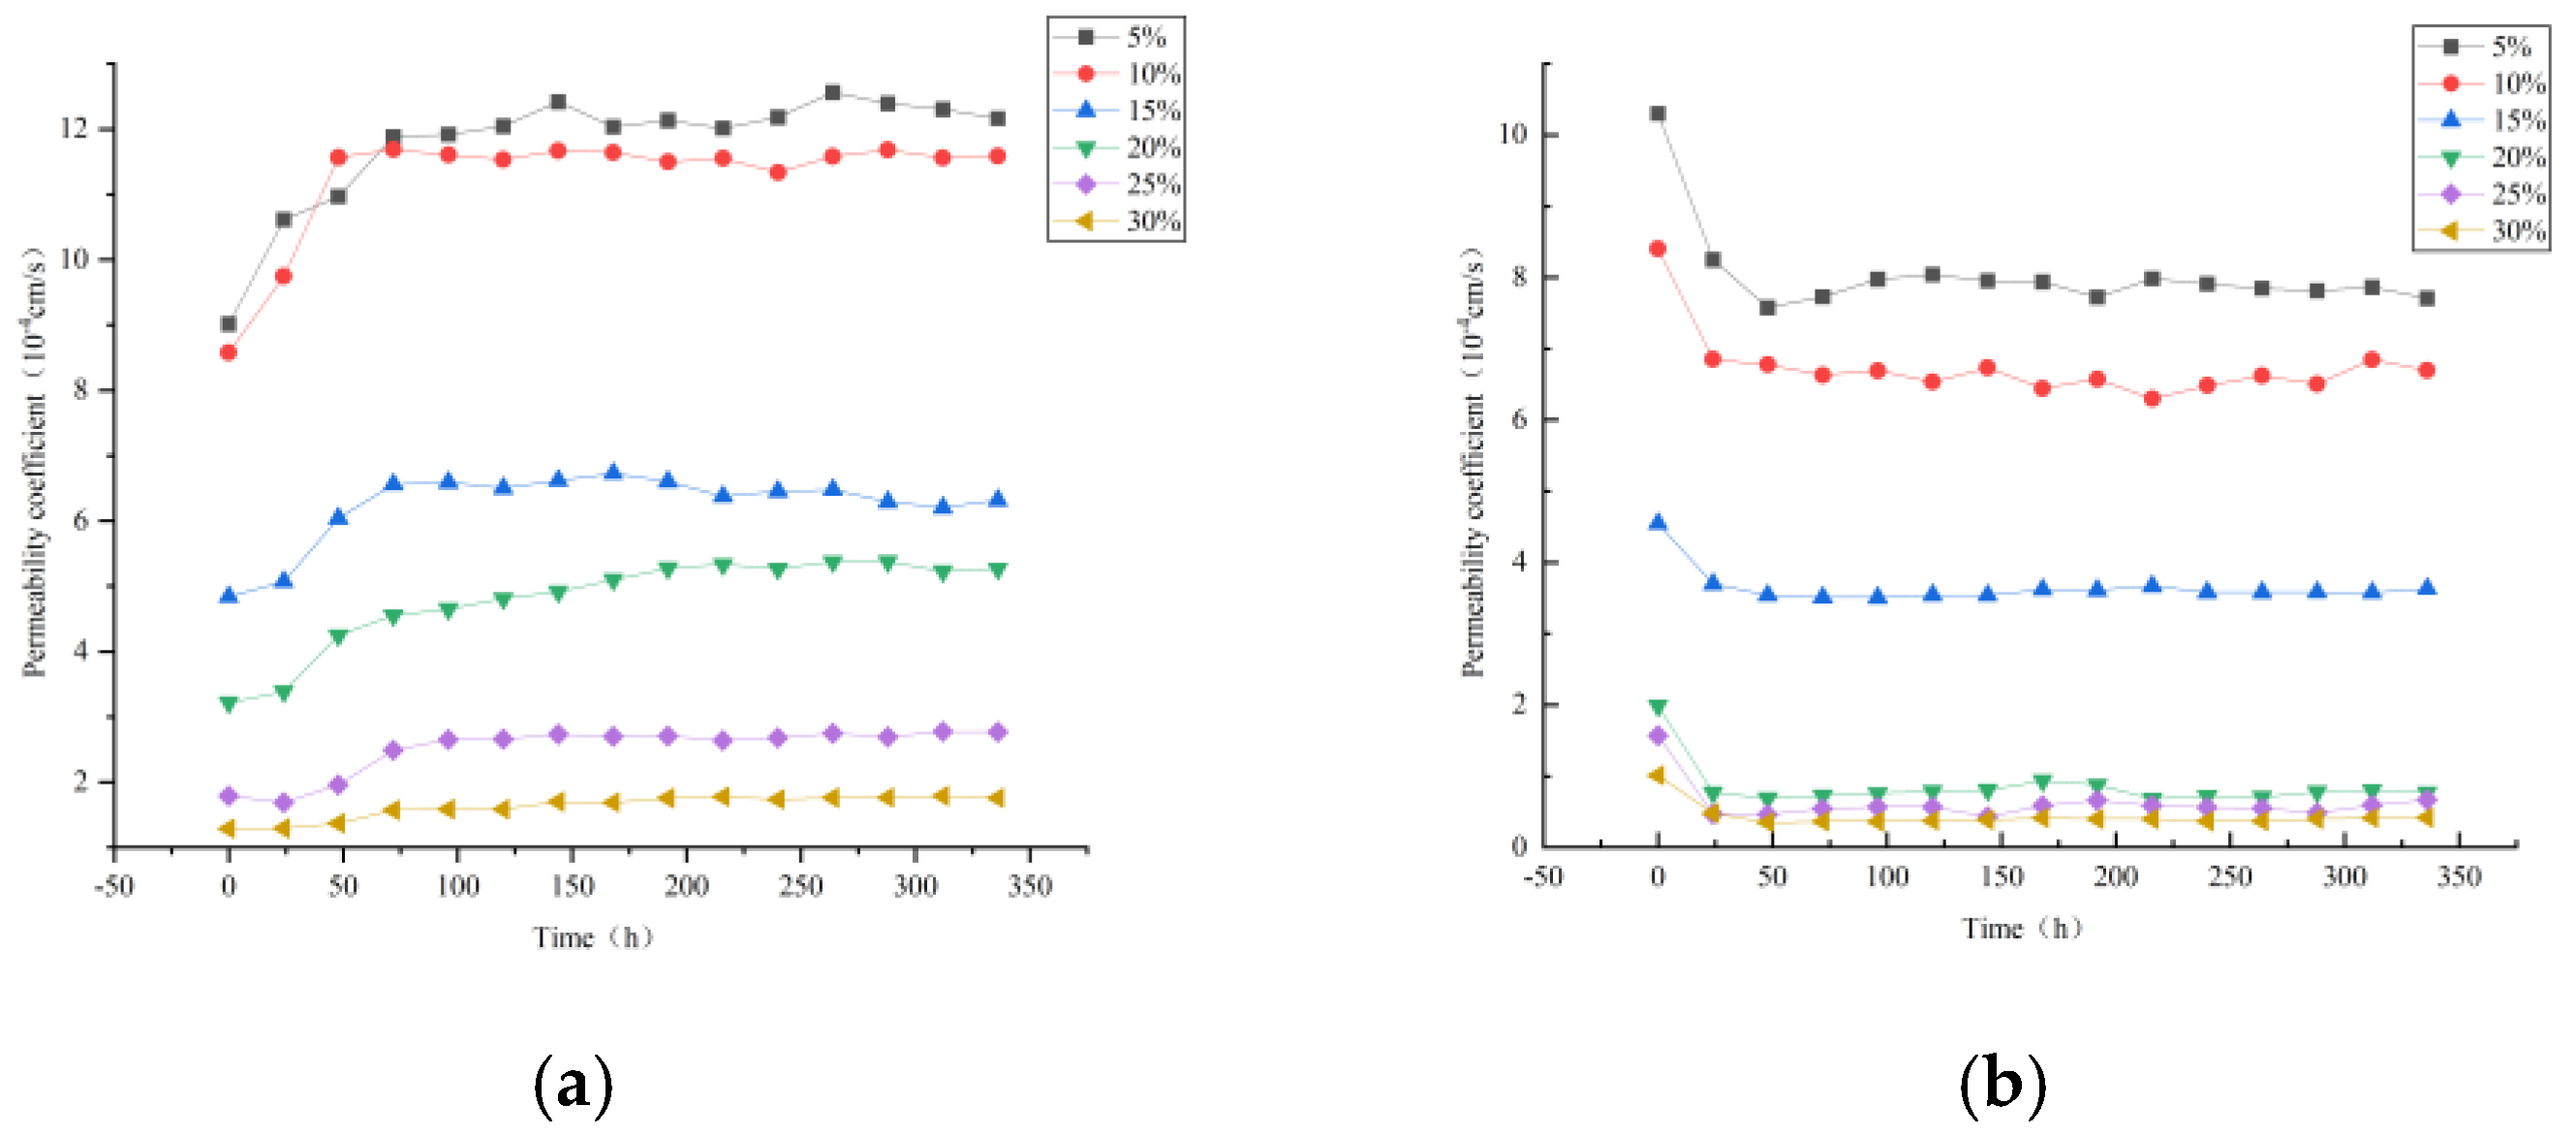
3.2. Influence of Magnesium Sulfate Leaching on the Permeability Coefficient of Each Layer of Rare Earth Ores with Different Fines Content

The permeability coefficients of each layer during the magnesium sulfate solution leaching process of rare earth ores with different fine particle contents are shown in Figure 4a–f. Similar to water leaching, the relationship between the upper, middle, and lower layers and the overall permeability coefficient follows the pattern: upper > middle > whole > lower layer. However, a key difference is observed: the permeability coefficient of each layer decreases rapidly within 1–2 days and then stabilizes [21]. This rapid decrease is attributed to the chemical replacement reaction between the magnesium sulfate solution and rare earth particles over the initial 1–2 days. Specifically, as an electrolyte solution, magnesium sulfate redistributes charged ions on the surface of rare earth particles, forming a double electric layer. The net charge of this double layer generates a potential difference with the seepage flow. The resulting negative electric field causes the net charge to move backward, dragging part of the solution along and reducing the seepage speed and permeability coefficient [22]. Additionally, during the reaction, high-valence rare earth ions are replaced by low-valence magnesium ions, leading to an increase in high-valence cations. This results in a decrease in the Zeta potential and thickness of the double electric layer, reducing electrostatic repulsion. Consequently, van der Waals attraction dominates, causing an increase in small pores and a decrease in large pores, thereby limiting pore channel development and decreasing the permeability coefficient. After the reaction, the permeability coefficient tends to stabilize [23].
Furthermore, it can be observed from the curves that the upper and middle layers of FC05, FC10, and FC15 samples exhibit relatively more compact permeability coefficient curves during leaching. In contrast, the layers of FC20, FC25, and FC30 samples are relatively compact. When the fine particle content is low, there are more skeleton particles, resulting in higher dynamic water pressure in the upper and middle layers. This leads to the downward migration of fine particles, increasing connected pores in the upper and middle layers and differentiating their permeability coefficients from those of the lower layer. As the fine particle content increases to a certain degree, the number of skeleton particles decreases, the pore structure becomes more complex, and the number of pore throats reduces [24]. The hydraulic gradient falls below the critical value, making fine particle migration difficult, and thus the permeability coefficients of each layer become closer [25].

3.3. Variation of the Overall Permeability Coefficient of the Sample

The overall changes in the permeability coefficient of rare earth ores with varying fine particle content during leaching, from top to bottom, under different leaching conditions (using clean water and magnesium sulfate), are illustrated in Figure 5a,b. It is evident that a higher content of fine particles corresponds to a lower overall permeability coefficient, a narrower range of variation, and a longer duration to achieve a stable permeability coefficient. This is because the migration of fine particles requires coarse particles to create a sufficient number of pore throats [26]. A high fine particle content leads to a reduced number of coarse particles, resulting in a complex pore structure with fewer pore throats. This complicates the migration of fine particles, hinders pore connectivity, and consequently results in minimal changes and lower values of the permeability coefficient [27].
Additionally, when leaching with magnesium sulfate solution, the overall permeability coefficient of the ore body decreases due to the combined effects of percolation and chemical displacement. The impact of chemical displacement on the permeability coefficient is greater than that of clean water percolation, leading to a reduction in the permeability coefficient following chemical displacement [28].

4. Discussion

Porosity characteristics, as the core factor determining the permeability performance of rare earth materials, are influenced by a combination of factors such as the composition and grading of rare earth particles. The fine-grain content, uniformity coefficient, and average particle diameter can comprehensively and effectively describe the particle composition characteristics of rare earths from different perspectives [29].

4.1. Correlation Between Fine Grain Content and Initial Permeability Coefficient

The initial permeability coefficients of different fine-grained content rare earth ores are shown in Table 5, and the relationship between different fine-grained content rare earth ores and their initial permeability coefficients is shown in Figure 6. It can be seen that in semi-logarithmic coordinates, with the increase in fine-grained content, the permeability coefficient of the ore body decreases, and the curve is divided into three segments: (a), (b), and (c). When the fines content is <10%, i.e., in section (a), the permeability coefficient of the ore body decreases slowly with the increase in fines; when the fines content is between 10% and 20%, i.e., the fines content is in section (b), the permeability coefficient of the ore body decreases sharply with the increase in fines content; when the fines content is >20%, i.e., in section (c), the permeability coefficient of the ore body decreases slowly with the increase in fines again. In Figure 6, the fitted equations are:
k = 0.846 + 9.536 1 + F C 13.467 4.590 R 2 = 0.999

4.2. Correlation of Inhomogeneity Coefficient with Initial Permeability Coefficient

The inhomogeneity coefficient Cu is the ratio of the restricted particle size to the effective particle size, which reflects the good degree of soil grading; the higher the inhomogeneity coefficient of the rare earth ores, the wider the range of the particle size distribution, the better the grading, and it is used as one of the important indexes for evaluating the infiltration performance of the rare earth ores. The inhomogeneity coefficients and initial permeability coefficients of rare earth ores with different fine-grained contents are shown in Table 6, and the fitting relationship between the inhomogeneity coefficients and permeability coefficients is shown in Figure 7. It can be seen that the larger the inhomogeneity coefficient of a rare earth ore, the smaller its permeability coefficient and the performance of its linear relationship, indicating that the particle gradation of rare earth ores has an extremely important effect on the permeability coefficient of rare earth ores. Although the higher inhomogeneity coefficient represents the better rare earth gradation, its permeability coefficient is smaller, which is not conducive to the mining of rare earth ore. In Figure 7, the fitted equation is:
k = 11.148 0.160 × C u R 2 = 0.977

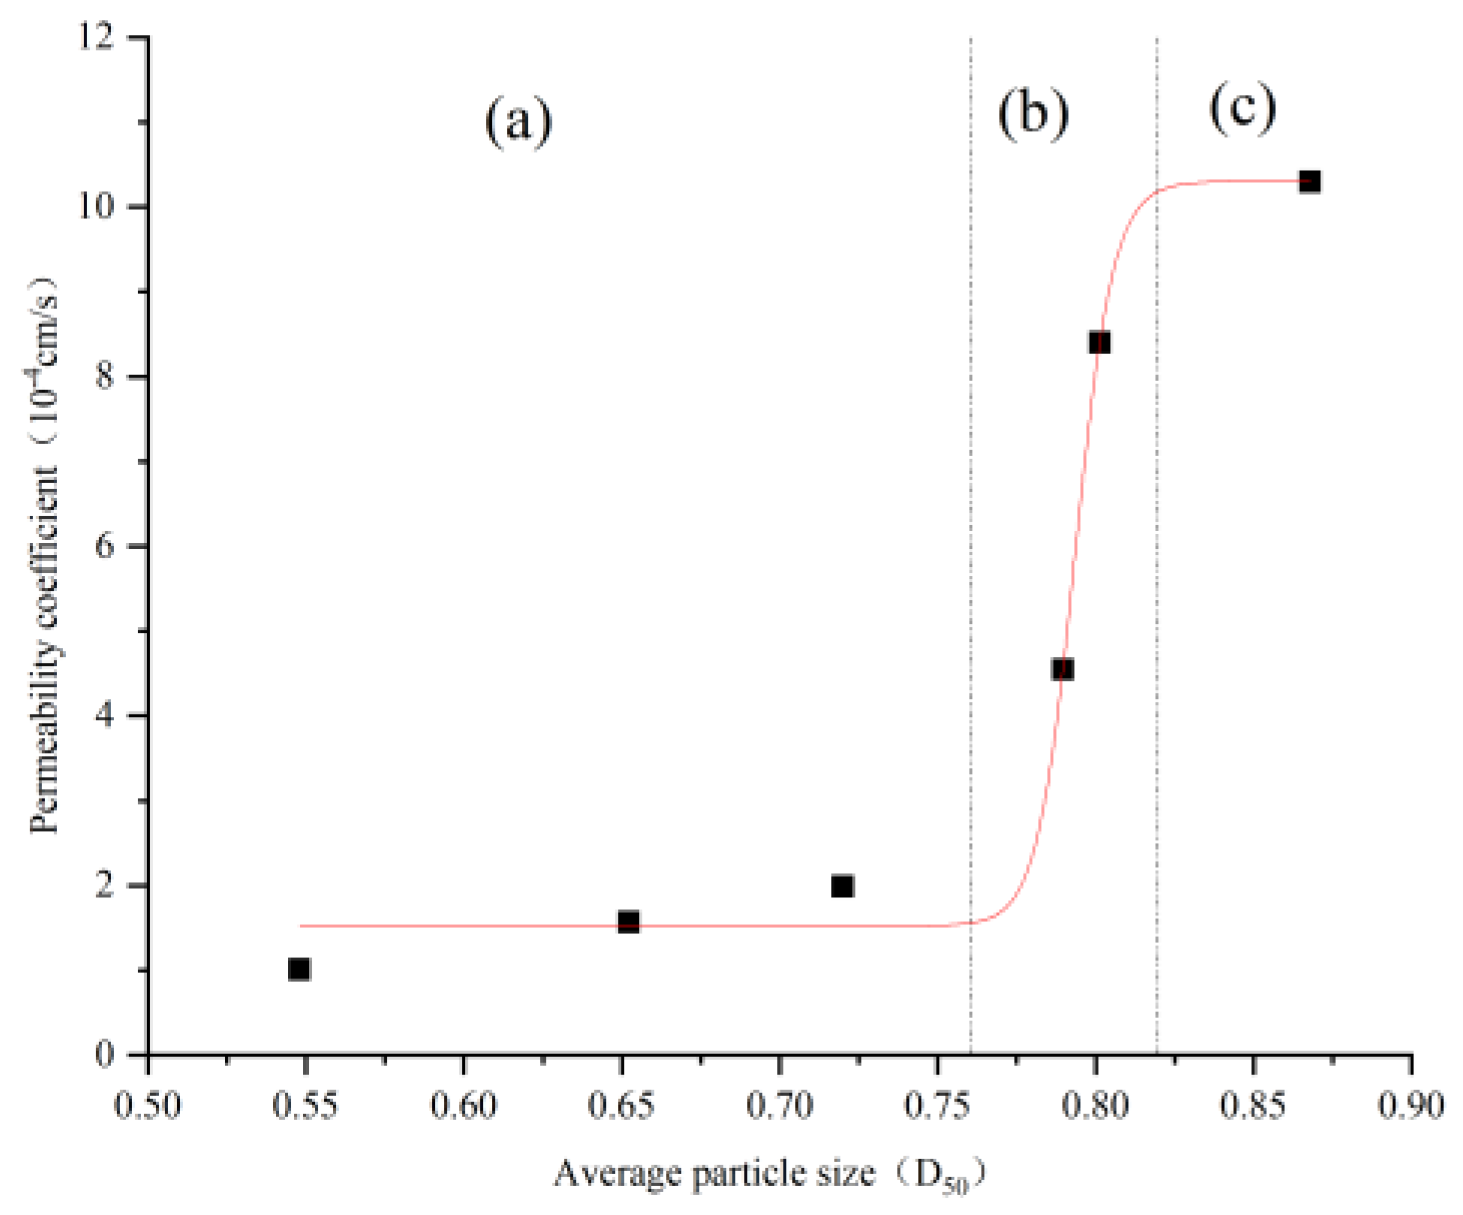
4.3. Correlation Between Average Particle Size D50 and Initial Permeability Coefficient

The particle size value corresponding to the cumulative particle size distribution percentage of the soil that reaches 50% is called the average particle size, which can reflect the particle size distribution of the particles in the soil and can be used as an important index for the analysis of the soil particle size and gradation analysis. The relationship between the average particle size D50 and the initial permeability coefficients of different fine-grained rare earth minerals is shown in Table 7, and the fitted curves are shown in Figure 8, which shows that the permeability coefficients of the rare earth minerals are higher as the average particle size of the rare earth minerals is larger. When the average particle size D50 < 0.76 and D50 > 0.82, i.e., in regions (a) and (c), the permeability coefficient grows more gently with the larger average particle size of rare earth ores; when the average particle size 0.76 < D50 < 0.82, i.e., in region (b), the rare earth ores with large average particle sizes have more coarse particles, the seepage channel connectivity is better, and the permeability coefficient grows rapidly with the increase in the average particle size of rare earth ores. In Figure 8, the fitted equation is:
k = 10.300 + 8.777 1 + D 50 0.793 131.340 R 2 = 0.994

4.4. Correlation of Intergranular Porosity with Initial Permeability Coefficient

As can be seen from the above, there is still a large error in describing the permeability properties of rare earths by using the state coefficients such as Cu and D50, and the error is especially obvious when the fine-grained content of rare earths is greater than 20%. Therefore, in order to better describe the permeability of rare earth ores with different fine-grained content, the concept of intergranular state parameter is introduced in the following. When the soil body is under the action of an external force, Thevanayagam called the connection between soil particles or agglomerates as “force chain”, but the existing pore ratio e cannot accurately describe the significance of the “force chain”, which has a certain degree of “force chain”. “Force chain” has a certain particle size effect, and using this effect can better characterize the permeability of sandy soils, so Thevanayagam divided the coarse particles and fine particles, with 74 μm as the dividing line, expanding the concept of the soil skeleton porosity ratio, defined as the intergranular state parameter [30,31]. Later, Kong [2] and others cited the intergranular state parameter to sandy soils, and in order to apply uniformity in fine-grained sandy soils, it was also called intergranular porosity ratio es, i.e., the pore ratio between soil particles with grain sizes larger than 74 μm. The relationship between intergranular porosity ratio and permeability coefficient of sandy soils with different fine-grain contents was obtained in this study with good representativeness, and its formula is as follows:
e s = e + f c 1 f c
where
  • e = Porosity ratio
  • es = Intergranular porosity ratio
  • fc = Fine grain volume (cm3)
  • 1 − fc = Coarse Grain Volume (cm3)
In view of this, the concept of intergranular porosity ratio is introduced in this paper, and the intergranular porosity ratios and permeability coefficients of rare earth ores with different fine-grained contents were obtained according to the formula, as shown in Table 8. The fitting relationship between the intergranular porosity ratio and the initial permeability coefficient is shown in Figure 9. The permeability of the rare earth ores decreases as the fines content of the ore body increases, i.e., es increases, which causes a blockage to the internal pores of the ore body. The turning point of the curve occurs near es = 1.29 and es = 1.89. For es < 1.29 and es > 1.89, i.e., regions (a) and (c) in the figure, the permeability coefficient decreases slowly with the increase in intergranular pore ratio, but when 1.29 < es < 1.89, i.e., region (b), the permeability coefficient of the ore body appears to decrease drastically with the increase in intergranular pore ratio. In Figure 9, the fitted equation is:
k = 0.819 + 11.021 1 + e s 1.493 7.596 R 2 = 0.998

5. Conclusions

This study systematically analyzes the permeability characteristics of rare earth ores with varying fine particle contents under both clear water and magnesium sulfate leaching conditions. The conclusions are as follows:
(1)
Experimental results indicate that during clear water infiltration, the permeability coefficients of the various layers of rare earth ores follow the order: upper layer > middle layer > overall > lower layer. This phenomenon can be attributed to the higher hydraulic gradient present in the upper layer, which enhances the migration of fine particles and improves pore connectivity. Consequently, as the fine particle content increases, particularly when it exceeds 10%, the permeability coefficients of the middle and lower layers become increasingly similar, indicating a significant suppressive effect of fine particles on pore connectivity.
(2)
Under magnesium sulfate leaching conditions, the permeability coefficients of each layer exhibit a similar hierarchical relationship as observed with clear water. However, during the initial 1 to 2 days of treatment, permeability coefficients decrease rapidly and subsequently stabilize. This variation is closely associated with the chemical exchange reactions between the magnesium sulfate solution and the rare earth particles. Such reactions alter the surface charge distribution of the particles, thereby affecting the electrostatic repulsion among particles and the pore structure, leading to a reduction in overall permeability.
(3)
A comparison of the initial permeability coefficients of different fine particle samples reveals a significant negative correlation between increasing fine particle content and permeability coefficients. Specifically, when the fine particle content is below 10%, the permeability coefficient decreases gradually; however, once the fine particle content reaches the range of 10% to 20%, the permeability coefficient declines sharply, demonstrating strong sensitivity. Additionally, an increase in the uniformity coefficient suggests that an improved particle size distribution can limit permeability, despite the fact that a high uniformity coefficient generally indicates better particle grading.
(4)
To accurately assess the permeability performance when fine particle content exceeds 20%, this study introduces the concept of inter-particle void ratio (es). The analysis indicates that an increase in the inter-particle void ratio leads to a significant reduction in the permeability coefficient of the ore body, especially when es values are between 1.29 and 1.89, at which point a drastic decline in permeability is observed. This reflects changes in the connectivity of internal pores within the ore. Therefore, the inter-particle void ratio effectively captures the spatial relationships among fine particles and provides new insights into understanding permeability variations.

Author Contributions

Y.R. and R.X.; methodology, Y.R.; software, R.X.; validation, J.Z., Z.Y. and L.Z.; formal analysis, J.Z.; investigation, R.X.; resources, Z.Y.; data curation, L.Z.; writing—original draft preparation, R.X.; writing—review and editing, R.X.; visualization, Z.Y.; supervision, Y.R.; project administration, Y.R.; All authors have read and agreed to the published version of the manuscript.

Funding

This research received no external funding.

Data Availability Statement

The original contributions presented in the study are included in the article, further inquiries can be directed to the corresponding author.

Conflicts of Interest

The authors declare no conflict of interest.

References

  1. Zheng, G.D.; Wang, K.; Chen, Q.S.; Zhang, Y.F.; Xing, J.Y.; Long, T.; Dong, Y.T.; Ni, J.P. The change of world rare earth industrial structure and the problems faced by China’s rare earth industry. Acta Geol. Sin. 2021, 42, 265–272. [Google Scholar]
  2. Kong, L.; Li, X.; Tian, H. Correlation between fine-grained effect of permeability coefficient and state parameters in sandy soils. Geotechnics 2011, 32 (Suppl. S2), 21–26. [Google Scholar]
  3. He, S.; Xianmu, S.-A.; Rong, H. Experimental study on the effect of particle migration and ion adsorption on permeability of coarse-grained soil. Nonferrous Met. Sci. Eng. 2018, 9, 80–85. [Google Scholar]
  4. Luo, Z.; Huang, Q.; Wang, G. Experimental study on the change rule of permeability during leaching of ionic rare earths. Nonferrous Met. Sci. Eng. 2014, 5, 95–99. [Google Scholar] [CrossRef]
  5. Yin, S.; Qi, Y.; Xie, F. Permeability characteristics of rare earths in weathered crust leachate with different pore structures. Chin. J. Nonferrous Met. 2018, 28, 1043–1049. [Google Scholar]
  6. Li, S.; Liu, Z.; Mong, J. Test on engineering characteristics of red clay under the action of ammonium carbonate solution. J. Henan Univ. Sci. Technol. Nat. Sci. Ed. 2019, 36, 57–63. [Google Scholar]
  7. Liang, J.; Fang, Y.; Gu, R. Analysis of micro electric field effects on the seepage of fine particles clay. Rock Soil Mech. 2010, 31, 3043–3050. [Google Scholar]
  8. Chen, X.; He, Q.; Chen, J.F.; Huang, L.; Tan, C.M.; Yin, Y.Q.; Jiao, Y.F.; Xiao, Y.F. Development of leaching technology and theory of ion-adsorption type rare earth ore. J. Chin. Soc. Rare Earths 2022, 40, 936–947. [Google Scholar]
  9. Feng, J.; Zhou, F.; Chi, R.A.; Liu, X.; Xu, Y.L.; Liu, Q. Effect of a novel compound on leaching process of weathered crust elution deposited rare earth ore. Miner. Eng. 2018, 129, 63–70. [Google Scholar] [CrossRef]
  10. Liu, D.F.; Zhang, Z.Y.; Chi, R.A. Seepage mechanism during in-situ leaching process of weathered crust elution-deposited rare earth ores with magnesium salt. Physicochem. Probl. Miner. Process. 2020, 56, 349–361. [Google Scholar] [CrossRef]
  11. Deng, Z.X.; Qin, L.; Wang, G.S.; Luo, S.H.; Peng, C.L.; Li, Q. Metallogenic process of ion adsorption REE ore based on the occurrence regularity of La in kaolin. Ore Geol. Rev. 2019, 112, 103022. [Google Scholar] [CrossRef]
  12. Peng, L.; Chen, B.; Zou, X.; Zou, Z.; Xiao, W.; Que, X. New scheme for rare earth allotment characteristics and type classification of ionic rare earth ores. Chin. J. Rare Earths 2021, 39, 624. [Google Scholar]
  13. Zhou, F.; Liu, Q.; Feng, J.; Su, J.X.; Liu, X.; Chi, R.A. Role of initial moisture content on the leaching process of weathered crust elution-deposited rare earth ores. Sep. Purif. Technol. 2019, 217, 24–30. [Google Scholar] [CrossRef]
  14. Qiu, T.; Yan, H.; Li, J.; Liu, Q.; Ai, G. Response surface method for optimization of leaching of a low-grade ionic rare earth ore. Powder Technol. 2018, 330, 330–338. [Google Scholar] [CrossRef]
  15. Han, M.; Wang, D.; Rao, Y.; Xu, W.; Nie, W. An experimental study on the kinetics of leaching ion-adsorbed REE deposits with different concentrations of magnesium sulfate. Metals 2023, 13, 1906. [Google Scholar] [CrossRef]
  16. Luo, S.H.; Luo, T.; Wang, G.S.; Liu, J.; Hu, S.L.; Zhu, D.M. Effect of heterogeneity of leaching solution on leaching rate in ionic rare earth ore body. Soils 2018, 50, 421–427. [Google Scholar]
  17. Tian, J.; Yin, J.Q.; Chi, R.A.; Rao, G.H.; Jiang, M.T.; Ouyang, K.X. Kinetics on leaching rare earth from the weathered crust elution-deposited rare earth ores with ammonium sulfate solution. Hydrometallurgy 2010, 101, 166–170. [Google Scholar]
  18. Zou, H.L.; Zhang, Z.Y.; Chen, Z.; Liu, D.F.; Chai, X.W.; Zhang, H.; Chi, R.A. Seepage process on weathered crust elution-deposited rare earth ores with ammonium carboxylate solution. Physicochem. Probl. Miner. Process. 2020, 56, 90–102. [Google Scholar]
  19. Wei, D.D.; Wang, H.N.; Yang, Z.Z. Experimental research on the leaching of ionic rare earth ore with weak permeability. Min. Res. Dev. 2016, 36, 55–58. [Google Scholar]
  20. Sun, R.; Zhang, Y.; Fan, K.; Shi, Y. Molecular simulation of adsorption properties of clay minerals in shale. J. Chem. Eng. 2015, 66, 2118–2122. [Google Scholar]
  21. Li, F.J.; Xiao, Z.; Zeng, J.Y.; Chen, J.Q.; Sun, X.Q. Recovery of REEs from leaching liquor of ion-adsorbed-type rare earth ores using ionic liquid based on cooking oil. Hydrometallurgy 2020, 196, 105449. [Google Scholar] [CrossRef]
  22. Yang, L.F.; Wang, D.S.; Li, C.C.; Sun, Y.Y.; Zhou, X.Z.; Li, Y.X. Searching for a high efficiency and environmentally benign reagent to leach ion-adsorption rare earths based on the zeta potential of clay particles. Green Chem. 2018, 20, 4528–4536. [Google Scholar] [CrossRef]
  23. Gao, Z.; Rao, Y.; Shi, L.; Xiang, R.; Yang, Z. Effect of magnesium sulfate solution on pore structure of ionic rare earth ore during leaching process. Minerals 2023, 13, 294. [Google Scholar] [CrossRef]
  24. Long, P.; Wang, G.; Zhang, C.; Yang, Y.; Cao, X.; Shi, Z. Kinetics model for leaching of ion-adsorption type rare earth ores. J. Rare Earths 2020, 38, 1354–1360. [Google Scholar] [CrossRef]
  25. Xie, F.F.; Wang, G.S.; Wen, T. Discussion on reasons for difference of ionic phase rare earth grade distribution in different grain size fractions. Chin. J. Nonferr. Met. 2023, 33, 1672–1681. [Google Scholar]
  26. Yan, D.R.; Ro, S.; Sunam, O.; Kim, S. On the global rare earth elements utilization and its supply-demand in the future. IOP Conf. Ser. Earth Environ. Sci. 2020, 508, 012084. [Google Scholar] [CrossRef]
  27. Sen, T.K.; Khilar, K.C. Review on subsurface colloids and colloid-associated contaminant transport in saturated porous media. Adv. Colloid Interface Sci. 2006, 119, 71–96. [Google Scholar]
  28. Zhang, X.; Gao, Z.; Rao, Y.; Shi, L.; Xu, W. Evolutionary law of pore structure of ion-adsorbed rare earth ore leaching process. Minerals 2023, 13, 322. [Google Scholar] [CrossRef]
  29. Wu, K.X.; Zhang, L.; Zhu, P.; Chen, L.K.; Tian, Z.F.; Xing, X.Y. Research on particle size distribution and its variation of ion-adsorption type rare earth ore. Chin. Rare Earths 2016, 37, 67–74. [Google Scholar]
  30. Thevanayagam, S.; Mohan, S. Intergranular State Variables and Stress-Strain Behaviour of Silty Sands. Geotechnique 2000, 50, 1–23. [Google Scholar] [CrossRef]
  31. Xenaki, V.C.; Athanasopoulos, G.A. Liquefaction resistance of sand-silt mixtures: An experimental investigation of the effect of fines. Soil Dyn. Earthq. Eng. 2003, 23, 183–194. [Google Scholar] [CrossRef]
Figure 1. XRD pattern of run-of-mine ore sample.
Metals 15 00258 g001
Figure 2. Osmosis Experimental Setup.
Metals 15 00258 g002
Figure 3. The permeability coefficient of each layer in the process of clean water leaching of mineral soil. (a) FC05 Permeability coefficient of each layer in the leach process; (b) FC10 Permeability coefficient of each layer in the leach process; (c) FC15 Permeability coefficient of each layer in the leach process; (d) FC20 Permeability coefficient of each layer in the leach process; (e) FC25 Permeability coefficient of each layer in the leach process; (f) FC30 Permeability coefficient of each layer in the leach process.
Metals 15 00258 g003
Figure 4. The permeability coefficient of each layer in the leaching process of magnesium sulfate solution. (a) FC05 Permeability coefficient of each layer in the leach process; (b) FC10 Permeability coefficient of each layer in the leach process; (c) FC15 Permeability coefficient of each layer in the leach process; (d) FC20 Permeability coefficient of each layer in the leach process; (e) FC25 Permeability coefficient of each layer in the leach process; (f) FC30 Permeability coefficient of each layer in the leach process.
Metals 15 00258 g004
Figure 5. Overall permeability coefficients of the mineral soil for each fine-grained content during leaching. (a) Clean water leach; (b) Magnesium sulfate leach.
Metals 15 00258 g005
Figure 6. Relationship between fine grain content and permeability coefficient.
Metals 15 00258 g006
Figure 7. Unevenness coefficient versus initial permeability coefficient.
Metals 15 00258 g007
Figure 8. Mean particle size D50 vs. initial permeability coefficient.
Metals 15 00258 g008
Figure 9. The relationship between intergranular pores and initial permeability coefficient.
Metals 15 00258 g009
Table 1. Physical parameters of ionic rare earth ores.
Parameter TypeValue
moisture content (%)20.47
dry density (g/cm3)1.35
specific gravity of particles2.70
porosity ratio0.995
porosity (%)49.87
Table 2. Percentage of each particle size of mineral soil.
Particle Size (mm)>55~22~11~0.50.5~0.250.25~0.075<0.075
percentage content (%)5241518151013
Table 3. Oxide content of mineral soil.
OxideNa2OMgOAL2O3SiO2SO3K2OCaO
Content (%) 0.1460.12734.97548.2510.0291.8470.098
OxideTiO2MnOFe2O3NiOZnOGa2O3Rb2O
Content (%) 0.0370.0801.9940.0040.0190.0090.041
OxideY2O3ZrO2Nd2O3Yb2O3WO3PbOThO2
Content (%) 0.0970.0280.0310.0140.0070.0410.007
Table 4. Basic physical properties of rare earth minerals with different fines content.
Fines Content (%)Pore Ratio (e)Average Particle Size D50 (mm)Curvature Coefficient CcCoefficient of Inhomogeneity Cu
50.97 0.87 0.93 9.15
101.06 0.80 1.13 12.20
151.23 0.79 3.59 45.41
201.31 0.72 3.84 53.93
251.37 0.65 2.42 60.29
301.45 0.55 0.77 63.12
Table 5. Fine-grained content and initial permeability coefficients.
Fine Grain Content (%) Initial Permeability Coefficient (10−4 cm/s)
510.30
108.40
154.55
201.99
251.57
301.01
Table 6. Unevenness coefficients and initial permeability coefficients.
Unevenness Coefficient CuInitial Permeability Coefficient (10−4 cm/s)
9.1510.30
12.208.40
45.414.55
53.931.99
60.291.57
63.121.01
Table 7. Average particle size D50 and initial permeability coefficient.
Average Particle Size D50 (mm) Initial Permeability Coefficient (10−4 cm/s)
0.8710.30
0.808.40
0.794.55
0.721.99
0.651.57
0.551.01
Table 8. Intergranular Pore Ratio and Permeability Coefficient.
Intergranular Porosity Ratio esInitial Permeability Coefficient (10−4 cm/s)
1.0710.30
1.298.40
1.624.55
1.891.99
2.161.57
2.501.01
Disclaimer/Publisher’s Note: The statements, opinions and data contained in all publications are solely those of the individual author(s) and contributor(s) and not of MDPI and/or the editor(s). MDPI and/or the editor(s) disclaim responsibility for any injury to people or property resulting from any ideas, methods, instructions or products referred to in the content.

