Abstract
In this paper, we report the effect of annealing on the first hydrogenation behavior of Ti48.8Fe46.0Mn5.2 alloy. This alloy was produced by gas atomization, and a portion of the powder was subjected to vacuum annealing at 1120 °C for 1 h. The goal was to investigate the usefulness of this atomized powder for hydrogen storage and also to investigate the effect of annealing. Scanning electron microscopy (SEM) images revealed that both atomized and annealed alloys exhibit a two-phase structure. The atomized alloy consists of a main TiFe matrix and a filamentous Ti2Fe-like phase. After annealing, the microstructure is globular. In addition to the microstructure, there was a change in the chemical composition of the matrix and secondary phase after annealing. The first hydrogenation at room temperature of both atomized and annealed samples required cold rolling. However, the kinetics was much slower for the annealed sample compared to the atomized sample. After the first hydrogenation, the XRD analysis identified the main phases as TiFe, TiFeH0.94, and Ti2FeH3, indicating that both the TiFe and Ti2Fe phases participated in hydrogen absorption during hydrogenation.
1. Introduction
Hydrogen is gaining attention as a renewable energy carrier due to its versatility and clean energy potential. When it comes to hydrogen storage, a reliable and efficient method is crucial for the wide utilization of hydrogen. Solid-state storage in metal hydrides could be suitable for storing hydrogen for a variety of applications [1,2]. Among the many different types of metal hydrides, TiFe has shown great potential for hydrogen storage applications due to its reasonable hydrogen storage capacity of 1.86 wt.% at low pressure and room temperature. Furthermore, this alloy is made from cost-effective raw materials. However, a major challenge is the first hydrogenation, the so-called activation, which is usually slow at room temperature. This is most likely due to the formation of surface oxides that act as a barrier for hydrogen dissociation and absorption [3,4,5,6]. In the pioneering work of Reilly and Wiswall [7], the first hydrogenation was preceded by heating the alloy to over 400 °C for 30 min, either in a vacuum or at low hydrogen pressure, and then cooling it to room temperature and applying a high hydrogen pressure of approximately 6000 kPa. The process had to be repeated several times until the hydrogenation occurred in about 15 min. Since then, several studies have used this type of activation procedure for TiFe alloys [8,9,10].
In addition to the above-mentioned repeated heating process, the activation issue can be overcome by other approaches: the addition of transition elements such as Mn [11,12], Zr [13,14], Cr [15], V [16,17], and Y [18,19]; the addition of excess Ti in the stoichiometry [20]; and mechanical treatments [21,22,23]. Lv et al. studied the effects of doping, cold rolling, and forging on the microstructure and hydrogen storage properties of air-exposed TiFe + x wt.% (Zr + 2V) (x = 0, 4, 5, and 6) alloys [14]. They concluded that doping with (Zr + 2V) significantly improved the first hydrogenation kinetics of TiFe due to the formation of an hcp secondary phase, which can enhance the diffusion of hydrogen. Forging effectively reduced the incubation time and enhanced the first hydrogenation kinetics, while cold rolling improved the absorption kinetics but resulted in a lower hydrogen capacity.
Patel et al. investigated the effect of Zr and Mn on the microstructure and the first hydrogenation kinetics of TiFe alloy [24]. They concluded that the fastest kinetics and highest capacity were reached by doping with 2 wt% Mn and 4 wt% Zr. The enhanced activation kinetics was attributed to the presence of a large proportion of Ti2Fe-type phase, potentially because this phase could act as a gateway, facilitating hydrogen entry into the TiFe phase.
Ulate-Kolitsky et al. investigated the first hydrogenation of both cold-rolled and ball-milled TiFe-based alloy synthesized by gas atomization [21]. Cold rolling was shown to be more effective than ball milling for the regeneration of air-exposed atomized powder. Edalati et al. have shown that mechanical processing using severe plastic deformation (SPD) is effective at accelerating the hydrogenation kinetics [23]. They attributed it to the diffusivity of hydrogen that can be enhanced because of the high dislocation and grain boundary density and high concentration of vacancies after SPD processing.
In this paper, the cold rolling method is used for the activation of Ti48.8Fe46.0Mn5.2 alloy produced by gas atomization. Atomization is a method that is utilized by industries to produce commercial alloys. However, as this method involves rapid cooling, there are some concerns regarding the stability of the resulting phases. Moreover, atomized powders are often fragile and difficult to compact without heat treatment [25]. Therefore, it is crucial to understand the effects of annealing on the phase stability, microstructural evolution, and chemical composition. In addition, annealing can significantly affect the hydrogenation properties of metal hydrides. Abe and Kuji noted that the TiFe alloy prepared by the mechanical alloying method exhibited a lower plateau pressure and reduced hydrogen reversibility at room temperature. However, after annealing at 600 °C for 3 h, a wide plateau area could be obtained [26]. According to a study by Lee et al., the activation process of the TiFe compound can be facilitated by incorporating a small quantity of Cr or Mn as substitutes for Fe. However, when subjected to a homogenization treatment at 900 °C for 80 h, the activation rate decreased due to alterations in the amount and morphology of the secondary phase [27]. This indicates that annealing could improve the hydrogen absorption properties of the alloys by reducing the plateau pressure in the PCT curve. However, compositional and morphological changes after annealing may adversely affect activation. Additionally, for industrial applications, annealing for a long duration could be too costly. Therefore, the effects of a short annealing time on the microstructure and hydrogen storage properties of Ti48.8Fe46.0Mn5.2 alloy synthesized by gas atomization were investigated.
2. Materials and Methods
The Ti48.8Fe46.0Mn5.2 alloy was produced by GKN Hoeganaes Innovation Centre and Advanced Materials. The gas atomization was performed under pure argon with a VIGA-type furnace with a free-fall atomization ring configuration. After synthesis, the powder was stored in the air. A portion of the atomized powder was vacuum annealed at 1120 °C for 1 h in a batch furnace.
The morphology and microstructure of the powder were analyzed using a Hitachi Su1510 scanning electron microscope (Hitachi High-Tech Canada, Inc., Toronto, ON, Canada) equipped with an EDX—Energy Dispersive X-ray spectrometer (Oxford instrument, Abingdon, UK). The crystal structure of the alloys was analyzed by X-ray diffraction (XRD) measurement carried out on a Bruker D8 Focus diffractometer (Madison, WI, USA) with CuKα radiation. The XRD patterns were analyzed by the Rietveld method using TOPAS software v 7.0 (Bruker, Madison, WI, USA) to determine the alloy’s phase abundance, lattice parameter, and crystallite size [28].
Cold rolling was performed vertically in the air with a modified Durston DRM 130 rolling mill (High Wycombe, Buckinghamshire, UK). The powder was inserted between two 316 stainless steel plates to avoid contamination by the rolls. Samples were cold rolled for 5 passes (5 CR).
The sample’s hydrogen capacities and absorption kinetics were evaluated using a homemade Sievert-type apparatus. One gram of powders was placed in a sample holder and evacuated for 15 min before kinetic measurements. The absorption measurements were taken at room temperature (25 °C) under 2000 kPa of hydrogen pressure or at 90 °C and a hydrogen pressure of 4500 kPa.
3. Results and Discussion
3.1. Microstructure
Figure 1 shows the backscattered electron micrographs of Ti48.8Fe46.0Mn5.2 alloys in as-atomized (AS) and vacuum-annealed (VA) conditions. The microstructure reveals the presence of two distinct regions: a matrix (gray) and a darker gray region. In the as-atomized alloy, the darker regions have a filamentous structure, while in the VA sample, they are globular, forming distinct islands.
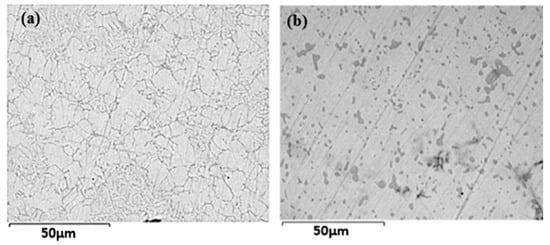
Figure 1.
Backscattered electron micrographs of Ti48.8Fe46.0Mn5.2 alloys: (a) as-atomized; (b) after vacuum annealing.
Figure 2 shows a higher magnification image of the atomized alloy analyzed by EDX. At this magnification, two distinct secondary regions are visible: a gray region and a black region. The chemical compositions of the bulk material and each region are shown in Table 1. The values represent the elemental compositions (in atomic percent, at.%) of different phases within the as-atomized alloy, determined by Energy Dispersive X-ray (EDX) analysis. These compositions reflect the distribution of Ti, Fe, and Mn in the matrix and secondary phases. We see that the bulk composition is slightly different than the nominal one. Unfortunately, we do not have the ‘error’ on the nominal composition, but the difference is so small that we assume that the bulk composition is the real composition of the alloy. For the matrix region, the composition is TiFe with a small amount of Mn. Both the black and gray regions are Ti-rich and have a Mn concentration slightly higher than that in the matrix. In fact, the stoichiometry of these two regions is close to Ti2Fe. The Ti2Fe is not a stable phase and is not included in the ASM phase diagram [29]. Reilly et al. tried to synthesize Ti2Fe in order to study its hydrogen absorption behavior [7]. They found that it exists above 1000 °C and that below this temperature, it decomposes to TiFe and Ti. Dong et al. prepared Ti2Fe alloy using an arc furnace followed by remelting in an induction furnace and subsequent spin quenching [30]. They reported that the structure type of Ti2Fe is Ti2Ni. Guéguen et al. observed Ti2Fe precipitates in the TiFe matrix after arc melting and annealing at 1000 °C for one week under argon atmosphere [17]. Therefore, despite not being a stable phase, Ti2Fe could be relatively easy to obtain in Ti-Fe alloys under specific high-temperature conditions followed by rapid cooling or controlled annealing. In our study, the sample was produced by gas atomization, where the melt underwent rapid cooling. Additionally, the annealing temperature is comparable to the heat treatment temperatures in the above-mentioned studies. In the present investigation, the Ti2Fe phase was obtained after just one hour of annealing.
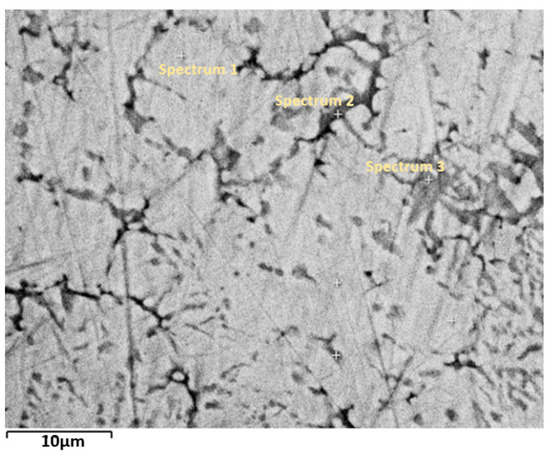
Figure 2.
Higher magnification image of the microstructure of the as-atomized sample. Spectrum 1: matrix, spectrum 2: black region, spectrum 3: gray region.

Table 1.
EDX analysis of phases of atomized alloys. Error on the last significant digit is indicated in parentheses.
The higher magnification image of the vacuum-annealed sample (Figure 3) revealed a two-phase microstructure: a gray matrix and a dark secondary phase. The EDX analysis results are presented in Table 2. First, it shows that the bulk composition agrees with the bulk value given in Table 1, thus proving that the actual composition of the alloy given by the bulk values is the real one. Contrary to the matrix composition of the as-atomized alloy, the matrix has a composition that is much closer to the TiFe stoichiometry with Fe being substituted by Mn. The dark phase composition is close to (Ti, Mn)2Fe.
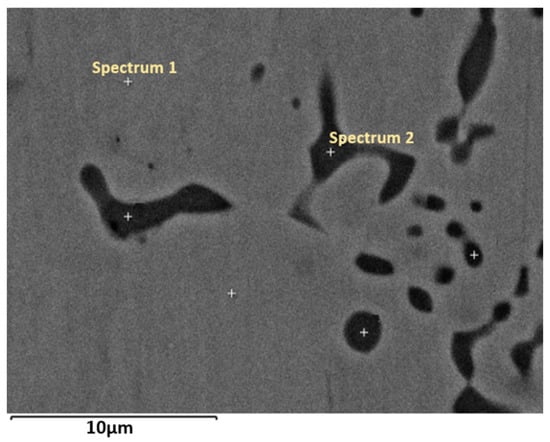
Figure 3.
Higher magnification image of the microstructure of the vacuum annealed sample. Spectrum 1: matrix, spectrum 2: black region.
Table 2.
EDX analysis showing the elemental composition of the matrix and secondary phase of vacuum-annealed alloy. Error on the last significant digit is indicated in parentheses.
Comparing the EDX results before and after annealing shows a change in the matrix composition. Before annealing, the matrix composition was Ti47.5Fe48.4Mn4.1, while after annealing, the matrix composition was closer to the nominal composition, and Mn only substituted for Fe. This is very close to the composition given by Fruchart et al., who found that Mn substitutes for Fe in the TiFe crystal structure [31]. In the as-atomized sample, the secondary phase exhibited slightly different compositions, with two distinct regions, namely, gray and black, dispersed within the matrix. After annealing, only a black phase is dispersed into the matrix. The Ti and Fe concentrations in this region are close to the average of the gray and black regions in the as-atomized sample. However, after annealing, the Mn content in the secondary phase decreased compared to that in the as-atomized sample. The stoichiometry of the secondary phase is then Ti1.87Mn0.14Fe. Thus, for the TiFe matrix phase, Mn substitutes for Fe, while for the secondary Ti2Fe phase, Mn substitutes for Ti.
The X-ray diffraction (XRD) patterns of the as-atomized and vacuum-annealed samples are shown in Figure 4. The main phase was identified as TiFe for both alloys. The peaks of the secondary phase could be observed in the XRD pattern after annealing, and it was identified as Ti2Fe, which is consistent with the results of the EDS analysis. The absence of the Ti2Fe phase in the AS sample can be attributed to the lower abundance and the thickness of this phase, which, as observed in SEM analysis, is only a fraction of a micron thick, while in the VA sample, the Ti2Fe phase grows to a thickness of several microns. Considering the penetration depth of X-rays, the Ti2Fe phase diffracts weakly in the AS sample, making it undetectable in the XRD pattern.
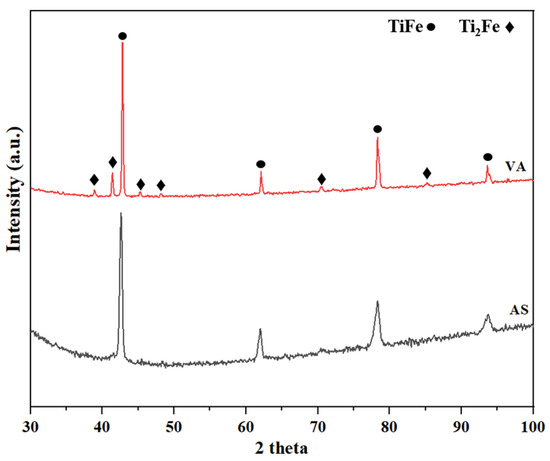
Figure 4.
X-ray diffraction patterns of AS (as-atomized) and VA (vacuum-annealed) alloys.
Table 3 displays the phase fraction, lattice parameters, and crystallite size for each phase as determined by Rietveld refinement. For both the AS and VA samples, the lattice parameter is slightly bigger than the 2.97838 (6) Å of TiFe measured by Jung et al. [32].
Table 3.
Rietveld refinement results of AS (as-atomized) and VA (vacuum-annealed) alloys. The error is shown in parentheses.
From the Rietveld refinement, we evaluated the crystallite size and microstrain. The crystallite size is the coherent domain of the crystal structure. When the crystallite size is less than around 100 nm, this broadening is important enough to be seen on the Bragg peaks. The microstrain is due to a distribution of both tensile and compressive forces, which results in a broadening of the Bragg peak. This type of broadening depends on the diffraction angle and thus could be distinguished from the broadening due to crystallite size. The microstrain thus represents the variation in lattice parameters due to strain and is expressed as a % with respect to the average lattice parameter.
The annealing process also led to a noticeable increase in crystallite size and a reduction in the microstrain for the TiFe phase. This growth is easily explained by recrystallization because of the annealing temperature (1200 °C), which is close to the TiFe melting point (1317 °C). In addition to the increase in crystallite size, a reduction in the microstrain was observed. Microstrain is typically reduced during annealing, as the material’s internal stresses decrease due to the reduction in defects.
3.2. First Hydrogenation
The hydrogenation was performed under two different conditions: at room temperature (21 °C) and 2000 kPa of hydrogen pressure and at 90 °C under 4500 kPa of hydrogen. For both conditions, the experiment ran for a period of 24 h. For both AS and VA samples, no hydrogen uptake was registered under these conditions. This could be due to the long air exposure before hydrogenation. In order to ‘regenerate’ the samples, they were subjected to five passes of cold rolling in the air. Previous studies have shown that this technique is effective in enabling the first hydrogenation of TiFe alloys. Ulate-Kolitsky et al. reported that five passes of cold rolling is efficient for the activation of TiFe alloys synthesized by gas atomization [21]. Manna et al. investigated the effect of air exposure on the TiFe+4 wt.% Zr alloy and found that the seven-day air-exposed alloy did not absorb hydrogen, but cold rolling successfully led to the recovery of the alloy [33].
Figure 5 shows the curves of the first hydrogenation at RT/2000 kPa after five passes of cold rolling. The AS-5CR sample started to absorb hydrogen after about 1000 s, and it reached the capacity of 1.56 wt.% in 24 h. However, the VA-5CR sample did not absorb hydrogen in 24 h. The fast activation of the AS-5CR sample even at RT has shown that five passes of cold rolling is efficient for the regeneration of atomized TiFe(Mn) alloys.
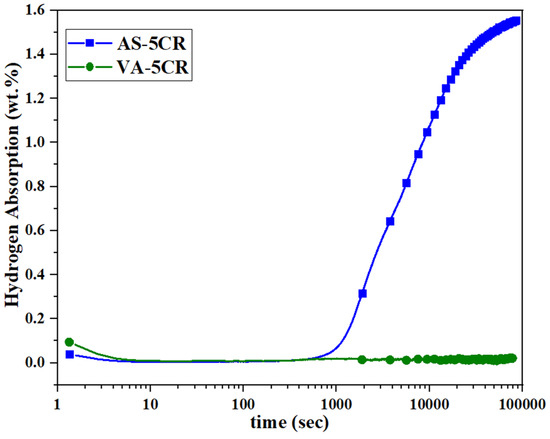
Figure 5.
Activation curves of AS and VA samples after 5 CR at room temperature and a hydrogen pressure of 2000 kPa.
Since the VA-5CR sample did not activate at RT and 2000 kPa, the temperature was increased to 90 °C and the hydrogen pressure to 4500 kPa to investigate the effect of elevated pressure and temperature on its activation behavior. As seen in Figure 6, under these conditions, both samples absorbed hydrogen. The AS-5CR sample exhibited rapid kinetics, starting hydrogen absorption within 40 s and reaching a capacity of 1.42 wt.% after 24 h. In contrast, the annealed sample demonstrated a longer incubation time of 7200 s and finally achieved a capacity of 1.2 wt.% after 24 h.
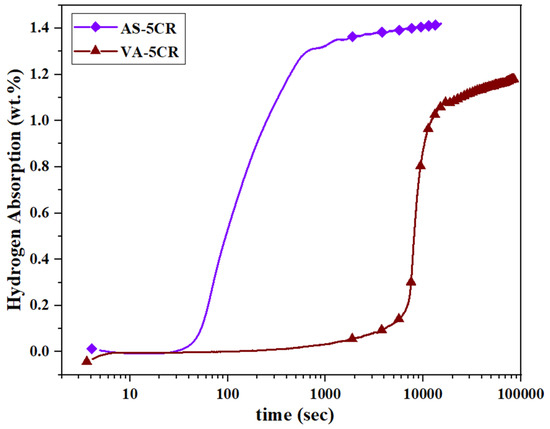
Figure 6.
Activation curves of AS and VA samples after 5 CR at 90 °C and a hydrogen pressure of 4500 kPa.
Based on these results, it was determined that annealing is not appropriate for the TiFe alloy studied in this work. It seems that the hydrogenation behavior of the TiFe alloy is strongly influenced by the chemical composition and morphology of the secondary phase. After heat treatment, the phases’ chemical compositions are marginally changed, but the morphology has been drastically changed from filamentous to globular. These changes may be responsible for the longer incubation time of the VA sample. The presence of a filamentous secondary phase seems to facilitate the hydrogen uptake by providing nucleation points for the hydride phase and a diffusion pathway for the hydrogen. After annealing, the secondary phase becomes more spheroidized, resulting in the reduction of pathways available for hydrogen within the alloy. This decrease in the interfacial region ultimately leads to a reduction in hydrogenation kinetics. In addition, SEM studies (Figure 2 and Figure 3) revealed the presence of two distinct secondary regions within the TiFe matrix of the as-atomized alloy. However, after heat treatment, a dark secondary phase was observed in the matrix. EDS analysis (Table 1 and Table 2) further confirmed the compositional changes following heat treatment. These compositional changes could potentially influence the hydrogen absorption behavior of the alloy.
Additionally, annealing also induced recrystallization in the primary TiFe phase, as evidenced by an increase in crystallite size and a reduction in microstrain determined from the Rietveld refinement of the XRD patterns (Table 3). While recrystallization reduces internal stresses, it also eliminates some of the grain boundaries that act as key diffusion pathways for hydrogen. Grain boundaries enhance hydrogen diffusion by serving as low-energy sites for hydrogen absorption and movement. The combination of a reduced interfacial area in the secondary phase and a decrease in the grain boundary density in the matrix likely explains the observed decline in hydrogenation performance [34,35].
Figure 7 presents the X-ray diffraction (XRD) patterns of the samples after cold rolling, and Table 4 shows the Rietveld refinement results. Comparing the results before and after cold rolling reveals that the cold rolling process reduced the crystallite size and increased the microstrain. Decreasing the crystallite size leads to more grain boundaries. Therefore, the reduction in crystallite size and formation of a fresh surface due to crushing during cold rolling could lead to faster hydrogen absorption. The effectiveness of highly strained grain boundaries as effective trapping sites for hydrogen has been shown by Emami et al. [34]. Similarly, Lv et al. have shown that the grain boundaries formed by cold rolling could act as diffusion points for hydrogen [14].
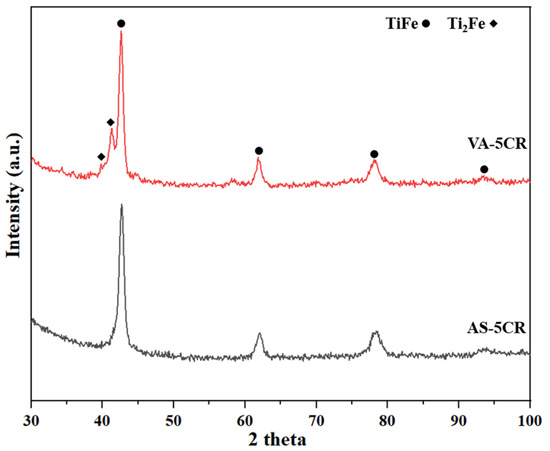
Figure 7.
X-ray diffraction patterns of AS (as-atomized) and VA (vacuum-annealed) alloys after 5 passes of cold rolling.
Table 4.
Rietveld refinement results of AS-5CR and VA-5CR. The error is shown in parentheses.
Figure 8 shows the X-ray diffraction (XRD) patterns of AS and VA samples after activation at 90 °C and 4500 kPa. The corresponding phase fractions, lattice parameters, and crystallite sizes are presented in Table 5. In order to preserve the hydride state, after hydrogenation at 90° C, the sample was cooled to room temperature under hydrogen pressure. The diffraction pattern was registered in the air shortly after removing the sample from the sample holder. Upon analysis of the activated samples, XRD reveals the presence of the TiFe, TiFeH0.94,, and Ti2FeHX phases. The presence of the TiFe peak after activation in the XRD pattern indicates that the sample starts desorbing at room temperature and atmospheric pressure. The TiFe phase fraction was reduced due to the presence of the orthorhombic TiFeH0.94 phase. This phase was identified by Reidinger et al. on the desorption of TiFe hydride [36]. The lattice parameters of the TiFeH0.94 phase presented in Table 5 are close to the lattice parameters reported by Reidinger et al.
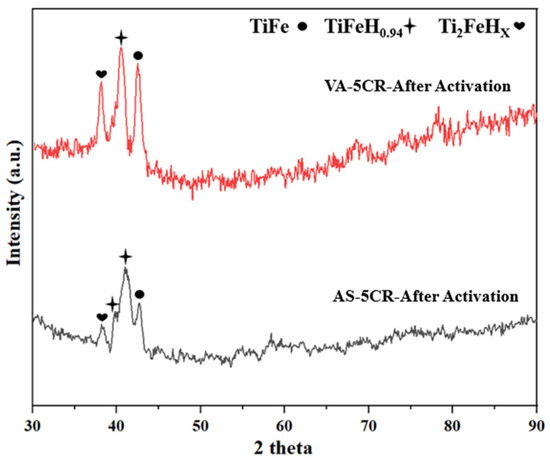
Figure 8.
X-ray diffraction patterns of AS (as-atomized) and VA (vacuum-annealed) alloys after activation.
Table 5.
Rietveld refinement results of AS (as-atomized) and VA (vacuum-annealed) alloys after activation. The error is shown in parentheses.
For the VA sample, the unit cell volume of Ti2Fe before hydrogenation is 1456 Å3, which expands to 1803 Å3 after hydrogenation. This corresponds to a volume expansion of 24%. This is consistent with previous investigations by Ulate-Kolitsky et al. [20], who reported a volume expansion of 21%. The stoichiometry of the Ti2FeHX phase can be determined by analyzing the increase in unit cell volume resulting from hydrogen uptake. The volume increase is 347 Å3, and there are 32 formula units per unit cell. Therefore, the volume variation per formula unit is estimated to be about 11 Å3. Based on the assumption that the volume of a single hydrogen atom is around 2.9 Å3 [37], the resulting stoichiometry is approximately Ti2FeH3 (~1.9 wt.%). As this sample is made up of 20% Ti2FeH3, the contribution to the total hydrogen capacity is 0.38 wt.%. The TiFeH0.94 phase makes up 40% of the sample and contains 1 wt.% hydrogen. Therefore, its contribution to the total capacity is 0.4 wt.% hydrogen. Consequently, the overall hydrogen content is about 0.8 wt.%. Given the hydrogen absorption capacity of 1.2 wt.%, this shows that the sample partially desorbed before the X-ray diffraction measurement.
In the activated AS sample, assuming the Ti2FeHX phase has a stoichiometry of approximately Ti2FeH3, the 11 wt.% of this phase contributes about 0.2 wt.% hydrogen. The sample also contains 73% TiFeH0.94, which contributes to 0.7 wt.% hydrogen. Consequently, the total hydrogen content in the sample is 0.9 wt.%. Considering the hydrogen absorption capacity of 1.4 wt.% (Figure 6), the amount of desorbed hydrogen is 0.5 wt.%. It should be pointed out that the desorbed capacities of the VA and AS samples are almost the same, at 0.4 wt% and 0.5 wt.%, respectively.
4. Conclusions
- The microstructure and first hydrogenation of Ti48.8Fe46.0Mn5.2 alloy prepared by gas atomization, before and after vacuum annealing, have been investigated.
- The microstructure of the alloy before and after annealing consists of a TiFe matrix and a secondary Ti2Fe-like phase. The secondary Ti2Fe phase exhibited a filamentous microstructure in the atomized alloy, whereas it appeared more globular in the annealed sample.
- Both the atomized and annealed alloys needed prior mechanical processing by cold rolling to absorb hydrogen. After five cold rolling passes, the atomized sample absorbed 1.56 wt.% hydrogen at room temperature and a hydrogen pressure of 2000 kPa. However, the annealed sample could not be activated in 24 h under the same conditions.
- Both the atomized and annealed samples absorbed hydrogen at 90 °C and a hydrogen pressure of 4500 kPa, but the atomized sample had faster kinetics and a higher capacity.
- Annealing after atomization had a negative effect on the activation process, probably due to recrystallization and changes in the microstructure.
- X-ray analysis identified the main phases as TiFe, TiFeH0.94, and Ti2FeHx after activation. Considering the volume expansion of the Ti2Fe phase upon hydrogenation, the resulting stoichiometry is approximately Ti2FeH3.
Author Contributions
Conceptualization, J.H and C.S.; validation, S.H. and J.H.; formal analysis, S.H.; investigation, S.H.; writing—original draft preparation, S.H.; writing—review and editing, S.H., C.S., and J.H.; supervision, J.H.; project administration, J.H and C.S. All authors have read and agreed to the published version of the manuscript.
Funding
This research was funded by GKN Hoeganaes Innovation Centre and Advanced Materials and MITACS.
Data Availability Statement
The original contributions presented in this study are included in the article. Further inquiries can be directed to the corresponding author.
Acknowledgments
Seyedehfaranak Hosseinigourajoubi acknowledges GKN Hoeganaes Innovation Centre and Advanced Materials and MITACS for a fellowship.
Conflicts of Interest
Author Chris Schade was employed by GKN Hoeganaes Innovation Centre & Advanced Materials. The remaining authors declare that the research was conducted in the absence of any commercial or financial relationships that could be construed as a potential conflict of interest. Besides, the authors declare that this study received funding from GKN Hoeganaes Innovation Centre and Advanced Materials. The funder was not involved in the study design, collection, analysis, interpretation of data, the writing of this article or the decision to submit it for publication.
References
- Greene, D.L.; Ogden, J.M.; Lin, Z. Challenges in the designing, planning and deployment of hydrogen refueling infrastructure for fuel cell electric vehicles. eTransportation 2020, 6, 100086. [Google Scholar] [CrossRef]
- Bosu, S.; Rajamohan, N. Recent advancements in hydrogen storage—Comparative review on methods, operating conditions and challenges. Int. J. Hydrog. Energy 2024, 52, 352–370. [Google Scholar] [CrossRef]
- Edalati, K.; Matsuo, M.; Emami, H.; Itano, S.; Alhamidi, A.; Staykov, A.; Smith, D.J.; Orimo, S.-i.; Akiba, E.; Horita, Z. Impact of severe plastic deformation on microstructure and hydrogen storage of titanium-iron-manganese intermetallics. Scr. Mater. 2016, 124, 108–111. [Google Scholar] [CrossRef]
- Liu, H.; Zhang, J.; Sun, P.; Zhou, C.; Liu, Y.; Fang, Z.Z. An overview of TiFe alloys for hydrogen storage: Structure, processes, properties, and applications. J. Energy Storage 2023, 68, 107772. [Google Scholar] [CrossRef]
- Dematteis, E.; Berti, N.; Cuevas, F.; Latroche, M.; Baricco, M. Substitutional effects in TiFe for hydrogen storage: A comprehensive review. Mater. Adv. 2021, 2, 2524–2560. [Google Scholar] [CrossRef]
- Dematteis, E.M.; Dreistadt, D.M.; Capurso, G.; Jepsen, J.; Cuevas, F.; Latroche, M. Fundamental hydrogen storage properties of TiFe-alloy with partial substitution of Fe by Ti and Mn. J. Alloys Compd. 2021, 874, 159925. [Google Scholar] [CrossRef]
- Reilly, J.J.; Wiswall, R.H. Formation and properties of iron titanium hydride. Inorg. Chem. 1974, 13, 218–222. [Google Scholar] [CrossRef]
- Zhu, H.Y.; Wu, J.; Wang, Q.D. Reactivation behaviour of TiFe hydride. J. Alloys Compd. 1994, 215, 91–95. [Google Scholar] [CrossRef]
- Lee, S.M.; Perng, T.P. Microstructural correlations with the hydrogenation kinetics of FeTi1+ξ alloys. J. Alloys Compd. 1991, 177, 107–118. [Google Scholar] [CrossRef]
- Schober, T.; Westlake, D.G. The activation of FeTi for hydrogen storage: A different view. Scr. Metall. 1981, 15, 913–918. [Google Scholar] [CrossRef]
- Padhee, S.P.; Roy, A.; Pati, S. Role of Mn-substitution towards the enhanced hydrogen storage performance in FeTi. Int. J. Hydrog. Energy 2022, 47, 9357–9371. [Google Scholar] [CrossRef]
- Miller, H.I.; Murray, J.; Laury, E.; Reinhardt, J.; Goudy, A.J. The hydriding and dehydriding kinetics of FeTi and Fe0.9TiMn0.1. J. Alloys Compd. 1995, 231, 670–674. [Google Scholar] [CrossRef]
- Li, C.; Gao, X.; Liu, B.; Wei, X.; Zhang, W.; Lan, Y.; Wang, H.; Yuan, Z. Effects of Zr doping on activation capability and hydrogen storage performances of TiFe-based alloy. Int. J. Hydrog. Energy 2023, 48, 2256–2270. [Google Scholar] [CrossRef]
- Lv, P.; Liu, Z.; Dixit, V. Improved hydrogen storage properties of TiFe alloy by doping (Zr + 2V) additive and using mechanical deformation. Int. J. Hydrog. Energy 2019, 44, 27843–27852. [Google Scholar] [CrossRef]
- Chen, Z.; Guo, F.; Sunamoto, R.; Yin, C.; Miyaoka, H.; Ichikawa, T. Anti-oxidation effect of chromium addition for TiFe hydrogen storage alloys. J. Alloys Compd. 2024, 1008, 176634. [Google Scholar] [CrossRef]
- Kumar, S.; Tiwari, G.P.; Sonak, S.; Jain, U.; Krishnamurthy, N. High performance FeTi—3.1 mass % V alloy for on board hydrogen storage solution. Energy 2014, 75, 520–524. [Google Scholar] [CrossRef]
- Guéguen, A.; Latroche, M. Influence of the addition of vanadium on the hydrogenation properties of the compounds TiFe0.9Vx and TiFe0.8Mn0.1Vx (x = 0, 0.05 and 0.1). J. Alloys Compd. 2011, 509, 5562–5566. [Google Scholar] [CrossRef]
- Han, Z.; Yuan, Z.; Zhai, T.; Feng, D.; Sun, H.; Zhang, Y. Effect of yttrium content on microstructure and hydrogen storage properties of TiFe-based alloy. Int. J. Hydrog. Energy 2023, 48, 676–695. [Google Scholar] [CrossRef]
- Li, C.; Lan, Y.; Wei, X.; Zhang, W.; Liu, B.; Gao, X.; Yuan, Z. Improvement of hydrogen absorption and desorption properties of TiFe-based alloys by adding yttrium. J. Alloys Compd. 2022, 927, 166992. [Google Scholar] [CrossRef]
- Ulate-Kolitsky, E.; Tougas, B.; Huot, J. First Hydrogenation of TiFe with Addition of 20 wt.% Ti. Hydrogen 2022, 3, 379–388. [Google Scholar] [CrossRef]
- Ulate-Kolitsky, E.; Tougas, B.; Neumann, B.; Schade, C.; Huot, J. First hydrogenation of mechanically processed TiFe-based alloy synthesized by gas atomization. Int. J. Hydrog. Energy 2021, 46, 7381–7389. [Google Scholar] [CrossRef]
- Patel, A.K.; Siemiaszko, D.; Dworecka-Wójcik, J.; Polański, M. Just shake or stir. About the simplest solution for the activation and hydrogenation of an FeTi hydrogen storage alloy. Int. J. Hydrog. Energy 2022, 47, 5361–5371. [Google Scholar] [CrossRef]
- Edalati, K.; Matsuda, J.; Yanagida, A.; Akiba, E.; Horita, Z. Activation of TiFe for hydrogen storage by plastic deformation using groove rolling and high-pressure torsion: Similarities and differences. Int. J. Hydrog. Energy 2014, 39, 15589–15594. [Google Scholar] [CrossRef]
- Patel, A.K.; Duguay, A.; Tougas, B.; Schade, C.; Sharma, P.; Huot, J. Microstructure and first hydrogenation properties of TiFe alloy with Zr and Mn as additives. Int. J. Hydrog. Energy 2020, 45, 787–797. [Google Scholar] [CrossRef]
- Neikov, O.D. Chapter 4—Atomization and Granulation. In Handbook of Non-Ferrous Metal Powders, 2nd ed.; Neikov, O.D., Naboychenko, S.S., Yefimov, N.A., Eds.; Elsevier: Oxford, UK, 2019; pp. 125–185. [Google Scholar]
- Abe, M.; Kuji, T. Hydrogen absorption of TiFe alloy synthesized by ball milling and post-annealing. J. Alloys Compd. 2007, 446–447, 200–203. [Google Scholar] [CrossRef]
- Lee, S.M.; Perng, T.P. Effect of the second phase on the initiation of hydrogenation of TiFe1−xMx (M = Cr,Mn) alloys. Int. J. Hydrog. Energy 1994, 19, 259–263. [Google Scholar] [CrossRef]
- Evans, J.S.O. Advanced Input Files & Parametric Quantitative Analysis Using Topas. Mater. Sci. Forum 2010, 651, 1–9. [Google Scholar] [CrossRef]
- Okamoto, H.; Schlesinger, M.E.; Mueller, E.M. Alloy Phase Diagrams; ASM International: Detroit, MI, USA, 2016. [Google Scholar] [CrossRef]
- Dong, C.; Hei, Z.K.; Wang, L.B.; Song, Q.H.; Wu, Y.K.; Kuo, K.H. A new icosahedral quasicrystal in rapidly solidified FeTi2. Scr. Metall. 1986, 20, 1155–1158. [Google Scholar] [CrossRef]
- Fruchart, D.; Commandré, M.; Sauvage, D.; Rouault, A.; Tellgren, R. Structural and activation process studies of FeTi-like hydride compounds☆. J. Less Common Met. 1980, 74, 55–63. [Google Scholar] [CrossRef]
- Jung, J.Y.; Lee, Y.-S.; Suh, J.-Y.; Huh, J.-Y.; Cho, Y.W. Tailoring the equilibrium hydrogen pressure of TiFe via vanadium substitution. J. Alloys Compd. 2021, 854, 157263. [Google Scholar] [CrossRef]
- Manna, J.; Tougas, B.; Huot, J. Mechanical activation of air exposed TiFe + 4 wt% Zr alloy for hydrogenation by cold rolling and ball milling. Int. J. Hydrog. Energy 2018, 43, 20795–20800. [Google Scholar] [CrossRef]
- Emami, H.; Edalati, K.; Matsuda, J.; Akiba, E.; Horita, Z. Hydrogen storage performance of TiFe after processing by ball milling. Acta Mater. 2015, 88, 190–195. [Google Scholar] [CrossRef]
- Lv, P.; Guzik, M.N.; Sartori, S.; Huot, J. Effect of ball milling and cryomilling on the microstructure and first hydrogenation properties of TiFe + 4wt.% Zr alloy. J. Mater. Res. Technol. 2019, 8, 1828–1834. [Google Scholar] [CrossRef]
- Reidinger, F.; Lynch, J.F.; Reilly, J.J. An X-ray diffraction examination of the FeTi-H2 system. J. Phys. F Met. Phys. 1982, 12, L49. [Google Scholar] [CrossRef]
- Kirchheim, R.; Pundt, A. 25—Hydrogen in Metals. In Physical Metallurgy, 5th ed.; Laughlin, D.E., Hono, K., Eds.; Elsevier: Oxford, UK, 2014; pp. 2597–2705. [Google Scholar]
Disclaimer/Publisher’s Note: The statements, opinions and data contained in all publications are solely those of the individual author(s) and contributor(s) and not of MDPI and/or the editor(s). MDPI and/or the editor(s) disclaim responsibility for any injury to people or property resulting from any ideas, methods, instructions or products referred to in the content. |
© 2025 by the authors. Licensee MDPI, Basel, Switzerland. This article is an open access article distributed under the terms and conditions of the Creative Commons Attribution (CC BY) license (https://creativecommons.org/licenses/by/4.0/).