Article

Reaction Behavior of Biochar Composite Briquette Under H2-N2 Atmosphere: Experimental Study

State Key Laboratory of Advanced Metallurgy, University of Science and Technology Beijing, Beijing 100083, China
*
Author to whom correspondence should be addressed.
Metals 2025, 15(3), 236; https://doi.org/10.3390/met15030236
Submission received: 9 January 2025 / Revised: 18 February 2025 / Accepted: 19 February 2025 / Published: 23 February 2025
(This article belongs to the Special Issue Advances in Ironmaking and Steelmaking Processes (2nd Edition))

Abstract

:
Charging biochar composite briquettes (BCBs) and the injection of hydrogen-rich gas into the blast furnace (BF) are two efficient methods for reducing CO2 emission in BF ironmaking. This study investigated the reaction behavior of BCBs under a hydrogen-rich atmosphere to explore the potential combination of these two methods for enhanced CO2 emission reduction efficiency in the BF. The employed BCB had a chemical composition of 52.57 wt.% Fe3O4, 24.54 wt.% FeO, 0.98 wt.% Fe, 13.16 wt.% C, and 8.75 wt.% gangue. Isothermal BCB reaction tests were conducted using a custom-design thermogravimetric device under temperatures ranging from 1173 K to 1373 K and under an atmosphere of N2-H2 with a H2 content from 25 vol.% to 75 vol.%. A mathematical model was developed for the kinetics of the BCB reaction behavior under the H2-N2 atmosphere. Results showed that the developed model was adequate in predicting the reaction behavior of BCB. Under an atmosphere of 50 vol.% H2-N2, increasing the temperature from 1173 K to 1373 K resulted in a decrease in the fraction of iron-oxide oxygen removed by hydrogen from 62% to 26% and an increase in the fraction removed by biochar from 29% to 72%, indicating that hydrogen is the primary reducing agent under low temperatures, whereas, under high temperatures, biochar plays a more significant role. Under a constant temperature of 1273 K, increasing the H2 content in the atmosphere from 25 vol.% to 75 vol.% led to an increase in the fraction of iron-oxide oxygen removed by hydrogen from 37% to 45%, and a decrease in the fraction removed by biochar from 57% to 53%, suggesting that a higher H2 content enhances the iron oxide reduction by hydrogen but has little impact on the reduction by biochar. In the reaction process, the main products were CO and H2O, the iron oxide reduction occurred more rapidly near the center than near the surface, whereas the gasification of biochar followed the opposite trend. The structural transformation of the BCB progressed from sinter iron oxides into the metallic iron network in the reaction.

1. Introduction

Steel materials play a significant role in the world’s economy, and currently, the steel demand is still increasing [1]. In traditional ironmaking processes, the blast furnace (BF) method has advantages, such as a simple process and high efficiency, making the BF-BOF (blast furnace-basic oxygen converter) process the predominant route for producing iron and steel. However, BF ironmaking, together with the coke plant and sinter plant, is responsible for most of the CO2 emissions in the BF-BOF process and accounts for more than 70% of the total energy consumption [2,3]. In recent years, global climate change has become one of the most important issues. To combat global warming, the green and low-carbon development of BF ironmaking has become a core issue.
In conventional BF ironmaking, coke and pulverized coal (PC) are used as reducing agents. To reduce the reliance on carbon-based fossil fuels, BF ironmaking is increasingly turning its attention to alternative energy sources such as hydrogen and biomass [4,5]. Biomass is a renewable energy. Biomass could be used in BF ironmaking in many routes including coking [6,7], sintering [8,9], and BF tuyere injection [10]. One promising method for utilizing biomass is charging the biochar composite briquette (BCB) in the BF for the partial substitution of coke [11,12,13]. Other than CO2, the byproduct of hydrogen reduction is H2O. The utilization of hydrogen in the BF is realized by the injection of hydrogen-bearing gases (natural gas and coke oven gas) from the tuyere [14,15,16], aiming to replace PC. The massive injection of hydrogen has been tested on an industrial scale. Thus, it is expected that a combination of these two technologies (BCB charging and massive hydrogen injection) can further improve the efficiency of low-carbon operations in BFs. In conventional BFs, hydrogen is usually insignificant in BF gas, so studies on the BCB reaction behavior in BFs do not consider the influence induced by hydrogen [17]. However, in the case of BF operations with massive hydrogen injections, the hydrogen content in BF gas is considerably increased and its influence on the BCB reaction behavior becomes important. If one wants to determine the most favorable working conditions for BF ironmaking using BCB charging and massive hydrogen injection, it is necessary to understand the kinetics of the reaction between BCB and hydrogen in the BF. However, up to now, no studies on the reaction kinetics and the reaction development of BCB under the H2-rich BF gas have been carried out.
In this study, a H2-N2 mixture was used to simulate the H2-rich BF gas, and the BCB reaction behavior under the H2-N2 atmosphere in temperatures ranging from 1173 K to 1373 K was studied. A mathematical model was first developed and validated. Thereafter, the influences of reaction temperature and hydrogen content on BCB reaction behavior were investigated, and at the same time, the microstructure evolution in the BCB was examined.

2. Materials and Methods

2.1. BCB Preparation

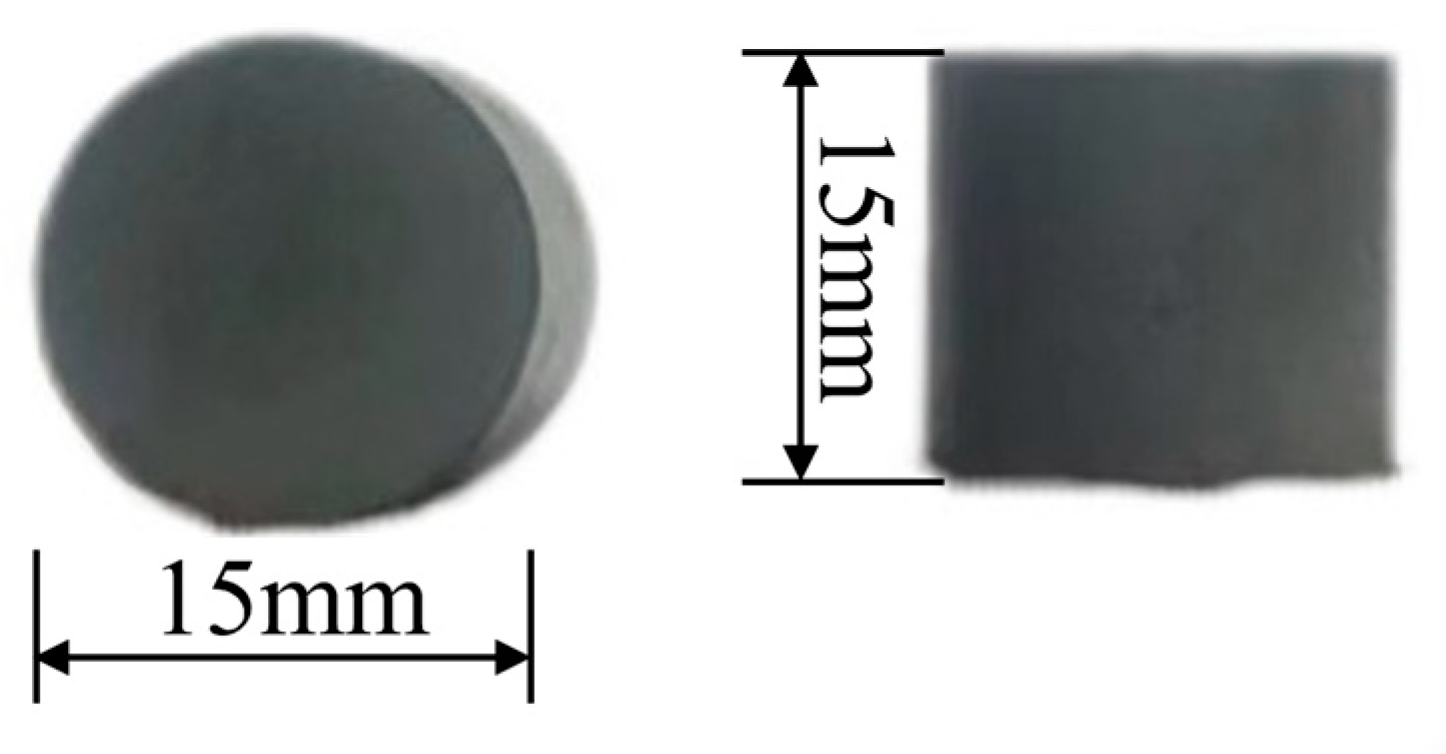
The raw materials for preparing the BCB sample were iron oxide fines, quartz fines, and biochar fines. The biochar (Figure 1) was prepared using jujube wood and was supplied by a local farm. The obtained biochar was further carbonized under 1173 K (900 °C) to remove the volatile, and then grounded. The prepared biochar fines had an average size of 120 μm. Its composition is shown in Table 1. The iron oxide fines and quartz fines were chemical agents supplied by Sinochem Company (Beijing, China). The BCB was prepared under a mass ratio of hematite:quartz:biochar = 80:5:15, the details for preparing the BCB qualified for BF ironmaking are given elsewhere [18]. The image of the prepared BCB is shown in Figure 2. Both the diameter and the height of the BCB were 15 mm. Its composition is listed in Table 2.

2.2. Experiment

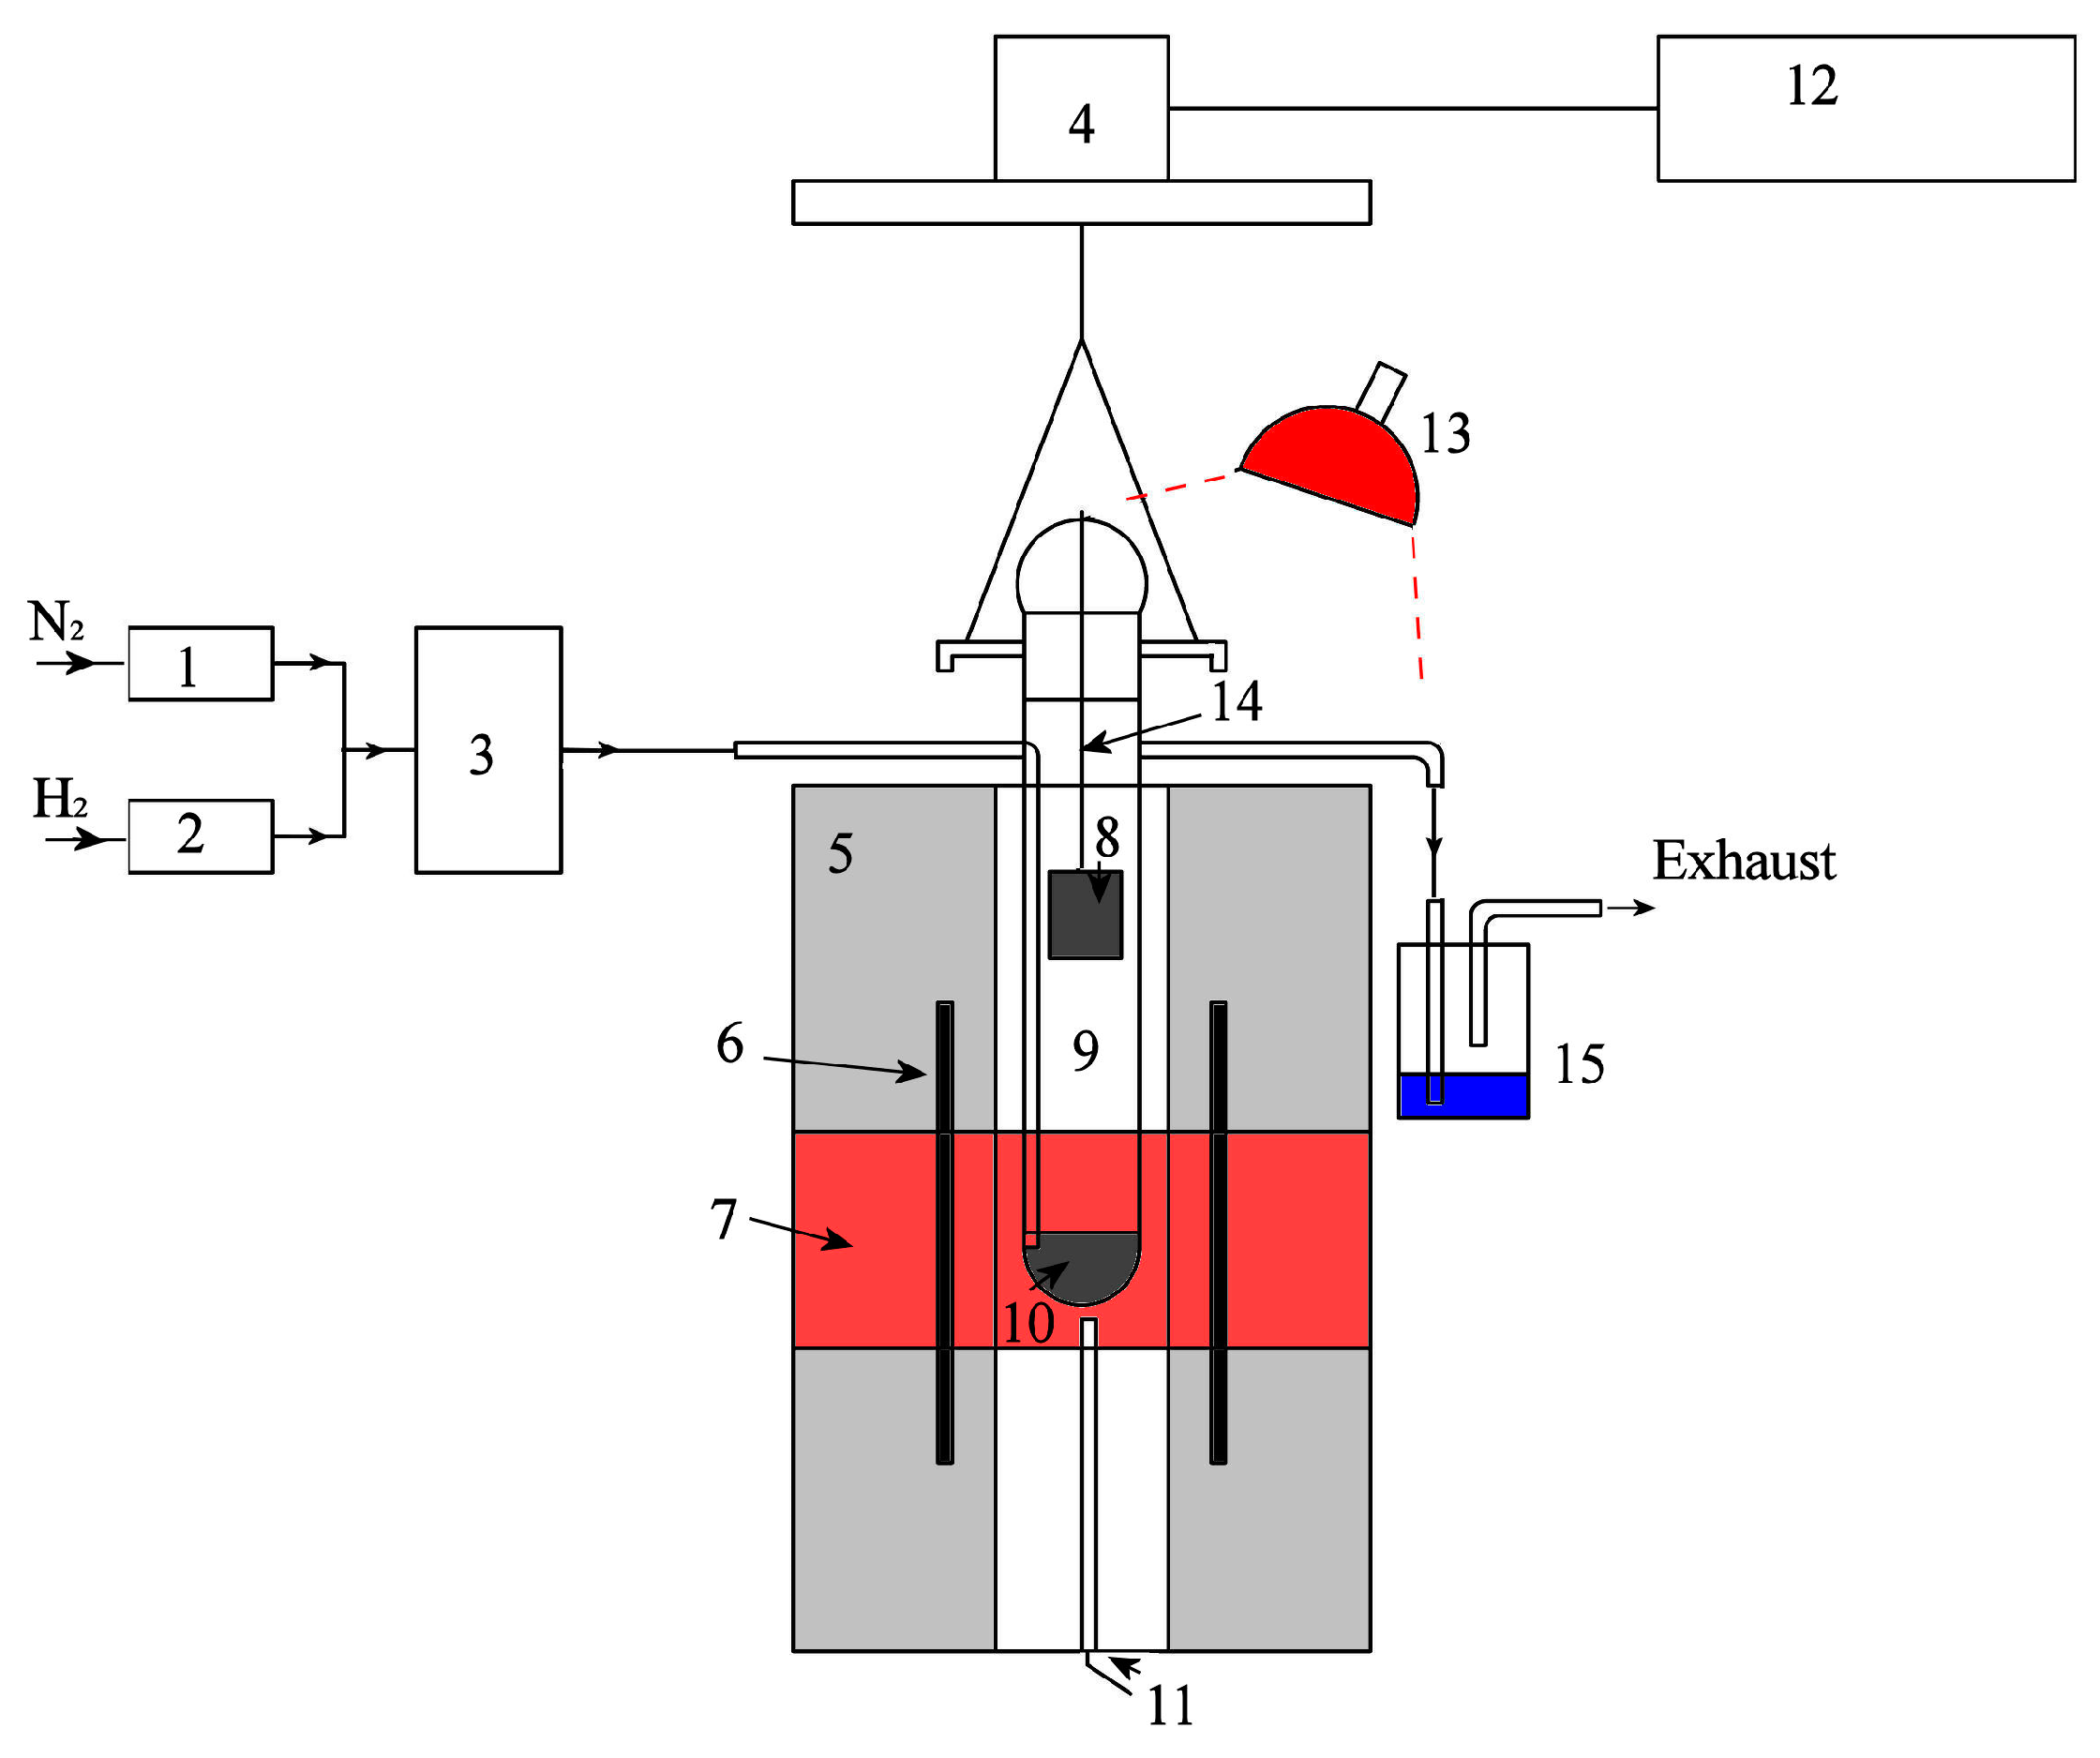
A self-designed experimental apparatus was used as shown in Figure 3. The device consists of a gas supply system, a temperature-controlled tubular furnace, a reaction tube, an IR heater, and a data acquisition system. The furnace was heated using silicon molybdenum (MoSi2) elements, producing a 60 mm constant temperature zone in the furnace. The reaction tube (Diameter: 30 mm, Length: 600 mm) was made of quartz. The data acquisition system includes a mass-loss sensor and a computer. An infrared (IR) heater was installed near the gas outlet to prevent the condensation of steam in the exhaust. In the present study, five scenarios were designed (Table 3). In each scenario, the furnace and the reaction tube were first heated to the desired temperature. Thereafter, N2 was introduced into the reaction tube, and a sample holder loaded with three BCB samples (approximately 16 g) was placed above the hot temperature zone of the reaction tube for preheating. After being stabilized for 10 min, the sample holder was dropped into the hot temperature zone, and the N2 was switched to the N2-H2 mixture under a flow rate of 2000 cm3·min−1 (standard temperature and pressure). The mass-loss fraction was calculated using Equation (1). After being reacted for 30 min, the BCB samples were withdrawn and subjected to rapid cooling under a N2 atmosphere.
f m = ( m 0 m ) / m O , 0 + m C , 0
where, m 0 and m are, respectively, the initial BCB mass and the BCB mass at time t, g; m O , 0 and m C , 0 are, respectively, the mass of iron-oxide oxygen in BCB and the mass of carbon in BCB, g.
The reacted BCB samples were characterized and analyzed using the following techniques. The carbon content (WC, wt.%) was measured using a CS-2800 infrared carbon-sulfur analyzer (NCS Co., Beijing, China), and the contents of total iron (TFe, wt.%), Fe2+ ion (WFe2+, wt.%) and metallic iron (WFe, wt.%) were measured using the titrimetric (iron chloride) method. The BCB reduction fraction and gasification fraction were calculated using Equations (2) and (3), respectively [18]. Phase identification was performed using a M21X X-Ray diffractometer (XRD, MAC Science Co., Tokyo, Japan), and microstructure observation was conducted using an EV018 scanning electron microscope (SEM, ZEISS Co., Oberkochen, Germany).
f O = ( 1.5 ( T F e W F e 2 + W F e ) + W F e 2 + ) / ( 1.5 T F e )
f C = ( m W C ) / m C , 0

3. Model Formulation

For the present study, a mathematical model was developed based on the BCB reaction model under the N2-CO-CO2 mixture [11]. The prepared BCB is cylindrical, and it has the same height and diameter; therefore, in modeling, the BCB is considered to be a sphere with a diameter of 15 mm. The model is then established for the reaction of a single BCB and is one-dimensional in the radial direction. In the briquette, the iron oxide reduction and biochar gasification are assumed to proceed through gas media. Therefore, the model includes reactions in Table 4, including the step-wise reduction of iron oxide by CO (Reactions (R1)–(R3)), the step-wise reduction of iron oxide through H2 (Reactions (R4)–(R6)), biochar gasification by CO2 (Reaction (R7)), and biochar gasification by H2O (Reaction (R8)). In addition to the Reactions (R1)–(R8), the internal gas diffusion and the mass transfer between the BCB and the atmosphere are also considered in the model. Both the gas phase and the solid phase are included in the model. The gas phase is an ideal gas and includes CO, CO2, H2, H2O, and N2, and the solid phase includes Fe2O3, Fe3O4, FeO, Fe, C, and gangue.
Based on the mass balance of each species, the general governing equation of the gas phase is built based on the mass conservation of the gas species in the BCB and is given as Equation (4).
( α P ) t = 1 r 2 r ( r 2 ( α 2 D / 3 ) P r ) + S
The terms in Equation (4) are listed in Table 5. In Table 5, Di-N2 (i = CO, CO2, H2, and H2O) is calculated using the method given by Natsui et al. [19].
Under the experimental conditions, the supplied gas rate in the reaction tube was 2 L/min, indicating that the superficial gas velocity in the reaction tube under the reaction temperatures was larger than 0.2 m/s. Therefore, the effect of the boundary layer could be neglected. The boundary conditions are Equations (5) and (6), and the initial condition is Equation (7).
r = 0 : P i r = 0
r = d / 2 : P i = P i , e
t = 0 ,   r ( 0 , d / 2 ) : P i = P i ,   e  
where i = CO, CO2, H2 and H2O.
The general governing equation of the solid phase is constructed based on the mass conservation of the solid phase species and is given as Equation (8).
ρ / t = S
The terms in Equation (8) are listed in Table 6.
The initial condition for Equation (8) is Equation (9).
t = 0 ,   r ( 0 , d / 2 ) : ρ j = ρ j , 0
where j = Fe2O3, Fe3O4, FeO, and C.
Equation (4) is spatially and temporally discretized using an explicit scheme. Equation (8) is solved using an explicit time integration method. Equations (4) and (8) are solved simultaneously, and the time step is 0.001 s.

4. Results and Discussion

4.1. Model Validation

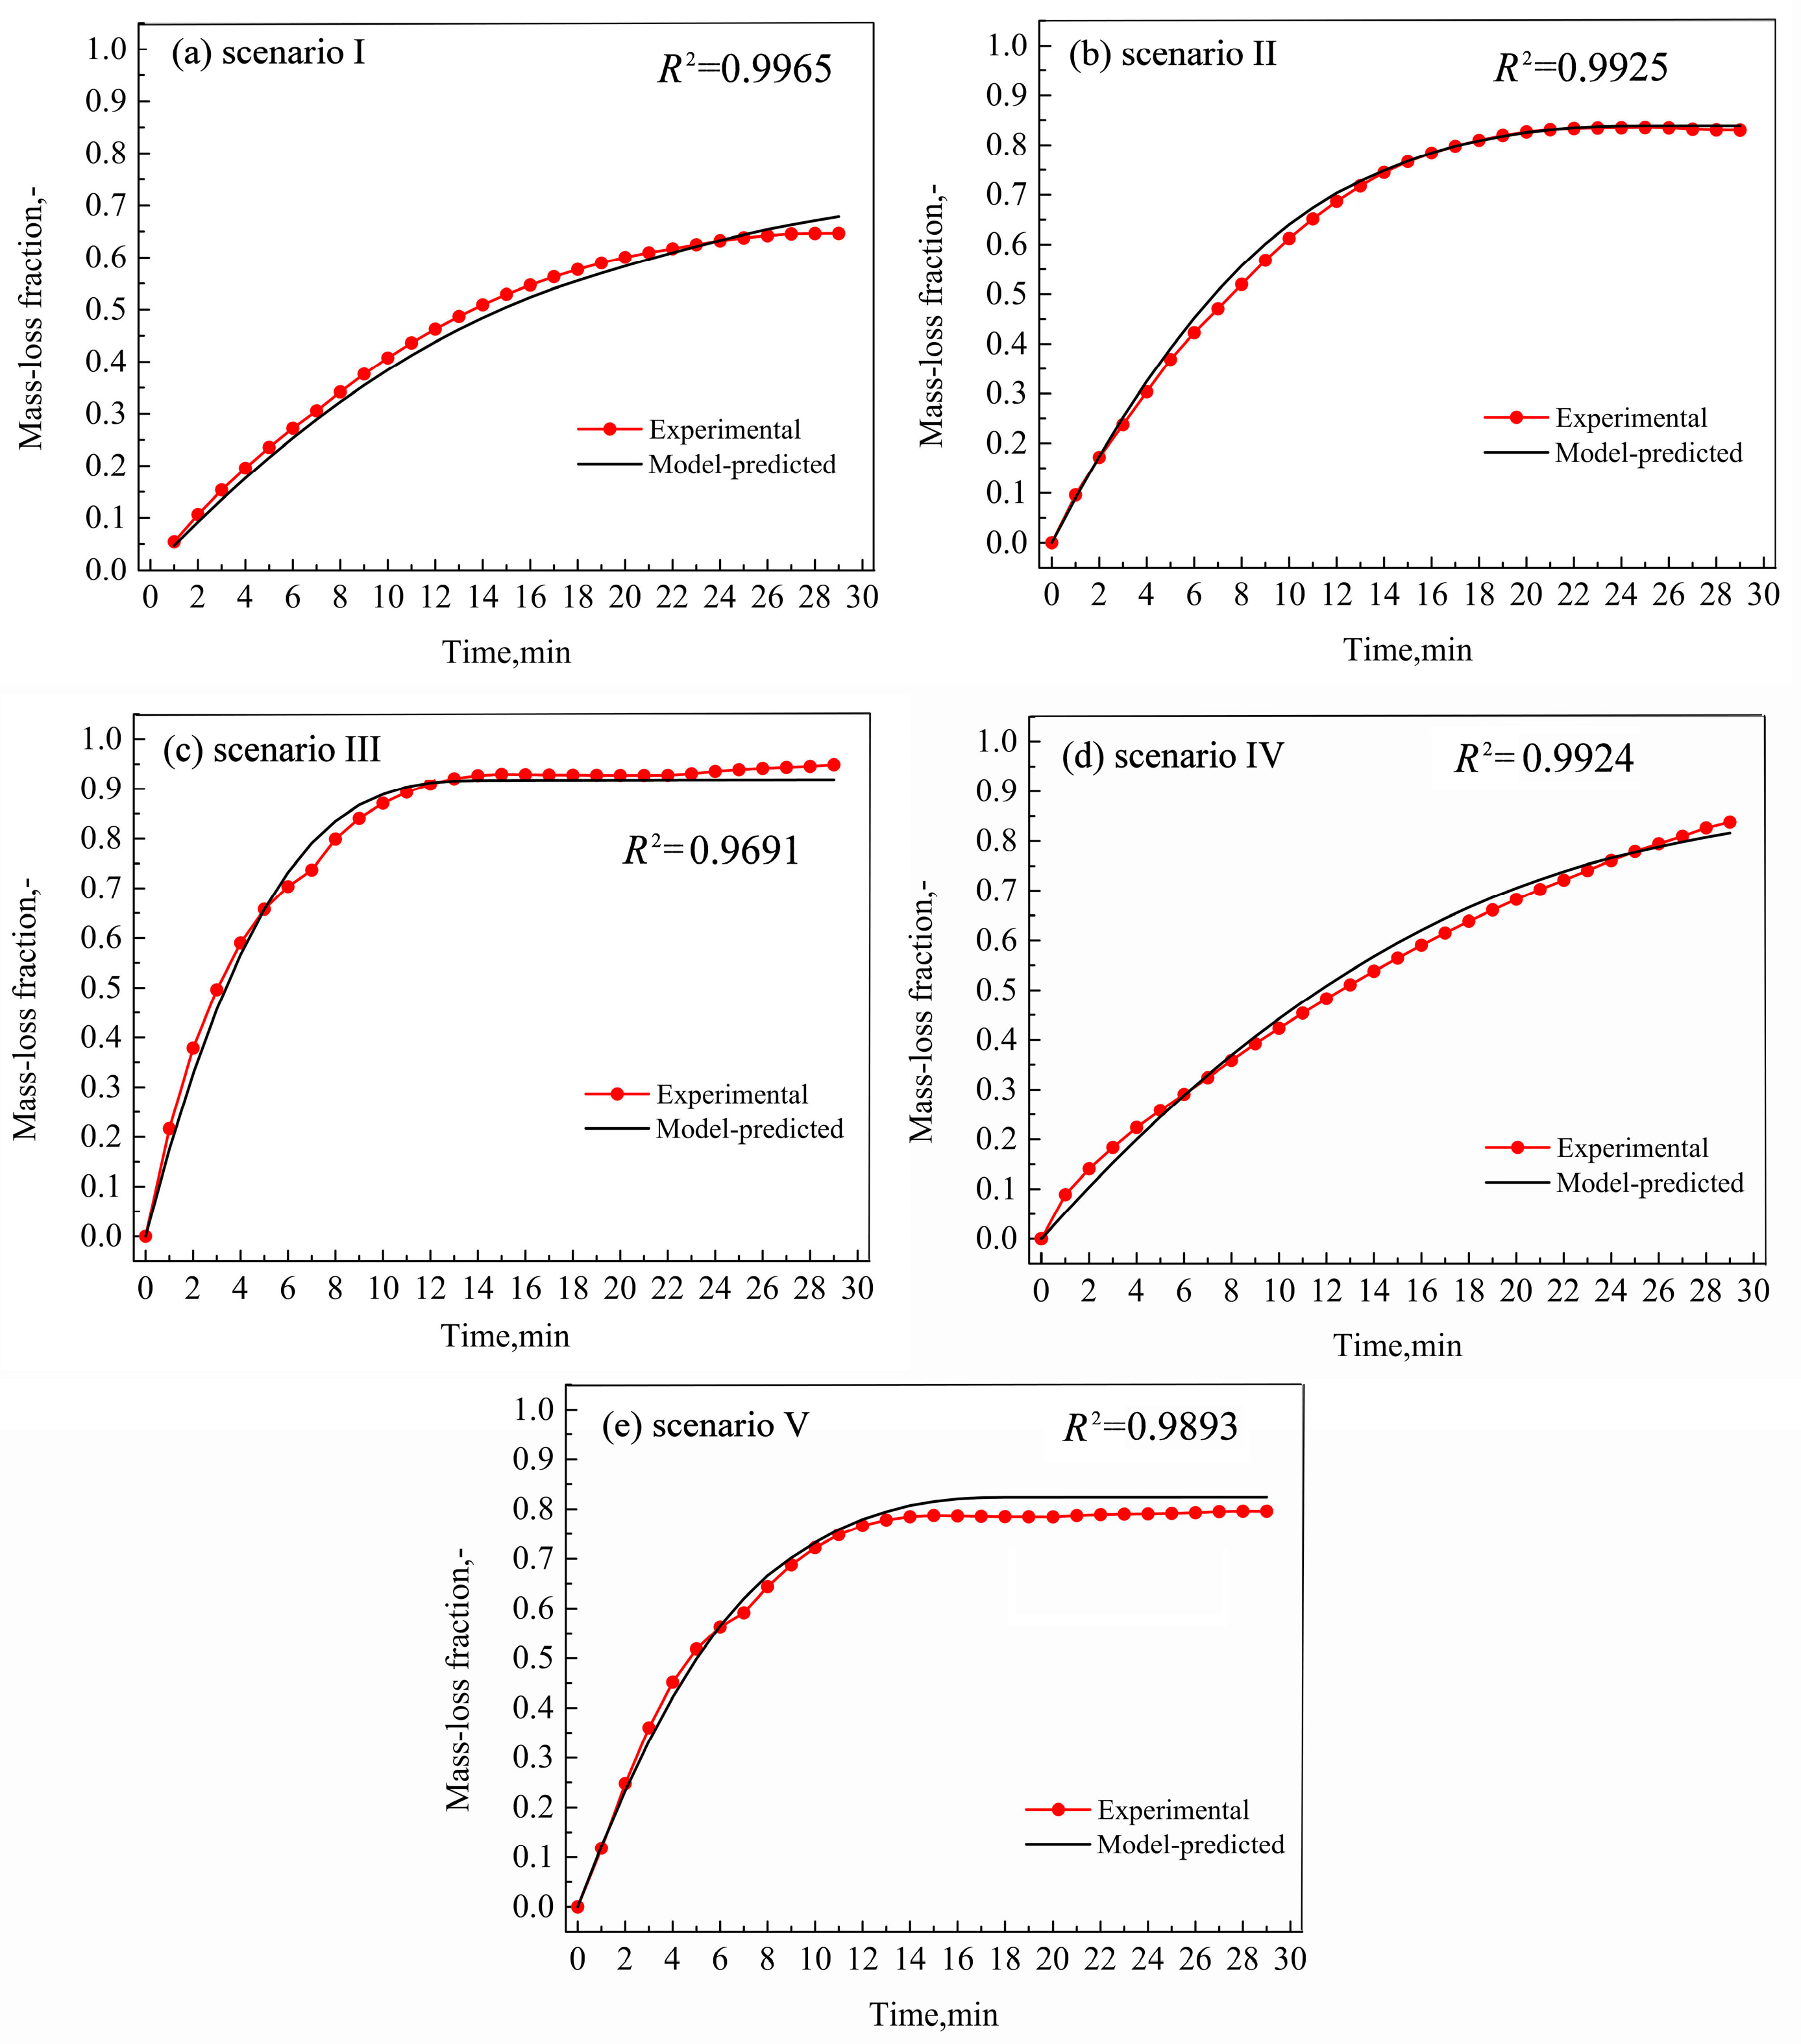
The parameter ags in the model is the gas–solid interface area of iron oxide particles in the BCB, and therefore it depends on the microstructure transformation of the briquette in the reaction process. To determine its value, a trial and error method was employed. The method is as follows. For each experimental mass-loss curve, 29 points were selected at a time step of 1 min from 1 min to 29 min. In the model, the mass-loss fraction at time t is calculated using Equation (10). The disagreement level between the model predictions and experimental measurements was evaluated using the root mean square (RMS) and is expressed as Equation (11). Different values of ags from 5 m2·m−3 to 25 m2·m−3 were tested and the results are shown in Table 7. Table 7 shows that the RMS reaches its minimal value of 0.04340 when ags = 15 m2·m−3. Therefore, the value of ags is 15 m2·m−3 in the model.
f m = 1.0 0 t ( 0 r 4 π r 2 ( ( r 1 + r 2 + r 3 + r 4 + r 5 + r 6 ) M O + ( r 7 + r 8 ) M C ) d r ) d t / ( m O + m C )
R M S = i = 1 N ( f m , sim f m , exp ) 2 / N
where f m , sim and f m , exp are the mass-loss fraction of the simulation and the mass-loss fraction of the experiment, respectively; N is the number of selected points on the mass-loss curves under the five scenarios.
Under ags = 15 m2·m−3, the model-predicted mass-loss curve and the experimental curve under each scenario were compared and the results are presented in Figure 4. In Figure 4, the coefficient of determination (R2) of each scenario was calculated. R2 is more than 0.96 for all scenarios, indicating that the agreement between them is satisfying.
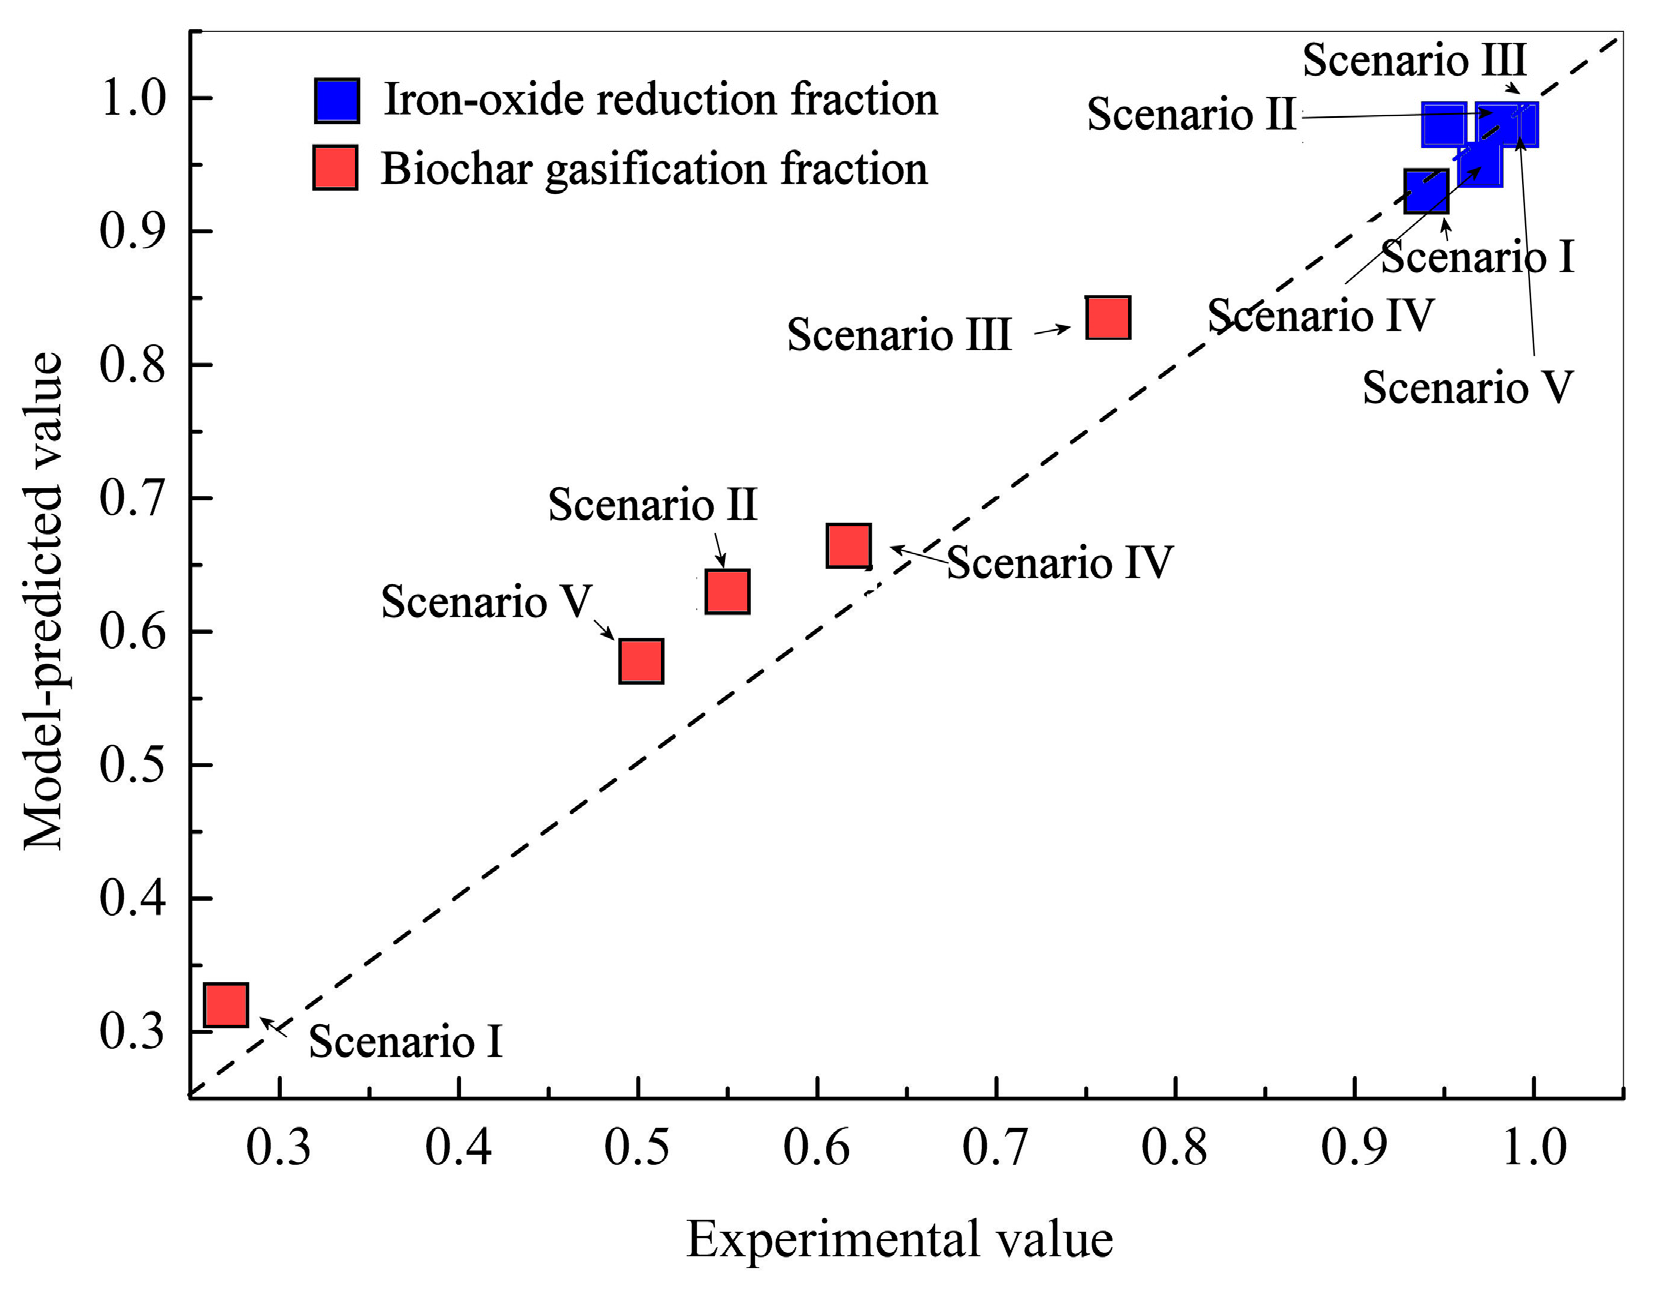
The mass-loss of the BCB in the reaction was attributed to the reduction of iron oxide and the gasification of biochar. Therefore, the final reduction fraction and final biochar gasification fraction of the BCB were also compared, results are shown in Figure 5. It can be seen in Figure 5, that all of the points are located near the diagonal line. The validation of the model can also be confirmed.

4.2. Influence of Temperature

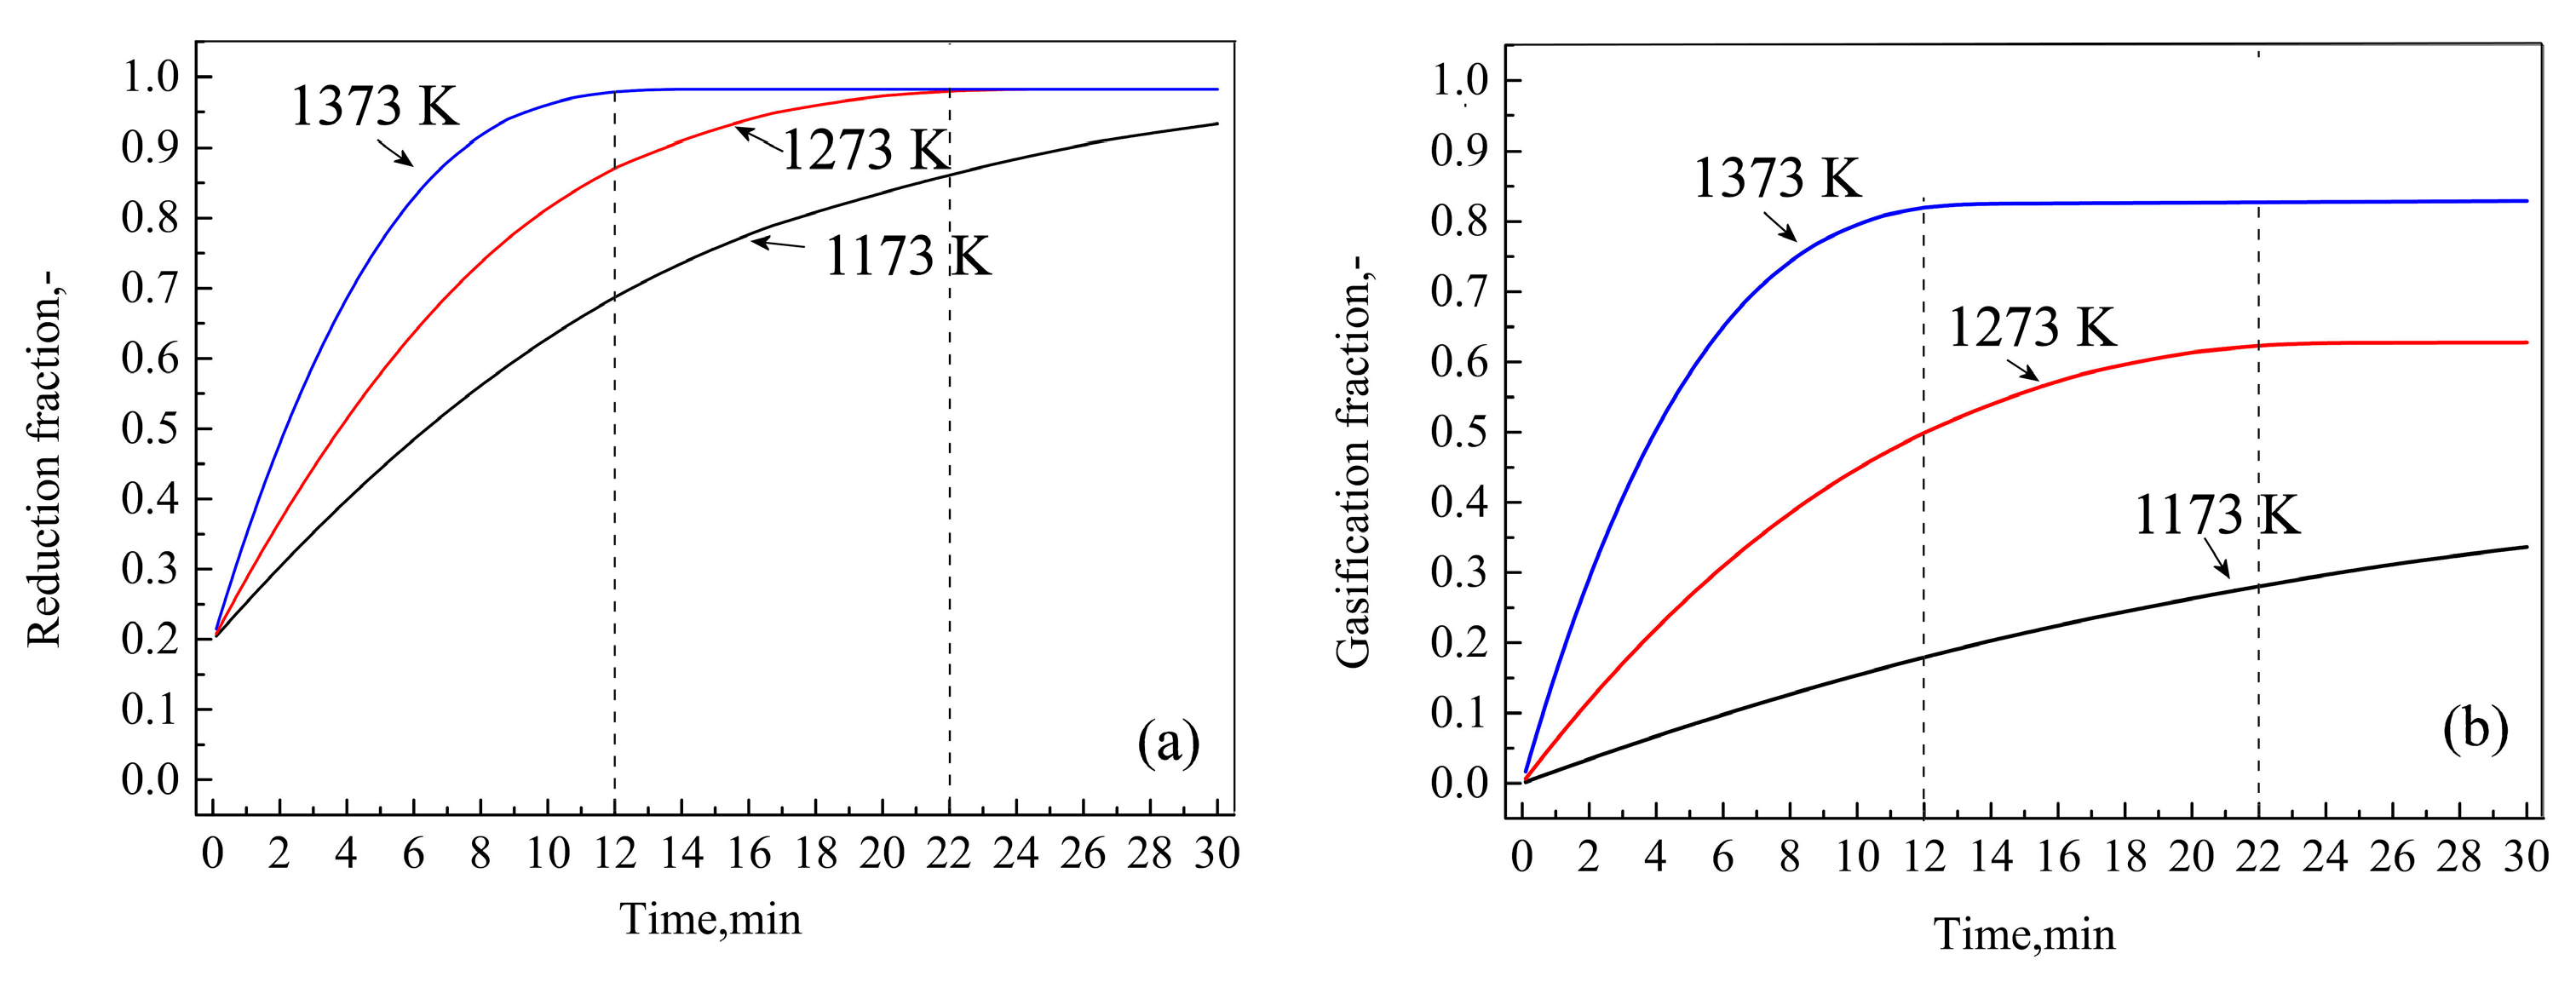
Scenarios I, II, and III were used to investigate the influence of temperature on iron oxide reduction and biochar gasification. The corresponding reaction curves, obtained under a 50 vol.% H2-N2 atmosphere at temperatures ranging from 1173 K to 1373 K, are shown in Figure 6a,b. In Figure 6, fO and fC at time t are calculated using Equations (12) and (13), respectively. Figure 6a,b indicate that both the iron oxide reduction rate and biochar gasification rate in the BCB increase with the increase in temperature. At 1373 K, iron oxide achieves full reduction within 12 min, whereas at 1273 K, complete iron oxide reduction occurs in 22 min, and at 1173 K, the reduction fraction reaches 0.90 after 30 min (Figure 6a). Since biochar gasification depends on the availability of iron-oxide oxygen in the BCB, its maximum gasification fraction reaches 0.8 at 12 min under 1373 K and 0.6 at 22 min under 1273 K, respectively; at 1173 K, biochar gasification continues to increase gradually, reaching a fraction of 0.3 by the end of the reaction period (Figure 6b).
f O = 1.0 M O 0 t ( 0 r 4 π r 2 ( r 1 + r 2 + r 3 + r 4 + r 5 + r 6 ) d r ) d t / m O
f C = 1.0 M C 0 t ( 0 r 4 π r 2 ( r 7 + r 8 ) d r ) d t / m C
The generating rates of CO, CO2, H2, and H2O under different temperatures are shown in Figure 7. In Figure 7, the gas generating rate of gas species i (i = CO, CO2, H2, and H2O) is calculated using 0 r 4 π r 2 r i d r . A positive gas-generating rate represents that the BCB releases gas to the environment, while a negative one indicates that the BCB consumes gas from the environment. As observed in Figure 7, under all temperatures, the BCB consumes H2 from the environment and releases CO, CO2, and H2O during the reaction process. CO and H2O are the dominant gases, while CO2 formation is negligible.
The reduction of iron oxide in the BCB occurs through two main pathways: reduction by hydrogen and reduction by biochar. The H2 reduction produces H2O while biochar reduction generates CO and CO2, Table 8 presents the distribution of iron-oxide oxygen removal across different pathways under scenarios I, II, and III. In Table 8, the fraction of the iron-oxide oxygen removed by hydrogen is calculated using M O 0 1800 ( 0 r 4 π r 2 ( r 4 + r 5 + r 6 r 8 ) d r ) d t / m O , the fraction removed by biochar is calculated using M O 0 1800 ( 0 r 4 π r 2 ( r 1 + r 2 + r 3 + r 8 ) d r ) d t / m O , and the fraction remaining in the BCB is given by 1.0 M O 0 1800 ( 0 r 4 π r 2 ( r 1 + r 2 + r 3 + r 4 + r 5 + r 6 ) d r ) d t / m O As shown in Table 8, increasing the temperature from 1173 K to 1373 K decreases the fraction of iron-oxide oxygen removed by hydrogen from 62% to 26%, while the fraction removed by biochar increases from 29% to 72%. Therefore, under low temperatures (e.g., 1173 K), hydrogen is the dominant reducing agent, whereas under high temperatures (e.g., 1373 K), biochar plays a more significant role.

4.3. Effect of H2 Content in the Atmosphere

Scenarios II, IV, and V were selected to investigate the effect of the H2 content on iron oxide reduction and biochar gasification. The corresponding reaction curves, obtained under H2 contents ranging from 25 vol.% to 75 vol.% at 1273 K are presented in Figure 8. As shown in Figure 8a, the iron oxide achieves complete reduction within 16 min under a 75 vol.% H2-N2 atmosphere, within 22 min under a 50 vol.% H2-N2 atmosphere, and reaches a reduction fraction of 0.90 by the end of the reaction under a 25 vol. % H2-N2 atmosphere. Therefore, increasing the H2 content in the atmosphere enhances the iron oxide reduction in the BCB. Figure 8b shows that the biochar gasification rate increases with the higher H2 content in the early stages. However, the final biochar gasification fractions remain nearly the same under different atmospheric conditions.
The generating rates of CO, CO2, H2, and H2O under different H2 contents are shown in Figure 9. It can be seen that CO and H2O remain the primary products regardless of variations in the atmospheric H2 content. The distribution of iron-oxide oxygen removal across different pathways under scenarios IV, II, and V are listed in Table 9. As shown in Table 9, increasing the H2 content in the atmosphere from 25 vol.% to 75 vol.% results in an increase in the fraction of iron-oxide oxygen removed by hydrogen from 37% to 45%, while the fraction removed by biochar decreases slightly from 57% to 53%. Indicating that a higher H2 content enhances the iron oxide reduction by hydrogen but has minimal impact on the iron oxide reduction by biochar.

4.4. Microstructure Evolution

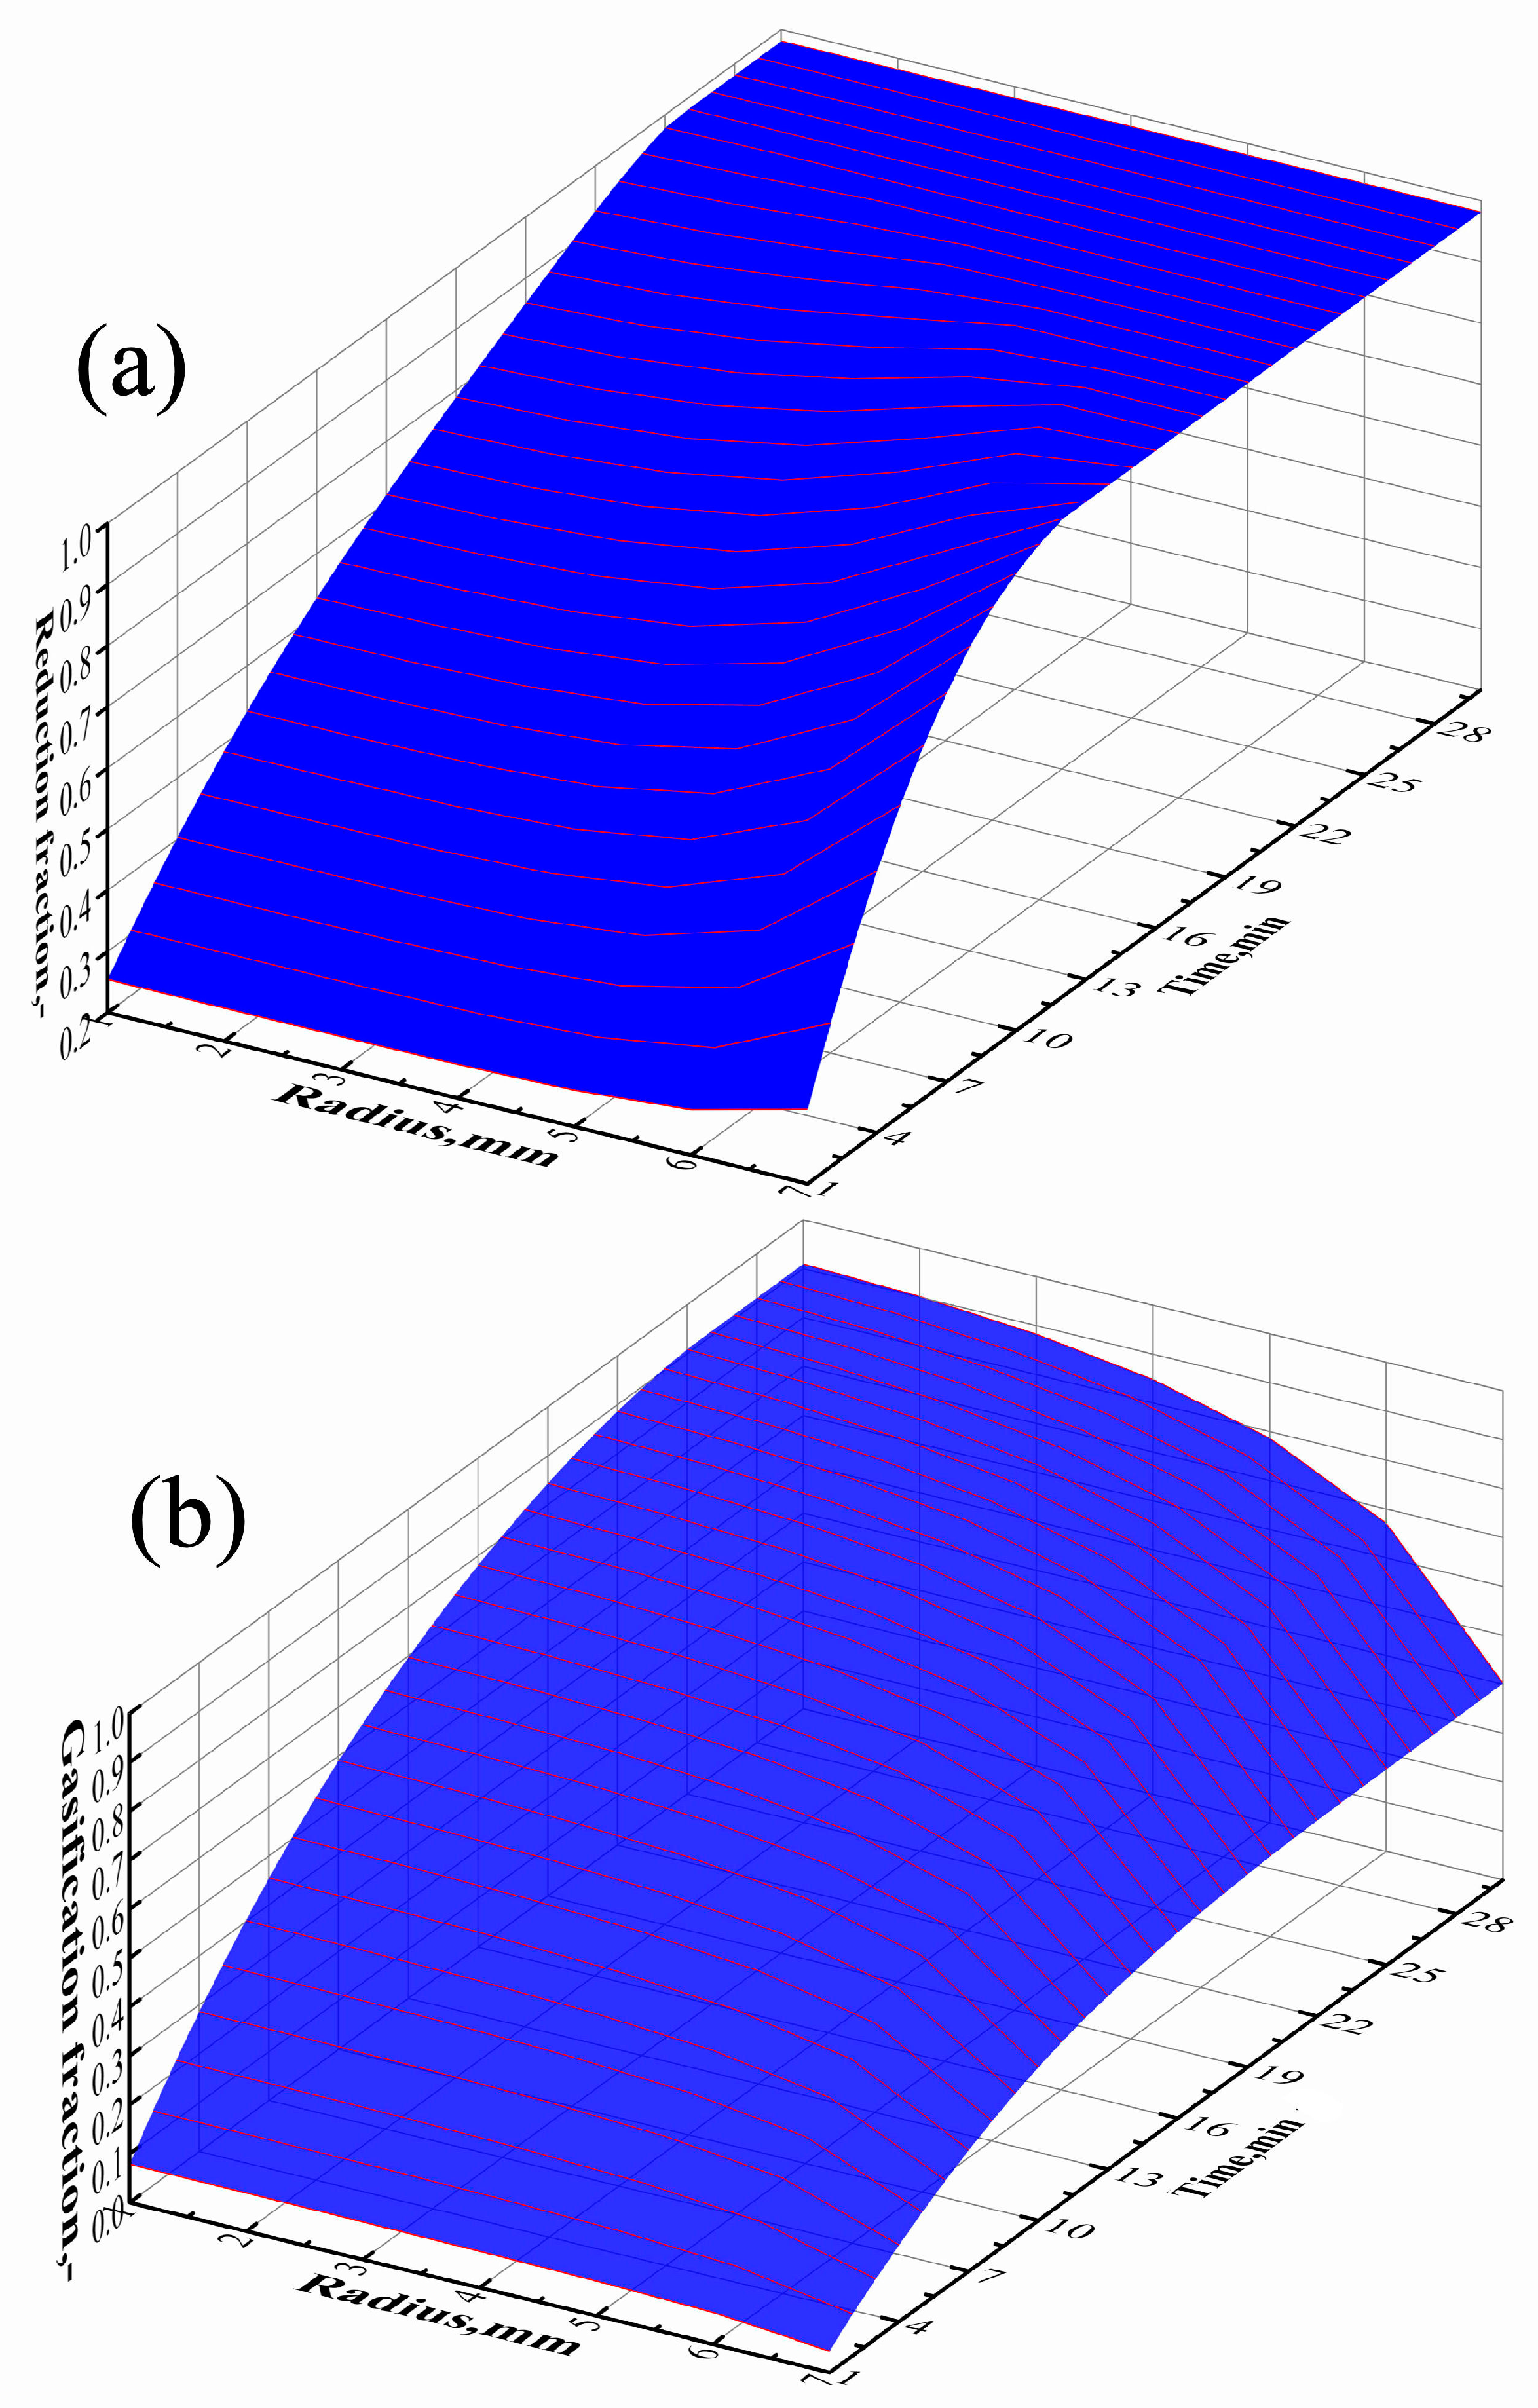
The development of the BCB microstructure in scenario II was analyzed. Simulation results revealed that the reduction of iron oxide and the gasification of biochar did not proceed uniformly throughout the BCB, as shown in Figure 10. Figure 10a illustrates the change in the radial distribution of iron oxide reduction fraction over time. Near the center, the iron oxide fines are fully reduced at approximately 25 min while near the surface this occurs at approximately 11 min, indicating that the reduction of iron oxide is much faster near the surface than near the center. Figure 10b shows the change in radial distribution of the biochar gasification fraction with time. Near the center, the biochar fines gasify rapidly, reaching a final gasification fraction of 0.90. However, the gasification rate is much slower near the surface, and the final gasification fraction is only 0.40. This reflects that biochar fines gasifies more quickly near the center than near the surface.
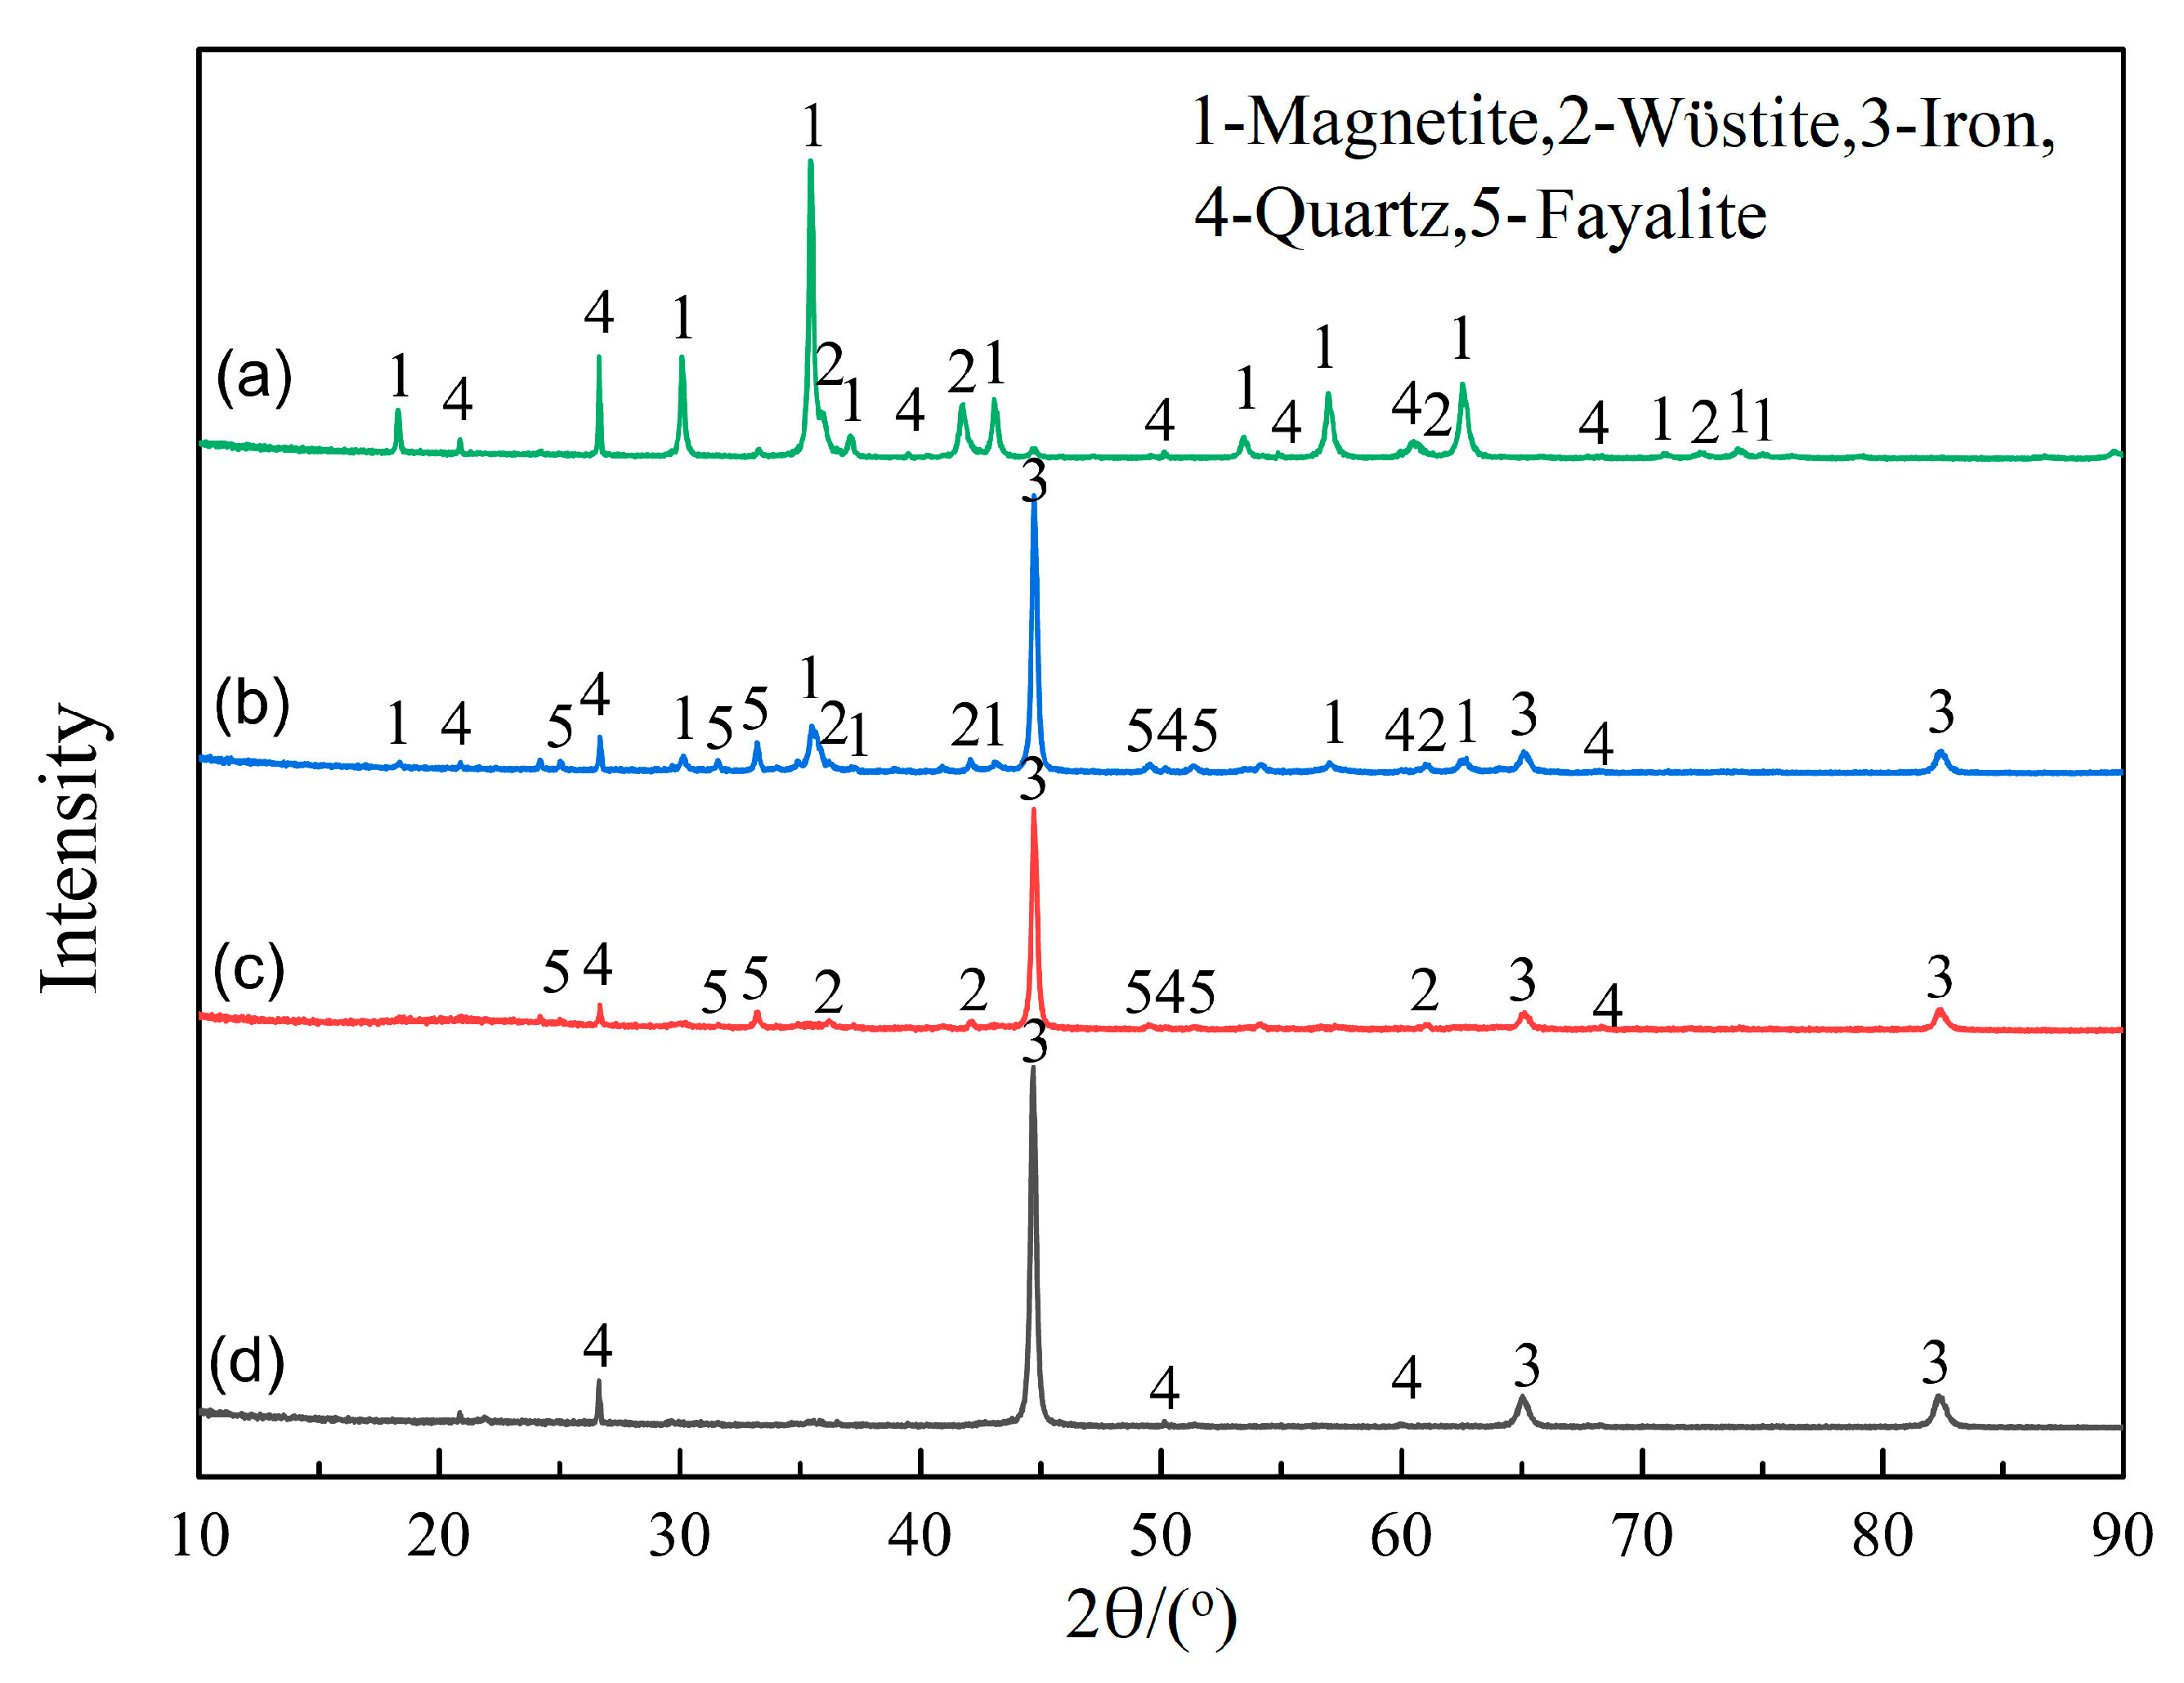
The evolution of the phase composition in the BCB in the reaction process is shown in Figure 11. Initially, in the origin sample, the main phases are magnetite, wüstite, and quartz (Figure 11a). As the reaction progressed, the peaks corresponding to magnetite gradually weakened, indicating its transformation to wüstite. Simultaneously, fayalite (2FeO·SiO2) began to form (Figure 11b). The formation of fayalite contributed to the strengthening of the BCB. By 20 min of the reaction, the magnetite was completely reduced to wüstite (Figure 11c). At the final stage, the fayalite decomposed and, in the briquette, only metallic iron and quartz existed (Figure 11d).
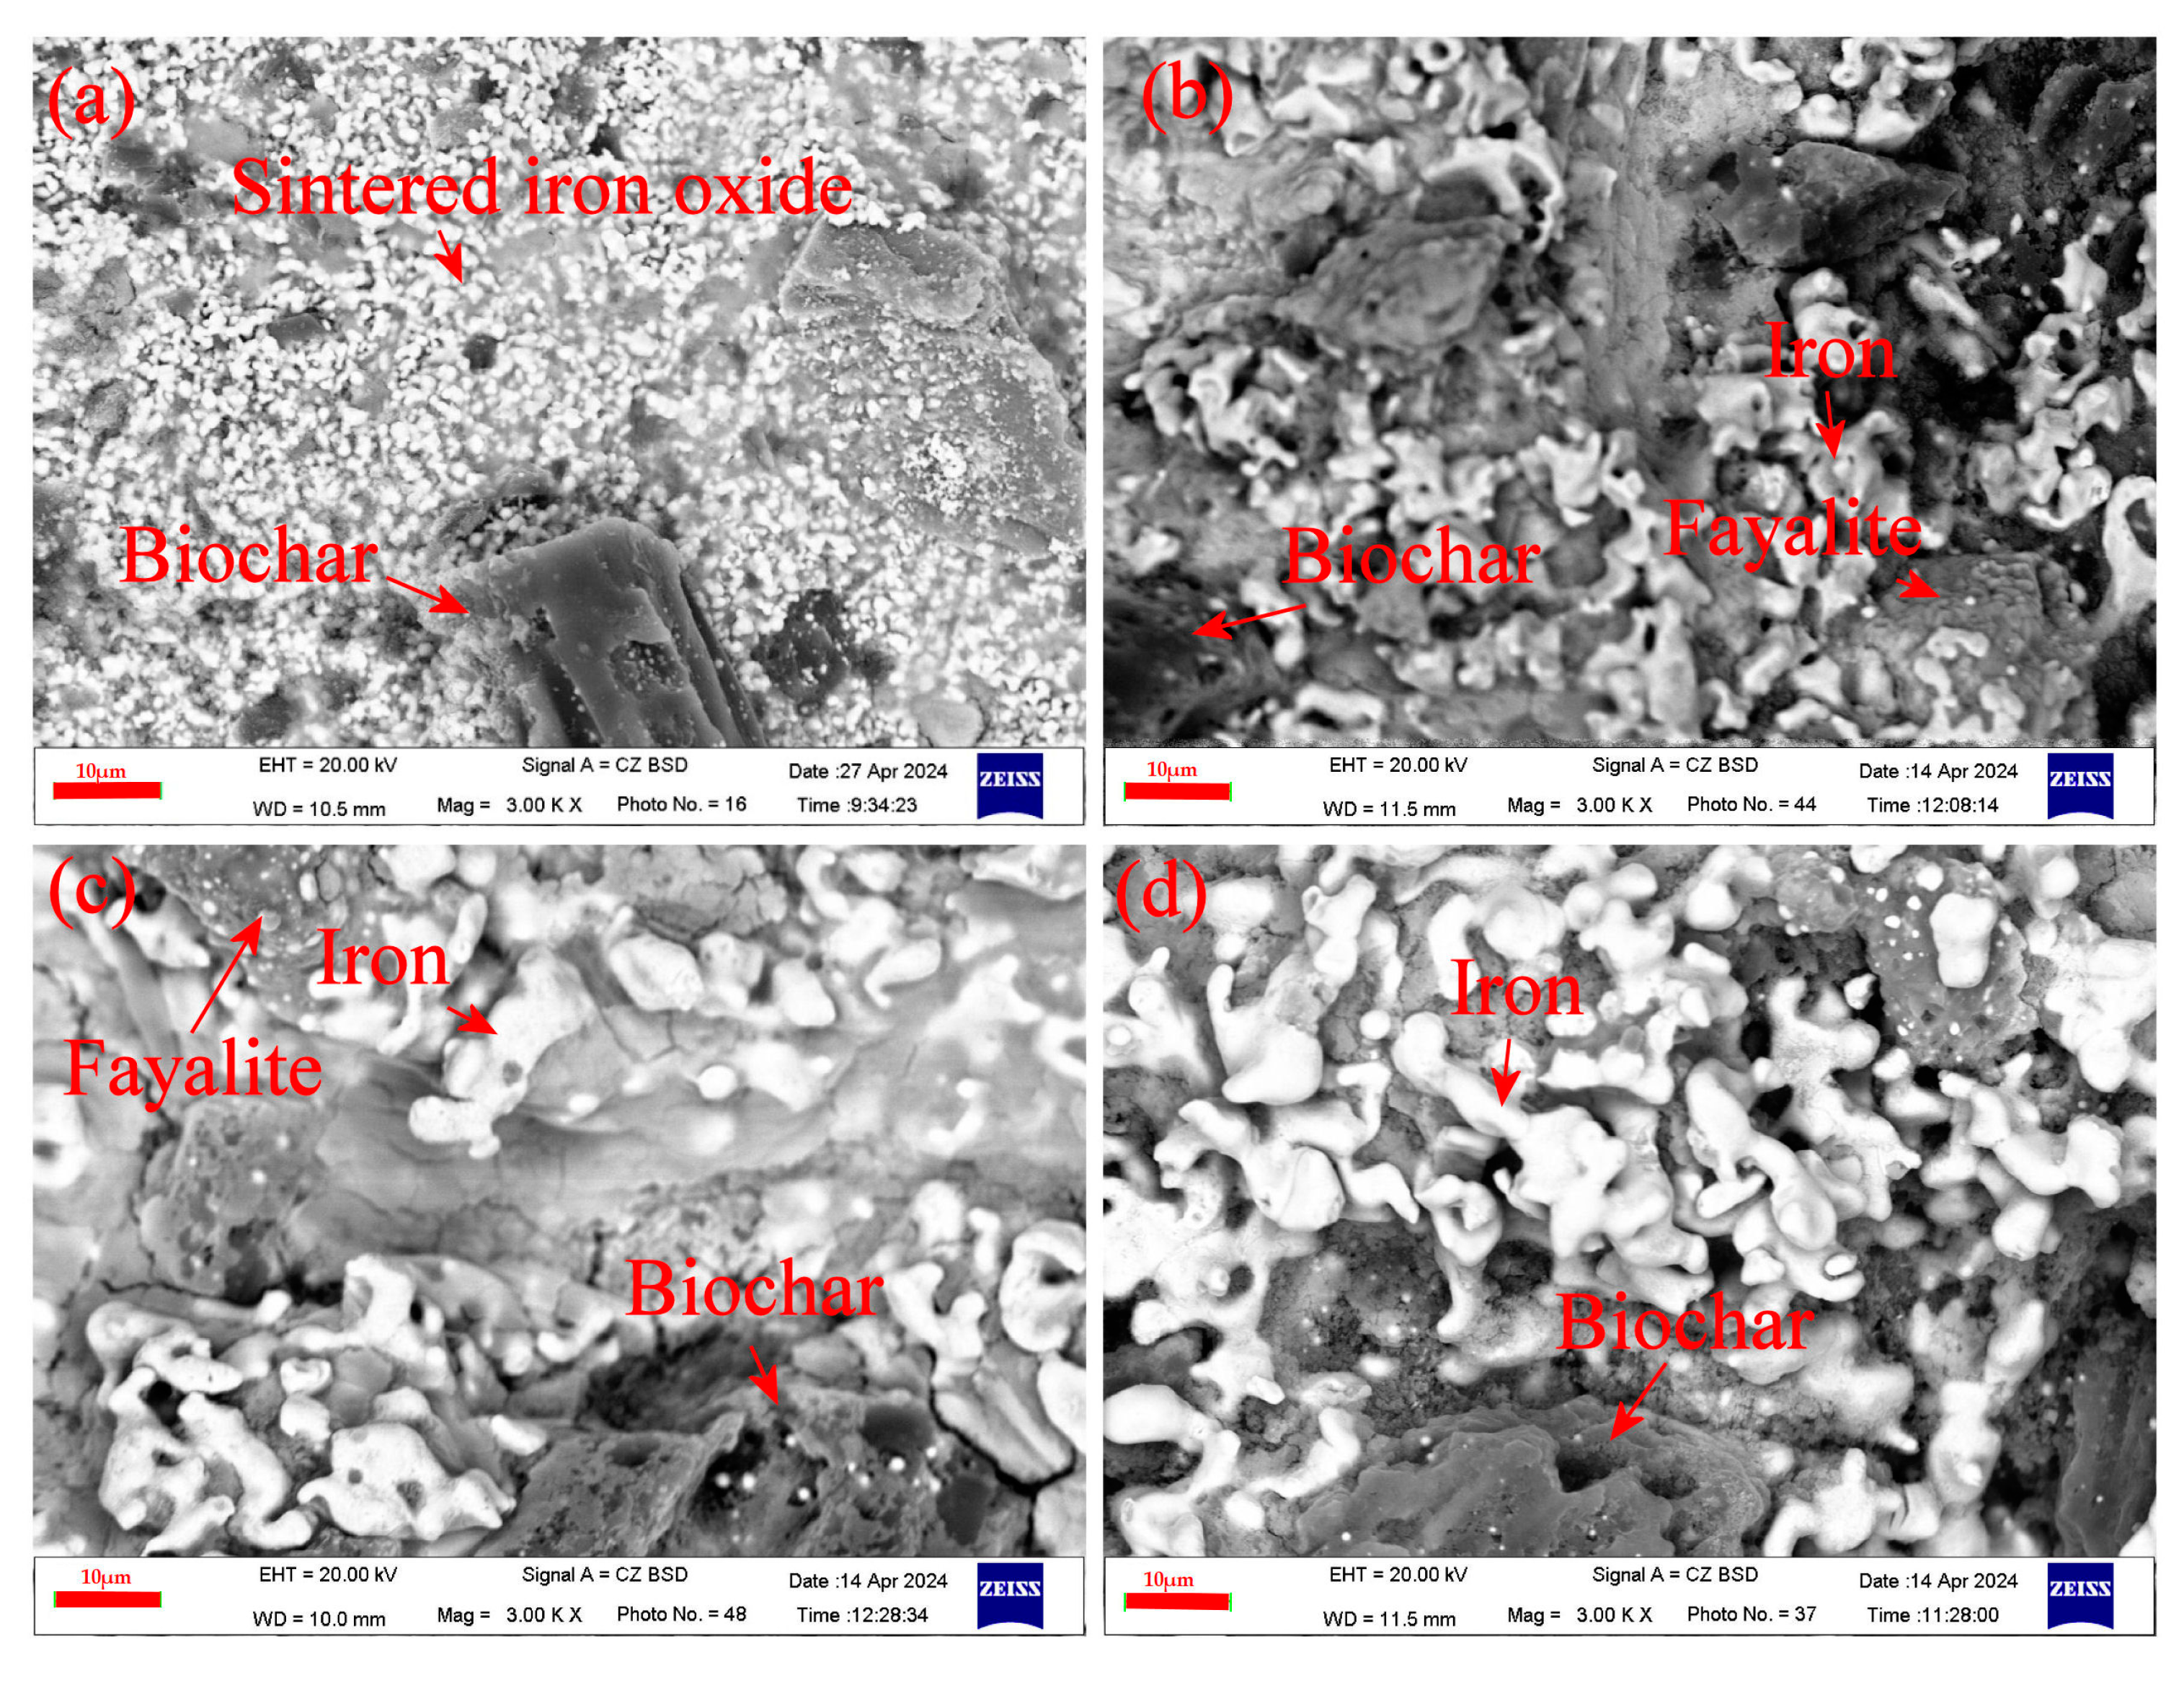
The transition of morphology near the BCB center is shown in Figure 12. In the initial stage, the iron oxide particles presented a sintered structure and the biochar particles were bounded by the sintered iron oxide matrix (Figure 12a). As the reaction progressed, some iron oxide particles were reduced to metallic iron. The fresh iron particles were generated in very irregular shapes. The sintered structure of iron oxide was disrupted by these metallic iron particles, and the sintered iron oxide network became disintegrated (Figure 12b). The irregular shapes of iron particles are attributed to the reduction by hydrogen. The hydrogen in the reducing agent has the effect of prompting the development of iron whiskers [21]. When the reaction time reached 20 min, as most iron oxide particles were reduced to metallic iron, the iron particles began to agglomerate (Figure 12c). By the end of the reaction, a network of metallic iron was generated in the briquette (Figure 12d).

5. Conclusions

In this study, a high-strength BCB for a BF was prepared, and its reaction behavior was examined under an N2-H2 atmosphere with a H2 content ranging from 25 vol.% to 75 vol.%, and temperatures from 1173 K to 1373. Some conclusions were drawn:
  • The developed reaction model accurately described the reaction behavior of the BCB in the time of 30 min.
  • Under low temperatures, hydrogen was the dominant reducing agent, while under high temperatures, biochar played a more significant role. Under a 50 vol.% H2-N2 atmosphere, increasing the temperature from 1173 K to 1373 K decreased the ratio of iron-oxide oxygen removed by hydrogen from 62% to 26% and increased the fraction removed by biochar from 29% to 72%.
  • Increasing the H2 content in the atmosphere enhanced the iron oxide reduction by hydrogen but had little impact on biochar reduction. At 1273 K, increasing the H2 content from 25 vol.% to 75 vol.% increased the fraction of iron-oxide oxygen removed by hydrogen from 37% to 45%, while the fraction removed by biochar slightly decreased from 57% to 53%.
  • In the reaction process, the BCB consumed H2 from the environment, the main products were CO and H2O, while the product CO2 was negligible.
  • The reactions proceeded unevenly within the BCB. Iron oxide reduction progressed more rapidly near the surface, while biochar gasification followed the opposite trend. Its structure evolved from the sinter iron oxide to small, irregular-shaped iron particles, eventually forming a metallic iron network in the BCB.

Author Contributions

Conceptualization, H.T.; methodology, H.T.; software, T.Z. and H.T.; validation, T.Z. and Y.L.; formal analysis, T.Z. and Y.L.; investigation, T.Z. and Y.L.; resources, T.Z. and Y.L.; data curation, T.Z. and Y.L.; writing—T.Z.; writing—review and editing, H.T.; visualization, T.Z. and Y.L.; supervision, H.T.; project administration, H.T.; funding acquisition, H.T. All authors have read and agreed to the published version of the manuscript.

Funding

The authors thank the National Natural Science Foundation of China for supporting this work (Project No. U1960205).

Data Availability Statement

The original contributions presented in this study are included in the article. Further inquiries can be directed to the corresponding author.

Conflicts of Interest

The authors declare no conflicts of interest.

Nomenclature

a g s specific surface of iron oxide particles in CCB, (m2·m−3)
d diameter, (m)
D diffusivity, (m2·s−1)
f i reaction fraction of reaction i, (-)
f C , f O , f m global biochar gasification fraction, global iron oxide reduction fraction, and global BCB mass-loss fraction, (-)
k i reaction rate constant of reaction i, (m·s−1, kg·s−1·atm−1)
K i equilibrium constant of reaction i, (-)
Mmolar weight, (kg·mol−1)
Ppressure, (pa)
rireaction rate of reaction i
rradial direction, (m)
RConstant, (8.314 J·mol−1·K−1)
Ttemperature, (K)
ttime, (s)
Greek symbols
ρ density, (kg·m−3)
αporosity, (-)
subscripts
0initial
eenvironment
species namevariable of assigned species

References

  1. Watari, T.; Nansai, K.; Nakajima, K. Major metals demand, supply, and environmental impacts to 2100: A critical review. Resour. Conserve. Recy. 2021, 164, 105107. [Google Scholar] [CrossRef]
  2. Perpiñán, J.; Peña, B.; Bailera, M.; Eveloy, V.; Kannan, P.; Raj, A.; Lisbona, P.; Romeo, L.M. Integration of carbon capture technologies in blast furnace based steel making: A comprehensive and systematic review. Fuel 2023, 336, 127074. [Google Scholar] [CrossRef]
  3. Li, H.; Zhao, Y.; Guo, C.; Li, J. Analysis of technological pathways and development suggestions for blast furnace low-carbon ironmaking. Metals 2024, 14, 1276. [Google Scholar] [CrossRef]
  4. Chen, Y.; Zuo, H. Review of hydrogen-rich ironmaking technology in blast furnace. Ironmak. Steelmak. 2021, 48, 749–768. [Google Scholar] [CrossRef]
  5. Joel, O.; Sundqvist, Ö.L.; Axel, B.; Bo, B. Understanding of blast furnace performance with biomass introduction. Minerals 2021, 11, 157. [Google Scholar] [CrossRef]
  6. Seo, M.W.; Jeong, H.M.; Lee, W.J.; Yoon, S.J.; Ra, H.W.; Kim, Y.K.; Lee, D.; Han, S.D.; Kim, S.D.; Lee, J.G.; et al. Carbonization characteristics of biomass/coking coal blends for the application of bio-coke. Chem. Eng. J. 2020, 394, 124943. [Google Scholar] [CrossRef]
  7. Ueki, Y.; Nunome, Y.; Yoshiie, R.; Naruse, I.; Nishibata, Y.; Aizawa, S. Effect of woody biomass addition on coke properties. ISIJ Int. 2014, 54, 2454–2460. [Google Scholar] [CrossRef]
  8. Mohammad, S.; Patra, S.; Harichandan, B. Reductants in iron ore sintering: A critical review. Fuel 2023, 332, 126194. [Google Scholar] [CrossRef]
  9. Jha, G.; Soren, S. Study on applicability of biomass in iron ore sintering process. Renew. Sust. Energ. Rev. 2017, 80, 399–407. [Google Scholar] [CrossRef]
  10. Liu, Y.; Shen, Y. Modelling and optimisation of biomass injection in ironmaking blast furnaces. Prog. Energ. Combust. 2021, 87, 100952. [Google Scholar] [CrossRef]
  11. Tang, H.; Liu, Z.; Guo, Z. Numerical simulation of charging biochar composite briquette to blast furnace. ISIJ Int. 2022, 62, 642–651. [Google Scholar] [CrossRef]
  12. Chai, Y.; Wang, S.; Zhang, J.; Shi, Y.; Liu, P.; An, S.; Wang, C.; Ning, X. Study on strength and reduction characteristics of iron ore powder-green carbon composite briquettes. Fuel 2024, 377, 132741. [Google Scholar] [CrossRef]
  13. Mousa, E.; Lundgren, M.; Ökvist, L.D.; From, L.E.; Robles, A.; Hällsten, S.; Sundelin, B.; Friberg, H.; El-Tawil, A. Reduced carbon consumption and CO2 emission at the blast furnace by use of briquettes containing torrefied sawdust. J. Sustain. Metall. 2019, 5, 391–401. [Google Scholar] [CrossRef]
  14. Yilmaz, C.; Wendelstorf, J.; Turek, T. Modeling and simulation of hydrogen injection into a blast furnace to reduce carbon dioxide emissions. J. Clean. Prod. 2017, 154, 488–501. [Google Scholar] [CrossRef]
  15. Lan, C.; Hao, Y.; Shao, J.; Zhang, S.; Liu, R.; Lyu, Q. Effect of H2 on blast furnace ironmaking: A review. Metals 2022, 12, 1864. [Google Scholar] [CrossRef]
  16. Wang, K.; Zhang, J.; Zhou, H.; Ni, J.; Hu, Y.; Huang, J.; Li, S.; Ma, X.; Wu, S.; Kou, M. Numerical study of natural g-as and pulverized coal co-injection into an ironmaking blast furnace. Appl. Therm. Eng. 2023, 230, 120817. [Google Scholar] [CrossRef]
  17. Tang, H.; Sun, Y.; Yu, Z. Modeling of biochar composite briquette reaction in blast furnace. Can. Metall. Quart. 2022, 61, 341–350. [Google Scholar] [CrossRef]
  18. Yu, Z.; Liu, Z.; Tang, H.; Xue, Q. Preparation of high-strength biochar composite briquette for blast furnace ironmaking. Metall. Res. Technol. 2021, 118, 109. [Google Scholar] [CrossRef]
  19. Natsui, S.; Kikuchi, T.; Suzuki, R.O. Numerical analysis of carbon monoxide–hydrogen gas reduction of iron ore in a packed bed by an Euler–Lagrange approach. Metall. Mater. Trans. B 2014, 45, 2395–2413. [Google Scholar] [CrossRef]
  20. Blasi, C.D. Combustion and gasification rates of lignocellulosic chars. Prog. Energ. Combust. 2008, 35, 121–140. [Google Scholar] [CrossRef]
  21. Guo, L.; Bao, Q.; Gao, J.T.; Zhu, Q.; Guo, Z.C. A review on prevention of sticking during fluidized bed reduction of fine iron ore. ISIJ Int. 2020, 60, 1–17. [Google Scholar] [CrossRef]
Figure 1. Image of the obtained biochar.
Metals 15 00236 g001
Figure 2. Photos of the prepared BCB.
Metals 15 00236 g002
Figure 3. Experimental device: (1, 2) mass flow controller, (3) mixing chamber, (4) mass-loss sensor, (5) furnace, (6) MoSi2 heating elements, (7) hot temperature zone, (8) sample holder, (9) reaction tube, (10) alumina ball, (11) thermocouple, (12) computer, (13) IR heater, (14) suspending wire, and (15) water sealing.
Metals 15 00236 g003
Figure 4. Comparison between model-predicted and experimental mass-loss curves under different scenarios.
Metals 15 00236 g004
Figure 5. Comparison between model-predicted and experimental final iron oxide reduction fractions and biochar gasification fractions under different scenarios.
Metals 15 00236 g005
Figure 6. Influence of temperature on iron oxide reduction (a) and biochar gasification (b) in BCB reaction.
Metals 15 00236 g006
Figure 7. Changes in gas generating rates of H2, H2O, CO, and CO2 with time under different temperatures.
Metals 15 00236 g007
Figure 8. Influences of H2 content in the atmosphere on iron oxide reduction (a) and biochar gasification (b) in the BCB reaction.
Metals 15 00236 g008
Figure 9. Changes of gas generation rates of H2, CO, CO2, and H2O with time under different atmospheres.
Metals 15 00236 g009
Figure 10. Changes of radial distribution of local reduction fraction (a) and local gasification fraction (b) with time under scenario II.
Metals 15 00236 g010
Figure 11. XRD patterns at different times under scenario II: (a) 0 min, (b) 10 min, (c) 20 min, and (d) 30 min.
Metals 15 00236 g011
Figure 12. SEM images near the BCB center at different reaction times under scenario II: (a) 0 min, (b) 10 min, (c) 20 min, and (d) 30 min.
Metals 15 00236 g012
Table 1. Properties of prepared biochar fines (wt.%).
Proximate Analysis (ar)Elemental Analysis (daf)
MAVFCCHONS
2.424.633.6089.3589.820.938.670.580.03
ar: as received, daf: dry and ash free, M: moisture, A: ash, V: volatile, and FC: fixed carbon.
Table 2. BCB phase composition (wt.%).
Fe3O4FeOFeCGangue
52.5724.540.9813.168.75
Table 3. Experimental scenarios.
No.Temperature/KAtmosphere (H2:N2 (Vol.))
I1173 50:50
II1273 50:50
III1373 50:50
IV1273 25:75
V1273 75:25
Table 4. Reactions involved in the model.
NoReactionReaction RateRefs.
(R1) 3 Fe 2 O 3 s + CO g = 2 Fe 3 O 4 s + CO 2 ( g ) r i = ( P CO P CO 2 / K i ) / ( R T ) ( K i / ( k i ( 1 + K i ) ) ( 1 f i ) 2 / 3 ) a gs
k 1 = exp ( 1.445 6038.0 / T )
K 1 = exp ( 7.255 + 3720 / T )
k 2 = exp ( 2.515 4811.0 / T )
K 2 = exp ( 5.289 4711.0 / T )
k 3 = exp ( 0.805 7385 / T )
K 3 = exp ( 2.946 + 2744.63 / T )
[19]
(R2) Fe 3 O 4 s + CO g = 3 FeO s + CO 2 ( g )
(R3) FeO s + CO g = Fe s + CO 2 ( g )
(R4) 3 Fe 2 O 3 s + H 2 g = 2 Fe 3 O 4 s + H 2 O ( g ) r i = ( P H 2 P H 2 O / K 2 ) / ( R T ) ( K i / ( k i ( 1 + K i ) ) ( 1 f i ) 2 / 3 ) a gs ( f 4 = f 1 , f 5 = f 2 , f 6 = f 3 )
k 4 = exp ( 2.490 4017 / T )
K 4 = exp ( 10.32 + 362 / T )
k 5 = exp ( 4.70 6999.7 / T )
K 5 = exp ( 8.98 8580 / T )
k 6 = exp ( 4.97 6867.4 / T )
K 6 = exp ( 1.30 + 2070 / T ) ;
[19]
(R5) Fe 3 O 4 s + H 2 g = 3 FeO s + H 2 O ( g )
(R6) FeO s + H 2 g = Fe s + H 2 O ( g )
(R7) C s + CO 2 g = 2   CO ( g ) r 7 = ρ C , 0 k 3 1 f 7 2 / 3 ( P CO 2 / 1.01 × 10 5 ) 0.38 / M C ,   k 7 = 3.1 × 10 6 exp ( 230000 / R T ) ,   f 7 = f C [20]
(R8) C s + H 2 O g = CO ( g ) + H 2 ( g ) r 8 = ρ C , 0 k 4 1 f 8 2 / 3 ( P H 2 O / 1.01 × 10 5 ) 0.55 / M C k 8 = 6750 exp ( 156000 / R T ) , f 8 = f C [20]
Table 5. Terms in Equation (2).
p D S
p C O D C O - N 2 R T r C O ,   r CO = r 8 + 2.0 r 7 r 1 r 2 r 3
p CO 2 D CO 2 - N 2 R T r CO 2 , r CO 2 = r 1 + r 2 + r 3 r 7
p H 2 D H 2 - N 2 R T r H 2 , r H 2 = r 8 r 4 r 5 r 6
p H 2 O D H 2 O - N 2 R T r H 2 O ,   r H 2 O = r 4 + r 5 + r 6 r 8
Table 6. Terms in Equation (8).
ρ S
ρ Fe 2 O 3 3.0 ( r 1 + r 4 ) M Fe 2 O 3
ρ Fe 3 O 4 ( 2 r 1 r 2 ) M Fe 3 O 4 + ( 2 r 4 r 5 ) M Fe 3 O 4
ρ FeO ( 3 r 2 r 3 ) M FeO + ( 3 r 5 r 6 ) M FeO
ρ Fe r 3 M Fe + r 6 M Fe
ρ C 1.0 ( r 7 + r 8 ) M C
Table 7. RSM values under different ags.
ags/(m2·m−3)510152025
RMS/-0.135440.058980.043400.079140.08714
Table 8. Distribution of iron-oxide oxygen removal across different pathways under different temperatures.
Item1173 K 1273 K1373 K
Iron-oxide oxygen removed by H2 (%)624226
Iron-oxide oxygen removed by biochar (%)295672
Residual iron-oxide oxygen in BCB (%)922
Table 9. Ratios of iron-oxide oxygen in different pathways under different atmospheres.
Item25 Vol.% H2-N250 Vol.% H2-N275 Vol.% H2-N2
Iron-oxide oxygen removed by H2 (%)374245
Iron-oxide oxygen removed by biochar (%)575653
Residual iron-oxide oxygen in BCB (%)622
Disclaimer/Publisher’s Note: The statements, opinions and data contained in all publications are solely those of the individual author(s) and contributor(s) and not of MDPI and/or the editor(s). MDPI and/or the editor(s) disclaim responsibility for any injury to people or property resulting from any ideas, methods, instructions or products referred to in the content.