Abstract
The oxidation behaviour of Ti alloys is a crucial aspect for structural components operating at high service temperature. The aim of this study is to identify the oxidation kinetics and mechanism of binary Ti-Cu alloys with a progressively higher amount of Cu with the alloys having a α + β lamellar structure. It is found that all the alloys followed a non-ideal (i.e., n ≠ 2) parabolic relationship, as controlled by anionic oxygen diffusion, with a distinct effect from both oxidation temperature and alloy chemistry. Specifically, faster oxidation kinetics are found both at higher temperatures and for higher Cu contents, resulting in the formation of thicker oxide scale layers. The oxidation mechanism primarily entails the formation of the stable TiO2 rutile polymorph. However, transitions through metastable phases (e.g., anatase) and texturing of rutile are also revealed as dictated by the composition of the alloy at specific oxidation temperature/time pairs.
1. Introduction
Ti and its alloys are used in a variety of industrial applications including relatively high temperature operating engineering components such as low-pressure jet engine turbine blades [1]. This is because Ti alloys are able to maintain a good mechanical behaviour at relatively high temperatures, conventionally up to 550–600 °C [2], which is in general impractical for other structural metals like steel and aluminium alloys. The primary factor limiting the application of Ti alloys at higher service temperatures is their affinity for oxygen, which results in their oxidation [3]. Therefore, understanding of the oxidation reactions and of the resulting phase changes are critical aspects of alloy development for the selection of the appropriate operating conditions [4]. In particular, higher service temperatures will enhance the efficiency of the combustion process and reduce fuel consumption and greenhouse gas emissions. Both the operating atmosphere and the chemistry of the material affect the outcome of the oxidation process and, thus, the actual thermal cycling and the intrinsic thermodynamics and kinetics properties of the alloy are crucial. A further major drawback is the high cost of Ti alloys as a consequence of the high affinity for oxygen leading to the need of using specialised processes for their manufacturing [5]. Therefore, the development of alternative cheaper compositions and manufacturing processes is crucial.
When it comes to the oxidation of Ti alloys, the oxide generally nucleates on the metal surfaces and oxygen diffuses inwards into the metallic substrate owing to the very high maximum solubility of oxygen in Ti (i.e., ~30 at.% in α-Ti) [6,7]. Ti is characterised by very high thermodynamics affinity for oxygen, therefore easily forming stable TiO1.5–2 oxides [8]. However, ascertain of the formation of one or the other of the three atmospherically stable polymorphic Ti oxides phases (i.e., rutile, anatase, and brookite) is not straightforward. In particular, the general TiO2 phase is known as a nonstoichiometric compound with fully charged oxygen deficiency, TiO2−x [9]. This leads to the need of two Ti3+ occupied regular sites in the tetragonal structure to conserve the local charge neutrality, which is temperature and oxygen partial pressure dependent [10]. Moreover, the presence of strong oxide-forming alloying elements, such as Al in the Ti-6Al-4V alloy [11,12], affects the outcome of the oxidation process. For example, the formation of hematite (i.e., Fe2O3) was found in low cost Fe-bearing Ti alloys [13], and the concurrent formation of Ti- and Al-based oxidation products has been widely reported for Al-bearing Ti alloys [14,15,16,17,18]. Specifically, a drop of the partial oxygen pressure at the TiO2/substrate has been indicated for the Ti-6Al-4V alloy after the initial nucleation of TiO2, and this consequently leads to the formation of Al2O3 at the external gas/oxide interface [19].
A survey of current literature shows that the oxidation response of Ti alloys has primarily been assessed for standard alloys, which include Ti [20,21], near-α Ti alloys [7], Ti-6Al-4V [22,23,24,25,26], Ti-6Al-7Nb [18], and Ti-6Al-2Sn-4Zr-2Mo-Si (i.e., Ti6242s) [27] produced using the classical wrought plus heat treatment route [7,18,21,22,23,25,26,27]. The most widely studied oxidation conditions entail a temperature between 500 °C and 900 °C [7,18,20,22,23,25,27] combined with exposure times that range from 0 h to 300 h [7,18,20,22,23,25,27]. Near-α and α + β Ti alloys [28], which commonly include Al as a primary alloying element are the most broadly studied. For example, Leyens et al. [29] analysed the behaviour of the IMI 834 and TIMETAL 1100 alloys isothermally oxidised at 750 °C for 100 h in air. It was found that, although there is less dependence on the microstructure in the IMI 834 alloy, in both alloys, the highest oxidation resistant was achieved when they had a lamellar microstructure and the lowest when they had a globular structure. Guleryuz and Cimenoglu [25] analysed the oxidation behaviour of the Ti-6Al-4V alloy in air determining the oxidation kinetics, the oxygen diffusion zone depth, and the hardness. It was found that the rate of oxidation transitions for a parabolic kinetics to a linear one when the oxidation temperature exceeded 700 °C. A temperature-compensated time parameter was also proposed for predicting the extent of oxidation. Gaddam et al. [27] performed oxidation experiments on the Ti6242s alloy demonstrating that different temperature/time pairs lead to different changes in oxidation kinetics (e.g., cubic to parabolic at 500 °C as a function of the exposure time). These changes were justified by the differences observed in the oxide scale, but no details about the crystalline structures of the oxide were provided.
Although in recent years, binary Ti-Cu have been investigated due to their antibacterial behaviour, the addition of Cu was originally considered to improve the strength and enhance the burn resistance for aeronautical applications. In particular, the binary Ti-2.5Cu was developed to manufacture bypass ducts of turbines due to its combination of formability, weldability, and higher strength than pure Ti [2], and for automobile exhaust systems [30]. Ternary Ti-Al-Cu alloys have good burn resistance as a consequence of their combination of good thermal conductivity, low melting point, and the presence of the low-melting point Ti2Cu phase [31]. Arc melting followed by ingot casting was the primary manufacturing method used to produce binary Ti-Cu alloys [32,33,34], although powder metallurgy has also been investigated [35,36,37,38]. The majority of the studies analysed a Cu content of up to 10 wt.% [32,33,34,35,37,38], and post-processing heat treatments were sometimes also considered [33,39,40]. In terms of properties, tensile and compressive behaviour, micro- and macro-hardness, bio-corrosion, and antibacterial response were analysed. The oxidation behaviour has been far less investigated where, for instance, Otsuka et al. [30] analysed the high-temperature (500–700 °C) oxidation response of the Ti-1Cu and Ti-1Cu-0.5Nb alloys, whereas Chen et al. [41] used thermogravimetric analysis to quantify the oxidation of binary Ti-Cu alloys with a Cu content of up to 20 wt.% in the 1000–1300 °C temperature range.
It is evident from literature that there is a lack of knowledge on the oxidation response of Al-free Ti alloys as the majority of conventional wrought Ti alloys entail Al in their chemistry. Moreover, to the best of the authors’ knowledge, the understating of the oxidation kinetics of binary Ti-Cu alloys is lacking in literature. To fill these gaps, in this study, representative binary Ti-Cu alloys were isothermally oxidised in the 600–800 °C temperature range up to 312 h. The aim was to establish their oxidation kinetics and clarify the evolution of the crystal structure of the oxide forming, simulating the service of the alloys at high temperatures under air.
2. Materials and Methods
Sintered Ti-xCu (x = 0.5, 2.5 and 5 wt.%) alloys were used as representative Al-free Ti alloys in this study. As per [37], the alloys were obtained via the blended elemental approach, cold pressed at 600 MPa, and vacuum sintered (ZSJ − 20 × 20 × 30) at 1250 °C during 2 h. This ensures the achievement of a homogenous chemistry due to complete dissolution of Cu into the Ti matrix. Isothermal oxidation experiments were performed at 600 °C, 700 °C, and 800 °C in a muffle furnace (Carbolite RHF 16/8) in static laboratory air. Upon reaching the desired temperature, individual samples for each alloy composition were removed after 5 h, 25 h, 75 h, 150 h, and 312 h. It is worth mention that the 20 × 20 × 4 mm3 specimens were originally cut from bigger samples via electrical discharge machining and, therefore, their surfaces were ground with emery papers (up to #600 grit) to standardise the surface roughness and eliminate any byproduct of the cutting process. Three samples for each condition were used in order to obtain a representative measurement for each case.
The dimensions of the samples were measured by means of a digital 2-digit calliper and their weight before and after isothermal oxidation was quantified using a 4-digit analytical scale (Mettler Toledo, Greifensee, Switzerland). Such data were then used to calculate the associated mass gain per unit area. Original microstructures of the binary Ti-Cu alloys were examined via optical (Olympus BX 60, Tokyo, Japan) microscopy on polished samples, which were chemically etched using a Kroll etchant (2 mL HF, 6 mL HNO3, and 92 mL of H2O). Scanning electron microscopy (Hitachi S4700, Tokyo, Japan) was used for cross-sectional observation to measure the thickness of the oxide layer for which the samples were prepared using a standard metallographic method entailing mounting, grinding and polishing. Symmetrical shooting X-ray diffraction (Philips X’Pert, Almelo, The Netherlands) with Cu Kα radiation was used to identify the phases in the oxide scale using a scanning step of 0.013° with dwell time of 1s in the 20–60° 2θ diffraction angle range. It is worth mentioning that the data were converted into relative values to identify the peak with the highest relative intensity. Moreover, the sum of the relative intensity of the different peaks belonging to the same phase was used to quantify the relative amount of each phase present in the surface of the oxidised alloys.
3. Results
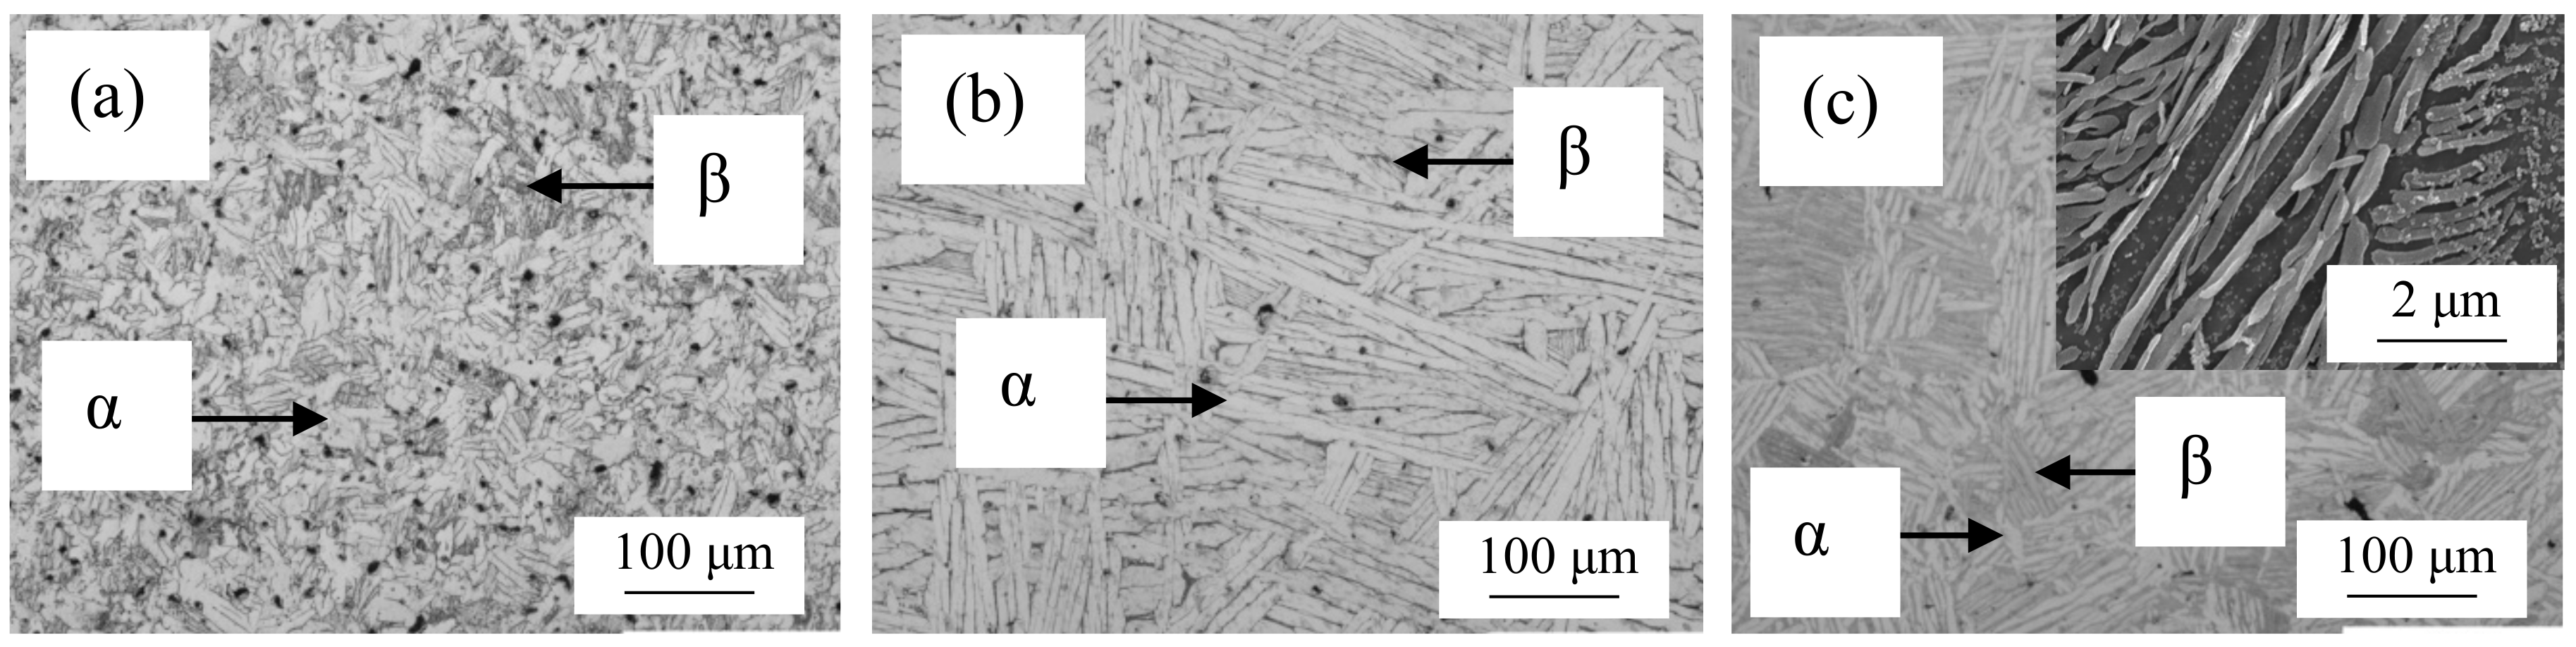
Figure 1 shows representative images of the original microstructure of the binary Ti-Cu alloys where it can be seen that the microstructure is lamellar and thus composed of equiaxed α-Ti grain boundaries and α + β lamellae (Figure 1a–c). A progressive refinement of the microstructural features is found as the Cu content increases. Moreover, a eutectoid substructure entailing the precipitation of the Ti2Cu intermetallic phase is found within the β lamellae when the Cu content is ≥2.5 wt.% (Figure 1c inset). Based on their microstructure and conventional methods used to classify Ti alloys, Ti-0.5Cu is a near-α alloy, and Ti-2.5Cu and Ti-5Cu are α + β alloys [37].
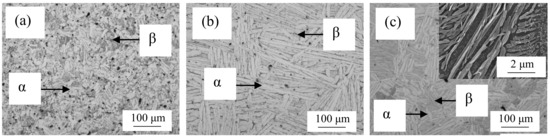
Figure 1.
Representative optical (and SEM as inset) micrographs of the binary Ti-Cu alloys: (a) Ti-0.5Cu, (b) Ti-2.5Cu, and (c) Ti-5Cu.
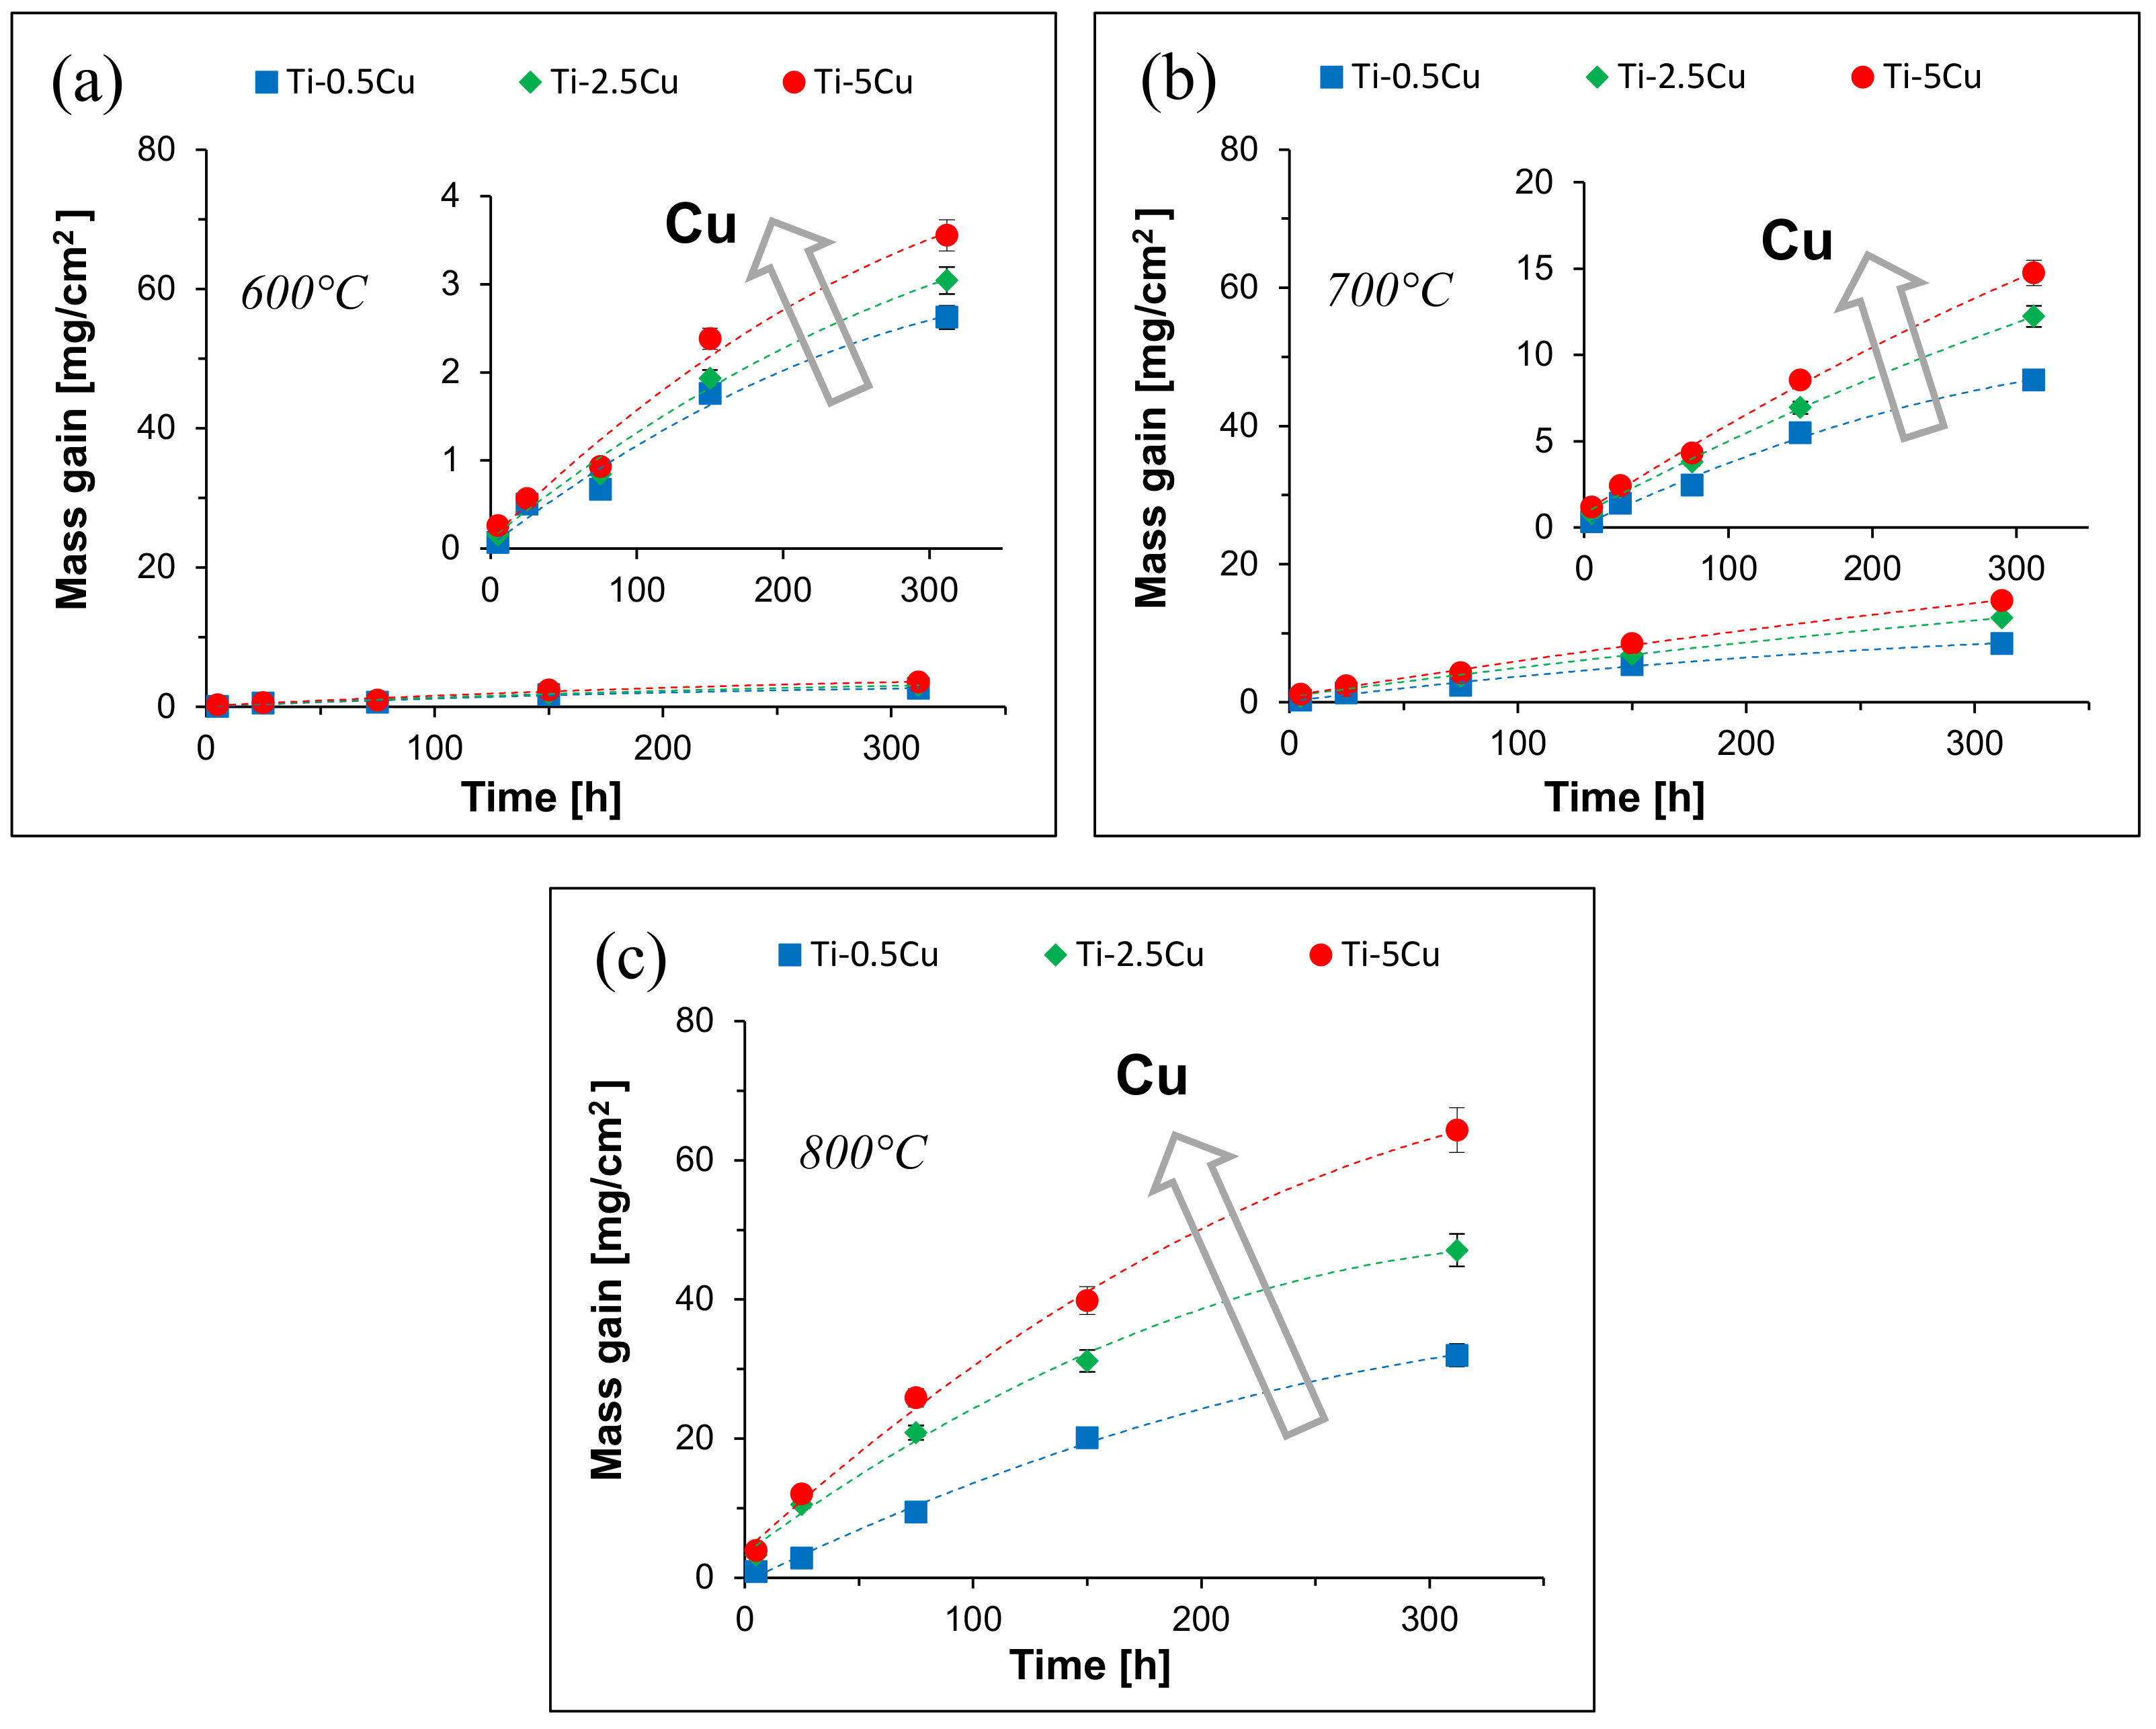
Figure 2 shows the curves of isothermal oxidation kinetics (i.e., mass gain per unit area over time) of the binary Ti-Cu alloys at 600 °C, 700 °C, and 800 °C. Regardless of the Cu content, the mass gain increases with the elapsed isothermal oxidation time. However, the mass gain is both temperature and chemistry dependent as it can be noticed from the comparison of the overall y axis scale and those of the insets. Specifically, the higher the oxidation temperature the higher the mass gain independently of the chemical composition where, at 312 h, the maximum mass gain ranges from 2.6–3.6 mg/cm2 at 600 °C, 8.5–14.7 mg/cm2 at 700 °C, and 32.0–64.3 mg/cm2 at 800 °C, respectively. Therefore, it is found that the overall mass gain is remarkably higher at 800 °C with respect to lower temperatures and the behaviour between 600 °C and 700 °C is less significantly different. Regarding the effect of the alloy chemistry, the higher the amount of Cu the higher the mass gain independently of the oxidation temperature.
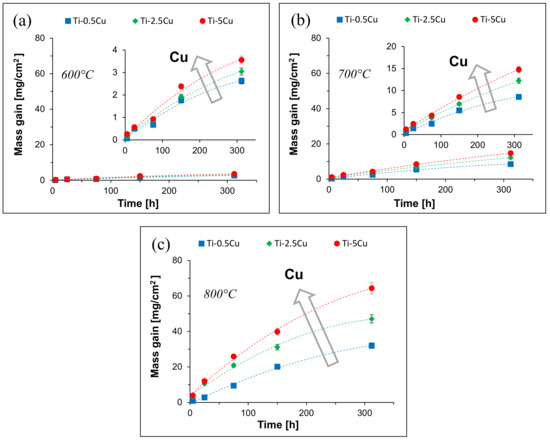
Figure 2.
Oxidation kinetics curves of the binary Ti-Cu alloys: (a) 600 °C, (b) 700 °C, and (c) 800 °C.
Identification of the oxidation kinetics’ law (i.e., linear, parabolic, or logarithmic) was done by fitting the experimental data; the best fitting equation turned out to be ΔM n = kn·t where ΔM is the mass gain per unit area (mg/cm2), n is the oxidation exponent, kn is the rate constant (mgn/cm2n·h), and t is the isothermal oxidation time (h). The values of kn, n, and associated coefficient of determination (R2) are shown in Table 1. Generally, kn is higher for higher isothermal oxidation temperatures whereas no specific trend is found for n. Furthermore, it can be noticed that the oxidation kinetics of the binary Ti-Cu alloys does not follow an ideal parabolic relationship (i.e., n ≠ 2) as the overall range of n values is 1.23–1.70. A clear influence from the chemistry of the alloy is also found where, generally, the higher the amount of Cu the higher the kn and n values.

Table 1.
Parameters of the oxidation kinetics’ law.
Figure 3 shows the variation of the oxide layer thickness as a function of the isothermal oxidation time where it can be seen that the thickness increases with the elapsed time. It is also found that a thicker oxide layer forms as the Cu content increases. For instance, the oxide layer thickness ranges are, respectively, 0.4–3.8 μm, 0.8–6.6 μm, and 1.1–8.0 μm for the Ti-0.5Cu, Ti-2.5Cu, and Ti-5Cu alloys isothermally oxidised at 600 °C. Similarly, a thicker oxide layer is formed at higher oxidation temperatures. For example, the oxide layer thickness ranges are 4.6–33.6 μm and 19.4–141.8 μm for the Ti-5Cu alloy isothermally oxidised at 700 °C and 800 °C, respectively.
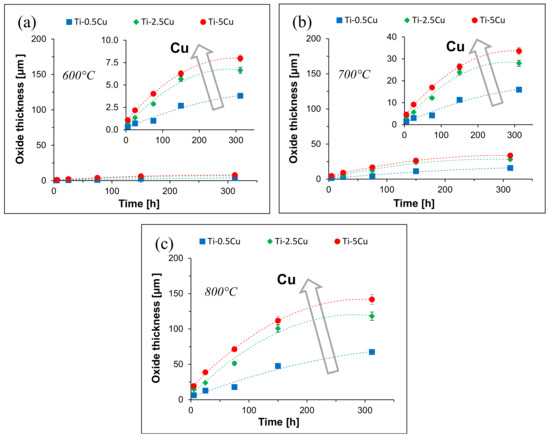
Figure 3.
Oxide layer thickness kinetics curves of the binary Ti-Cu alloys: (a) 600 °C, (b) 700 °C, and (c) 800 °C.
Fitting the oxide layer thickness experimental data generated a similar kinetics to that of oxidation, resulting in the ΔWl = kl·t equation where ΔW is the oxide thickness (μm), l is the growth exponent, and kl is the rate constant (μmn/h). The values of the latter two are reported in Table 2. The analysis of the oxide layer growth kinetics yields similar conclusions to those of the oxidation kinetics: generally higher rate constant kl values for higher isothermal oxidation temperatures, and non-ideal parabolic relationship (i.e., l = 1.42–2.07) are found in most instances. However, the growth exponent l remains practically constant for each alloy.
Table 2.
Parameters of the kinetics of oxide layer growth.
XRD analysis was performed on the surface of the isothermally oxidised binary Ti-Cu alloys. For the sake of simplicity, only representative cases are subsequently reported and discussed as per Table 3, which shows a summary of relevant events (i.e., transition from a dominant structure to another) as determined from the peak of the phase with the highest relative intensity in the XRD pattern.
Table 3.
Phase with the highest relative intensity peak in the XRD pattern of the isothermally oxidised binary Ti-Cu alloys.
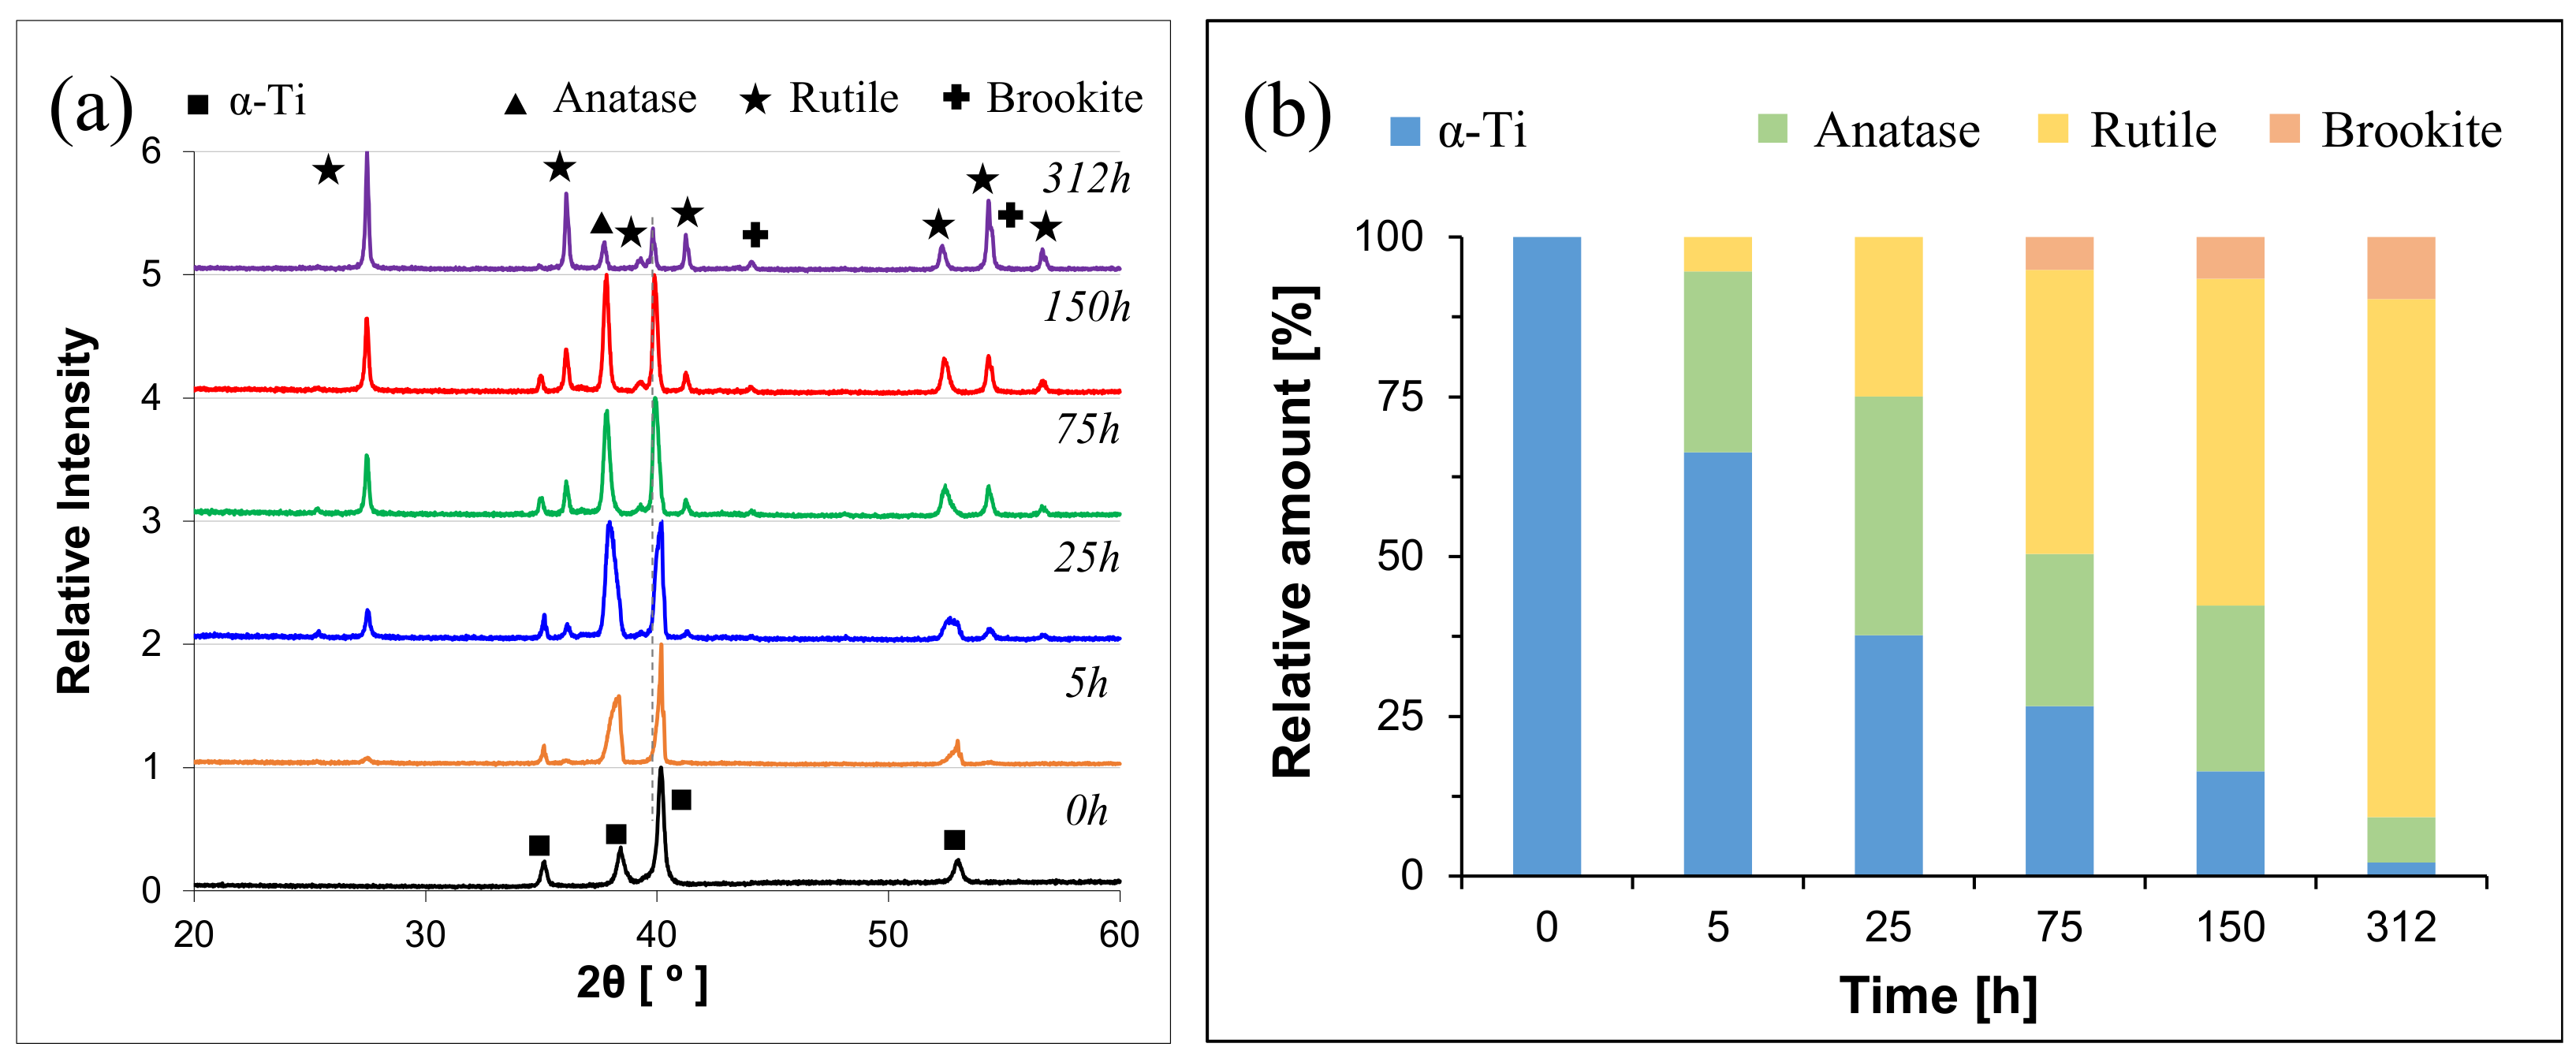
Figure 4 shows the XRD pattens of the Ti-0.5Cu alloy isothermally oxidised at 600 °C. Only peaks of the α-Ti phase were detected in the original alloy (i.e., 0 h), although of its lamellar microstructure (Figure 1a). The α-Ti(101) plane is the one with the highest relative intensity. This means that the amount of stabilised β-Ti phase is below the detection limit of the XRD equipment. Oxidation of the Ti-0.5Cu alloy starts (i.e., 5 h) with the formation of TiO2 in the form of anatase (i.e., a-TiO2) and rutile (i.e., r-TiO2), where the relative intensity of the main plane of the former is significantly stronger than that of the latter. However, α-Ti is still the predominant phase, which the is result of the reduced thickness of the oxide layer formed (i.e., few μm as per Figure 3). The relative amount of anatase increases with the oxidation time and at 25h is almost as strong as that of the α-Ti phase (Figure 4b). As the oxidation time progresses, the relative amount of anatase decreases, that of rutile increases, and a small amount of brookite (i.e., b-TiO2) is detected from 75 h. As per Table 3, the final relevant structural transition happens between 150 h and 312 h where rutile becomes the predominant phase. It is worth mentioning that the inward diffusion of oxygen also leads to a progressive shift of the α-Ti phase peaks towards slightly lower diffraction angles as a consequence of the straining of the hexagonal lattice induced by the interstitial oxygen atoms. Moreover, a small amount of α-Ti is still detected via XRD even at 312 h due to the thickness of the oxide layer (Figure 3) being smaller than the X-ray beam penetration depth.
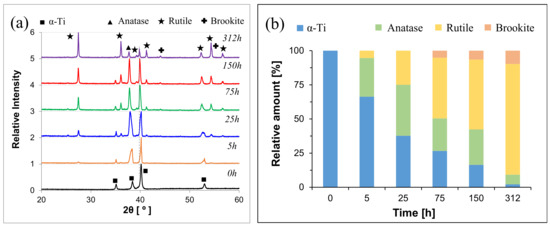
Figure 4.
Results of the XRD analysis performed on the Ti-0.5Cu alloy isothermally oxidised at 600 °C: (a) XRD patterns, and (b) relative amount of the different phases present in the surface of the oxidised alloy.
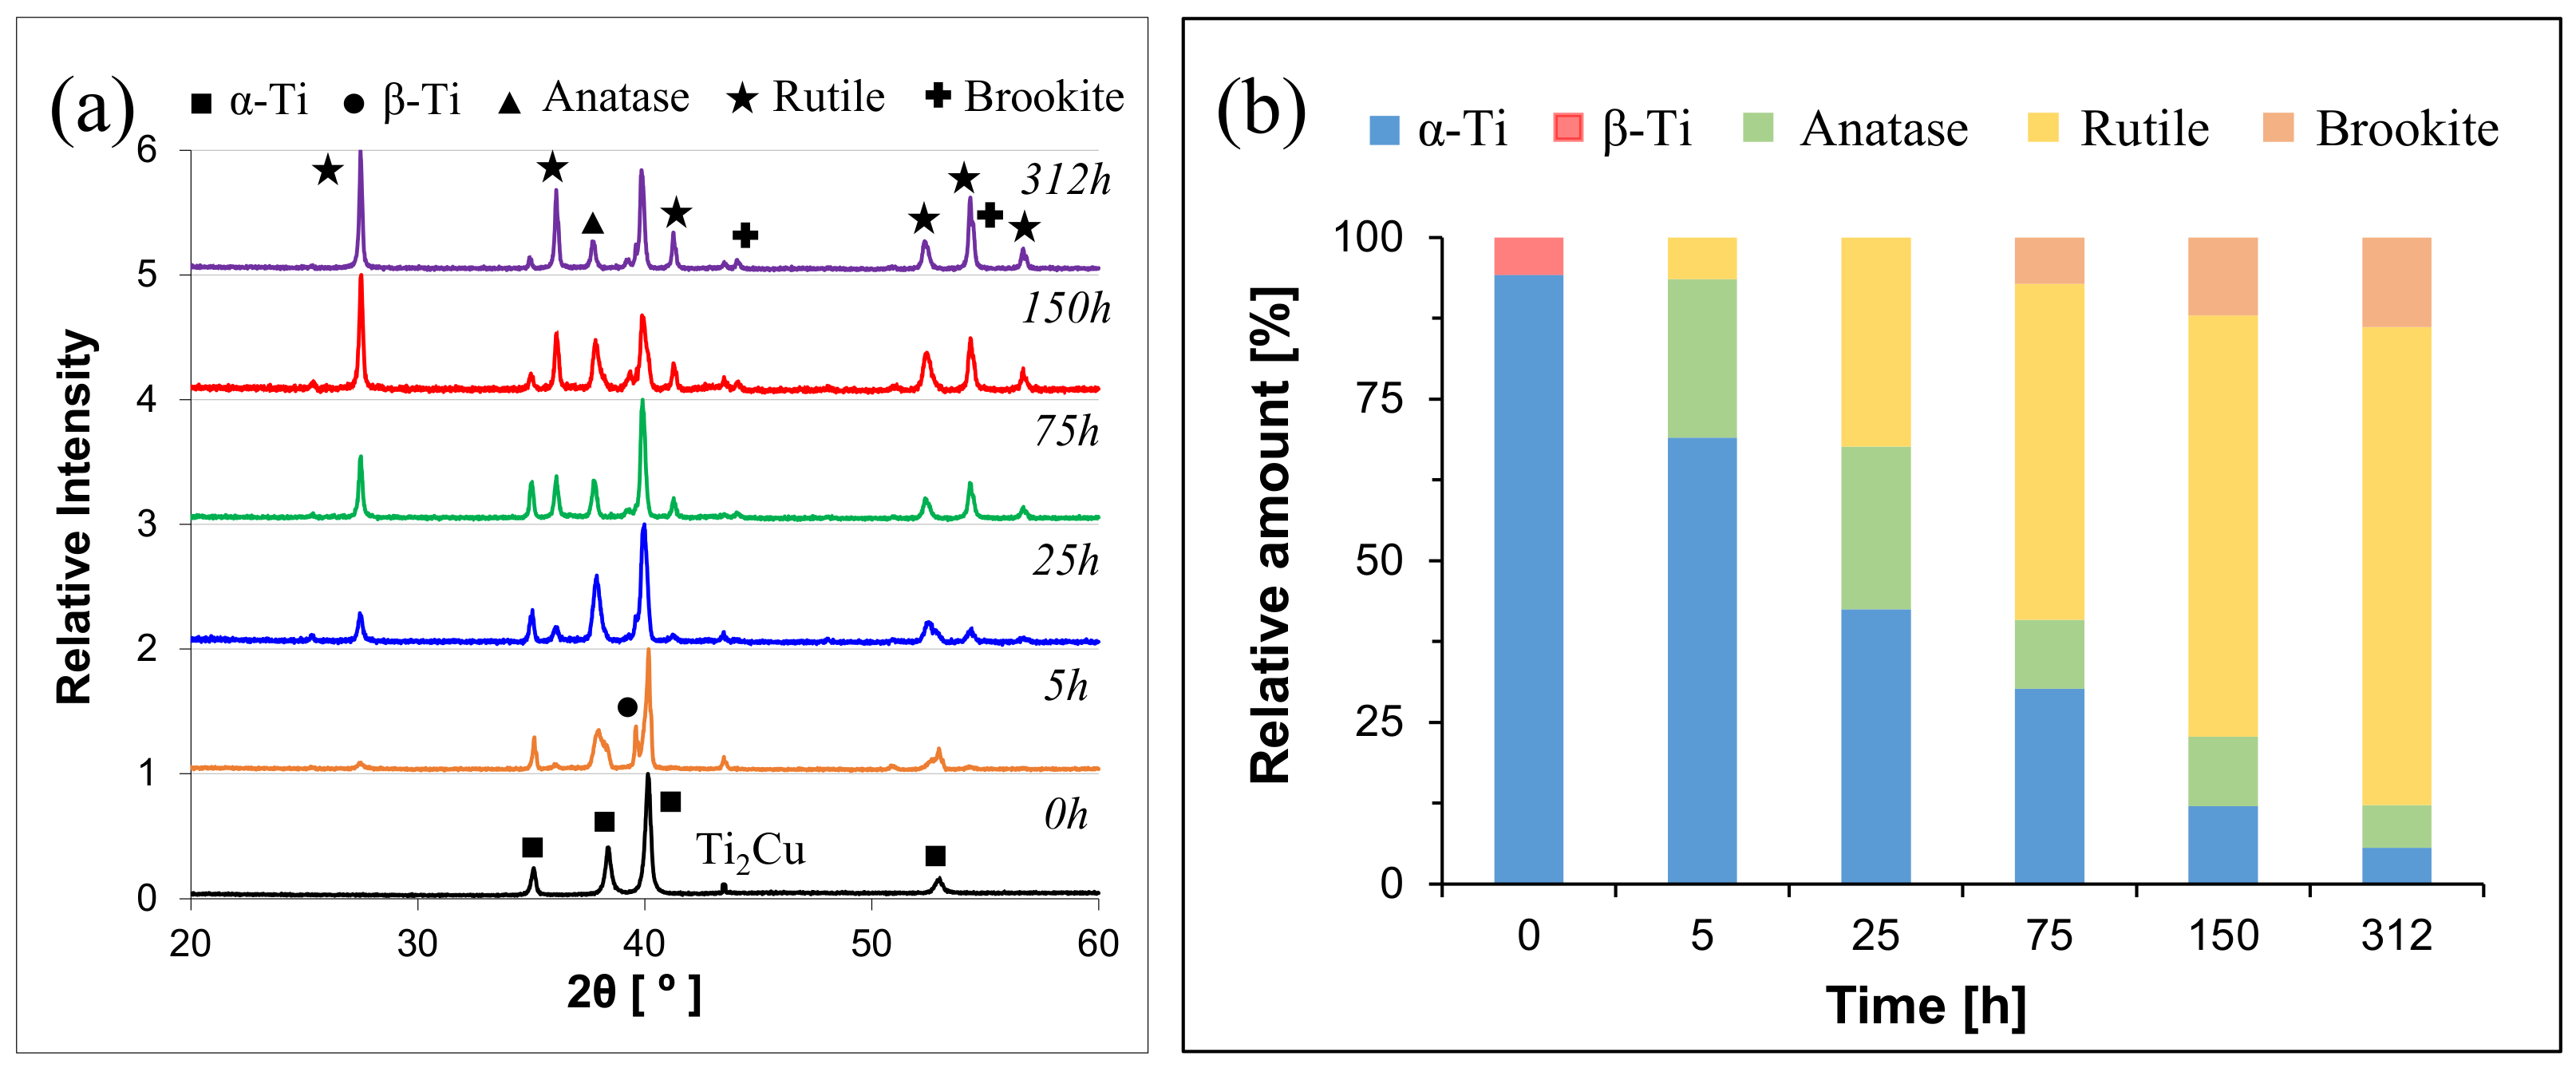
A similar trend is found for the Ti-2.5Cu alloy (Figure 5a) isothermally oxidised at 600 °C with the only difference that the α-Ti phase transitions directly to r-TiO2 when the oxidation time is increased from 75 h to 150 h. The transition through anatase is hidden by the faster oxidation kinetics (Figure 2) as anatase is still present (Figure 5b). Once more, it can be noticed that the α-Ti phase is detected at 312 h due to thickness of the oxide layer (Figure 3) being lower than the XRD penetration depth. As per Table 3, this same behaviour is applicable to the binary Ti-5Cu alloy isothermally oxidised at 600 °C.
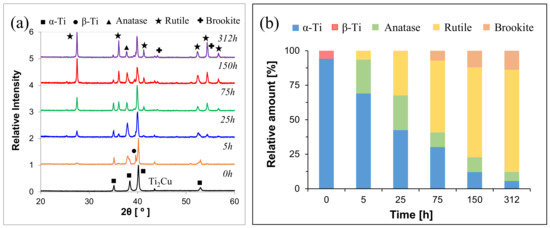
Figure 5.
Results of the XRD analysis performed on the Ti-2.5Cu alloy isothermally oxidised at 600 °C: (a) XRD patterns, and (b) relative amount of the different phases present in the surface of the oxidised alloy.
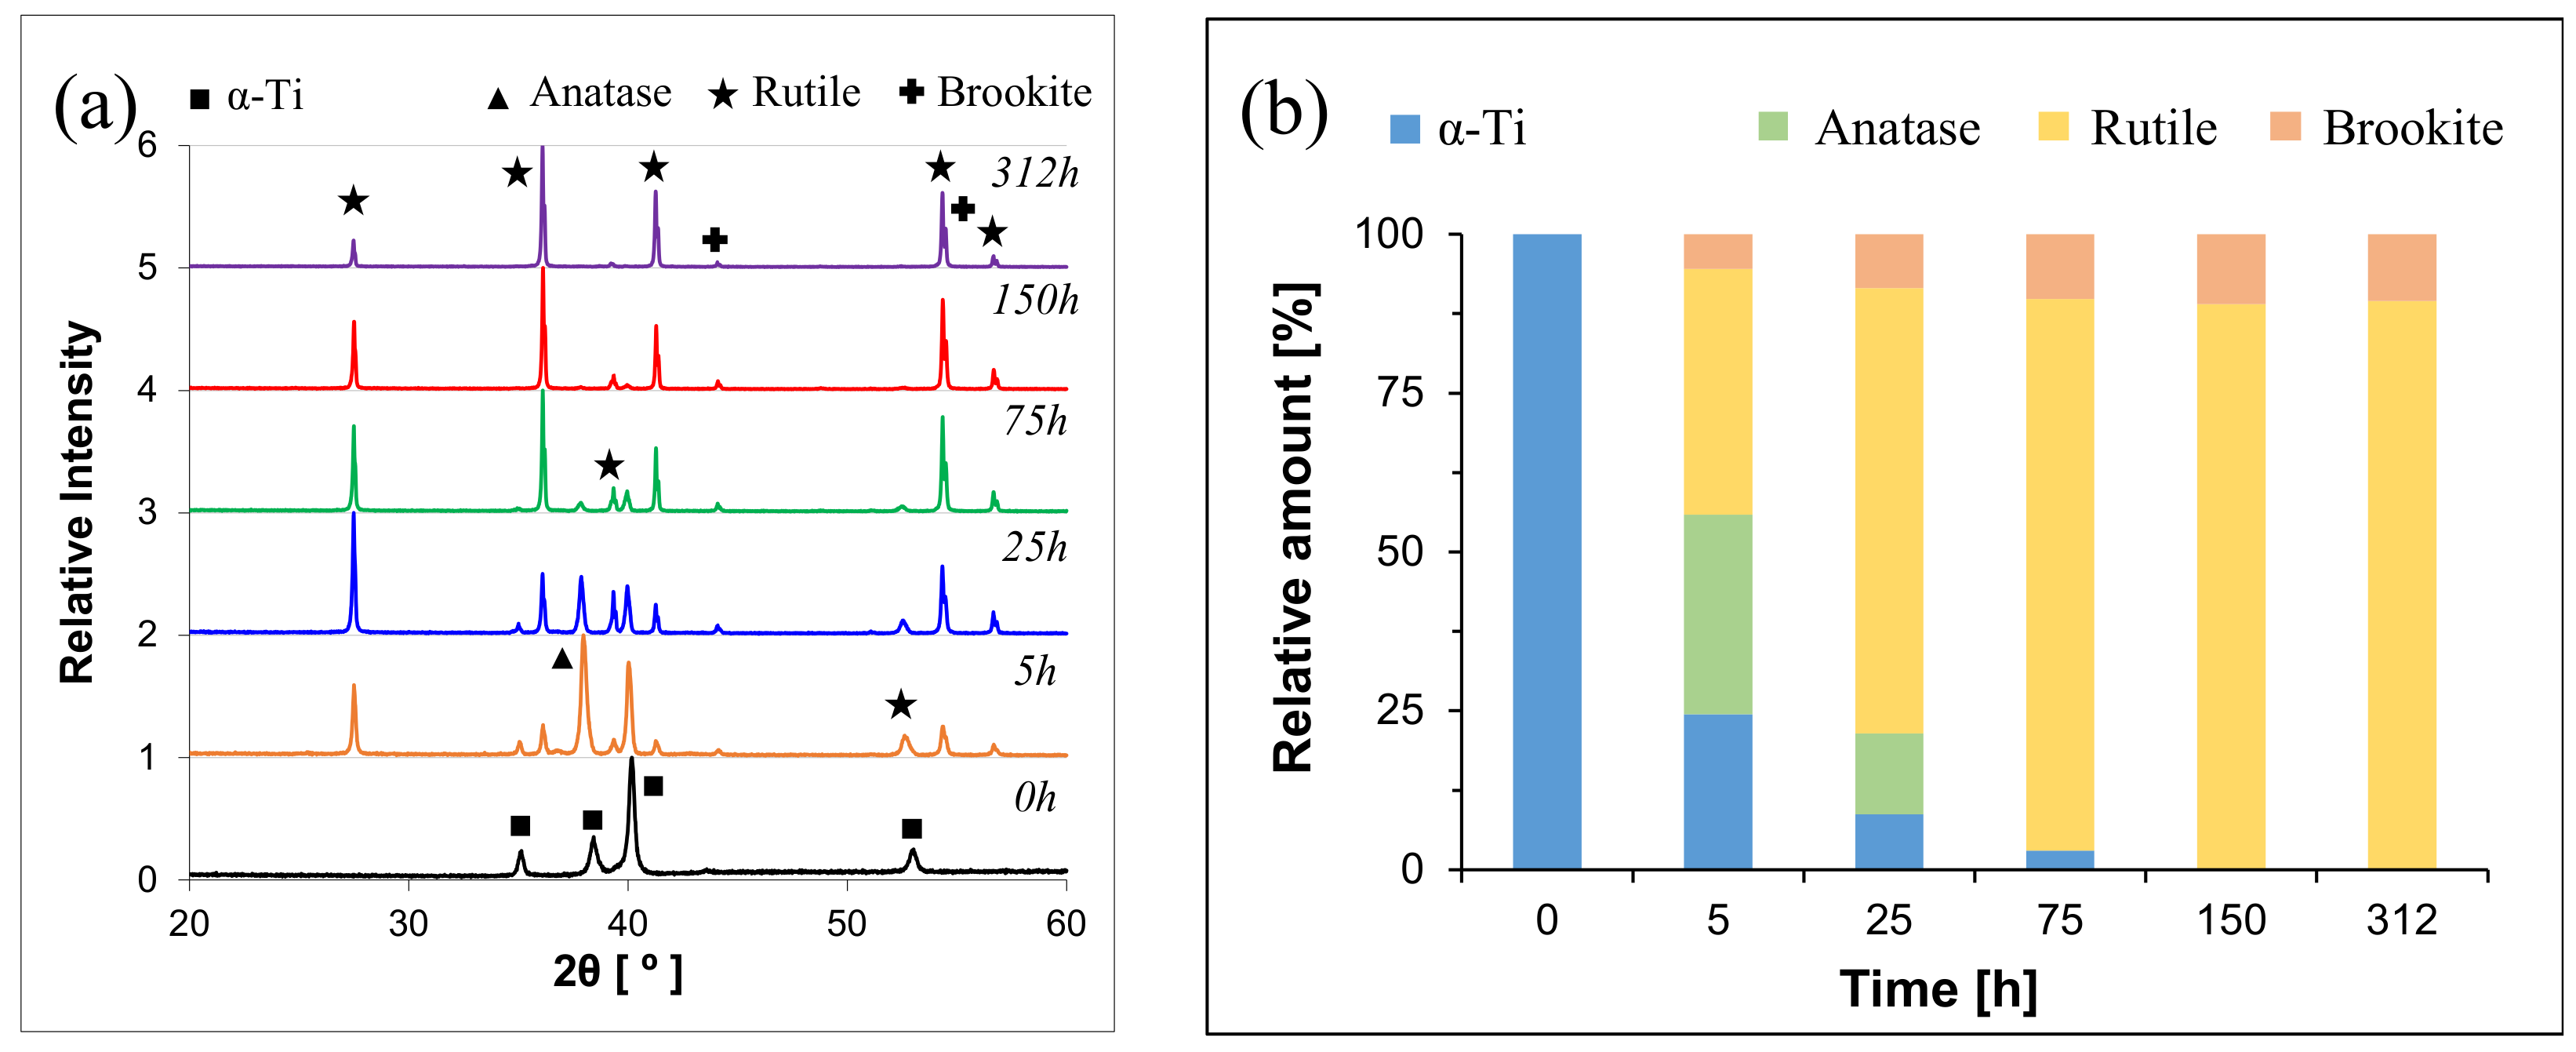
Regarding the binary Ti-Cu alloys isothermally oxidised at 700 °C, a couple of changes were detected with respect to the alloys oxidised at 600 °C. Firstly, the direct transition of the α-Ti phase to r-TiO2 at 25 h rather than at 75 h (Figure 6) due to the faster kinetics. Secondly, analysing the peaks with the highest relative intensity there seems to be a transition of the main plane of growth of rutile from r-TiO2(110) to r-TiO2(101). This transition was detected at 75 h for the Ti-0.5Cu alloy and at 150 h for the Ti-2.5Cu and Ti-5Cu alloys (Table 4), highlighting the effect of the chemistry of the alloy and the associated microstructural features.
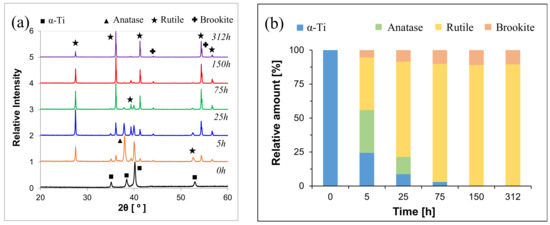
Figure 6.
Results of the XRD analysis performed on the Ti-0.5Cu alloy isothermally oxidised at 700 °C: (a) XRD patterns, and (b) relative amount of the different phases present in the surface of the oxidised alloy.
Table 4.
Phase with the highest relative amount and associated Miller Index plane with the highest relative intensity in each XRD pattern.
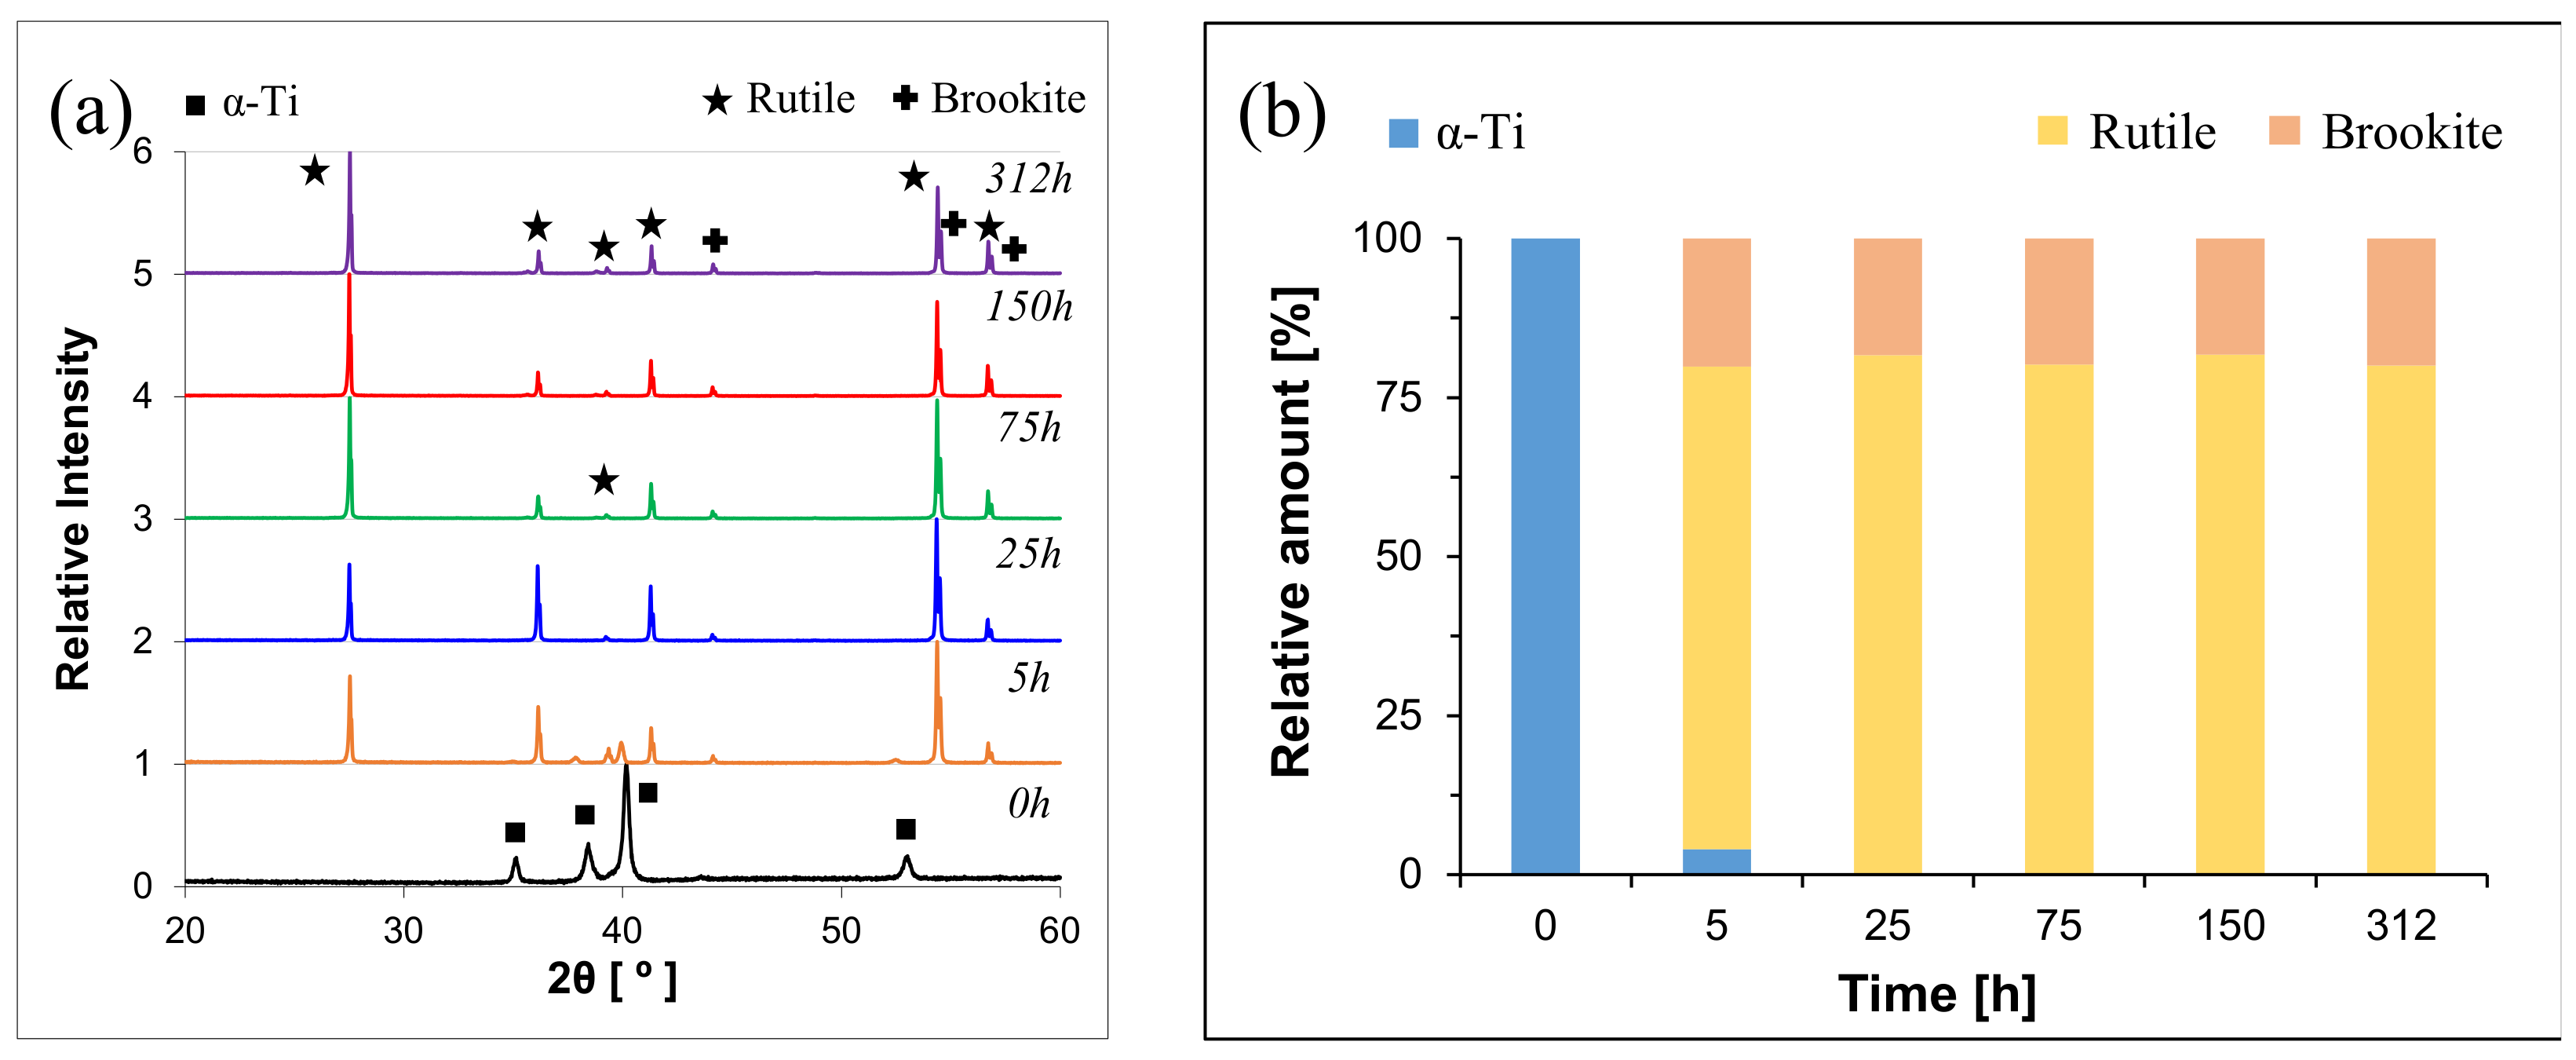
Concerning the Ti-0.5Cu alloy isothermally oxidised at 800 °C, it is found that at this temperature (Figure 7) the system is characterised by the direct transition of the α-Ti phase to the r-TiO2 at 5 h. From Table 4 it can be seen that eventually, at 75 h, the main plane of growth of rutile becomes r-TiO2(110). The same behaviour is found in the other Ti-xCu alloys even though the r-TiO2(211)→r-TiO2(110) main growth mode change occurs at a later stage, for instance at 312 h, as a consequence of the difference in microstructural features.
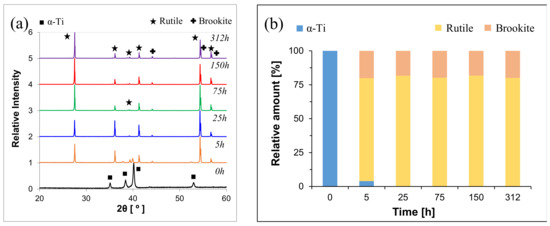
Figure 7.
Results of the XRD analysis performed on the Ti-0.5Cu alloy isothermally oxidised at 800 °C: (a) XRD patterns, and (b) relative amount of the different phases present in the surface of the oxidised alloy.
4. Discussion
In this study, binary Ti-xCu (x = 0.5, 2.5 and 5 wt.%) alloys [37] were used with the aim of clarifying their oxidation kinetics and associated formation of the oxide layer over time (0–312 h) as a function of different isothermal oxidation temperatures (600–800 °C). Such an array of compositions was chosen because of three fundamental aspects: available knowledge, type of microstructure, and precipitation behaviour. Regarding the former, as indicated in the introduction, there is a general lack of understanding of the oxidation behaviour of experimental binary Ti-Cu alloys with respect to well-established wrought Ti alloys, most of which bear Al in their composition (e.g., Ti-6Al-4V, the Ti workhorse alloy). In terms of type of microstructure, this spans from fine to very coarse lamellar entailing different amounts of stabilised β-Ti phase (Figure 1). Regarding the precipitation behaviour, Cu is known as eutectoid β stabiliser as its addition to Ti can lead to the precipitation of intermetallic phases, the most common of which is Ti2Cu as per the binary Ti-Cu phase diagrams [42]. It is worth mentioning that such eutectoid phase transformation is characterised by extremely fast reaction kinetics. This means that, for a sufficiently high amount of Cu, the Ti2Cu intermetallic phase does precipitate even when using high cooling rates (i.e., quenching) from high temperatures [43,44]. The presence or absence of the precipitated Ti2Cu phase in the starting alloys is confirmed by the XRD results. Specifically, Figure 5 shows that the Ti2Cu intermetallic phase was detected in the original (i.e., slow cooled after sintering) binary Ti-xCu alloy for Cu ≥ 2.5 wt.%, as per [37].
4.1. Isothermal Oxidation Kinetics
The oxidation kinetics of the binary Ti-Cu alloys was quantified using mass gain per unit area over time measurements and through fitting of the experimental data where weight gain becomes more obvious at 800 °C, fundamentally obeying the ΔMn = kn·t parabolic law. This indicates that the growth of the oxide layer is controlled by diffusion, as such parabolic behaviour is derived from Fick’s first law. The adsorption of oxygen leads to the nucleation of an outer layer and its subsequent inward growth is controlled by anionic transport mechanisms [10]. Therefore, the principal point defects involved in this transport mechanism are oxygen vacancies and oxygen in interstitial sites [45]. Specifically, the nucleation of a TiO2 lattice entails the oxidation of one Ti atom and the generation of two oxygen vacancies (i.e., Tialloy → TiTiO2 + 2VO + 4e−) [10]. The growth of the superficial oxide layer is limited by the diffusion of oxygen in the oxide scale, but a portion of the flux of oxygen anions is not consumed in the growth process and diffuses inside the metal. This leads to an increment of the oxygen concentration, which is reflected in the shift of the XRD peaks of the metallic phase towards lower angles due to the stretching of the hexagonal lattice. Therefore, the oxidation behaviour of the binary Ti-Cu alloys investigated is essentially the sum of two complementing phenomena: the nucleation and growth of the outer oxidised layer and the interstitial diffusion of oxygen. It is worth mentioning that the shift of the XRD peaks is clearly detected for the α-Ti phase already at 600 °C after 25 h (Figure 4). This is because the solubility of oxygen is ~30 at.% in the hexagonal α-Ti lattice at room temperature [6,7].
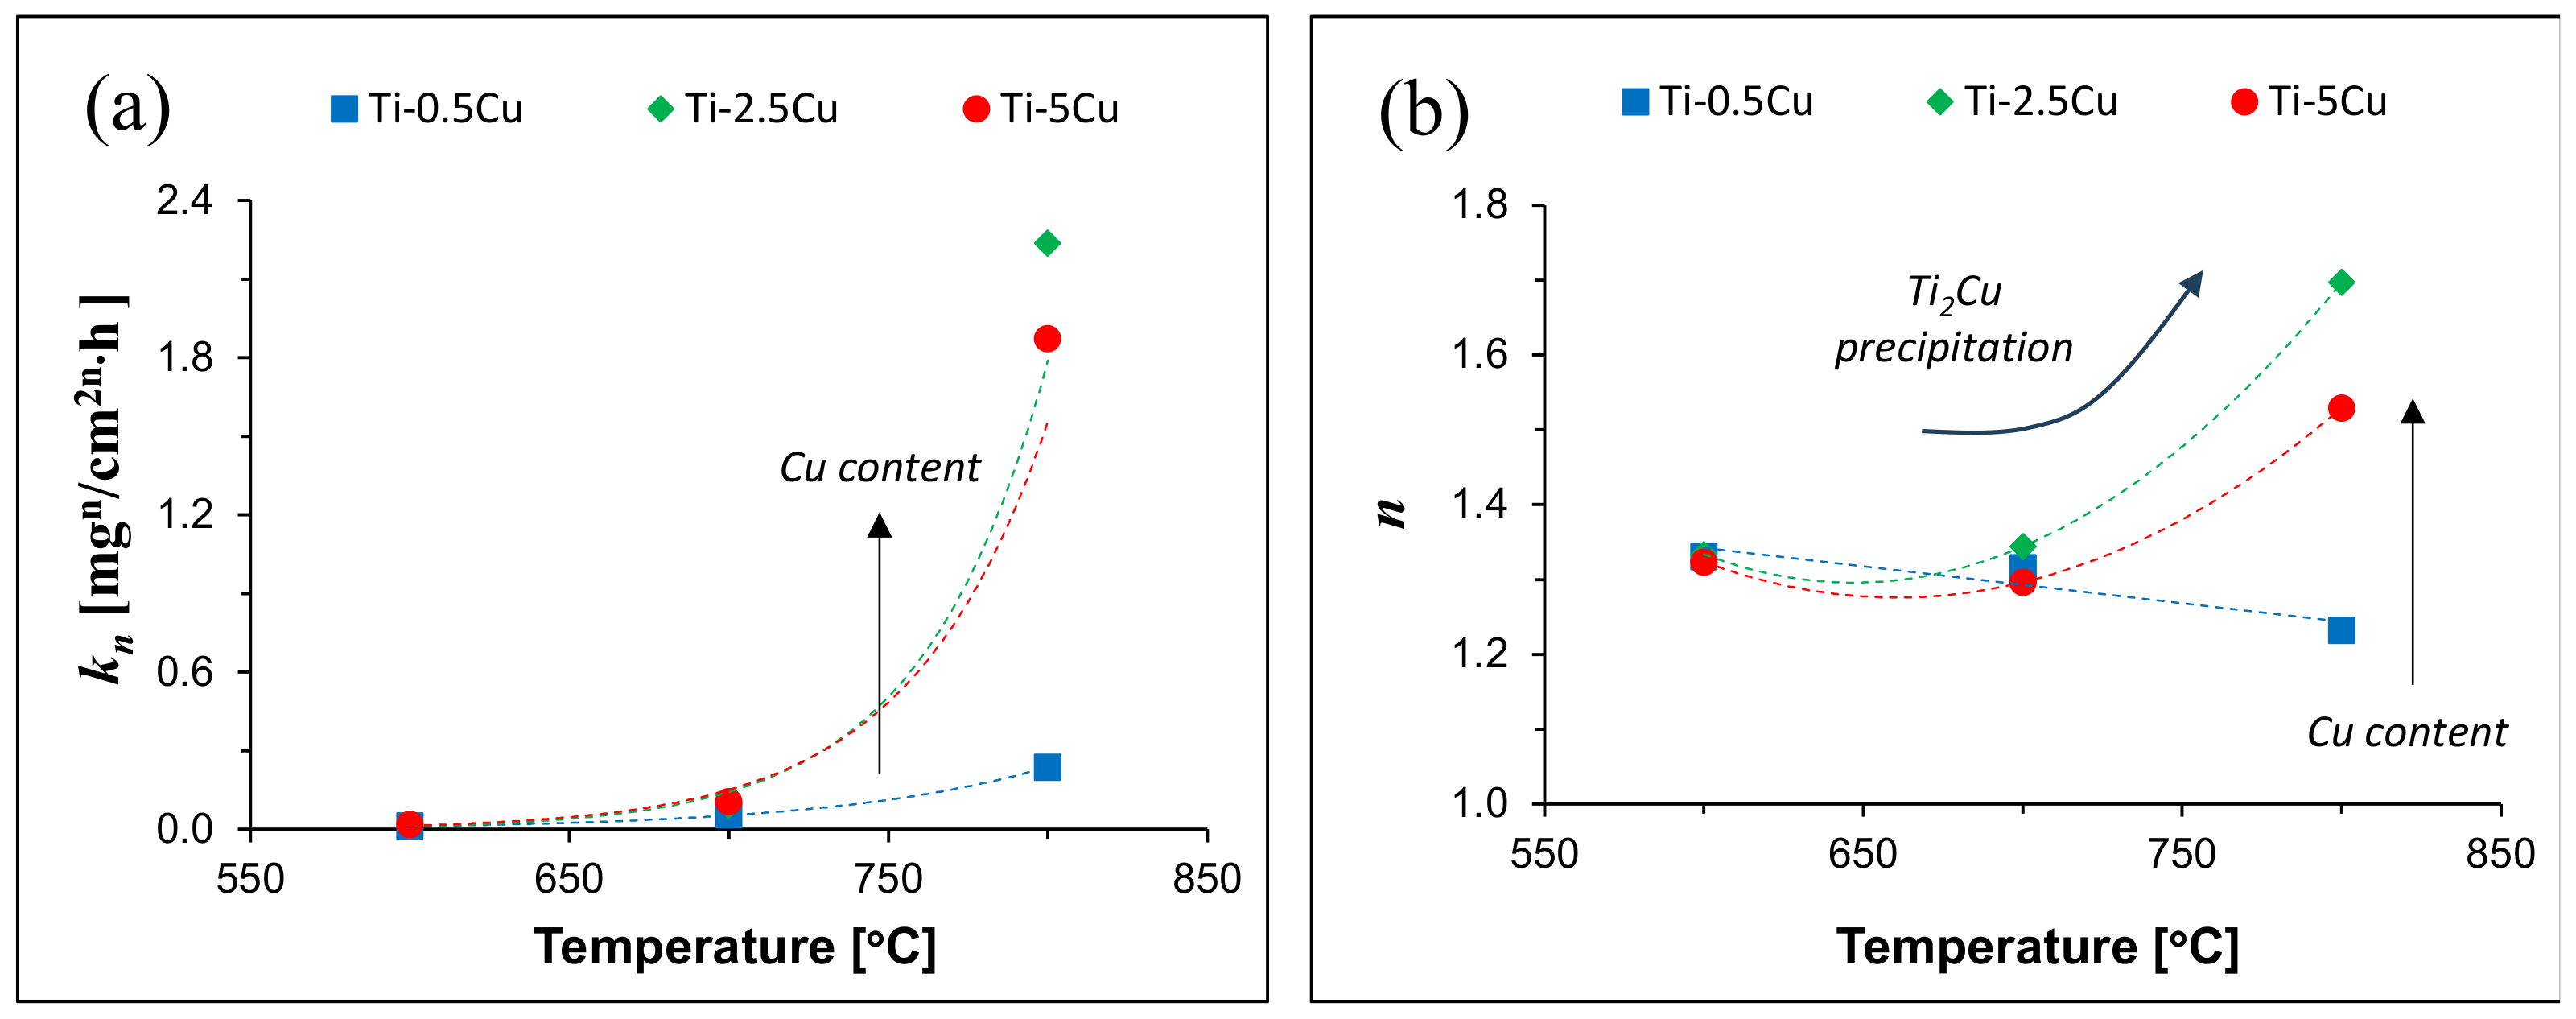
The analysis of the parameters of the isothermal oxidation kinetics parabolic law yields that the rate constant kn exponentially increases with the oxidation temperature (Figure 8a). Moreover, it can be noticed that the chemistry of the alloy and the associated microstructure has a significant effect on the oxidation resistance; for instance, the Ti-0.5Cu alloy is characterised by remarkably lower kn values. Conversely, no unified trend is found for the oxidation exponent n (Figure 8b), highlighting the effect of the alloy chemistry, which leads to a monotonic decrease in the n value for the Ti-0.5Cu alloy and an exponential increase for the other binary Ti-Cu alloys. The increase in n value is an indication that the oxide layer becomes intrinsically more protective, even though the oxidation kinetics is faster at higher temperatures. Regardless, it is clear that the oxidation kinetics of the binary Ti-Cu alloys does not follow an ideal parabolic relationship (i.e., n ≠ 2). This deviation from an overall pure parabolic model is not surprising as it is linked to the change in oxidation kinetics regime as Kofstad et al. [46] empirically confirmed the transition from parabolic to linear at high temperatures (800–1200 °C). Furthermore, Kofstad and Hauffe proved that the oxidation kinetics of pure Ti is temperature/time dependent, switching from a cubic to a parabolic regime in the 350–650 °C temperature range for long expositions, and afterwards, to a linear regime [47]. It can be noticed that the expected change in oxidation kinetics from parabolic to linear after 700 °C fits well with the Ti-0.5Cu alloy but not with the Ti-2.5Cu and Ti-5Cu alloys.
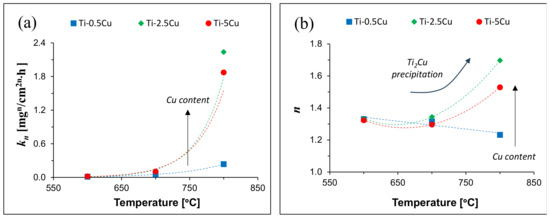
Figure 8.
Variation of the oxidation kinetics law parameters as a function of the temperature: (a) rate constant kn, and (b) oxidation exponent n.
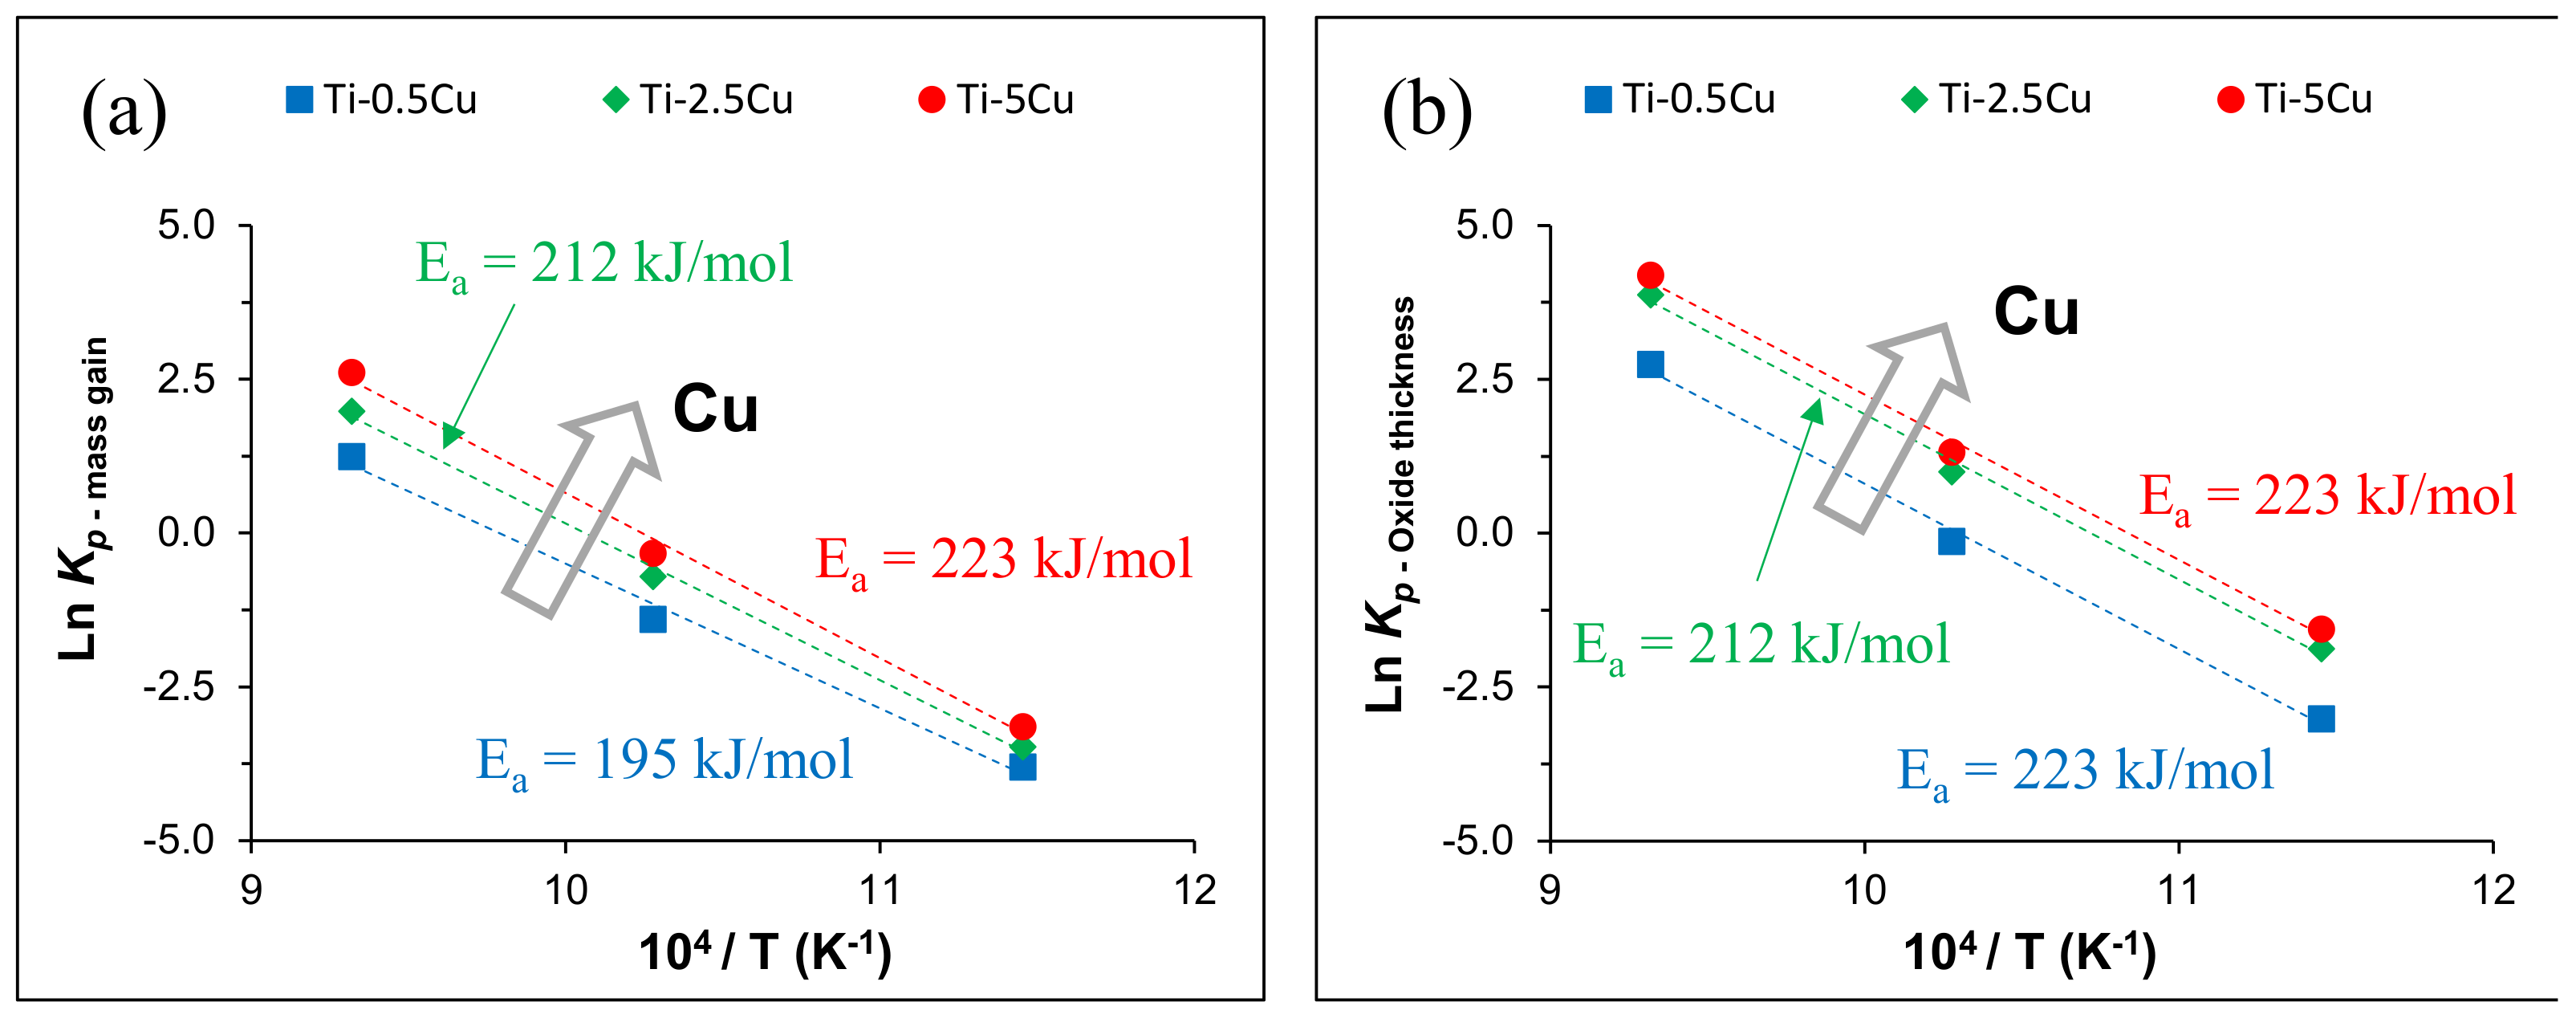
The ideal parabolic rate constant (kp) has a well-established theoretical significance; therefore, to make the comparison with other data with literature possible, regression lines fitting a parabolic model of the oxidation experimental data were used. The variation of kp as a function of the inverse of the temperature, when plotted logarithmically (Figure 9a), leads to an Arrhenius-type behaviour with comparable activation energy, whose average is 210 ± 14 J/mol, which is of comparable magnitude to those reported for pure Ti and Ti alloys ~190 kJ/mol [22,45]. The calculate activation energy value is similar to that of oxygen diffusion in α-Ti (i.e., 200 kJ/mol [48]). However, it can be noticed that the actual activation energy monotonically increases with the amount of Cu. This is due to the higher the amount of stabilised β-Ti phase within the microstructure as the activation energy for diffusion of oxygen in β-Ti is higher (i.e., 288 kJ/mol [49]) than that of α-Ti.
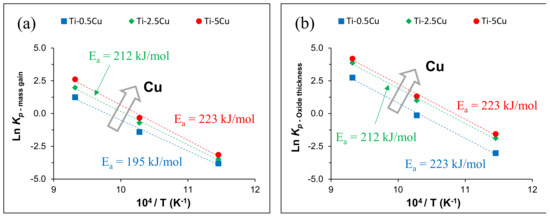
Figure 9.
Arrhenius diagram of the mass gain (a) and of the oxide layer growth (b) kinetics of the binary Ti-Cu alloys.
The calculated kp values are reported in Table 5 where it can be seen that the kp value of the binary Ti-Cu alloys of this study is comparable to that of other powder metallurgy and wrought Ti-based alloys. It can be noticed that the Ti-6Al-4V isothermally oxidised at 600 °C has higher oxidation resistance (i.e., smaller kp) due to the presence of Al in its composition. However, the gap in oxidation resistance progressively decreases with the increase in the oxidation temperature and comparable kp values between Al-free and Al-bearing Ti alloys are eventually obtained. It is worth noting that the kp value of the binary Ti-Cu alloys isothermally oxidised at 800 °C is remarkable lower with respect to that of the wrought Ti-6Al-4V alloy.
Table 5.
Values of the parabolic rate constant (kp) for different powder metallurgy (PM) and wrought (W) Ti-based alloys.
4.2. Oxide Layer Growth Kinetics
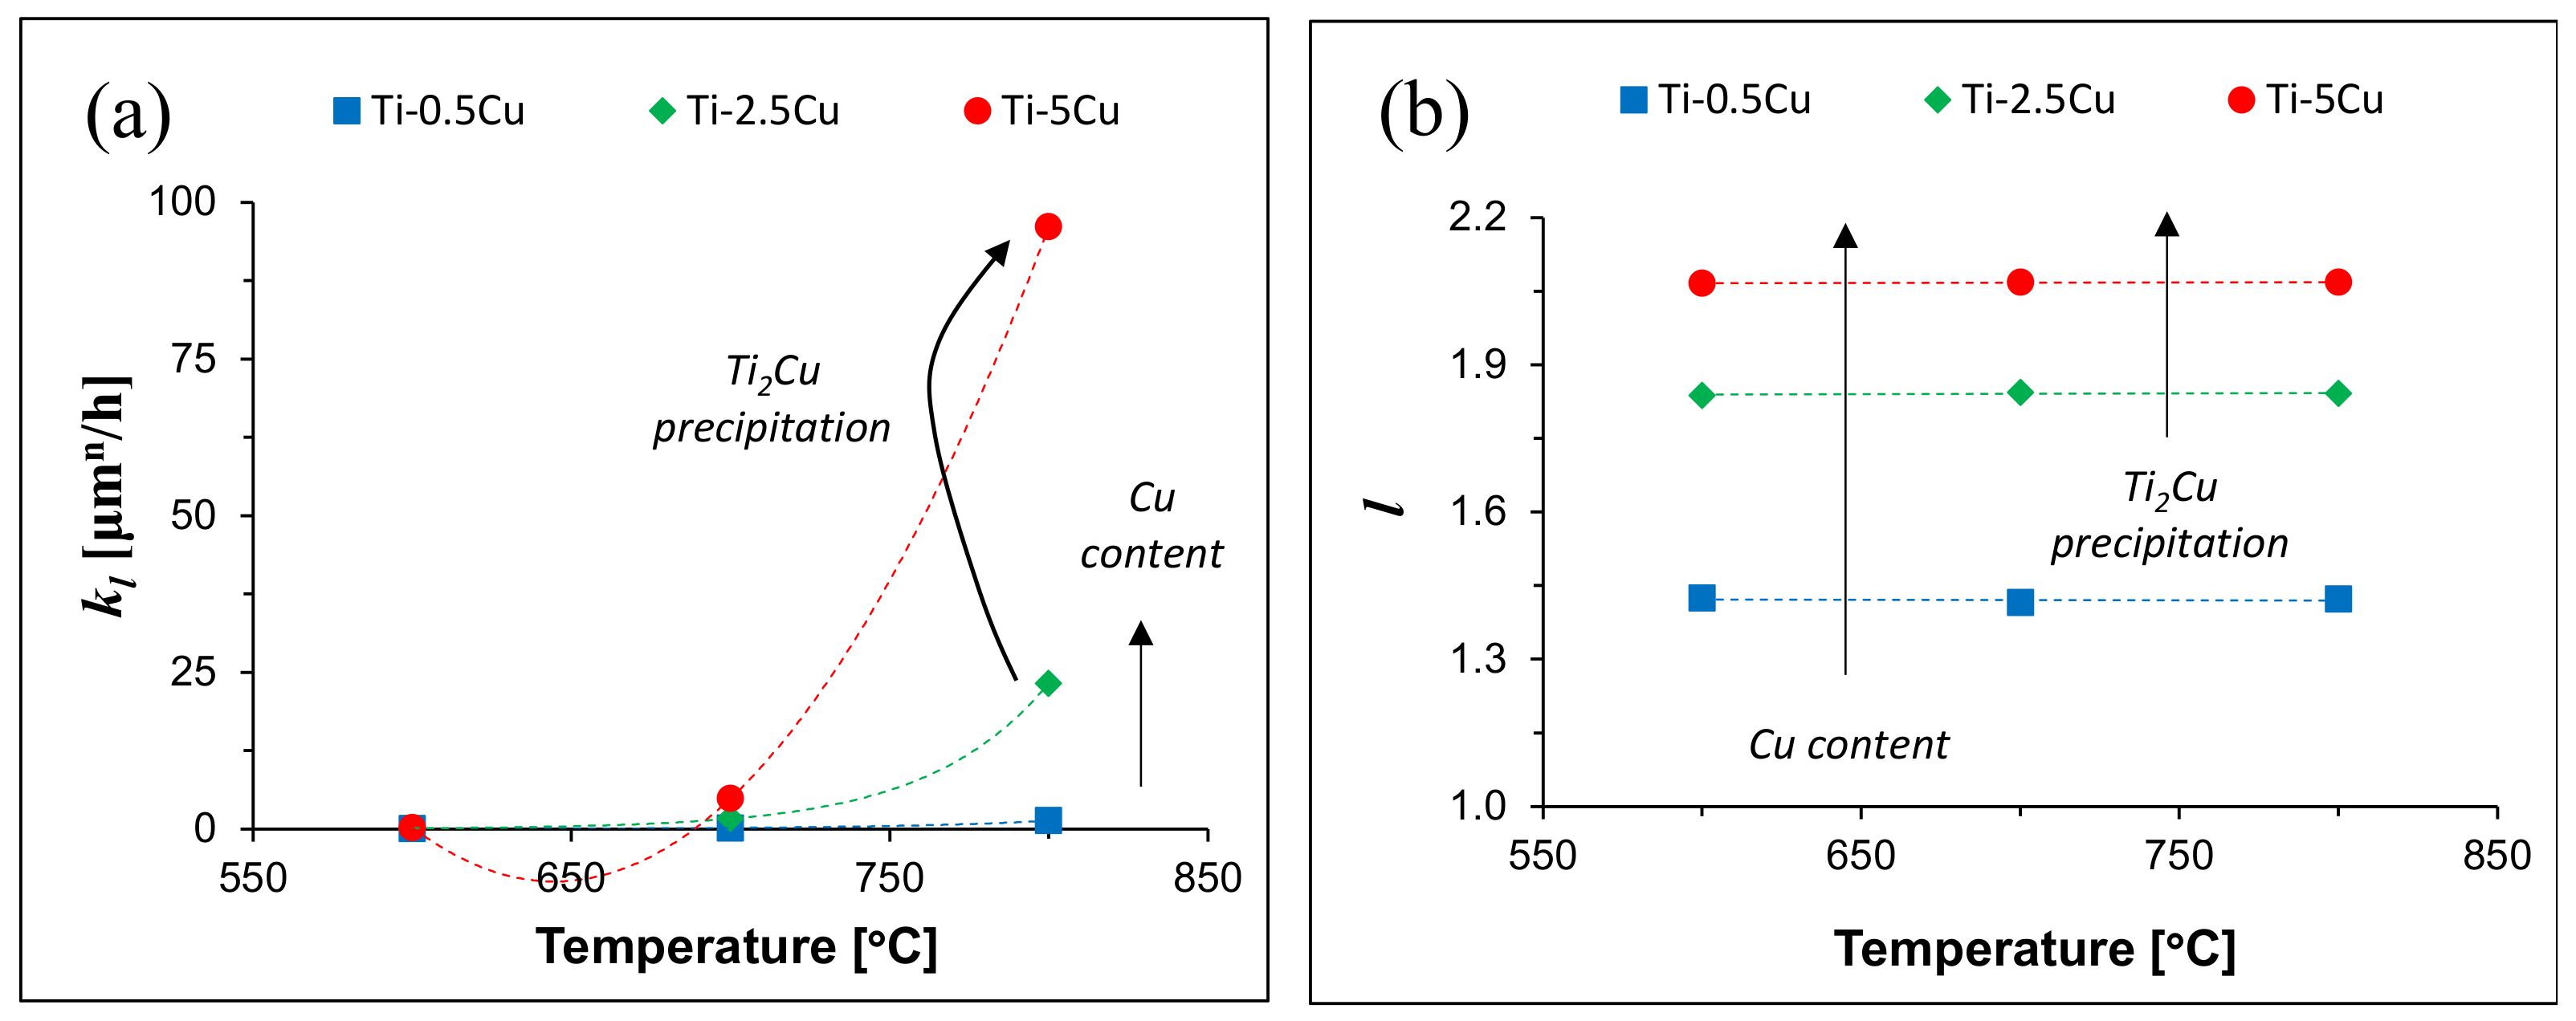
As oxygen vacancies are the main species responsible for the growth mechanism, and thus the process is diffusion controlled, the oxide layer growth kinetics still follow a parabolic law (ΔWl = kl·t). Consequently, independently of the composition of the binary Ti-Cu alloy, the oxide layer thickness increases with the oxidation time and it is notably more pronounced at 800 °C compared to 600–700 °C (Figure 3) due to the faster oxide layer growth kinetics. Specifically, the rate constant kl exponentially increases with the oxidation temperature (Figure 10a). Considering the growth exponent l, a common constant trend is shared by all the binary Ti-Cu alloys (Figure 10b). The assessment of the oxide layer growth kinetics using the ideal parabolic rate and regression lines fitting leads to an activation energy value of 223 ± 1 kJ/mol as seen from the Arrhenius-type behaviour (Figure 9b). Therefore, oxide layer growth kinetics is still dictated by the inwards diffusion of oxygen.
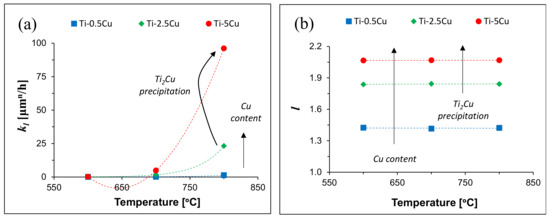
Figure 10.
Variation of the oxide layer growth kinetics law parameters as a function of the temperature: (a) rate constant kl, and (b) growth exponent l.
4.3. Oxidation Mechanism
From the analysis of the crystalline structure during the evolution of the oxide layer with the exposure time, it can be seen that the three TiO2 polymorphs form in different alloys at different stages, although rutile is the most stable structure. Specifically, three key aspects can be highlighted considering the isothermal oxidation behaviour at 600 °C. Firstly, the formation of the TiO2 layer starts in the form of anatase, which is clearly detected in the Ti-0.5Cu isothermally oxidised at 600 °C (Table 3). The α-Ti(101) and a-TiO2(004), respectively, are the XRD peaks with the highest relative intensity (Figure 4a). Subsequently, anatase transforms into rutile where the r-TiO2(110) plane has the highest relative intensity and it is the phase with the highest relative amount (Table 4). Even though anatase is metastable at all temperatures, and rutile is the equilibrium polymorph, anatase initially forms due to its lower surface energy associated with the (004) plane resulting into its preferential ⟨001⟩ growth [51,52]. Commonly, anatase begins its irreversible transformation to rutile in air at ~600 °C [53], but this temperature is alloy-dependent. The established anatase to rutile transformation entails the nucleation of rutile at anatase {112} twin boundaries as a consequence of the low activation energy [54]. Four orientation relationships are thus possible: ⟨010⟩A||⟨110⟩R with {112}A||{200}R [54], ⟨110⟩A||⟨011⟩R with {112}A||{200}R [55], ⟨201⟩A||⟨111⟩R with {101}A||{101}R [56], and [001]A||[100]R with (020)A||(01)R [57]. The latter orientation relationship is coherent with the results of Table 4. DTF (density functional theory) simulation shows that the anatase lattice undergoes shearing along different directions, with associated strains and Ti-O bonds breaking and reforming, to transform into the rutile lattice [57]. Due to the faster oxidation kinetics, this transition is masked in the other binary Ti-Cu alloys, although anatase is still detected in their respective XRD patterns (e.g., Figure 5). This is due to the higher relative amount of β-Ti phase stabilised in the microstructure. It can be also noticed that from the peak with the highest relative intensity there seems to be a direct transition from the α-Ti phase to r-TiO2 which shifts to longer oxidation times as the amount of Cu increases (Table 3). This is related to the concurrent eutectoid precipitation of the Ti2Cu phase. Regardless of the transitions and shifts discussed, rutile is the predominant phase constituting the oxide layer from early (i.e., 25–75 h) oxidation times (Table 4).
The increase in the isothermal oxidation temperature expectedly moves the initial formation of anatase and the eventual transition to the equilibrium rutile polymorph at much shorter oxidation times (i.e., ≤5 h, Table 3) regardless of the specific oxidation temperature. However, it is found that isothermal oxidation at 700 °C leads to the texturing of rutile where the r-TiO2(101) plane becomes the one with the highest relative intensity (Table 4) instead of the r-TiO2(110) plane. The presence of the eutectoid transformation shifts this texturing towards longer exposure times. It is also found that as the oxidation temperature is raised to 800 °C, texturing of rutile occurs along the r-TiO2(211) starting from the α-Ti phase from very short exposure times. Such texturing is maintained for significantly longer exposure times when the eutectoid precipitation concurrently takes place (Table 4).
5. Conclusions
This study investigated the oxidation kinetics, and associated oxide layer structure, of binary Ti-Cu alloys characterised by different microstructures. The oxidation resistance of the binary Ti-Cu alloys decreases with the increment of the temperature, with more obvious weight gain at 800 °C, essentially obeying a non-ideal parabolic law for both oxidation and oxide layer growth kinetics. Mass gains ranging from, respectively, 2.6–3.6 mg/cm2 at 600 °C, 8.5–14.7 mg/cm2 at 700 °C, and 32.0–64.3 mg/cm2 at 800 °C were found at 312 h of exposure time where the lowest values correspond to the Ti-0.5Cu alloy and the highest to the Ti-5Cu alloy. Similarly, oxide layer thicknesses in the range of 0.4–3.8 μm for the Ti-0.5Cu, 0.8–6.6 μm for the Ti-2.5Cu, and 1.1–8.0 μm for the Ti-5Cu alloy, respectively, isothermally oxidised at 600 °C were obtained.
The oxidation mechanism is governed by anionic inward diffusion of oxygen leading to the nucleation/growth of the oxide layer. The incoming flux of oxygen anions is primarily consumed in the growth process and the remaining portion increases the oxygen concentration of the alloy. The interstitial diffusion of oxygen stretches the lattice of Ti, leading to the shift of its XRD peaks towards lower angles, and destabilises the β-Ti phase as oxygen is a α stabiliser. The oxidation/oxide layer growth kinetics law rate constant exponentially increases with the oxidation temperature, ranging from 0.01 to 96.08, with a minor effect from the alloy type. Conversely, the kinetics law exponent is highly dependent on the alloy chemistry leading to a different behaviour for the oxidation (i.e., n = 1.23–1.70) and oxide layer growth (i.e., l = 1.42–2.07) kinetics.
Overall, the oxidation resistance decreases with the amount of Cu present in the binary Ti-Cu alloys, which determines the amount of stabilised β-Ti phase. The analysis with the well-established ideal parabolic rate constant yields that the binary Ti-Cu alloys have comparable oxidation behaviour to other Al-free and Al-bearing Ti alloys. Finally, this study demonstrates that different TiO2 polymorphs compose the oxide layer of different alloys at different stages entailing the initial formation of the metastable anatase phase due to its lower surface energy. In particular, the alloys start from being composed of 83–100% of α-Ti phase and end up with an oxide layer on average composed of 80–90% of rutile and 10–20% of brookite at 312 h of exposure time. Anatase eventually transforms into rutile via specific orientation relationships. The increment of the amount of Cu and higher oxidation temperatures mainly shifts this transition to shorter oxidation times. However, specific combinations of oxidation temperature/time and alloy chemistry induce texturing in rutile and the formation of the metastable brookite TiO2 polymorph.
Author Contributions
Conceptualization, L.B.; methodology, F.A., F.Y. and L.B.; formal analysis, L.B.; investigation, F.A., F.Y. and L.B.; data curation, F.A. and L.B.; writing—review and editing, L.B. All authors have read and agreed to the published version of the manuscript.
Funding
This research did not receive any specific grant from funding agencies in the public, commercial, or not-for-profit sectors.
Data Availability Statement
The raw data supporting the conclusions of this article will be made available by the authors on reasonable request.
Conflicts of Interest
The authors declare no conflicts of interest.
References
- Chen, H.-C.; Pinkerton, A.J.; Li, L. Fibre Laser Welding of Dissimilar Alloys of Ti-6Al-4V and Inconel 718 for Aerospace Applications. Int. J. Adv. Manuf. Technol. 2011, 52, 977–987. [Google Scholar] [CrossRef]
- Boyer, R.; Welsch, G.; Collings, E.W. Materials Properties Handbook: Titanium Alloys; ASM International: Novelty, OH, USA, 1998. [Google Scholar]
- Qu, S.J.; Tang, S.Q.; Feng, A.H.; Feng, C.; Shen, J.; Chen, D.L. Microstructural Evolution and High-temperature Oxidation Mechanisms of a Titanium Aluminide Based Alloy. Acta Mater. 2018, 148, 300–310. [Google Scholar] [CrossRef]
- Imam, M.A.; Froes, F.H.; Reddy, R.G. Cost Effective Developments for Fabrication of Titanium Components. Key Eng. Mater. 2013, 551, 3–10. [Google Scholar] [CrossRef]
- Amherd Hidalgo, A.; Frykholm, R.; Ebel, T.; Pyczak, F. Powder Metallurgy Strategies to Improve Properties and Processing of Titanium Alloys: A Review. Adv. Eng. Mater. 2017, 19, 1600743. [Google Scholar] [CrossRef]
- Kitashima, T.; Liu, L.J.; Murakami, H. Numerical Analysis of Oxygen Transport in Alpha Titanium during Isothermal Oxidation. J. Electrochem. Soc. 2013, 160, C441. [Google Scholar] [CrossRef]
- Kitashima, T.; Kawamura, T. Prediction of Oxidation Behavior of Near-α Titanium Alloys. Scr. Mater. 2016, 124, 56–58. [Google Scholar] [CrossRef]
- Jung, I.H.; Eriksson, G.; Wu, P.; Pelton, A. Thermodynamic Modeling of the Al2O3-Ti2O3-TiO2 System and Its Applications to the Fe-Al-Ti-O Inclusion Diagram. ISIJ Int. 2009, 49, 1290–1297. [Google Scholar] [CrossRef]
- Khan, S.U.M.; Al-Shahry, M.; Ingler, W.B. Efficient Photochemical Water Splitting by a Chemically Modified n-TiO2. Science 2002, 297, 2243–2245. [Google Scholar] [CrossRef]
- Siblani, M.; Ollivier, M.; Favergeon, L.; Chartrand, P. Experimental and Thermodynamic Modeling of Al2O3 Corundum and TiO2 Rutile Structures Forming on Ti-6Al-4V Powder during Oxidation. Acta Mater. 2023, 256, 119037. [Google Scholar] [CrossRef]
- Raynova, S.; Yang, F.; Bolzoni, L. Mechanical Behaviour of Induction Sintered Blended Elemental Powder Metallurgy Ti Alloys. Mater. Sci. Eng. A 2021, 799, 140157. [Google Scholar] [CrossRef]
- Bolzoni, L.; Esteban, P.G.; Ruiz-Navas, E.M.; Gordo, E. Mechanical Behaviour of Pressed and Sintered Titanium Alloys Obtained from Prealloyed and Blended Elemental Powders. J. Mech. Behav. Biomed. Mater. 2012, 14, 29–38. [Google Scholar] [CrossRef] [PubMed]
- Reverte, E.; Tsipas, S.A.; Gordo, E. Oxidation and Corrosion Behavior of New Low-Cost Ti-7Fe-3Al and Ti-7Fe-5Cr Alloys from Titanium Hydride Powders. Metals 2020, 10, 254. [Google Scholar] [CrossRef]
- Garbacz, H.; Lewandowska, M. Microstructural Changes during Oxidation of Titanium Alloys. Mater. Chem. Phys. 2003, 81, 542–547. [Google Scholar] [CrossRef]
- Tsipas, S.A.; Gordo, E.; Jiménez-Morales, A. Oxidation and Corrosion Protection by Halide Treatment of Powder Metallurgy Ti and Ti6Al4V Alloy. Corros. Sci. 2014, 88, 263–274. [Google Scholar] [CrossRef]
- Jiang, H.; Hirohasi, M.; Imanari, H.; Lu, Y. The Relationship between the Morphology of the Scale and the Oxidation Kinetics at Elevated Temperatures in Ti-Al Alloys. Scr. Mater. 2001, 45, 253–259. [Google Scholar] [CrossRef]
- Wang, S.; Liao, Z.; Liu, Y.; Liu, W. Influence of Thermal Oxidation Duration on the Microstructure and Fretting Wear Behavior of Ti6Al4V Alloy. Mater. Chem. Phys. 2015, 159, 139–151. [Google Scholar] [CrossRef]
- Aniołek, K.; Łosiewicz, B.; Kubisztal, J.; Osak, P.; Stróż, A.; Barylski, A.; Kaptacz, S. Isothermal Oxidation of Ti-6Al-7Nb Alloy. Vacuum 2015, 114, 114–118. [Google Scholar] [CrossRef]
- Du, H.L.; Datta, P.K.; Lewis, D.B.; Burnell-Gray, J.S. Air Oxidation Behaviour of Ti-6Al-4V Alloy between 650 and 850. Corros. Sci. 1994, 36, 631–642. [Google Scholar] [CrossRef]
- Latief, F.H.; Sherif, E.-S.M.; Wismogroho, A.S.; Widayatno, W.B.; Abdo, H.S. The Cyclic Oxidation and Hardness Characteristics of Thermally Exposed Titanium Prepared by Inductive Sintering-Assisted Powder Metallurgy. Crystals 2020, 10, 104. [Google Scholar] [CrossRef]
- Kofstad, P. High-temperature Oxidation of Titanium. J. Less Common Met. 1967, 12, 449–464. [Google Scholar] [CrossRef]
- Frangini, S.; Mignone, A.; de Riccardis, F. Various Aspects of the Air Oxidation Behaviour of a Ti6Al4V Alloy at Temperatures in the Range 600–700 °C. J. Mater. Sci. 1994, 29, 714–720. [Google Scholar] [CrossRef]
- Mungole, M.N.; Singh, N.; Mathur, N. Oxidation Behaviour of Ti6Al4V Titanium Alloy in Oxygen. Mater. Sci. Technol. 2002, 18, 111–114. [Google Scholar] [CrossRef]
- Kumar, S.; Narayanan, T.S.; Raman, S.G.S.; Seshadri, S. Thermal Oxidation of Ti6Al4V Alloy: Microstructural and Electrochemical Characterization. Mater. Chem. Phys. 2010, 119, 337–346. [Google Scholar] [CrossRef]
- Guleryuz, H.; Cimenoglu, H. Oxidation of Ti-6Al-4V Alloy. J. Alloys Comp. 2009, 472, 241–246. [Google Scholar] [CrossRef]
- Rajabi, A.; Mashreghi, A.R.; Hasani, S. Non-isothermal Kinetic Analysis of High Temperature Oxidation of Ti-6Al-4V Alloy. J. Alloys Comp. 2020, 815, 151948. [Google Scholar] [CrossRef]
- Gaddam, R.; Sefer, B.; Pederson, R.; Antti, M.L. Oxidation and Alpha-case Formation in Ti-6Al-2Sn-4Zr-2Mo Alloy. Mater. Charact. 2015, 99, 166–174. [Google Scholar] [CrossRef]
- Bolzoni, L.; Esteban, P.G.; Ruiz-Navas, E.M.; Gordo, E. Influence of Powder Characteristics on Sintering Behaviour and Properties of PM Ti Alloys Produced from Prealloyed Powder and Master Alloy. Powder Metall. 2011, 54, 543–550. [Google Scholar] [CrossRef]
- Leyens, C.; Peters, M.; Kaysser, W.A. Influence of Microstructure on Oxidation Behaviour of Near-α Titanium Alloys. Mater. Sci. Technol. 1996, 12, 213–218. [Google Scholar] [CrossRef]
- Otsuka, H.F.; Takahashi, H.K.; Mori, K. Development of Ti-Cu Alloy Sheets for Automobile Exhaust Systems. In Nippon Steel & Sumitomo Metal Technical Report no. 106; Nippon Steel: Tokyo, Japan, 2014; pp. 53–59. [Google Scholar]
- Zhu, K.Y.; Zhao, Y.Q.; Qu, H.L.; Wu, Z.L.; Zhao, X.M. Microstructure and Properties of Burn-resistant Ti-Al-Cu Alloys. J. Mater. Sci. 2000, 35, 5609–5612. [Google Scholar] [CrossRef]
- Kikuchi, M.; Takada, Y.; Kiyosue, S.; Yoda, M.; Woldu, M.; Cai, Z.; Okuno, O.; Okabe, T. Mechanical Properties and Microstructures of Cast Ti-Cu Alloys. Dent. Mater. 2003, 19, 174–181. [Google Scholar] [CrossRef]
- Zhang, E.; Ren, J.; Li, S.; Yang, L.; Qin, G. Optimization of Mechanical Properties, Biocorrosion Properties and Antibacterial Properties of As-cast Ti-Cu Alloys. Biomed. Mater. 2016, 11, 065001. [Google Scholar] [CrossRef]
- Yi, C.; Ke, Z.; Zhang, L.; Tan, J.; Jiang, Y.; He, Z. Antibacterial Ti-Cu Alloy with Enhanced Mechanical Properties as Implant Applications. Mater. Res. Exp. 2020, 7, 105404. [Google Scholar] [CrossRef]
- Zhang, E.; Li, S.; Ren, J.; Zhang, L.; Han, Y. Effect of Extrusion Processing on the Microstructure, Mechanical Properties, Biocorrosion Properties and Antibacterial Properties of Ti-Cu Sintered Alloys. Mater. Sci. Eng. C 2016, 69, 760–768. [Google Scholar] [CrossRef]
- Liu, J.; Li, F.; Liu, C.; Wang, H.; Ren, B.; Yang, K.; Zhang, E. Effect of Cu Content on the Antibacterial Activity of Titanium-Copper Sintered Alloys. Mater. Sci. Eng. C 2014, 35, 392–400. [Google Scholar] [CrossRef]
- Alshammari, Y.; Yang, F.; Bolzoni, L. Low-cost Powder Metallurgy Ti-Cu Alloys as a Potential Antibacterial Material. J. Mech. Behav. Biomed. Mater. 2019, 95, 232–239. [Google Scholar] [CrossRef]
- Alshammari, Y.; Jia, M.; Yang, F.; Bolzoni, L. The Effect of α+ β Forging on the Mechanical Properties and Microstructure of Binary Titanium Alloys Produced via a Cost-effective Powder Metallurgy Route. Mater. Sci. Eng. A 2020, 769, 138496. [Google Scholar] [CrossRef]
- Zhang, E.; Wang, X.; Chen, M.; Hou, B. Effect of the Existing Form of Cu Element on the Mechanical Properties, Bio-corrosion and Antibacterial Properties of Ti-Cu Alloys for Biomedical Application. Mater. Sci. Eng. C 2016, 69, 1210–1221. [Google Scholar] [CrossRef]
- Wang, J.; Zhang, S.; Sun, Z.; Wang, H.; Ren, L.; Yang, K. Optimization of Mechanical Property, Antibacterial Property and Corrosion Resistance of Ti-Cu Alloy for Dental Implant. J. Mater. Sci. Technol. 2019, 35, 2336–2344. [Google Scholar] [CrossRef]
- Chen, H.; Mi, G.B.; Li, P.J.; Cao, C.X. Influence Mechanism of Cu on High Temperature Oxidation Behavior of Titanium Alloys. Mater. Sci. For. 2019, 944, 110–119. [Google Scholar] [CrossRef]
- Murray, J.L. Phase Diagrams of Binary Titanium Alloys, 1st ed.; ASM International: Novelty, OH, USA, 1987. [Google Scholar]
- Holden, F.C.; Watts, A.A.; Ogden, H.R.; Jaffee, R.I. Heat Treatment and Mechanical Properties of Ti-Cu Alloys. JOM 1955, 7, 117–125. [Google Scholar] [CrossRef]
- Williams, J.C.; Taggart, R.; Polonis, D.H. An Electron Microscopy Study of Modes of Intermetallic Precipitation in Ti-Cu Alloys. Metall. Trans. 1971, 2, 1139–1148. [Google Scholar] [CrossRef]
- Vaché, N.; Cadoret, Y.; Dod, B.; Monceau, D. Modeling the Oxidation Kinetics of Titanium Alloys: Review, Method and Application to Ti-64 and Ti-6242s Alloys. Corros. Sci. 2021, 178, 109041. [Google Scholar] [CrossRef]
- Kofstad, P.; Anderson, P.B.; Krudtaa, O.J. Oxidation of Titanium in the Temperature Range 800–1200 °C. J. Less Common Met. 1961, 3, 89–97. [Google Scholar] [CrossRef]
- Kofstad, P.; Hauffe, K. Oxydation von Titan. Mater. Corros. 1956, 7, 642–649. [Google Scholar] [CrossRef]
- Nakajima, H.; Koiwa, M. Diffusion in Titanium. ISIJ Int. 1991, 31, 757–766. [Google Scholar] [CrossRef]
- Gardner, H.M.; Gopon, P.; Magazzeni, C.M.; Radecka, A.; Fox, K.; Rugg, D.; Wade, J.; Armstrong, D.E.J.; Moody, M.P.; Bagot, P.A.J. Quantifying the Effect of Oxygen on Micro-mechanical Properties of a Near-alpha Titanium Alloy. J. Mater. Res. 2021, 36, 2529–2544. [Google Scholar] [CrossRef]
- Mi, G.; Yao, K.; Bai, P.; Cheng, C.; Min, X. High Temperature Oxidation and Wear Behaviors of Ti-V-Cr Fireproof Titanium Alloy. Metals 2017, 7, 226. [Google Scholar] [CrossRef]
- Pang, Y.; Xu, G.; Feng, Q.; Lv, J.; Qin, Y.; Zhang, Y.; Zheng, Z.; Wu, Y. Crystalline Orientation Preference for TiO2 Nanotube Arrays with Efficient Photoelectrochemical Properties. Phys. Lett. A 2018, 382, 2759–2762. [Google Scholar] [CrossRef]
- Stefanov, B.I.; Niklasson, G.A.; Granqvist, C.G.; Österlund, L. Quantitative Relation between Photocatalytic Activity and Degree of <001> Orientation for Anatase TiO2 Thin Films. J. Mater. Chem. A 2015, 3, 17369–17375. [Google Scholar]
- Hanaor, D.A.H.; Sorrell, C.C. Review of the Anatase to Rutile Phase Transformation. J. Mater. Sci. 2011, 46, 855–874. [Google Scholar] [CrossRef]
- Penn, R.L.; Banfield, J.F. Formation of Rutile Nuclei at Anatase {112} Twin Interfaces and the Phase Transformation Mechanism in Nanocrystalline Titania. Am. Miner. 1999, 84, 871–876. [Google Scholar] [CrossRef]
- Gouma, P.I.; Mills, M.J. Anatase-to-Rutile Transformation in Titania Powders. J. Am. Cer. Soc. 2001, 84, 619–622. [Google Scholar] [CrossRef]
- Shao, Y.; Tang, D.; Sun, J.; Lee, Y.; Xiong, W. Lattice Deformation and Phase Transformation from Nano-scale Anatase to Nano-scale Rutile TiO2 Prepared by a Sol-gel Technique. China Particuol. 2004, 2, 119–123. [Google Scholar] [CrossRef]
- Song, M.; Lu, Z.; Li, D. Phase transformations among TiO2 polymorphs. Nanoscale 2020, 12, 23183–23190. [Google Scholar] [CrossRef]

Disclaimer/Publisher’s Note: The statements, opinions and data contained in all publications are solely those of the individual author(s) and contributor(s) and not of MDPI and/or the editor(s). MDPI and/or the editor(s) disclaim responsibility for any injury to people or property resulting from any ideas, methods, instructions or products referred to in the content. |
© 2025 by the authors. Licensee MDPI, Basel, Switzerland. This article is an open access article distributed under the terms and conditions of the Creative Commons Attribution (CC BY) license (https://creativecommons.org/licenses/by/4.0/).