
Data and Knowledge Dual-Driven Creep Life Prediction for Austenitic Heat-Resistance Steel

Abstract
1. Introduction
2. Methods
2.1. Creep Dataset and Machine Learning Algorithms
2.2. Physical Metallurgy Information Calculation
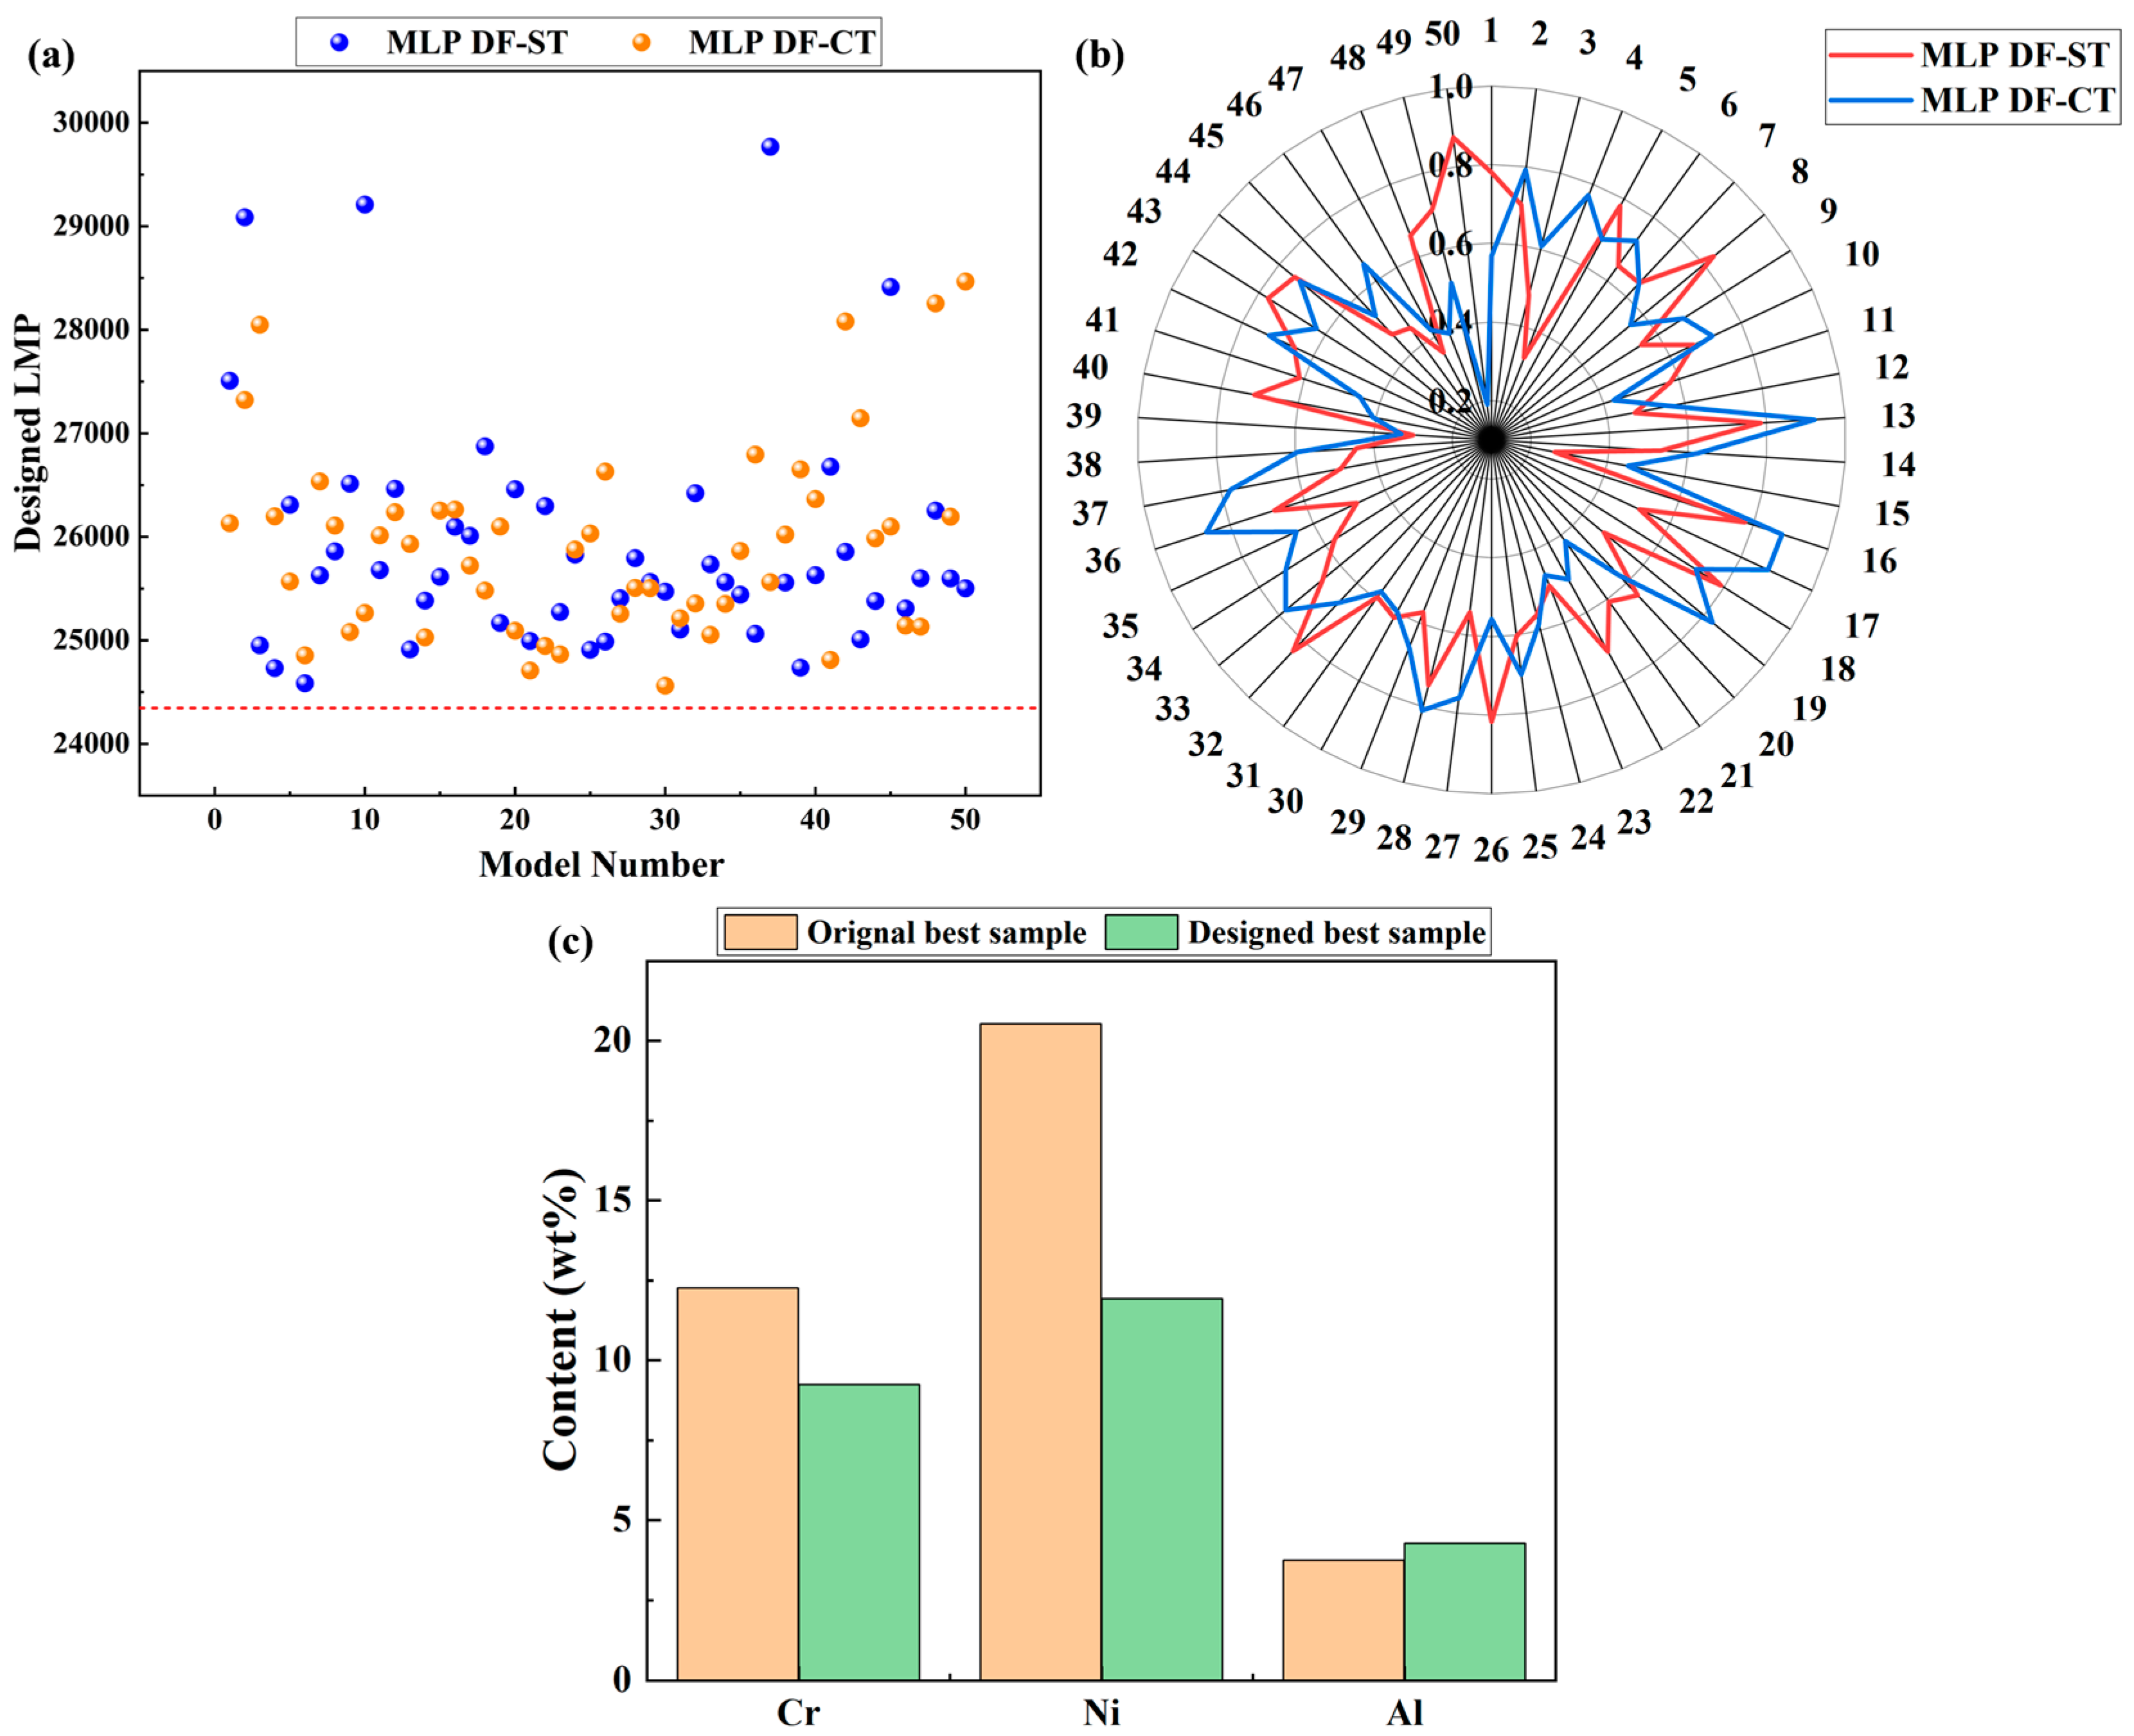
2.3. Alloy Design Results
3. Results and Discussion
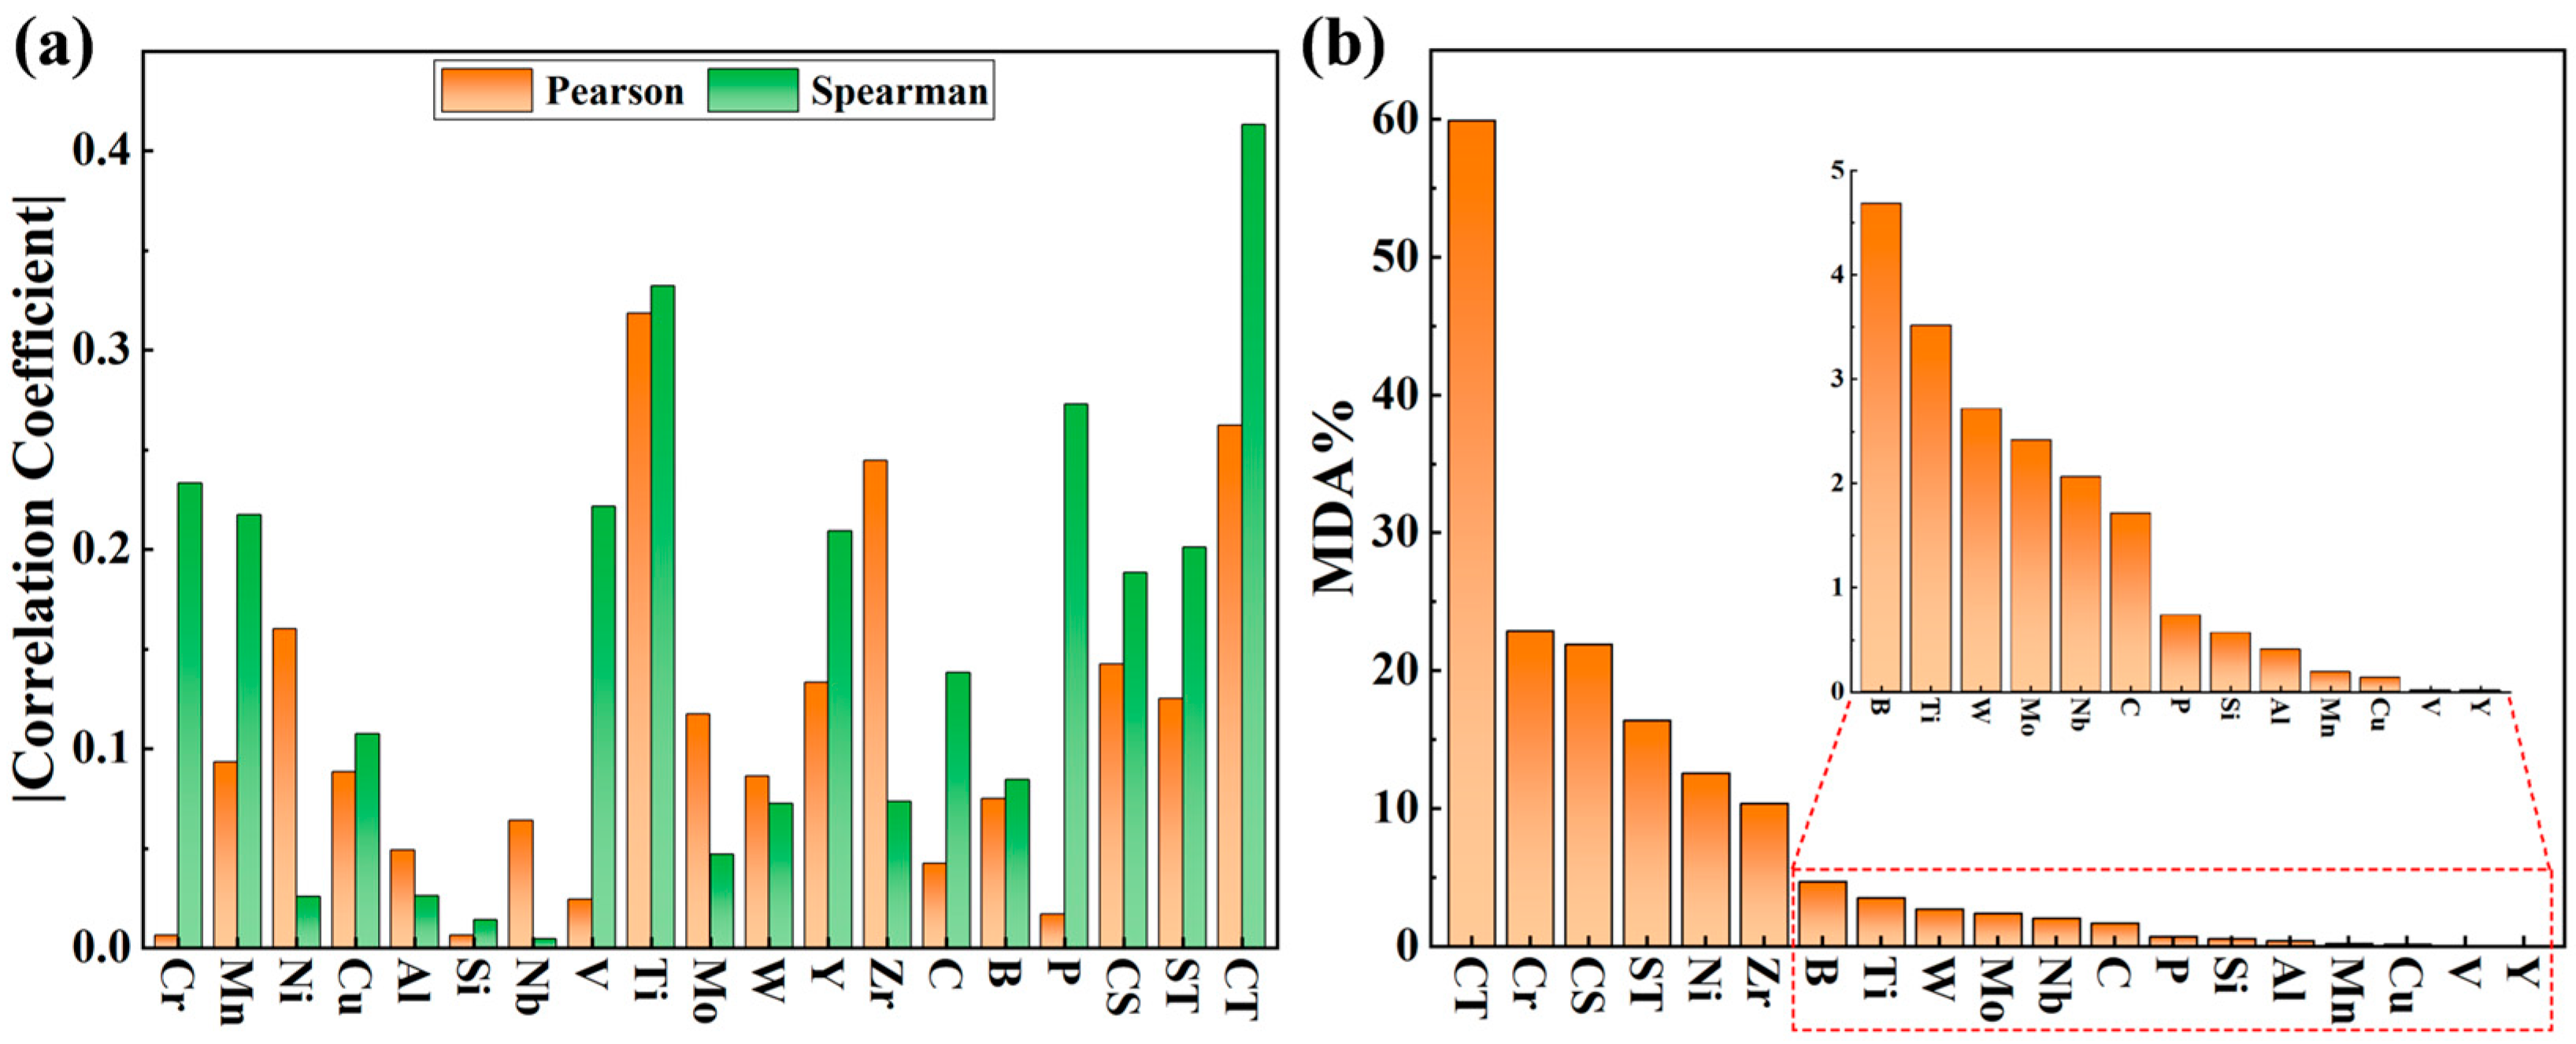
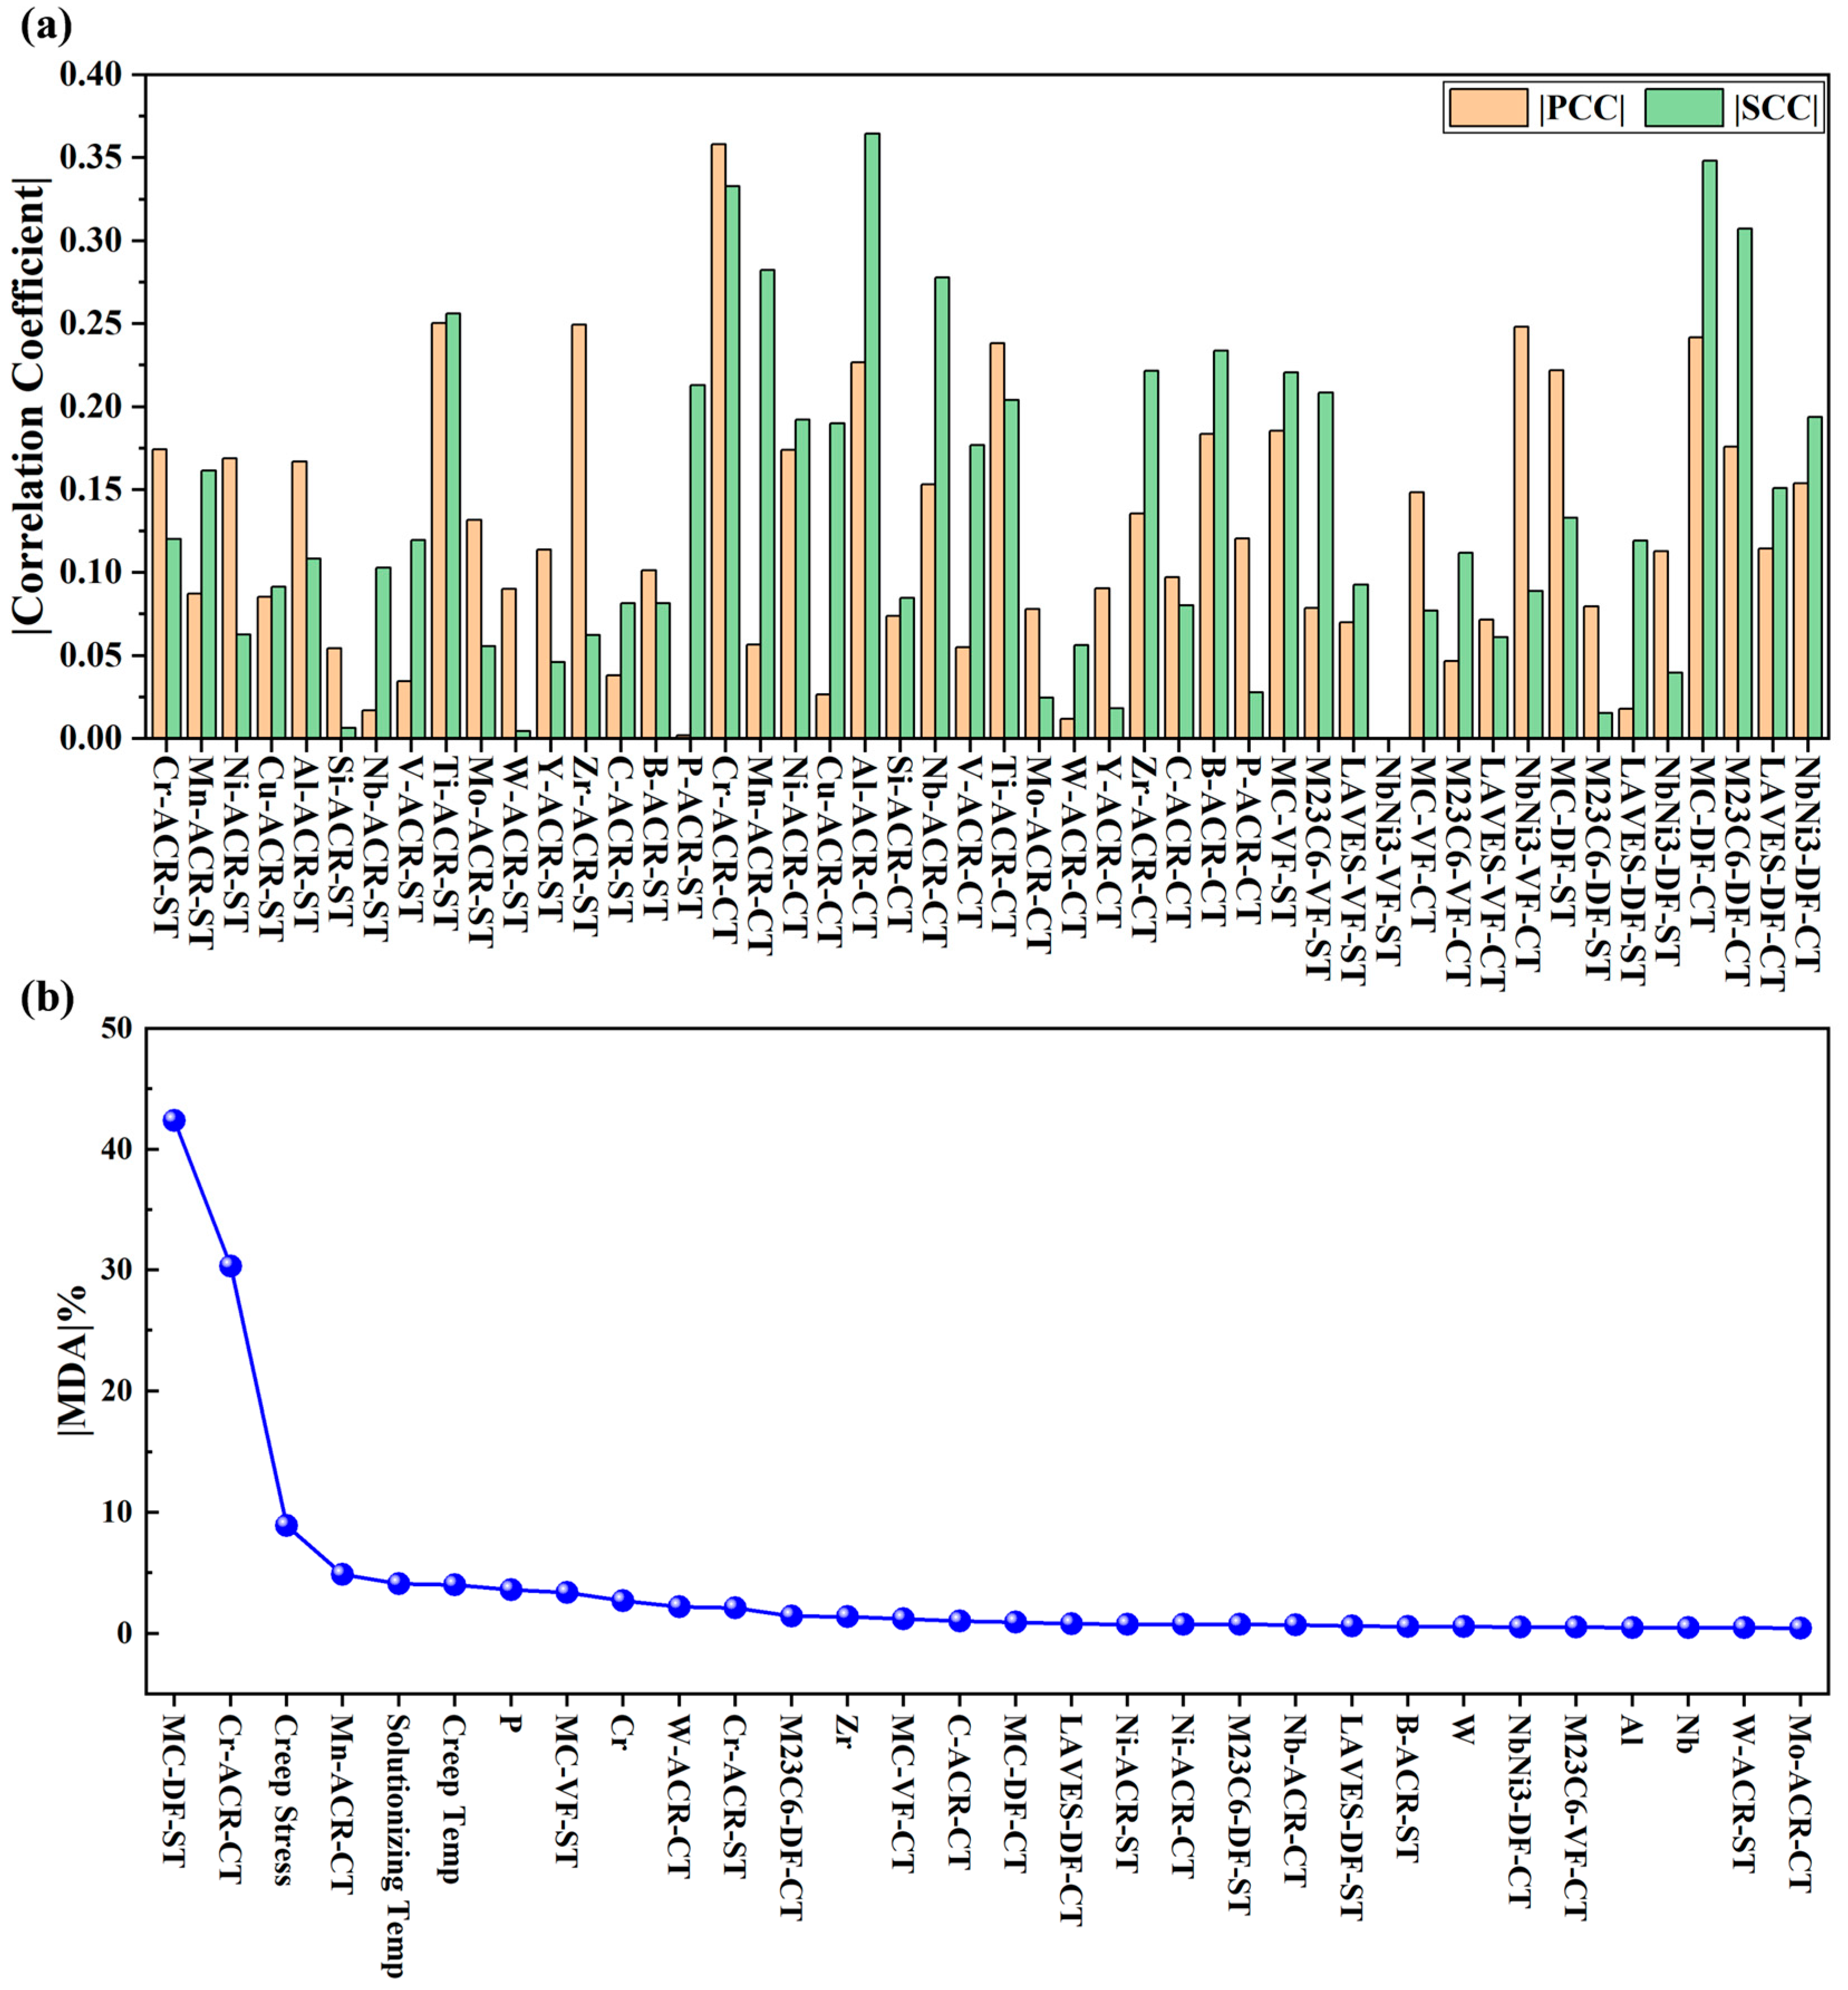
3.1. Feature Analysis Results
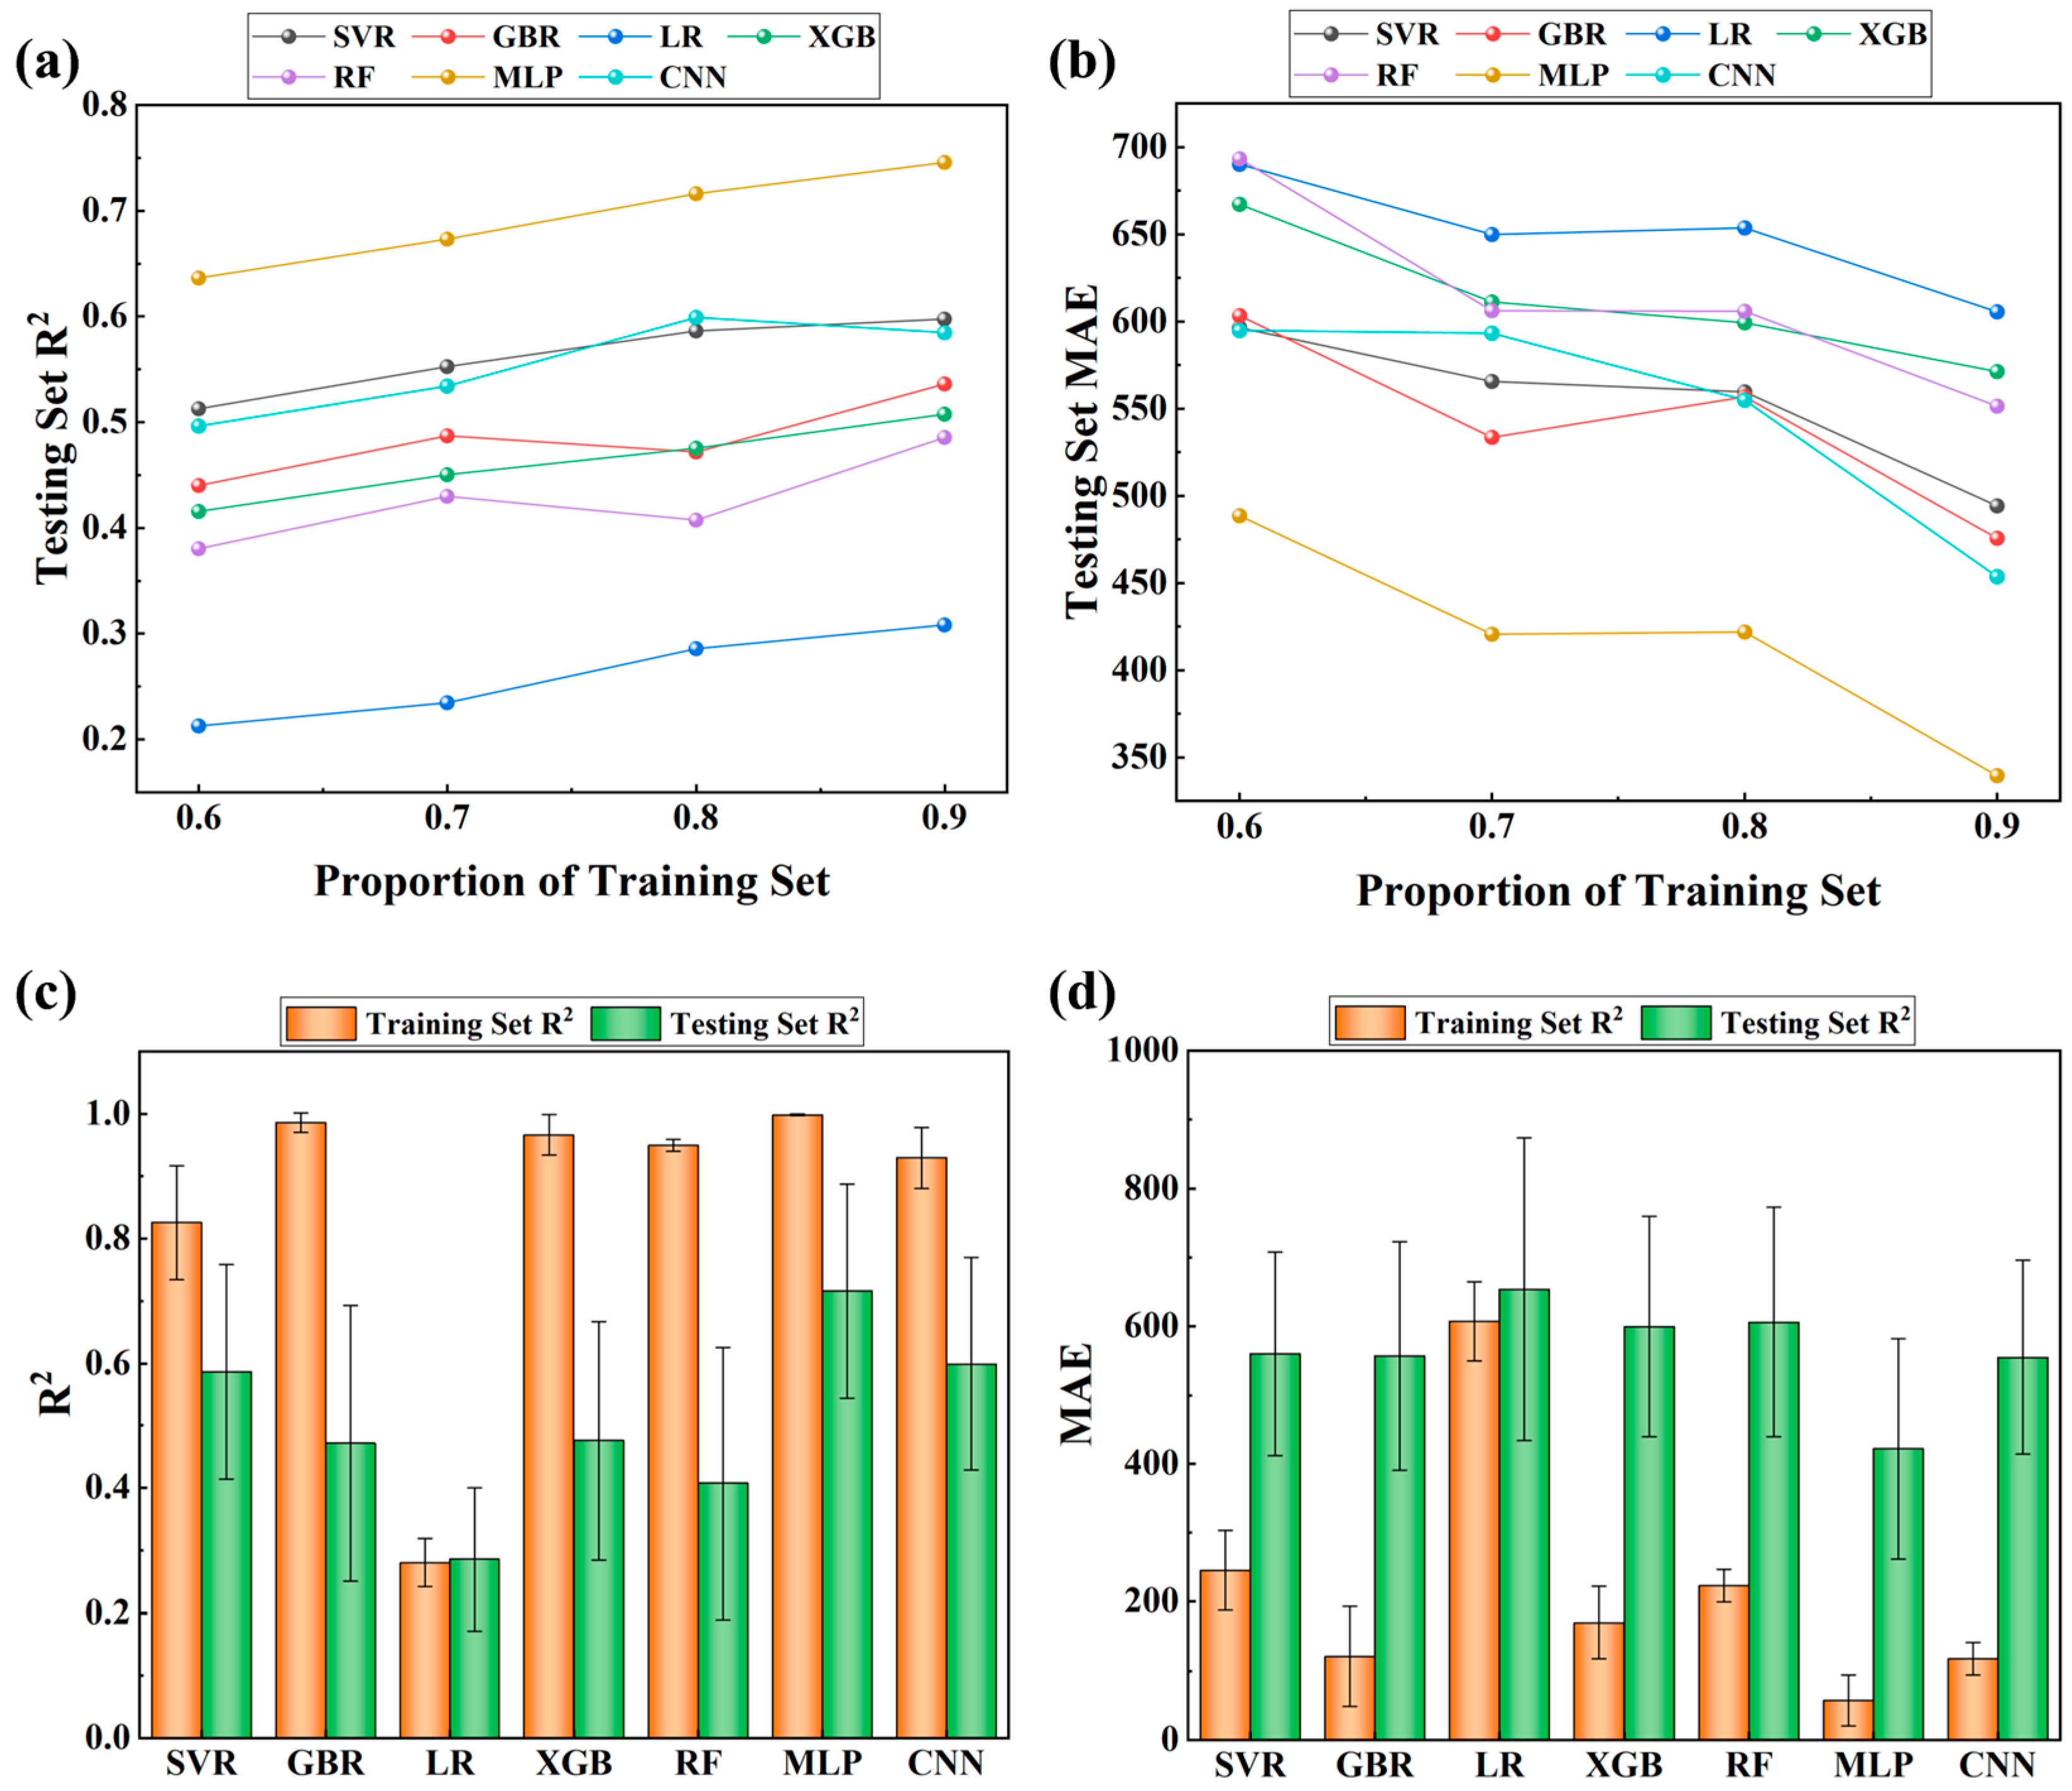
3.2. Creep Life Prediction Results
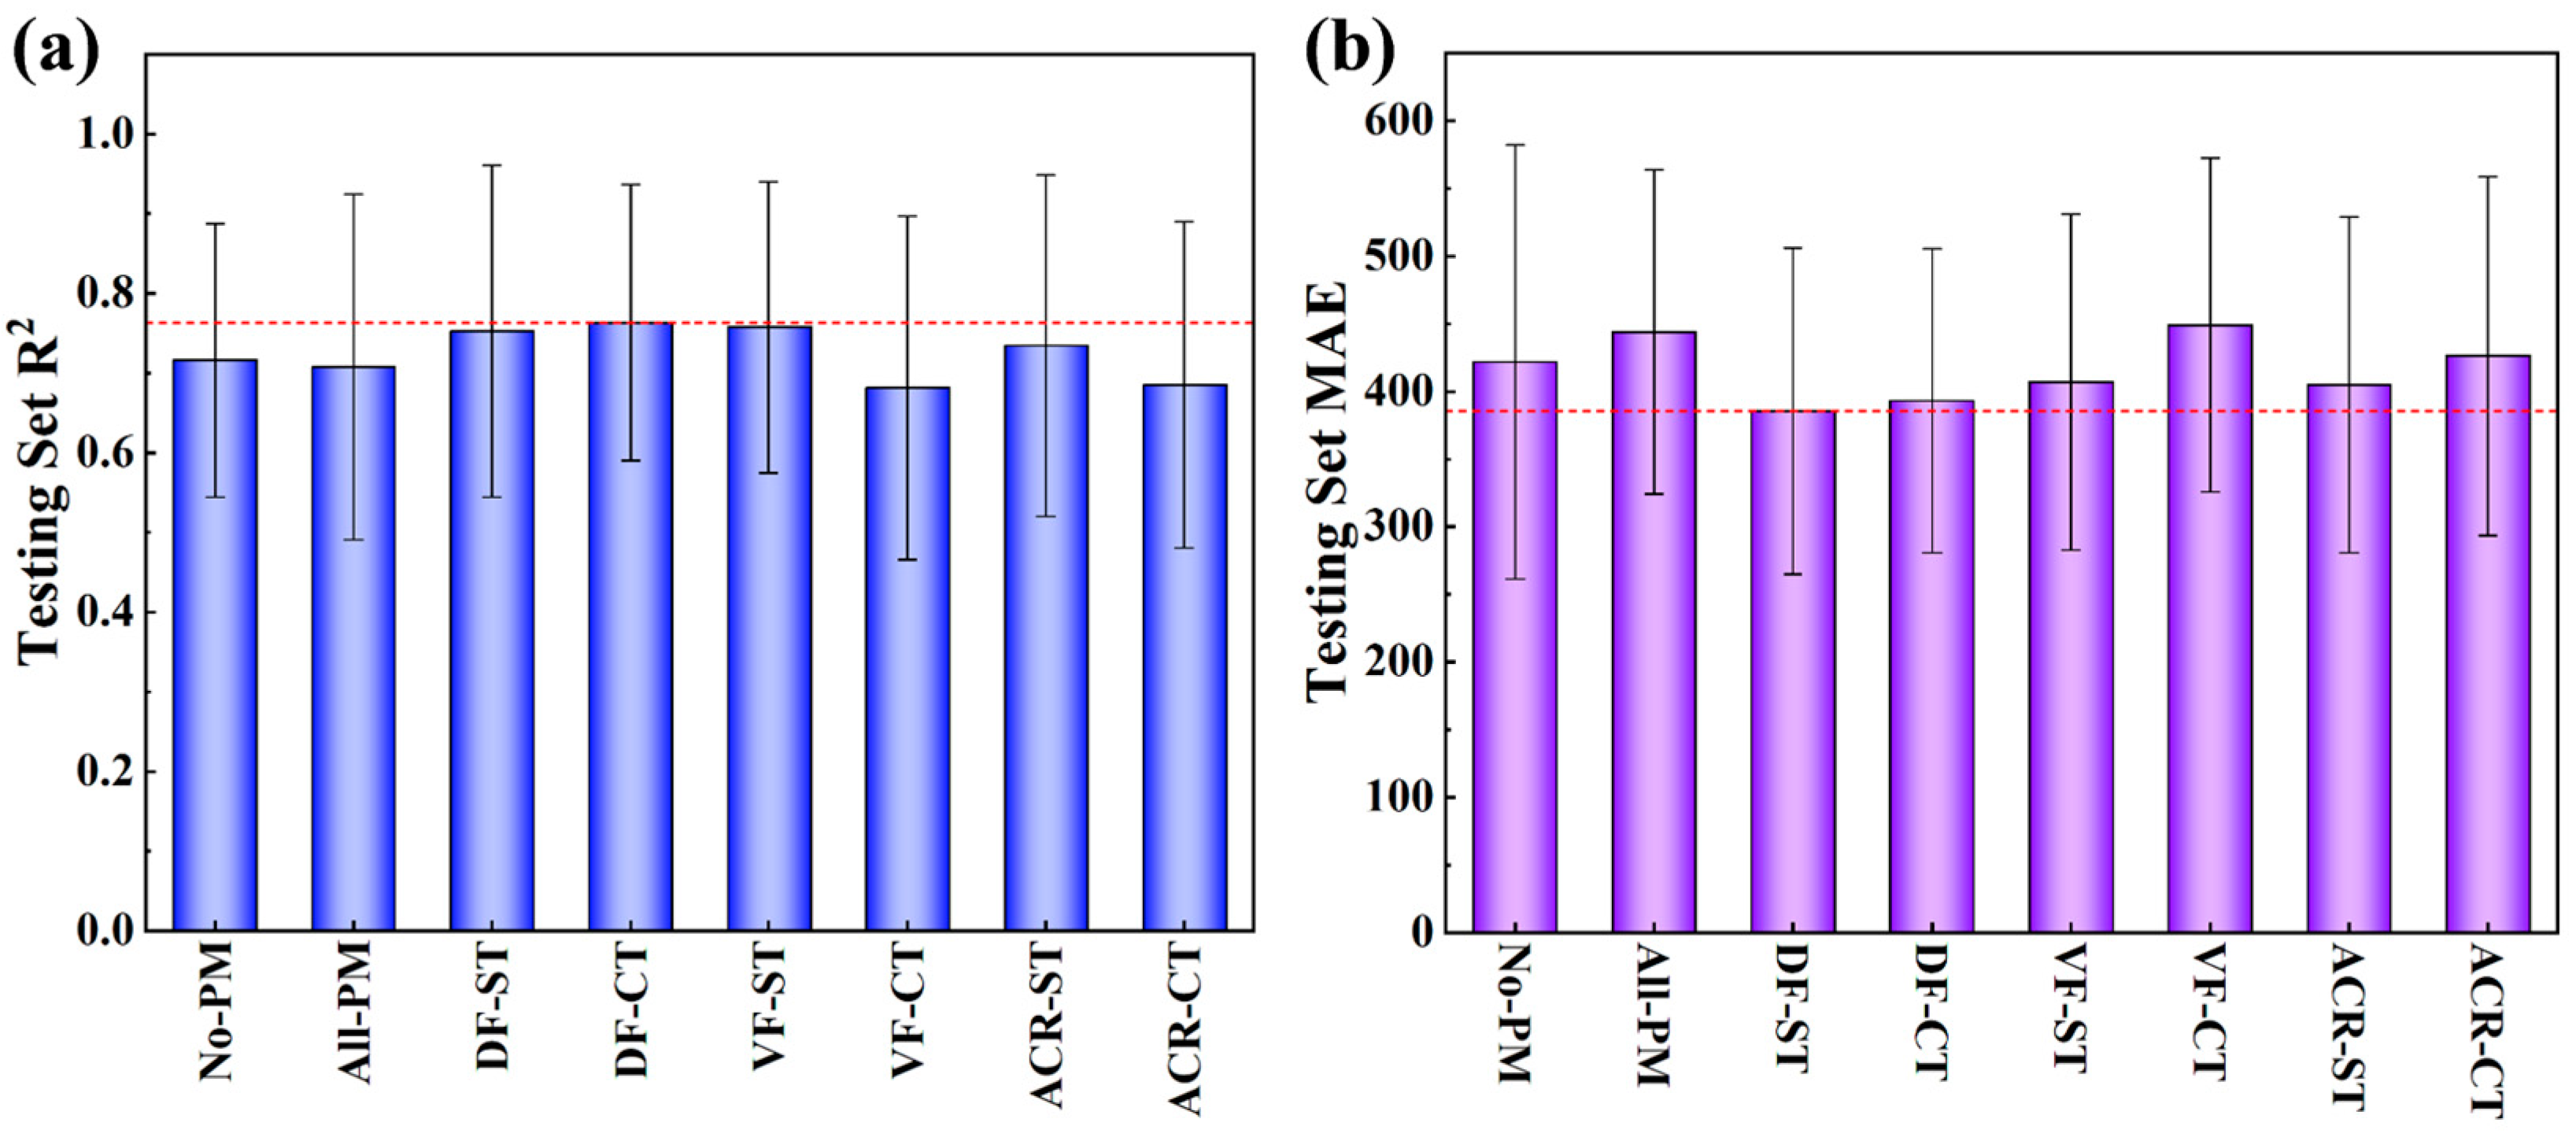
3.3. Alloy Optimization Results
4. Conclusions
Supplementary Materials
Author Contributions
Funding
Data Availability Statement
Conflicts of Interest
References
- Jianmin, J.; Montgomery, M.; Larsen, O.H.; Jensen, S.A. Investigation on steam oxidation behaviour of TP347H FG Part 1: Exposure at 256 bar. Mater. Corros. 2005, 56, 459–467. [Google Scholar] [CrossRef]
- Fu, J.; Zhou, Q.; Li, N.; Liu, Z.; Liu, T. Effects of external stresses on hot corrosion behavior of stainless steel TP347HFG. Corros. Sci. 2016, 104, 103–111. [Google Scholar] [CrossRef]
- Torić, N.; Harapin, A.; Boko, I. Modelling of Steel Creep at High Temperatures Using an Implicit Creep Model. Key Eng. Mater. 2013, 553, 13–22. [Google Scholar] [CrossRef]
- Tehami, M.; Ramdane, K.-E. Creep behaviour modelling of a composite steel–concrete section. J. Constr. Steel Res. 2009, 65, 1029–1033. [Google Scholar] [CrossRef]
- Srinivasan, V.S.; Vanaja, J.; Choudhary, B.K.; Laha, K. Modeling of Creep Deformation Behaviour of RAFM Steel. Trans. Indian Inst. Met. 2016, 69, 567–571. [Google Scholar] [CrossRef]
- Meng, Q.; Wang, Z. Creep damage models and their applications for crack growth analysis in pipes: A review. Eng. Fract. Mech. 2019, 205, 547–576. [Google Scholar] [CrossRef]
- Mackerle, J. Creep and creep fracture/damage finite element modelling of engineering materials and structures: An addendum. Int. J. Press. Vessels Pip. 2004, 81, 381–392. [Google Scholar] [CrossRef]
- Lee, J.S.; Armaki, H.G.; Maruyama, K.; Muraki, T.; Asahi, H. Causes of breakdown of creep strength in 9Cr–1.8W–0.5Mo–VNb steel. Mater. Sci. Eng. A 2006, 428, 270–275. [Google Scholar] [CrossRef]
- Holmström, S.; Auerkari, P. A robust model for creep-fatigue life assessment. Mater. Sci. Eng. A 2013, 559, 333–335. [Google Scholar] [CrossRef]
- Goswami, T. Development of generic creep–fatigue life prediction models. Mater. Des. 2004, 25, 277–288. [Google Scholar] [CrossRef]
- Evans, M. A new statistical framework for the determination of safe creep life using the theta projection technique. J. Mater. Sci. 2011, 47, 2770–2781. [Google Scholar] [CrossRef]
- Basoalto, H.; Sondhi, S.; Dyson, B.; McLean, M.J.S. A generic microstructure-explicit model of creep in nickel-base superalloys. Superalloys 2004, 1, 897–906. [Google Scholar]
- Wei, X.; van der Zwaag, S.; Jia, Z.; Wang, C.; Xu, W. On the use of transfer modeling to design new steels with excellent rotating bending fatigue resistance even in the case of very small calibration datasets. Acta Mater. 2022, 235, 118103. [Google Scholar] [CrossRef]
- Wang, C.; Wei, X.; Ren, D.; Wang, X.; Xu, W. High-throughput map design of creep life in low-alloy steels by integrating machine learning with a genetic algorithm. Mater. Des. 2022, 213, 110326. [Google Scholar] [CrossRef]
- Shen, C.; Wang, C.; Wei, X.; Li, Y.; van der Zwaag, S.; Xu, W. Physical metallurgy-guided machine learning and artificial intelligent design of ultrahigh-strength stainless steel. Acta Mater. 2019, 179, 201–214. [Google Scholar] [CrossRef]
- Liu, Y.; Zhao, T.; Ju, W.; Shi, S. Materials discovery and design using machine learning. J. Mater. 2017, 3, 159–177. [Google Scholar] [CrossRef]
- Zhu, L.; Luo, Q.; Chen, Q.; Zhang, Y.; Zhang, L.; Hu, B.; Han, Y.; Li, Q. Prediction of ultimate tensile strength of Al-Si alloys based on multimodal fusion learning. Mater. Genom. Eng. Adv. 2024, 2, e26. [Google Scholar] [CrossRef]
- Ong, S.P. Accelerating materials science with high-throughput computations and machine learning. Comput. Mater. Sci. 2019, 161, 143–150. [Google Scholar] [CrossRef]
- Morgan, D.; Jacobs, R. Opportunities and Challenges for Machine Learning in Materials Science. Annu. Rev. Mater. Res. 2020, 50, 71–103. [Google Scholar] [CrossRef]
- Geng, X.; Wang, F.; Wu, H.H.; Wang, S.; Wu, G.; Gao, J.; Zhao, H.; Zhang, C.; Mao, X. Data-driven and artificial intelligence accelerated steel material research and intelligent manufacturing technology. Mater. Genom. Eng. Adv. 2023, 1, e10. [Google Scholar] [CrossRef]
- Fang, J.; Xie, M.; He, X.; Zhang, J.; Hu, J.; Chen, Y.; Yang, Y.; Jin, Q. Machine learning accelerates the materials discovery. Mater. Today Commun. 2022, 33, 104900. [Google Scholar] [CrossRef]
- Chai, M.; He, Y.; Li, Y.; Song, Y.; Zhang, Z.; Duan, Q. Machine Learning-Based Framework for Predicting Creep Rupture Life of Modified 9Cr-1Mo Steel. Appl. Sci. 2023, 13, 4972. [Google Scholar] [CrossRef]
- Dong, Y.; Liu, J.; Liu, Y.; Li, H.; Zhang, X.; Hu, X. Creep-Fatigue Experiment and Life Prediction Study of Piston 2A80 Aluminum Alloy. Materials 2021, 14, 1403. [Google Scholar] [CrossRef]
- Gao, S.; Yue, X.; Wang, H. Predictability of Different Machine Learning Approaches on the Fatigue Life of Additive-Manufactured Porous Titanium Structure. Metals 2024, 14, 320. [Google Scholar] [CrossRef]
- Wu, H.; Wang, A.; Gan, Z.; Gan, L. Graphical Feature Construction-Based Deep Learning Model for Fatigue Life Prediction of AM Alloys. Materials 2024, 18, 11. [Google Scholar] [CrossRef]
- Mambuscay, C.L.; Ortega-Portilla, C.; Piamba, J.F.; Forero, M.G. Predictive Modeling of Vickers Hardness Using Machine Learning Techniques on D2 Steel with Various Treatments. Materials 2024, 17, 2235. [Google Scholar] [CrossRef]
- Zhou, X.; Xu, J.; Meng, L.; Wang, W.; Zhang, N.; Jiang, L. Machine-Learning-Assisted Composition Design for High-Yield-Strength TWIP Steel. Metals 2024, 14, 952. [Google Scholar] [CrossRef]
- Zhao, Y.; Xiao, H.; Chen, L.; Chen, P.; Lu, Z.; Tang, C.; Yao, H. Application of the non-linear three-component model for simulating accelerated creep behavior of polymer-alloy geocell sheets. Geotext. Geomembr. 2025, 53, 70–80. [Google Scholar] [CrossRef]
- Zhang, X.; Gong, J.; Xuan, F. A deep learning based life prediction method for components under creep, fatigue and creep-fatigue conditions. Int. J. Fatigue 2021, 148, 106236. [Google Scholar] [CrossRef]
- Shin, D.; Yamamoto, Y.; Brady, M.P.; Lee, S.; Haynes, J.A. Modern data analytics approach to predict creep of high-temperature alloys. Acta Mater. 2019, 168, 321–330. [Google Scholar] [CrossRef]
- Peng, J.; Yamamoto, Y.; Brady, M.P.; Lee, S.; Haynes, J.A.; Shin, D. Uncertainty Quantification of Machine Learning Predicted Creep Property of Alumina-Forming Austenitic Alloys. JOM 2020, 73, 164–173. [Google Scholar] [CrossRef]
- Wang, J.; Fa, Y.; Tian, Y.; Yu, X. A machine-learning approach to predict creep properties of Cr–Mo steel with time-temperature parameters. J. Mater. Res. Technol. 2021, 13, 635–650. [Google Scholar] [CrossRef]


| Min | Max | Mean | Std. | |
|---|---|---|---|---|
| Cr/wt% | 9.236 | 19 | 14.463 | 1.634 |
| Mn/wt% | 0 | 9.96 | 2.014 | 1.952 |
| Ni/wt% | 11.92 | 35.07 | 23.202 | 5.903 |
| Cu/wt% | 0 | 3.1 | 0.854 | 1.057 |
| Al/wt% | 0 | 5.02 | 3.171 | 0.751 |
| Si/wt% | 0 | 0.98 | 0.149 | 0.128 |
| Nb/wt% | 0 | 5.014 | 1.681 | 1.056 |
| V/wt% | 0 | 0.26 | 0.035 | 0.036 |
| Ti/wt% | 0 | 2.88 | 0.186 | 0.509 |
| Mo/wt% | 0 | 3.106 | 1.211 | 0.97 |
| W/wt% | 0 | 4.04 | 0.648 | 0.933 |
| Y/wt% | 0 | 0.044 | 0.003 | 0.007 |
| Zr/wt% | 0 | 0.32 | 0.037 | 0.092 |
| C/wt% | 0.0001 | 0.452 | 0.115 | 0.073 |
| B/wt% | 0 | 0.08 | 0.009 | 0.009 |
| P/wt% | 0 | 0.039 | 0.012 | 0.01 |
| Creep Stress/MPa | 30 | 300 | 144.491 | 63.909 |
| Solutionizing Temp/°C | 1093 | 1250 | 1186.898 | 43.252 |
| Creep Temp/°C | 600 | 850 | 727.894 | 48.588 |
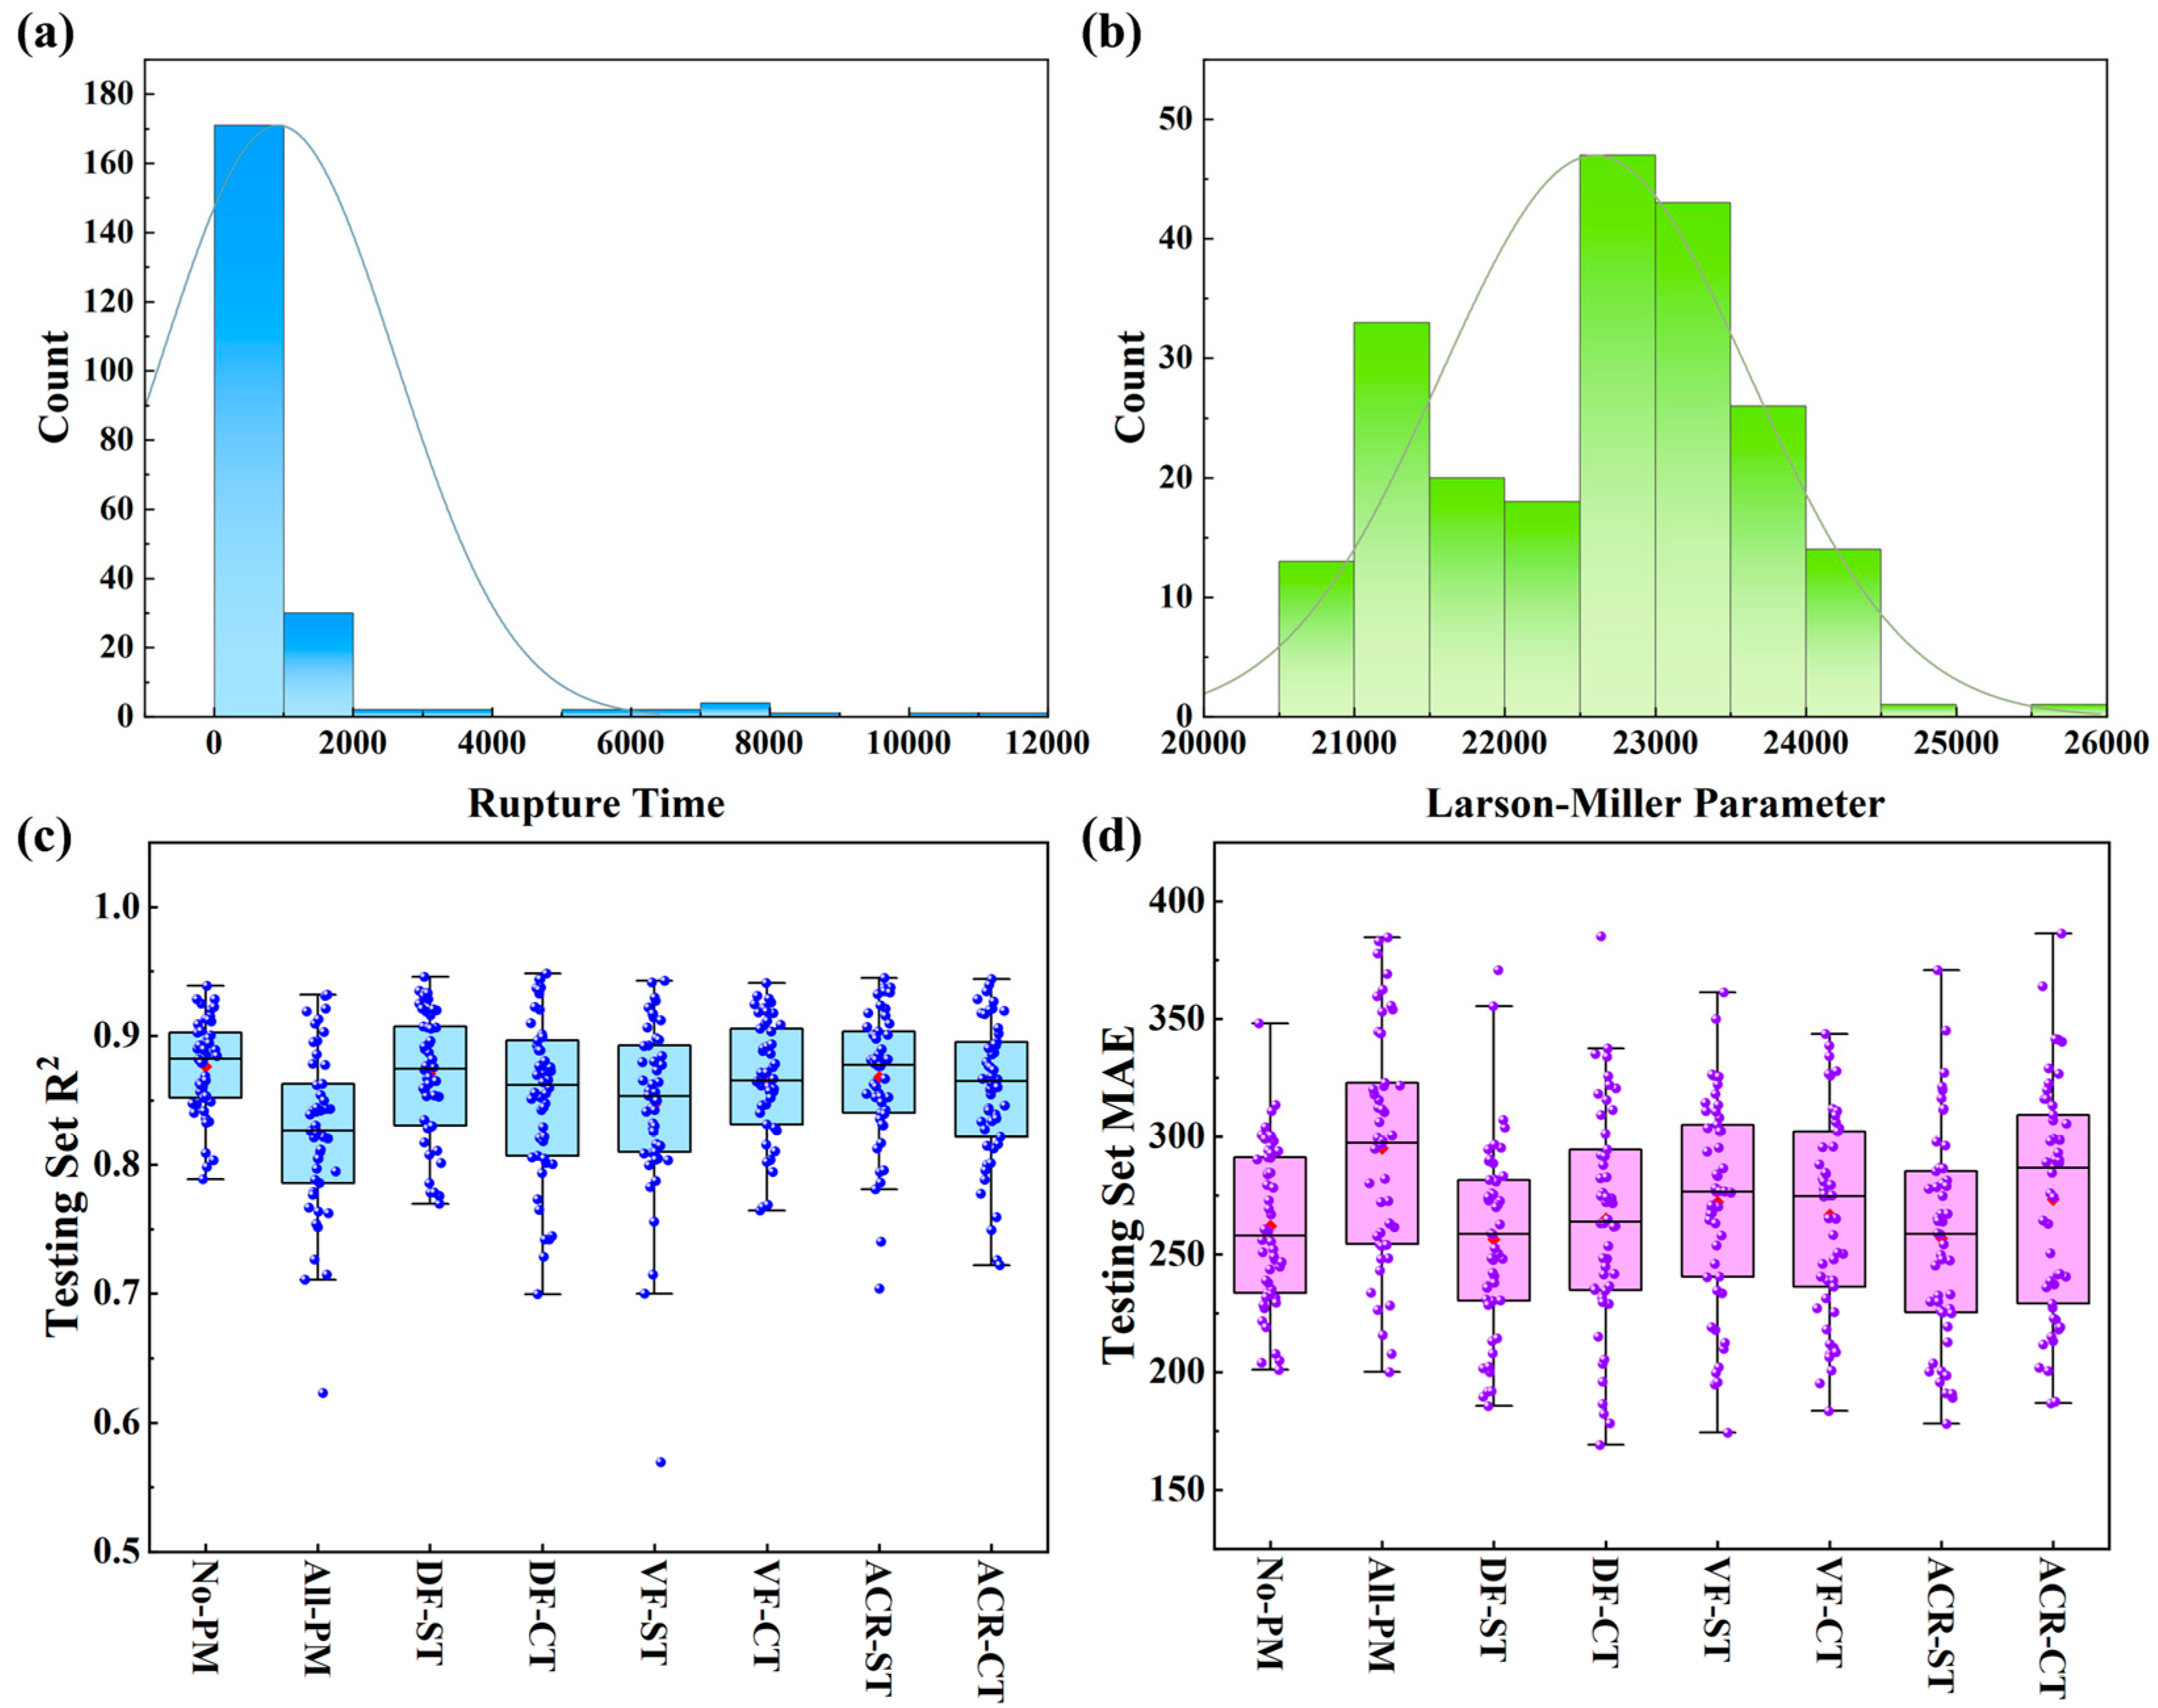
| Creep Life/h | 5.77 | 11,452 | 920.068 | 1685.208 |
| Description | Abbreviations |
|---|---|
| The activity of elements in the alloy system at solutionizing temperature | Cr-ACR-ST, Mn-ACR-ST, Ni-ACR-ST, Cu-ACR-ST, Al-ACR-ST, Si-ACR-ST, Nb-ACR-ST, V-ACR-ST, Ti-ACR-ST, Mo-ACR-ST, W-ACR-ST, Y-ACR-ST, Zr-ACR-ST, C-ACR-ST, B-ACR-ST, P-ACR-ST |
| The activity of elements in the alloy system at creep temperature | Cr-ACR-CT, Mn-ACR-CT, Ni-ACR-CT, Cu-ACR-CT, Al-ACR-CT, Si-ACR-CT, Nb-ACR-CT, V-ACR-CT, Ti-ACR-CT, Mo-ACR-CTW-ACR-CT, Y-ACR-CT, Zr-ACR-CT, C-ACR-CT, B-ACR-CT, P-ACR-CT |
| The equilibrium volume frac-tion of the precipitated phase at solutionizing temperature | MC-VF-ST, M23C6-VF-ST, Laves-VF-ST, NbNi3-VF-ST |
| The equilibrium volume fraction of the precipitated phase at creep temperature | MC-VF-CT, M23C6-VF-CT, Laves-VF-CT, NbNi3-VF-CT |
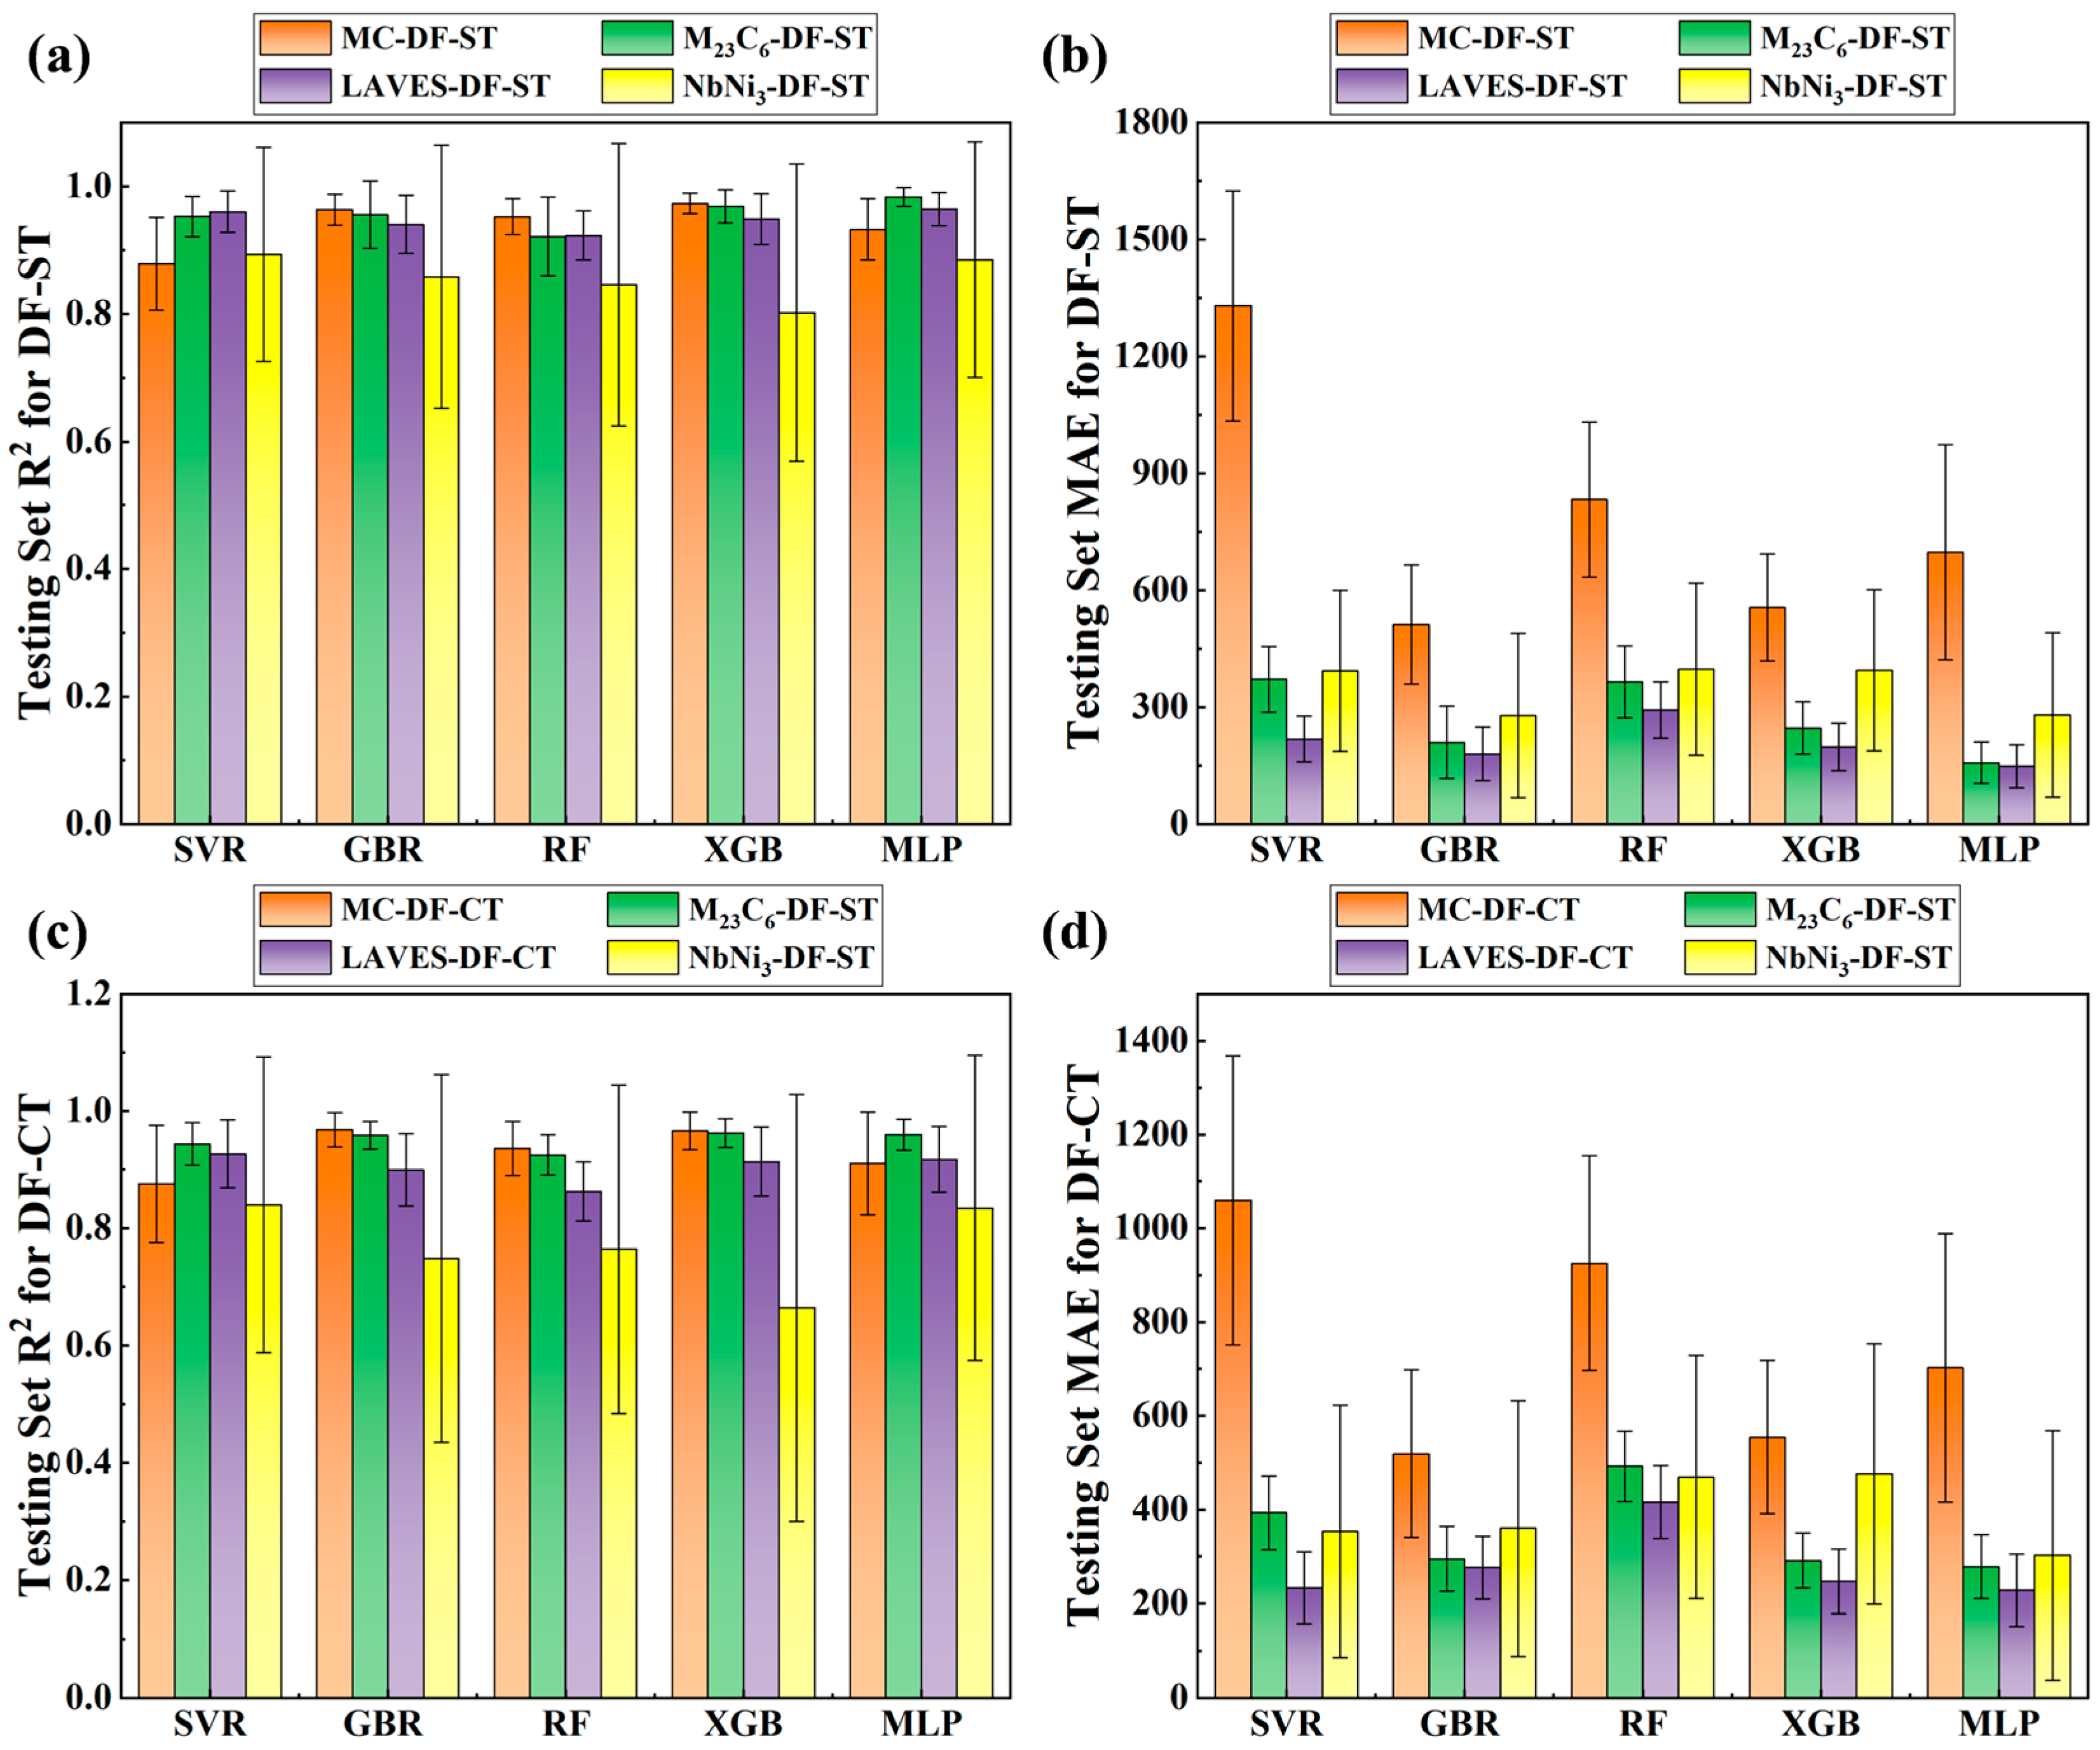
| The precipitation driving force of the precipitated phase at solutionizing temperature | MC-DF-ST, M23C6-DF-ST, Laves-DF-ST, NbNi3-DF-ST |
| The precipitation driving force of the precipitated phase at solutionizing temperature | MC-DF-CT, M23C6-DF-CT, Laves-DF-CT, NbNi3-DF-CT |
| Mean R2 on Testing SET | Mean MAE on Testing Set | |||
|---|---|---|---|---|
| Larson–Miller Parameter of Creep Life | Creep Life | Larson–Miller Parameter of Creep Life | Creep Life | |
| No-PM | 0.87621 | 0.71626 | 261.94575 | 421.7419 |
| All-PM | 0.82522 | 0.70756 | 295.15915 | 443.88607 |
| DF-ST | 0.87038 | 0.75262 | 256.38085 | 385.36843 |
| DF-CT | 0.8532 | 0.76333 | 265.00241 | 393.08826 |
| VF-ST | 0.84683 | 0.75743 | 272.17425 | 407.02921 |
| VF-CT | 0.86487 | 0.68146 | 266.81553 | 448.90497 |
| ACR-ST | 0.86778 | 0.73474 | 256.91625 | 404.9212 |
| ACR-CT | 0.85705 | 0.68496 | 273.37632 | 426.25956 |
Disclaimer/Publisher’s Note: The statements, opinions and data contained in all publications are solely those of the individual author(s) and contributor(s) and not of MDPI and/or the editor(s). MDPI and/or the editor(s) disclaim responsibility for any injury to people or property resulting from any ideas, methods, instructions or products referred to in the content. |
© 2025 by the authors. Licensee MDPI, Basel, Switzerland. This article is an open access article distributed under the terms and conditions of the Creative Commons Attribution (CC BY) license (https://creativecommons.org/licenses/by/4.0/).
Share and Cite
Xie, X.; Liu, M.; Yang, P.; Yang, Z.; Pan, C.; Wang, C.; Wei, X. Data and Knowledge Dual-Driven Creep Life Prediction for Austenitic Heat-Resistance Steel. Metals 2025, 15, 120. https://doi.org/10.3390/met15020120
Xie X, Liu M, Yang P, Yang Z, Pan C, Wang C, Wei X. Data and Knowledge Dual-Driven Creep Life Prediction for Austenitic Heat-Resistance Steel. Metals. 2025; 15(2):120. https://doi.org/10.3390/met15020120
Chicago/Turabian StyleXie, Xiaochang, Mutong Liu, Ping Yang, Zenan Yang, Chengbo Pan, Chenchong Wang, and Xiaolu Wei. 2025. "Data and Knowledge Dual-Driven Creep Life Prediction for Austenitic Heat-Resistance Steel" Metals 15, no. 2: 120. https://doi.org/10.3390/met15020120
APA StyleXie, X., Liu, M., Yang, P., Yang, Z., Pan, C., Wang, C., & Wei, X. (2025). Data and Knowledge Dual-Driven Creep Life Prediction for Austenitic Heat-Resistance Steel. Metals, 15(2), 120. https://doi.org/10.3390/met15020120