Abstract
Wire Arc Additive Manufacturing (WAAM) is a process for fabricating metal parts known for its high productivity and material flexibility. However, defects such as overheating, residual stresses, distortions, porosity, and a non-homogeneous microstructure limit its commercial applications. Therefore, the present study aims to analyze the correlation between electrical sensing anomalies in the Gas Metal Arc (GMA) during WAAM and the occurrence of microscopic defects caused by external contamination. To achieve this, experiments were conducted to fabricate walls using WAAM with controlled contaminant introduction. Simultaneously, electrical arc data, specifically voltage and current, were segmented and acquired during the wall deposition process. Metallographic analysis confirmed the presence of microscopic defects or changes in the solidification patterns in regions with contaminant inclusion, distinguishing them from other areas of the analyzed samples. Similarly, the contaminations were proven to cause anomalies in attributes associated with the electrical arc. Therefore, this approach confirms the criticality of electrical arc monitoring in WAAM, as it demonstrates that anomalies in the electrical arc could lead to microstructural consequences.
1. Introduction
In recent years, the industry has presented itself in an innovative way, encompassing a broad system of advanced technologies that drive progress in production methods and business models on a global scale [1,2]. As a result, there has been significant development in the field of Additive Manufacturing (AM), as the use of this technology is linked to the reduction of production steps, as well as contributing to shorter product delivery times, thus adding value to distribution, storage, and production processes [3,4,5].
The AM process is defined as a material joining process for manufacturing components by depositing layer by layer from a 3D model, differing from conventional subtractive manufacturing (machining) [6,7]. Additionally, this process can be applied to various materials, such as polymers, ceramics, composites, and even metals [6,7]. In Metal Additive Manufacturing (MAM) processes, material deposition can be performed by melting a metal wire onto a substrate [8], using energy sources like a laser, electron beam, or even an electric arc, as well as by the fusion/sintering of metals in powder form [9,10,11].
Laser and electron-beam-based additive manufacturing processes are common, but their high cost and low efficiency greatly limit their application in the production of large metallic components [12]. On the other hand, Wire Arc Additive Manufacturing (WAAM) utilizes the heat generated by an electric arc, which melts the metal material (wire) that is continuously deposited, overcoming the described obstacles [13]. Regarding its terminology, according to ISO/ASTM 52900:2021 [14], the WAAM process is classified as a direct energy deposition of metals with an electric arc (DED-Arc) process. The electric arc used in WAAM can be a Gas Metal Arc (GMA), Gas Tungsten Arc (GTA), or plasma arc (PA) [15]. Arc-based techniques, such as GMA and GTA, offer energy efficiencies of up to 90% [16] and allow nearly all of the wire material to be used in the component. These methods are more affordable and suitable for wire-fed additive manufacturing processes compared to laser and electron beam techniques [17].
However, one of the major limitations associated with WAAM is the defects resulting from improper process parameter settings, environmental disturbances, and process instability [18]. These can lead to serious issues, affecting product performance, durability, and even causing safety incidents [19]. Similarly, connections have been identified between data collected during the manufacturing process and the emergence of defects in the produced parts, enabling the application of methodologies for monitoring control parameters [20,21] or other types of responses [22,23,24].
Recent studies have explored different monitoring methods for defect analysis in Wire and Arc Additive Manufacturing (WAAM) processes. Ramalho et al. [20] investigated the use of acoustic emissions to detect contaminations during the additive manufacturing of 316L stainless steel, highlighting its application in fault identification. Similarly, Chen et al. [24] developed an optical spectral-physics-informed attention network for condition monitoring in WAAM, demonstrating the potential of optical signal-based techniques for predictive defect analysis. These works emphasize the variety of approaches employed to enhance defect detection and quality control in the WAAM process.
Among the monitoring techniques in WAAM, the electrical sensing method is based on the perspective that electric arc signals are closely related to droplet transfer and arc ignition [25]. While these methods have advanced the understanding of WAAM monitoring, their focus often remains on macroscopic defect detection or signal-based assessments, without direct exploration of the microstructural implications of anomalies. In this context, Lupo et al. [26] analyzed microstructural images captured between powder layers to assess how the quality of the powder layer in the Selective Laser Sintering (SLS) process affects defects in the final product.
Furthermore, this study bridges this critical gap by integrating electric arc signal analysis with microstructural investigation for anomaly detection in WAAM. Unlike prior works, which primarily concentrate on process monitoring or defect prediction, this research experimentally validates the correlation between electric arc characteristics and microstructural changes in austenitic stainless steel 316L-Si walls. Through a controlled experimental design, electric arc data (voltage and current) are acquired during the deposition process, with conditions tailored to induce specific defects. The subsequent microstructural analysis evaluates how these defects manifest at the microscopic level, confirming the legitimacy of using electric arc signals for anomaly detection in WAAM. This novel approach ensures a deeper understanding of the relationship between process parameters, arc instability, and material integrity, offering critical insights for improving defect detection and ensuring the industrial reliability of WAAM components.
2. Materials and Methods
In this work, C-Mn plates (Aço Brazil, Campina Grande, Brazil) with dimensions of 18 × 160 × 170 mm were used as the substrate. For the filler metal, austenitic stainless steel wire ER 316LSi (Avesta ER316Si/316L Si®, from Avesta, Sweden) with a nominal diameter of 1.2 mm was used, and commercially pure argon (99.98% Ar) was used as the shielding gas. Table 1 presents the nominal chemical composition of the wire used, as specified by the AWS A5.9 classification and measured by X-ray fluorescence (XRF).

Table 1.
Nominal chemical composition of filler metal AISI 316L-Si.
The walls produced by WAAM were made by depositing 5 weld beads, each 100 mm in length, using a zig-zag strategy in the manufacturing direction to achieve a more uniform wall height [27,28]. The process used was GMAW with controlled short-circuit transfer mode (GMAW-CCC) [29]. For this, an IMC Soldagem (Palhoça, Brazil) power source, model Digiplus A7, was used along with the STA 20-D wire feeder model, from IMC Soldagem. The torch displacement system was a CNC robotic mechanism with three-axis movement (X, Y, and Z), controlled by MACH3 CNC software version 3.043, from the ArtSoft company (Hood River, OR, USA), with G-code language. The deposition parameters were chosen to ensure minimal dimensional stability and mechanical properties of the deposits, according to the literature related to the material [30], as presented in Table 2.
Table 2.
Deposition parameters for the WAAM manufacturing of 316L-Si steel walls.
To investigate defects and arc instability due to the influence of contaminants during layer deposition, three types of contaminants were used: sand, oil, and chalk [20,31]. Thus, two walls were manufactured for each contaminant, with intercalation in the deposition of the contaminants, represented by strategies P1 (Figure 1b) and P2 (Figure 1b). This pattern was applied to all three contaminants, deposited in the layers and locations indicated, as shown in Figure 1a.
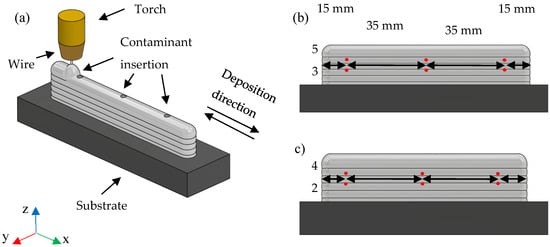
Figure 1.
(a) Schematic diagram of contaminant insertion during layer deposition by MADA, according to strategies (b) P1 and (c) P2. The red dots indicate the exact locations of contaminant introduction.
The fundamental parameters determining the CCC waveform shape included the peak current (1), peak current time (2), current drop rate (3), current rise rate (4), short-circuit wait current (5), and background current (6), as depicted in Figure 1.
For better visualization and future reference for results and discussions, acronyms were adopted to identify the walls according to the contamination strategy and the introduced contaminant. This standardization is presented in Table 3.
Table 3.
Nomenclature of the fabricated walls.
For metallographic preparation, samples were taken from the walls where contaminants were introduced into the deposits. After cutting, 5 mm-thick samples were embedded, ground to a 2400 grit, polished with 1 μm and 0.5 μm alumina, and subjected to electrolytic etching using 10% oxalic acid for 50 s at 2 V. Digital photographs were obtained using an Olympus (Tokyo, Japan) optical microscope, SC30 model, with 5× magnification. These images were taken in all interpass regions of the three samples removed transversely from the contamination areas for each manufactured wall. This was done to compare the appearance of microscopic defects in the contamination regions with the others, as well as to distinguish the microstructural morphology of an interpass region with and without the presence of external contaminants.
2.1. Data Labeling
Before analyzing the electric arc data to investigate the effect of contaminant introduction on defect occurrence in the walls, it is necessary to perform a preprocessing step to remove irrelevant data. Some data are considered useless for analysis; for example, when both current and voltage levels are zero before and after the start and end of the electric arc due to delays in communication between the welding and robotic systems, or when only the current levels are zero due to delays between the start and end of data acquisition and the start and end of the electric arc. After this data cleaning, the welding current and voltage datasets are normalized using the Min-Max technique.
All preprocessed files were labeled to enable the correlation between raw or feature-extracted electric arc data and electric arc anomalies, which were categorically assessed. This categorical label was assigned according to the type of electric arc disturbance and could assume the following values: 0 for no disturbance; 1 for disturbance associated with the start of the arc; 2 for disturbance associated with contamination; and 3 for disturbance associated with the end of the arc.
2.2. Feature Selection and Extraction Process
Next, a rolling window is used to divide the normalized data into sections containing 100 samples each. There is overlap between neighboring windows in this work. If the last data window contains fewer than 100 samples, the script will re-sample this last window to 100 samples using data from the previous window. This windowing process aims to calculate features related to the electric arc (voltage and current).
Based on a complete cycle of the events occurring during the CCC metal transfer, eleven statistical features can be extracted for both current and voltage data, similarly to what was proposed by Shi et al. [12] and Li et al. [13]. Another selected feature was the IVcc (Vilarinho Index of Regularity) for CCC metal transfer, based on the short-circuit and arc burn time intervals. This feature was chosen considering domain knowledge that reflects the understanding that electric arc anomalies caused by contaminants can effectively lead to irregularities in the electric arc during metal transfer. For calculating IVcc, the electrical voltage and current data were acquired at a rate of 5 kHz and 22 V for short-circuit voltage. The acquisition and storage of the electric arc data were performed using the data acquisition system SAP V4 from IMC Soldagem.
To determine the IVcc, as previously done in other works [27,32,33], a dedicated script developed in Python 3.12 was used, through which the short-circuit time values and their respective standard deviations are calculated numerically [27,28], as shown in Equation (1).
where is the standard deviation of the mean short-circuit time, is the standard deviation of the mean arc burn time, is the mean short-circuit time, and is the mean arc burn time. In this context, the regularity index IVcc takes into account both the mean values and standard deviations. Thus, a lower IVcc value indicates greater stability of the arc for short-circuit transfer [21].
Thus, knowing that all selected features are calculated for both voltage and current data, except for IVcc, there are a total of 23 electric arc features calculated for each data window. These features are listed in Table 4 below.
Table 4.
Features related to acquired electric arc data.
To concatenate the extracted features with the labels, which did not undergo the data windowing process, the labels were also windowed, with the most frequent value (mode) calculated for each window.
3. Results
3.1. Visual Inspection of the Walls
The walls were manufactured according to the manufacturing parameters of the WAAM process and the contaminants—chalk, sand, and oil—indicated in Table 3. The visual characteristics of the walls are shown in Figure 2.
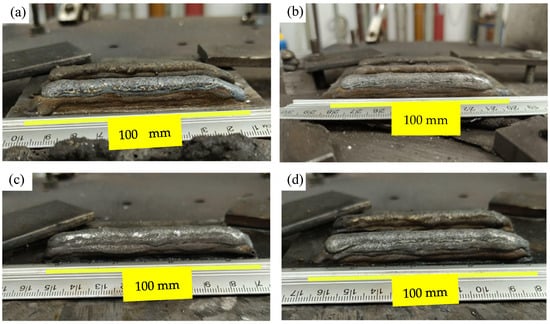
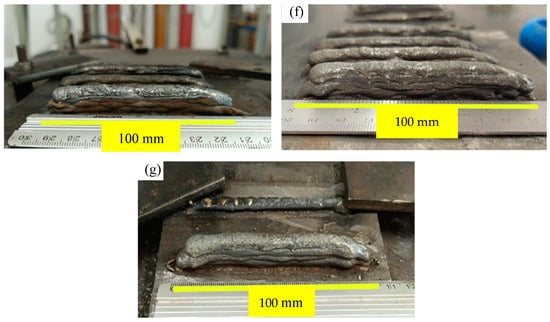
Figure 2.
Fabricated walls: (a) W2, (b) W3, (c) W4, (d) W5, (e) W6, (f) W7, and (g) W1.
Visual inspection revealed distinct characteristics on the surface of wall W1 (Figure 2g) compared to those where contaminants were introduced (Figure 2a–f). It was observed that the walls contaminated with sand (W6 and W7) were the most geometrically inconsistent, showing lateral deformations along the entire length of the layers, as indicated in Figure 2e,f. This can be justified by the physical interference with arc stability, as sand particles may create points of low adhesion between the deposited layers, compromising material cohesion and leading to geometric deformations. This is also described by Meier et al. [34], who noted that the presence of sand particles can interfere with deposition continuity in the metal powder bed fusion process, resulting in irregular surfaces and inadequate adhesion. Roy et al. [35] highlighted that interparticle cohesion can result in layer structures with variable density, creating low-density areas susceptible to adhesion failures between subsequent layers. Additionally, it’s possible to infer chemical contamination due to undesirable reactions. Sand, primarily composed of silicon dioxide (SiO₂) [36,37], might react with elements present in the stainless steel 316L-Si and these reactions can form compounds that alter the material properties of the deposited layers and compromise their geometric integrity. This is also discussed by Mouayd et al. [38], who concluded that the presence of silica or silicon dioxide delays scale growth by creating a barrier at the metal interface due to the low diffusivity of iron in silica.
Another perspective for justifying the greater deformations in the walls contaminated with sand (Figure 2e,f) is the thermal effects of this inclusion. Sand may alter thermal distribution during the deposition process, causing differences in thermal contraction and expansion along the wall, which leads to deformations in the piece. This is also discussed by Meier et al. [34]. Additionally, sand particles can act as nucleation points for solidification, accelerating the cooling of molten metal in specific areas and creating thermal stresses, which also cause deformations. This effect can be compared to the behavior observed in metal welding processes, where contaminants can result in microcracks and structural failures due to accumulated residual stresses, as described by Roy et al. [35].
Additionally, the walls W4 and W5, contaminated with oil, also exhibited the same discontinuities as those contaminated with sand, but to a lesser extent, along with the presence of lateral spatter in the same direction as the layer deposition. This is due to the interference with the electric arc caused by the inclusion of oil. The presence of oil on the surface of the molten metal can alter the surface tension of the metal, causing spatter and irregularities in the deposition. As the oil vaporizes, it can create small explosions that disperse the molten metal, resulting in lateral spatter, as discussed by Li et al. [39], who investigated the effects of oxides on the surface tension of molten metal and arc behavior in the GTAW process.
In addition, oil can create a thin layer between deposits, reducing cohesion between the deposited layers and resulting in smaller, yet still present, discontinuities. This is similar to the discussion by Yoo, Lee, and Kim [40], who indicated that oil contamination can lead to fusion and adhesion problems, creating weak points in the WAAM-produced piece. It should also be noted that the introduction of oil can reduce the wettability of the deposited metal, hindering proper fusion of successive layers and resulting in discontinuities. This is consistent with discussions by other authors, who emphasize the critical nature of oil contamination during additive manufacturing, creating physical barriers that prevent adequate fusion between layers, resulting in structural defects [41,42]. This problem is particularly significant in DED-AM processes, where layer adhesion is directly related to the quality of the final product.
The walls contaminated with oil (Figure 2c,d) exhibited reductions in width towards the end of their length. Additionally, the walls contaminated with chalk (W2 and W3) showed excessive surface oxidation in the layers where the contaminant was introduced, significantly compromising arc stability when evaluated layer by layer, as also discussed by Bevans et al. [31]. As a preliminary assessment in the context of investigating defects and arc stability in walls manufactured by WAAM from 316L-Si stainless steel, visual inspection was complemented by quantitative and experimental indicators, as shown in the following sections.
3.2. Metallographic Analysis
The metallographic characterization of the samples, strategically taken from the locations where contaminants were introduced into the walls manufactured according to the contamination strategies P1 and P2, can be seen in Figure 3, Figure 4, Figure 5, Figure 6, Figure 7 and Figure 8. To demonstrate the effects of contaminant insertion on the microscopic aspect of the material, images from the contamination regions (lower and upper zones) and other interpass regions of the sample (middle zone) were selected for each of the three samples taken per wall for comparative purposes. Beyond the scope of this study, Figure 3, Figure 4, Figure 5, Figure 6, Figure 7 and Figure 8 display the typical microstructure of austenitic stainless steel manufactured by WAAM, consisting of austenite dendrites, visualized in yellowish regions, with ferrite at the boundaries, visible in darker regions of the figures [43,44,45]. The results for the walls with contaminants, W2 to W7, are shown in Figure 3, Figure 4, Figure 5, Figure 6, Figure 7 and Figure 8, in sequence.
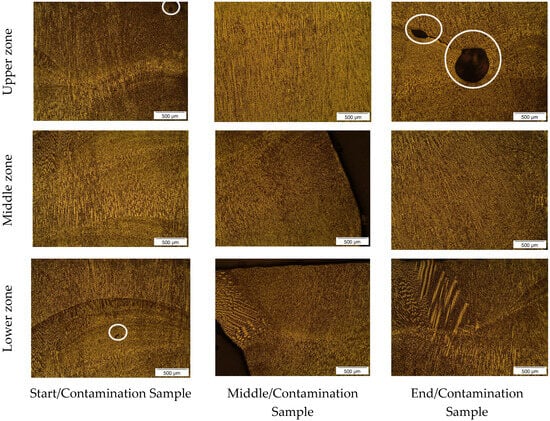
Figure 3.
Microstructure of wall W2 at 50× magnification. The white circles indicate noticeable microstructural defects.
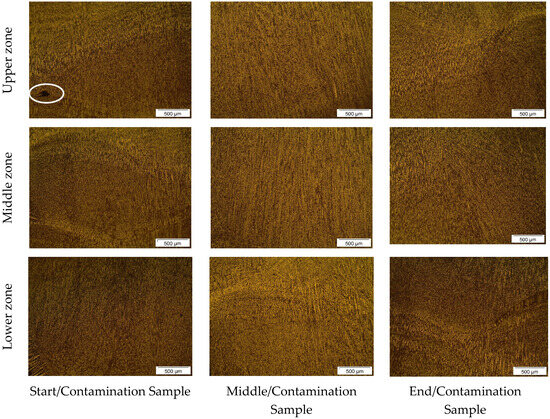
Figure 4.
Microstructure of wall W3 at 50× magnification. The white circle indicates noticeable microstructural defects.
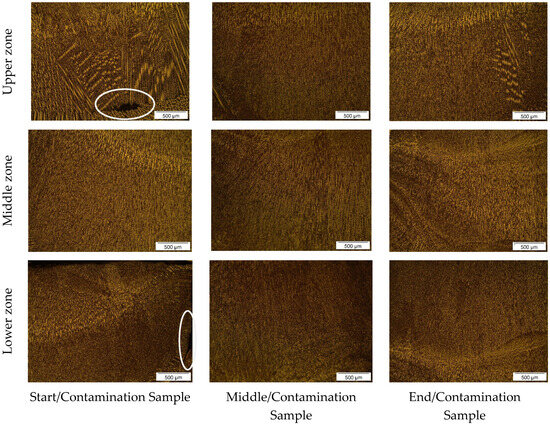
Figure 5.
Microstructure of wall W4 at 50× magnification. The white circles indicate noticeable microstructural defects.

Figure 6.
Microstructure of wall W5 at 50× magnification.
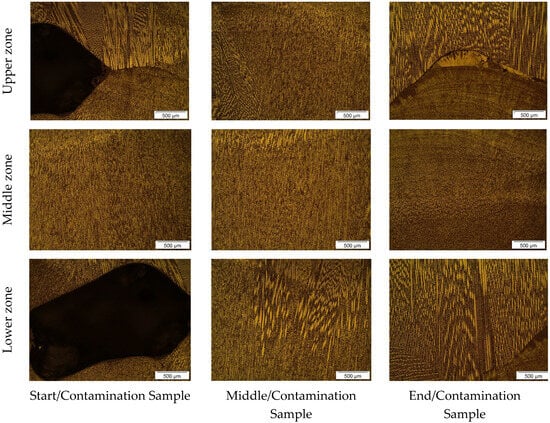
Figure 7.
Microstructure of wall W6 at 50× magnification.
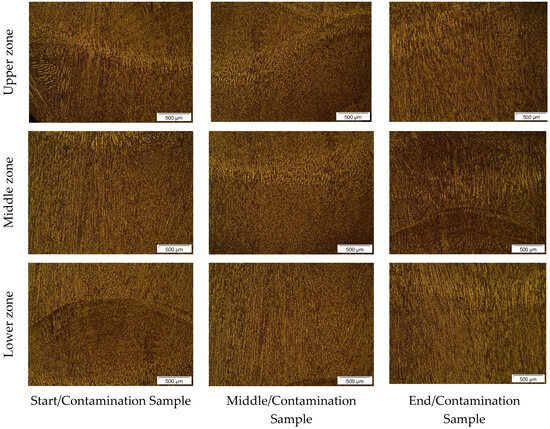
Figure 8.
Microstructure of wall W7 at 50× magnification.
From Figure 3, the microstructure of the W2 sample can be observed. In the analysis of Figure 3, regarding the upper zone, the start/contamination sample showed a relatively homogeneous microstructure with a darker region prominently highlighted, possibly related to the accumulation of chalk during deposition. In this region, the middle/contamination sample also showed a relatively homogeneous microstructure with elongated grains in the direction of solidification. The end/contamination sample exhibited a more evenly distributed microstructure, but with a highlighted area of material accumulation resulting from the buildup of chalk in that location.
For the lower zone, the start/contamination sample displays a more irregular solidification pattern, characteristic of the interpass regions in the WAAM process, and a dark region prominently highlighted, possibly associated with residues from the chalk accumulation. The middle/contamination sample shows the characteristic solidification structure, revealing a different solidification pattern at the edges of the sample, related to the natural cooling gradient of the deposit to the environment. Similarly, the end/contamination sample displayed the characteristic solidification pattern of the WAAM process but with a region of solidification typical of the sample edges, where there is greater contact with the environment. This is featured in the physical characteristics of the chalk, which can act as a thermal insulator, affecting heat and mass transfer in the contamination regions and their surroundings, leading to a heterogeneous distribution of microconstituents.
In the samples shown in Figure 4, there is no significant differentiation compared to what was observed in Figure 6, except for a drastic reduction in the identification of contaminant accumulation, which is only present in the highlighted section of the upper zone of the start/contamination sample. It is noted that the middle zone of all samples, as illustrated in Figure 3 and Figure 4, shows a more uniform and fine structure compared to the upper and lower zones, possibly due to a lesser influence from the contaminants introduced in the other zones during the process. The microstructural and solidification patterns of the other zones in the samples are characteristic of the WAAM process, indicating that there was no significant influence of chalk insertion for this wall. Alternatively, the imperfections in the deposit, as shown in Figure 2, especially at the edges, may have affected the precision of sample extraction. This could justify why a sample does not necessarily reflect the intended manufacturing/contamination conditions.
The presence of inclusions, highlighted in Figure 3 and Figure 4, located in the interpass region and exhibiting irregular morphology, is featured in the contamination by chalk and the reduction in the activity of the electric arc caused by this type of contamination during the metal deposition. This finding aligns with the discussions by Wang et al. [46], who developed a strategy for detecting porosity in WAAM, and Li et al. [47], who established an internal system for tracking defects in WAAM.
Figure 5 and Figure 6 illustrate the microstructures of the interpass regions for the walls W4 and W5, respectively, when contaminated with oil. From the analysis of Figure 5, which displays the microstructure of sample W4, it is observed that in the upper zone, the initial/contaminated sample has a heterogeneous microstructure with elongated dendrites, originating from a prominent dark region featuring the effect of oil vaporizing during deposition. In the same region, the medium/contaminated sample exhibits a more homogeneous microstructure with fewer visible disturbances, but still with some indications of solidification anomalies compared to other regions of the sample. Similarly, the end/contaminated sample also shows a more homogeneous distribution of microconstituents, with signs of solidification anomalies in specific locations.
Regarding the lower zone, the initial/contaminated sample shows a marked segregation in the microstructure, characterized by faster solidification, with elongated dendrites originating from a prominent fissured region. In contrast, the medium/contaminated and end/contaminated samples display a microstructure and morphology characteristic of the WAAM process.
Figure 6 shows similar behavior in the microstructural characteristics of the oil-contaminated samples, as previously analyzed in Figure 5. In both the upper and lower zones, the initial/contaminated and end/contaminated samples exhibited irregular solidification patterns, deviating from the typical WAAM process characteristics. This suggests that the presence of oil during deposition caused irregular metal solidification due to gas generation. In contrast, the upper and lower zones of the medium/contaminated sample reveal a more homogeneous microstructure with a finer grain size, which could be attributed to the lower influence of oil in this part of the deposit or to the imprecision in sampling from the wall.
Similar to Figure 3 and Figure 4, it is noteworthy that the middle zone of the samples illustrated in Figure 5 and Figure 6 shows finer and more uniform granulation. This is featured to the proper selection of deposition parameters and the reduced influence of oil in the subsequent layers after its introduction, considering that it vaporizes shortly after deposition.
The presence of voids and cracks in the samples extracted from walls W4 and W5 can be featured to the evaporation mechanism of this contaminant, which is absorbed by the molten pool and subsequently generates pores upon solidification. This phenomenon was discussed when examining the influence of different types of contamination on the acoustic spectrum in WAAM, as demonstrated by Huang et al. [48] and Li et al. [47].
Figure 7 and Figure 8 illustrate the microstructure of the interpass regions for walls W6 and W7, respectively, when contaminated with sand. As observed in Figure 7, in the upper zone, the initial/contamination and end/contamination samples show pronounced dark areas and unusual solidification patterns in the interpass region. This indicates that the sand interacted with the material during solidification, compromising its fusion and the typical annealing process in the interpass region of WAAM. The middle/contamination sample shows a more uniform microstructure but still has some areas of irregular solidification, suggesting a lesser effect of the sand in this region. In the lower zone, the initial/contamination sample displays a large dark region associated with rapid solidification patterns in its vicinity, indicating that the concentration of the contaminant in this region may have acted as an anchor for internal metal solidification. The middle/contamination and end/contamination samples in the lower zone showed solidification patterns similar to those observed in the contaminant accumulation area in the initial/contamination sample, indicating that sand caused internal metal solidification differences, although not explicitly identified in the images, as illustrated in the initial/contamination sample of the lower zone.
Based on Figure 8, both the upper and lower zones exhibit microstructural characteristics and solidification conditions considered suitable for the process. When compared to other samples from walls contaminated with sand in these zones, this would be unusual as there are no evident effects of the contaminant. This can be featured as inaccuracies in sample removal from wall W7, given the geometric imperfections at the wall’s edges. The middle zones of the samples presented in Figure 7 and Figure 8, similar to previous ones in this region, show fine and homogeneous grain structure, reflecting the lesser direct influence of contaminants in this area. The irregularities in the microstructure observed in sand-contaminated samples, as presented in Figure 7 and Figure 8, were also noted by Wang et al. [46] and Li et al. [47].
3.3. Feature Extraction
The routines for extracting features related to the electrical arc, outlined in Section 2.2, were applied to the original datasets collected during the manufacturing of the walls. In this study, only anomalies related to contamination of the deposit in the middle region of the wall (AC), or at the start (ONC) or end (OFC) of the electrical arc are targeted. Some of these anomalies identified in the electrical arc data are represented in Figure 9. It is preliminarily estimated that the average values of the electrical arc signals (Figure 9d), along with their respective standard deviation values (Figure 9a), minimum values (Figure 9b), and the number of peaks (Figure 9c), provide good indicators for distinguishing between normal and anomalous behavior of the electrical arc under the current set of experimental conditions related to manufacturing anomalies.
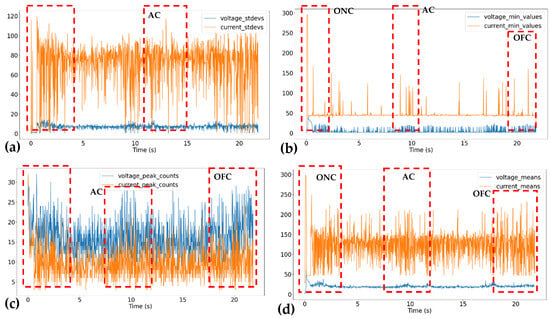
Figure 9.
Examples of the features extracted from the electrical arc data: (a) standard deviation values, (b) minimum values, (c) number of peaks, and (d) average values. The dotted red squares indicate regions of the oscillogram where some type of electric arc anomaly occurred, marked by the acronyms ONC, AC, and OFC.
3.4. Correlation Between Features and Target Parameter
The feature extraction routines were aggregated into the datasets with labeled responses, along with the electric arc data collected during the fabrication of the walls, through the application of the rolling window technique. The same parameters were applied to the labeled data to adjust the dimensionality of the data matrices resulting from both scripts. By combining the feature dataset with the original labeled dataset, it was possible to observe the correlation matrix between the features and the categorical responses of the label, represented by the feature ‘Anomaly’, as shown in Figure 10.
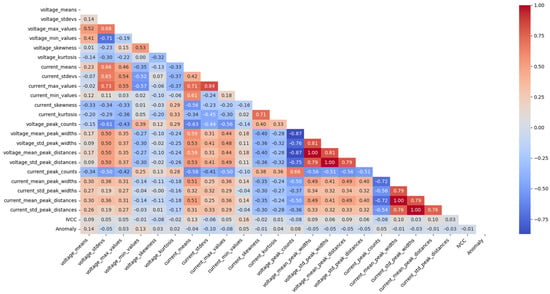
Figure 10.
Correlation matrix between electric arc features.
Based on the results for electric arc features presented in Figure 9a, which displays the correlation matrix between the features and the response (‘Anomaly’) as a heatmap, it can be observed that the features ‘voltage_max_values’ (0.52) and ‘current_means’ (0.66) showed moderately strong correlations with the response. This indicates that higher voltage values and current averages may be associated with the occurrence of electric arc anomalies. Additionally, the features ‘voltage_peak_counts’ (−0.34) and ‘current_peak_counts’ (−0.34) exhibited moderate negative correlations, suggesting that a lower frequency of voltage and current peaks may be related to anomalous characteristics in the electric arc, considering CCC metal transfer.
In addition, the feature IVCC has a low correlation with ‘Anomaly’ (0.01), suggesting that this feature does not have a significant influence on the target parameter, or at least does not establish a linear relationship with the target parameter, given the multi-complexity of the metal transfer process in WAAM, as the correlation matrix uses Pearson’s coefficient. Furthermore, there are strong positive correlations between variables related to electrical current, such as ‘current_max_values’ and ‘current_std_peak_widths’ (0.81), which is expected since both parameters are related to peak analysis in current waveforms. A similar behavior is observed between voltage variables, such as ‘voltage_max_values’ and ‘voltage_std_peak_distances’ (0.87), suggesting an intrinsic relationship between voltage peak characteristics and their statistical variations.
4. Conclusions
The presented study revealed significant discussions regarding arc analysis techniques for anomaly detection in walls fabricated by Wire Arc Additive Manufacturing (WAAM) using the GMA process. The following conclusions were highlighted based on the visual inspection of the walls, microstructural analysis of cross-sectioned samples, and analysis of arc-related features:
- (1)
- The controlled introduction of contaminants, such as chalk, oil, and sand, led to observable geometric and microstructural changes due to their effect on the molten pool’s solidification and the appearance of microscopic defects;
- (2)
- The analysis of arc-related features, selected based on the controlled short-circuit transfer mode, identified strong correlations between variations in arc features—such as mean, minimum, standard deviation values, as well as the number of peaks—and the occurrence of anomalies in the WAAM process, as confirmed by metallographic analyses;
- (3)
- The study of features indicated that applying machine learning techniques for defect prediction could be enabled through the collected data. This expands the resources for controlling and mitigating anomalies in metal additive manufacturing processes;
- (4)
- The study confirmed that arc analysis can effectively detect anomalies in additive manufacturing processes, suggesting that such techniques could be refined to improve the reliability and quality of fabricated components.
All the evidence presented in this work highlights the significant potential of integrated methods to advance monitoring and quality control in additive manufacturing processes.
Author Contributions
Conceptualization, L.J.E.B.S., J.S.L., R.A.C.S., R.S.G., I.J.S.A. and A.L.D.B.; investigation, L.J.E.B.S. and I.J.S.A.; formal analysis, L.J.E.B.S., J.I.V.S., I.J.S.A., W.B.C. and J.S.L.; validation, J.I.V.S., J.S.L., I.J.S.A. and W.B.C.; writing—original draft preparation, L.J.E.B.S., J.I.V.S., J.M.P.Q.D., R.S.G., A.G.B.L. and A.L.D.B.; writing—review and editing, J.I.V.S., J.S.L., W.B.C., J.M.P.Q.D., R.A.C.S., A.L.D.B. and A.G.B.L.; supervision, J.I.V.S. and J.S.L.; funding acquisition, J.S.L., R.A.C.S., R.S.G., J.M.P.Q.D. and A.G.B.L. All authors have read and agreed to the published version of the manuscript.
Funding
This research was funded by the Brazilian National Council for Scientific and Technological Development (CNPq): grant numbers 409585/2022-0 and 408253/2022-3. Also, this work was financially supported by Base Funding—UIDB/04708/2020, with DOI: 10.54499/UIDB/04708/2020; Programmatic Funding—UIDP/04708/2020, with DOI: 10.54499/UIDP/04708/2020 of the CONSTRUCT funded by national funds through the FCT/MCTES (PIDDAC); and FCT through the individual Scientific Employment Stimulus 2020.00828.CEECIND/CP1590/CT0004, DOI: 10.54499/2020.00828.CEECIND/CP1590/CT0004.
Data Availability Statement
The raw data supporting the conclusions of this article will be made available by the authors upon request due to privacy concerns related to the confidentiality of proprietary processes.
Acknowledgments
The authors thank the Welding Laboratory (LABSOL) at the Federal University of Campina Grande (UFCG) and the startup WIRE—Technology and Smart Manufacturing for the loan of machines and equipment, and to the Tutorial Education Program of Mechanical Engineering (PETMEC-CG) at UFCG.
Conflicts of Interest
The authors declare no conflicts of interest.
References
- Javaid, M.; Haleem, A.; Singh, R.P.; Suman, R.; Gonzalez, E.S. Understanding the adoption of Industry 4.0 technologies in improving environmental sustainability. Sustain. Oper. Comput. 2022, 3, 203–217. [Google Scholar] [CrossRef]
- Sehnem, S.; Lara, A.C.; Benetti, K.; Schneider, K.; Marcon, M.L.; da Silva, T.H.H. Improving startups through excellence initiatives: Addressing circular economy and innovation. Environ. Dev. Sustain. 2023, 26, 15237–15283. [Google Scholar] [CrossRef]
- Sireesha, M.; Lee, J.; Kranthi Kiran, A.S.; Babu, V.J.; Kee, B.B.T.; Ramakrishna, S. A review on additive manufacturing and its way into the oil and gas industry. RSC Adv. 2018, 8, 22460–22468. [Google Scholar] [CrossRef]
- Minguella-Canela, J.; Morales Planas, S.; Gomà Ayats, J.R.; De los Santos López, M.A. Assessment of the Potential Economic Impact of the Use of AM Technologies in the Cost Levels of Manufacturing and Stocking of Spare Part Products. Materials 2018, 11, 1429. [Google Scholar] [CrossRef] [PubMed]
- Fernandes, V.; Matos, F.; Oliveira, J.P.; Neves, A.; Godina, R. Identifying strategic opportunities through the development of a roadmap for additive manufacturing: The example of Portugal. Heliyon 2023, 9, e19672. [Google Scholar] [CrossRef] [PubMed]
- Gonzalez-Gutierrez, J.; Cano, S.; Schuschnigg, S.; Kukla, C.; Sapkota, J.; Holzer, C. Additive Manufacturing of Metallic and Ceramic Components by the Material Extrusion of Highly-Filled Polymers: A Review and Future Perspectives. Materials 2018, 11, 840. [Google Scholar] [CrossRef] [PubMed]
- Ferretti, P.; Santi, G.M.; Leon-Cardenas, C.; Freddi, M.; Donnici, G.; Frizziero, L.; Liverani, A. Molds with Advanced Materials for Carbon Fiber Manufacturing with 3D Printing Technology. Polymers 2021, 13, 3700. [Google Scholar] [CrossRef] [PubMed]
- Kumar, N.; Bhavsar, H.; Mahesh, P.V.S.; Srivastava, A.K.; Bora, B.J.; Saxena, A.; Dixit, A.R. Wire Arc Additive Manufacturing—A revolutionary method in additive manufacturing. Mater. Chem. Phys. 2022, 285, 126144. [Google Scholar] [CrossRef]
- Ron, T.; Shirizly, A.; Aghion, E. Additive Manufacturing Technologies of High Entropy Alloys (HEA): Review and Prospects. Materials 2023, 16, 2454. [Google Scholar] [CrossRef]
- Hassan, A.; Alnaser, I.A. A Review of Different Manufacturing Methods of Metallic Foams. ACS Omega 2024, 9, 6280–6295. [Google Scholar] [CrossRef]
- Liu, D.; Lee, B.; Babkin, A.; Chang, Y. Research Progress of Arc Additive Manufacture Technology. Materials 2021, 14, 1415. [Google Scholar] [CrossRef] [PubMed]
- Shi, J.; Li, F.; Chen, S.; Zhao, Y.; Tian, H. Effect of in-process active cooling on forming quality and efficiency of tandem GMAW–based additive manufacturing. Int. J. Adv. Manuf. Technol. 2019, 101, 1349–1356. [Google Scholar] [CrossRef]
- Li, Y.; Polden, J.; Pan, Z.; Cui, J.; Xia, C.; He, F.; Mu, H.; Li, H.; Wang, L. A defect detection system for wire arc additive manufacturing using incremental learning. J. Ind. Inf. Integr. 2022, 27, 100291. [Google Scholar] [CrossRef]
- ISO/ASTM 52900:2021(en); Additive Manufacturing—General Principles—Fundamentals and Vocabulary. ASTM: West Conshohocken, PA, USA, 2021. Available online: https://www.iso.org/obp/ui/#iso:std:iso-astm:52900:ed-2:v1:en (accessed on 3 December 2024).
- Wang, J.F.; Sun, Q.J.; Wang, H.; Liu, J.P.; Feng, J.C. Effect of location on microstructure and mechanical properties of additive layer manufactured Inconel 625 using gas tungsten arc welding. Mater. Sci. Eng. A 2016, 676, 395–405. [Google Scholar] [CrossRef]
- Ding, D.; Pan, Z.; Cuiuri, D.; Li, H. A multi-bead overlapping model for robotic wire and arc additive manufacturing (WAAM). Robot. Comput. Integr. Manuf. 2015, 31, 101–110. [Google Scholar] [CrossRef]
- Zhu, L.; Luo, Y.; Han, J.; Zhang, C.; Xu, J.; Chen, D. Energy characteristics of droplet transfer in wire-arc additive manufacturing based on the analysis of arc signals. Measurement 2019, 134, 804–813. [Google Scholar] [CrossRef]
- Tomar, B.; Shiva, S.; Nath, T. A review on wire arc additive manufacturing: Processing parameters, defects, quality improvement and recent advances. Mater. Today Commun. 2022, 31, 103739. [Google Scholar] [CrossRef]
- He, X.; Wang, T.; Wu, K.; Liu, H. Automatic defects detection and classification of low carbon steel WAAM products using improved remanence/magneto-optical imaging and cost-sensitive convolutional neural network. Measurement 2021, 173, 108633. [Google Scholar] [CrossRef]
- Ramalho, A.; Santos, T.G.; Bevans, B.; Smoqi, Z.; Rao, P.; Oliveira, J.P. Effect of contaminations on the acoustic emissions during wire and arc additive manufacturing of 316L stainless steel. Addit. Manuf. 2022, 51, 102585. [Google Scholar] [CrossRef]
- de Souto, J.I.V.; de Lima, J.S.; de Castro, W.B.; de Santana, R.A.C.; Silva, A.A.; de Abreu Santos, T.F.; Tavares, J.M.R.S. Effects of Contaminations on Electric Arc Behavior and Occurrence of Defects in Wire Arc Additive Manufacturing of 316L-Si Stainless Steel. Metals 2024, 14, 286. [Google Scholar] [CrossRef]
- Chabot, A.; Laroche, N.; Carcreff, E.; Rauch, M.; Hascoët, J.Y. Towards defect monitoring for metallic additive manufacturing components using phased array ultrasonic testing. J. Intell. Manuf. 2020, 31, 1191–1201. [Google Scholar] [CrossRef]
- Lopez, A.; Bacelar, R.; Pires, I.; Santos, T.G.; Sousa, J.P.; Quintino, L. Non-destructive testing application of radiography and ultrasound for wire and arc additive manufacturing. Addit. Manuf. 2018, 21, 298–306. [Google Scholar] [CrossRef]
- Chen, L.; Yang, F.; Wang, R.; Zhang, Y.; Diao, Z.; Rong, M. Optical Spectral Physics-Informed Attention Network for Condition Monitoring in WAAM. IEEE Trans. Ind. Electron. 2023, 71, 9708–9718. [Google Scholar] [CrossRef]
- Li, Y.; Su, C.; Zhu, J. Comprehensive review of wire arc additive manufacturing: Hardware system, physical process, monitoring, property characterization, application and future prospects. Results Eng. 2022, 13, 100330. [Google Scholar] [CrossRef]
- Lupo, M.; Ajabshir, S.Z.; Sofia, D.; Barletta, D.; Poletto, M. Experimental metrics of the powder layer quality in the selective laser sintering process. Powder Technol. 2023, 419, 118346. [Google Scholar] [CrossRef]
- Rodideal, N.; Machado, C.M.; Infante, V.; Braga, D.F.O.; Santos, T.G.; Vidal, C. Mechanical characterization and fatigue assessment of wire and arc additively manufactured HSLA steel parts. Int. J. Fatigue 2022, 164, 107146. [Google Scholar] [CrossRef]
- Zhang, T.; Li, H.; Gong, H.; Wu, Y.; Chen, X.; Zhang, X. Study on location-related thermal cycles and microstructure variation of additively manufactured inconel 718. J. Mater. Res. Technol. 2022, 18, 3056–3072. [Google Scholar] [CrossRef]
- de Lima, J.S.; da Silva Neto, J.F.; Maciel, T.M.; López, E.A.T.; de Santana, R.A.C.; de Abreu Santos, T.F. Effect of wire arc additive manufacturing parameters on geometric, hardness, and microstructure of 316LSi stainless steel preforms. Int. J. Adv. Manuf. Technol. 2024, 131, 5981–5996. [Google Scholar] [CrossRef]
- De Souto, J.I.V.; Ferreira, S.D.; de Lima, J.S.; de Castro, W.B.; Grassi, E.N.D.; Santos, T.F. de A. Effect of GMAW Process Parameters and Heat Input on Weld Overlay of Austenitic Stainless Steel 316L-Si. Soldag. Inspeção 2023, 28, e2809. [Google Scholar] [CrossRef]
- Bevans, B.; Ramalho, A.; Smoqi, Z.; Gaikwad, A.; Santos, T.G.; Rao, P.; Oliveira, J.P. Monitoring and flaw detection during wire-based directed energy deposition using in-situ acoustic sensing and wavelet graph signal analysis. Mater. Des. 2023, 225, 111480. [Google Scholar] [CrossRef]
- Surovi, N.A.; Soh, G.S. Acoustic feature based geometric defect identification in wire arc additive manufacturing. Virtual Phys. Prototyp. 2023, 18, e2210553. [Google Scholar] [CrossRef]
- Alcaraz, J.Y.; Foqué, W.; Sharma, A.; Tjahjowidodo, T. Indirect porosity detection and root-cause identification in WAAM. J. Intell. Manuf. 2023, 35, 1607–1628. [Google Scholar] [CrossRef]
- Meier, C.; Weissbach, R.; Weinberg, J.; Wall, W.A.; Hart, A.J. Critical influences of particle size and adhesion on the powder layer uniformity in metal additive manufacturing. J. Mater. Process. Technol. 2019, 266, 484–501. [Google Scholar] [CrossRef]
- Roy, S.; Xiao, H.; Angelidakis, V.; Pöschel, T. Structural fluctuations in thin cohesive particle layers in powder-based additive manufacturing. Granul. Matter 2024, 26, 43. [Google Scholar] [CrossRef]
- Jeanne Rampe, M.; Zeth Lombok, J.; Arini Tiwow, V.; Milian Tompunu Tengker, S.; Bua, J. Characterization of silica (SiO2) based on beach sand from Sulawesi and Sumatra as silicon carbide (SiC) base material. J. Chem. Technol. Metall. 2023, 58, 467–476. [Google Scholar] [CrossRef]
- Akl, M.A.; Aly, H.F.; Soliman, H.M.A.; Abd ElRahman, A.M.E.; Abd-Elhamid, A.I. Preparation and characterization of silica nanoparticles by wet mechanical attrition of white and yellow sand. J. Nanomedicine Nanotechnol. 2013, 4, 2. [Google Scholar] [CrossRef]
- Alaoui Mouayd, A.; Koltsov, A.; Sutter, E.; Tribollet, B. Effect of silicon content in steel and oxidation temperature on scale growth and morphology. Mater. Chem. Phys. 2014, 143, 996–1004. [Google Scholar] [CrossRef]
- Li, C.; Shi, Y.; Gu, Y.; Yang, F. Effect of oxide on surface tension of molten metal. RSC Adv. 2017, 7, 53941–53950. [Google Scholar] [CrossRef]
- Yoo, S.-W.; Lee, C.-M.; Kim, D.-H. Effect of Functionally Graded Material (FGM) Interlayer in Metal Additive Manufacturing of Inconel-Stainless Bimetallic Structure by Laser Melting Deposition (LMD) and Wire Arc Additive Manufacturing (WAAM). Materials 2023, 16, 535. [Google Scholar] [CrossRef]
- Huang, W.; Nelson, B.; Ding, H. Surface wettability patterning of metal additive manufactured parts via laser-assisted functionalization. J. Laser Appl. 2023, 35, 42067. [Google Scholar] [CrossRef]
- Zhai, W.; Zhou, W.; Nai, S.M. Effect of Interface Wettability on Additively Manufactured Metal Matrix Composites: A Case Study of 316L-Y2O3 Oxide Dispersion-Strengthened Steel. Metals 2024, 14, 170. [Google Scholar] [CrossRef]
- Zhao, D.S.; Long, D.F.; Niu, T.R.; Liu, Y.J. Effect of Current Mode on Anisotropy of 316L Stainless Steel Wire Arc Additive Manufacturing. J. Mater. Eng. Perform. 2023, 33, 8728–8732. [Google Scholar] [CrossRef]
- Wu, W.; Xue, J.; Wang, L.; Zhang, Z.; Hu, Y.; Dong, C. Forming process, microstructure, and mechanical properties of thin-walled 316L stainless steel using speed-cold-welding additive manufacturing. Metals 2019, 9, 109. [Google Scholar] [CrossRef]
- Xie, B.; Xue, J.; Ren, X.; Wu, W.; Lin, Z. A comparative study of the CMT+P process on 316L stainless steel additive manufacturing. Appl. Sci. 2020, 10, 3284. [Google Scholar] [CrossRef]
- Wang, Z.; Zimmer-Chevret, S.; Léonard, F.; Bourlet, C.; Abba, G. In Situ Monitoring of Internal Defects by a Laser Sensor for CMT Based Wire-Arc Additive Manufacturing Parts. Defect Diffus. Forum 2022, 417, 67–72. [Google Scholar] [CrossRef]
- Li, Y.P.; Wang, C.R.; Du, X.D.; Tian, W.; Zhang, T.; Hu, J.S.; Li, B.; Li, P.C.; Liao, W.H. Research status and quality improvement of wire arc additive manufacturing of metals. Trans. Nonferrous Met. Soc. China (Engl. Ed.) 2023, 33, 969–996. [Google Scholar] [CrossRef]
- Huang, Y.; Yue, C.; Tan, X.; Zhou, Z.; Li, X.; Zhang, X.; Zhou, C.; Peng, Y.; Wang, K. Quality Prediction for Wire Arc Additive Manufacturing Based on Multi-source Signals, Whale Optimization Algorithm–Variational Modal Decomposition, and One-Dimensional Convolutional Neural Network. J. Mater. Eng. Perform. 2023, 33, 11351–11364. [Google Scholar] [CrossRef]
Disclaimer/Publisher’s Note: The statements, opinions and data contained in all publications are solely those of the individual author(s) and contributor(s) and not of MDPI and/or the editor(s). MDPI and/or the editor(s) disclaim responsibility for any injury to people or property resulting from any ideas, methods, instructions or products referred to in the content. |
© 2025 by the authors. Licensee MDPI, Basel, Switzerland. This article is an open access article distributed under the terms and conditions of the Creative Commons Attribution (CC BY) license (https://creativecommons.org/licenses/by/4.0/).