Abstract
Hydrogen-rich gas (HRG) injection is a promising low-carbon solution for blast furnace ironmaking. This study conducted numerical simulations in the lower part of a blast furnace to analyze the combustion behavior of coinjected coke oven gas (COG) and pulverized coal (PC) within the raceway and the associated thermal load on the tuyere. A three-dimensional computational fluid dynamics model incorporating fluid–thermal–solid coupling and the GRI-Mech 3.0 chemical kinetic mechanism (validated for 300–2500 K) was established to simulate the lance–blowpipe–tuyere–raceway region. The simulation results revealed that moderate COG injection accelerated volatile release from PC and enlarged the high-temperature zone (>2000 K). However, excessive COG injection intensified oxygen competition and shortened the residence time of PC, ultimately decreasing the burnout rate. Notably, although COG has high reactivity, its injection did not cause an increase in tuyere temperature. By contrast, the presence of an unburned gas layer near the upper wall of the tuyere and the existence of a strong convective cooling effect contributed to a reduction in tuyere temperature. An optimized cooling water channel was designed to enhance flow distribution and effectively suppress localized overheating. The findings of this study offer valuable technical insights for ensuring safe COG injection and advancing low-carbon steelmaking practices.
1. Introduction
With the intensification of global climate change, industries worldwide are actively seeking low-carbon technologies to reduce their CO2 emissions and achieve carbon neutrality in their processes. The development of such technologies has become a central focus in both environmental and policy agendas. In the steelmaking industry, blast furnaces constitute a primary source of CO2 emissions. Therefore, innovative technologies that can substantially reduce the carbon emissions produced during blast furnace ironmaking are critical for promoting environmental sustainability and enabling a low-carbon transition in the steel sector.
Blast furnace ironmaking is a continuous process in which iron ore is reduced and melted. This process is primarily driven by the combustion of coke, which results in the production of CO as the primary reducing agent. Solid raw materials such as iron ore and coke are charged from the top of the furnace and form an alternating layered structure as they descend. During the descent of the raw materials, the iron ore gradually reacts with the reducing gases and eventually melts into hot metal. The thermal energy and reducing atmosphere within the furnace are mainly provided by a hot blast injected laterally through the blowpipe and tuyere into the coke bed. This high-velocity gas stream generates a cavity known as the raceway in front of the tuyere. Intense combustion occurs between the hot blast and coke, resulting in the production of CO2. This CO2 then reacts with coke at a temperature of approximately 2000 °C to form CO, thereby maintaining the reducing environment. In addition, auxiliary fuel injection techniques are commonly applied in modern blast furnaces. Pulverized coal (PC) injection is a widely adopted auxiliary fuel injection method. In this method, PC is delivered to the blast furnace through a lance to supply the furnace with supplementary thermal energy and reducing gases. This method enables the partial replacement of coke, effectively reducing ironmaking costs and improving combustion efficiency.
To further reduce CO2 emissions while maintaining a stable supply of reducing gases and thermal energy within a blast furnace, researchers have explored various low-carbon fuels, such as natural gas (NG), recycled top gas in a blast furnace, and coke oven gas (COG), which are classified as hydrogen-rich gas (HRG). HRG can be injected into a blast furnace through two main strategies: shaft injection and tuyere injection [1]. Tuyere injection is a more practical method than shaft injection because shaft injection typically involves extensive retrofitting of the existing blast furnace infrastructure. Accordingly, this study focused on the more practical tuyere injection method. The combustion behavior of HRG injected into the raceway through the tuyere injection method differs considerably from the conventional PC injection method. Therefore, the efficiency and operational safety of HRG injection in blast furnace ironmaking should be comprehensively assessed.
The tuyere is a crucial component of a blast furnace. This component delivers hot air or fuel to the furnace, providing the oxygen and reducing gases required for smelting. However, because H2 is highly reactive and ignites easily, injecting HRG through the tuyere may cause local overheating, which can increase the thermal load on the tuyere [2]. Damage to the tuyere can directly affect the stable operation and productivity of the blast furnace. Therefore, investigating the combustion behaviors of HRG and PC in the raceway as well as the effects of these behaviors on the temperature and thermal load on the tuyere is essential for ensuring reliable long-term furnace operation.
Temperatures in the lower part of a blast furnace are extremely high. Hence, conducting direct measurements and analysis by using experimental tools in this region is highly challenging. Computational fluid dynamics (CFD) is an effective and practical simulation tool for clearly understanding the combustion behaviors of PC and HRG in the raceway and for evaluating the thermal load on the tuyere. CFD simulations facilitate predictions of changes in flow, combustion behavior, heat transfer, and tuyere temperature under different fuel injection conditions, such as changes in the mass flow rates of HRG and PC, adjustments to the oxygen enrichment level in the hot blast, and the injection of different types of HRG (e.g., natural gas, COG, or hydrogen-enriched gases). These predictions offer useful technical support for improving blast furnace operation and encouraging the use of low-carbon fuels.
Several research groups have conducted CFD simulations to investigate how HRG injection affects combustion in blast furnaces. For example, Yeh et al. [3] performed a three-dimensional simulation to examine the flow and combustion behaviors during the simultaneous injection of PC and blast furnace gas (BFG) into the blowpipe–tuyere–raceway area. They explored the effects of different lance designs, BFG types, and BFG flow rates on pressure drop and combustion performance. Their results revealed that BFG mixed with oxygen in the tuyere and formed a premixed flame, which caused earlier ignition and led to an increase in pressure and turbulence in this area. In addition, when more BFG was added, oxygen was consumed more quickly, which further slowed down PC combustion and reduced burnout. Zhang et al. [4] conducted a three-dimensional numerical simulation to examine the influence of the coinjection of NG and PC on the combustion zone in a blast furnace. Their findings indicated that NG–PC coinjection increased the local temperature near the tuyere. As the NG injection rate was increased from 0 to 34.5 m3/t, the burnout rate of PC decreased from 68.11% to 64.12%, primarily because of the higher oxygen consumption during hydrogen combustion, which prevented the complete burnout of char. Moreover, they observed that NG combustion increased the hydrogen concentration and decreased the CO content in the gas phase, thereby contributing to a potential reduction in CO2 emissions. In a follow-up study, Zhang et al. [5] explored the effects of different HRGs, namely H2, NG, COG, and recycled top gas, on the combustion zone in a blast furnace. Their findings revealed that among the considered HRGs, COG caused the earliest ignition, with the ignition occurring closest to the tuyere. Furthermore, it offered a more balanced CO/H2 ratio than did the other HRGs, which helped maintain a more stable reducing gas composition. They concluded that optimizing the ratio and injection method of HRGs can enhance furnace performance and support carbon reduction efforts. Liu et al. [1] conducted a simulation study on the coinjection of H2 and PC, reporting that when the H2 injection rate reached 4000 Nm3/h, the average temperature in the raceway increased from 2003 to 2042 K. As the H2 injection rate was further increased, the concentration of reducing gases (H2 + CO) in the raceway increased, contributing to a reduction in CO2 emissions from the blast furnace. However, Li et al. observed that excessive hydrogen injection reduced the combustion zone temperature and affected combustion stability. Okosun et al. [6] investigated the coinjection of NG and PC. They noted that NG combustion occurred near the tuyere wall, which increased the local temperature. Consequently, some PC remained unburned within the raceway, potentially increasing the resistance of the coke bed. In addition, using NG as the carrier gas instead of nitrogen considerably accelerated the devolatilization of PC, thereby enhancing combustion kinetics. However, excessive NG injection could cause pressure fluctuations, which may negatively affect the operational stability of a furnace. Ren et al. [7] explored the effects of varying hydrogen content levels on the combustion zone in a blast furnace. Their results indicated that increasing the hydrogen content from 20% to 80% raised the PC burnout rate from 83.2% to 86.8%. Hydrogen combustion accelerated volatile release from PC, advanced the ignition point, and considerably altered the CO/H2 ratio. Specifically, the inlet CO/H2 molar ratio varied from 8:2 to 2:8, leading to corresponding outlet ratios of 54:46 and 24:76. The highest reduction efficiency was achieved at 80% hydrogen content (CO/H2 = 2:8), resulting in a PC burnout rate of 86.8%. They also revealed that hydrogen injection enhanced the water–gas reaction (C + H2O → CO + H2) within the combustion zone, leading to increased H2O generation and reduced CO2 formation, which in turn altered the composition of the reducing gases. Additionally, higher hydrogen content levels resulted in a slight decrease in the peak temperature in the raceway, suggesting that excessive hydrogen may have a negative effect on combustion stability.
To evaluate the thermal load on blast furnace tuyeres, Borjoui Raky et al. [8] investigated the effects of water cooling systems with different designs on heat transfer and cooling efficiency. They demonstrated that a helical cooling configuration was more effective than a conventional cooling system design in directing water toward high-temperature areas. The enhanced water transfer ability of the helical cooling system configuration decreased the tuyere body temperature and substantially reduced the risk of thermal damage. Chatterjee et al. [9] examined the effects of the design and structural optimization of tuyere cooling systems on their service life. By using fiber Bragg grating sensing technology to monitor operating conditions, they detected local temperatures of up to 496 °C, which is considerably higher than the copper creep limit of 406 °C. Such local temperatures led to reduced mechanical strength and structural deformation. Their analysis indicated that conventional cooling channel designs can lead to local water stagnation, which reduces heat transfer efficiency. Through a numerical simulation, they confirmed that an improved design reduced localized temperatures by approximately 40 °C and helped prevent water boiling within the cooling circuit. Zhu et al. [10] conducted a numerical simulation using Ansys to evaluate how the structural optimization of the wear-resistant layer of a tuyere influences its thermal and stress fields. Their results indicated that the use of an annular wear-resistant coating design reduced the average temperature of the coating by 24 K and decreased the heat loss by 16.7%, which resulted in lower fuel consumption in the furnace. Furthermore, the new design decreased the maximum thermal stress from 624.98 to 427.99 MPa, which represents a 31.5% reduction. This improvement extended the service life of the tuyere. Chen et al. [11] explored the influence of the copper content of Ni60A wear-resistant coatings on the temperature distribution of a blast furnace tuyere. As the copper content increased, the thermal conductivity of the coating also increased, resulting in a gradual decrease in the surface temperature. However, when the copper content exceeded 40%, the internal temperature of the tuyere became higher than that in the uncoated case, suggesting that excessive copper can reduce the coating’s thermal insulation performance. They recommended maintaining a copper content of less than 40% for wear-resistant coating on the tuyere to balance thermal conductivity and durability, thereby improving the thermal stability and extending the service life of the tuyere.
According to a review of the literature, most CFD-based studies on the distribution of tuyere temperature have primarily focused on the thermal load from the hot blast while neglecting the additional heat generated by the combustion of PC or HRG. Considering the high reactivity and low ignition threshold of HRG, its direct injection through the tuyere can result in rapid combustion near the wall surface, leading to localized temperature spikes. Studies have indicated that such localized heating may elevate the thermal load on the tuyere, potentially necessitating cooling system optimization to avoid structural damage [2]. Therefore, the combustion behaviors of HRG and PC in the raceway and the resulting thermal effects of these behaviors on the tuyere must be comprehensively investigated to ensure the safety and long-term stability of blast furnace operations.
To comprehensively assess the effect of HRG combustion on the thermal load on a tuyere, this study developed a fully coupled fluid–thermal–solid CFD model of the lower part of a blast furnace. This model includes the lance, blowpipe, tuyere, and raceway, thus enabling a detailed numerical analysis of the combustion and heat transfer characteristics in the lower region of the blast furnace. The model was used to systematically examine the effects of different operating conditions on raceway combustion and tuyere temperature. The results of this study can serve as a valuable reference for optimizing blast furnace operations and promoting the use of low-carbon combustion technologies.
2. Model Description
2.1. Geometric Model and Operating Conditions
A three-dimensional CFD model of the lance–blowpipe–tuyere–raceway region of the blast furnace was developed based on actual industrial dimensions (1:1 scale), as shown in Figure 1. The model includes the blowpipe, tuyere, lance (for PC injection), HRG injection port, raceway, and tuyere cooling channel, enabling a comprehensive simulation of the flow characteristics, heat transfer behavior, and chemical reactions in the tuyere–raceway zone. Table 1 presents a summary of the operating conditions for the hot blast, PC, carrier gas, cooling medium, and the HRG used in the simulation, namely COG. The domain geometry and boundary conditions were defined on the basis of actual operating data from an industrial blast furnace to ensure the accuracy and engineering relevance of the simulation.
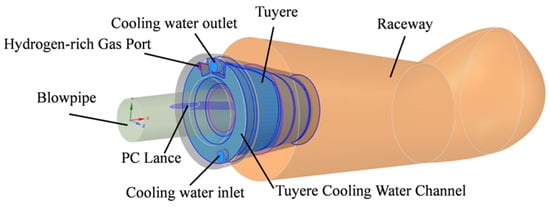
Figure 1.
Physical geometry of simulation model.

Table 1.
Operating condition of blast furnace.
Table 2 presents the proximate and ultimate analysis data for the PC used in the simulation. The particle size ranged from 20 to 90 µm, with 45 µm being the dominant size fraction (55 wt%). The distribution of 20 µm (15 wt%), 45 µm (55 wt%), 63 µm (25 wt%), and 90 µm (5 wt%) was based on actual industrial operation data obtained from a commercial blast furnace. Table 3 provides a summary of the composition of COG. This gas mainly contained H2 (~56 wt%) and CH4 (~22 wt%).
Table 2.
Composition of PC.
Table 3.
Composition of injected COG.
Four injection scenarios (Cases 1–4) were simulated in this study to evaluate the effects of COG on the combustion behavior in the blast furnace and the thermal load on the tuyere. Case 1 involved only PC injection, and Case 3, serving as the baseline case, involved the coinjection of PC and COG. Cases 2 and 4 were derived from Case 3 by reducing and increasing the COG flow rate by 20%, respectively, to assess the sensitivity of combustion and heat transfer characteristics to COG flow rate. These cases provided a systematic basis for analyzing how COG proportion affects raceway combustion behavior, PC burnout, and thermal load distribution on the tuyere.
To ensure computational efficiency while maintaining acceptable accuracy, the following assumptions and simplifications were applied in the simulation:
- 1.
- The geometry and dimensions of the raceway were considered constant, without accounting for structural deformation.
- 2.
- Reactions involving coke were excluded.
- 3.
- PC particles were assumed to be spherical and to have a constant size distribution during the injection process.
- 4.
- Interactions among PC particles were neglected, with only the heat transfer and chemical reactions between the PC particles and the gas phase being considered.
These simplifications were adopted to improve computational efficiency and to focus on the dominant combustion and heat transfer phenomena in the tuyere–raceway region. However, they may introduce minor deviations in the quantitative results. In particular, excluding coke reactions could slightly overestimate the combustion efficiency and local temperature because the endothermic gasification reactions of coke were not considered. The assumption of a fixed raceway geometry may affect the local temperature gradient near the raceway boundary, while neglecting interparticle interactions could marginally influence the residence time of PC particles. Nevertheless, since all simulated cases were performed under identical geometric and boundary conditions, these simplifications are not expected to alter the comparative trends or main conclusions of this study.
2.2. Governing Equations
To accurately simulate the flow, heat transfer, and combustion phenomena induced by the coinjection of PC and COG in the blast furnace raceway, this study used the Ansys Fluent software 2022R1 [12]. Ansys Fluent offers robust capabilities for modeling turbulent combustion and is widely applied in simulations of multiphase flow and reaction kinetics.
The fluid phase was modeled using the Reynolds-averaged Navier–Stokes equations; the standard k-ε turbulence model was adopted to characterize the strong turbulence within the furnace. Moreover, the discrete-phase model was employed to describe the motion, combustion, and gasification of PC. The governing equations are summarized in Table 4.
Table 4.
Summary of the governing equations.
Three mechanisms were considered in the heat transfer model of the blast furnace: convection, radiation, and solid conduction. The P-1 radiation model was used to simulate radiative heat transfer because of its low computational cost and its effectiveness in handling complex radiative problems. The thermal behavior of the tuyere was modeled using Fourier’s law of heat conduction. Finally, a conjugate heat transfer (CHT) model was adopted to simulate solid conduction because the tuyere is influenced by both heat removal through internal cooling water channels and exposure to high-temperature gas within the cavity. This model couples solid conduction with external convective heat transfer, allowing for a more accurate prediction of the thermal load distribution on the tuyere.
2.3. Chemical Reactions
The GRI-Mech 3.0 mechanism [13,14] was used to model gas-phase combustion reactions, and the eddy dissipation concept was adopted to describe turbulent combustion. The GRI-Mech 3.0 mechanism has been extensively validated for temperatures ranging from 300 to 2500 K, which encompasses the entire temperature range encountered in blast furnace tuyere-raceway systems (typically 300–2400 K). Previous studies have successfully applied this mechanism to similar COG injection conditions with peak temperatures exceeding 2400 K [7], confirming its suitability for the current application. To balance computational time cost and accuracy, a simplified version of the GRI-Mech 3.0 mechanism was adopted. This simplified mechanism reduces the original GRI-Mech 3.0 mechanism, which consists of 354 reactions and 53 species, to 135 reactions and 25 species. It retains key reaction pathways, including methane pyrolysis, hydrogen oxidation, and carbon monoxide oxidation, while considerably improving computational efficiency.
The combustion of PC involves two main stages: (1) devolatilization and (2) char combustion and gasification.
- Devolatilization: The two-competing rate model [15,16] was employed to simulate the thermal decomposition behavior of PC under different temperature conditions. This model captures the parallel release of volatile matter through two distinct kinetic pathways, one corresponding to a low-temperature regime and another corresponding to a high-temperature regime.
- Char combustion and gasification: The multisurface reaction model [17,18] was used to simulate the heterogeneous reactions between char and gas-phase species, including oxidation and gasification. The kinetic parameters for these reactions, including pre-exponential factors (A) and activation energies (E), were adopted from validated studies on blast furnace PC combustion [4,5]. The detailed chemical reactions and kinetic parameters are provided in Table 5.
Table 5. Key reactions and its mechanism for char combustion and gasification, adapted from refs. [4,5].
2.4. Model Validation
Numerical simulations have been extensively used to analyze the combustion behavior in the raceway of blast furnaces. Most relevant studies have modeled the combustion process by using a simplified single-step methane reaction mechanism [4,5,19], whereas some have employed more detailed mechanisms involving up to 28 reaction steps [2]. The selected combustion model can substantially influence the accuracy of simulation results. Accordingly, the present study compared two combustion models and validated them by using experimental data to assess their applicability and predictive performance.
A 300 kW burner engineering research laboratory (BERL) combustion furnace was used as the benchmark for model validation in this study (Figure 2) [20]. The actual BERL furnace is equipped with 24 natural-gas nozzles arranged circumferentially around the burner centerline to ensure uniform fuel distribution. Because of the axisymmetric configuration of the burner, the computational domain for validation was simplified to a two-dimensional axisymmetric model, which effectively represents the azimuthally symmetric flow field generated by the 24 nozzles while reducing computational cost. Adjustable swirl vanes guided incoming air to generate a strong swirling flow, thereby enhancing fuel–air mixing and improving combustion stability.
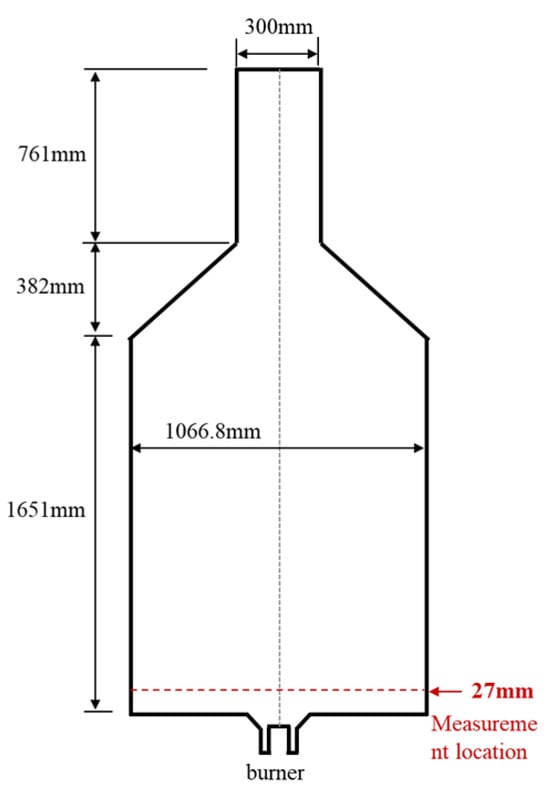
Figure 2.
Two-dimensional axisymmetric computational domain of the 300 kW BERL burner furnace used for model validation. The actual furnace contains 24 fuel nozzles arranged circumferentially around the burner centerline, which are represented in the axisymmetric model as an equivalent annular fuel injection, adapted from ref. [20].
The combustion conditions were set on the basis of data from the literature [20]. The adopted fuel primarily consisted of methane (CH4, 96.5%) along with small quantities of nitrogen (N2) and ethane (C2H6). Air was injected at an average axial velocity of 31.35 m/s and a swirl velocity of 20.97 m/s, whereas NG was injected radially at a velocity of 157.25 m/s.
The simulation model was validated against experimental data by using two combustion mechanisms: a simplified version of the GRI-Mech 3.0 mechanism (i.e., GRI-Mech 25sp mechanism) and a four-step methane combustion mechanism (i.e., four-step mechanism). The reaction scheme of the four-step mechanism (Table 6) was adopted from the study of Yan et al. [20].
Table 6.
Four step golbal mechanism for CH4 combustion, adapted from ref. [20].
3. Results and Discussion
3.1. Simulation Results and Experimental Validation
Figure 3 presents a comparison of the simulation results with the experimental data. The detailed raw data for Figure 3 are provided in the Supplementary Materials. The experimental temperature data were obtained from the raw measurements reported in Ref. [20], and all available data points were processed through interpolation to obtain uniformly spaced values for consistent comparison. The simulated temperature data for both combustion mechanisms were extracted from the discrete computational grid and interpolated at the same radial positions. In total, 10 equally spaced points were selected within the radial range of 0.05–0.5 m for the quantitative comparison.
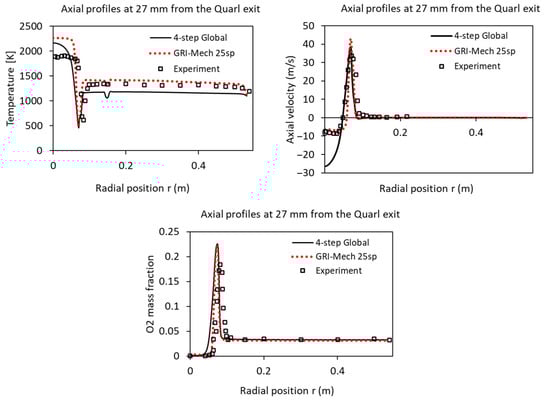
Figure 3.
Validation of Simulation Results Through Comparison with Experimental Data.
The temperature predictions obtained using the GRI-Mech 25sp mechanism exhibited higher consistency with the experimental measurements than did those acquired using the four-step mechanism. On the basis of an evaluation of 10 equally spaced points within a range of 0.05–0.5 m of the radial position, the average temperature prediction errors obtained for the GRI-Mech 25sp and four-step mechanisms were 7.1% and 11.2%, respectively. These results indicate that the GRI-Mech 25sp mechanism provided a more accurate representation of the temperature variations within the combustion zone than the four-step mechanism.
The axial velocity and O2 mass fractions predicted using both combustion mechanisms showed good agreement with the experimental results, which confirmed the reliability of the numerical model. Overall, the GRI-Mech 25sp mechanism was associated with higher accuracy in temperature prediction; therefore, this mechanism was selected for all subsequent simulations in the present study to ensure the fidelity of combustion modeling.
The 300 kW BERL combustion furnace was used to validate both the chemical reaction mechanism (GRI-Mech 3.0 simplified scheme) and the predictive accuracy of two combustion models employed in this study. The numerical temperature profiles obtained using the GRI-Mech 25sp mechanism and a four-step global mechanism were compared with experimental data to evaluate model performance. Although the BERL setup differs from an industrial blast furnace in terms of pressure, and temperature, this validation was intended to verify the combustion mechanism and model accuracy rather than to reproduce the full-scale furnace geometry. Accordingly, the results should be interpreted as a mechanism- and model-level validation.
3.2. Gas Temperature and Pressure Distribution
The numerical simulation results indicated that when PC was injected at ambient temperature (approximately 300 K) into high-temperature hot blast flow, a low-temperature zone initially formed inside the tuyere. As the PC particles were heated and began to combust, the temperature increased gradually (Figure 4a). The addition of COG caused ignition to occur earlier, with combustion being initiated within the tuyere and causing a rapid local temperature rise (Figure 4c). This phenomenon was mainly attributed to the high concentrations of H2 and CO in COG, both of which exhibited high reactivity at elevated temperatures, leading to earlier thermal energy release.
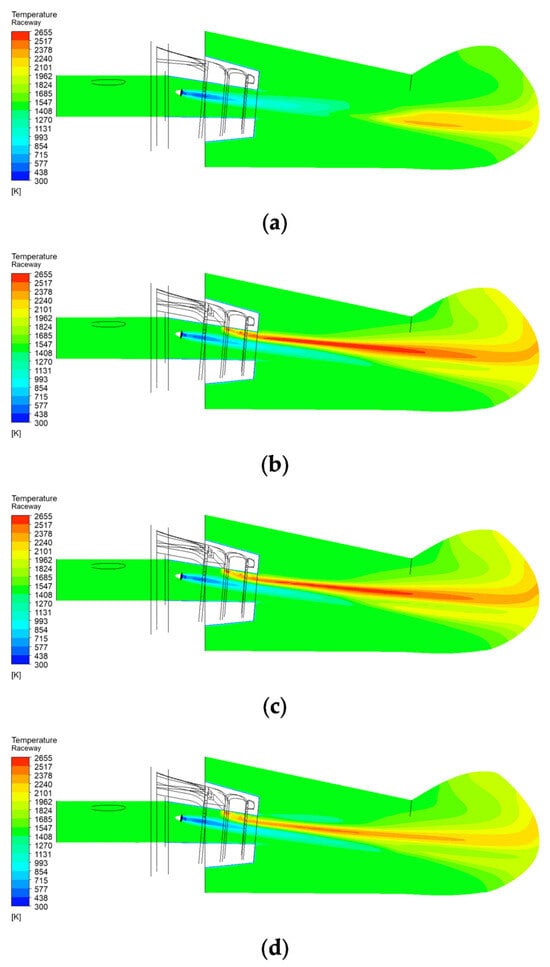
Figure 4.
Raceway temperature distribution. (a) Case 1, (b) Case 2, (c) Case 3, (d) Case 4.
As displayed in Figure 4, the size of the combustion zones varied considerably under different COG flow rate conditions. Compared with Case 1 (without COG injection), Cases 2 and 3 involved the formation of larger combustion regions with broader high-temperature zones. However, in Case 4, which involved the highest COG flow rate among all cases, the combustion region became narrower, and the maximum temperature within the high-temperature zone was reduced. These results suggest that when the COG flow rate exceeds a certain threshold, combustion becomes constrained, which affects combustion efficiency and temperature distribution.
The aforementioned trend was validated by the raceway temperature analysis results (Figure 5). The average temperatures shown in Figure 5b were obtained as volume-weighted averages over the entire gas-phase flow field in the 3D computational domain, including both the high-temperature combustion core and the surrounding lower-temperature regions. After the addition of COG, the average and peak temperatures in the raceway increased substantially because of the greater heat release from COG combustion and the expansion of the combustion zone. However, the overall temperature in the raceway was lower in Case 4 than in Cases 2 and 3, indicating that excessive COG injection may compromise combustion stability and alter the resulting thermal distribution.
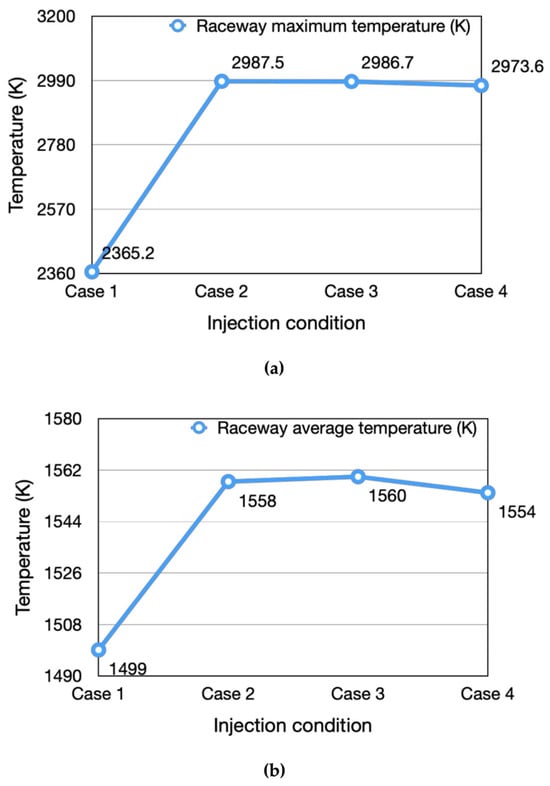
Figure 5.
Raceway temperature. (a) maximum temperature, (b) average temperature.
The influence of COG flow rate on combustion temperature can be attributed to several factors. First, as the flow rate of COG increases, its diffusivity decreases, reducing its interaction time with oxygen in the hot blast; thus, the combustion efficiency declines. Moreover, because COG is injected at ambient temperature, an increase in the injection rate increases the amount of thermal energy required to preheat the gas to its ignition temperature. These findings suggest that at a high COG flow rate, combustion behavior is influenced by diffusion limitations and thermal transport effects, resulting in changes in temperature distribution within the raceway.
In this study, the internal pressure within the tuyere increased considerably with COG injection (Figure 6 and Figure 7), rising further with an increase in the COG flow rate. It should be clarified that the pressure values presented in Figure 6 and Figure 7 represent gauge pressure (atm) relative to the outlet pressure, whereas the absolute operating pressure of the blast furnace is approximately 4.5 atm. The overall pressure drop across the tuyere–raceway system, ranging from 0.26 atm to 0.35 atm (≈26–35 kPa), is consistent with the typical industrial range of 20–50 kPa. This phenomenon primarily occurred because of the increased total gas volume introduced into the tuyere, which altered the local gas-phase dynamics in the combustion zone. Moreover, the volume of gas produced through COG combustion exceeded the volume of the injected gas, resulting in an expansion that further increased the pressure during combustion. The pressure distribution indicated that the upper half of the blowpipe experienced higher pressures than its lower half, which was attributable to the injection of COG from the upper section of the tuyere, resulting in local pressure accumulation. As the COG flow rate increased, this effect became more pronounced, leading to additional pressure accumulation in the tuyere and raceway.
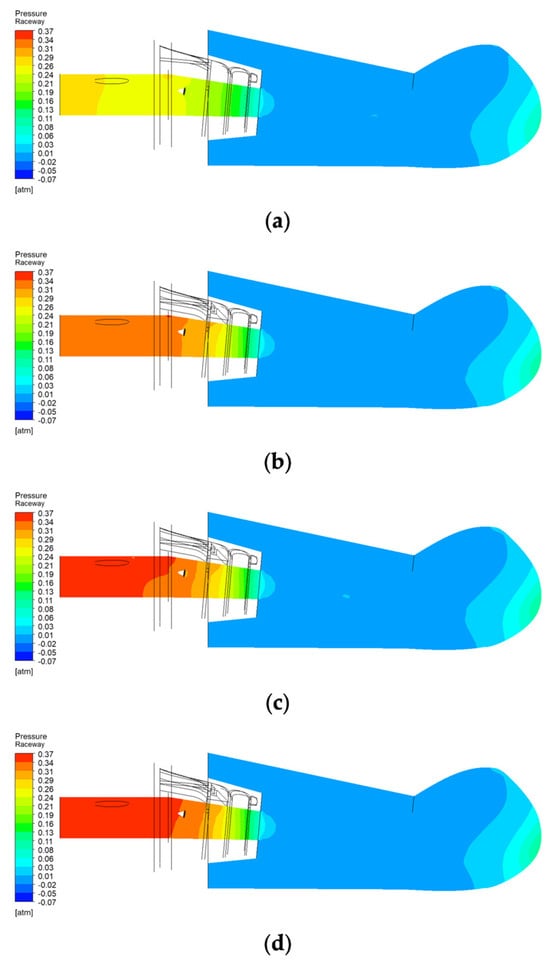
Figure 6.
Gauge pressure distribution (atm). Operating pressure: 4.5 atm (absolute). (a) Case 1, (b) Case 2, (c) Case 3, (d) Case 4.
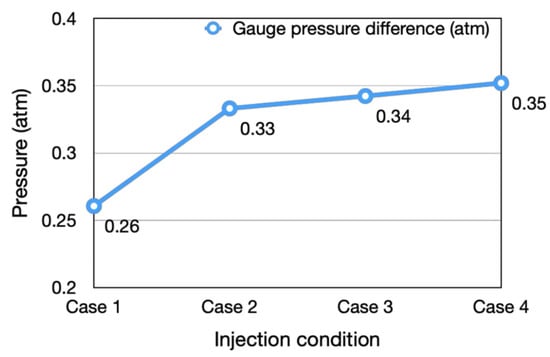
Figure 7.
Gauge pressure difference.
3.3. Combustion Behavior of PC
Figure 8 illustrates the combustion stages of PC particles with different diameters in Case 1. In this figure, the blue, yellow, and red regions denote the heating and cooling stages, devolatilization stage, and char combustion stage, respectively. As displayed in Figure 8, PC particles with diameters of 20 and 45 µm almost underwent complete combustion before exiting the raceway. By contrast, PC particles with diameters of 63 and 90 µm retained a portion of unburned char at the raceway outlet.
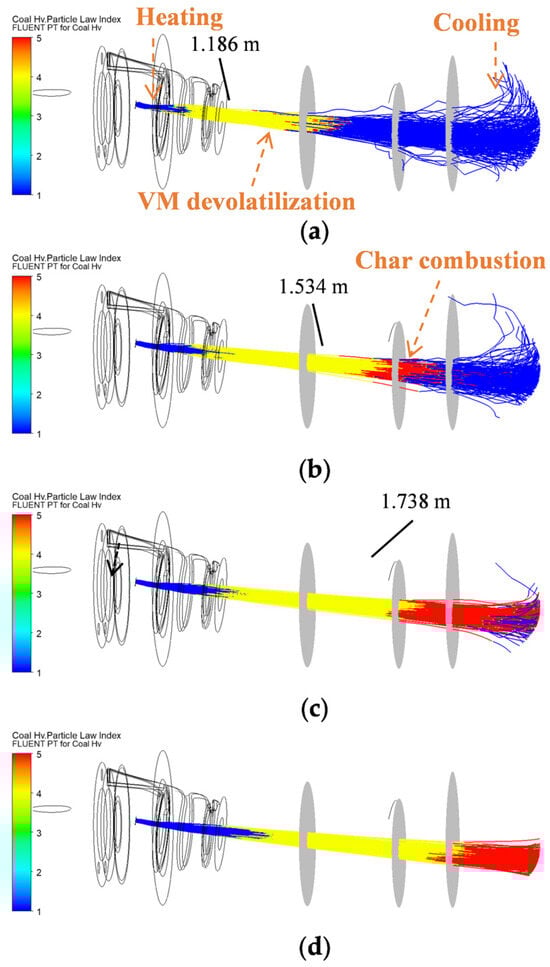
Figure 8.
Particle law index of Case 1. (a) 20 µm, (b) 45 µm, (c) 63 µm, (d) 90 µm.
Figure 9 depicts the combustion behaviors of 45 µm PC particles in the four simulation cases. A comparison of Case 3 (co-injection of PC and COG) and Case 1 (only PC injection) indicated that the addition of COG led to the faster heating of PC particles located near the COG streamlines (highlighted by green arrows in Figure 9c). Consequently, the devolatilization rate of volatile matter increased, and the PC particles entered the char combustion stage earlier. However, near the outer boundary of the raceway, some PC particles remained in the char combustion stage and were not fully burned before leaving the domain. A qualitative comparison of the results presented in Figure 9c,d suggested that with more unburned char existed near the raceway periphery in Case 4 than in Case 3.
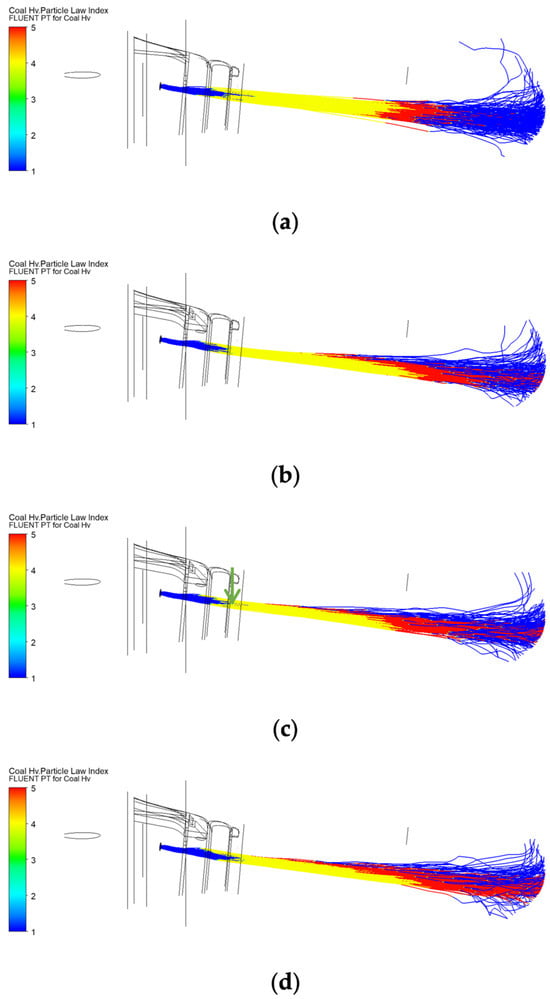
Figure 9.
Particle law index of 45 µm diameter. (a) Case 1, (b) Case 2, (c) Case 3, (d) Case 4.
The changes noted in the initial combustion behavior of PC could be attributed to the rapid combustion of COG. Upon injection into the tuyere, COG ignited rapidly, generating a localized high-temperature region. This temperature rise accelerated heat absorption by nearby PC particles, increased their heating rate, and promoted the release of volatiles, thereby causing PC to enter the char combustion stage earlier. However, in the later stages of combustion, the presence of COG negatively affected the burnout efficiency of PC.
The underlying physical mechanisms for reduced PC burnout with COG injection can be further explained through oxygen-distribution analysis (Figure 10 and Figure 11). The radial oxygen profiles reveal two critical phenomena: (1) COG combustion creates an oxygen-depleted zone near the tuyere centerline, where the O2 concentration drops below 5%, and (2) this forces PC particles to compete for oxygen in the peripheral regions. The altered reaction pathways include the shift from fast char–O2 oxidation (C + O2 → CO2) to slower gasification reactions (C + CO2 → 2 CO and C + H2O → CO + H2) in oxygen-starved zones, fundamentally changing the combustion kinetics.
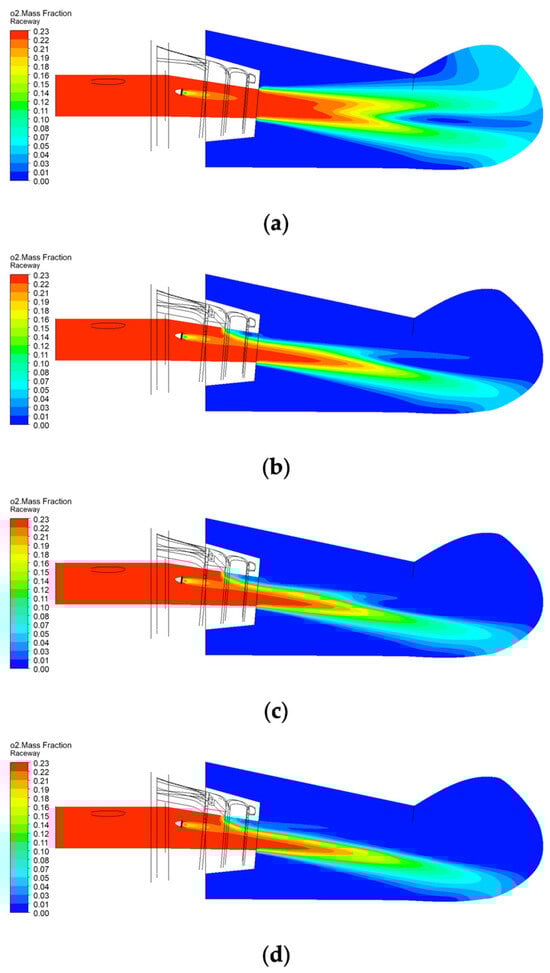
Figure 10.
Oxygen distribution. (a) Case 1, (b) Case 2, (c) Case 3, (d) Case 4.
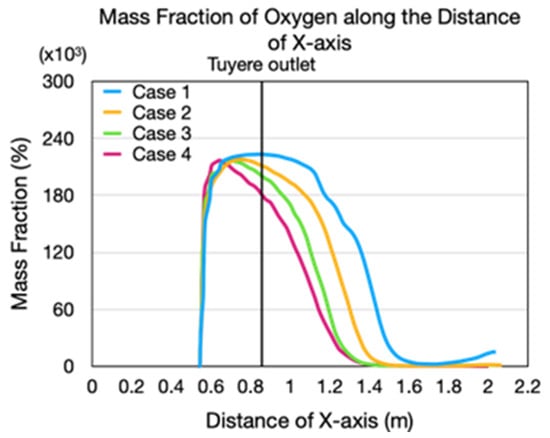
Figure 11.
Mass fraction of oxygen along the distance of X-axis.
Furthermore, the presence of COG increased the overall gas velocity in the combustion zone. Consequently, the residence time of PC particles in the raceway was shortened, limiting the completion of combustion reactions before PC particles exited the raceway. The shortened residence time also contributed to an overall decrease in PC burnout. Figure 12 displays the burnout rates of PC particles with varying diameters in the four simulation cases. As illustrated in Figure 12a, the burnout rate consistently decreased with increasing particle size in all cases. Figure 12b presents a summary of the average burnout rates in the four cases. The burnout rate in Case 1 reached 93.3%, and the addition of COG in Case 3 reduced this rate to 81.8%, suggesting that the decrease in combustion efficiency in Case 3 was mainly caused by intensified oxygen competition and a shortened residence time for PC particles. Moreover, the burnout rates in Cases 2 and 3 were relatively similar. However, the increased COG flow rate in Case 4 resulted in a further decrease in the burnout rate. This thus implies that excessive COG injection not only restricts oxygen availability but also alters the thermal distribution in the combustion zone, ultimately reducing combustion efficiency.
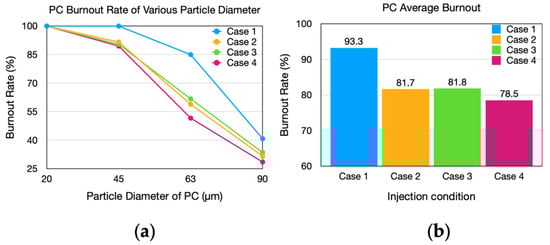
Figure 12.
PC burnout rate. (a) Various particle diameter. (b) Various cases.
The size-dependent burnout behavior correlates directly with spatial variations in the velocity and oxygen-concentration fields. Smaller particles (20–45 µm) with lower inertia closely follow gas streamlines, maintaining proximity to oxygen-rich regions along their trajectories. Conversely, larger particles (63–90 µm) with higher inertia penetrate deeper into the raceway, where oxygen is rapidly depleted (Figure 11), experiencing both lower oxygen availability and shorter residence times. This spatial-segregation effect is amplified by COG injection, which creates steeper oxygen gradients across the raceway cross-section.
The combustion behavior of PC was noted to be strongly influenced by particle size. Smaller particles tended to burn out earlier, whereas larger ones combusted more slowly and released heat over a broader spatial range. The introduction of COG changed this combustion pattern. In the upstream combustion zone, the additional thermal energy released through COG combustion increased the heating rate of PC particles, thereby accelerating the reaction rate and promoting earlier ignition. However, in the downstream region, COG intensified oxygen competition and shortened the residence time of the PC particles. These two phenomena collectively restricted the combustion efficiency of larger particles and decreased the overall burnout rate. As the COG flow rate increased excessively, its impact on combustion behavior became more pronounced. These results underscore the importance of appropriately controlling the COG flow rate to optimize PC combustion performance.
3.4. Thermal Load on the Tuyere and Cooling Optimization
In blast furnace operations, when only PC is injected, ignition primarily occurs within the raceway. However, with the addition of COG, the high reactivity of hydrogen causes the ignition point to shift upstream to a location inside the tuyere. This shift raises a crucial safety concern: whether the combustion behavior of COG increases the thermal load on the tuyere, potentially causing overheating and structural damage.
To examine the influence of COG injection on tuyere temperature, this study simulated heat transfer within the tuyere by employing a CHT model. The three- and two-dimensional temperature distributions for the tuyere are displayed in Figure 13 and Figure 14, respectively. In Case 1 (injection of only PC), high-temperature regions were primarily concentrated at the nose and lower portion of the tuyere. The elevated temperatures at the nose were attributed to heat transfer resulting from combustion in the raceway. Furthermore, the localized heating in the lower region was possibly caused by thermal accumulation resulting from a nonuniform cooling water flow. In Cases 2–4 (coinjection of PC and COG), the combustion of COG was expected to increase the temperature along the upper wall of the tuyere. However, the simulation results indicated that the upper wall temperatures in Cases 2–4 were not significantly higher than those in Case 1. Figure 15 presents the gas temperature distribution near the upper wall of the tuyere. The streamlines of COG (denoted by gray lines in Figure 15) indicated that although COG ignited inside the tuyere to generate a high-temperature zone, a layer of unburned low-temperature gas persisted along the upper wall. This layer effectively insulated the tuyere wall from the surrounding high-temperature region, which explains why the upper wall temperature did not increase significantly. In addition, an examination of the internal temperature distribution within the tuyere revealed a notable temperature decrease in the lower region (Figure 14). This trend was likely associated with COG-injection-induced changes in the gas flow field. When COG was introduced through the injection port, its slightly downward flow shifted the trajectory of the PC stream toward the lower part of the tuyere. Because PC and its carrier gas were injected at relatively low temperatures, their downward motion produced a convective cooling effect, which led to a local temperature reduction in the aforementioned region.
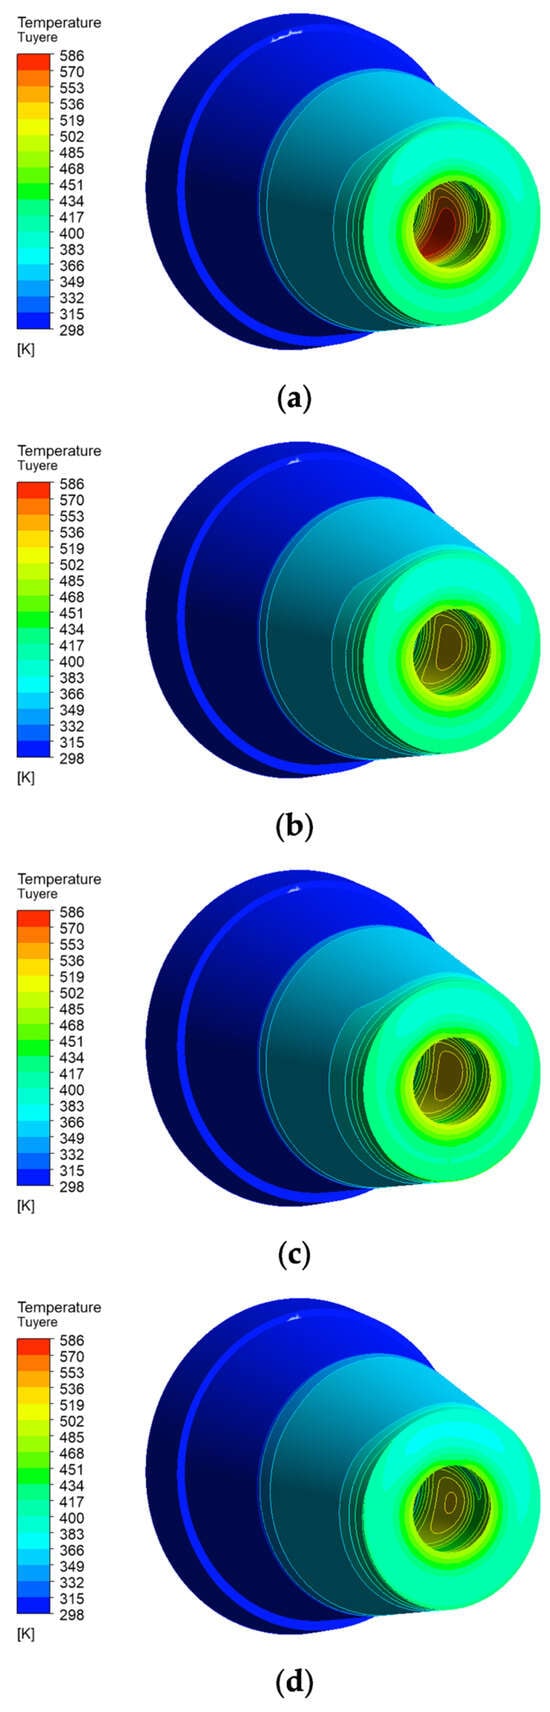
Figure 13.
Temperature distribustion of solid tuyere in 3-dimesinal view. (a) Case 1, (b) Case 2, (c) Case 3, (d) Case 4.
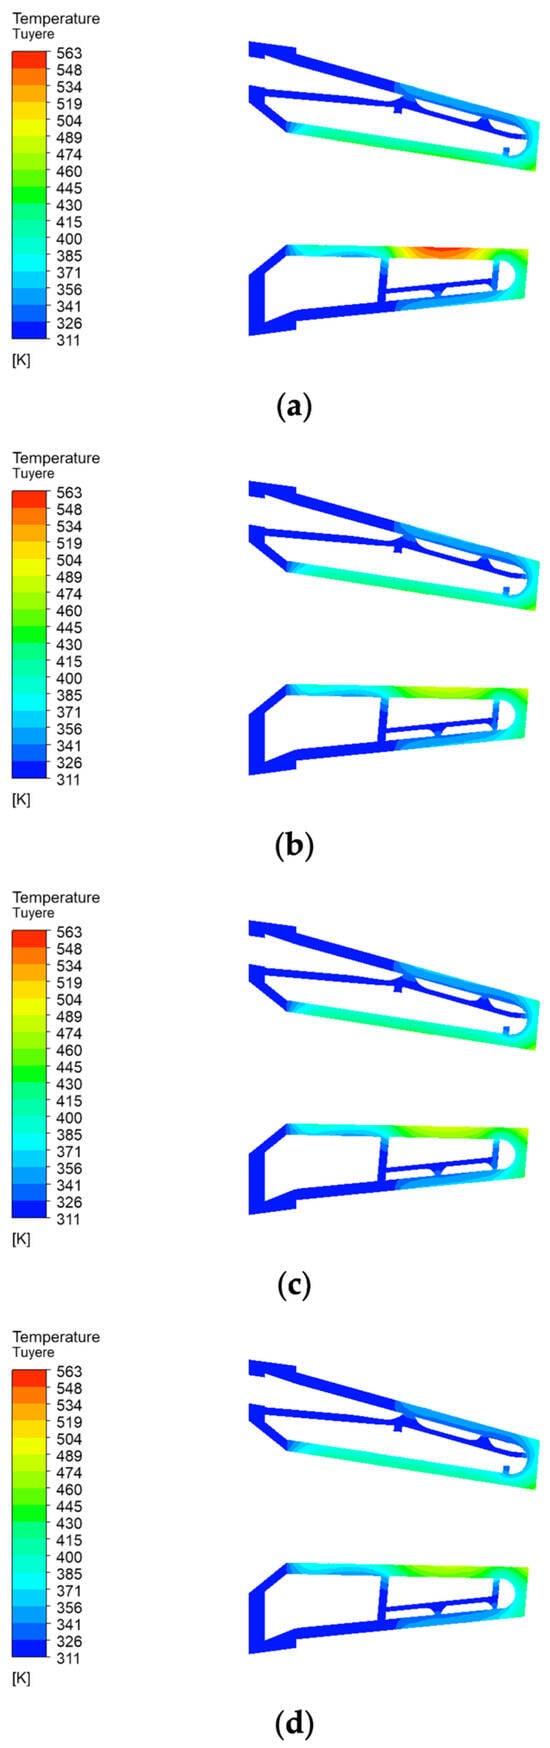
Figure 14.
Temperature distribution of solid tuyere. (a) Case 1, (b) Case 2, (c) Case 3, (d) Case 4.
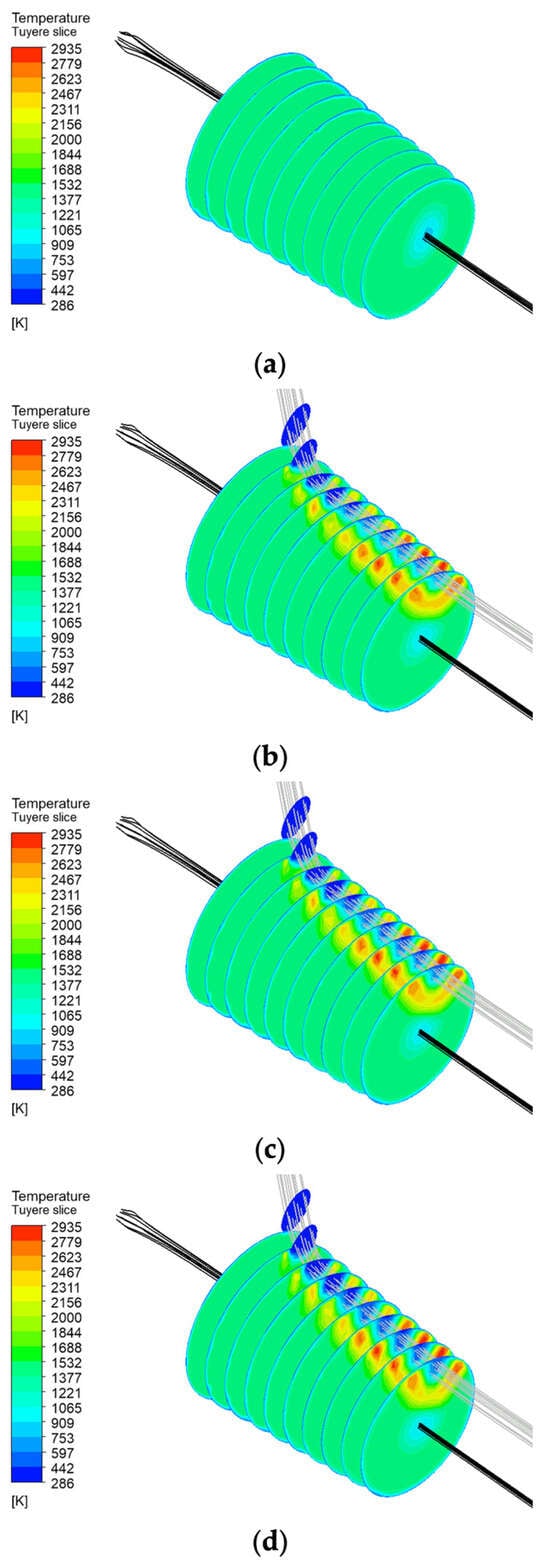
Figure 15.
Temperature distribution inside the tuyere. (a) Case 1, (b) Case 2, (c) Case 3, (d) Case 4.
Figure 16 illustrates the trend of the maximum tuyere temperature in the four simulation cases. The highest maximum tuyere temperature occurred in Case 1. In contrast to expectations, the introduction of COG led to a decrease in the maximum tuyere temperature. Previous concerns regarding COG injection have mainly centered on its potential to cause localized overheating. However, the results of the present study suggest that COG addition may reduce the thermal load on the tuyere. This phenomenon can be explained by two key factors. First, a layer of unburned COG flows along the upper wall of the tuyere, forming a low-temperature gas layer that suppresses conductive heat transfer in this region. Second, because of the high velocity of the COG stream, its entry at ambient temperature into the tuyere channel enhances convective cooling by removing heat from the internal surface of the tuyere. These effects were most pronounced in Case 4, in which the highest COG flow rate was applied. Thus, the tuyere exhibited the largest temperature reduction in Case 4. Two mechanisms likely contributed to this outcome. First, the increased COG flow rate strengthened convective cooling and reduced the overall thermal load. Second, the increased COG flow rate resulted in a greater downward shift in the trajectory of the PC stream, which enhanced convective cooling in the lower tuyere region.
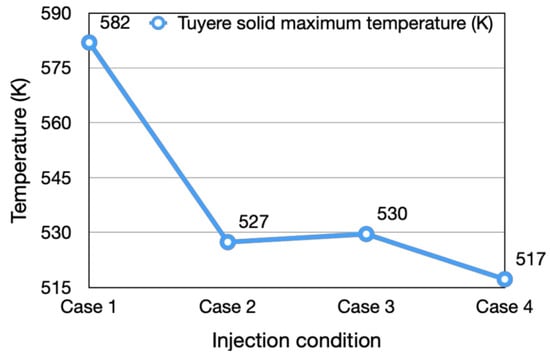
Figure 16.
Tuyere solid maximum temperature.
In Case 1, a localized high-temperature region was observed along the lower wall of the tuyere, which was attributable to the nonuniform distribution of cooling water. To reduce this localized heating, the design of the cooling water channel was optimized. As illustrated in Figure 17, a flow-guiding structure was incorporated into the cooling channel to mitigate local heat accumulation and enhance heat transfer efficiency. This optimized configuration effectively eliminated the hotspot in the lower tuyere region and improved overall cooling performance. Consequently, the tuyere could maintain stable thermal performance even under COG injection conditions.
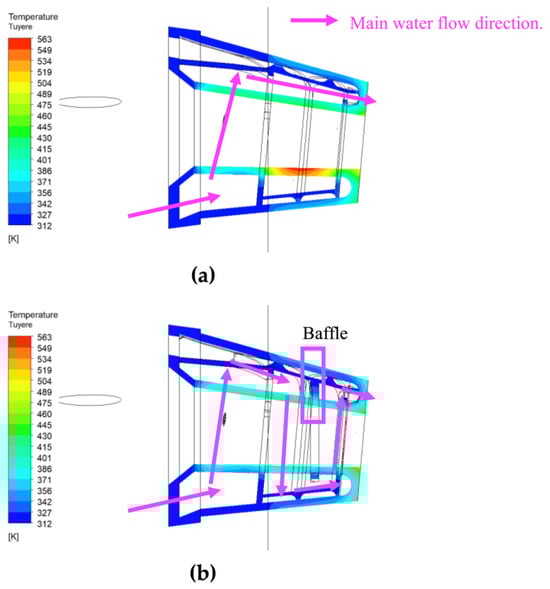
Figure 17.
Temperature distribution before and after improvement of the tuyere cooling water channel. (a) Before, (b) After.
The results of this study indicate that the high reactivity of COG caused the ignition location to shift upstream into the tuyere but did not lead to an increase in tuyere temperature. By contrast, because of altered flow dynamics and enhanced convective cooling, the overall tuyere temperature decreased under COG injection conditions. Furthermore, the use of the cooling water channel with an optimized design could effectively eliminate localized high-temperature zones within the tuyere, thereby ensuring thermal safety and operational stability during COG coinjection. These findings provide critical insights for blast furnace applications, demonstrating that under appropriate flow field design and cooling strategies, COG injection not only contributes to carbon emission reduction but also ensures that the thermal load on the tuyere remains within a safe operational range.
4. Conclusions
This study provides critical insights into COG–PC co-injection in blast furnace tuyeres through a comprehensive CFD analysis with three key contributions.
- The dual effects of COG injection on PC combustion were quantified. Moderate COG injection accelerated volatile release and increased raceway temperatures by up to 400 K, enhancing early-stage combustion. However, excessive COG flow reduced PC burnout from 93.3% to 78.5% due to intensified oxygen competition and shortened residence time, thereby identifying an optimal COG injection range of approximately 80% of the baseline flow rate.
- Contrary to safety concerns regarding hydrogen-rich gas injection, the thermal analysis revealed that COG injection decreased maximum tuyere temperatures by 55–65 K. This unexpected cooling effect resulted from (1) an unburned gas layer along the upper tuyere wall providing thermal insulation, and (2) convective cooling from ambient-temperature COG flow.
- A simple optimization of the cooling-water channel by incorporating a flow-guiding baffle eliminated the localized hotspot at the lower tuyere edge and reduced the peak temperature by approximately 40 K.
These findings provide quantitative operational guidelines for implementing COG injection in industrial blast furnaces: maintain COG flow rates below 120% of baseline to preserve PC burnout efficiency, utilize the inherent cooling effect of COG injection for thermal management, and adopt targeted cooling-channel modifications for enhanced safety. The validated CFD framework developed here can also be extended to optimize site-specific injection strategies, supporting the steel industry’s transition toward carbon-neutral operations.
Supplementary Materials
The following supporting information can be downloaded at https://www.mdpi.com/article/10.3390/met15111241/s1.
Author Contributions
Conceptualization, C.-C.L., K.-Y.C. and S.-W.D.; methodology, C.-C.L. and K.-Y.C.; validation, D.-Q.V.; formal analysis, C.-C.L., K.-Y.C. and D.-Q.V.; investigation, C.-C.L., K.-Y.C. and B.-J.L.; resources, B.-J.L. and T.-Y.H.; data curation, C.-C.L. and K.-Y.C.; writing—original draft preparation, C.-C.L.; writing—review and editing, D.-Q.V., B.-J.L., T.-Y.H., H.-C.W., H.-J.L. and S.-W.D.; visualization, C.-C.L.; supervision, H.-C.W., H.-J.L. and T.-Y.H.; project administration, H.-C.W. and S.-W.D.; funding acquisition, S.-W.D. All authors have read and agreed to the published version of the manuscript.
Funding
This work was financially supported by the National Science and Technology Council and China Steel Corporation of Taiwan (NSTC 113-2622-8-006-020).
Data Availability Statement
The original contributions presented in the study are included in the article/Supplementary Material. Further inquiries can be directed to the corresponding author.
Acknowledgments
The authors gratefully acknowledge the financial support from the National Science and Technology Council of Taiwan (NSTC 113-2622-8-006-020). The authors also thank China Steel Corporation for valuable technical discussions and assistance. For the preparation of this manuscript, our team used Perplexity (v3) for literature exploration and preliminary reference identification. Additionally, ChatGPT (v4) and Gemini (v2.5) were employed for English language refinement and grammar polishing.
Conflicts of Interest
Authors Bo-Jhih Lin, Tsung-Yen Huang, and Shan-Wen Du are employed by China Steel Corporation. The authors declare that this study received funding from China Steel Corporation. The funder was not involved in the study design, collection, analysis, interpretation of data, the writing of this article or the decision to submit it for publication.
Abbreviations
The following abbreviations are used in this manuscript:
| BFG | Blast Furnace Gas |
| CFD | Computational Fluid Dynamics |
| CHT | Conjugate Heat Transfer |
| COG | Coke Oven Gas |
| HRG | Hydrogen-Rich Gas |
| NG | Natural Gas |
| PC | Pulverized Coal |
| VM | Volatile Matter |
| GRI-Mech | Gas Research Institute Mechanism |
| BERL | Burner Engineering Research Laboratory |
References
- Shen, Y.; Liu, Y.; Hu, Z. CFD study of hydrogen injection in blast furnaces: Tuyere co-injection of hydrogen and coal. Metall. Mater. Trans. B 2021, 52, 2563–2581. [Google Scholar] [CrossRef]
- Zhang, C.; Listopadov, V.; Xu, R.; Grachev, S.; Jiao, K.; Zhang, J.; Li, T.; Ternovykh, A.; Wang, C.; Wang, G. Blast furnace hydrogen-rich metallurgy-research on efficiency injection of natural gas and pulverized coal. Fuel 2022, 311, 122412. [Google Scholar] [CrossRef]
- Yeh, C.P.; Du, S.W.; Tsai, C.H.; Yang, R.J. Numerical analysis of flow and combustion behavior in tuyere and raceway of blast furnace fueled with pulverized coal and recycled top gas. Energy 2012, 42, 233–240. [Google Scholar] [CrossRef]
- Zhang, C.; Zhang, J.; Xu, R.; Zheng, A.; Zhu, J. Numerical investigation of hydrogen-rich gas and pulverized coal injection in the raceway of a blast furnace with lower carbon emissions. Fuel 2024, 356, 129462. [Google Scholar] [CrossRef]
- Zhang, C.; Zhang, J.; Zheng, A.; Xu, R.; Jia, G.; Zhu, J. Effects of hydrogen-rich fuel injection on the states of the raceway in blast furnace. Energy 2023, 274, 127237. [Google Scholar] [CrossRef]
- Okosun, T.; Street, S.J.; Zhao, J.; Wu, B.; Zhou, C.Q. Influence of conveyance methods for pulverized coal injection in a blast furnace. Ironmak. Steelmak. 2017, 44, 513–523. [Google Scholar] [CrossRef]
- Ren, M.; Liu, W.; Zhao, J.; Zou, C.; Ren, L.; Wu, H.; Zhao, J. Effects of hydrogen fraction in co-injection gas on combustion characteristics of the raceway in low carbon emission blast furnace. Int. J. Hydrog. Energy 2023, 48, 11530–11540. [Google Scholar] [CrossRef]
- Borjoui Raky, S.P.; Borjoui Raky, S.; Sharifi, M.; Mardani, S. Simulation of water-circulating path and heat transfer in blast-furnace tuyeres with simple and spiral double-chamfer design. Int. J. ISSI 2020, 17, 21–27. [Google Scholar] [CrossRef]
- Chatterjee, R.; Nag, S.; Kundu, S.; Ghosh, U.; Padmapal; Singh, U. A journey towards improving tuyere life. Trans. Indian Inst. Met. 2021, 74, 1077–1088. [Google Scholar] [CrossRef]
- Zhu, W.; Zhang, J.; Zong, Y.; Zhang, L.; Liu, Y.; Yan, L.; Jiao, K. Optimization study of annular wear-resistant layer structure for blast furnace tuyere. Metals 2023, 13, 1109. [Google Scholar] [CrossRef]
- Chen, Z.; Zhang, C.; Zhang, J.; Zhang, Y.; Wu, W.; Li, G.; Lu, X. Temperature field simulation of Ni60A coating with different copper content on blast furnace tuyere. Mater. Today Commun. 2022, 32, 104093. [Google Scholar] [CrossRef]
- ANSYS Inc. ANSYS Fluent Customization Manual: Release, 2024 R2; ANSYS: Canonsburg, PA, USA, 2024.
- Smith, G.P.; Golden, D.M.; Frenklach, M.; Moriarty, N.W.; Eiteneer, B.; Goldenberg, M.; Bowman, C.T.; Hanson, R.K.; Song, S.; Gardiner, W.C., Jr.; et al. GRI-Mech 3.0: An Optimized Detailed Chemical Kinetic Mechanism for Methane Combustion; University of California: Berkeley, CA, USA, 1999. [Google Scholar]
- ANSYS Inc. ANSYS Chemkin Tutorials Manual, 17.0; ANSYS Reaction Design: San Diego, CA, USA, 2016.
- Kobayashi, H.; Howard, J.B.; Sarofim, A.F. Coal devolatilization at high temperatures. Symp. Combust. 1977, 16, 411–425. [Google Scholar] [CrossRef]
- Ubhayakar, S.K.; Stickler, D.B.; Von Rosenberg, C.W., Jr.; Gannon, R.E. Rapid devolatilization of pulverized coal in hot combustion gases. Symp. Combust. 1977, 16, 427–436. [Google Scholar] [CrossRef]
- Patankar, S.V. Numerical Heat Transfer and Fluid Flow; Hemisphere Publishing Corporation: New York, NY, USA, 1980. [Google Scholar]
- Ferziger, J.H.; Perić, M. Computational Methods for Fluid Dynamics; Springer: Berlin/Heidelberg, Germany, 2002. [Google Scholar]
- Nielson, S.; Okosun, T.; Damstedt, B.; Jampani, M.; Zhou, C.Q. Tuyere-level syngas injection in the blast furnace: A computational fluid dynamics investigation. Processes 2021, 9, 1447. [Google Scholar] [CrossRef]
- Yan, L.; Yue, G.; He, B. Application of an efficient exponential wide band model for the natural gas combustion simulation in a 300 kW BERL burner furnace. Appl. Therm. Eng. 2016, 94, 209–220. [Google Scholar] [CrossRef]
Disclaimer/Publisher’s Note: The statements, opinions and data contained in all publications are solely those of the individual author(s) and contributor(s) and not of MDPI and/or the editor(s). MDPI and/or the editor(s) disclaim responsibility for any injury to people or property resulting from any ideas, methods, instructions or products referred to in the content. |
© 2025 by the authors. Licensee MDPI, Basel, Switzerland. This article is an open access article distributed under the terms and conditions of the Creative Commons Attribution (CC BY) license (https://creativecommons.org/licenses/by/4.0/).