Article

The Issues of the Radiation Hardening Determination of Steels After Ion Irradiation Using Instrumented Indentation

National Research Center Kurchatov Institute—Central Research Institute of Structural Materials Prometey, 49 Shpalernaja Street, Saint Petersburg 191015, Russia
*
Author to whom correspondence should be addressed.
Metals 2025, 15(11), 1181; https://doi.org/10.3390/met15111181
Submission received: 12 September 2025 / Revised: 17 October 2025 / Accepted: 21 October 2025 / Published: 24 October 2025

Abstract

The application of the instrumented indentation method with a Berkovich indenter (triangular pyramid) is considered for the determination of microhardness and radiation hardening of ion-irradiated steels. The main difficulties arising in the assessment of the microhardness of a thin irradiated layer are identified. They are connected with the indentation depth effect on microhardness even for homogeneous materials when the indentation diagram is used. A method of microhardness determination is proposed that is based on direct measurement of the indent projection area, taking into account the formed pile-ups. The proposed method allows one practically to exclude the influence of the indentation depth on the microhardness of homogeneous material at least over the depth range from 0.2 to 4 μm and to obtain an adequate assessment of the radiation hardening for a thin irradiated layer with a depth of about 2 μm. Moreover, a formula is proposed for taking into account the influence of pile-ups on the microhardness determined from the indentation diagram using the Oliver–Pharr method. The proposed method and the formula are verified for austenitic and ferritic-martensitic steels.

1. Introduction

One of the rapidly developing areas of radiation material science is emulating neutron irradiation by irradiating samples in an ion accelerator [1,2,3,4,5,6,7,8,9]. Under irradiation with heavy ions, the thickness of the irradiated layer does not exceed 2 ÷ 3 μm for the ion beam energies less than 12 MeV, while the distribution of the damage dose over the irradiated layer is extremely non-uniform [1,2,3,4,5,6,7,8]. Non-uniform irradiation leads to non-uniform radiation hardening of the material in the irradiated layer. There is no radiation hardening outside the irradiated layer. For experimental determination of radiation hardening of the irradiated layer, the method of instrumented nano- and microindentation with measurement of the indentation depth and determination of nano/microhardness values is usually used. In the work [5] it is shown that radiation hardening can be determined quite simply using instrumented microindentation (indentation depth greater than 0.2 μm) with a Vickers indenter (tetrahedral pyramid) and measuring the indent sizes. Determination of microhardness with a Vickers indenter was carried out by using the microhardness tester “CSM-instruments” with ×5000 magnification of a microscope. For the austenitic and ferritic-martensitic steels in the initial state, the microhardness is practically invariant to the indentation depth for specimens with high quality of the surface polishing, excluding work hardening [5]. Such results agree fully with results in [10], showing that the effect of indentation depth on microhardness practically disappears when the surface is prepared properly. Moreover, the obtained results in [5] fully agree also with the results in paper [11] referenced by the overall review on hardness measurements at macro-, micro-, and nanoscale [12]. In [11] it is shown that «different trends observed for Vickers hardness as a function of load (particularly for <100 gf loads) are due to visual perception problems of operators deciding where the indent tips are. The problem is not a material problem, as widely claimed in the literature for many years».
In the irradiated layer, the dependence of microhardness on the indentation depth has a maximum at a depth of 0.3–0.7 μm when using heavy ions of iron or nickel and an accelerating voltage of about 12 MeV [5]. A decrease in microhardness in the irradiated layer with an increase in the indentation depth is due to the influence of the “soft” substrate (unirradiated material) on the resistance to deformation of the irradiated layer. As a result, radiation hardening of the irradiated layer can be determined as the difference between the maximum microhardness value in the irradiated layer and the microhardness value of the unirradiated material, independent of the indentation depth [5].
It should be noted that in most cases, instrumented determination of microhardness at small indentation depths, in particular of a layer irradiated with ions, is carried out using the triangular Berkovich indenter [3,13,14,15,16,17,18]. The use of a Berkovich pyramid is primarily due to its simpler manufacturing technology compared to a tetrahedral Vickers pyramid. The technological advantage of a Berkovich indenter is that the triangular pyramid has a sharp apex even if the sizes of the facets and angles between them are not manufactured precisely enough. At the same time, a Vickers indenter, with the same manufacturing errors as a Berkovich indenter, has a bridge between the facets. It is generally accepted that the use of the always sharp Berkovich indenter allows one to determine microhardness not by the direct measurement of the indent projection area but by the indentation diagram with subsequent calculation of the indent projection area or the indent contact area using the formulae proposed by Oliver and Pharr [19].
At the same time, determination of microhardness with a Berkovich indenter by the indentation diagram has some disadvantages that are connected with the dependence of microhardness on the indentation depth even for a material with a homogeneous microstructure [13,15,20]. In [20], Nix and Gao, using the concept of geometrically necessary dislocations uniformly distributed under the indenter contact zone, described the experimental dependence of microhardness on the indentation depth as
H IT H 0 2   =   1   +   h * h ,
where H IT is microhardness under indentation with a Berkovich indenter, calculated from the indentation diagram by the Oliver–Pharr method,
h is indentation depth,
h* is the characteristic length, which depends on the shape of the indenter,
H 0   is bulk hardness at h → ∞.
Based on (1), it becomes clear that it is extremely difficult to determine radiation hardening in the ion-irradiated layer using a Berkovich indenter, the indentation diagram, and Formula (1). In fact, the physical dependence of radiation hardening on depth is monotonically increasing up to the depth at which the damage dose corresponds to saturation of hardening. At greater depths, radiation hardening should be constant up to the depth corresponding to the maximum damage dose. The increase in radiation hardening with increasing depth is due to the growth of the damage dose. In the case of determination of radiation hardening based on microhardness, the “soft” substrate distorts the dependence of radiation hardening on depth, turning it into a dependence with a maximum. In this case, if the measured microhardness depends on the indentation depth even for homogeneous material (see Formula (1)), then the radiation hardening curve acquires an additional change.
In spite of the effect of indentation depth on microhardness, the approaches presented in [20] were used to determine radiation hardening under ion irradiation [21,22]. Figure 1 shows an ideal scheme for using the Nix and Gao diagram to assess radiation hardening of a material after ion irradiation. At the first stage, the so-called Nix and Gao diagram, being the dependence of ( H IT )2 on (1/h) is plotted for unirradiated samples and approximated by a linear function. The H IT   value is determined as the intersection of the linear function with the ordinate axis ( H IT 0 )2 = b0 (Figure 1a). At the second stage, the unified dependence ( H IT irr )2 = f(1/h) is constructed for the irradiated layer and for the substrate. Then the constructed dependence ( H IT irr )2 = f(1/h) is approximated by a bilinear function (Figure 1b). The value ( H IT irr )2 = b2 for the irradiated layer is determined by extrapolation of the second part of the bilinear curve to the ordinate axis.
The bilinear function is represented as Figure 1b
( H IT ) 2 = a 1 1 / h + b 1 ,   f o r   h   >   h tr a 2 1 / h + b 2 ,   f o r   h     h tr ,
taking into account the additional condition a1(1/ h tr ) + b1 = a2(1/ h tr ) + b2, where a1, a2, b1, b2 are coefficients, h tr is the depth at which the substrate begins to influence the hardness of the irradiated region.
In this method it is assumed that the distribution of microhardness in the irradiated layer is similar to the distribution in the unirradiated metal, that is, it is assumed that radiation hardening in the irradiated layer is uniform. When experimental values of microhardness are approximated by a bilinear function, the coordinate of the intersection point of two linear dependencies is unknown. Therefore, the experimental points are ambiguously approximated by a bilinear dependence. In addition, in many cases the error increases when the dependence ( H IT )2 on (1/h) looks like a monotonically increasing function with a monotonically decreasing derivative, which is difficult to approximate by a bilinear function. As an example, Figure 2 represents the dependence of H IT (h) for an ion-irradiated sample of austenitic steel 18Cr-10Ni-Ti when the use of the Nix and Gao diagram gives an ambiguous estimation of the microhardness for the ion-irradiated layer.
The microhardness in Figure 2 was measured using instrumented indentation with a Berkovich indenter with a series of single indents at specified depths h.
As can be seen from Figure 2b,c, the dependence ( H IT )2 = f(1/h) is not a bilinear function, but rather a power or parabolic one. Approximation of such experimental data by a bilinear function gives an ambiguous result, since the presented experimental results can be approximated by function Equation (2) with different values of the coefficients a1, a2, and b1, b2 with practically the same correlation coefficient between the calculated and experimental values of microhardness. Figure 2b,c show two variants of constructing a bilinear dependence with practically the same correlation coefficient (R2 = 0.977). In the first variant, the microhardness of the irradiated layer is 2600 MPa, and in the second, 2335 MPa.
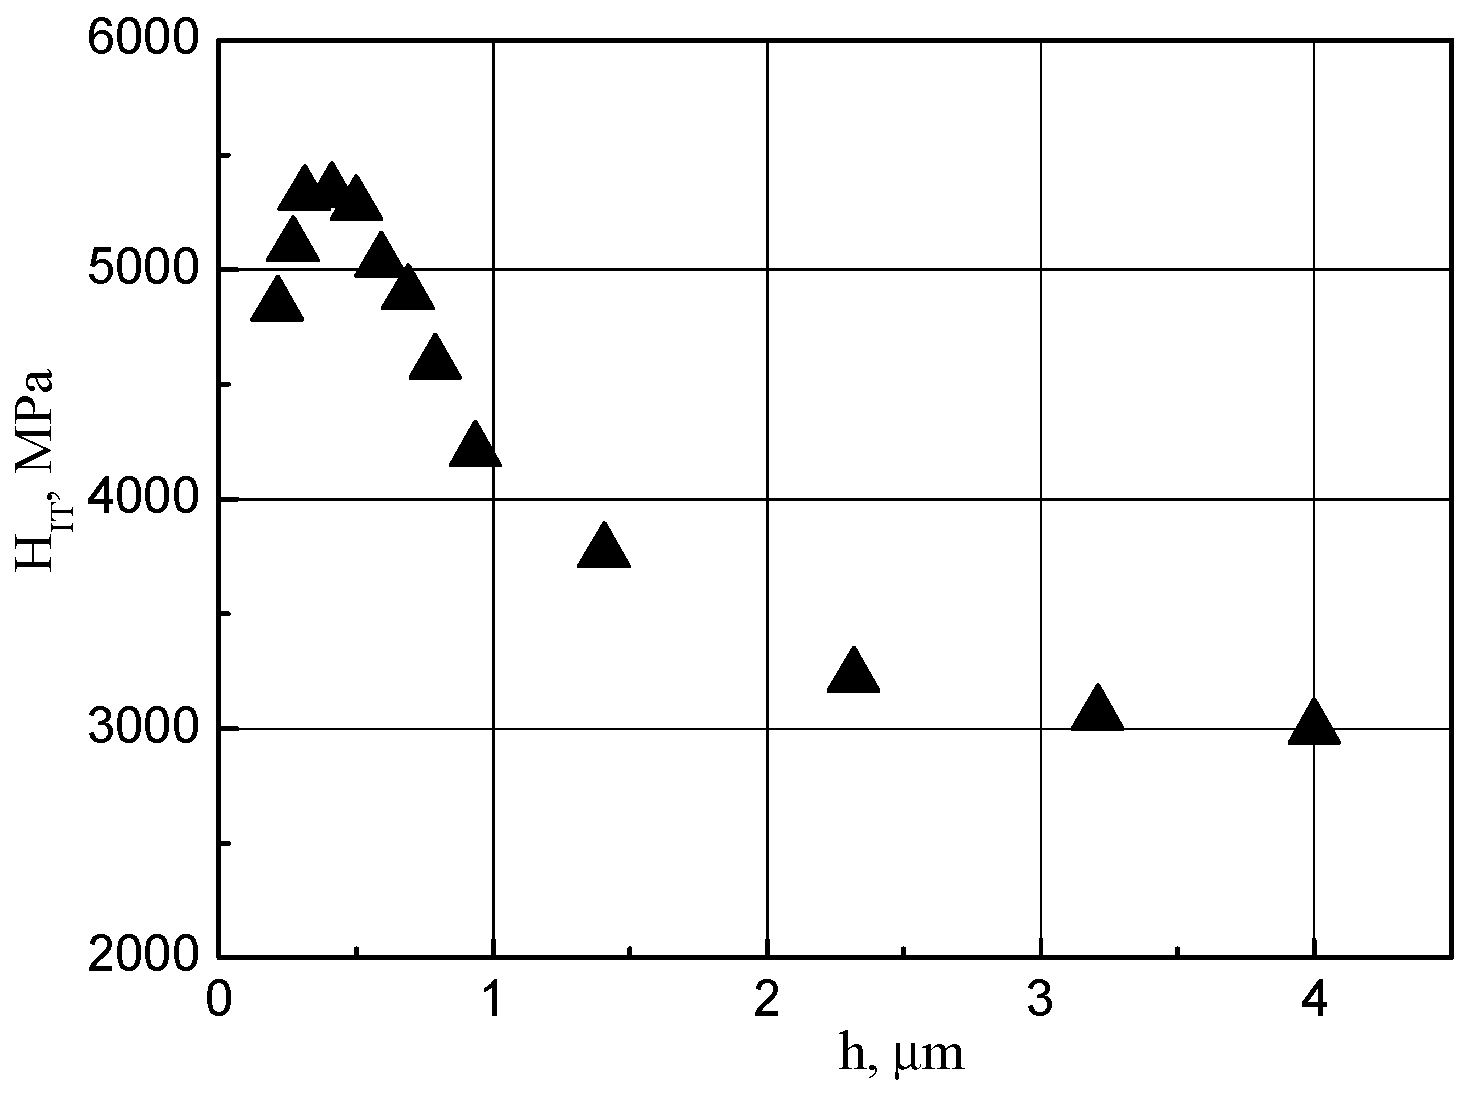
Figure 3 shows the dependence H IT = f(h) with a maximum, which is more typical for samples irradiated in ion accelerators than the dependence in Figure 2.
Similar dependencies for model ferritic steels were presented in [22,23]. It is clear that the Nix–Gao model is difficult to apply to a dependency with a maximum, since Equation (1) describes monotonically decreasing dependencies. Therefore, to process dependencies with a maximum, the so-called generalized Nix–Gao model is used, according to which the dependence ( H IT )2 = f(1/h) becomes less steep. The generalized Nix–Gao model gives smaller errors in estimating the microhardness of the irradiated layer, although it still does not take into account a maximum in the dependence H IT = f(h) [22,23]. Despite attempts in various works to apply the Nix–Gao model to determine the microhardness in the ion-irradiated layer, the review [24] indicates that the use of the Nix–Gao model in combination with various models based on semi-empirical approaches leads to significantly different values of radiation hardening.
Thus, it is clear from the presented analysis that using today’s models for determining the radiation hardening of ion-irradiated layers based on microhardness determination on indentation depth can lead to ambiguous and inadequate results. In connection with the above, the purpose of this article is to develop the most adequate procedure for determination of the radiation hardening of an ion-irradiated layer based on the results of microhardness measurements using a Berkovich indenter.
To achieve this purpose, at the first stage, the influence of the indentation depth on the microhardness of a homogeneous material is investigated when determination of microhardness is based on the direct measurement of the indent projection area and when microhardness is determined using the indentation diagram and the Oliver–Pharr method. The results obtained are compared with the Vickers microhardness. As a result of the comparisons, a conclusion is made about whether the dependence Equation (1) is physically justified. At the second stage of the present study, procedures are proposed for determination of microhardness by using the direct measurement of the indent projection area and by using the indentation diagram, the Oliver–Pharr method, and also the introduced correction function. At the third stage, the procedure is proposed for determination of radiation hardening of the layer irradiated by heavy ions.

2. Investigation Methods

2.1. Methodology for Microhardness Determination with a Berkovich Indenter

Indentation with a Berkovich indenter, as noted in the introduction, has its advantages and disadvantages compared to indentation with a Vickers indenter. In addition to those noted in the introduction, another disadvantage of indentation with a Berkovich indenter is the formation of material pile-ups along the pyramid facets, which are detected by many authors [25,26,27]. The contribution of the pile-ups is not taken into account in the Oliver–Pharr method, which ultimately leads to an overestimation of the microhardness under indentation with a Berkovich indenter.
In this paper, the microhardness is determined using a Berkovich pyramid indentation by three ways. The first way is based on the direct area determination of the indent projection with the account taken of pile-ups ( H Ber p ) . In this case, the indent is defined as the surface zone bounded by a closed line, which is the locus of the peaks of the pile-ups profiles. For comparison, on the same samples where indentation is carried out with a Berkovich indenter, the microhardness is also determined using the indent projection area after indentation with a Vickers indenter ( H V p ) .
The second way is based on the determination of the indent depth using the load-depth indentation diagram and the use of the Oliver–Pharr method without taking into account pile-ups H IT . The third way is similar to the second one, but pile-ups are taken into account ( H IT p - u p ) . In all studies, the microhardness is determined as the ratio of the maximum load to the indent projection area.

2.2. Microhardness Determination Methods Using the Direct Measurement of the Indent Projection Area

The contribution of the pile-ups to the microhardness assessment is connected with an increase in the indent contact area and the indent projection area. Based on the analysis of the 3D image of the pile-ups under indentation with a Berkovich indenter, in [13] it was proposed to represent the shape of the projection of the pile-ups as three triangles adjacent to each side. Then the projection of a Berkovich indent can be represented as a hexagon consisting of a large triangle and three small triangles (Figure 4). The large triangle corresponds to the projection of the indent without pile-ups; three small triangles correspond to the three projections of the pile-ups.
By analogy with a Berkovich indenter, the projection of a Vickers indent with pile-ups can be represented as an octagon consisting of a square and four small triangles adjacent to each of its sides (Figure 4).
The H Ber p value is determined using the direct measurement of the indent projection area of the Berkovich indenter. The H Ber p value is calculated as the ratio of the load at a given depth to the indent projection area. The area of the indent projection is determined using a microscope.
The size of the sides of the large triangle and the heights of the three small triangles are measured using a microscope, and the area of the hexagon is calculated from these sizes.
Microhardness, H Ber p , is calculated using the formula:
H Ber p   =   P A 3   +   A 3 p - u p ,
where P is the load at the given indentation depth, h ,
A 3 is the projection area of a Berkovich indent without taking into account the pile-ups (the area of the large triangle),
A 3 p - u p is the projection area of three pile-ups (the sum of the areas of three small triangles) (Figure 4).
A procedure similar to a Berkovich indenter is performed for measurement of the sizes of a square and four triangles for a Vickers indenter (Figure 4). The area of the octagon is determined by the measured sides of the square and the heights of the four triangles. The calculation of the Vickers microhardness H V p is carried out using the formula:
H V p   =   p A 4   +   A 4 p - u p ,
where A 4   is the projection area of a Vickers indent without taking into account the pile-ups (area of a square),
A 4 p - u p is the area of the projection of four pile-ups (the sum of the areas of four small triangles).

2.3. Microhardness Determination Method with a Berkovich Indenter Using the Indentation Diagram

The microhardness H I T is determined by the indentation depth hc calculated by the Oliver and Pharr formulae [19], using the «load-indentation depth» diagram. The Oliver–Pharr method with the above-mentioned diagram allows one to determine the area of the indent projection without taking into account the pile-ups.
To evaluate the microhardness taking into account pile-ups, a correction function is introduced that relates the ratio of the indent projection area taking into account pile-ups to the indent projection area without taking into account pile-ups.
The area of a large triangle (see Berkovich indent in Figure 4) is calculated by the formula.
A 3   = 3 4 a 2 ,
where a is the length of the side of the large triangle (i.e., the length of the side of the base of the pyramid).
The relationship between b and hp-up is represented as
b = tan ( φ ) × h p - u p ,
where b is the height of the projection of the pile-up schematized as an isosceles triangle (see Berkovich indent in Figure 4),
φ is the angle between the facet and the height of a Berkovich pyramid, h p - u p is the pile-up height.
The relationship between the side of the pyramid base, a, and the height of a Berkovich pyramid taken equal to hc is described by equation through the angle φ
tan ( φ )   = 1 2 3 × a h c ,
where h c is the contact depth of the indentation, calculated using the Oliver and Pharr formulae.
The projection area of three pile-ups is
A 3 p - u p = 3 2 a   ×   b .
Using (5), (6), (7) and (8) we obtain that the indent projection area with pile-ups is equal to
A 3 + A 3 p - u p = 3 4 a 2 + 3 2 × a 2 2 3 × h p - u p h c = 3 4 a 2 1 + h p - u p h c .
Then the correction function is equal to
A 3 + A 3 p - u p A 3   = 1   + h p - u p h c .
Taking into account that
H IT p - u p H IT = A 3   A 3   +   A 3 p - u p   ,
microhardness with account taken of pile-ups is calculated as
H IT p - u p = H IT 1 + h p - u p h c .

3. Equipment, Samples and Materials

Instrumented indentation and determination of microhardness with a Berkovich indenter is carried out by using the nanohardness tester “NanoScan-4D” (NanoScan, Moscow, Russia). Determination of microhardness with a Vickers indenter is carried out by using the microhardness tester “CSM-instruments” (CSM-instruments, Peseux, Switzerland).
Indentation with a Berkovich indenter is performed by a series of single injections at a constant strain rate equal to 0.1 1/s and given indentation depths as h = 0.2, 0.25, 0.3, 0.35, 0.45, 0.55, 0.65, 0.75, 0.85, 1.0, 1.5, 3.0, and 4.5 µm. Indentation with a Vickers indenter is performed at a constant strain rate equal to 0.1 1/s up to given loads as P = 0.02, 0.03, 0.04, 0.05, 0.06, 0.07, 0.08, 0.1, 0.2, 0.5, and 1 N. In both regimes, after reaching the specified indentation depth or the specified load value, a holding period of 2 s is performed. The number of injections is never less than 4 for depths of 0.2–0.85 µm and loads of 0.03–0.05 N and never less than 3 for depths of 1.0–4.5 µm and loads of 0.06–1 N.
It should be noted that there is a difference in the software for the testers used for the present study. Therefore, the setting parameters (indentation depth or load) differ for these testers. For the nanohardness tester “NanoScan-4D” the indentation depth is set with a step of 0.05 μm, and for the microhardness tester “CSM-instruments”, the maximum load is set with a step of 0.01 N. However, this difference in the set parameters does not affect the studied dependences of microhardness on the indentation depth.
The measurement of the indent projection areas with pile-ups for a Berkovich indenter (hexagon) and for a Vickers indenter (octagon) is carried out using a microscope built into the CSM-instruments tester at a magnification of at least 3000 times. The pile-up height hp-up and the residual indent depth hp are measured with an optical 3D profilometer S Neox (Sensofar, Terrassa, Spain).
To study microhardness, disk samples with a diameter of 12 mm and a thickness of 2 mm are used. Such samples are used for irradiation in an ion accelerator and for subsequent research [5].
To avoid work hardening and to provide a high quality of the disk surface, the following manufacturing procedure was used. At first, the disk is cut using an electrical discharge machine. After cutting, the disk surface is subjected to successive grinding and polishing with a final pass of “soft” abrasives based on colloidal silica with a dispersion of 0.3–0.5 μm. At last, the disk is subjected to electropolishing.
The absence of work hardening is controlled by scanning electron microscopy and electron backscatter diffraction by visualizing the so-called Kikuchi lines [28,29].
The objects of the study are samples of austenitic steels of 18Cr-10Ni-Ti, 16Cr-20Ni-2Mo-Ti, and 16Cr-25Ni-2Mo-Ti grades and ferritic-martensitic steels (FMS) of EP-823 and EP-450 grades in the initial state and of austenitic 16Cr-20Ni-2Mo-Ti steel after irradiation with Ni4+, He+, and H+ ions at 400 °C with a dose of D = 30 dpa at a depth of 1.4 μm. Chemical compositions of the investigated steels according to technical specifications are presented in Table 1 and Table 2.
The irradiation was carried out in the TANDENTRON accelerator by a continuous ion beam with a diameter of 6 mm in 5 blocks, in each of which (except for the last one) the irradiation alternated in the following order: Ni4+ → He+ → H+. In the last block, only heavy Ni4+ ions were used. Each of the blocks created the same damage dose in the sample. The maximum total damage dose was about 60 dpa with a damage dose rate 1 × 10⁻³ dpa/s. Irradiation was carried out at T = 400 °C with control of the irradiation temperature by a thermocouple installed directly in the specimen. The energy of Ni4+ ions was 11.5 MeV with a beam current of 1 μA. The irradiation depth was 2.4 μm. The dose distribution and the concentration distribution for the injected Ni ions over the irradiated layer are presented in Figure 5. All calculations were performed using TRIM code [30] in the Kinchin–Pease mode.
The irradiation by He+ and H+ ions was performed with varying energy to obtain the relative concentration of 7 appm/dpa for He and 15 appm/dpa for H over the depth range from 0.7 to 2 μm.

4. Experimental Results

4.1. Microhardness Determination Using the Direct Measurement of the Indent Projection Area

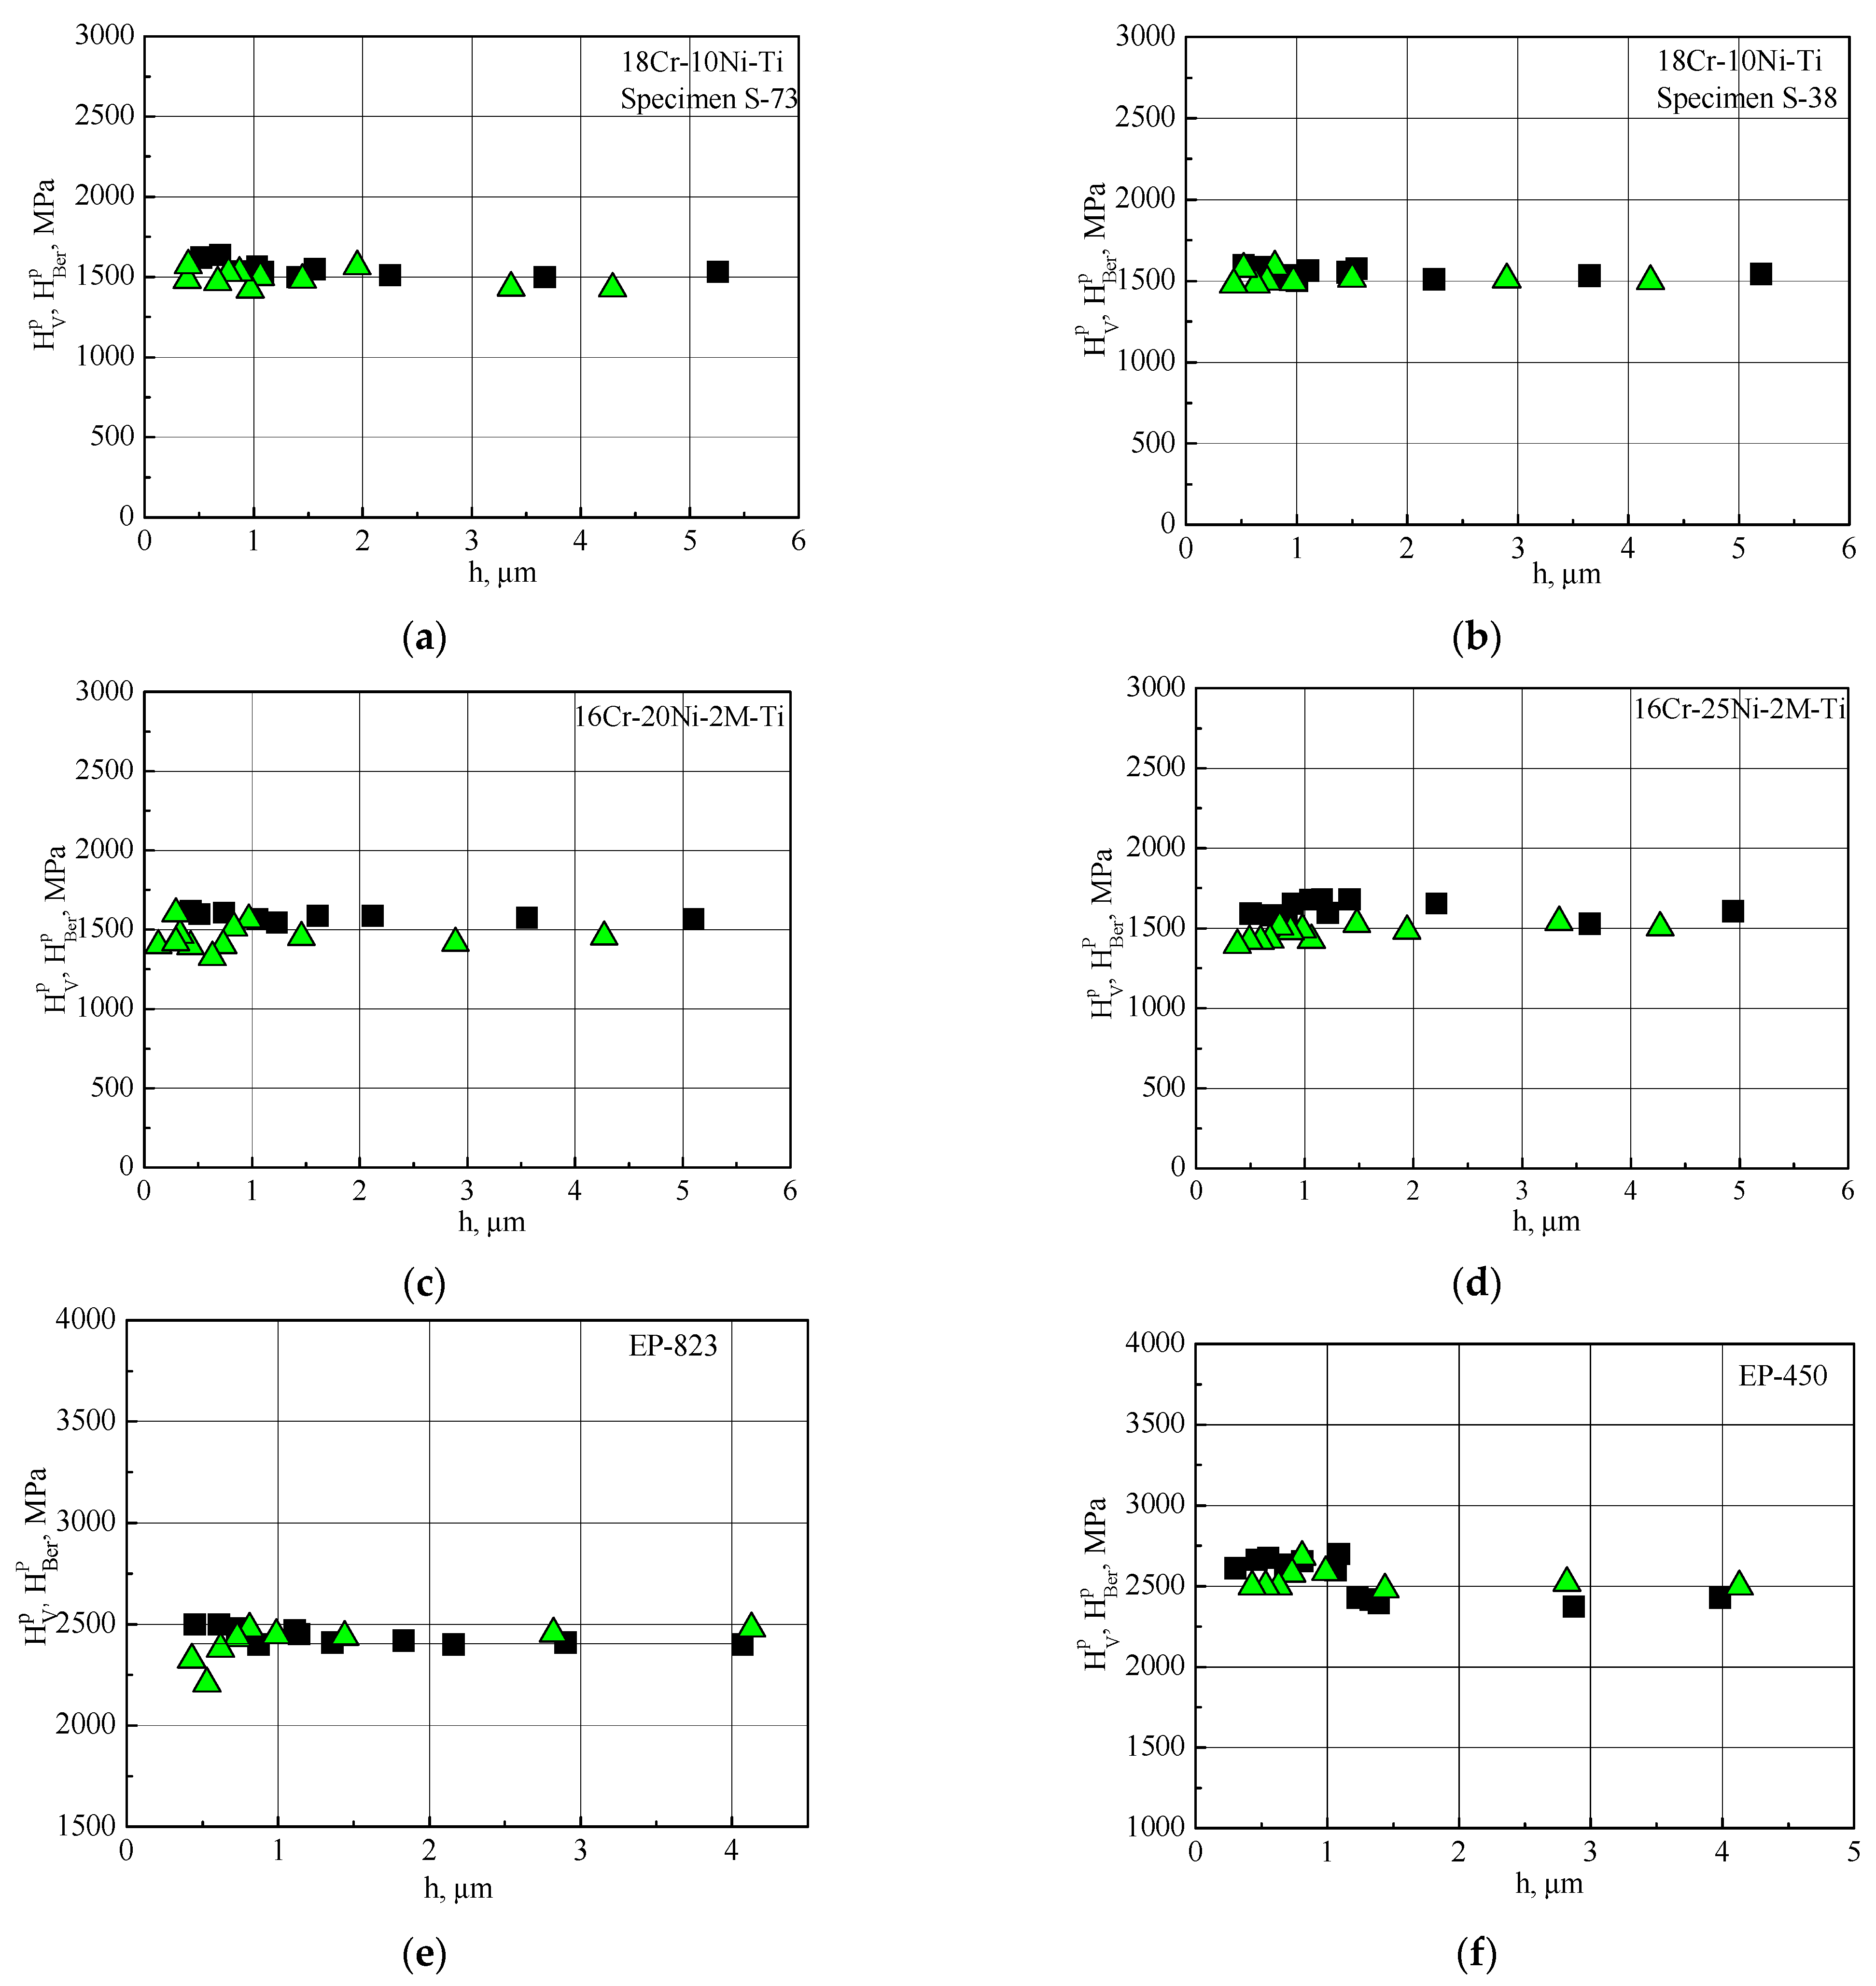
The results of the microhardness measurements with a Berkovich indenter, H Ber p , and with a Vickers indenter, H V p , are represented in Figure 6 for all the investigated steels in the initial state.
It is seen from Figure 6 that the microhardness values H Ber p and H V p measured by using the area of the indent projection with the account taken of pile-ups do not depend on the indentation depth for both a Vickers indenter and a Berkovich indenter for all the studied samples. Moreover, the values of H Ber p and H V p coincide practically.
Taking into account that the ratio of the indent projection area to the indent contact area is practically the same for Vickers and Berkovich indenters, the Vickers and Berkovich microhardness values should coincide if the microhardness is determined by measuring the same characteristic of the indent area (projection area or contact area).
The obtained experimental results on the independence of microhardness on the indentation depth are in agreement with the results of work [26] in which the indent projection area was determined by atomic force microscope. In work [26] it is shown that the value of the nanohardness determined from the indent geometry does not depend on the indentation depth even in the range of 0.02–0.08 µm. In addition, it was shown in [27] that the account taken of the pile-ups leads to the independence of the microhardness from the indentation depth, at least at depths exceeding 0.25 µm.

4.2. Microhardness Determination with a Berkovich Indenter Using the Indentation Diagram

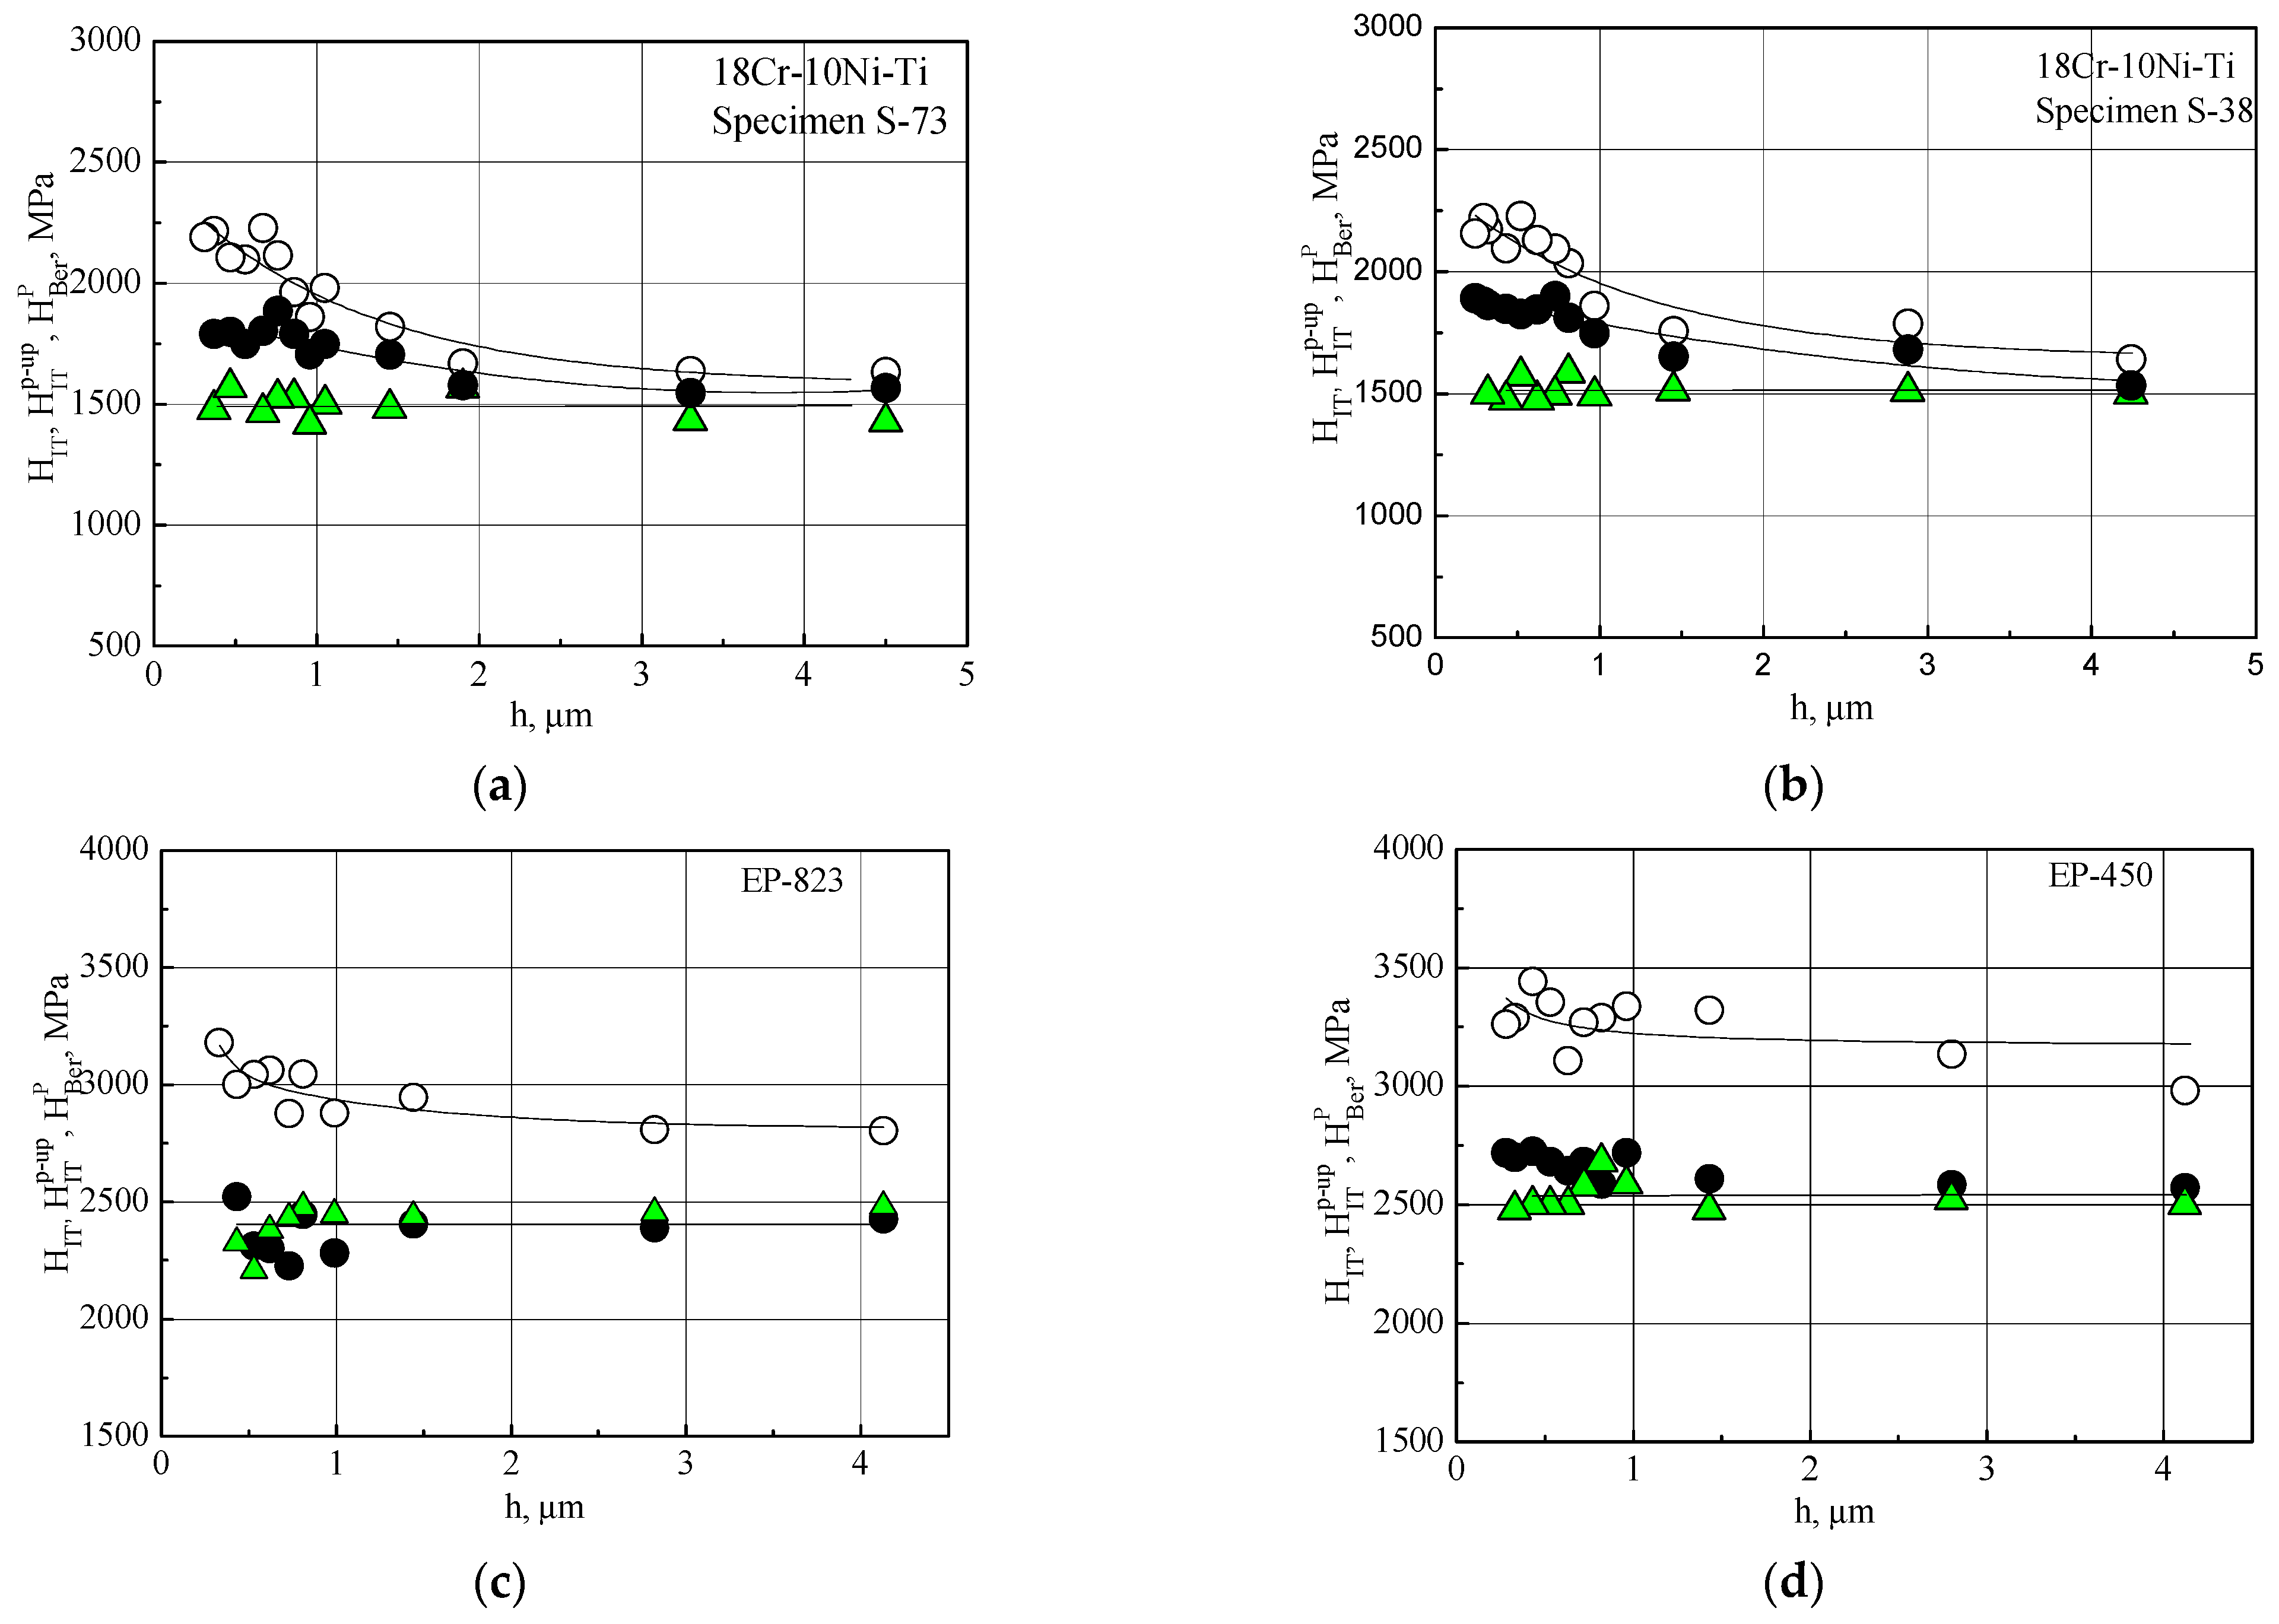
The values of H I T   and H I T p - u p for austenitic and ferritic-martensitic steels are represented in Figure 7. For comparison, the graphs show also the microhardness values using direct determination of the indent projection area,   H Ber p . It is necessary to note that the number of points for H IT p - u p and H Ber p values is less than for H I T values as pile-ups sizes or projection area for several indents could not be determined reliably enough.
It is clearly seen from the data in Figure 7 that the microhardness values obtained from the indentation diagram without account taken of pile-ups depend on the indentation depth for all the materials studied.
For austenitic 18Cr-10Ni-Ti steel (Figure 7a,b), the dependence of H IT p - u p on h becomes significantly weaker compared to H IT (h) if the pile-ups are taken into account according to Formula (12). At the same time, the H IT p - u p values remain higher than the values of H Ber p .
For samples from the FMS (Figure 7c,d), the dependences of H IT p - u p and H Ber p on the indentation depth, h, practically coincide, and the values of H IT p - u p and H Ber p do not depend on the depth.
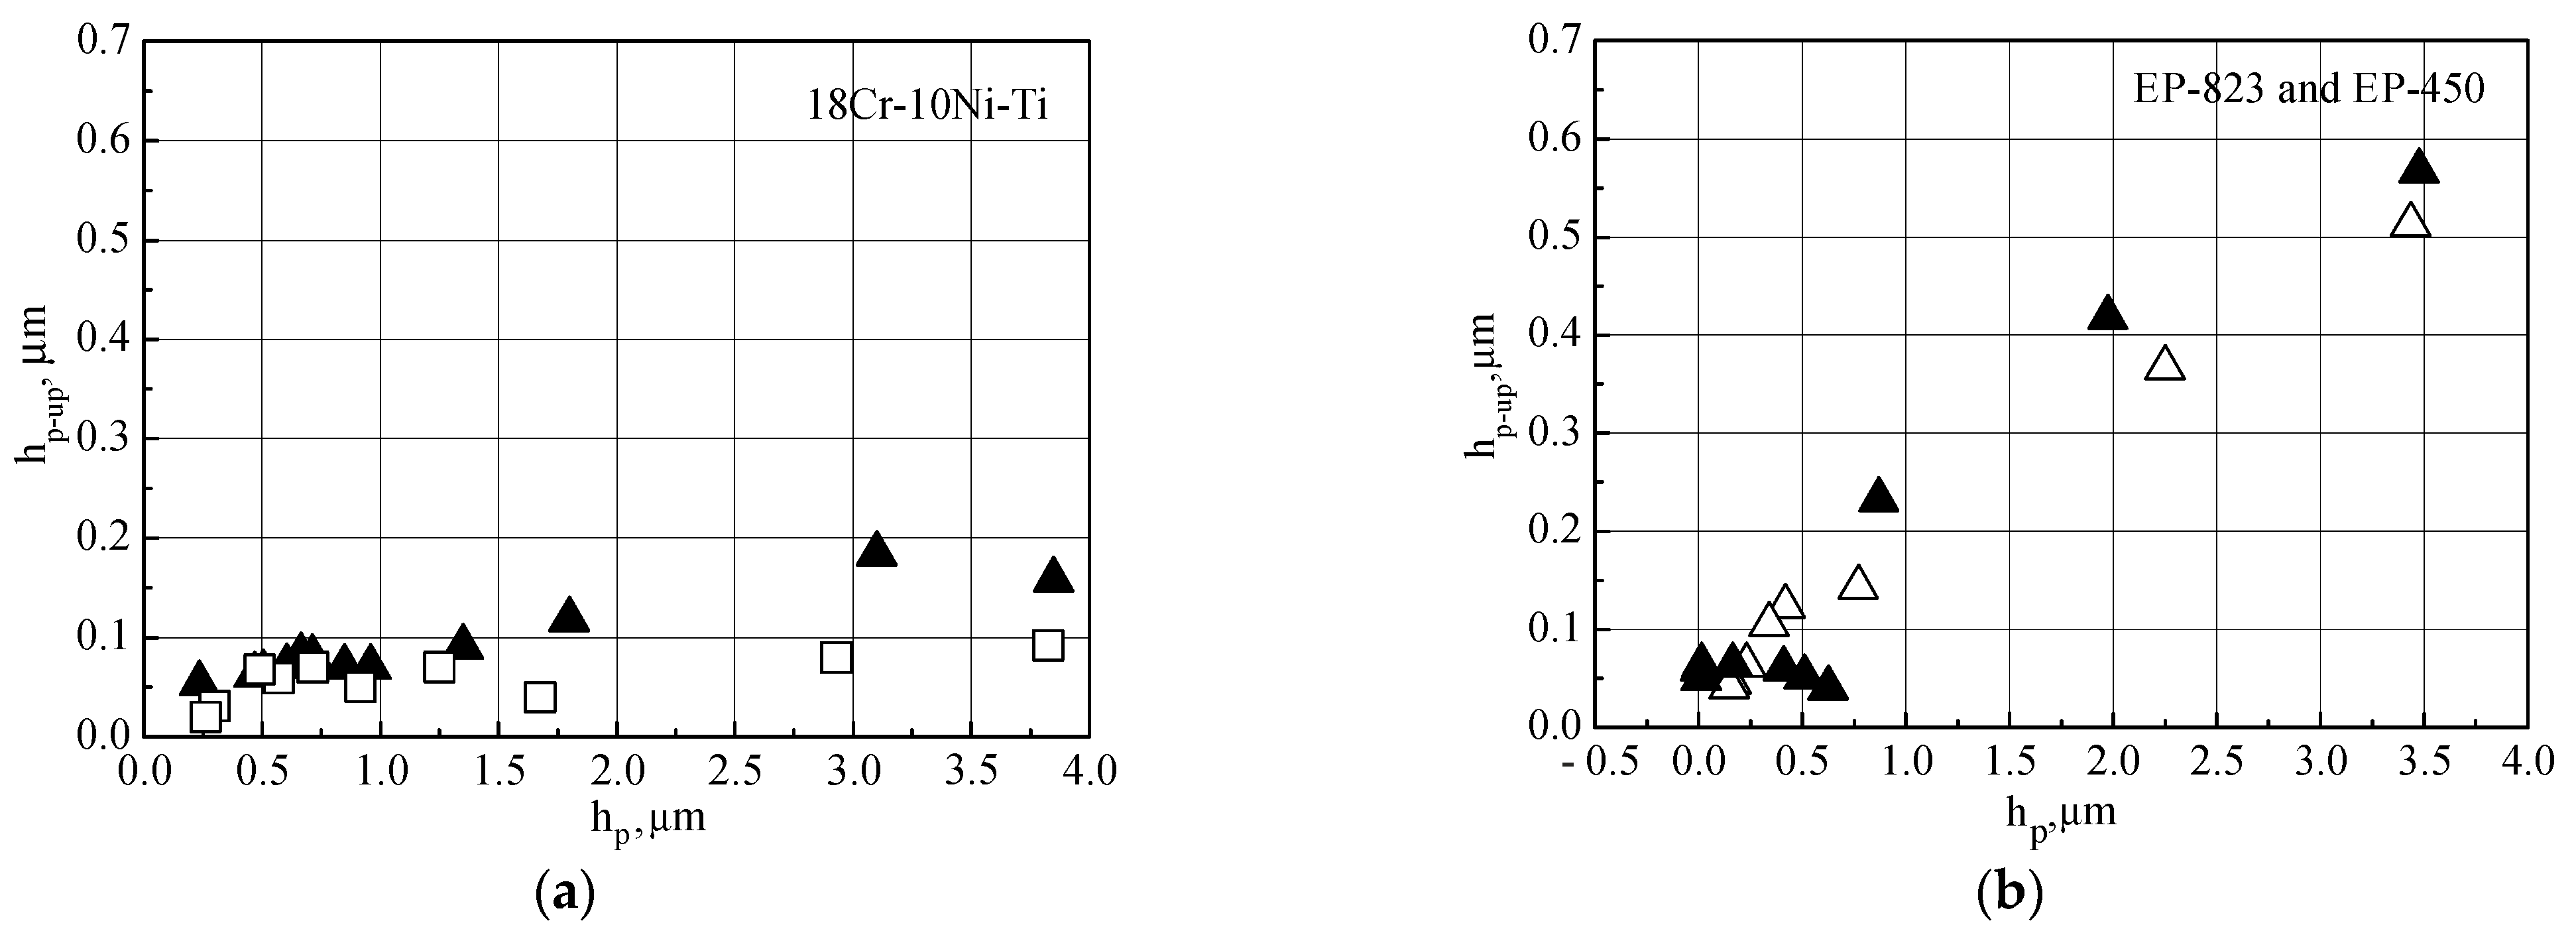
Figure 8a shows the measurement results of the pile-up height hp-up and the residual indentation depth hp when Berkovich and Vickers indenters for 18Cr-10Ni-Ti austenitic steel are used. Figure 8b shows the measurement results of the pile-up parameters for the indentation with a Berkovich indenter for EP-823 and EP-450 FMS.
It is seen from the data in Figure 8a,b that the dependence of the pile-up height on the residual indentation depth hp may be described, in the first approximation, by a linear dependence for a Berkovich pyramid indentation for austenitic steel and FMS. The growth rate of dhp-up/dhp for FMS is more than twice as high as for austenitic steel.
For a Vickers pyramid indentation, Figure 8a shows that the height of the pile-ups for austenitic steel is less than 0.1 µm and depends weakly on the indentation depth. The data indicating that the height of the pile-ups does not practically depend on the depth contradict the plastic deformation properties. Therefore, pile-ups up to 0.1 µm in height can be attributed to measurement error. Hence, pile-ups can be neglected for austenitic steel when indentation is performed with a Vickers indenter.
The formation of high pile-ups for FMS samples is connected with low strain hardening of FMS and, as a consequence, high localization of plastic deformation near the facets of a Berkovich indenter. One of the indicators of the tendency to deformation localization is the value of the relative uniform elongation δul that corresponds to the onset of neck formation for tensile smooth specimens. The smaller the δul value, the greater the tendency for deformation localization in the material. According to [31], for 18Cr-10Ni-Ti steel, δul = 35–40%, and for EP-823 steel, the δul values do not exceed 15%.
Calculation with Formula (12) for taking into account the high pile-ups near the indents on samples from the FMS of EP-823 and EP-450 grades results in strong variation in microhardness determined from the indentation diagram. As can be seen from Figure 7c,d, the values of H IT p - u p and H Ber p practically coincide, and they show independence from h. However, calculation with Formula (12) for austenitic 18Cr-10Ni-Ti steel (Figure 7a,b) leads only to a partial decrease in the gradient of the dependence of H IT p - u p on depth and to an incomplete convergence of the H IT p - u p and H Ber p values.
Apparently, for austenitic steel, Formula (12) does not provide an adequate account of the pile-ups when the indent projection area is determined. The fact is that when deriving Formula (12), it was assumed that the angle of inclination of the facet of the pile-up, which forms the indent contact area, coincides with the angle φ between the facet of the pyramid and its height (see Formula (6)). This assumption describes the pile-up effect quite well for steels prone to localized deformation, such as FMS. In this case, the zone of plastic deformation of the material is localized at the facets of the pyramid, and a high pile-up with a small base area is formed. Then the facet of the pile-up is practically adjacent to the facet of the pyramid, and Formula (12) is valid.
For austenitic steel, the zone of plastic deformation extends quite far from the facets of the pyramid, since the localization of plastic deformation is small. In this case, the base of the pile-up increases, and the angle of inclination of the pile-up facet becomes bigger than φ. Therefore, Formula (12) gives an underestimated contribution of pile-ups in the indent projection area. It is clear that with an increase in the angle of inclination of the pile-up facet, the indent projection area increases and the microhardness decreases for the same pile-up height.
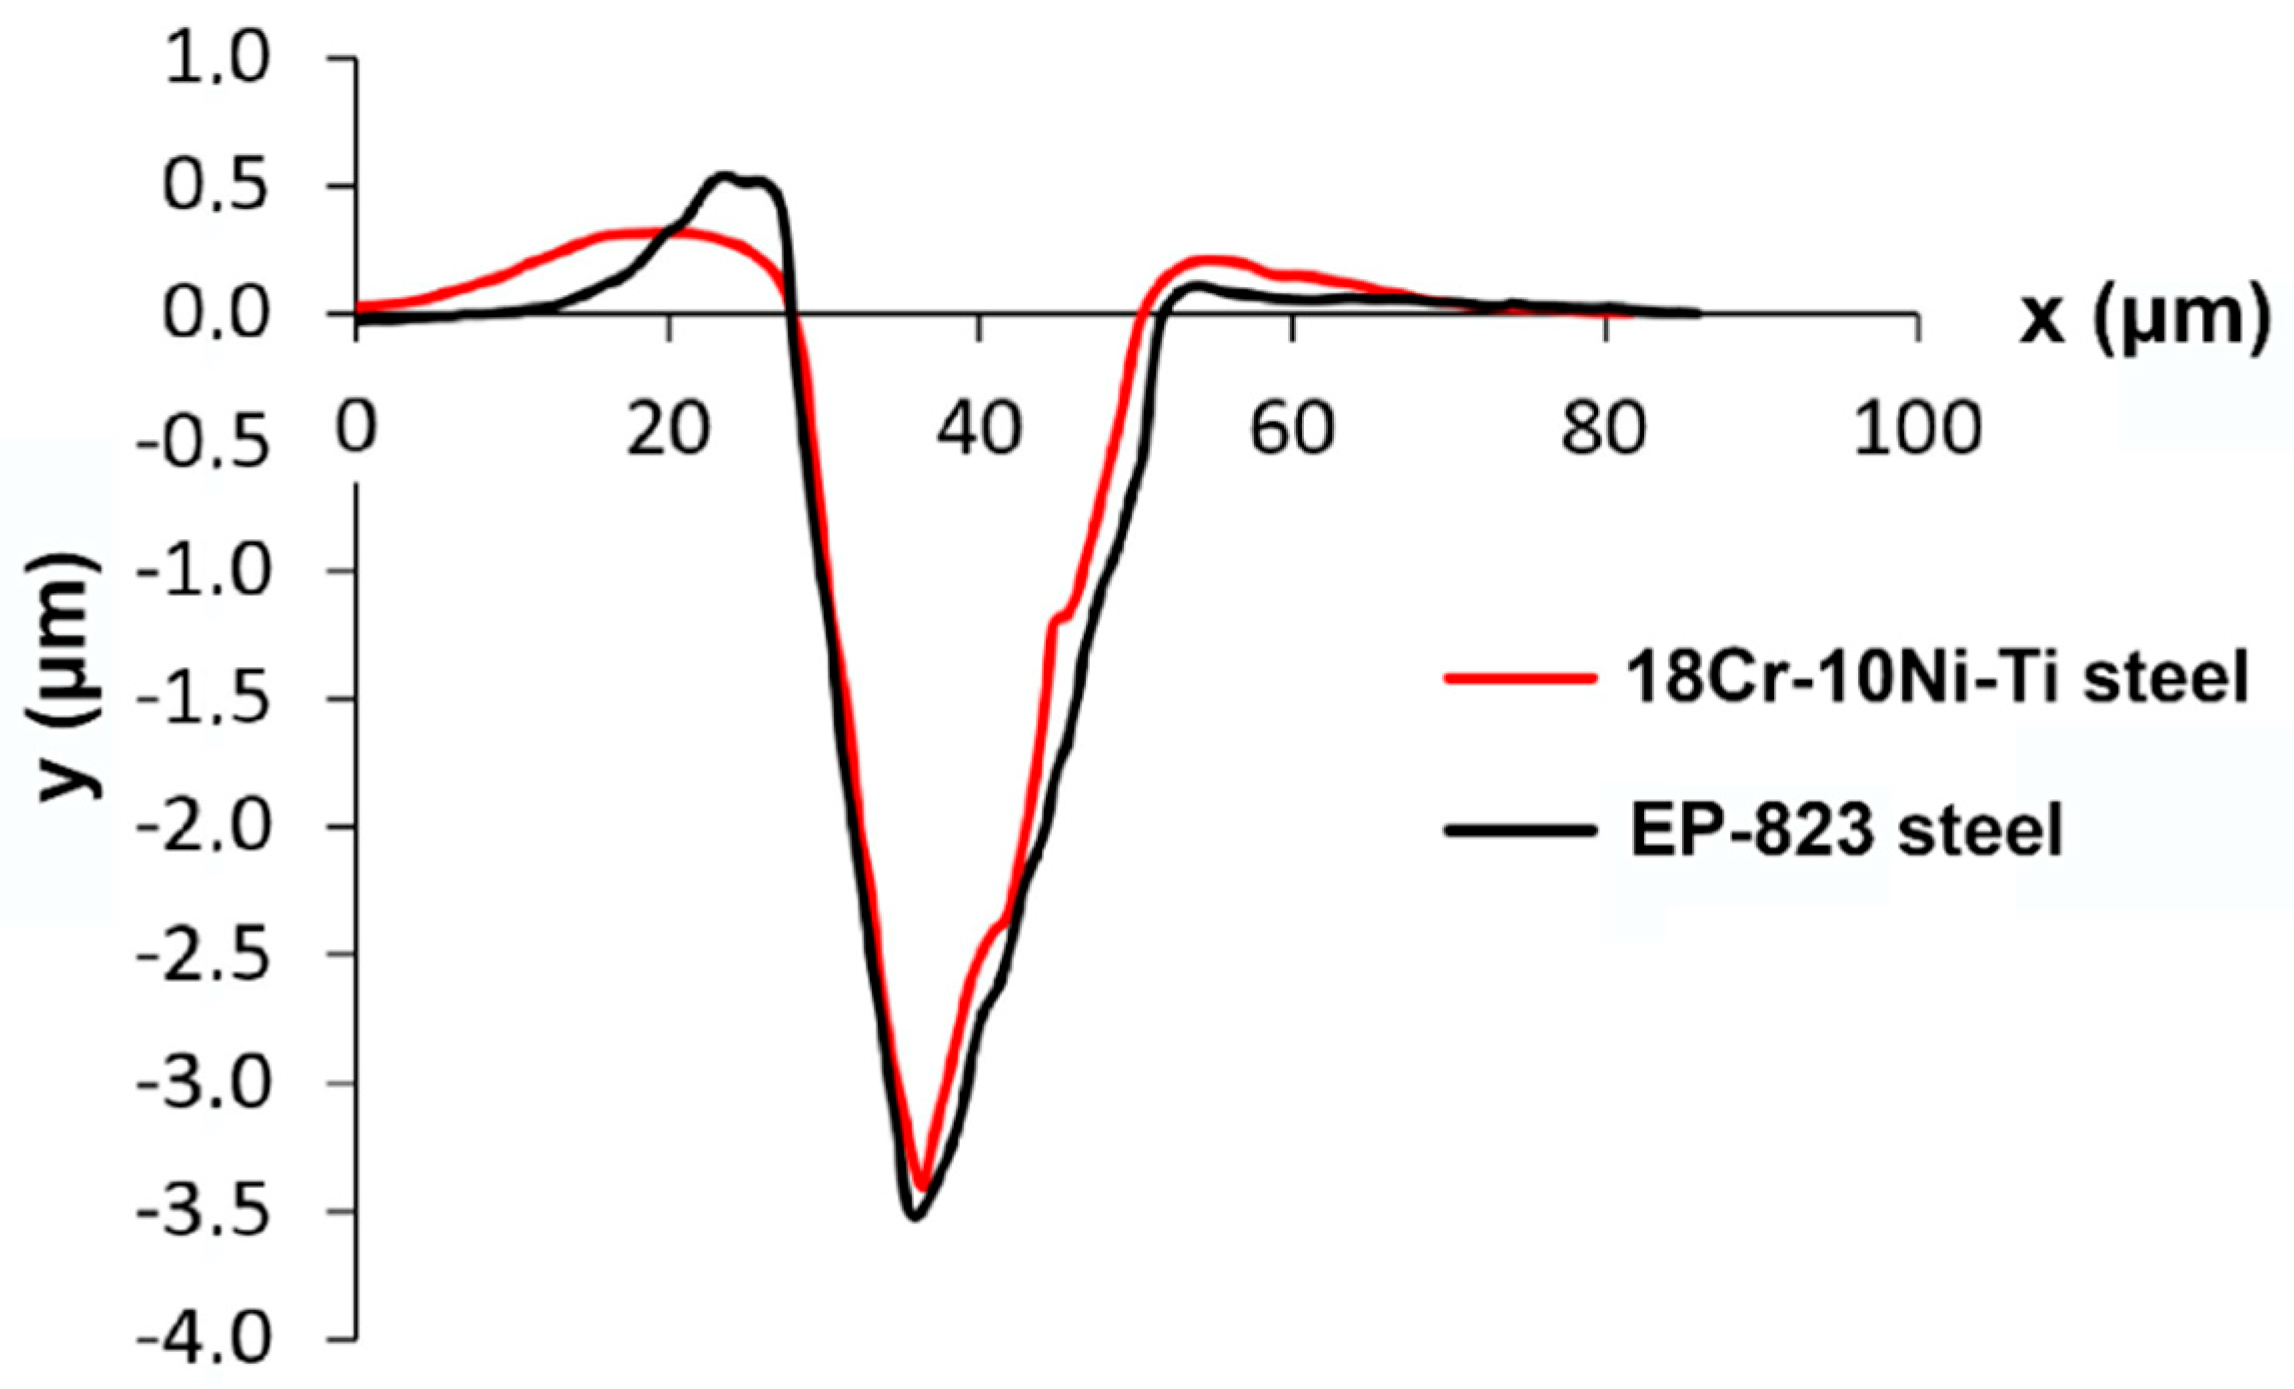
Such trends are confirmed experimentally by the types of the pile-up profiles for samples made of austenitic 18Cr-10Ni-Ti steel and for samples made of ferritic-martensitic EP-823 steel (see Figure 9).
From Figure 9 it can be seen that the profiles of the indents for samples of the austenitic steel and FMS differ from each other. The FMS sample is characterized by the formation of a high pile-up, tightly adjacent to the facet of the indenter. For the sample of the austenitic steel, the wider and diffuse pile-up is formed, which does not contact with the surface of the indenter and has a maximum height at some distance from the indenter.

5. Determination of Radiation Hardening Under Ion Irradiation by Microhardness Measurement with Berkovich Pyramid Indentation

Indentation with a Berkovich indenter and direct determination of the indent projection area allows one to adequately determine radiation hardening for ion-irradiated samples. As an example, it may be demonstrated for austenitic 16Cr-20Ni-2Mo-Ti steel irradiated with heavy Ni4+ ions in combination with He+ ions and H+ ions.
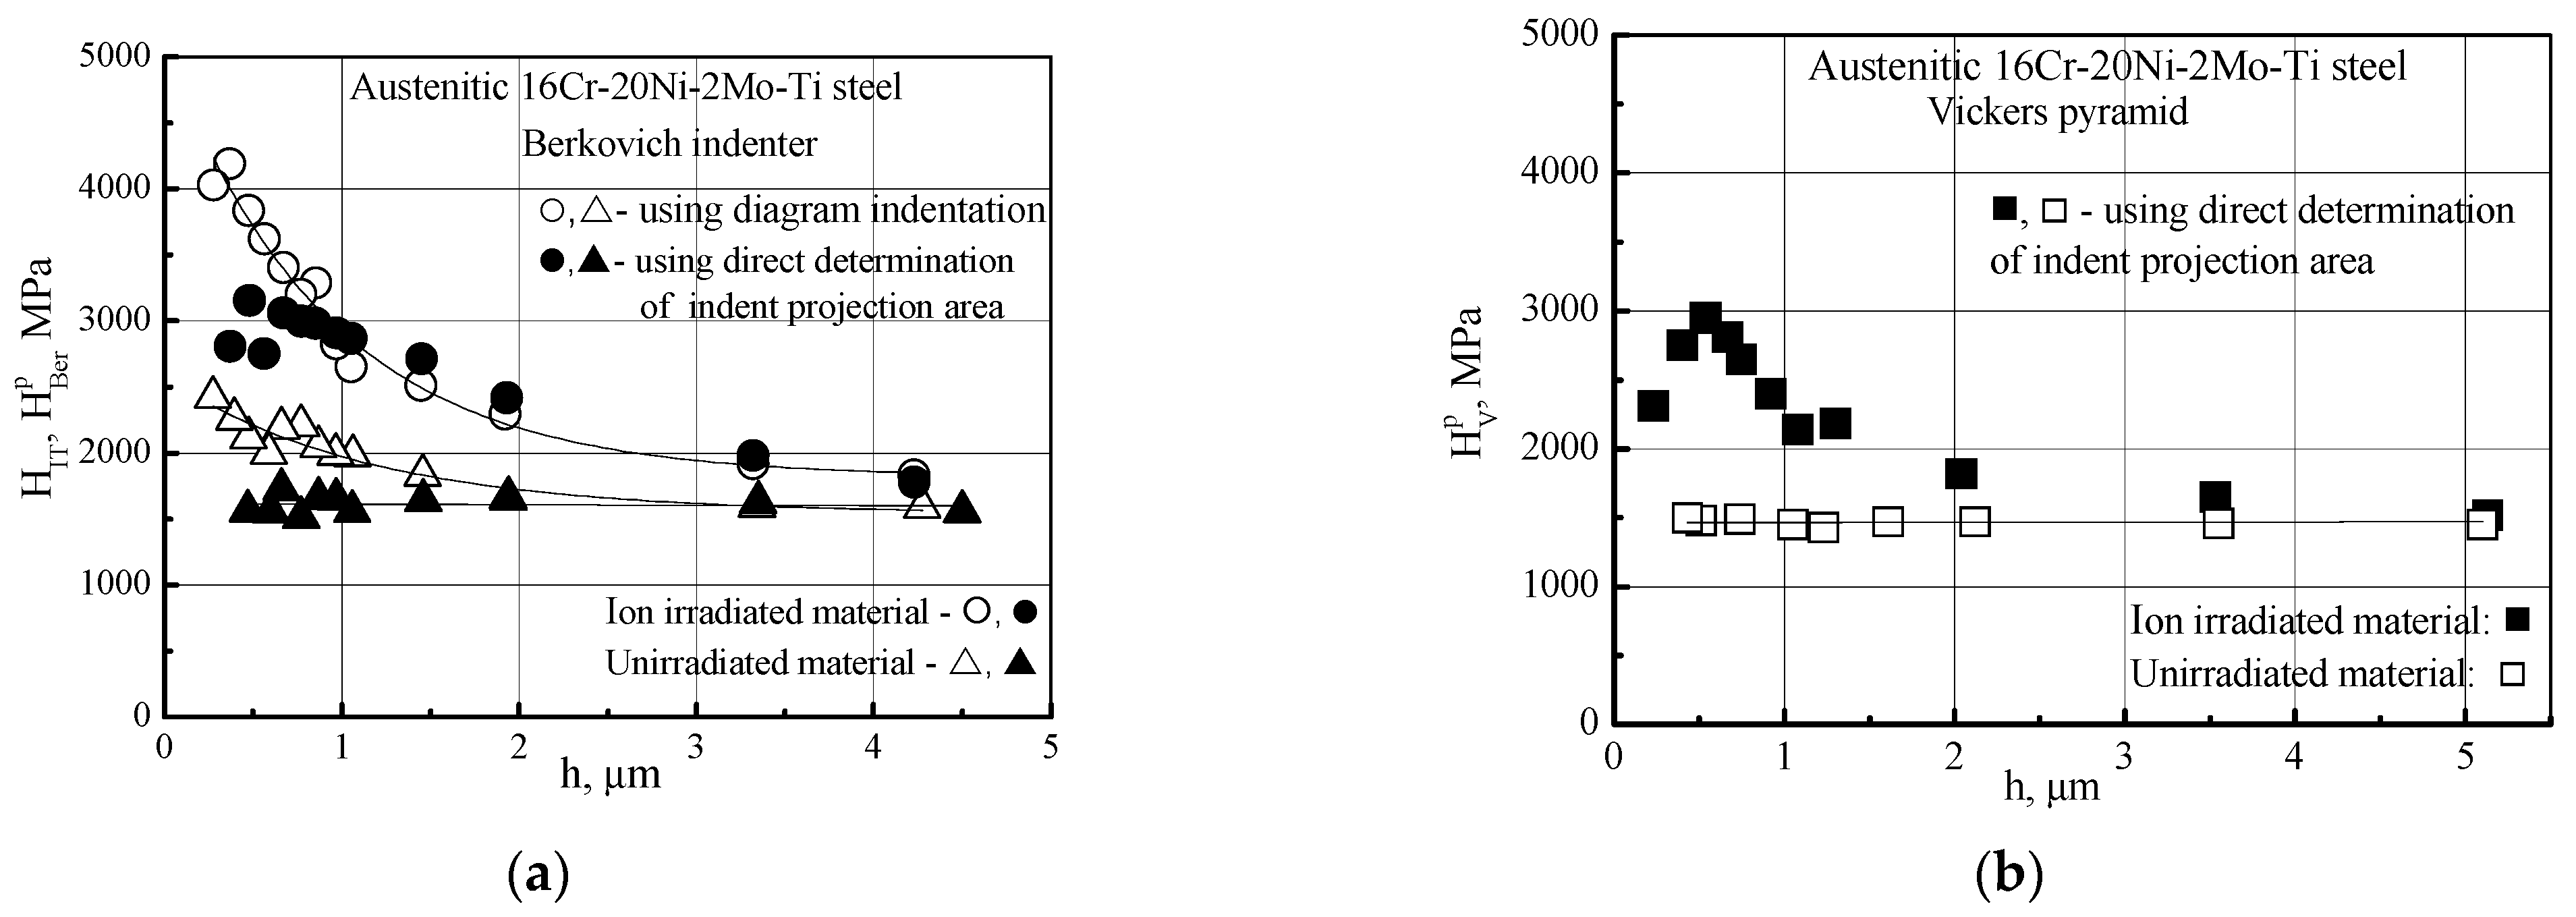
Two values of microhardness H IT and H Ber p were determined at different indentation depths under indentation with a Berkovich indenter. To analyze the reliability of determination of radiation hardening by means of Berkovich pyramid indentation, the dependence of H V p on the indentation depth h was also obtained with a Vickers indenter. The dependence H V p (h) is considered as a reference for determination of radiation damage. The measurement results are presented in Figure 10.
From Figure 10 it can be seen that the dependences H Ber p and H V p practically coincide for the unirradiated zone, and are close for the irradiated zone. This result demonstrates the possibility of adequate determination of radiation hardening not only with the Vickers pyramid indentation, but also with a Berkovich indenter with direct measurement of the indent projection area. The radiation hardening can be assessed from the formula
H Ber p = max H Ber p irr H Ber p unirr ,
where max H Ber p irr is the maximum microhardness in the irradiated zone,
H Ber p unirr is the microhardness of the unirradiated zone.
This estimate exclusively reflects radiation hardening. Indeed, for unirradiated material H Ber p (h) ≈ const. Consequently, the increase in H Ber p in the irradiated zone compared to the unirradiated zone is solely due to radiation hardening.
The evaluation of radiation hardening based on the results of H IT determination is not unambiguous, since an increase in H IT may be associated not only with irradiation, but also with the influence of the indentation depth. The influence of the indentation depth is very clearly seen not only in the H IT (h) dependence for the unirradiated zone, but also for the irradiated one. As can be seen from Figure 10, max H IT ≈ 4200 MPa, and max  H Ber p ≈ 3100 MPa, while max H IT is located at h ≈ 0.4 μm, and max H Ber p is located at h ≈ 0.6 μm.
The localization of max H IT at h ≈ 0.4 µm is false, since the shift in the maximum is due to the increase in H IT with a decrease in h, typical for microhardness determination using an indentation diagram. In other words, the actual decrease in microhardness with decreasing h should start at h < 0.6 µm, but this does not happen, since the decrease is compensated by an artificial increase in H IT with decreasing h.

6. Discussion

6.1. On Pile-Up Formation

In the common case, the pile-up formation is caused by a specific process of the plastic deformation localization, since pile-ups limit the extension of the plastic deformation zone around the indenter. After the formation of pile-ups, further loading results in an increase in pile-up height but not an increase in plastic deformation zone size around the indenter.
The susceptibility to the pile-up formation can be analyzed on the basis of the material strain hardening. Let us describe the stress–strain curve of the material by the following equation:
σ e q = σ Y + A · ε e q p n ,
where σ e q is the equivalent stress;
σ Y is the yield strength;
ε e q p is the equivalent plastic strain;
A and n are the strain hardening coefficients.
For structural steels both of austenitic and ferritic-martensitic types the value of n varies from 0.4 to 0.6 and can be taken equal to 0.5 as a first approximation.
The strain localization condition is usually described in the following form [32]:
d σ e q d ε e q p = σ e q .
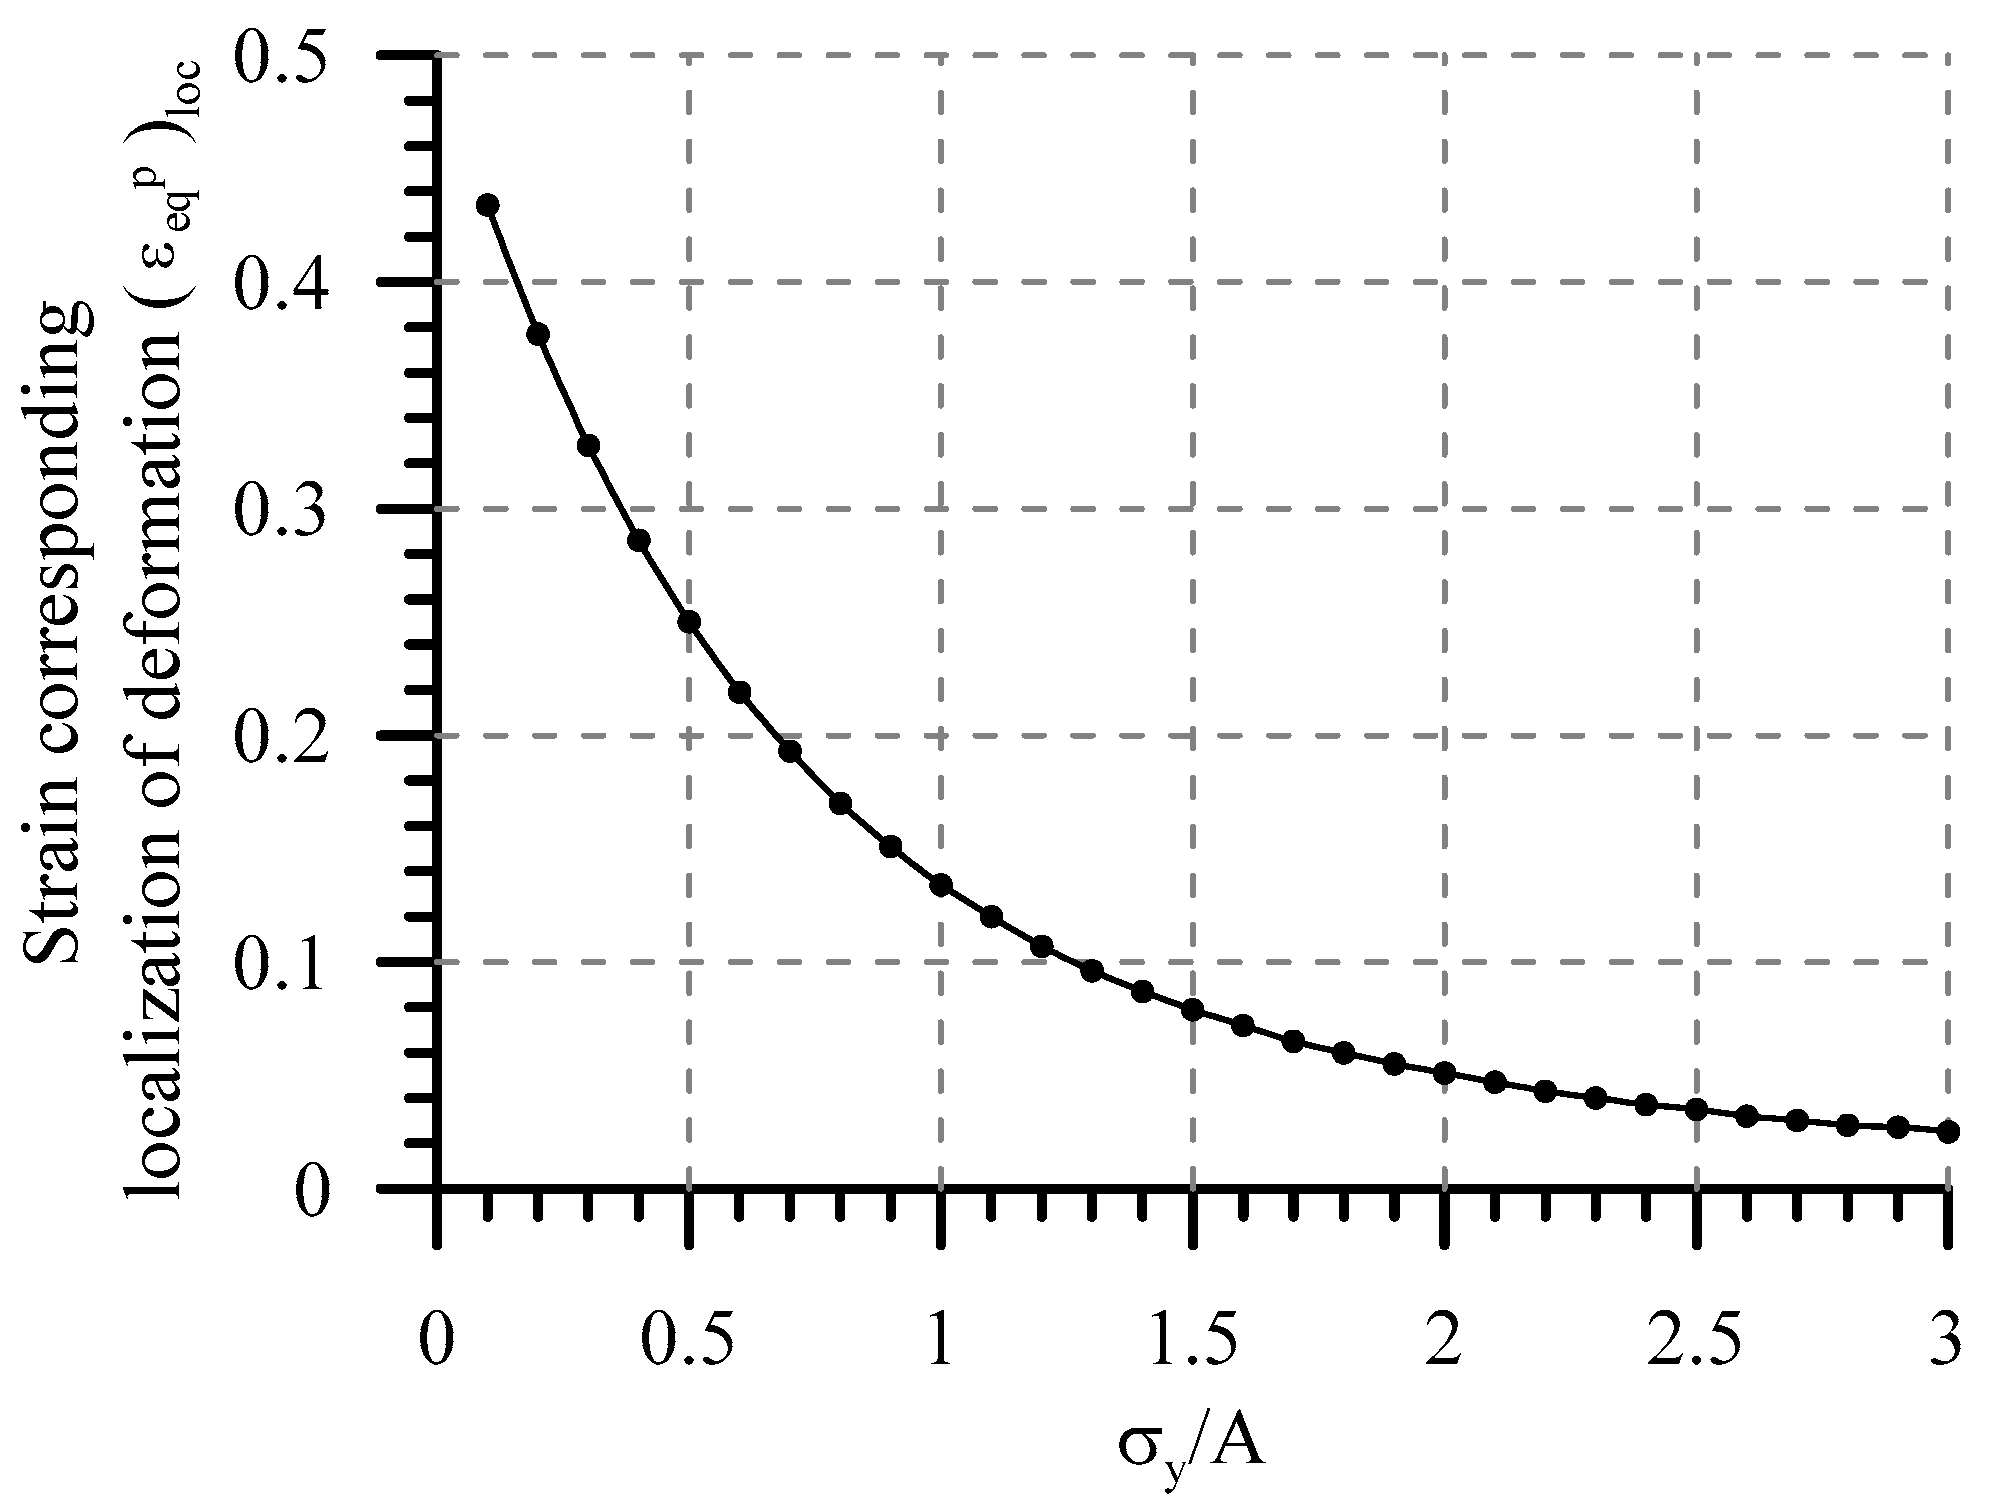
Solving Equation (15) when taking into account Equation (14) the dependence of ( ε e q p ) l o c (the equivalent strain corresponding to strain localization) on ratio σ Y / A can be obtained in the form presented in Figure 11. For tensile smooth round bars:
( ε e q p ) l o c = ln ( 1 + δ u l ) .
As seen from Figure 11, the increase in the yield strength or decrease in strain hardening parameter A results in the decrease of ( ε e q p ) l o c and hence the increase in the susceptibility to pile-up formation. A link between strain hardening and pile-up formation was mentioned in papers [33,34], where it was shown that pile-up height increases with the decrease in strain hardening.
In common cases, steels with an FCC lattice have lower yield strength and a higher value of A in comparison with steels with a BCC lattice. That is why steels with FCC lattices have higher values of ( ε e q p ) l o c and hence less susceptibility to pile-up formation.
Irradiation results in the increase of σ Y (so-called radiation hardening) and the decrease in the strain hardening [31]. In this case the susceptibility to the pile-up formation increases.
The effect of the temperature of indentation on pile-up formation can be unambiguous depending on the material. It is known that with an increase in temperature, both yield strength and strain hardening decrease. Depending on the temperature dependence of ratio σ Y /A the material will be more or less susceptible to the pile-up formation.

6.2. On the Physical Basis of the Nix–Gao Model

Based on the experiments presented in the article, it can be concluded that microhardness is practically invariant to the indentation depth (at least at an indentation depth h > 0.2 μm and at constant strain rate) when the indent projection area is directly measured. The invariance of microhardness to the indentation depth is ensured if the indent projection area is calculated with regard for pile-ups arising under Berkovich pyramid indentation. The dependence of microhardness on the indentation depth is caused by the lack of consideration of the pile-ups formed under indentation. Such a conclusion fully agrees with the results of paper [35].
At the same time, in article [20], an attempt is undertaken to physically substantiate the monotonically decreasing dependence of microhardness on the indentation depth. Based on several a priori accepted assumptions, the dependence H IT (h) in the form (1) was obtained in [20]. As can be seen, dependence (1) contradicts the experimental data presented in this article.
It should be noted that dependence (1) has been repeatedly criticized, and attempts to modify dependence (1) have been undertaken [22,23,24].
From our point of view, when deriving dependence (1), at least two incorrect assumptions were taken that led to the dependence of H IT on h. In this section, the derivation of dependence (1) is analyzed, and the incorrectness of some assumptions is shown. As a result, it is shown that, under more realistic assumptions, microhardness either does not depend on h or depends on h much weaker than follows from formula (1).
According to [20], the density of geometrically necessary dislocations ρ G   is calculated by the formula:
ρ G   =   3 2 b h tan 2 ( θ ) ,
where b is the Burgers vector;
h is the indentation depth;
θ is the angle between the surface of the conical indenter and the plane of the indentation surface.
In Formula (17), geometrically necessary dislocations are dislocations uniformly distributed in the plastic zone under the conical indenter, the shape of which is taken as a hemisphere with radius, a, equal to the radius of the indent projection. Thus, in [20] it is assumed that the plastic zone caused by the indentation is a hemisphere, and in this zone the dislocations are distributed uniformly.
To estimate the shear yield strength τ, the authors of the article [20] use the Taylor equation in the form
τ   = α μ b   ρ T   = α μ b ρ G   + ρ s ,
where ρ T is the total dislocation density,
μ is the shear modulus; α is a constant taken to be equal to 0.5,
ρ s   is the density of dislocations present in the material before indentation.
It should be noted that Formula (18) describes the current shear stress above the shear yield strength but not the shear yield strength.
To pass from shear stress to normal stress σ, the von Mises flow rule is used in [20] for uniaxial stress state. Then
σ =   3 τ .
To connect microhardness H and σ the following relationship is used in [20]:
H = 3 σ .
This relationship is valid for the connection of H and the yield strength σY, but is incorrect for the connection of H with the current stress.
From (17), (18), (17) and (20) Equation (1) can be obtained, where according to [20]
H 0 = 3 3 α σ b ρ s ,
h * = 81 2 b α 2 tan 2 θ μ H 0 2 .
Substituting (21) and (22) in (1), we obtain:
H = 3 3 α μ b 3 tan 2 θ 2 b h   +   ρ s .
From (23) it follows that H increases when h decreases.
However, this conclusion is based on incorrect Equation (20). In a more or less correct form, correlation of H and σ should be represented as
H = k σ σ ,
where kσ is numerical coefficient depending on σ.
As a general case, H correlates one-to-one with the yield strength. Then with an increase in σ above the yield strength, the coefficient k σ in (24) should decrease. With the growth of ρ G , according to (18) and (19), σ grows. Consequently, with the growth of ρ G , the coefficient k σ should decrease.
Using Equation (24) instead of (20) we obtain
H = k σ 3 α μ b 3 tan 2 θ 2 b h + ρ s .
As seen from (25), the value of H depends on h and k σ . When h decreases, ρ G increases according to (17), and as a result, σ increases and k σ decreases. Then it does not follow explicitly from (25) that a decrease in h leads to an increase in H.
One more incorrect assumption is the assumption used for the derivation of Formula (17). As mentioned above, Formula (17) is obtained from the assumption that dislocations are uniformly distributed in the plastic zone, which is a hemisphere. According to [36,37], the shape of the plastic zone is not a hemisphere, and dislocations are not distributed uniformly throughout the plastic zone. Moreover, from Formula (17) it follows that with a decrease in h, the dislocation density ρ G increases. This trend contradicts the TEM investigations of microstructure presented in [36], where it is shown that the density of dislocations in the zones of plastic deformation under the indenter, at least, does not increase with decreasing h. Consequently, even if correlation (18) is taken, the hardness of the material does not increase with a decrease in h, since ρ G does not increase, and therefore σ does not increase either.

7. Conclusions

  • It is shown that for a homogeneous material, the microhardness under Berkovich indenter indentation does not depend on the indentation depth if the indent projection area is determined directly by measurement of the indent geometric characteristics. When the microhardness is determined from the indentation diagram using the generally accepted Oliver–Pharr method, dependence of microhardness on the indentation depth is observed even for a homogeneous material.
  • The main reason leading to the dependence of microhardness on the indentation depth is the formation of plastic pile-ups near the facets of the Berkovich indenter indent that is not taken into account in the microhardness determination from the indentation diagram.
  • The proposed method allows one practically to exclude the influence of the indentation depth on microhardness of homogeneous material at least over the depth range from 0.2 to 4 μm and to obtain adequate assessment of the radiation hardening for a thin irradiated layer with depth about 2 μm.
  • The microhardness values determined with Berkovich and Vickers indenters indentations coincide almost completely if the same geometric characteristic of the indent is used (either the indent projection area or the contact indent area) and this characteristic is determined by direct measurements.
  • Formula (12) is proposed for taking into account the influence of pile-ups on the microhardness determined from the indentation diagram using the Oliver–Pharr method. The use of this formula makes it possible to practically eliminate the dependence of microhardness on the indentation depth for materials with a high susceptibility to deformation localization, including the studied ferritic-martensitic steels. At the same time, for materials with high strain hardening resulting in small localization of plastic deformation (for example, for austenitic steels), Formula (12) does not allow one to take into account the pile-ups adequately. The difference in applicability of Formula (12) is connected with different profiles of the pile-ups for ferritic-martensitic and austenitic steels.
  • It is shown that the radiation hardening of a material may be adequately determined with Berkovich indenter indentation of a thin ion-irradiated layer if the microhardness is calculated on the results of direct measurement of the indent projection area. The use of the Nix–Gao model can lead to incorrect results and significant errors in the estimation of radiation hardening.
  • Some assumptions have been analyzed that were taken in the Nix–Gao model [20] for derivation of Formula (1). It is shown that these assumptions are not sufficiently physically substantiated; that raises doubts in the correctness of the proposed dependence of microhardness on indentation depth.

Author Contributions

Conceptualization, B.M.; methodology, B.M.; validation, B.M. and A.S.; investigation L.B.; data curation, A.S.; writing—original draft preparation, B.M. and L.B.; visualization, L.B. and A.S.; supervision, B.M. All authors have read and agreed to the published version of the manuscript.

Funding

This research received no external funding.

Data Availability Statement

The original contributions presented in this study are included in the article. Further inquiries can be directed to the corresponding author.

Acknowledgments

The authors would like to thank Ekaterina Gladkikh from National Research Center Kurchatov Institute—Technological Institute for Superhard Novel Carbon Materials TISNCM for performing measurements of the indents profiles.

Conflicts of Interest

The authors declare no conflict of interest.

References

  1. Was, G.S.; Jiao, Z.; Getto, E.; Sun, K.; Monterrosa, A.M.; Maloy, S.A.; Anderoglu, O.; Sencer, B.H.; Hackett, M. Emulation of reactor irradiation damage using ion beams. Scr. Mater. 2014, 88, 33–36. [Google Scholar] [CrossRef]
  2. Was, G.S. Challenges to the use of ion irradiation for emulating reactor irradiation. J. Mater. Res. 2015, 30, 1158–1182. [Google Scholar] [CrossRef]
  3. Gupta, J.; Hure, J.; Laffont, L.; Lafont, M.-C.; Andreu, E. Characterisation of ion irradiation effects on the microstructure, hardness, deformation and crack initiation behavior of austenitic stainless steel: Heavy ions vs protons. J. Nucl. Mater. 2018, 501, 45–58. [Google Scholar] [CrossRef]
  4. Rogozhkin, S.V.; Aleev, A.A.; Zaluzhnyi, A.G.; Kuibida, R.P.; Kulevoi, T.V.; Nikitin, A.A.; Orlov, N.N.; Chalykh, B.B.; Shishmarev, V.B. Effect of irradiation by heavy ions on the nanostructure of perspective materials for nuclear power plants. Phys. Metals Metallogr. 2012, 113, 200–211. [Google Scholar] [CrossRef]
  5. Margolin, B.; Sorokin, A.; Belyaeva, L. Link between neutron and ion irradiation hardening for stainless austenitic and ferritic-martensitic steels. Metals 2024, 14, 99. [Google Scholar] [CrossRef]
  6. Jiao, Z.; Michalicka, J.; Was, G.S. Self-ion emulation of high dose neutron irradiated microstructure in stainless steels. J. Nucl. Mater. 2018, 501, 312–318. [Google Scholar] [CrossRef]
  7. Ayanoglu, M.; Motta, A.T. Emulation of neutron-irradiated microstructure of austenitic 21Cr32Ni model alloy using dual-ion irradiation. J. Nucl. Mater. 2022, 570, 153944. [Google Scholar] [CrossRef]
  8. Lee, S.; Chang, D.-S.; Lee, K.; Huh, S.-R.; Lee, S. Implementation of Fe ion irradiation and high-temperature target design at KAHIF for neutron damage simulation in fusion structural materials. Nucl. Eng. Technol. 2025, 57, 103815. [Google Scholar] [CrossRef]
  9. Skuratov, V.A.; Uglov, V.V.; O’Connell, J.; Sohatsky, A.S.; Neethling, J.H.; Rogozhkin, S.V. Radiation stability of the ODS alloys against swift heavy ion impact. J. Nucl. Mater. 2013, 442, 449–457. [Google Scholar] [CrossRef]
  10. Bückle, H. Progress in micro-indentation hardness testing. Met. Rev. 1959, 4, 49–100. [Google Scholar] [CrossRef]
  11. Voort, G.V.; Fowler, R. Low-load Vickers microindentation. Adv. Mater. Process. 2012, 170, 28–33. [Google Scholar]
  12. Broitman, E. Indentation Hardness Measurements at Macro-, Micro-, and Nanoscale: A Critical Overview. Tribol. Lett. 2017, 65, 23. [Google Scholar] [CrossRef]
  13. Zhu, P.; Zhao, Y.; Shrdha, A.; Zean, H.; Zinkle, S.J. Toward accurate evaluation of bulk hardness from nanoindentation testing at low indent depths. Mater. Des. 2022, 213, 110317. [Google Scholar] [CrossRef]
  14. Xiazi, X.; Long, Y. Nano-indentation of ion-irradiated nuclear structural materials: A review. Nucl. Mater. Energy 2022, 22, 100721. [Google Scholar] [CrossRef]
  15. Linmao, Q.; Ming, L.; Zhongrong, Z.; Hui, Y.; Xinyu, S. Comparison of nano-indentation hardness to microhardness. Surf. Coat. Technol. 2005, 195, 264–271. [Google Scholar] [CrossRef]
  16. Kapoor, G.; Chekhonin, P.; Kaden, C.; Vogel, K.; Bergner, F. Microstructure-informed prediction and measurement of nanoindentation hardness of an Fe-9Cr alloy irradiated with Fe-ions of 1 and 5 MeV energy. Nucl. Mater. Energy 2022, 30, 101105. [Google Scholar] [CrossRef]
  17. Pham, V.-T.; Kim, J.-S.; Eom, H.J.; Jang, C. Mechanical characterization of austenitic stainless steel under high-level ion-irradiation using nanoindentation experiment and simulation. J. Mater. Res. Technol. 2025, 34, 1777–1790. [Google Scholar] [CrossRef]
  18. Chudoba, T.; Schwaller, P.; Rabe, R.; Breguet, J.M.; Michler, J. Comparison of nanoindentation results obtained with Berkovich and cube-corner indenters. Philos. Mag. 2006, 86, 5265–5283. [Google Scholar] [CrossRef]
  19. Oliver, W.C.; Pharr, G.M. An improved technique for determining hardness and elastic modulus using load and displacement sensing indentation experiments. J. Mater. Res. 1992, 7, 1564–1583. [Google Scholar] [CrossRef]
  20. Nix, W.D.; Gao, H. Indentation size effects in crystalline materials: A law for strain gradient plasticity. J. Mech. Phys. Solids 1998, 46, 411–425. [Google Scholar] [CrossRef]
  21. Yabuuchi, K.; Kuribayash, Y.; Nogami, S.; Kasad, R.; Hasegawa, A. Evaluation of irradiation hardening of proton irradiated stainless steels by nanoindentation. J. Nucl. Mater. 2014, 446, 142–147. [Google Scholar] [CrossRef]
  22. Bergler, F.; Cornelia, K.; Das, A.; Merino, S.; Diego, G.; Hahler, P. Nanoindentation applied to ion-irradiated and neutron-irradiated Fe-9Cr and Fe-9Cr-NiSiP model alloys. J. Appl. Phys. 2022, 132, 045101. [Google Scholar] [CrossRef]
  23. Das, A.; Altstadt, E.; Kaden, C.; Kapoor, G.; Akhmadaliev, S.; Bergner, F. Nanoindentation Response of Ion- Irradiated Fe, Fe-Cr Alloys and Ferritic—Martensitic Steels Eurofer 97: The Effect of Ion Energy. Front. Mater. 2021, 8, 811851. [Google Scholar] [CrossRef]
  24. Hausild, P. Methodological comment on the nanoindentation of ion-irradiation hardened materials. J. Nucl. Mater. 2021, 551, 152987. [Google Scholar] [CrossRef]
  25. Reza, A.M.; Srivastava, A.K. Effect of Pile-up on Nanoindentation Measurements of Polycrystalline Bulk Metals. Adv. Mater. Res. 2014, 853, 143–150. [Google Scholar] [CrossRef]
  26. Miyake, K.; Fujisawa, S.; Korenaga, A.; Ishida, T.; Sasaki, S. The Effect of Pile-up and Contact Area on Hardness Test by Nanoindentation. Jpn. J. Appl. Phys. 2004, 43, 4602–4605. [Google Scholar] [CrossRef]
  27. Moharrami, N.; Bull, S.J. A Comparison of nanoindentation pile-up in bulk materials and thin films. Thin Solid Film. 2014, 572, 189–199. [Google Scholar] [CrossRef]
  28. George, F. Vander Voort, Metallographic Specimen Preparation for Electron Backscattered Diffraction. Pract. Metallogr. 2011, 48, 9. [Google Scholar] [CrossRef]
  29. Voort, G.V.; Van Geertruyden, W.; Dillon, S.; Metallographic, E.M. Specimen Preparation for Electron Backscattered Diffraction. Microsc. Microanal. 2006, 12, S02. [Google Scholar] [CrossRef]
  30. Ziegler, J. The Transport of Ions in Matter (TRIM). Available online: http://www.srim.org/ (accessed on 18 October 2025).
  31. Sorokin, A.A.; Margolin, B.Z.; Kursevich, I.P.; Minkin, A.J.; Neustroev, V.S. Effect of neutron irradiation on tensile properties of materials for pressure vessel internals of WWER type reactors. J. Nucl. Mater. 2014, 444, 373–384. [Google Scholar] [CrossRef]
  32. Yasnikov, I.S.; Vinogradov, A.; Estrin, Y. Revisiting the Considere criterion from the viewpoint of dislocation theory fundamentals. Scr. Mater. 2014, 76, 37–40. [Google Scholar] [CrossRef]
  33. Hill, R.; Storakers, B.; Zdunek, A.B. A Theoretical Study of the Brinell Hardness Test. Proc. R. Soc. Lond. A 1989, 423, 301–330. [Google Scholar] [CrossRef]
  34. Goto, K.; Watanabe, I.; Ohmura, T. Determining suitable parameters for inverse estimation of plastic properties based on indentation marks. Int. J. Plast. 2019, 116, 81–90. [Google Scholar] [CrossRef]
  35. Iost, A.; Bigot, R. Indentation size effect: Reality or artefact? J. Mater. Sci. 1996, 31, 3573–3577. [Google Scholar] [CrossRef]
  36. Hardie, C.D.; Roberts, S.G.; Bushby, A.J. Understanding the effects of ion irradiation using nanoindentation techniques. J. Nucl. Mater. 2015, 462, 391–401. [Google Scholar] [CrossRef]
  37. Mulewska, K.; Kalita, D.; Wilczopolovska, M.; Chrominski, W.; Ferreiros, P.A.; Kurpasks, L. Microstructural evolution and mechanical response of ion-irradiated Fe-9Cr alloys: Insights from nanoindentation. J. Nucl. Mater. 2025, 616, 156109. [Google Scholar] [CrossRef]
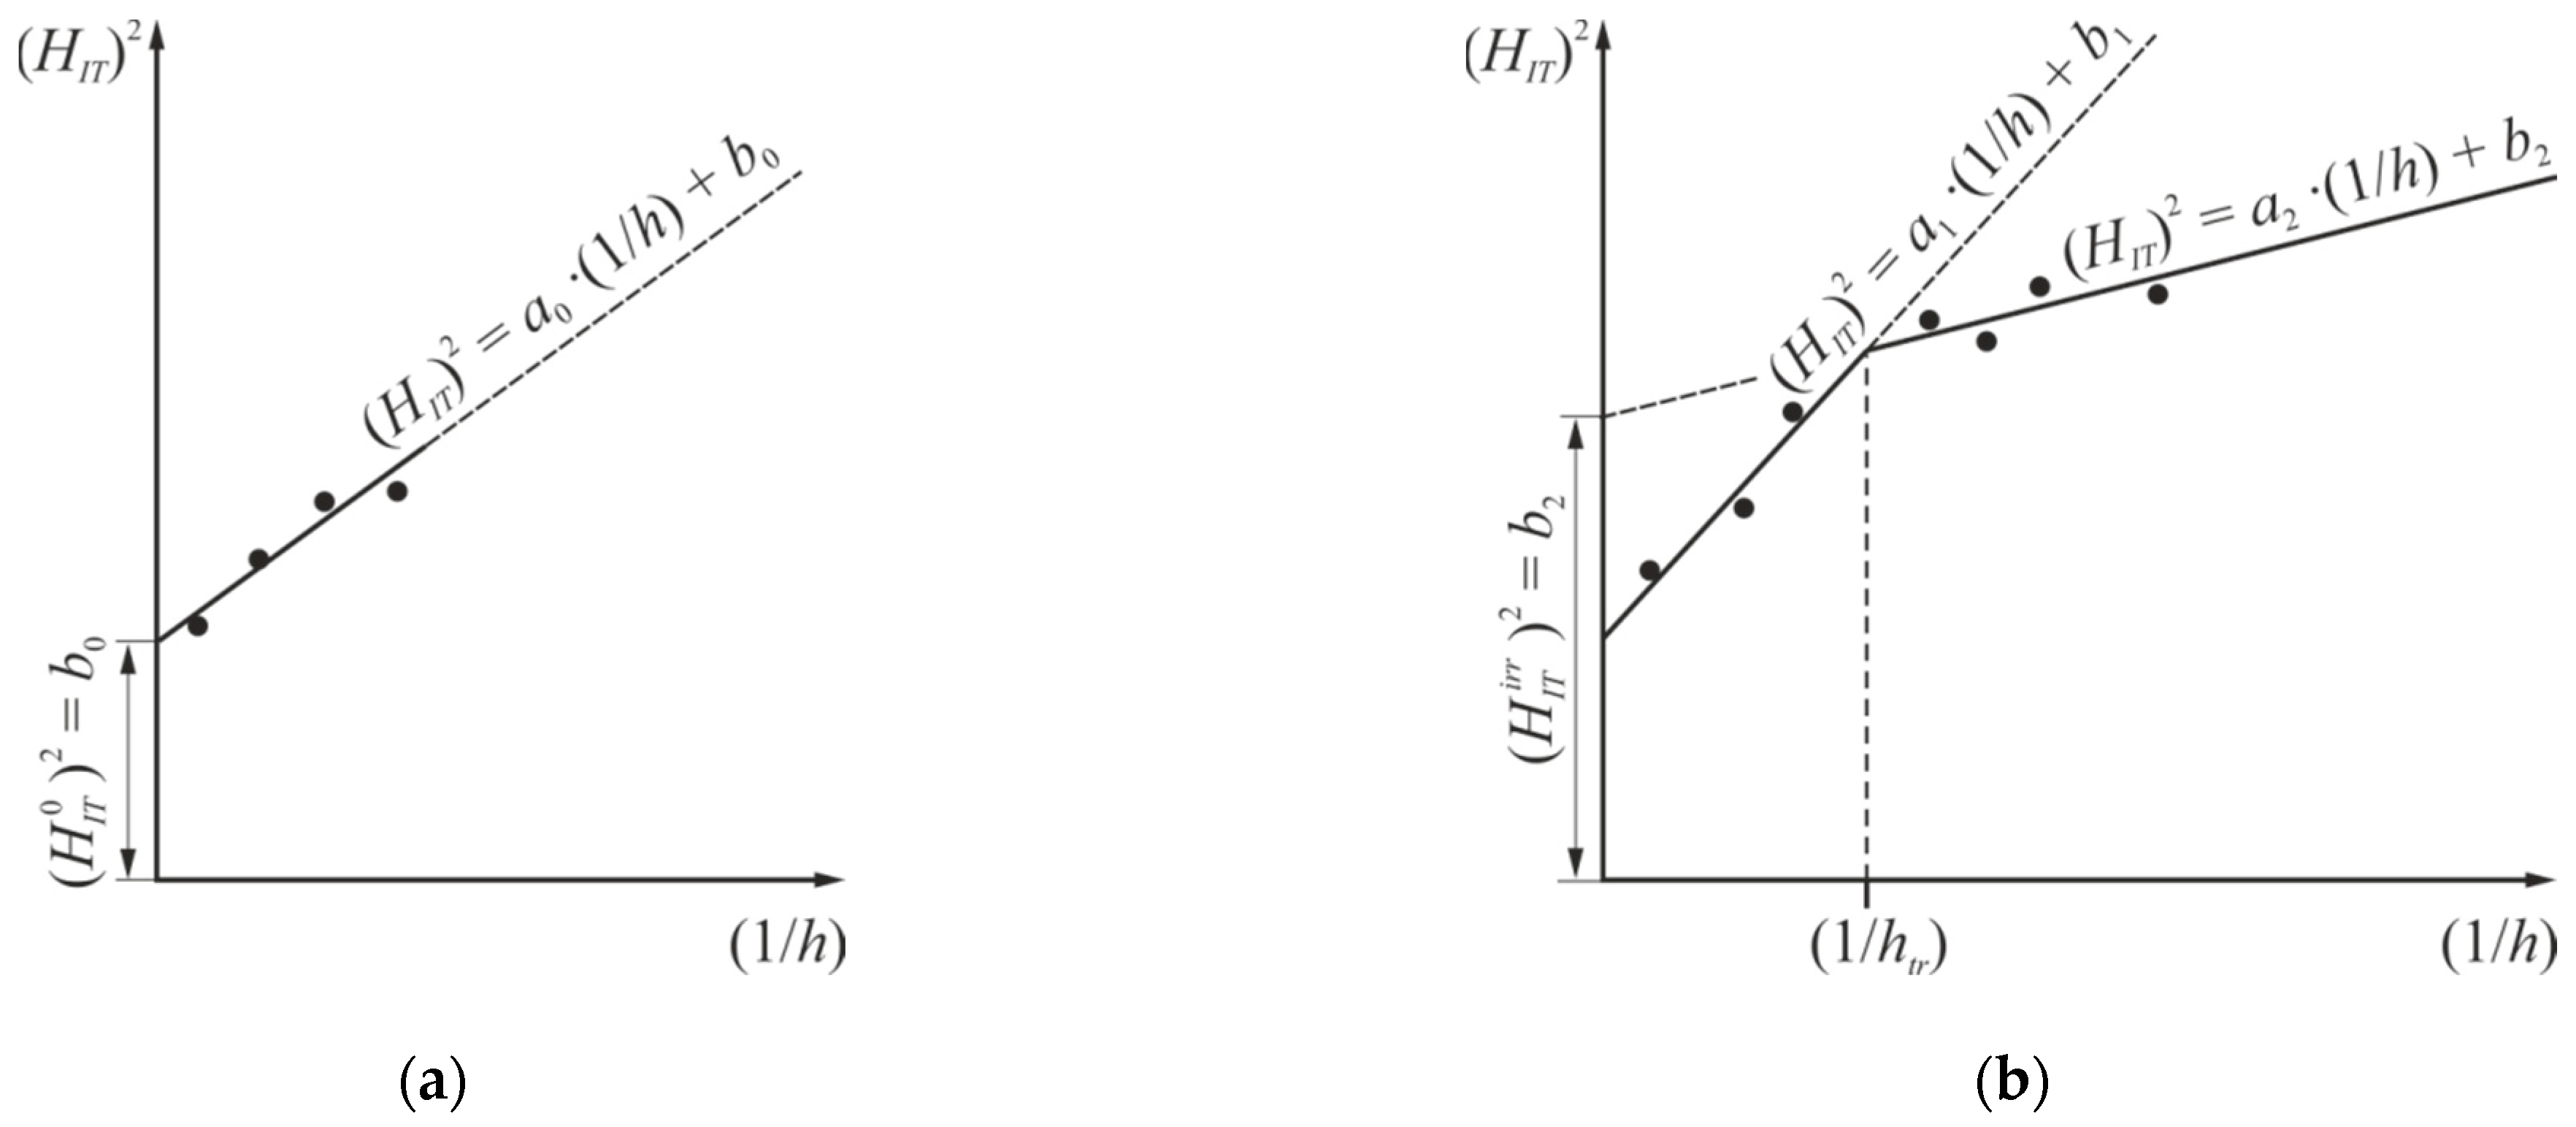
Figure 1. Diagrams for determination of the microhardness of the unirradiated zone of the sample or the unirradiated sample (a) and irradiated zone of the sample (b) based on the results of microhardness measurements under indentation with a Berkovich indenter and the use of the Nix–Gao diagram.
Metals 15 01181 g001
Figure 2. Dependence of microhardness H I T under indentation with a Berkovich indenter on the depth h (a) and the dependencies of ( H I T )2 on 1/h (b,c), constructed using the Nix and Gao diagram for a sample made of 18Cr-10Ni-Ti steel after Ni4+ ion irradiation at 400 °C up to a dose of 30 dpa with additional implantation of helium and hydrogen.
Metals 15 01181 g002
Figure 3. Dependence of microhardness H I T under indentation with a Berkovich indenter on the depth h for a sample of ferritic-martensitic steel EP-823 after Fe4+ ion irradiation at 400 °C up to a dose of 30 dpa with additional implantation of helium and hydrogen.
Metals 15 01181 g003
Figure 4. Schematization of indent projections without pile-ups (shaded areas) and pile-ups (blank areas) from Berkovich and Vickers indenters: a—length of the side of an equilateral triangle or square, b—height of the pile-up projection.
Metals 15 01181 g004
Figure 5. The distributions of damage dose and injected Ni ions concentration over irradiated layer.
Metals 15 01181 g005
Figure 6. The microhardness determined with a Berkovich indenter H Ber p (Metals 15 01181 i001) and with a Vickers indenter H V p (Metals 15 01181 i002) taking into account the pile-ups, depending on the indentation depth, h, for samples made of austenitic steels 18Cr-10Ni-Ti (a,b), 16Cr-20Ni-2Mo-Ti (c), 16Cr-25Ni-2Mo-Ti (d) and from FMS EP-823 (e) and EP-450 (f).
Metals 15 01181 g006
Figure 7. The microhardness vs. the indentation depth h under the Berkovich pyramid indentation for austenitic 18Cr-10Ni-Ti steel (a,b), FMS EP-823 (c) and EP-450 (d): (Metals 15 01181 i001)—determined from the indent projection area, H Ber p ; (Metals 15 01181 i003)—determined from the indentation diagram without taking account of the pile-ups, H IT (Metals 15 01181 i004)—determined from the indentation diagram taking account of the pile-ups with Formula (12), H IT p - u p .
Metals 15 01181 g007
Figure 8. The dependence of the pile-up height hp-up on the residual indentation depth hp: (a)—18Cr-10Ni-Ti steel, Berkovich indenter (Metals 15 01181 i005) and Vickers indenter (Metals 15 01181 i006); (b)—EP-823 (Metals 15 01181 i005) and EP-450 (Metals 15 01181 i007) steels, Berkovich indenter.
Metals 15 01181 g008
Figure 9. The profiles of the indents for samples of austenitic 18Cr-10Ni-Ti steel (red line) and ferritic-martensitic EP-823 steel (black line), obtained at indentation depth of h = 3.5 µm.
Metals 15 01181 g009
Figure 10. The microhardness determined with Berkovich (a) and Vickers (b) indenters as a function of the indentation depth, h, for austenitic 16Cr-20Ni-2Mo-Ti steel after ion irradiation: Metals 15 01181 i008;— H IT , irradiated material; Metals 15 01181 i007 H IT , unirradiated material; Metals 15 01181 i004 H Ber p , irradiated material; Metals 15 01181 i005 H Ber p , unirradiated material; Metals 15 01181 i002 H V p , irradiated material; Metals 15 01181 i009 H V p unirradiated material.
Metals 15 01181 g010
Figure 11. Dependence of ( ε e q p ) l o c on ratio σ Y / A for n = 0.5.
Metals 15 01181 g011
Table 1. Chemical composition of the investigated ferritic-martensitic steels according to technical specifications.
MaterialMass Fraction of Chemical Elements, %
CSiMnCrNiMoSP
EP-8230.14–0.181.0–1.30.5–0.810.0–12.00.5–0.80.6–0.9<0.01<0.015
EP-4500.10–0.15≤0.50≤0.811.0–13.50.05–0.31.2–1.8≤0.015≤0.025
NbVWTiAlBN
EP-8230.2–0.40.2–0.40.5–0.8<0.05<0.05<0.006<0.05
EP-4500.25–0.550.1–0.3---≤0.08-
Table 2. Chemical composition of the investigated austenitic steels according to technical specifications.
MaterialMass Fraction of Chemical Elements, %
CSiMnCrNiMoSP
18Cr-10Ni-Ti0.06–0.080.4–0.61.5–2.017.0–19.09.0–11.0≤0.50≤0.0080.025–0.030
16Cr-20Ni-2Mo-Ti0.06–0.080.4–0.61.5–2.015.0–16.519.0–21.02.0–3.0≤0.0080.025–0.030
16Cr-25Ni-2Mo-Ti0.08–0.100.4–0.61.5–2.015.0–16.024.0–25.02.0–3.0≤0.0080.020–0.040
TiAlVCuN
18Cr-10Ni-Ti5C-0.7≤0.12≤0.20≤0.10≤0.030
16Cr-20Ni-2Mo-Ti0.6–0.8≤0.12 ≤0.10≤0.025
16Cr-25Ni-2Mo-Ti0.6–0.8≤0.12 ≤0.10≤0.025
Disclaimer/Publisher’s Note: The statements, opinions and data contained in all publications are solely those of the individual author(s) and contributor(s) and not of MDPI and/or the editor(s). MDPI and/or the editor(s) disclaim responsibility for any injury to people or property resulting from any ideas, methods, instructions or products referred to in the content.